Embed Size (px)
Citation preview
What is sound?
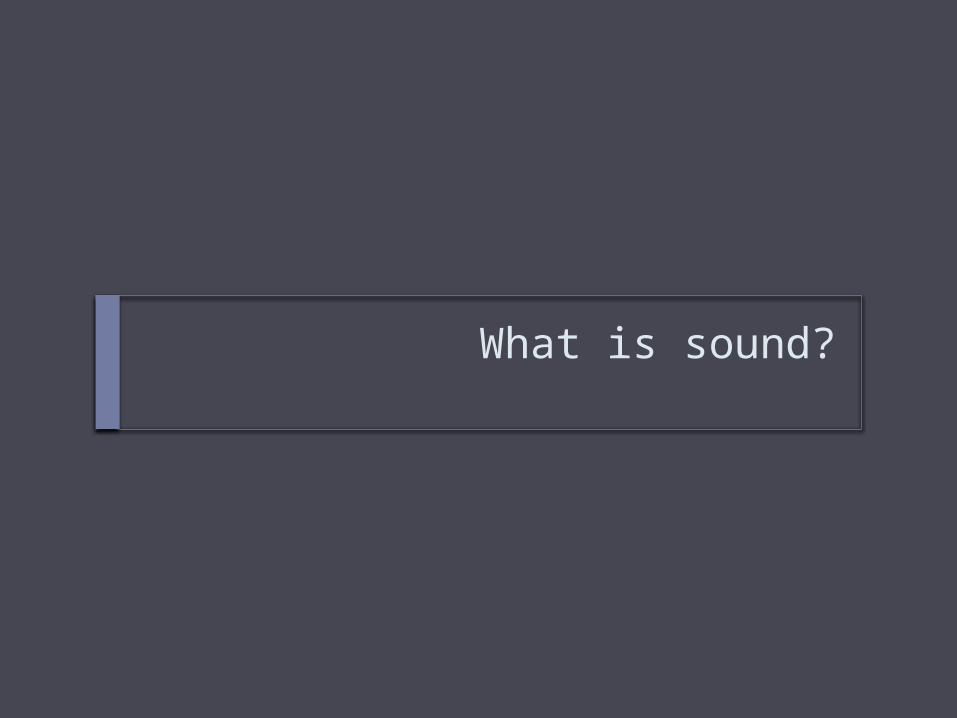
Hearing vs. seeing
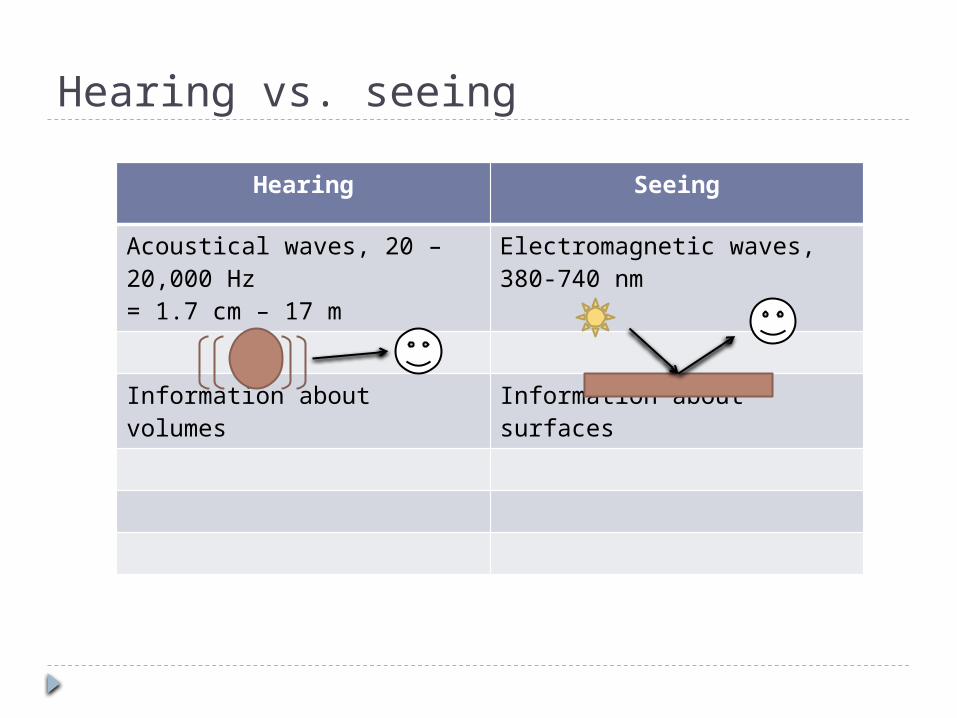
Hearing Seeing
Acoustical waves, 20 – 20,000 Hz= 1.7 cm – 17 m
Electromagnetic waves, 380-740 nm
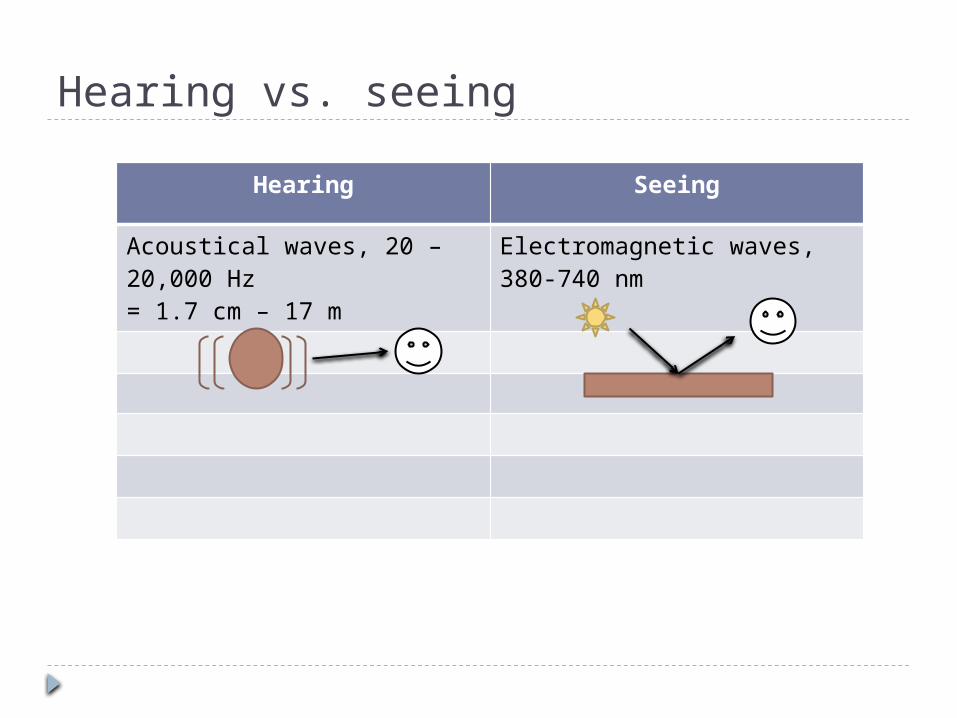
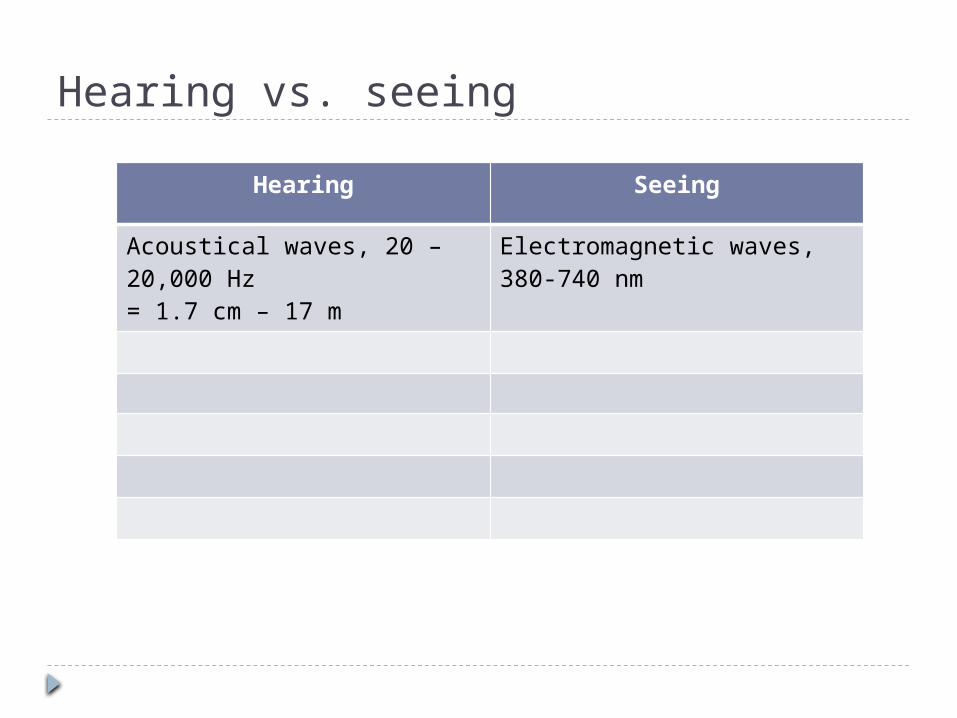
Hearing vs. seeing
Hearing Seeing
Acoustical waves, 20 – 20,000 Hz= 1.7 cm – 17 m
Electromagnetic waves, 380-740 nm
Hearing vs. seeing
Hearing Seeing
Acoustical waves, 20 – 20,000 Hz= 1.7 cm – 17 m
Electromagnetic waves, 380-740 nm
Information about volumes Information about surfaces
Hearing vs. seeing
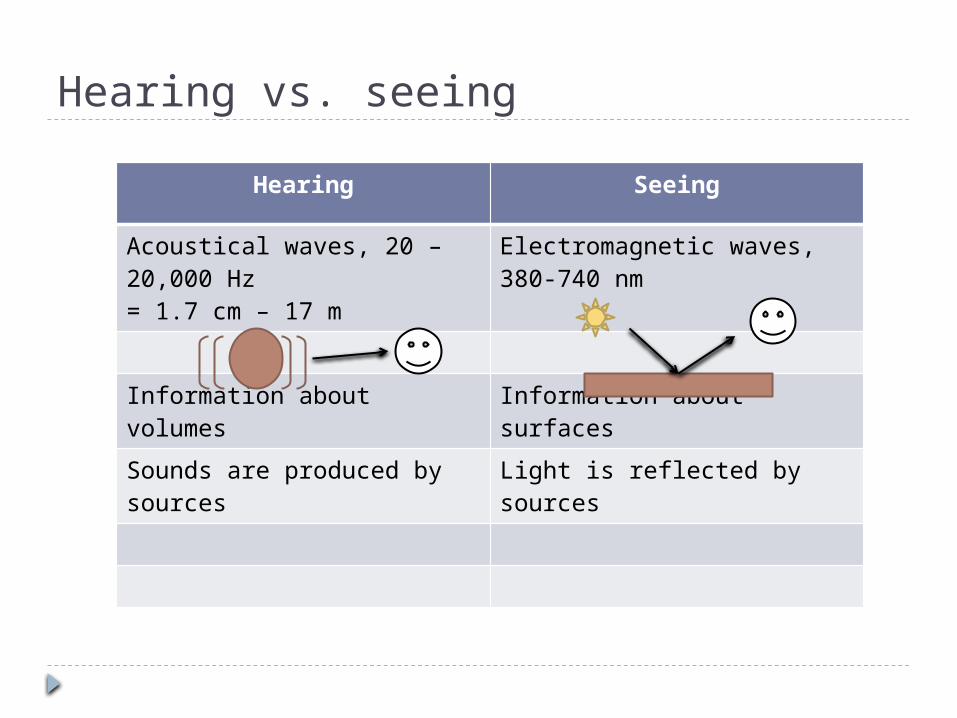
Hearing Seeing
Acoustical waves, 20 – 20,000 Hz= 1.7 cm – 17 m
Electromagnetic waves, 380-740 nm
Information about volumes Information about surfaces
Sounds are produced by sources
Light is reflected by sources
Hearing vs. seeing
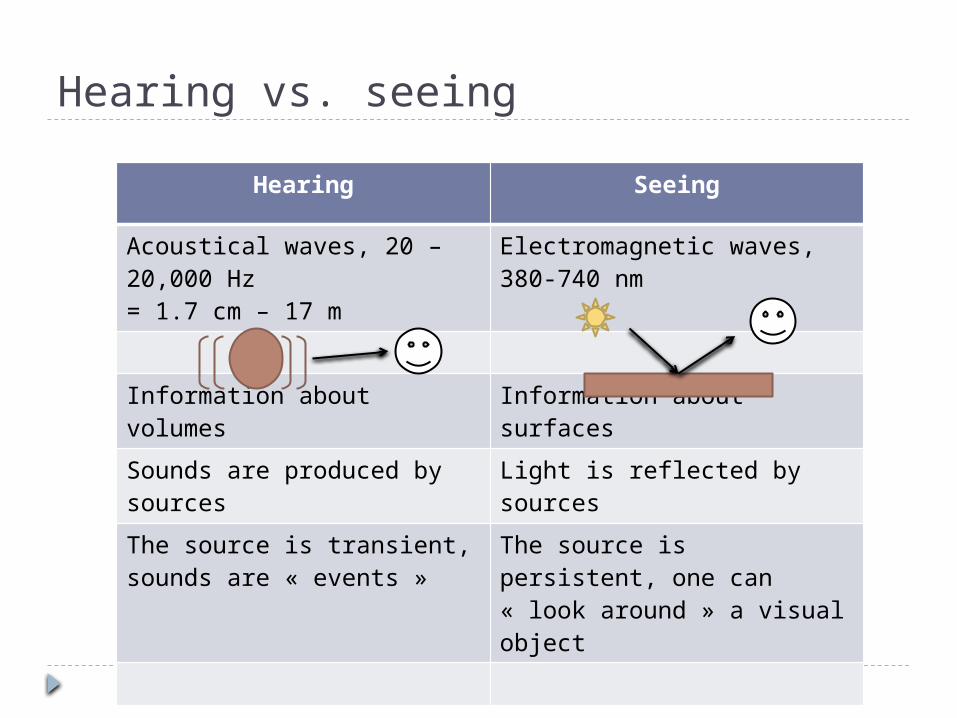
Hearing Seeing
Acoustical waves, 20 – 20,000 Hz= 1.7 cm – 17 m
Electromagnetic waves, 380-740 nm
Information about volumes Information about surfaces
Sounds are produced by sources
Light is reflected by sources
The source is transient, sounds are « events »
The source is persistent, one can « look around » a visual object
Hearing vs. seeing
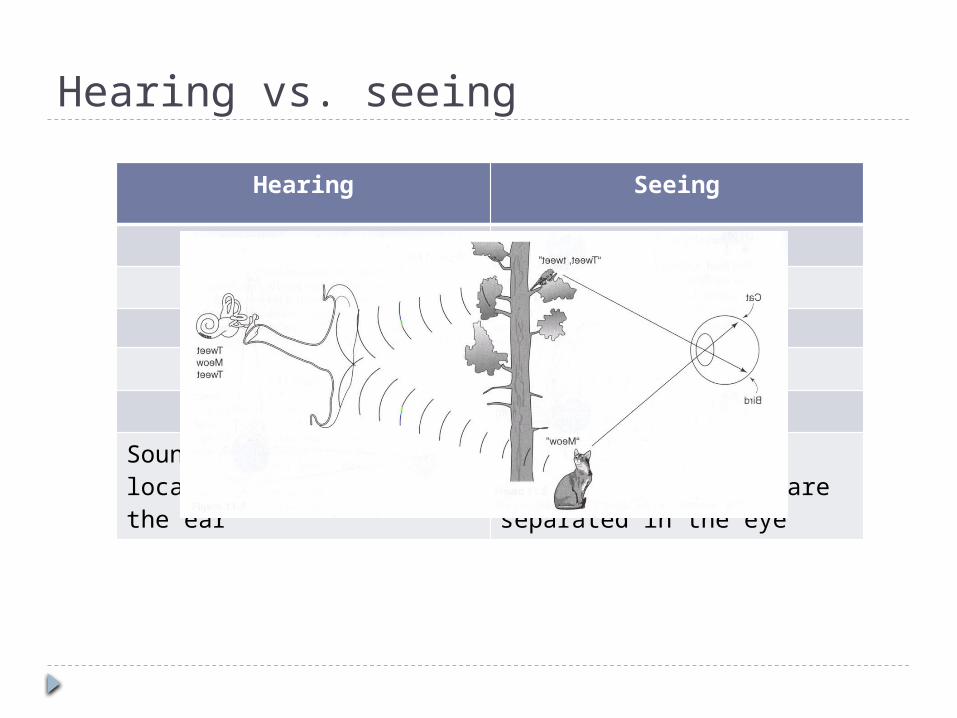
Hearing Seeing
Sounds from different locations are mixed at the ear
Light rays from different locations are separated in the eye
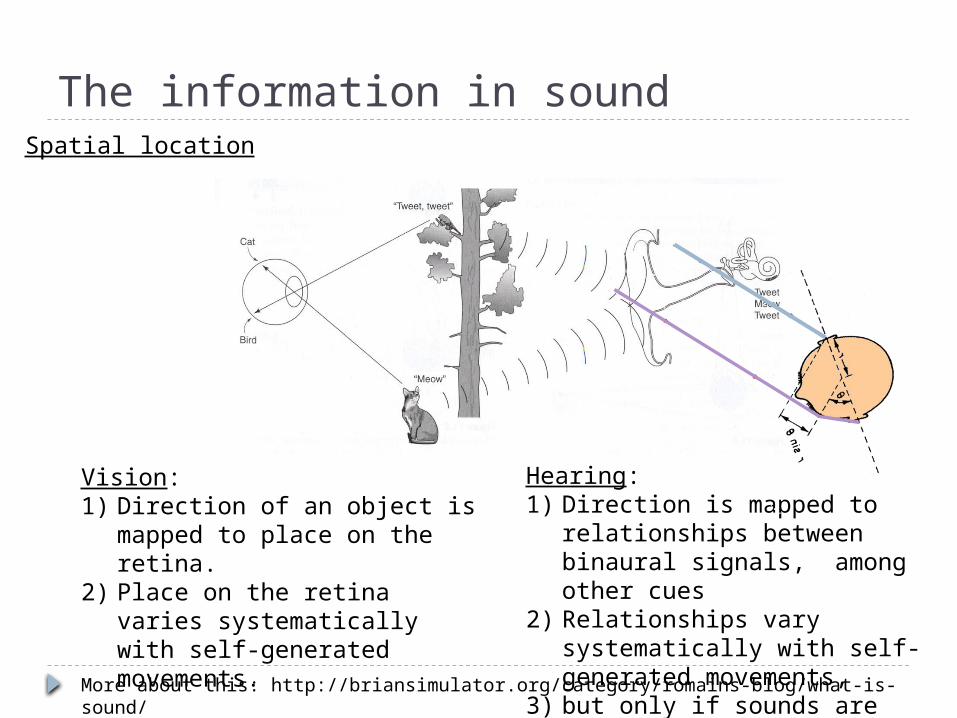
The information in soundSpatial location
Vision: 1) Direction of an object is
mapped to place on the retina.
2) Place on the retina varies systematically with self-generated movements.
Hearing:1) Direction is mapped to
relationships between binaural signals, among other cues
2) Relationships vary systematically with self-generated movements,
3) but only if sounds are repeated
More about this: http://briansimulator.org/category/romains-blog/what-is-sound/
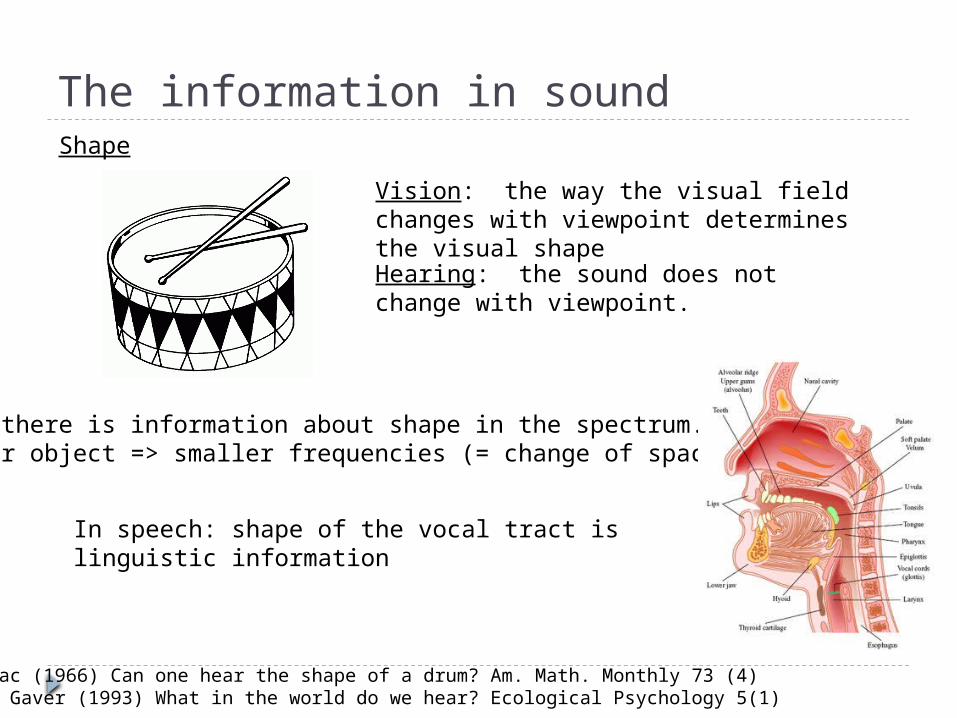
The information in soundShape
Vision: the way the visual field changes with viewpoint determines the visual shapeHearing: the sound does not change with viewpoint.
But: there is information about shape in the spectrum.Larger object => smaller frequencies (= change of space units).
M. Kac (1966) Can one hear the shape of a drum? Am. Math. Monthly 73 (4)W.W. Gaver (1993) What in the world do we hear? Ecological Psychology 5(1)
In speech: shape of the vocal tract is linguistic information
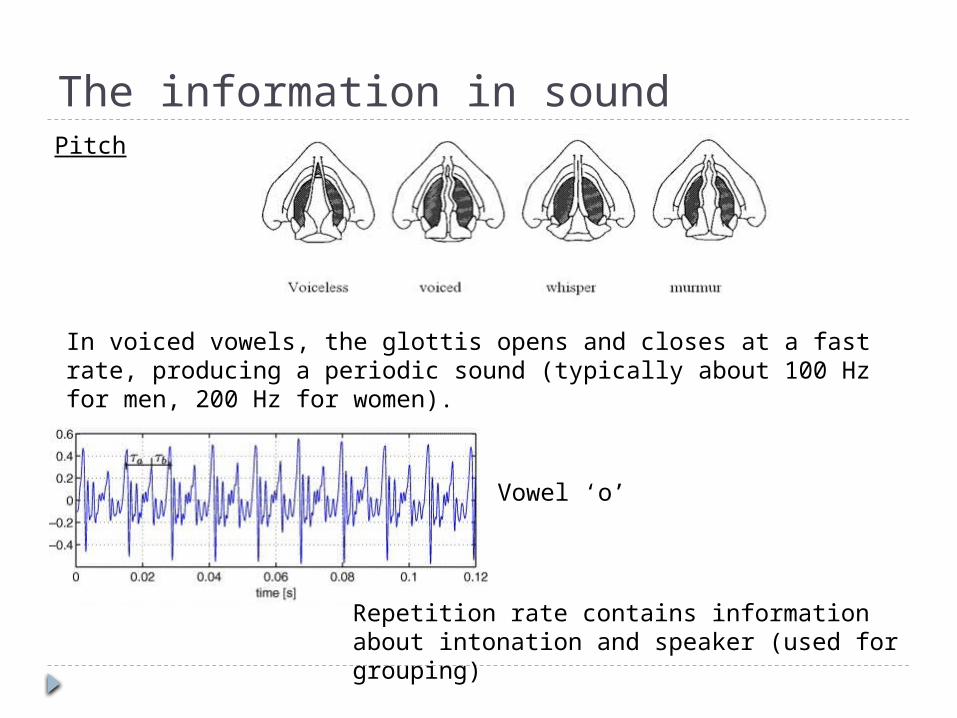
The information in soundPitch
In voiced vowels, the glottis opens and closes at a fast rate, producing a periodic sound (typically about 100 Hz for men, 200 Hz for women).
Vowel ‘o’
Repetition rate contains information about intonation and speaker (used for grouping)
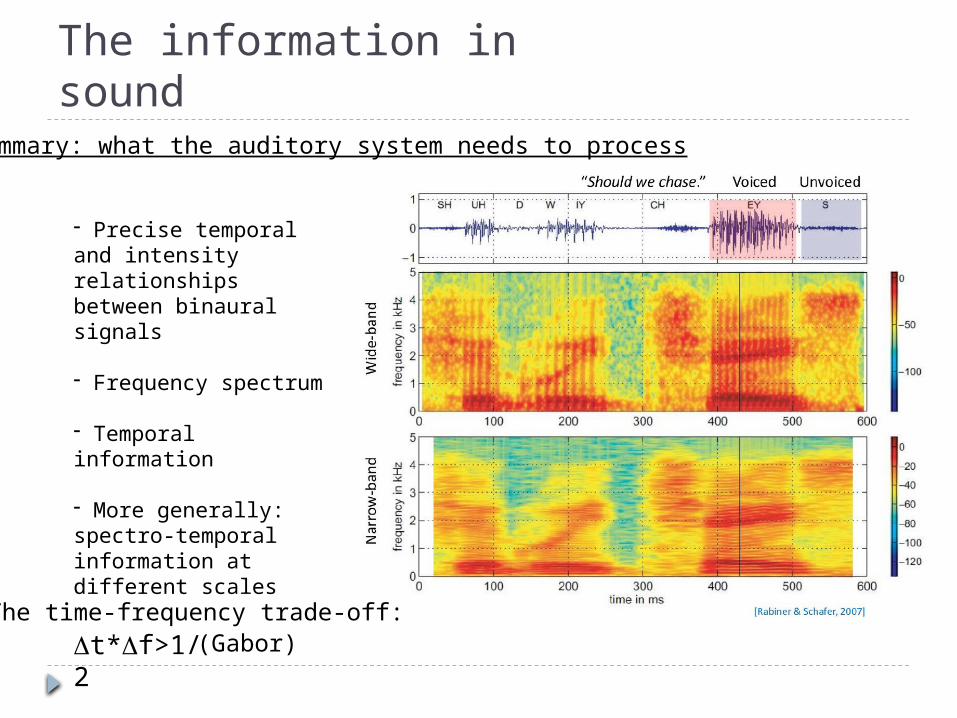
The information in soundSummary: what the auditory system needs to process
- Precise temporal and intensity relationships between binaural signals
- Frequency spectrum
- Temporal information
- More generally: spectro-temporal information at different scales
t*f>1/2 (Gabor)The time-frequency trade-off:
Anatomy and physiology of the auditory system
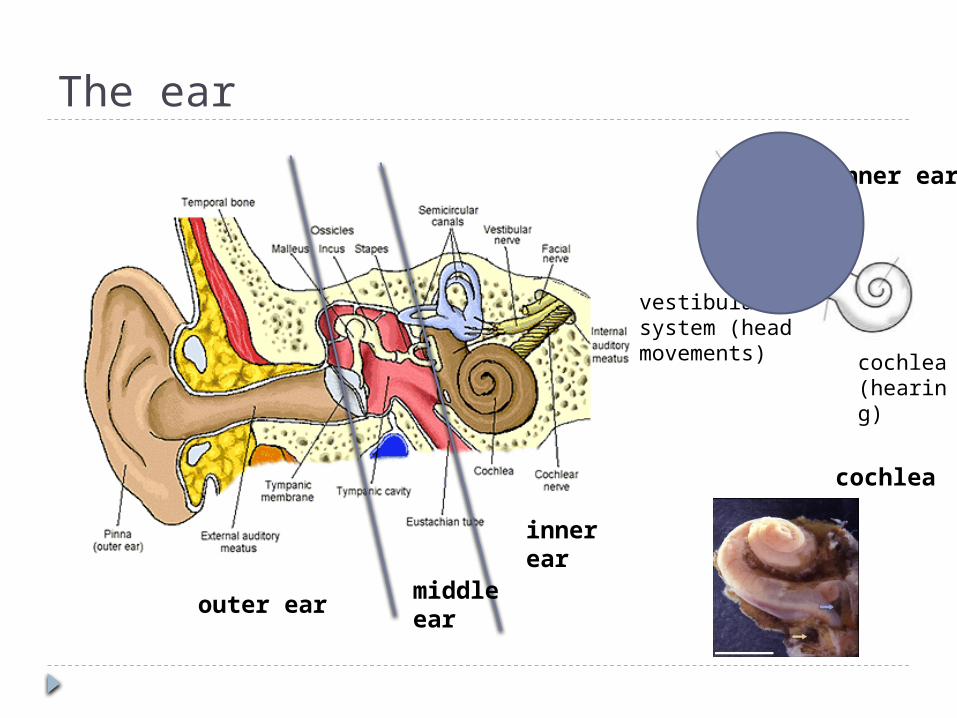
The ear
cochlea
inner ear
vestibular system (head movements) cochlea
(hearing)
outer earmiddle ear
inner ear
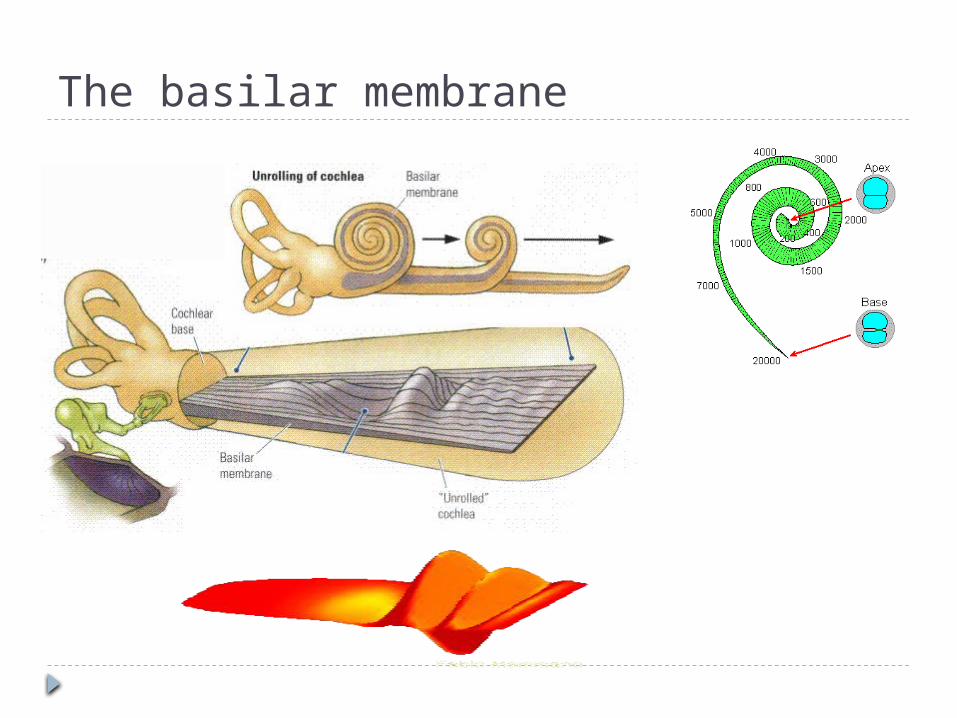
The basilar membrane
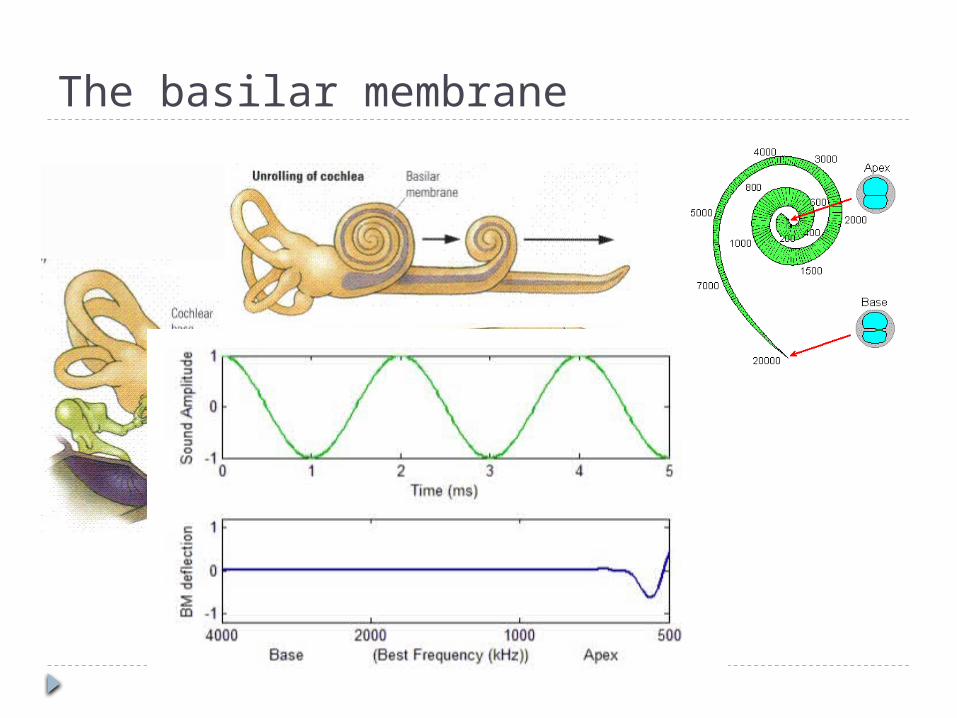
The basilar membrane
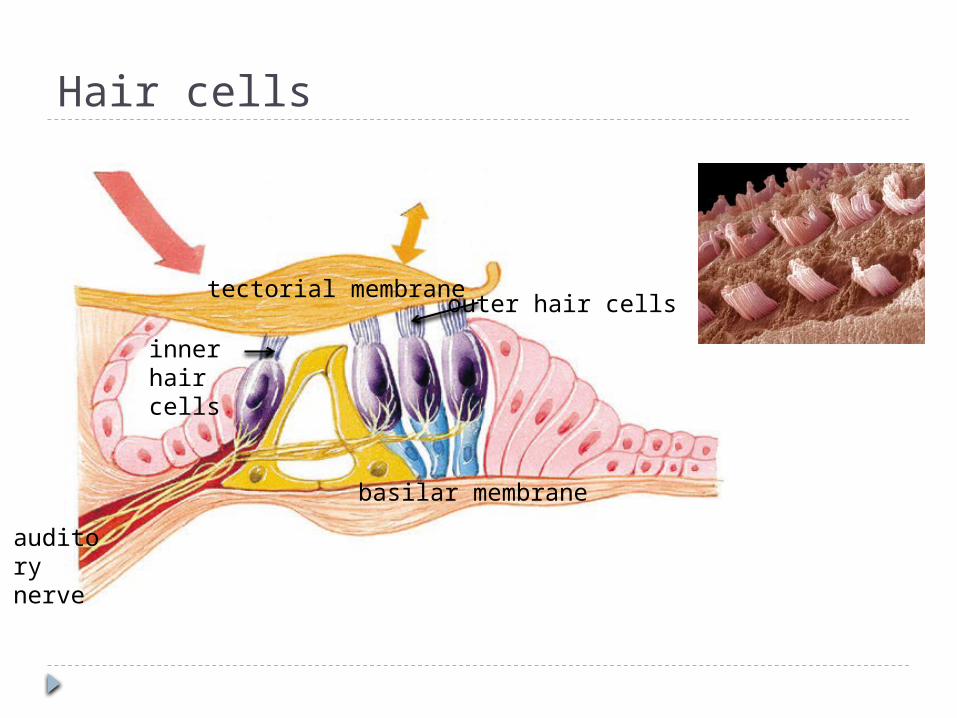
Hair cells
outer hair cells
inner hair cells
auditory nerve
tectorial membrane
basilar membrane
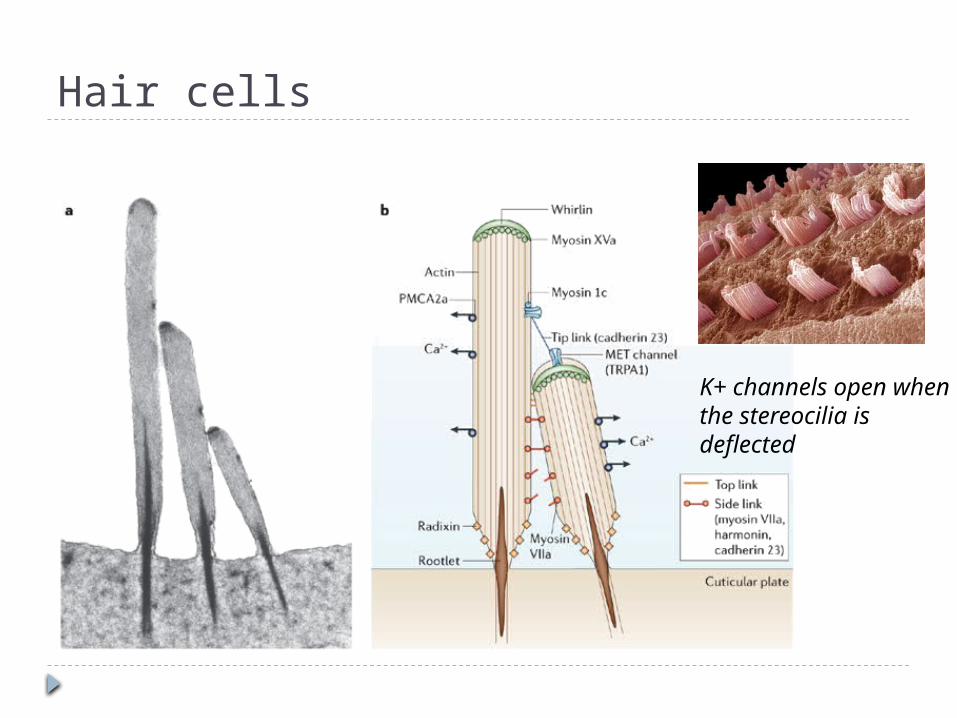
Hair cells
K+ channels open when the stereocilia is deflected
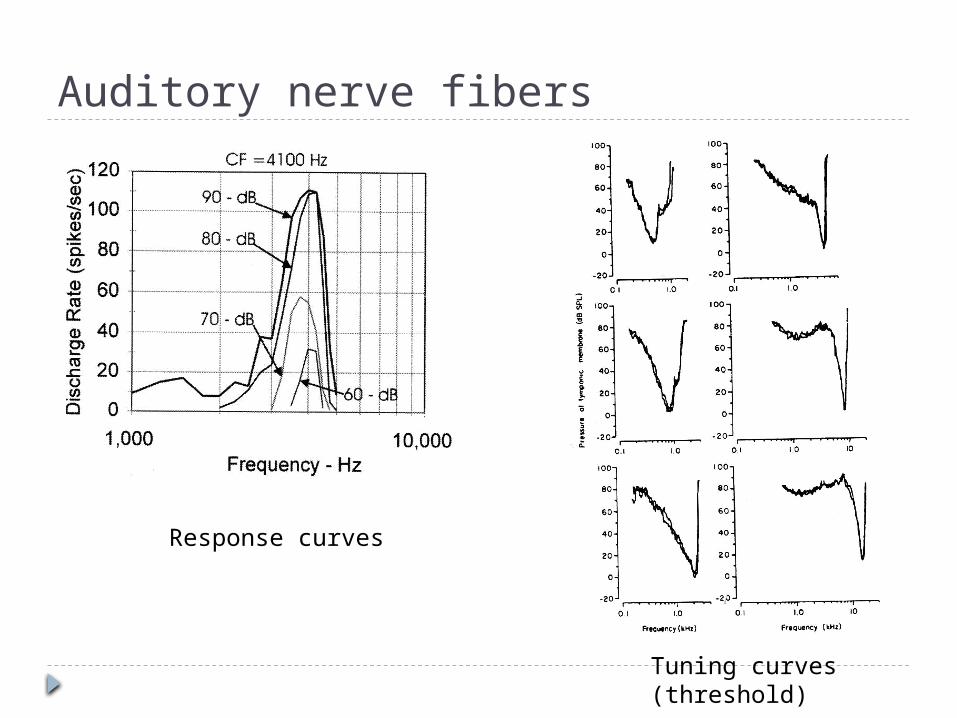
Auditory nerve fibers
Tuning curves(threshold)
Response curves
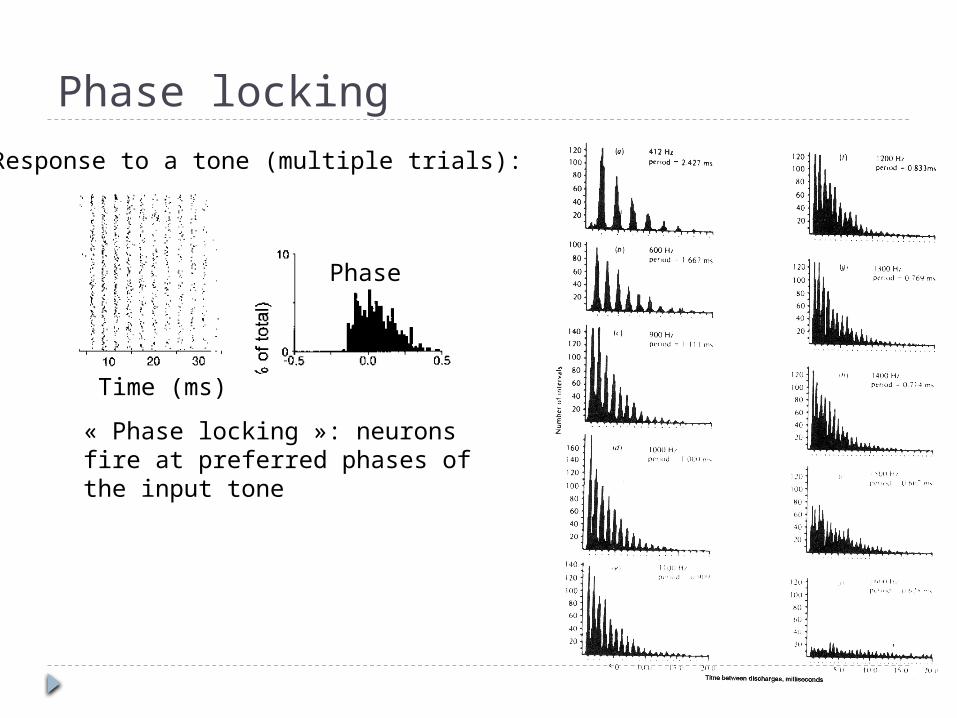
Phase locking
Response to a tone (multiple trials):
Time (ms)
« Phase locking »: neurons fire at preferred phases of the input tone
Phase
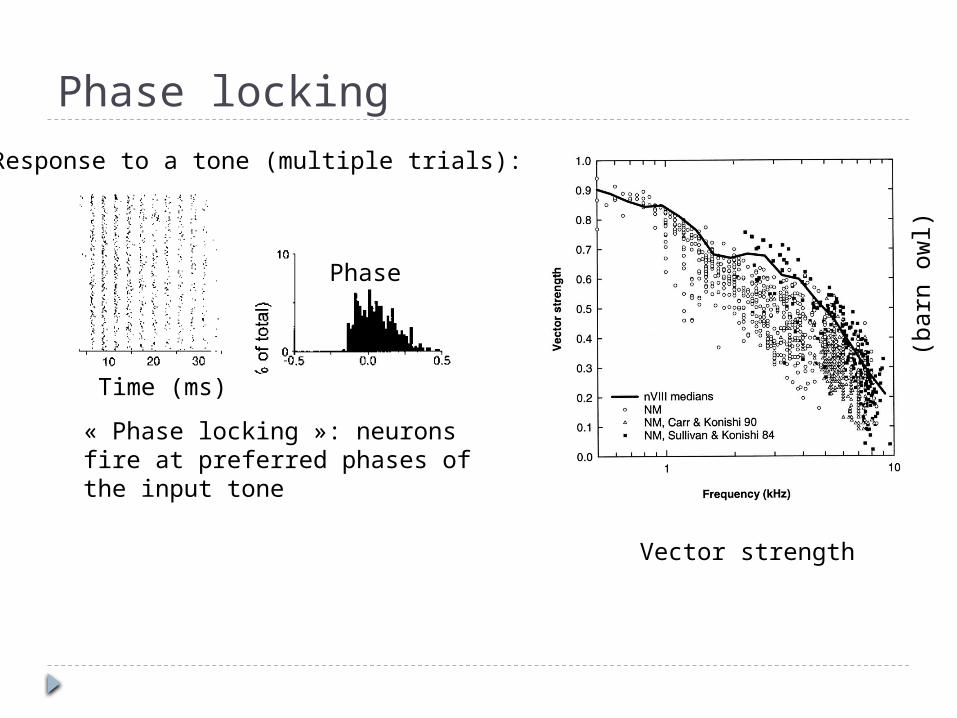
Phase locking
(barn
ow
l)
Response to a tone (multiple trials):
Time (ms)
« Phase locking »: neurons fire at preferred phases of the input tone
Phase
Vector strength
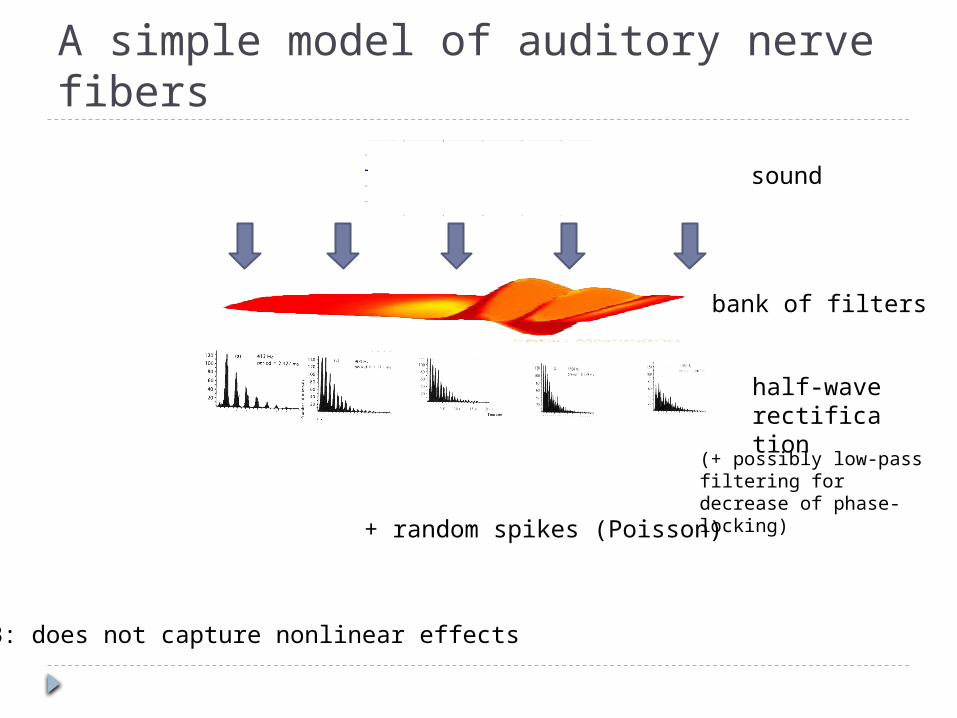
A simple model of auditory nerve fibers
bank of filters
sound
NB: does not capture nonlinear effects
half-wave rectification
(+ possibly low-pass filtering for decrease of phase-locking)
+ random spikes (Poisson)
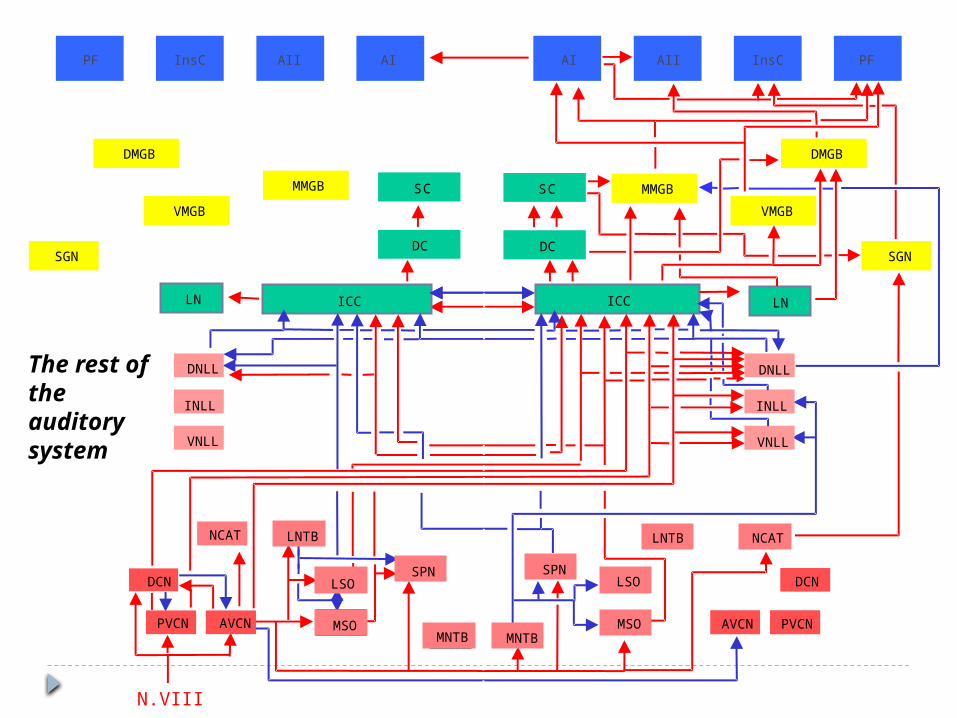
MNTB
ICC ICC
DNLL
INLL
VNLL
DNLL
INLL
VNLL
LNTBLNTB
LSO
MSO
SPN SPN
MNTB
LSO
MSO
DCN
PVCN AVCN
DCN
AVCN PVCN
DC DC
SC SC
LN LN
MMGB
DMGB
VMGB
SGN
PF InsC AII AI PFInsCAIIAI
MNTB
NCATNCAT
N.VIII
MMGB
DMGB
VMGB
SGN
The rest of the auditory system
Sound localization: acoustical cues
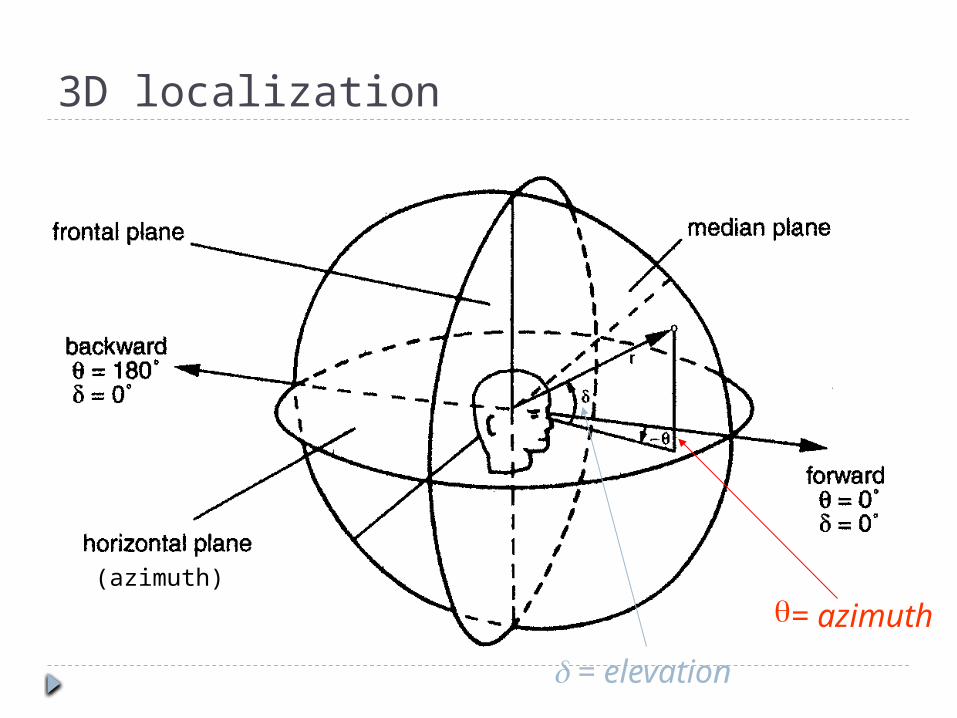
3D localization
q= azimuth
d = elevation
(azimuth)
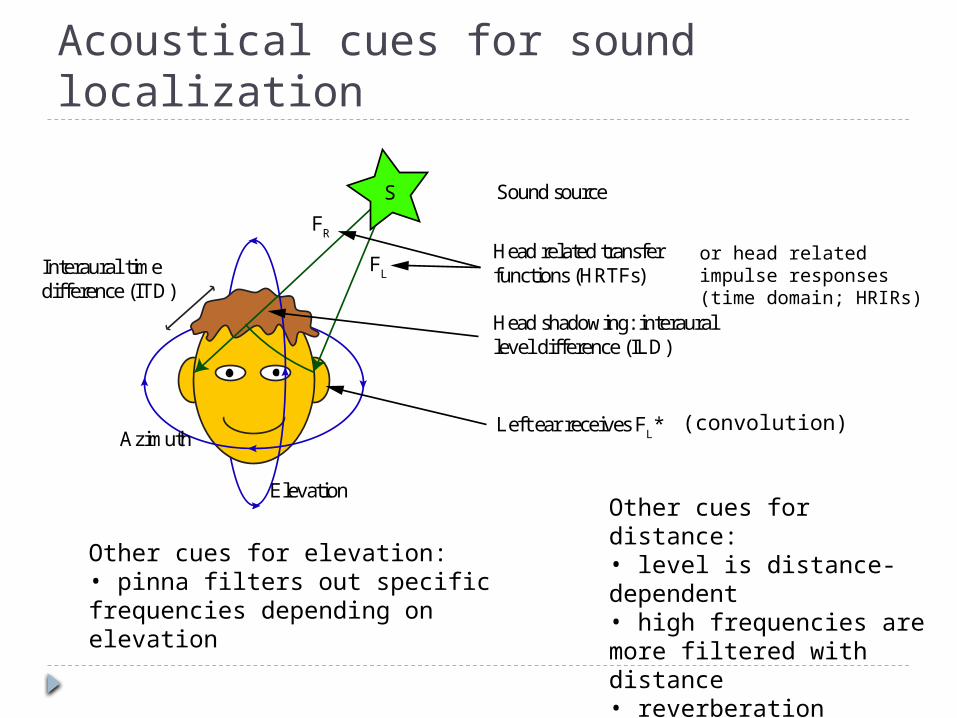
Acoustical cues for sound localization
Interaural timedifference (ITD)
FR
FL
Azimuth
Elevation
S
Head shadowing: interaurallevel difference (ILD)
Head related transferfunctions (HRTFs)
Sound source
Left ear receives FL*
or head related impulse responses (time domain; HRIRs)
Other cues for distance:• level is distance-dependent• high frequencies are more filtered with distance• reverberation correlates with distance
Other cues for elevation:• pinna filters out specific frequencies depending on elevation
(convolution)
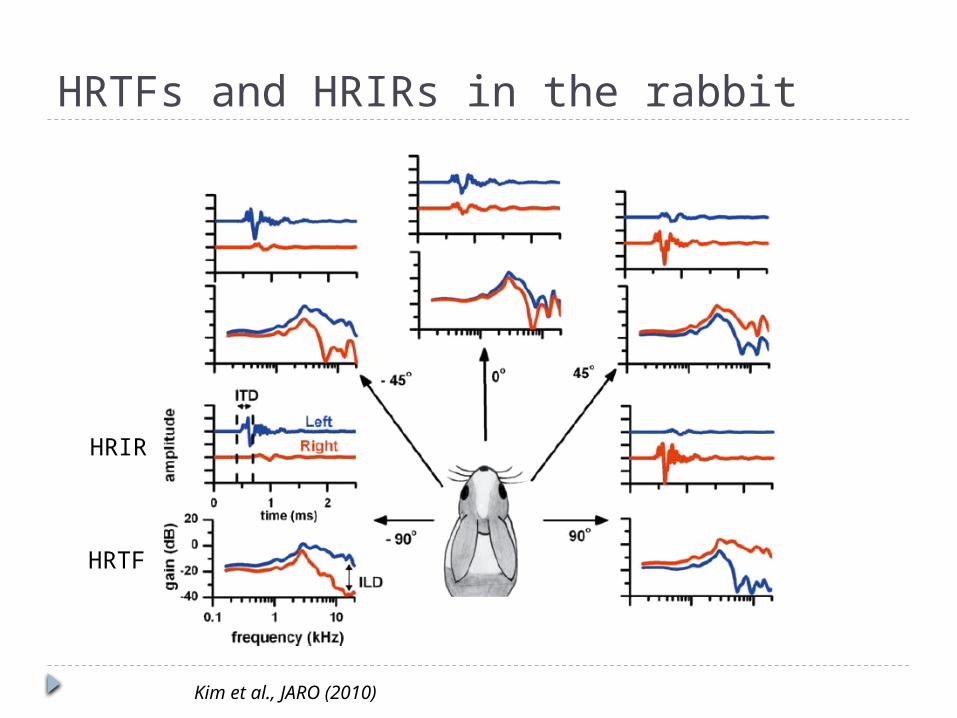
HRTFs and HRIRs in the rabbit
Kim et al., JARO (2010)
HRIR
HRTF
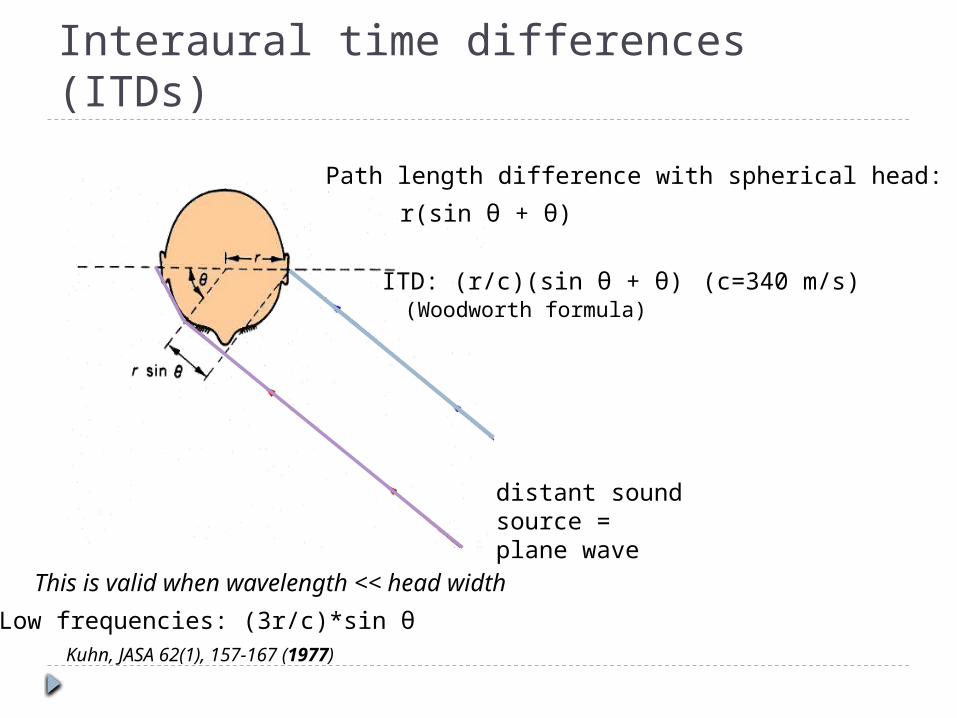
Interaural time differences (ITDs)
distant sound source = plane wave
Path length difference with spherical head:
r(sin θ + θ)
This is valid when wavelength << head width
Low frequencies: (3r/c)*sin θKuhn, JASA 62(1), 157-167 (1977)
ITD: (r/c)(sin θ + θ) (c=340 m/s)(Woodworth formula)
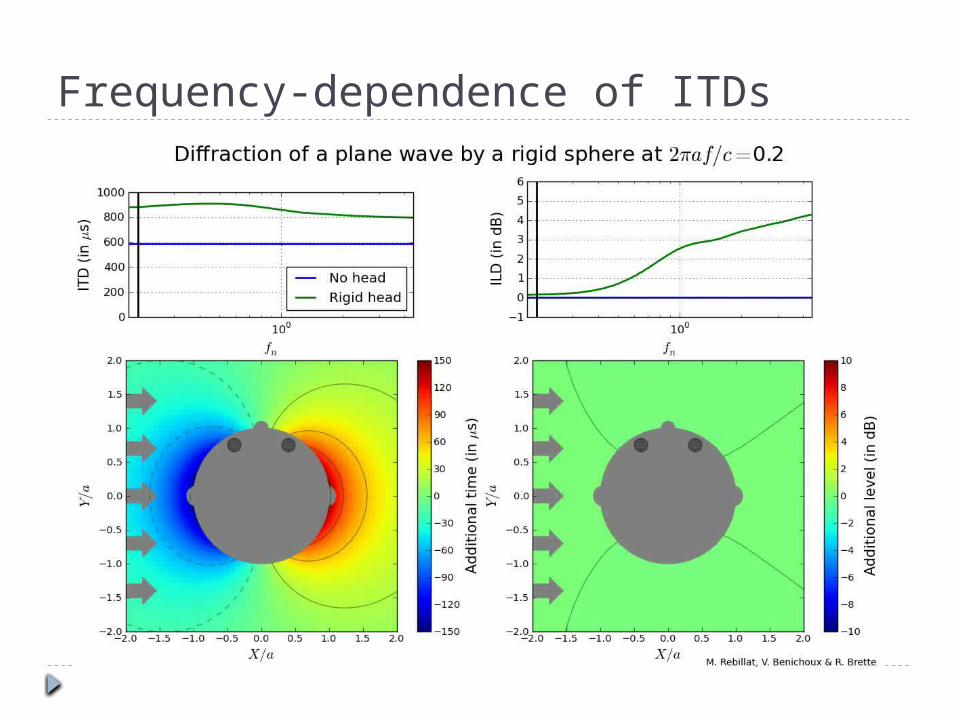
Frequency-dependence of ITDs
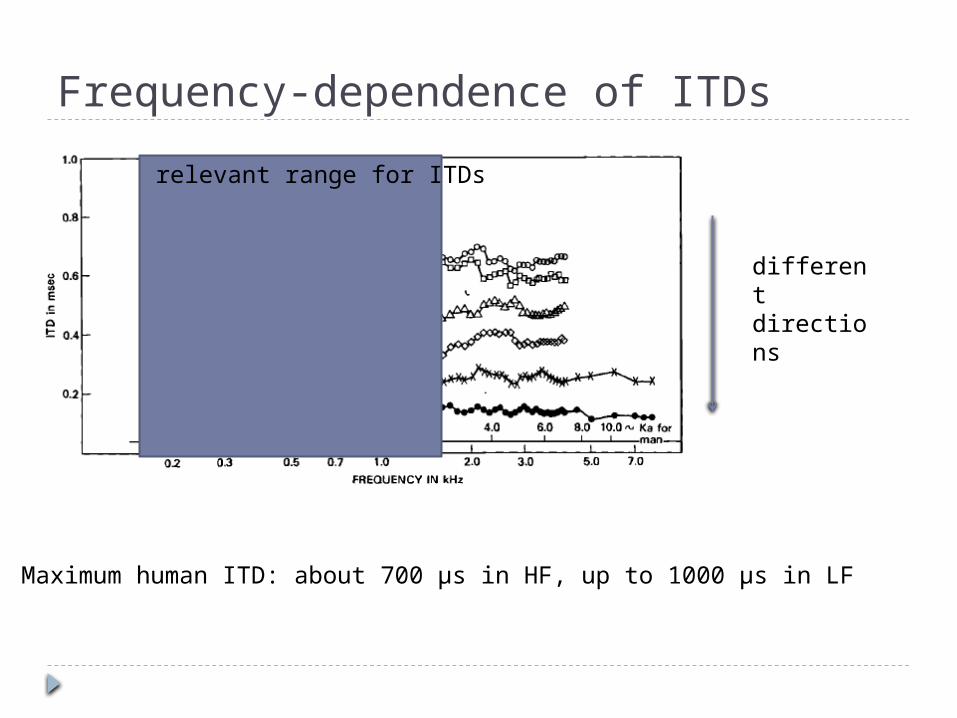
Frequency-dependence of ITDs
relevant range for ITDs
different directions
Maximum human ITD: about 700 µs in HF, up to 1000 µs in LF
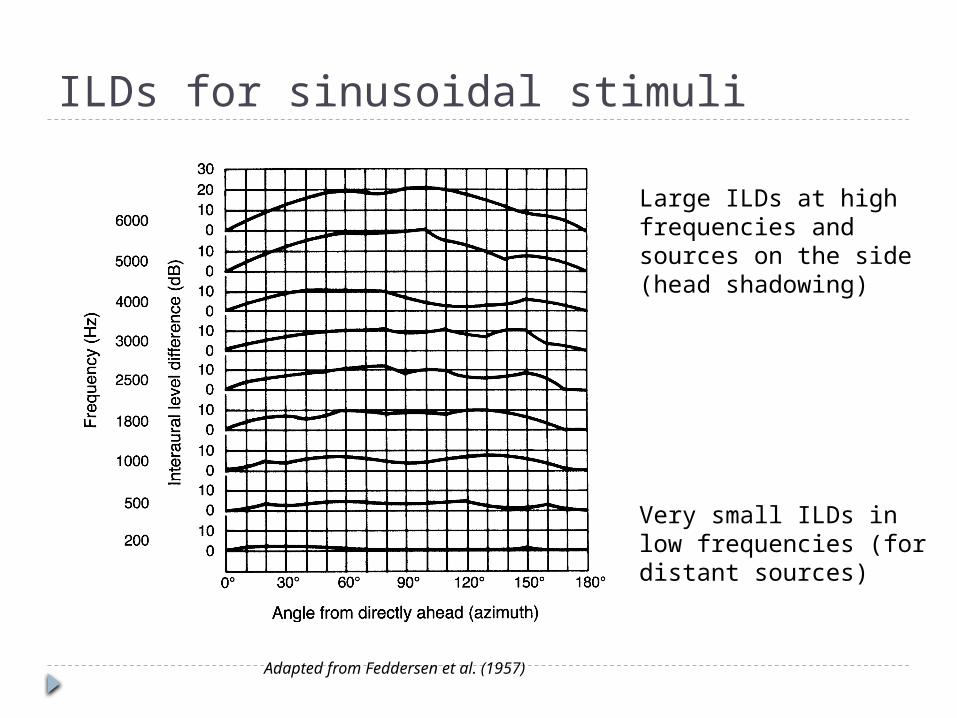
ILDs for sinusoidal stimuli
Adapted from Feddersen et al. (1957)
Very small ILDs in low frequencies (for distant sources)
Large ILDs at high frequencies and sources on the side (head shadowing)
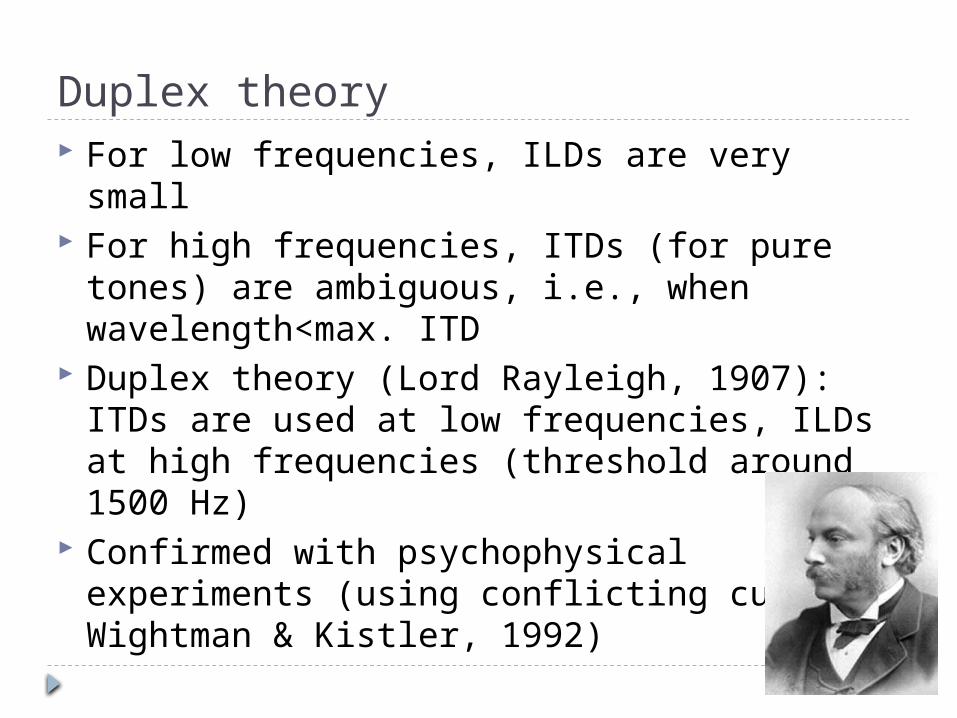
Duplex theory For low frequencies, ILDs are very small For high frequencies, ITDs (for pure tones) are
ambiguous, i.e., when wavelength<max. ITD Duplex theory (Lord Rayleigh, 1907): ITDs are
used at low frequencies, ILDs at high frequencies (threshold around 1500 Hz)
Confirmed with psychophysical experiments (using conflicting cues; Wightman & Kistler, 1992)
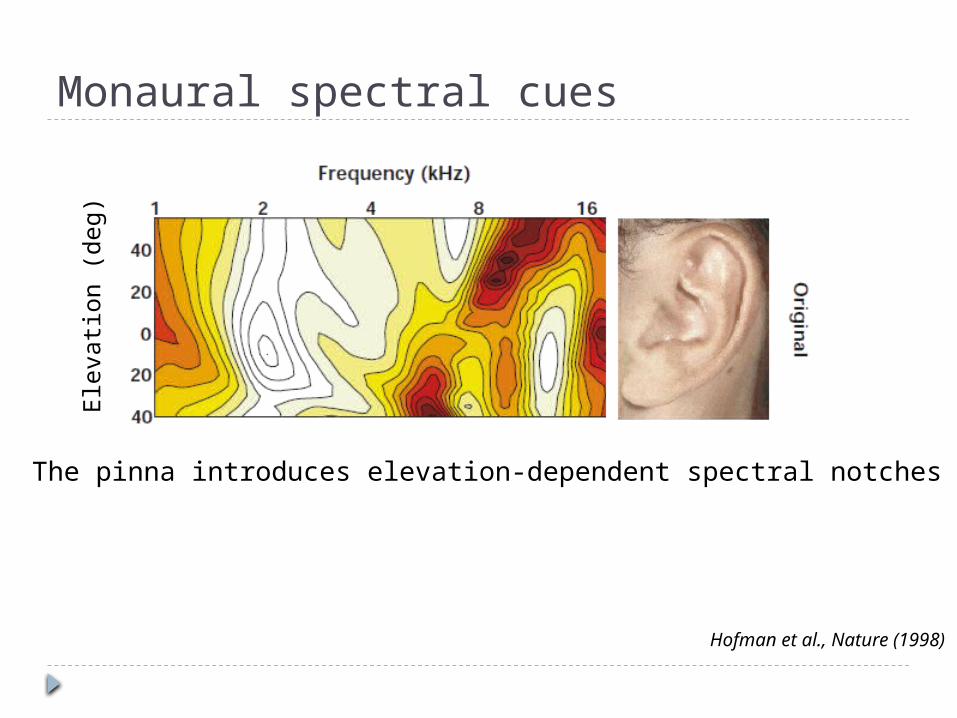
Monaural spectral cuesEle
vati
on (
deg
)
The pinna introduces elevation-dependent spectral notches
Hofman et al., Nature (1998)
Sound localization: anatomy and physiology
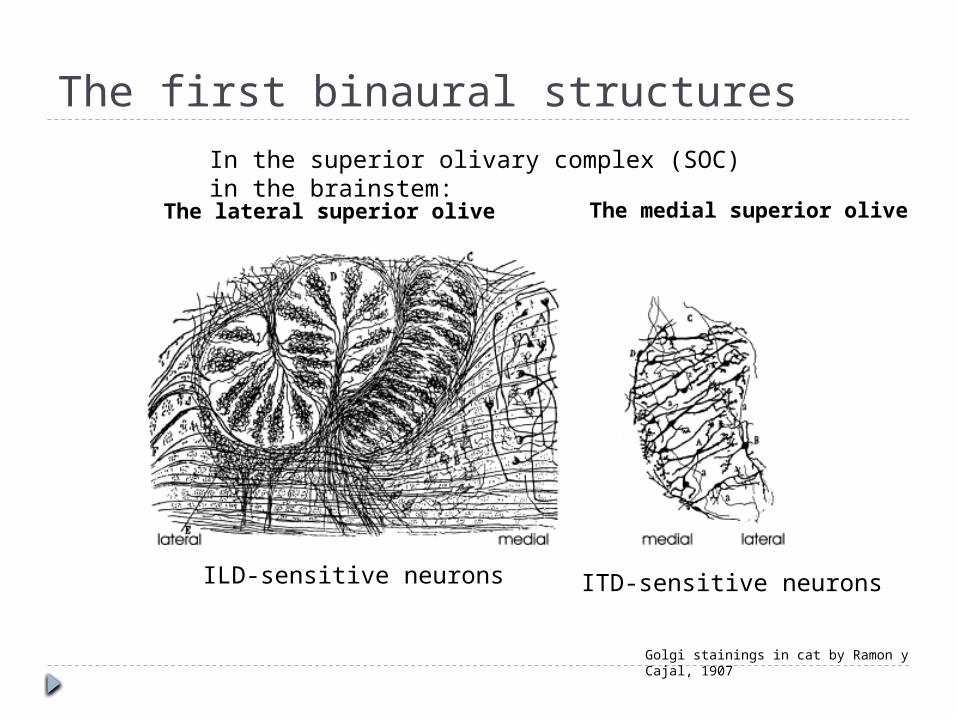
The first binaural structures
The lateral superior olive
Golgi stainings in cat by Ramon y Cajal, 1907
The medial superior olive
In the superior olivary complex (SOC) in the brainstem:
ILD-sensitive neurons ITD-sensitive neurons
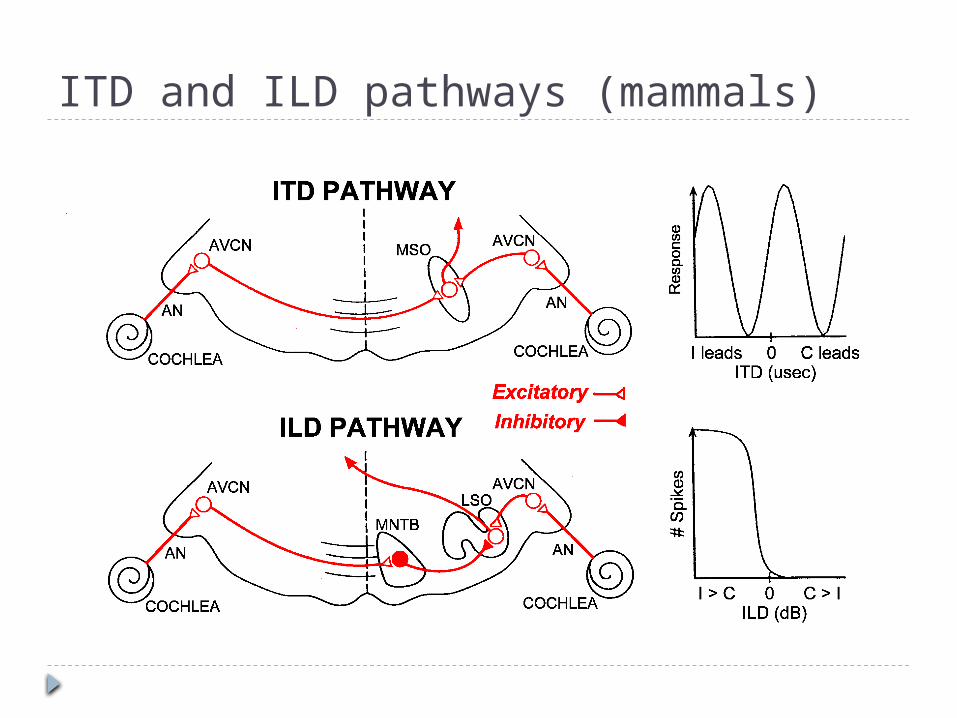
ITD and ILD pathways (mammals)
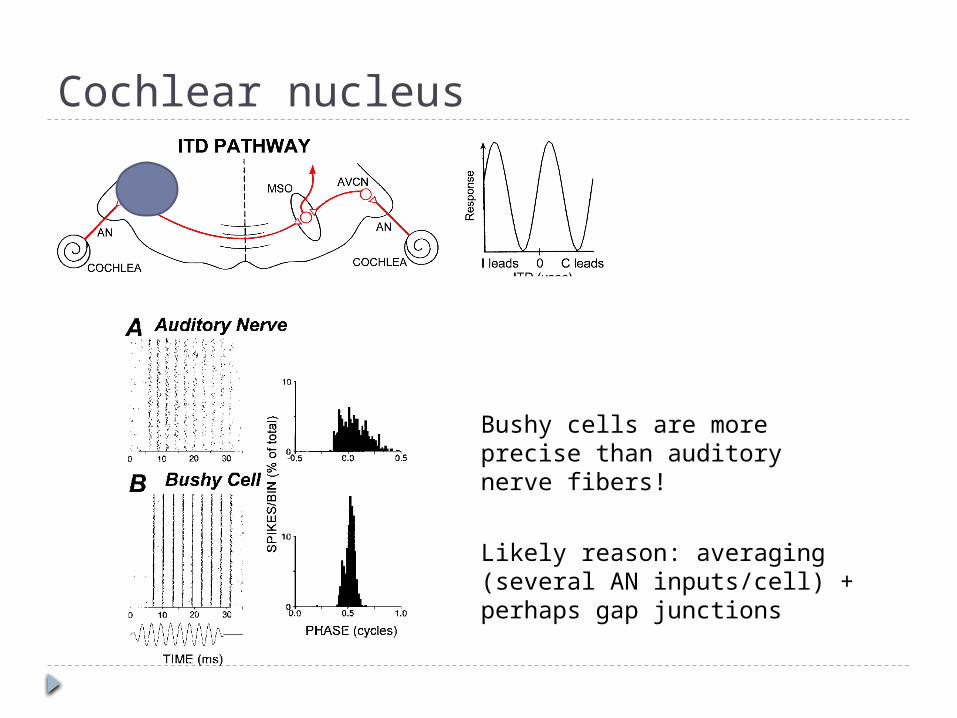
Cochlear nucleus
Bushy cells are more precise than auditory nerve fibers!
Likely reason: averaging (several AN inputs/cell) + perhaps gap junctions
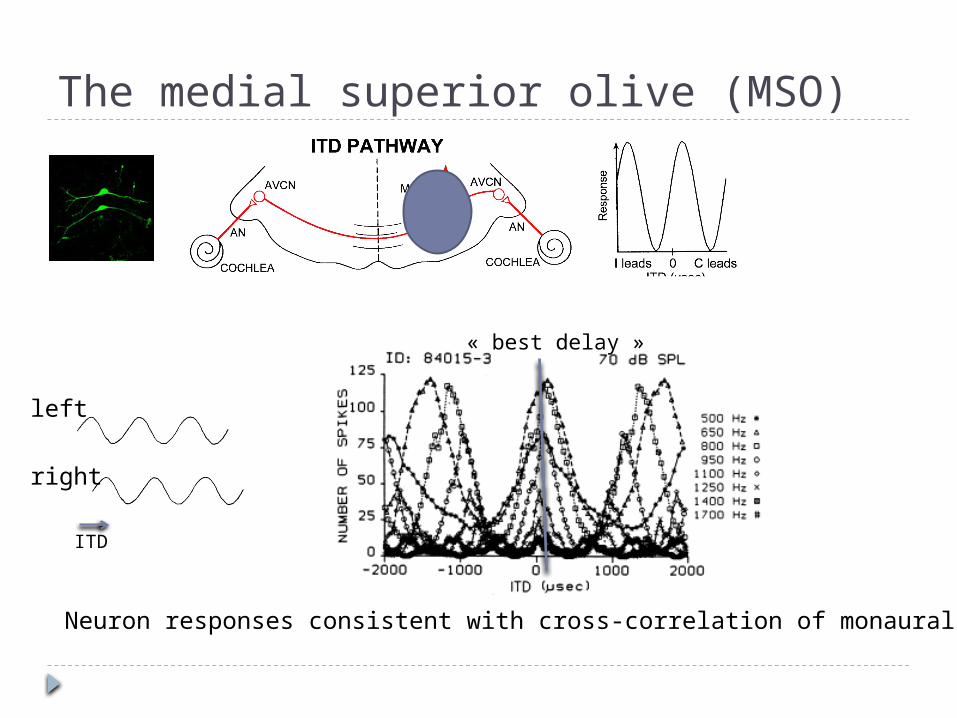
The medial superior olive (MSO)
left
right
ITD
Neuron responses consistent with cross-correlation of monaural inputs
« best delay »
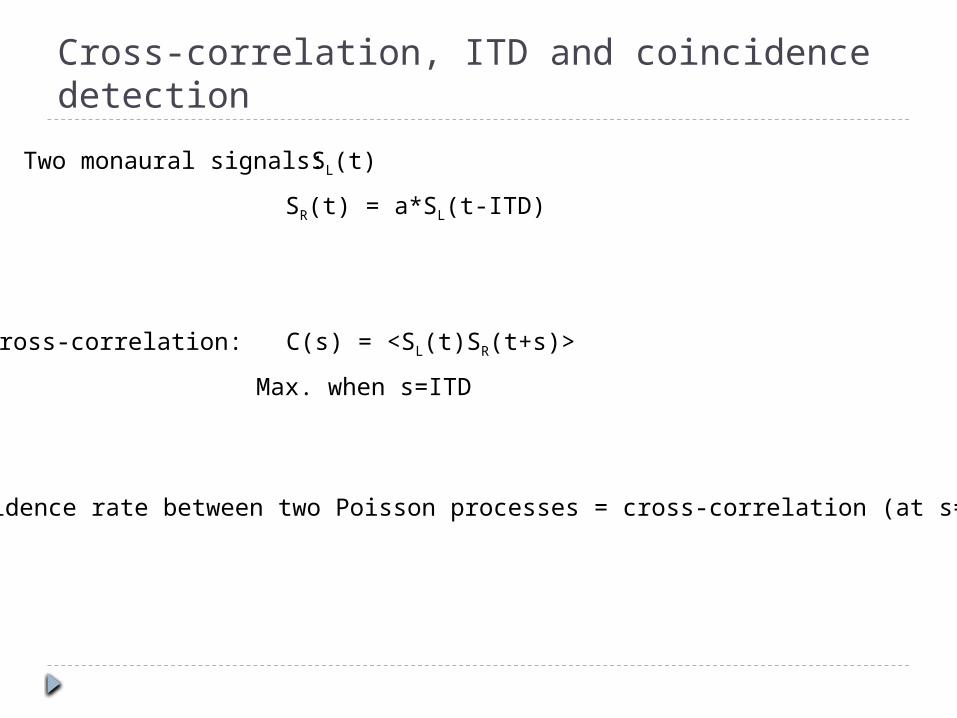
Cross-correlation, ITD and coincidence detection
Two monaural signals: SL(t)
SR(t) = a*SL(t-ITD)
Cross-correlation: C(s) = <SL(t)SR(t+s)>
Max. when s=ITD
Coincidence rate between two Poisson processes = cross-correlation (at s=0)

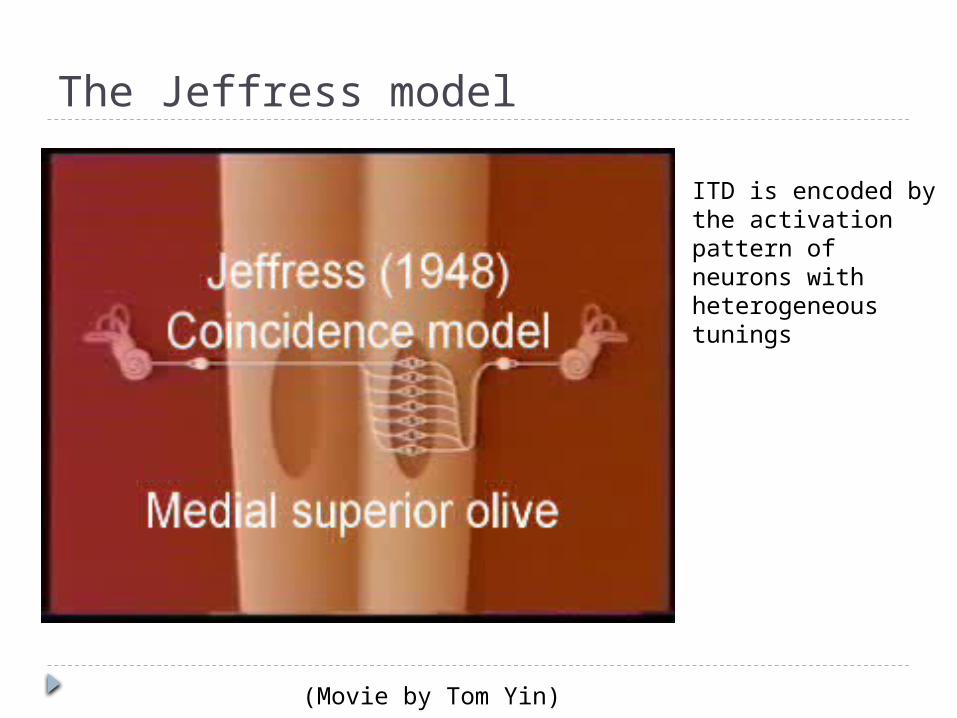
The Jeffress model
The Jeffress model
ITD is encoded by the activation pattern of neurons with heterogeneous tunings
(Movie by Tom Yin)
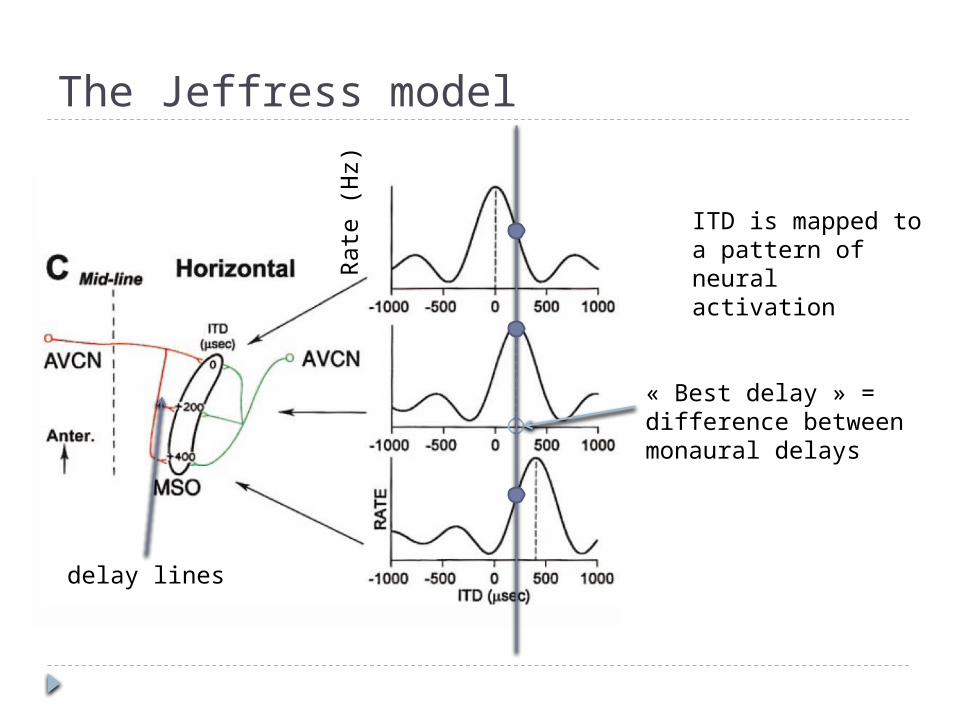
The Jeffress model
Rate
(H
z)
« Best delay » = difference between monaural delays
ITD is mapped to a pattern of neural activation
delay lines
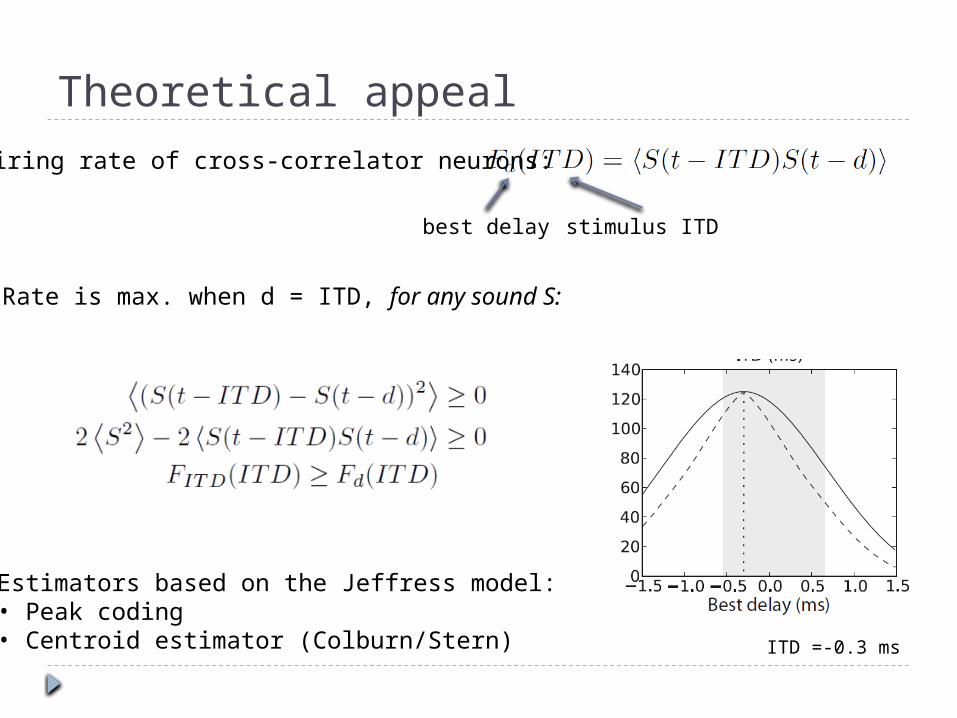
Theoretical appeal
ITD =-0.3 ms
Firing rate of cross-correlator neurons:
best delay stimulus ITD
Rate is max. when d = ITD, for any sound S:
Estimators based on the Jeffress model:• Peak coding• Centroid estimator (Colburn/Stern)
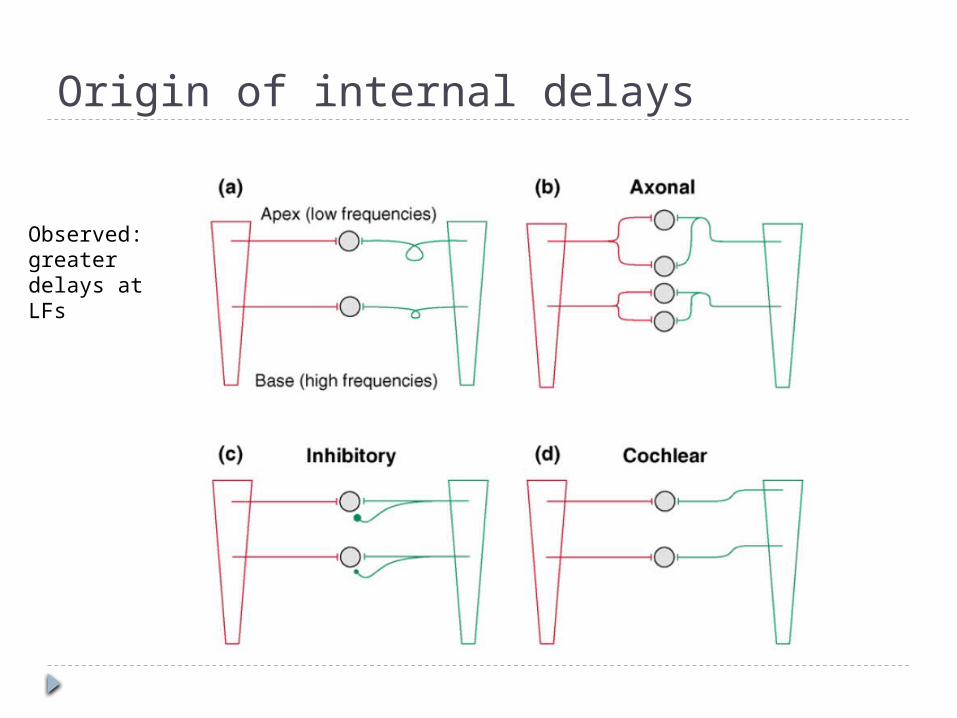
Origin of internal delays
Observed: greater delays at LFs
The hemispheric model
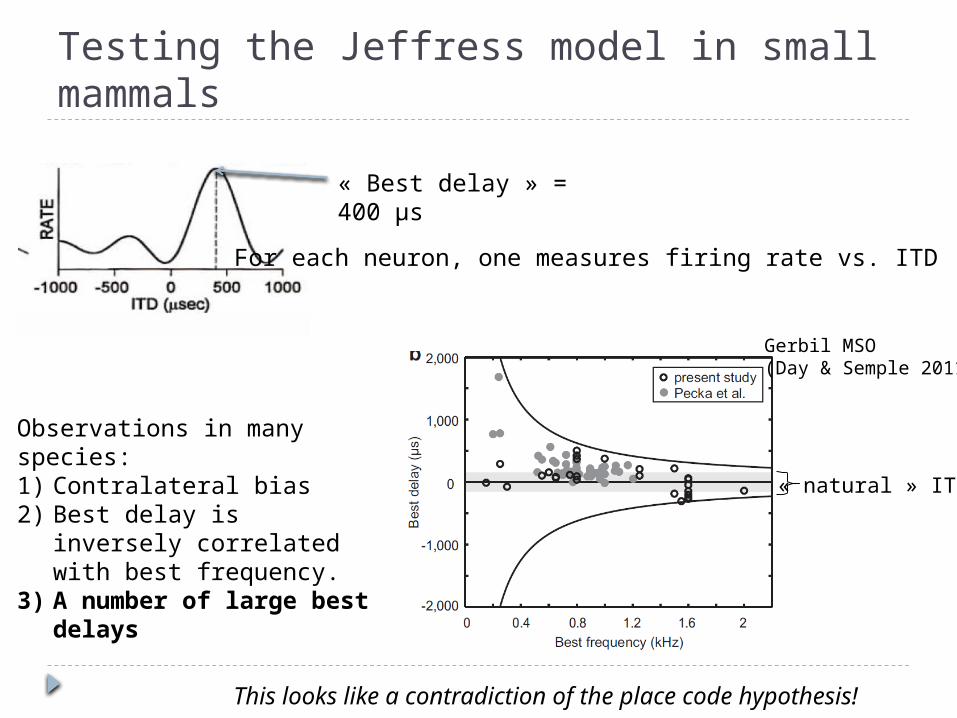
Testing the Jeffress model in small mammals
Gerbil MSO(Day & Semple 2011)
« natural » ITDs
Observations in many species:1) Contralateral bias2) Best delay is inversely
correlated with best frequency.
3) A number of large best delays
« Best delay » = 400 µs
For each neuron, one measures firing rate vs. ITD
This looks like a contradiction of the place code hypothesis!
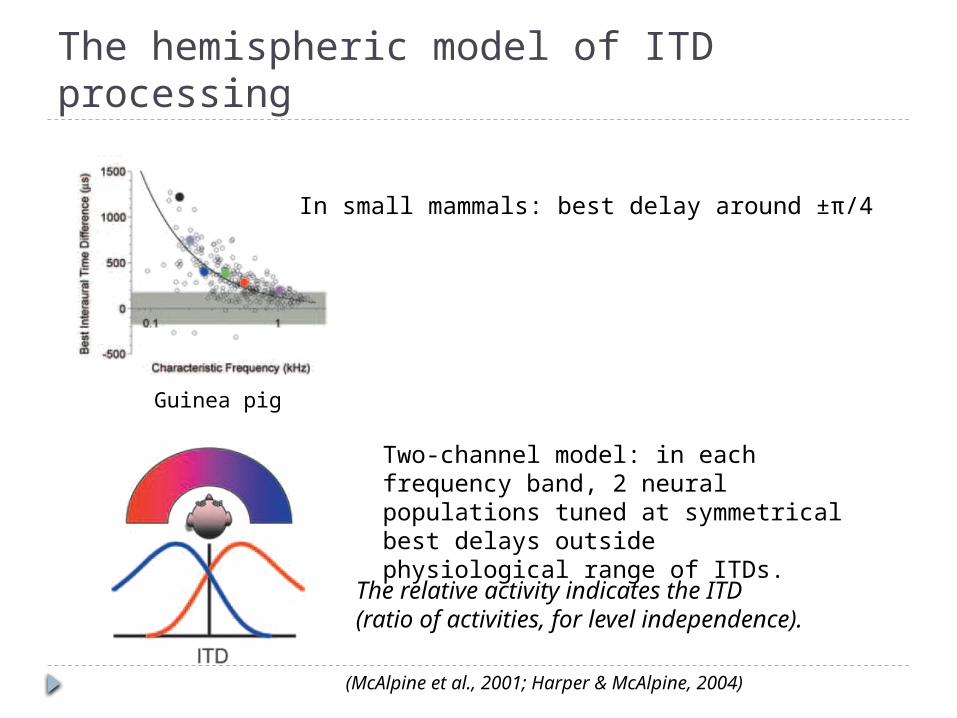
The hemispheric model of ITD processing
Guinea pig
In small mammals: best delay around ±π/4
Two-channel model: in each frequency band, 2 neural populations tuned at symmetrical best delays outside physiological range of ITDs.
The relative activity indicates the ITD(ratio of activities, for level independence).
(McAlpine et al., 2001; Harper & McAlpine, 2004)
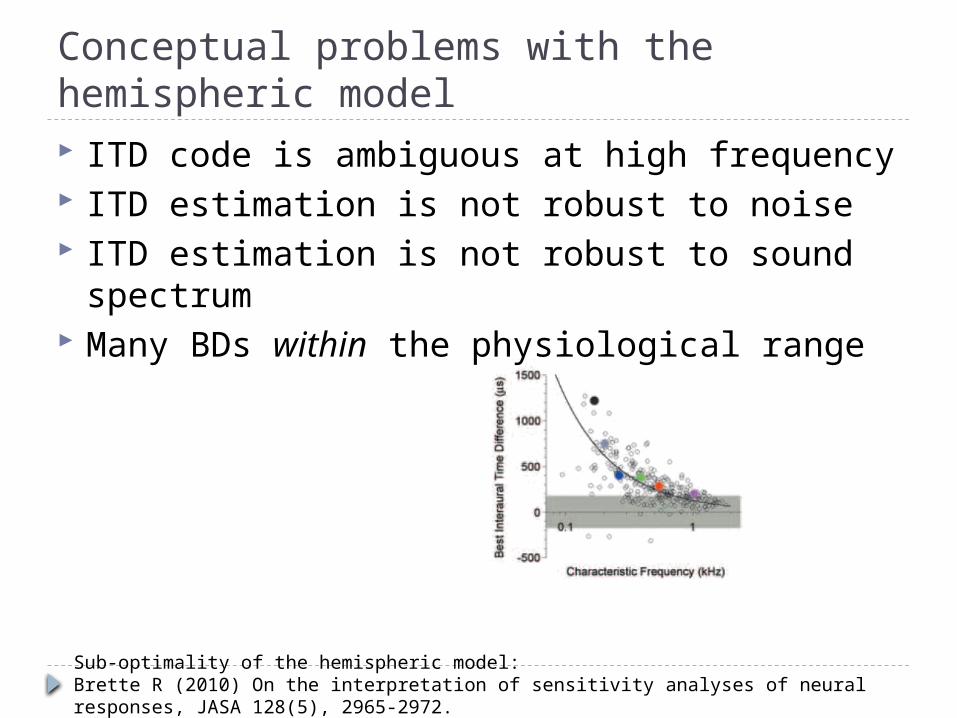
Conceptual problems with the hemispheric model ITD code is ambiguous at high frequency ITD estimation is not robust to noise ITD estimation is not robust to sound
spectrum Many BDs within the physiological range
Sub-optimality of the hemispheric model:Brette R (2010) On the interpretation of sensitivity analyses of neural responses, JASA 128(5), 2965-2972.
The synchrony field model
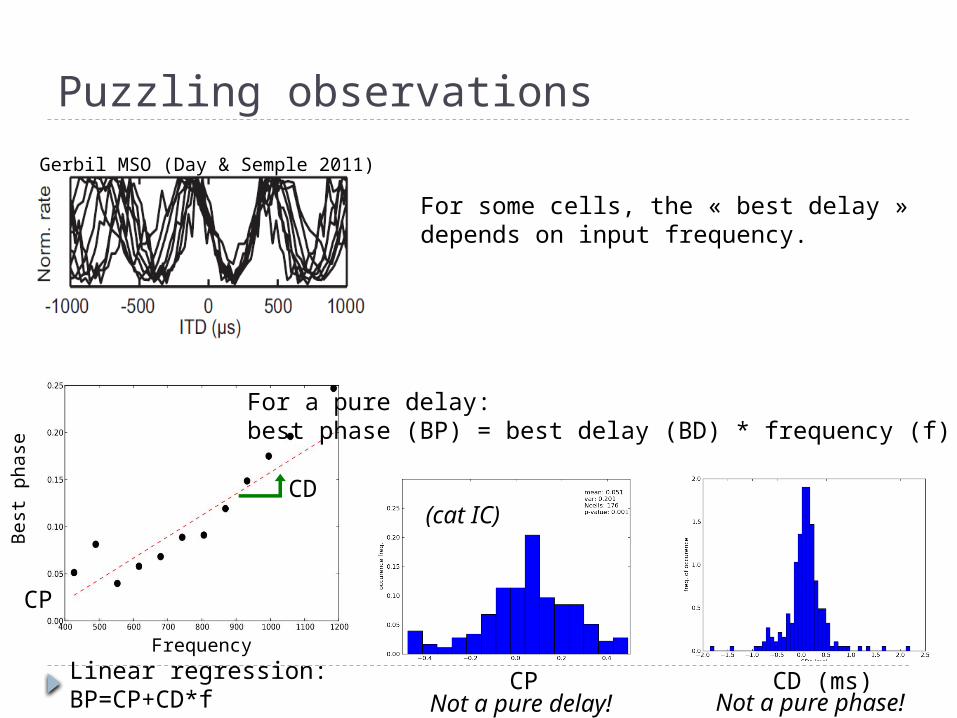
Puzzling observations
Gerbil MSO (Day & Semple 2011)
For some cells, the « best delay » depends on input frequency.
PUT A CELL
CP
CD
Frequency
Best
ph
ase
For a pure delay:best phase (BP) = best delay (BD) * frequency (f)
Linear regression:BP=CP+CD*f
CP
(cat IC)
CD (ms)Not a pure delay! Not a pure phase!
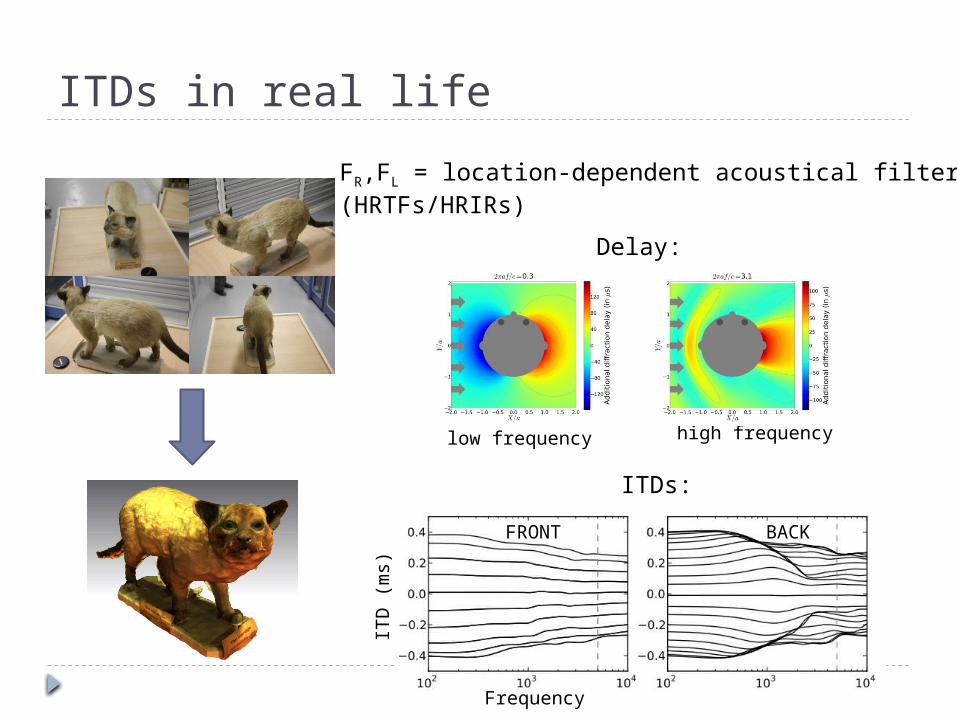
ITDs in real life
FR,FL = location-dependent acoustical filters(HRTFs/HRIRs)
Delay:
low frequency high frequency
ITDs:
FRONT BACK
Frequency
ITD
(m
s)
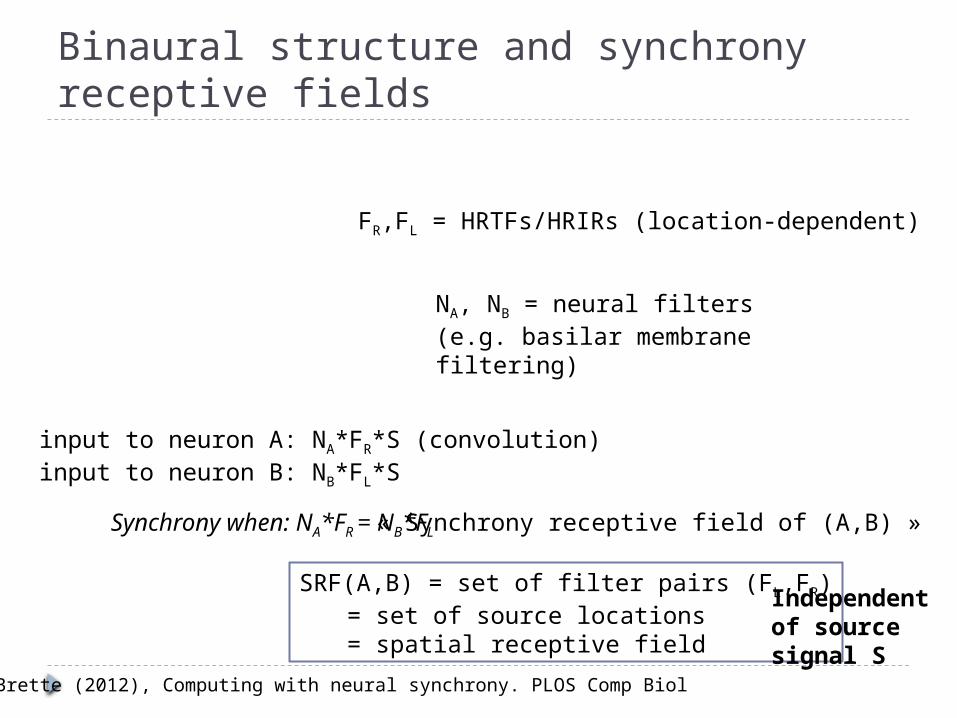
Binaural structure and synchrony receptive fields
FR,FL = HRTFs/HRIRs (location-dependent)
NA, NB = neural filters(e.g. basilar membrane filtering)
input to neuron A: NA*FR*S (convolution)input to neuron B: NB*FL*S
Synchrony when: NA*FR = NB*FL
SRF(A,B) = set of filter pairs (FL,FR)= set of source locations= spatial receptive field
Independent of source signal S
« Synchrony receptive field of (A,B) »
Brette (2012), Computing with neural synchrony. PLOS Comp Biol
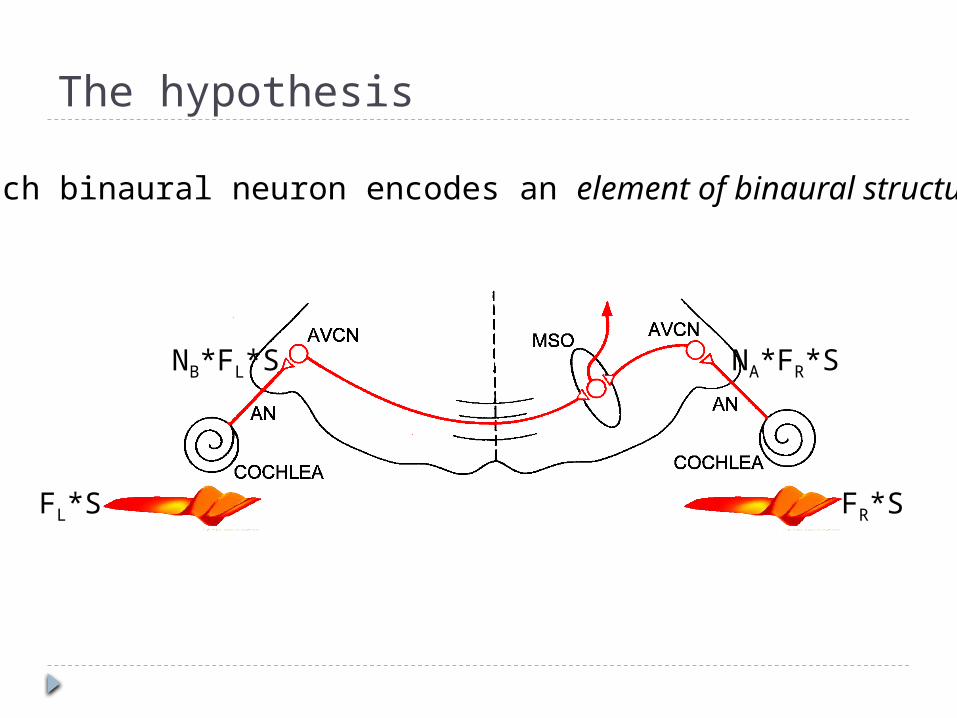
The hypothesis
FR*SFL*S
NA*FR*SNB*FL*S
Each binaural neuron encodes an element of binaural structure
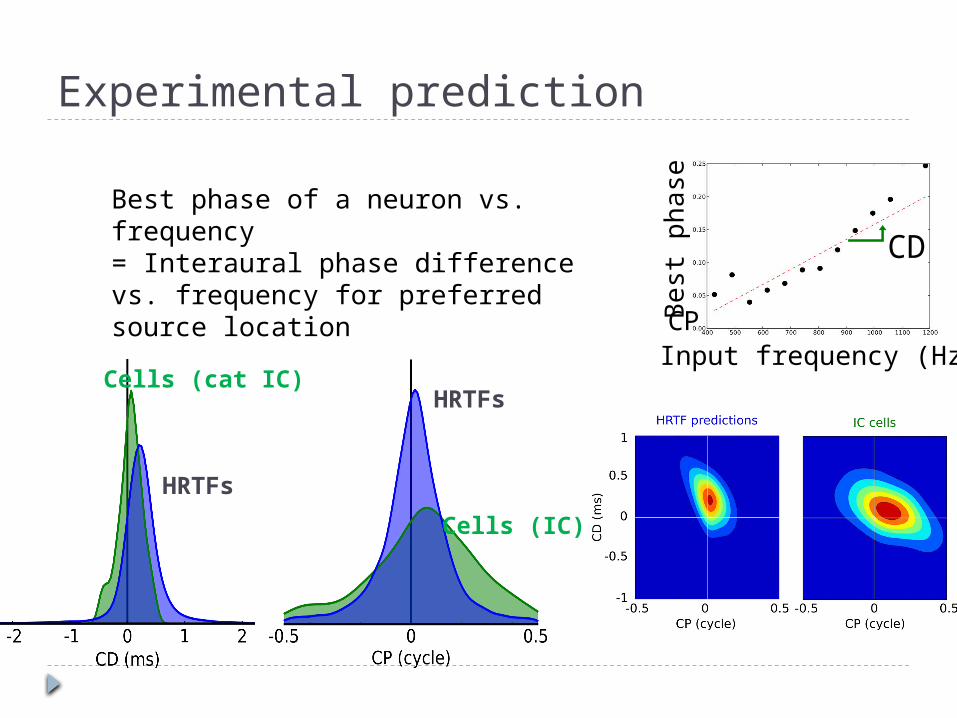
Experimental prediction
Cells (cat IC)
HRTFs
Cells (IC)
HRTFs
Best phase of a neuron vs. frequency= Interaural phase difference vs. frequency for preferred source location
PUT A CELLCP
CD
Best
ph
ase
Input frequency (Hz)
Dendrites and coincidence detection
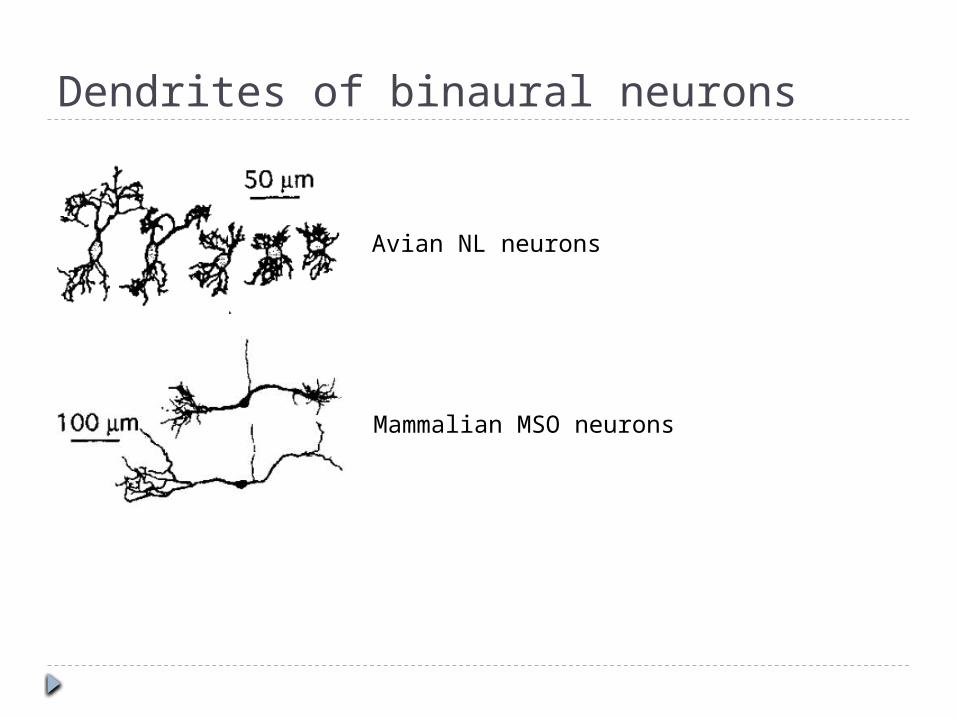
Dendrites of binaural neurons
Mammalian MSO neurons
Avian NL neurons
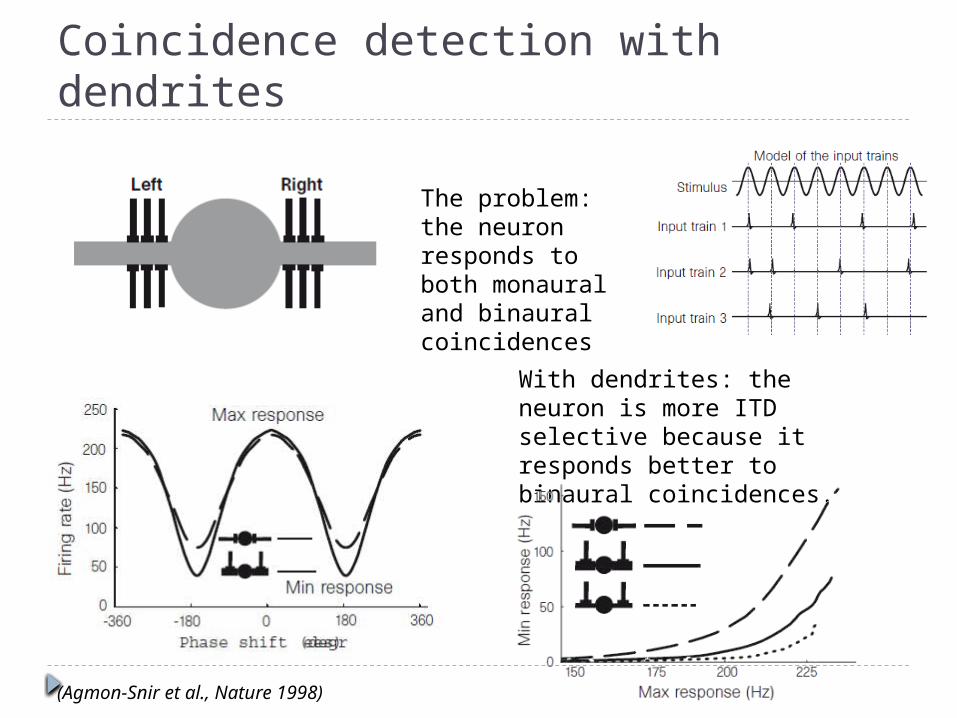
Coincidence detection with dendrites
The problem: the neuron responds to both monaural and binaural coincidences
With dendrites: the neuron is more ITD selective because it responds better to binaural coincidences.
(Agmon-Snir et al., Nature 1998)
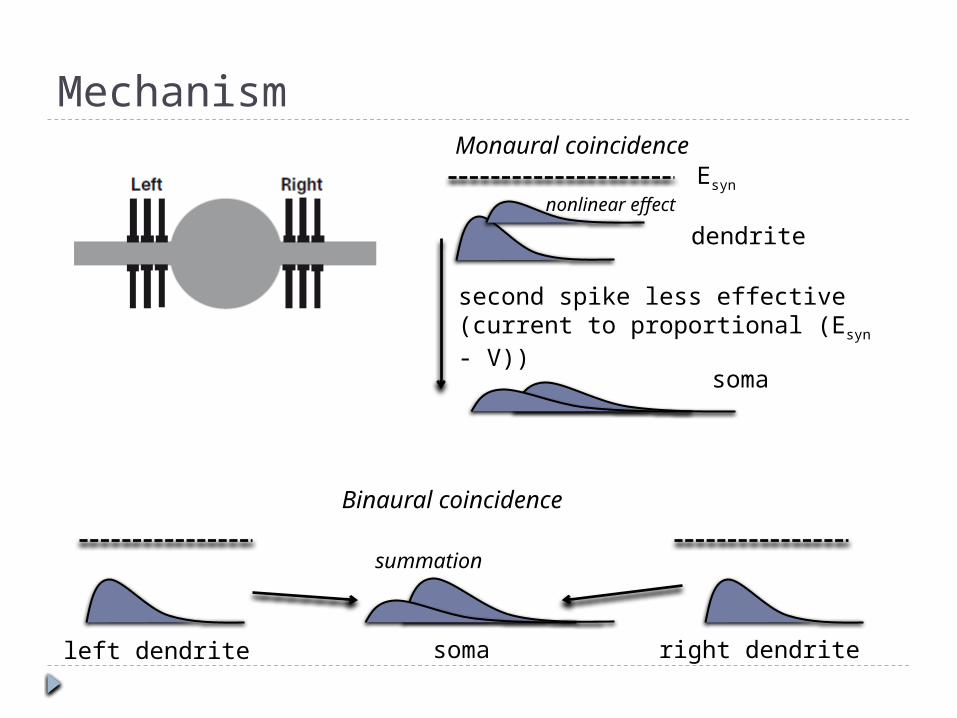
Mechanism
Esyn
second spike less effective (current to proportional (Esyn - V))
dendrite
soma
left dendrite right dendrite
Monaural coincidence
Binaural coincidence
soma
summation
nonlinear effect
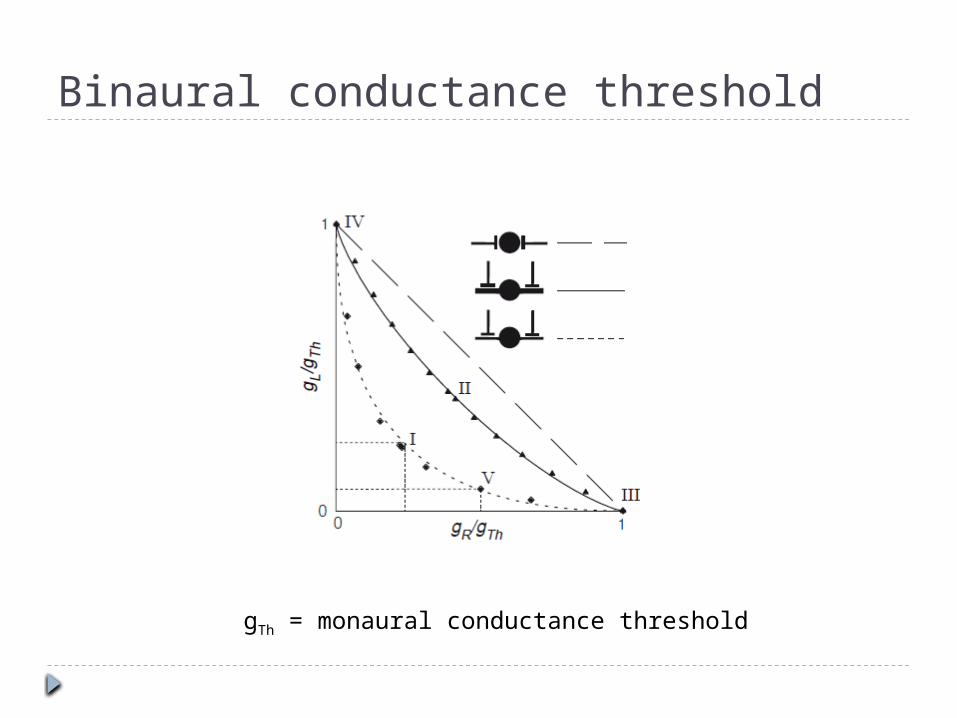
Binaural conductance threshold
gTh = monaural conductance threshold
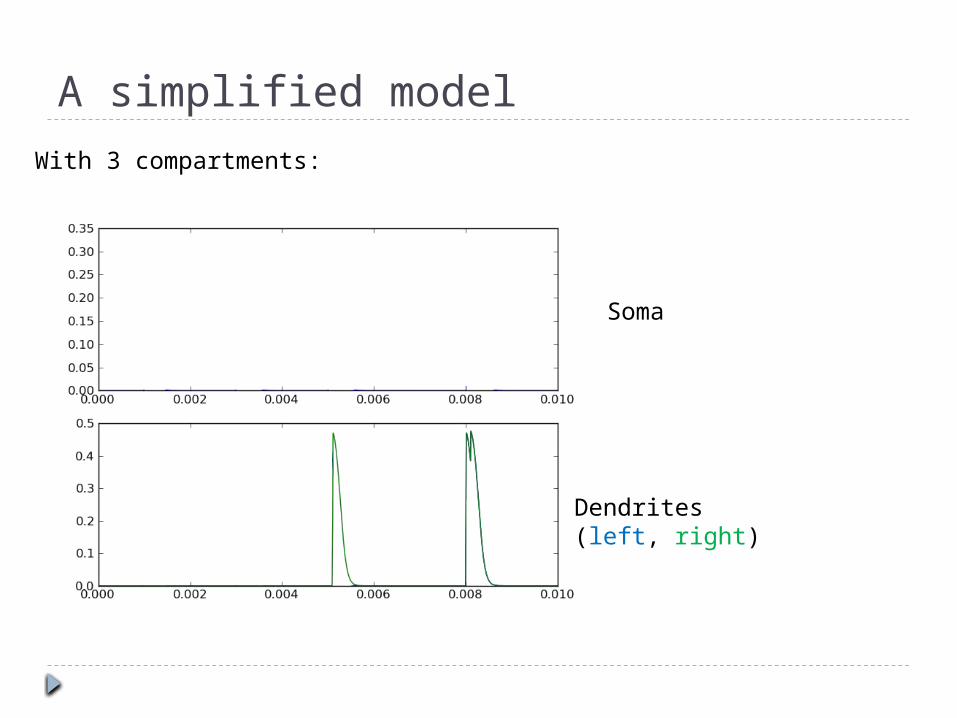
A simplified model
With 3 compartments:
Soma
Dendrites(left, right)