Embed Size (px)
Citation preview
THE AUDITORY AND VISUAL SEQUENCING
OF GOOD AND POOR SPELLERS
by
ROSEANNA CURREY DAVIDSON, B.S. in Ed,
A THESIS
IN
SPEECH PATHOLOGY AND AUDIOLOGY
Submitted to the Graduate Faculty of Texas Tech University in
Partial Fulfillment of the Requirements for
MASTER OF SCIENCE IN
SPEECH PATHOLOGY AND AUDIOLOGY
Approved ^
December, 1971
re
T6 )97l
Nc,^^ V ^ NV \O
'̂ °p' Z
ACKNOWLEDGMENTS
The author is indebted to those who gave their en
couragement, time and assistance to her throughout the
preparation of this thesis, especially to the following:
William Keith Ickes, Ph.D., Department Chairman and
Director of this thesis, for his kind encouragement and
assistance throughout this experiment.
The principal, teachers and students at Shallowater
Elementary School for their cooperation and participation
in the study.
Neil Eugene Davidson, the author's husband, for his
encouragement and also for designing and building the
electrical equipment for the Experimental Test of Visual
Memory Span.
11
CONTENTS
ACKNOWL EDGME NT S i i
LIST OF TABLES V
PROLOGUE vi
I. INTRODUCTION 1
Review of Related Literature 2
Purpose of This Research 6
II. METHODS AND PROCEDURES 8
Test Instruments Employed 9
Selection of Subjects 12
Testing Procedures 14
III. RESULTS AND DISCUSSION 19
Results 19
Discussion 21
IV. SUMMARY AND CONCLUSIONS 24
Procedure 24
Results 25
Conclusions 26
BIBLIOGRAPHY 27
APPENDIX 30
A. MILLER TEST OF AUDITORY MEMORY SPAN FOR TONAL SEQUENCES 31
B. ITPA SOUND BLENDING SUBTEST 32
C. TEST OF VISUAL MEMORY 33
iii
D. ITPA VISUAL-MOTOR SEQUENCING SUBTEST 34
E. SLINGERLAND TEST #5 35
F. ADJUSTED STANDARD SCORES FOR THREE SUBJECT GROUPS ON ALL TESTS 35
IV
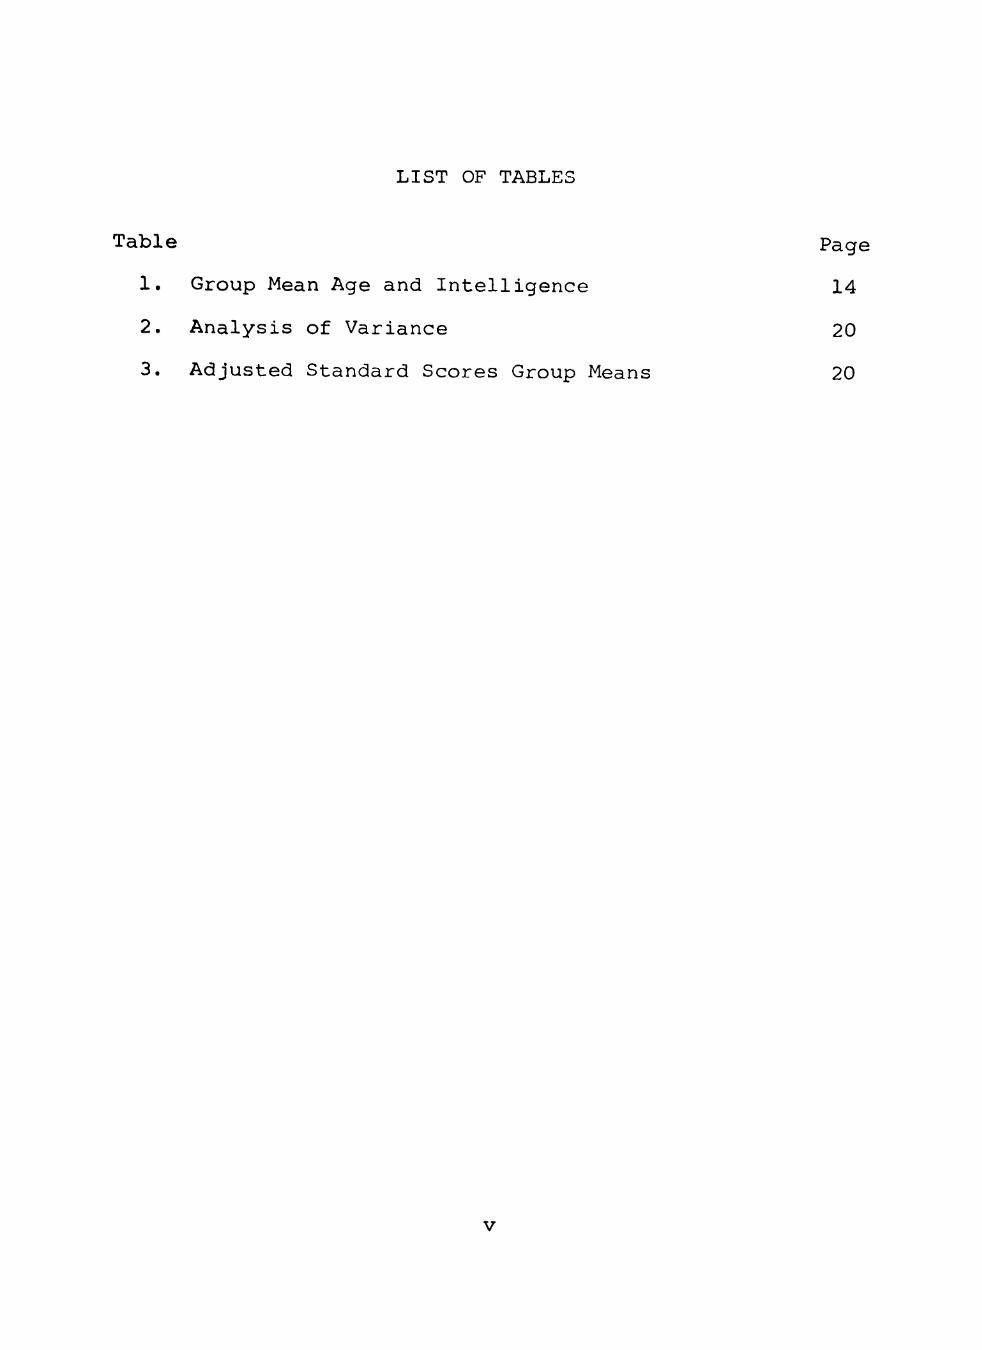
LIST OF TABLES
Table Page
1. Group Mean Age and Intelligence 14
2. Analysis of Variance 20
3. Adjusted Standard Scores Group Means 20
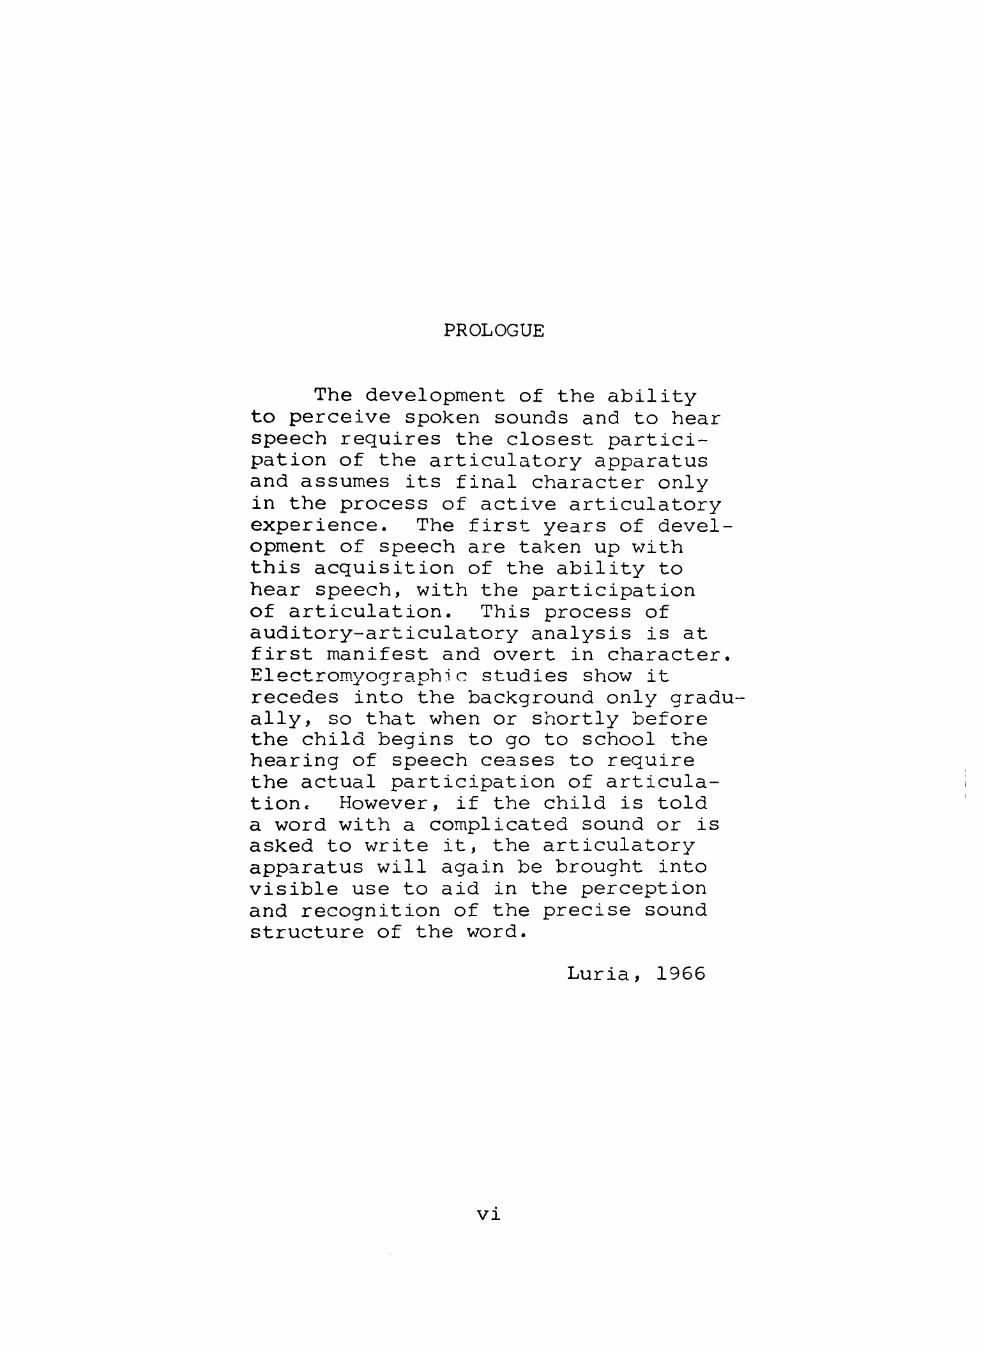
PROLOGUE
The development of the ability to perceive spoken sounds and to hear speech requires the closest participation of the articulatory apparatus and assumes its final character only in the process of active articulatory experience. The first years of development of speech are taken up with this acquisition of the ability to hear speech, with the participation of articulation. This process of auditory-articulatory analysis is at first manifest and overt in character. Electromyographic studies show it recedes into the background only gradually, so that when or shortly before the child begins to go to school the hearing of speech ceases to require the actual participation of articulation. However, if the child is told a word with a complicated sound or is asked to write it, the articulatory apparatus will again be brought into visible use to aid in the perception and recognition of the precise sound structure of the word.
Luria, 1966
VI
CHAPTER I
INTRODUCTION
The subject of spelling became of interest to the
author while studying communication disorders in children
as a graduate student at Texas Tech University. Specific
ally, the statement that "few investigators have published
significant findings related to the subject of spelling"
(Bangs, 1968) caused the writer to investigate the litera
ture about spelling. It was observed that even the most
recently published research dealt with seemingly super
ficial problems of spelling, e.g., background music inter
ference and loudness of dictation. In fact, spelling was
most often mentioned in articles reporting reading research,
The general inference was that any deficiency causing a
reading disorder would also cause a spelling disorder.
The author was familiar with the research conducted
by Patricia Miller (1969) regarding auditory sequencing in
remedial readers. Miller concluded that children receiving
training in remedial reading were less able to sequence
auditorily than a control group.
Sequencing sounds and letters appropriately is a
basic part of spelling (Bangs, 1968). The author was
interested in comparing Miller's research with remedial
readers to poor spellers.
Review of Related Literature
In order to understand the purpose of this study, a
review of the literature concerning auditory and visual
sequencing and its relation to the specific written
language task of spelling is necessary.
Auditory Temporal Order
Hirsch (1959) points out that in the perception of
speech, cases are found in which sounds must not only be
discriminated from one another, but must also be judged
with respect to order. For example, the words "mitts" and
"mist" are distinguished primarily on the basis of the
order in which the last two sounds occur. The two speech
sounds /s/ and /t/ have approximately the sam.e tongue
position and are distinguished on the basis of duration.
In distinguishing between the two words, the listener
must not only be able to discriminate the two speech
sounds themselves, but must be able to perceive their
order of occurrence.
McGinnis (1963) reported that aphasic adults can
understand speech better when it is delivered at a slow
rate. Johnson and Myklebust (1967) observed that dictating
spelling words slowly helps students spell more accurately.
Seemingly, these two populations, aphasics and spellers,
are affected positively by a reduction in the rate of
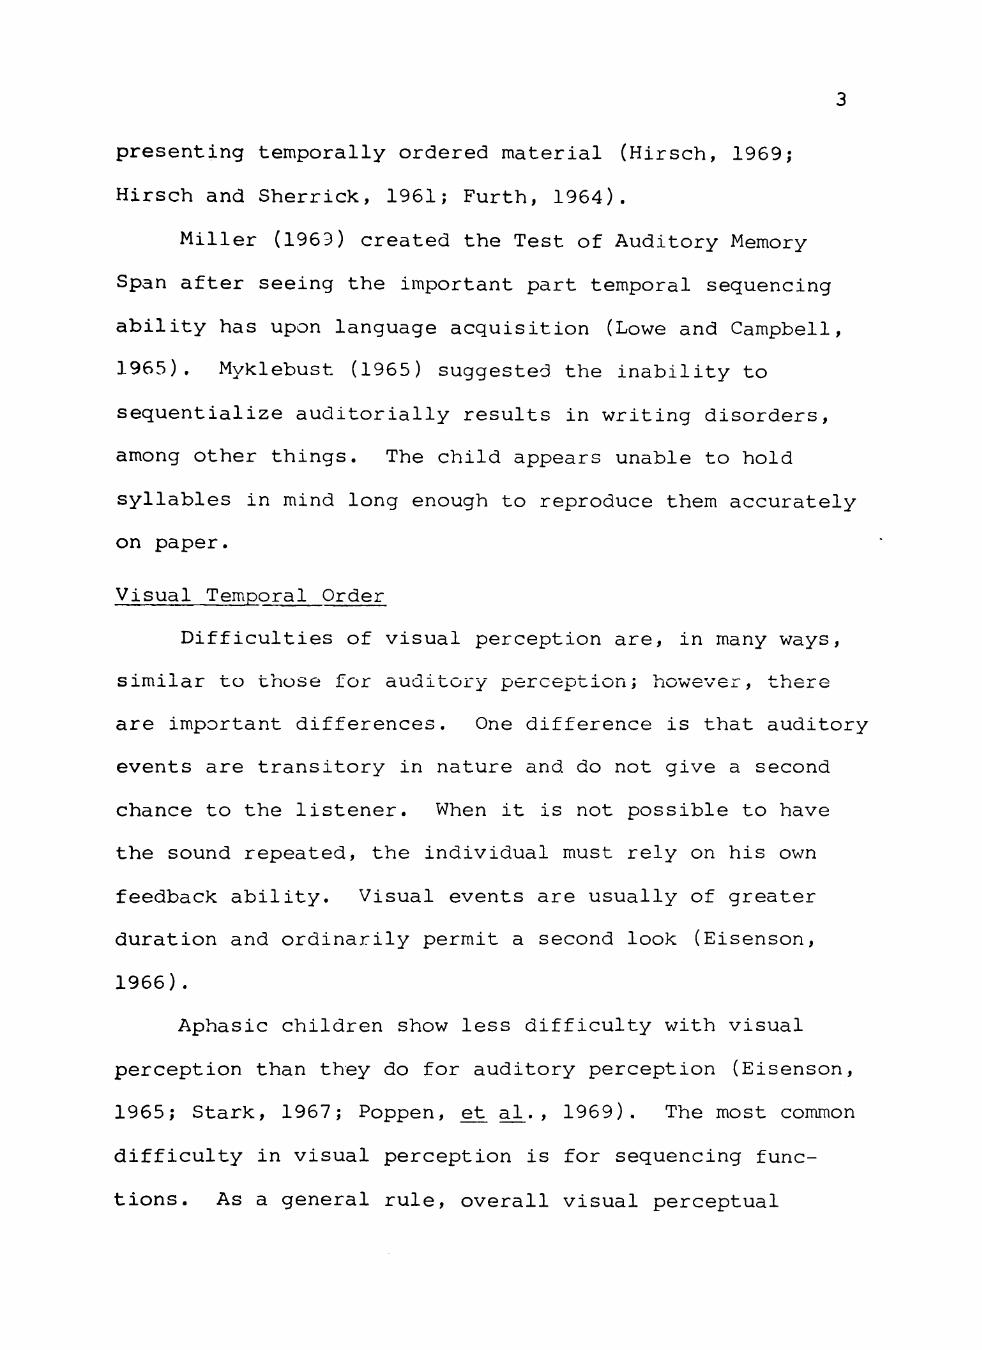
presenting temporally ordered material (Hirsch, 1969;
Hirsch and Sherrick, 1961; Furth, 1964).
Miller (1969) created the Test of Auditory Memory
Span after seeing the important part temporal sequencing
ability has upon language acquisition (Lowe and Campbell,
1965). Myklebust (1965) suggested the inability to
sequentialize auditorially results in writing disorders,
among other things. The child appears unable to hold
syllables in mind long enough to reproduce them accurately
on paper.
Visual Temporal Order
Difficulties of visual perception are, in many ways,
similar to those for auditory perception; however, there
are important differences. One difference is that auditory
events are transitory in nature and do not give a second
chance to the listener. When it is not possible to have
the sound repeated, the individual must rely on his own
feedback ability. Visual events are usually of greater
duration and ordinarily permit a second look (Eisenson,
1966) .
Aphasic children show less difficulty with visual
perception than they do for auditory perception (Eisenson,
1965; Stark, 1967; Poppen, ^t^ aJL̂. , 1969). The most common
difficulty in visual perception is for sequencing func
tions. As a general rule, overall visual perceptual
functioning is positively correlated with overall general
intellectual ability.
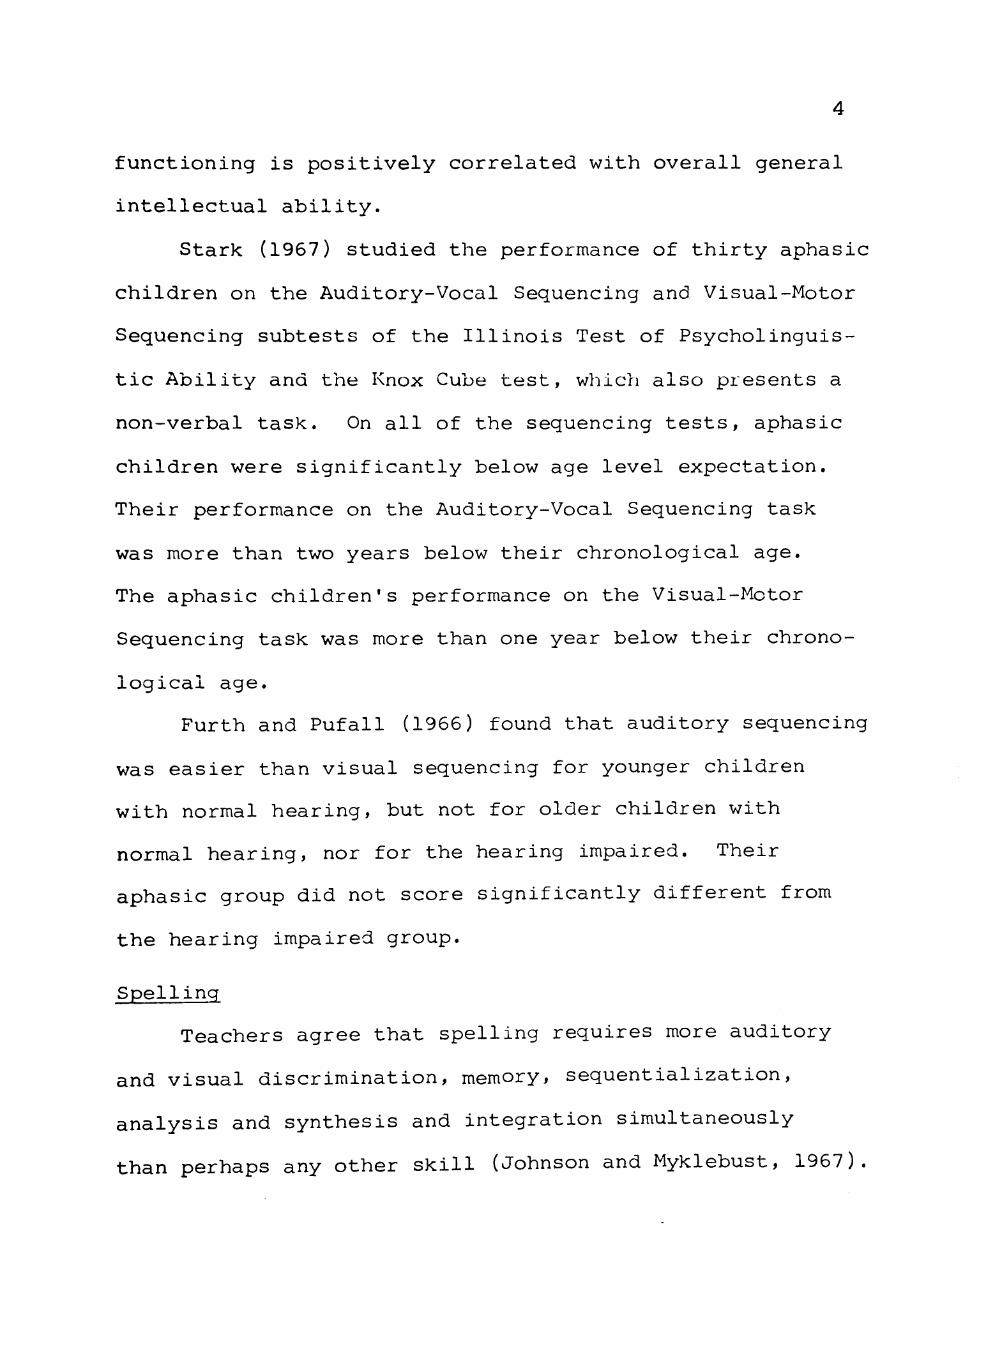
Stark (1967) studied the performance of thirty aphasic
children on the Auditory-Vocal Sequencing and Visual-Motor
Sequencing subtests of the Illinois Test of Psycholinguis-
tic Ability and the Knox Cube test, which also presents a
non-verbal task. On all of the sequencing tests, aphasic
children were significantly below age level expectation.
Their performance on the Auditory-Vocal Sequencing task
was more than two years below their chronological age.
The aphasic children's performance on the Visual-Motor
Sequencing task was more than one year below their chrono
logical age.
Furth and Pufall (1966) found that auditory sequencing
was easier than visual sequencing for younger children
with normal hearing, but not for older children with
normal hearing, nor for the hearing impaired. Their
aphasic group did not score significantly different from
the hearing impaired group.
Spelling
Teachers agree that spelling requires more auditory
and visual discrimination, memory, sequentialization,
analysis and synthesis and integration simultaneously
than perhaps any other skill (Johnson and Myklebust, 1967).
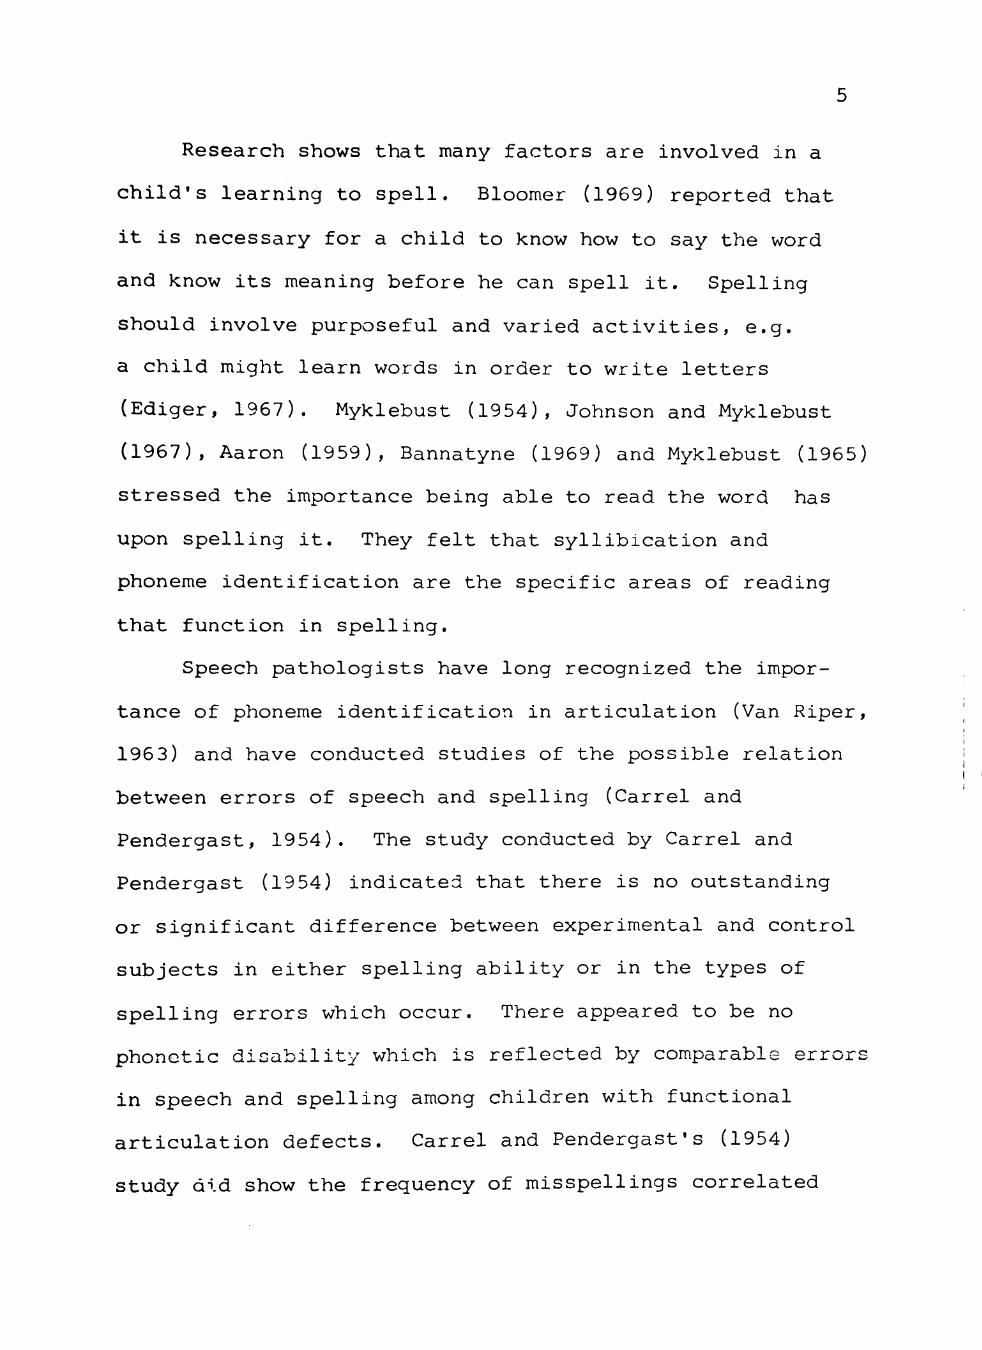
Research shows that many factors are involved in a
child's learning to spell. Bloomer (1969) reported that
it is necessary for a child to know how to say the word
and know its meaning before he can spell it. Spelling
should involve purposeful and varied activities, e.g.
a child might learn words in order to write letters
(Ediger, 1967). Myklebust (1954), Johnson and Myklebust
(1967), Aaron (1959), Bannatyne (1969) and Myklebust (1965)
stressed the importance being able to read the word has
upon spelling it. They felt that syllibication and
phoneme identification are the specific areas of reading
that function in spelling.
Speech pathologists have long recognized the impor
tance of phoneme identification in articulation (Van Riper,
1963) and have conducted studies of the possible relation
between errors of speech and spelling (Carrel and
Pendergast, 1954). The study conducted by Carrel and
Pendergast (1954) indicated that there is no outstanding
or significant difference between experimental and control
subjects in either spelling ability or in the types of
spelling errors which occur. There appeared to be no
phonetic disability which is reflected by comparable errors
in speech and spelling among children with functional
articulation defects. Carrel and Pendergast's (1954)
study did show the frequency of misspellings correlated
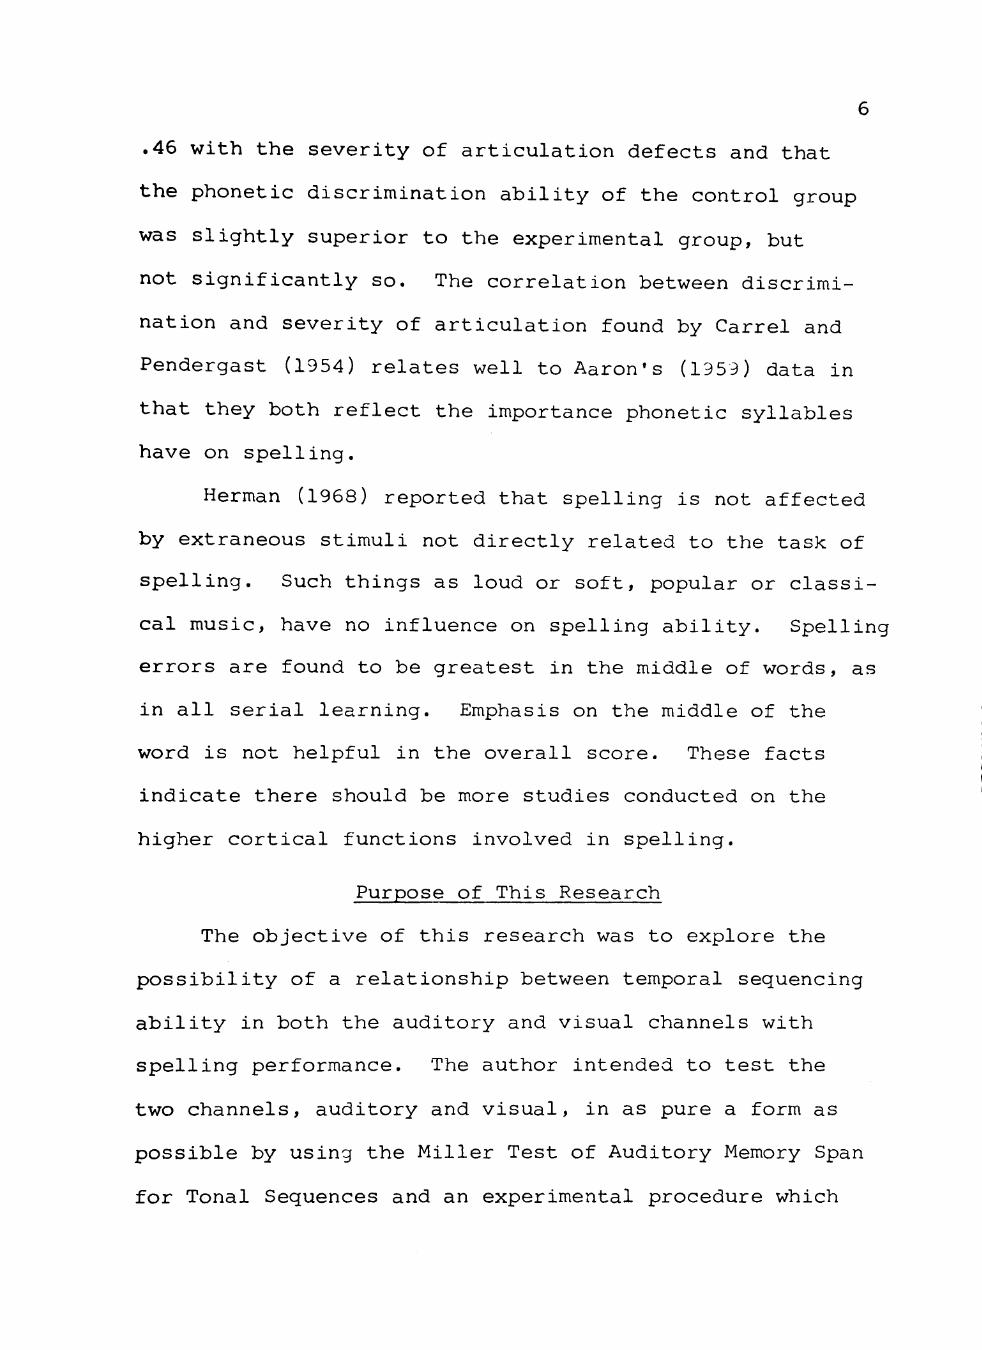
.46 with the severity of articulation defects and that
the phonetic discrimination ability of the control group
was slightly superior to the experimental group, but
not significantly so. The correlation between discrimi
nation and severity of articulation found by Carrel and
Pendergast (1954) relates well to Aaron's (1959) data in
that they both reflect the importance phonetic syllables
have on spelling.
Herman (1968) reported that spelling is not affected
by extraneous stimuli not directly related to the task of
spelling. Such things as loud or soft, popular or classi
cal music, have no influence on spelling ability. Spelling
errors are found to be greatest in the middle of words, as
in all serial learning. Emphasis on the middle of the
word is not helpful in the overall score. These facts
indicate there should be more studies conducted on the
higher cortical functions involved in spelling.
Purpose of This Research
The objective of this research was to explore the
possibility of a relationship between temporal sequencing
ability in both the auditory and visual channels with
spelling performance. The author intended to test the
two channels, auditory and visual, in as pure a form as
possible by using the Miller Test of Auditory Memory Span
for Tonal Sequences and an experimental procedure which
employed flashing lights in a visual memory span task.
The Miller Test of Auditory Memory Span was compared to
the Sound Blending subtest of the Revised Edition of the
Illinois Test of Psycholinguistic Abilities for predictive
value. The experimental test was compared to the Visual-
Motor Sequential subtest of the Experimental Edition of
the Illinois Test of Psycholinguistic Abilities and
Test 5 from Slingerland's Screening Tests for Identifying
Children with Specific Language Disability.
The following null hypotheses were tested.
1. There will be no difference in the performance
of good spellers, poor spellers and minimally
brain injured children on a battery of five
tests designed to measure auditory and visual
sequencing ability.
2. There will be no difference in the ability of
the five tests designed to measure auditory and
visual sequencing ability to differentiate the
three subject groups; children who were good
spellers, children who were poor spellers and
children who were minimally brain injured.
CHAPTER II
METHODS AND PROCEDURES
Myklebust (1965) points out that man's language
systems, auditory and written, develop sequentially
according to a pattern determined phylogenetically and
ontogenetically, neurologically, and psychologically.
He hears the spoken word and he comprehends before he
learns to speak; reception precedes expression, input
precedes output.
This relationship between the auditory and visual
language forms is hierarchical in nature. Meaning, that
to develop normally, the visual or read form is dependent
on the auditory or spoken form and the written form is
dependent on the integrity of both the auditory and the
visual language channels.
Man's total complex of language, consisting of three
forms, spoken, read and written, have a reciprocal affilia
tion with each other which is manifest in the sequential-
ness of the development pattern. By implication, when a
deviation in facility with the written word occurs, it
may be the result of a disturbance in either of the other
two language forms (auditory or read) which normally
precedes it developmentally (Myklebust, 1965).
8
Test Instruments Employed
This study was conducted using five specific tests
of auditory and visual sequencing ability. Two auditory
sequencing tests and three visual sequencing tests were
used.
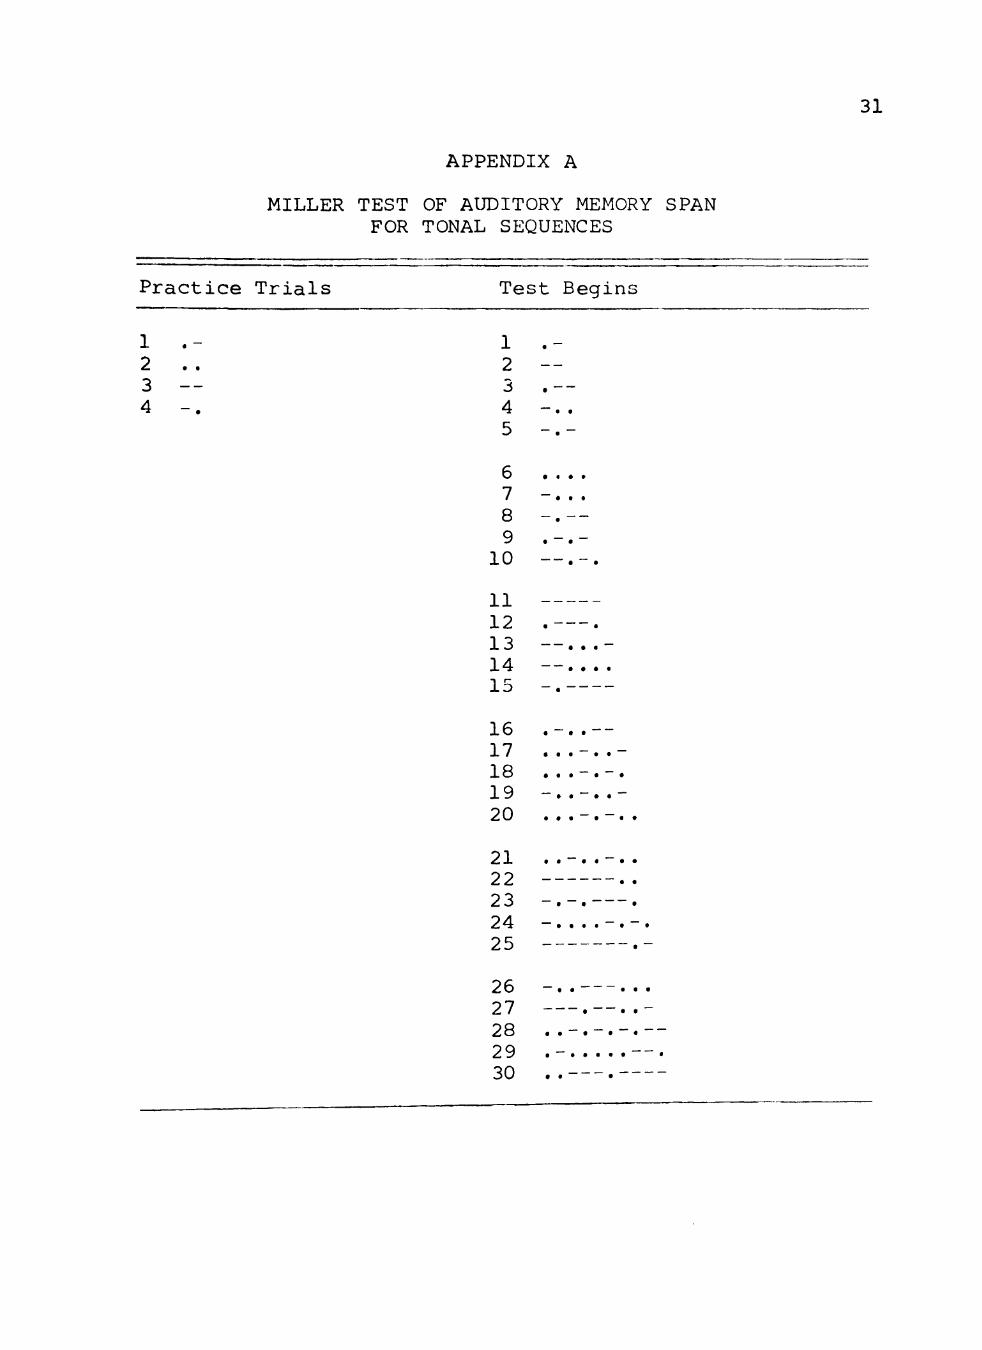
The Experimental Test of Auditory Memory Span for Tonal Sequences
This test of auditory memory span was devised by
Patricia Miller for her Master's thesis in 1969. It
consists of sequences of dots and dashes presented in a
completely random pattern by a Morse Code key. Appendix ^
shows the sequences of dots and dashes used in the Miller
test. The author of the test reported that the complex
noise of the code key had no conventional meaning and
therefore yielded the greatest possibility of presenting
a purely auditory stimulus which would not evoke a visual
image of the stimuli. The test measured auditory memory
for sequences without visual associations.
The subjects responded by repeating the sequences on
an identical Morse Code key. The keys were blank, giving
no visual symbols for dots and dashes.
This test was designed and chosen because the complex
noise of different durations yielded more valid scores
since (1) the signal was very distinctive; (2) all subjects
were equally familiar with the stimuli; (3) the stimuli
had no correlation with scholastic activities; and (4) the
10
subjects could not retain the stimuli by simply counting
(Miller, 1969).
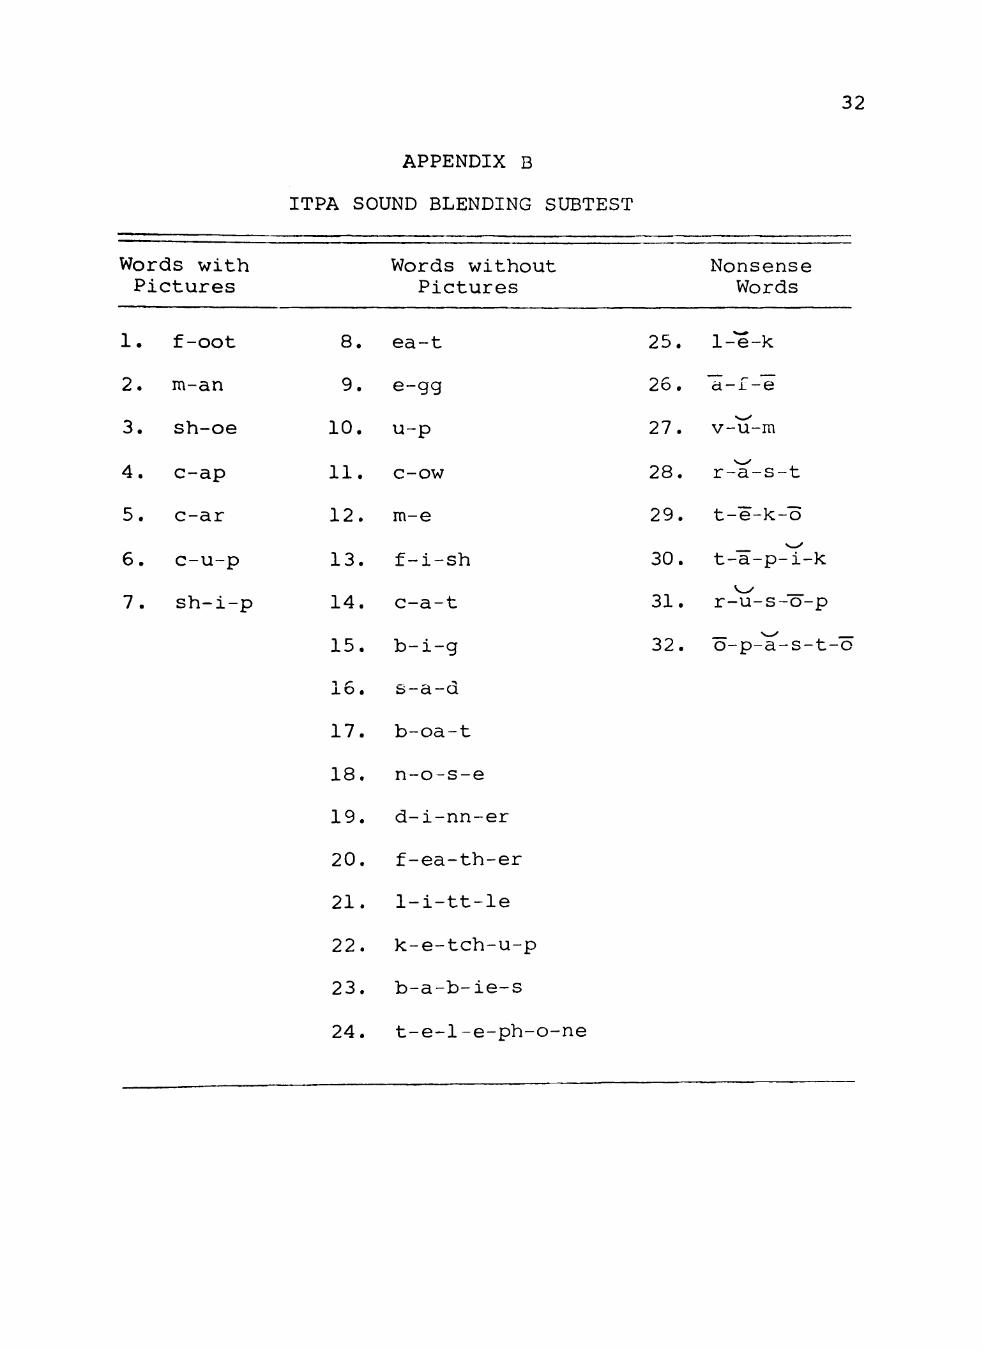
The Illinois Test of Psycholinguistic Abilities; Sound Blending Subtest
Successive sounds of words or nonsense words were
presented at the rate of two per second with a distinct
break between the sounds. The words used in this test
are listed in Appendix B. The points of sound distinction
are also noted. The subjects were asked to verbalize the
whole word or nonsense word. This is a supplem^entary test
to the Revised Illinois Test of Psycholinguistic Abilities
and is a means of assessing the organizing process at the
automatic level in the auditory-vocal channel. This
subtest was chosen to check the possibility of a relation
between it and the Miller Test. Both reflect ability to
sequence auditory stimuli temporally.
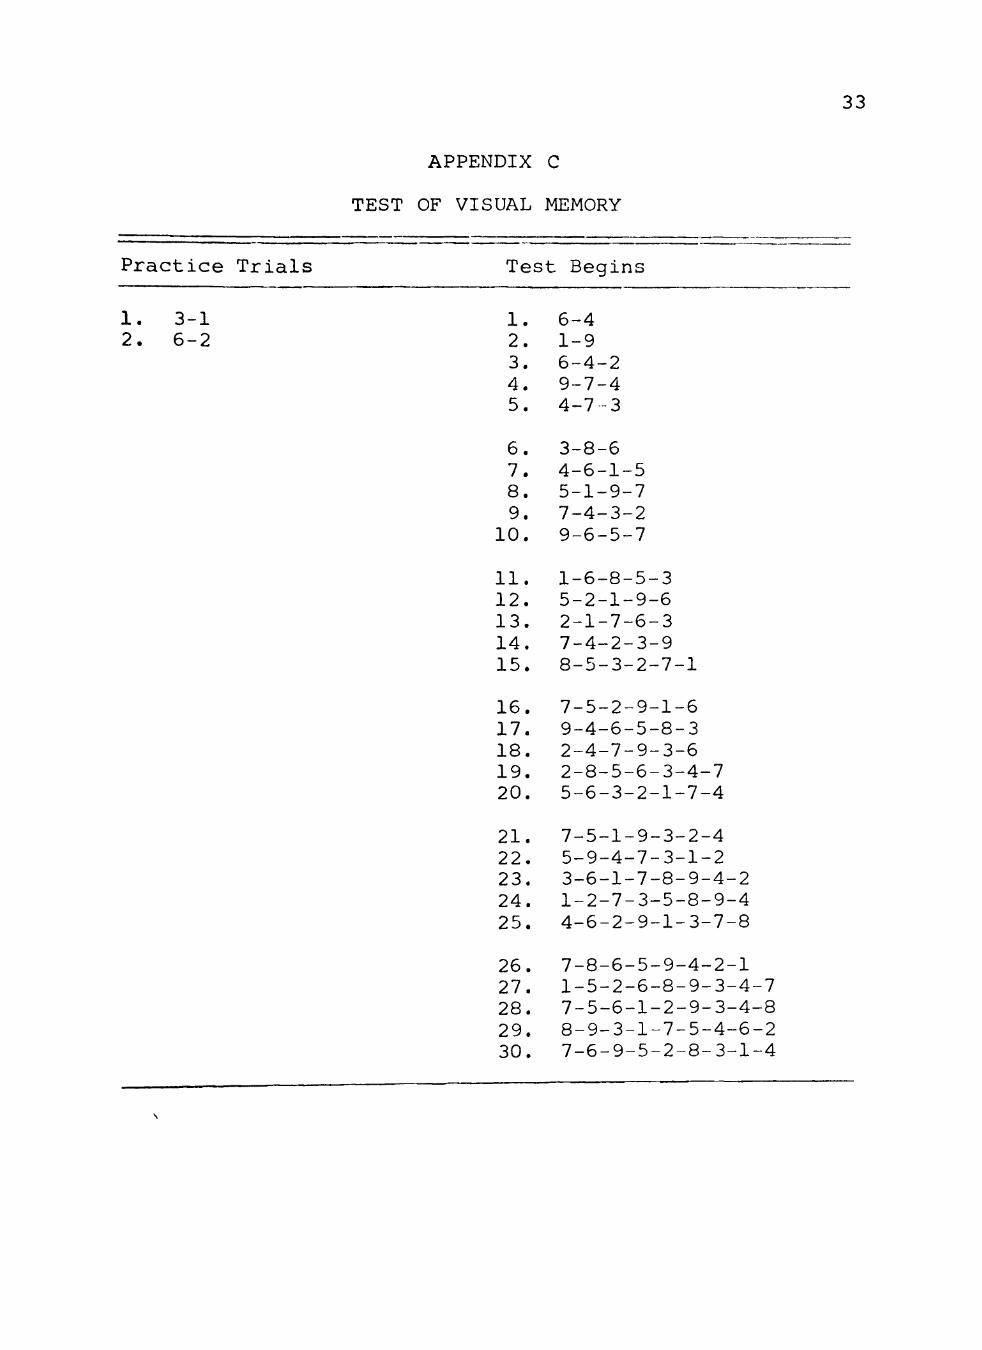
The Experimental Test of Visual Memory Span
Random sequences of flashing white lights were pre
sented by nine recessed light bulbs covered with plastic
bubbles. The lights were mounted on a metal chassis
painted black and were controlled by two-way switches.
The examiner's set of controls were nine push buttons
obscured from the subject's vision by a curved shield.
The subject's controls were nine toggle switches mounted
directly in front of the corresponding light. The
11
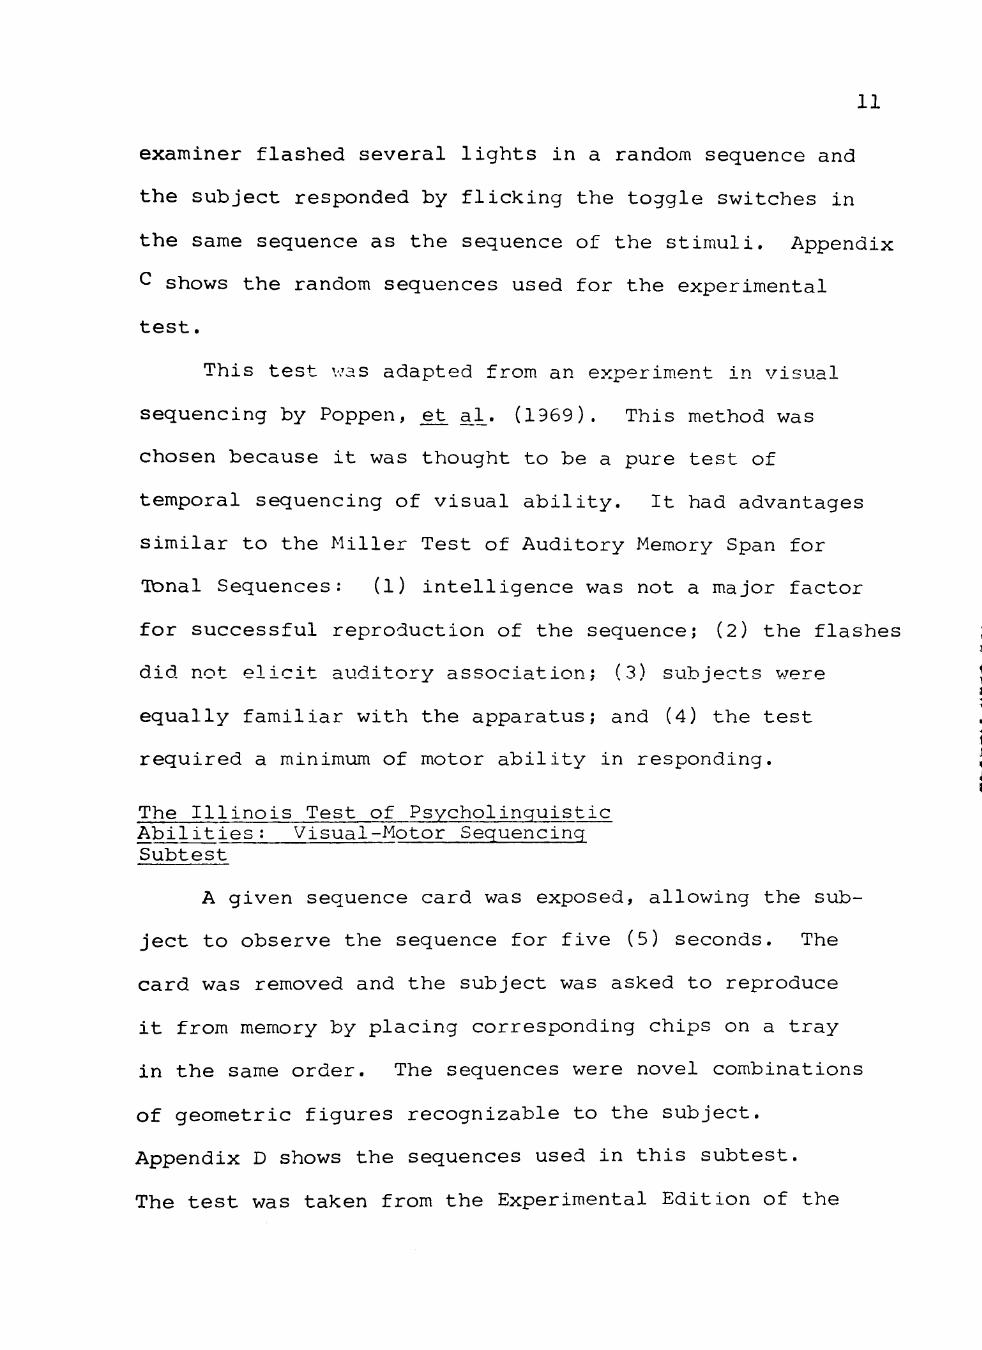
examiner flashed several lights in a random sequence and
the subject responded by flicking the toggle switches in
the same sequence as the sequence of the stimuli. Appendix
C shows the random sequences used for the experimental
test.
This test v/as adapted from an experiment in visual
sequencing by Poppen, _et, a_]̂ . (1969). This method was
chosen because it was thought to be a pure test of
temporal sequencing of visual ability. It had advantages
similar to the Miller Test of Auditory Memory Span for
Tonal Sequences: (1) intelligence was not a major factor
for successful reproduction of the sequence; (2) the flashes
did not elicit auditory association; (3) subjects were
equally familiar with the apparatus; and (4) the test
required a minimum of motor ability in responding.
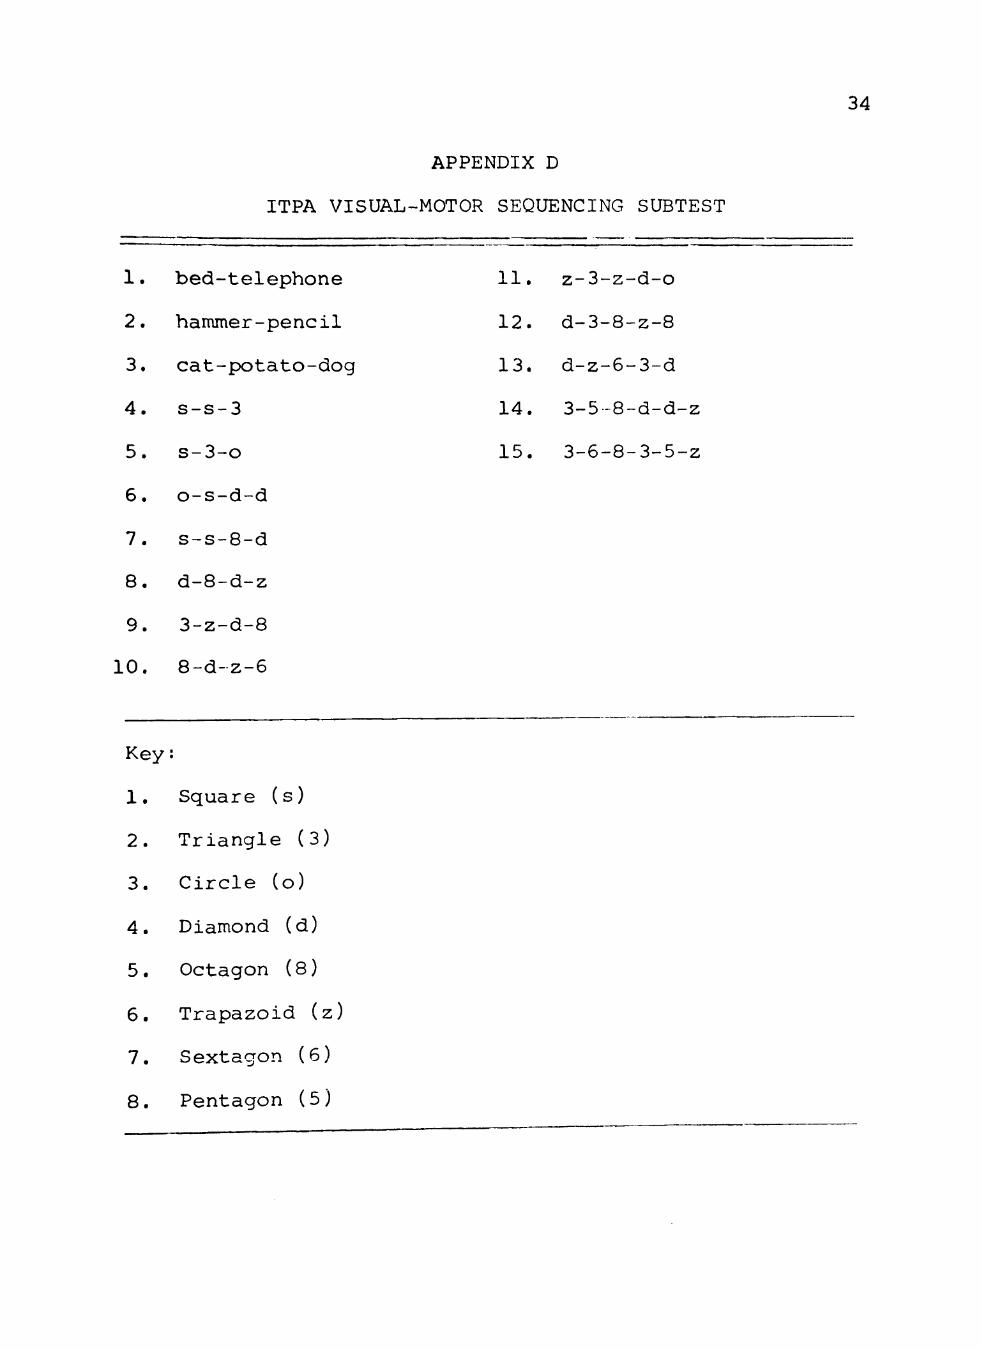
The Illinois Test of Psyeholinquistic Abilities; Visual-Motor Sequencing Subtest
A given sequence card was exposed, allowing the sub
ject to observe the sequence for five (5) seconds. The
card was removed and the subject was asked to reproduce
it from memory by placing corresponding chips on a tray
in the same order. The sequences were novel combinations
of geometric figures recognizable to the subject.
Appendix D shows the sequences used in this subtest.
The test was taken from the Experimental Edition of the
12
Illinois Test of Psycholinguistic Abilities (1961).
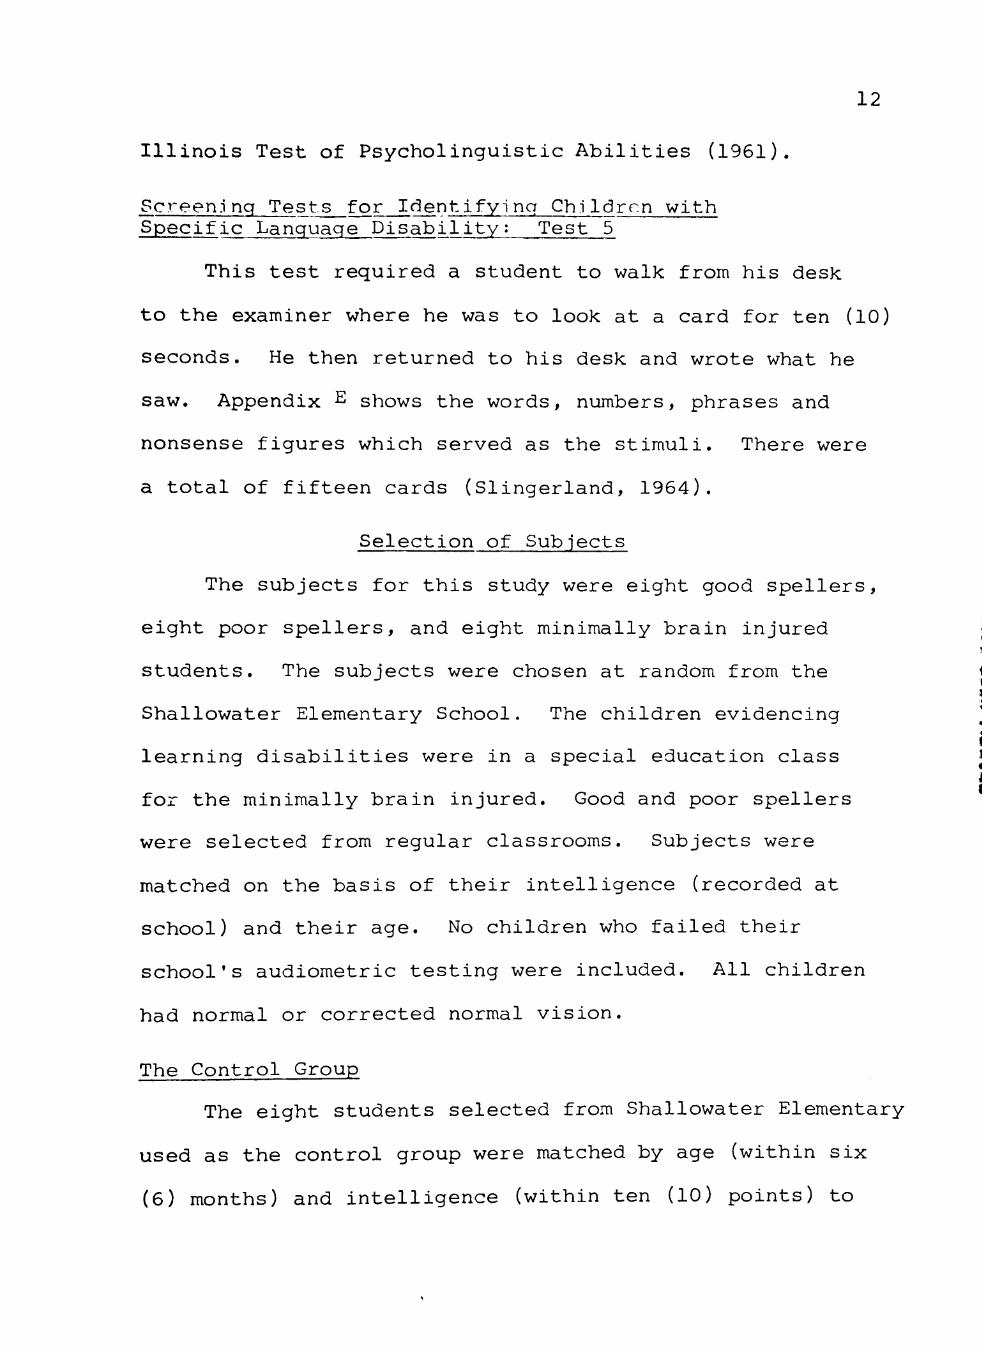
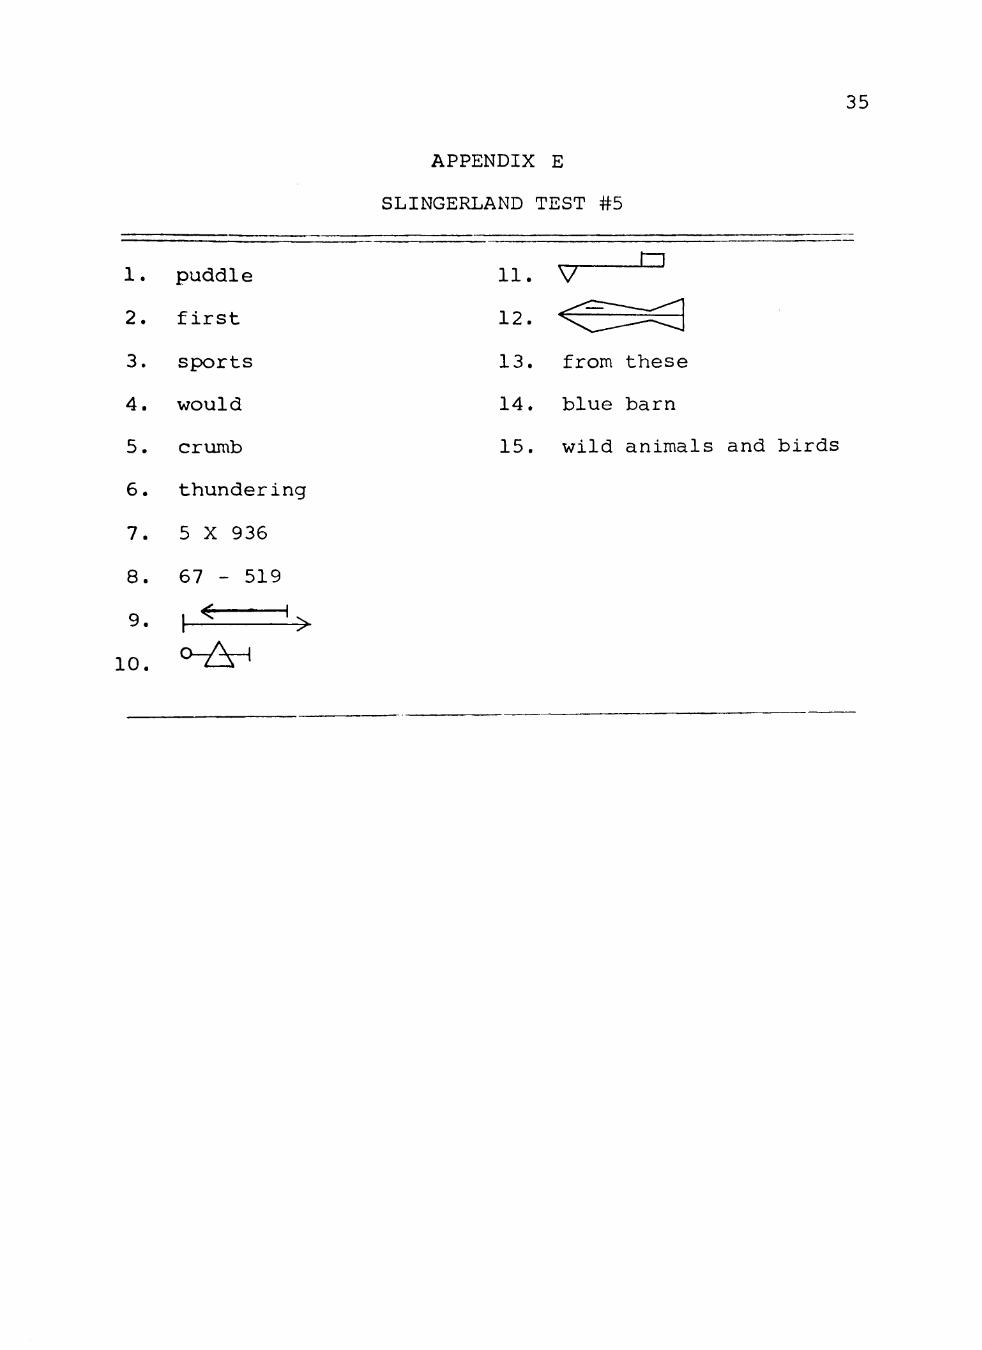
Screening Tests for Identifying Childrrn with Specific Language Disability; Test 5
This test required a student to walk from his desk
to the examiner where he was to look at a card for ten (10)
seconds. He then returned to his desk and wrote what he
saw. Appendix ^ shows the words, numbers, phrases and
nonsense figures which served as the stimuli. There were
a total of fifteen cards (Slingerland, 1964).
Selection of Subjects
The subjects for this study were eight good spellers,
eight poor spellers, and eight minimally brain injured
students. The subjects were chosen at random from the
Shallowater Elementary School. The children evidencing
learning disabilities were in a special education class
for the minimally brain injured. Good and poor spellers
were selected from regular classrooms. Subjects were
matched on the basis of their intelligence (recorded at
school) and their age. No children who failed their
school's audiometric testing were included. All children
had normal or corrected normal vision.
The Control Group
The eight students selected from Shallowater Elementary
used as the control group were matched by age (within six
(6) months) and intelligence (within ten (10) points) to
13
students in the two experimental groups. Children who
had any speech, language or hearing deficits were not
included, nor were students who had repeated a grade.
Minimally Brain Injured Group
Eight students from Shallowater Elementary School
who were enrolled in the class for minimally brain
injured children were used in this group. The special
class was organized along the guidelines set out in a
bulletin from the Texas Education Agency (1968). The
children were enrolled in the class after having met the
following requirements.
Prior to a child's admission to a class for the minimally brain injured, a thorough review of collected data is made by the local placement committee, composed of professional personnel from the disciplines of education, psychology, and medicine who are familiar with the specific objectives of the program.
Records used to determine the eligibility of every child must include the following:
A written comprehensive psychological report signed by the examiner, which indicates that the child is of normal intelligence or above and has potential to achieve academically.
A written report of a neurological examination (evaluation) signed by the examiner, which describes the extent of the brain injury.
Anecdotal records of the child's school history including grade placement and academic achievement for children of school age.
Each child in the program must be at least six years of age, but not more than twenty-one on September 1 of the year enrolled. His parents or guardian must
14
give written approval for his admission to the special program.
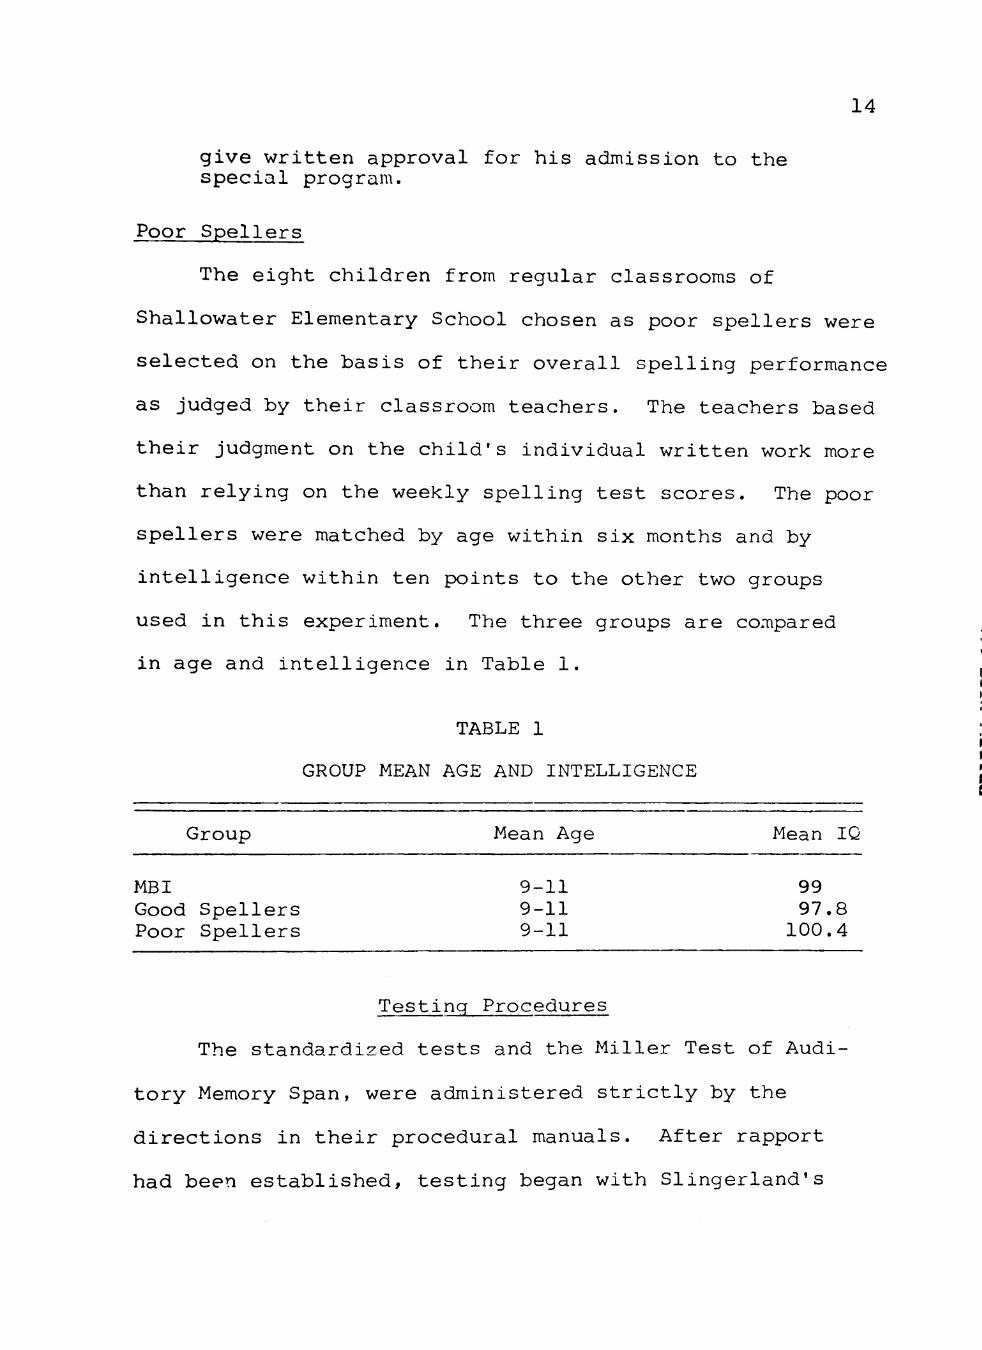
Poor Spellers
The eight children from regular classrooms of
Shallowater Elementary School chosen as poor spellers were
selected on the basis of their overall spelling performance
as judged by their classroom teachers. The teachers based
their judgment on the child's individual written work more
than relying on the weekly spelling test scores. The poor
spellers were matched by age within six months and by
intelligence within ten points to the other two groups
used in this experiment. The three groups are compared
in age and intelligence in Table 1.
TABLE 1
GROUP MEAN AGE AND INTELLIGENCE
Group Mean Age Mean IQ
MBI 9-11 99 Good Spellers 9-11 97.8 Poor Spellers 9-11 100.4
Testing Procedures
The standardized tests and the Miller Test of Audi
tory Memory Span, were administered strictly by the
directions in their procedural manuals. After rapport
had been established, testing began with Slingerland's
15
Test 5 (the visual memory subtest), followed by the
I.T.P.A. Sound Blending Subtest, I.T.P.A. Visual Motor
Sequencing Subtest, Miller's Test of Auditory Memory Span
and the Experimental Test of Visual Memory Span. A short
break was observed after the third test to reduce fatigue.
Testing was accomplished in a quiet room provided by the
school. Average testing time was about sixty minutes.
A simple system of rotation was used for the administration
of the tests to eliminate the possibility that the testing
sequence might effect scores significantly.
The Slingerland Test 5 required the examiner to stand
ten feet away from the subject. The student was to walk
to the examiner and look at a stimulus card for ten
seconds (as timed by a stopwatch). He then returned to
the desk and reproduced from memory, on lined paper, what
he saw. This procedure was carried out for a total of
fifteen cards.
The I.T.P.A. Sound Blending Subtest was conducted
orally by presenting successive sounds of words or
nonsense words at the rate of two per second. The child
responded by verbalizing the word or nonsense word. No
repetitions of the test items were allowed.
The I.T.P.A. Visual Motor Sequencing Subtest allowed
two trials to correctly reproduce the sequence card by
placing corresponding chips on a tray in the same order.
16
Two points were given for correct reproductions on the
first trial and one point for correct reproductions on
the second trial. The subject was allowed to see the
card for five seconds as timed by a stopwatch.
The Miller Test of Auditory Memory Span was conducted
with a code key behind a small screen. The stim.uli was
presented at the rate of two per second. The sequences
were repeated if the subject failed the original presenta
tion. Two points were received for correct reproductions
on the first trial and one point was received for correct
reproductions on the second trial.
The Experimental Test of Visual Memory Span allowed
two practice trials which were repeated as m̂ any timtcs as
necessary for the child to fully understand what he was
to do. The stimuli was presented at the rate of one per
second. Lights flashed in a randomly assigned order and
there was only one light illuminated at any given time.
The child flashed the lights in the order in which he
saw them. A total of thirty sequences were presented to
the child. No light flashed more than once in any given
sequence of flashes.
Instructions were given as follows;
Watch the lights. I am going to turn the lights on and you look carefully so that you can turn the very same lights on with your switches. As long as I am flashing lights you watch carefully. When I finish, I will say "now" and then you will
17
turn the lights on in the same order as I did. Leave your lights on.
These are practice trials. Are you ready? First this one (3) and then this one (1). Now. (After practice trials). Now we will begin. Ready? (No verbal prefacing to the lights was used during the test, only in practice trials).
Scoring
All tests were scored according to their standardi
zation procedures. On the I.T.P.A. Visual-Motor Sequenc
ing Subtest, the Miller Auditory Memory Span test and
the Experimental Test of Visual Memory Span, the subject
was given two points for each correct response on the
first trial and one point for a correct response on the
second trial. On the I.T.P.A. Sound Blending Subtest, the
subject received one point for each item correctly ver
balized plus one point for each item below the basal.
The score was the total number of points received. The
Slingerland Test 5 did not allow for two trials and the
subject was given one point for each correct reproduction
on the first trial. The raw scores were transposed into
standard scores and adjusted by a factor of ten to prepare
the data for statistical analysis (Hicks, 1964).
Statistical Procedures
The data v/as analyzed using an analysis of variance
of a randomized complete block design (Ferguson, 1966).
This design was a two factor experiment, possessing a
18
treatment effect, a level effect and an interaction of
treatment and block. The model assumed that the subjects
were tested in a random manner (Hicks, 1966). A confi
dence level of .05 was used to determine the significance
of the data.
CHAPTER III
RESULTS AND DISCUSSION
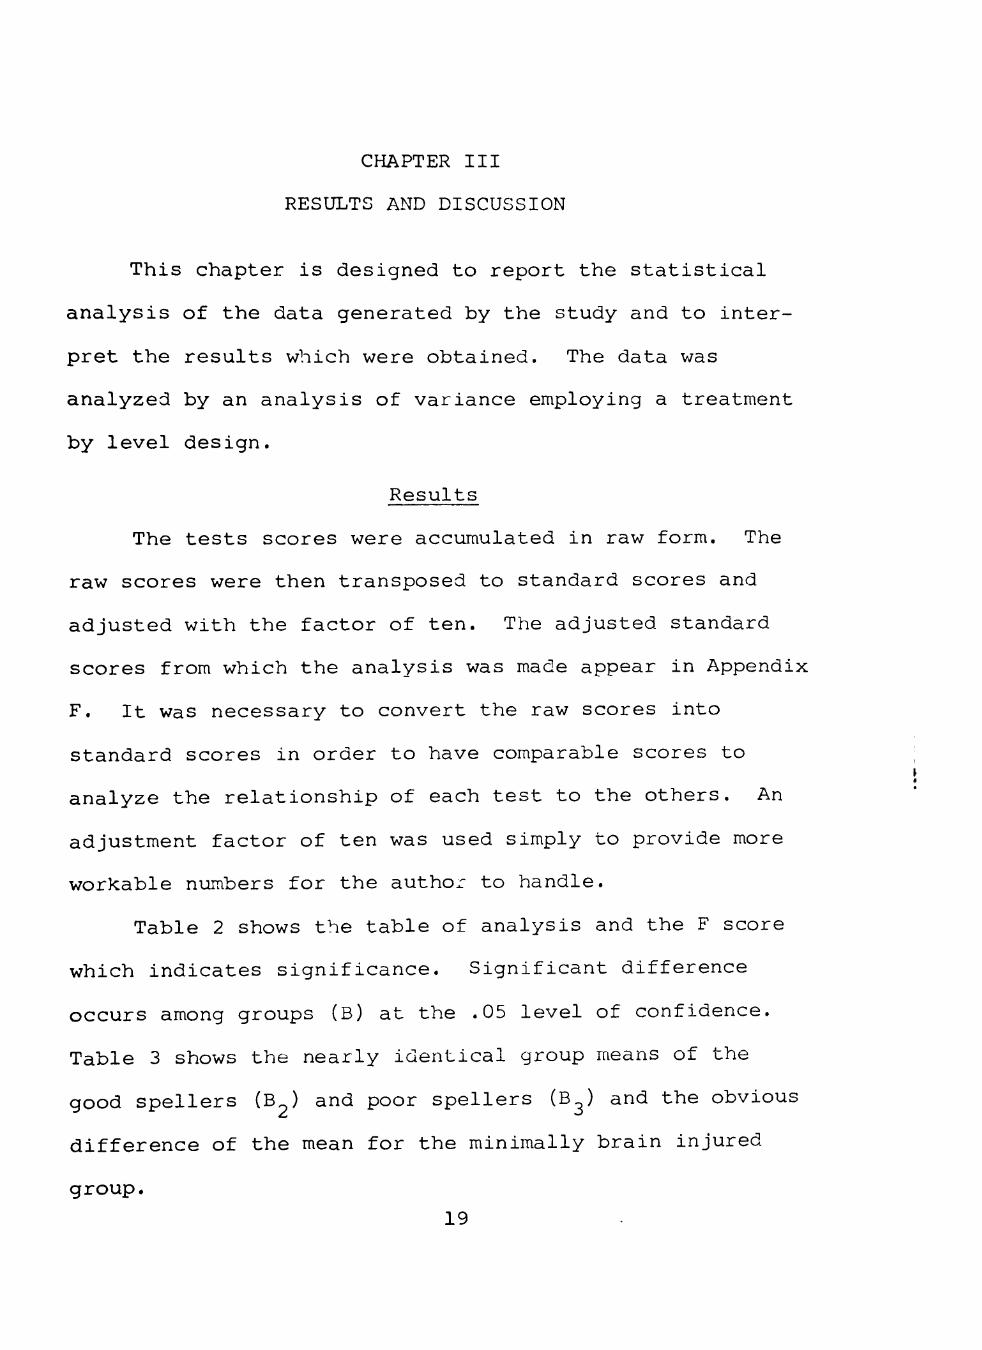
This chapter is designed to report the statistical
analysis of the data generated by the study and to inter
pret the results which were obtained. The data was
analyzed by an analysis of variance employing a treatment
by level design.
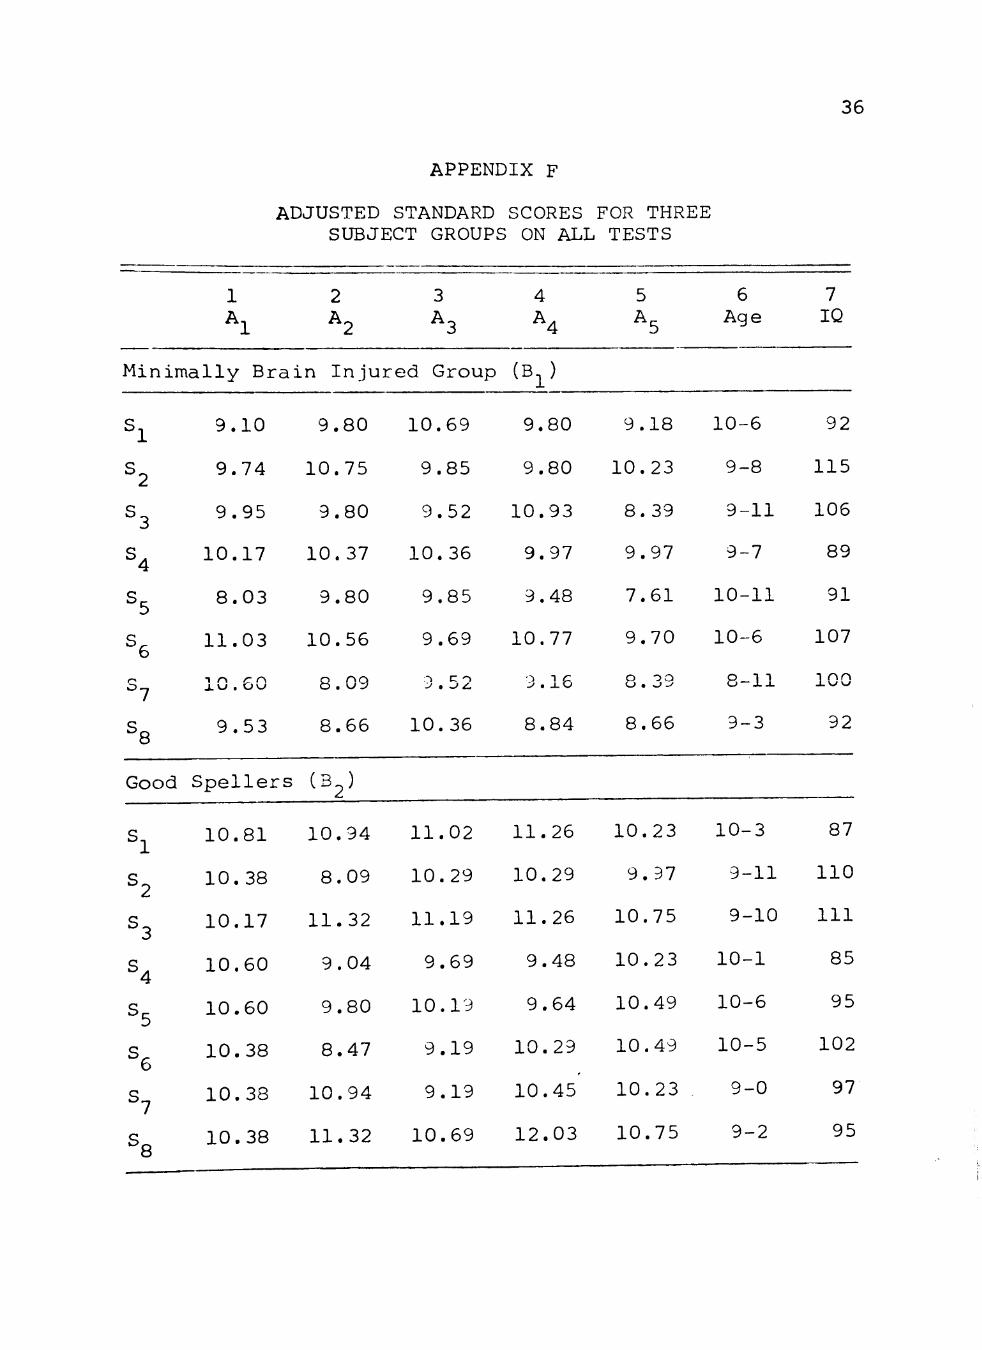
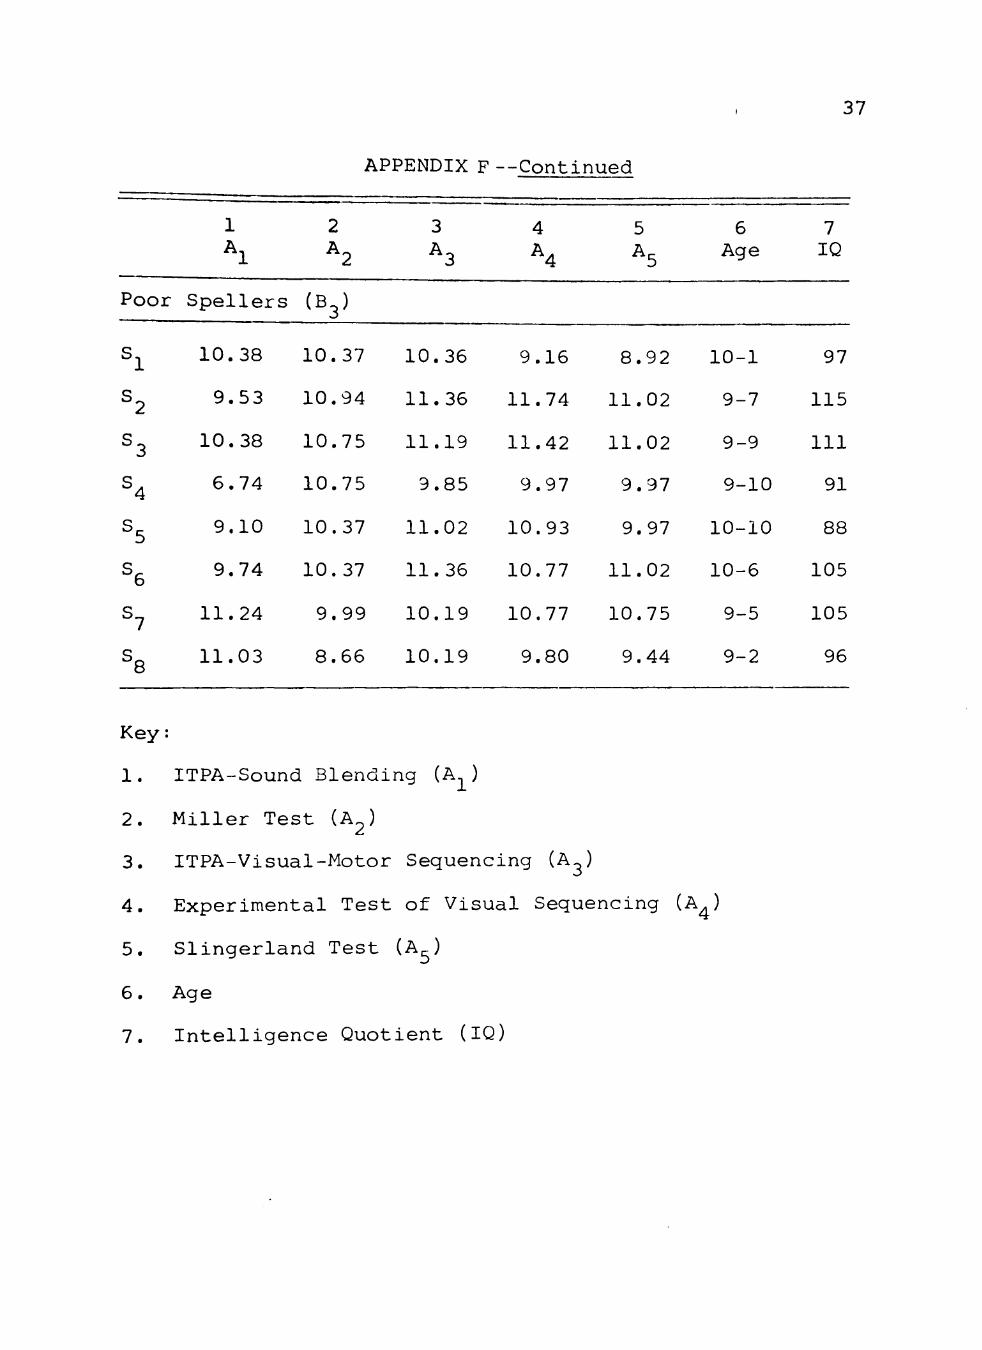
Results
The tests scores were accumulated in raw form. The
raw scores were then transposed to standard scores and
adjusted with the factor of ten. The adjusted standard
scores from which the analysis was made appear in Appendix
F. It was necessary to convert the raw scores into
standard scores in order to have comparable scores to
analyze the relationship of each test to the others. An
adjustment factor of ten was used simply to provide more
workable numbers for the author to handle.
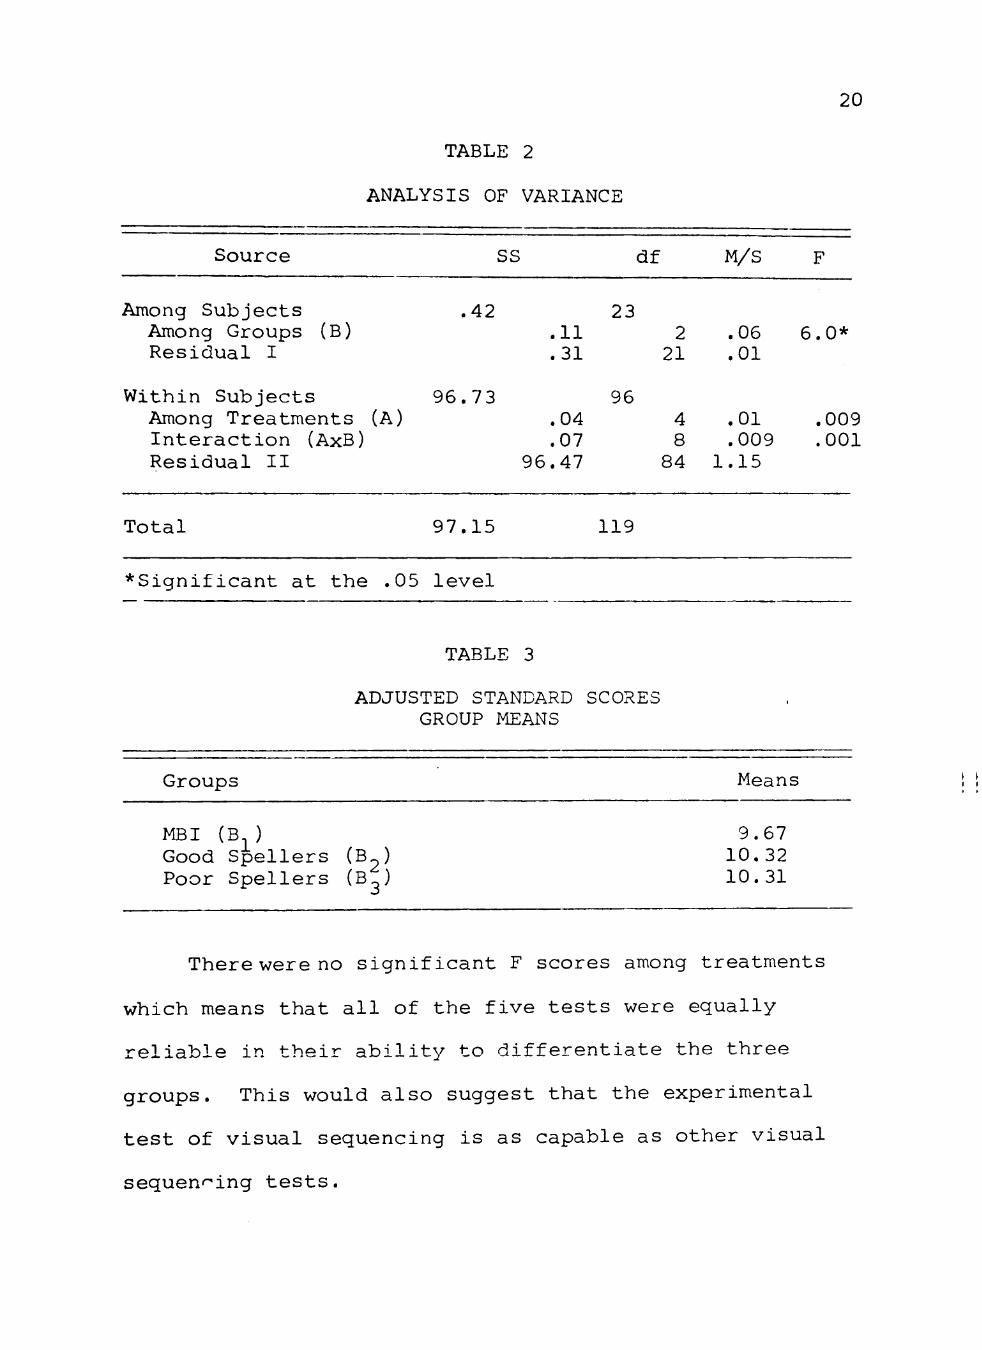
Table 2 shows the table of analysis and the F score
which indicates significance. Significant difference
occurs among groups (B) at the .05 level of confidence.
Table 3 shows the nearly identical group means of the
good spellers (B ) and poor spellers (B^) and the obvious
difference of the mean for the minimally brain injured
group.
19
20
TABLE 2
ANALYSIS OF VARIANCE
Source SS df M/S F
Among Subjects .42 23 Among Groups (B) .11 2 .06 6.0* Residual I .31 21 .01
Within Subjects 96.73 96 Among Treatments (A) .04 4 .01 .009 Interaction (AxB) .07 8 .009 .001 Residual II 96.47 84 1.15
Total 97.15 119
*Signifleant at the .05 level
TABLE 3
ADJUSTED STANDARD SCORES GROUP MEANS
Groups Means
MBI (B ) 9.67 Good Spellers (B ) 10.32 Poor Spellers (B ) 10.31
There were no significant F scores among treatments
which means that all of the five tests were equally
reliable in their ability to differentiate the three
groups. This would also suggest that the experimental
test of visual sequencing is as capable as other visual
sequen-^ing tests.
21
Discussion
The five tests used in this study have significant
ability to distinguish the minimally brain injured popu
lation from good and poor spellers. However, equally
important is the observable similarity between the auditory
and visual sequencing performance of good and poor spellers.
The statement can be made that poor spellers more nearly
resemble good spellers than minimally brain injured
children in sequencing ability.
These findings also indicate that sequencing ability
is not the outstanding deficiency causing poor spelling
within the normal population.
The writer feels that a difference will be observed
at higher levels of auditory and visual integration within
the normal population causing inadequate spelling per
formance. Deficiency may be found in children's ability
to make adequate sound-letter association. This deficiency
could hinder his ability to separate individual sounds
from the word he has heard. However, a deficiency in
sound-letter association might make him unable to supply
the correct symbol to the sound he has heard. He may also
be deficient in his ability to associate the proper
syntactical rules to the word he is trying to write.
Individual personality characteristics of the children
might be a factor in spelling performance. Correlation
might be found between such characteristics as
22
non-conforming behavior, unstructured approach to tasks,
or individualism and poor spelling performance.
All of the five tests were able to differentiate
between the three groups indicating that they could be
used with equal reliability as part of a battery of tests
for differential diagnosis. It would seem advantageous
to select from these tests the ones that are most suited
to the needs of the child. The Miller test and the
experimental test are particularly well suited for non
verbal clients and are designed to require no language
integration for testing success. Further study should be
done to test the correlation of these two tests with
similar tests and to observe actual testing facility
using a large population.
More information as to the areas of language inte
gration that are most important in spelling could be
gathered from studies comparing auditory discrimination,
sound-letter association, and syllibication and ability
to sequence backward (WISC). Backward sequencing requires
both retaining the original stimuli and reorganizing it,
a multi-stepped process more similar to the number of
steps necessary in spelling than forward sequencing
requires.
The writer feels that this study provides information
and impetus for further research into the particular
23
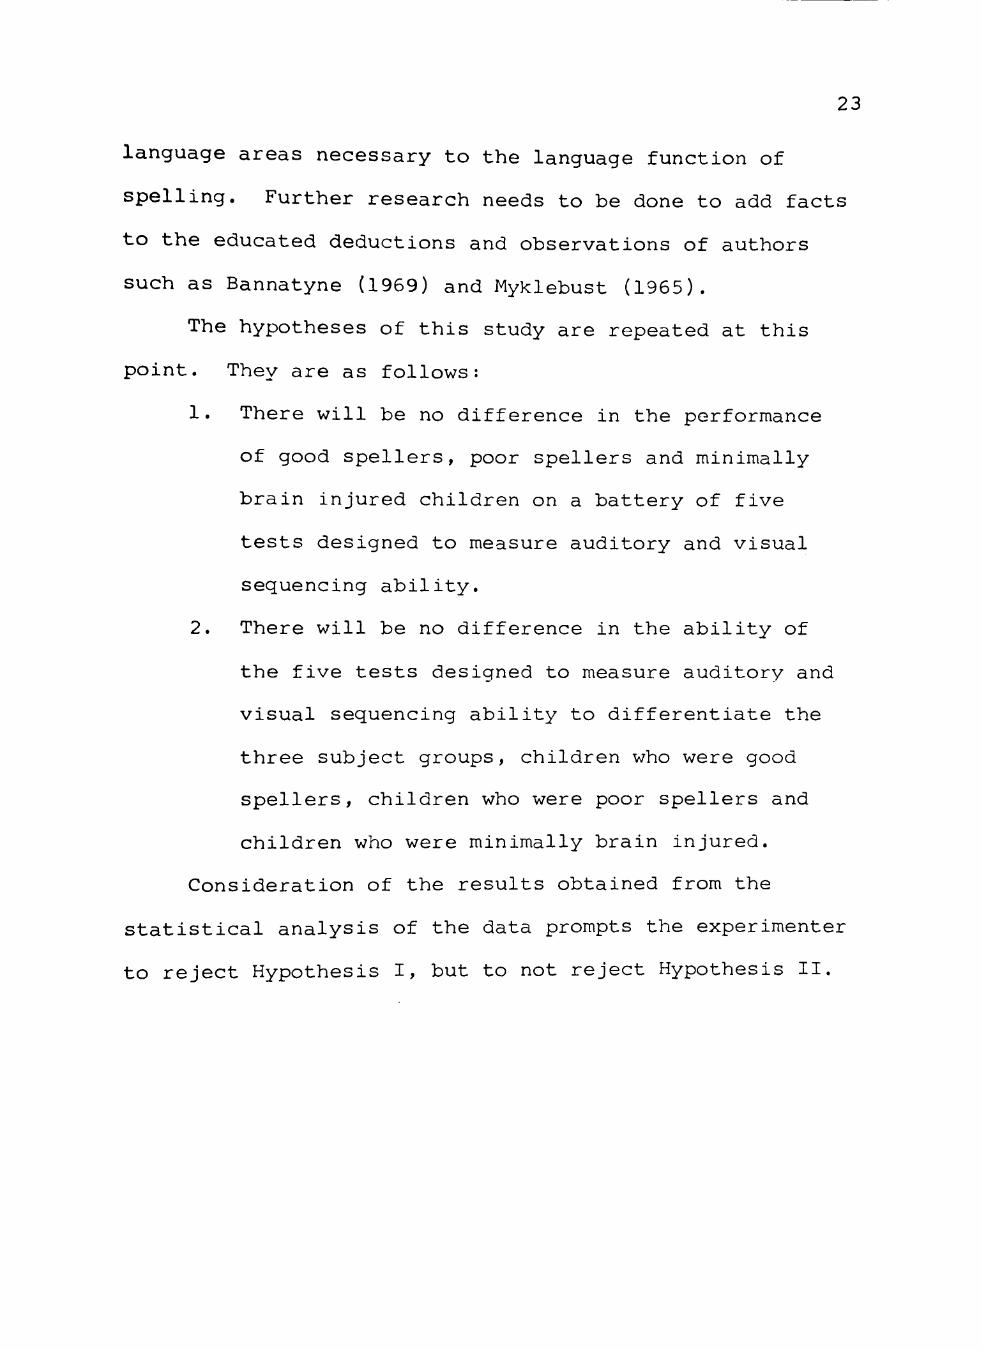
language areas necessary to the language function of
spelling. Further research needs to be done to add facts
to the educated deductions and observations of authors
such as Bannatyne (1969) and Myklebust (1965).
The hypotheses of this study are repeated at this
point. They are as follows:
1. There will be no difference in the performance
of good spellers, poor spellers and minimally
brain injured children on a battery of five
tests designed to measure auditory and visual
sequencing ability.
2. There will be no difference in the ability of
the five tests designed to measure auditory and
visual sequencing ability to differentiate the
three subject groups, children who were good
spellers, children who were poor spellers and
children who were minimally brain injured.
Consideration of the results obtained from the
statistical analysis of the data prompts the experimenter
to reject Hypothesis I, but to not reject Hypothesis II.
CHAPTER IV
SUMMARY AND CONCLUSIONS
The objective of this research was to explore the
possibility of a relation between temporal sequencing
ability in both the auditory and visual channels with
spelling performance. It was hypothesized that all
subject groups would score equally well on five sequential
tests and that of the five tests, none would differentiate
the three groups, children who are good spellers, children
who are poor spellers and children who are minimally
brain injured.
Procedure
Three groups of eight subjects each were matched
for age and intelligence. The populations compared were
children who were good spellers, children who were poor
spellers and children who were minimally brain injured.
All subjects had hearing within normal limits and vision
normal or corrected to normal.
Three tests of visual sequencing and two tests of
auditory sequencing were administered according to the
instructions in their test manuals. The tests were
administered in a rotating order so that no test score
was continually effected by fatigue or by learning. The
24
25
tests given were the Visual-Motor Subtest of the Illinois
Test of Psycholinguistic Abilities; Test 5 of the Screen
ing Tests for Identifying Children with Specific Language
Disability; the Experimental Test of Visual Memory Span;
the Sound Blending Subtest of the Illinois Test of
Psycholinguistic Abilities; and the Miller Test of Audi
tory Memory Span for Tonal Sequences.
Results
The data were analyzed using an analysis of variance
and employing a treatment by level design. An .05 level
of confidence was used to determine the significance of
the data. The scores analyzed were the adjusted standard
scores of the five tests.
The F ratio among groups of the analysis of variance
was significant. In other words, the five tests indicated
that the minimally brain injured group scored significantly
lower than the good spellers and poor spellers.
No significance was found within treatments indicating
that none of the five tests was particularly sensitive in
differentiating the groups. The data did imply that the
Miller Experimental Test of Auditory Memory Span for
Tonal Sequences and the Experimental Test of Visual Memory
Span are comparable to the control tests in their diagnos
tic ability.
26
Conclusions
The conclusions drawn by this experimenter are
stated below:
1. It would appear that poor spellers are more
similar to good spellers than to minimally brain
injured students in their ability to sequence
both auditory and visual stimuli.
2. It would also appear that none of the five
sequential tests employed in this study is better
able to identify the groups than any other.
3. It would appear also that the Miller Experimental
Test of Auditory Memory Span for Tonal Sequences
and the Experimental Test of Visual Memory Span
are comparable to the control tests in their
diagnostic ability.
4. There is no apparent evidence to indicate that
poor spelling in the normal population is sig
nificantly related to deficient auditory or visual
sequencing ability.
5. It would appear that the two experimental tests
are worthy of further testing to establish norms.
BIBLIOGRAPHY
Aaron, I. E. "The Relationship of Selected Measures to Spelling Achievement at the Fourth and Eighth Grade Levels." Journal of Educational Research. Vol. 53 (1953), pp. 138-143.
Aten, James. "Disturbances in the Perception of Auditory Sequence in Children with Minimal Cerebral Dysfunction." Journal of Speech and Hearing Research, Vol. 11, No. 2 (June, 1968), pp. 236-245.
Bangs, Tina E. Language and Learning Disorders of the Pre-Academic Child. New York: Appleton-Century-Crofts, 1968.
Carrell, James, and Pendergast, Kathleen. "An Experimental Study of the Possible Relation Between Errors of Speech and Spelling." Journal of Speech and Hearing Disorders, (Sept., 1954), pp. 327-332.
Bannatyne, Alex. "A Comparison of Visuo-Spatial and Visuo-Motor Memory for Designs and Their Relationship to Oclier Sensori-Motor and Psycholinguistic Variables." Journal of Learning Disabilities, Vol. 2, No. 9 (1969), pp. 451-466.
Bloomer, Richard H. "Concepts of Meaning and the Reading and Spelling Difficulty of Words." Journal of Educational Research, Vol. 54 (1961), pp. 178-182.
Ediger, M. "Teaching Spelling in the Elementary School." Peabody Journal of Education, Vol. 45 (1967), pp. 103-106.
Eisenson, Jon. "Perceptual Disturbances in Children with Central Nervous System Dysfunctions and Implications for Language Development." British Journal of Disorders of Communication. Vol. 8 (1966), pp. 21-56.
Ferguson, George A. Statistical Analysis in Psychology and Education. New York: McGraw-Hill, Inc., 1966.
Furth, H. G. "Sequence Learning in Aphasic and Deaf Children." Journal of Speech and Hearing Disorders, Vol. 29 (1964), pp. 171-177.
27
28
, and Pufall, P. B. "Visual and Auditory Sequence Learning in Hearing Impaired Children." Journal of Speech and Hearing Research, Vo1. 9 (1966), pp. 441-449.
Herman, W. L. "The Relationship of Background Music to Spelling." Peabody Journal of Education, Vol. 46 (1968), pp. 102-109.
Hicks, Charles R. Fundamental Concepts in the Design of Experiments. New York; Holt, Rinehart and Winston, 1964.
Hirsch, I. J. "Auditory Perception of Temporal Order." The Journal of the Acoustical Society of America, Vol. 31, No. 6 (June, 1959), pp. 759-767.
, and Sherrick, E. C. "Perceived Order in Different Sense Modalities." Journal of Experimental Psychology, Vol. 62 (1961), pp. 423-432.
Johnson, Doris, and Myklebust, Helmer. Learning Disabilities . New York: Grune and Stratton, 1967.
Kirk, S., McCarthy, J., and Kirk, W. Examiner's Manual of the Illinois Test: of Psycholinguistic Abilities. University of Illinois, 1968.
Lowe, H. D., and Campbell, R. A, "Temporal Discrimination in Aphasoid and Normal Children." Journal of Speech and Hearing Research, Vol. 8 (April, 1965), pp. 313-315.
Luria, A. R. Higher Cortical Functions in Man. New York: Basic Books, 1966.
McCarthy, J. J., and Kirk, S. A. Illinois Test of Psycholinguistic Abilities: Examiner's Manual. Urbana, 111., University of Illinois, Institute for Research on Exceptional Children, 1961.
McGinnis, M. Aphasic Children. Washington, D.C.: The Alexander Graham Bell Association for the Deaf, 1963.
Miller, Patricia Anne. "An Experimental Test of Auditory Memory Span for Tonal Sequences." Unpublished Master's Thesis, Texas Technological College, 1969.
Myklebust, Helmer. Auditory Disorders in Children. New York: Grune and Stratton, 1954.
29
. Development and Disorders of Written Language New York: Grune and Stratton, 1965.
Poppen, R., Stark, J., Eisenson, J., Forrest, T., and Wertheim, G. "Visual Sequencing Performance of Aphasic Children." Journal of Speech and Hearing Research, Vol. 12 (1969), pp. 288-300.
Slingerland, Beth. "Screening Tests for Identifying Children with Specific Language Disability." Cambridge: Educators Publishing Service, 1964.
Stark, Joel. "A Comparison of the Performance of Aphasic Children on Three Sequencing Tests." Journal of Communication Disorders, Vol. 1 (1967), pp. 31-34.
Texas Education Agency. "Minimally Brain Injured." State Plan for Special Education. Austin, Texas (November, 1965).
Van Riper, Charles. Speech Correction. Englewood Cliffs, New Jersey: Prentice-Hall, 1963.
APPENDIX
A. Miller Test of Auditory Memory Span for Tonal Sequences
B. ITPA Sound Blending Subtest
C. Test of Visual Memory
D. ITPA Visual-Motor Sequencing Subtest
E. Slingerland Test #5
F. Adjusted Standard Scores for Three Subject Groups on All Tests
30
31
APPENDIX A
MILLER TEST OF AUDITORY MEMORY SPAN FOR TONAL SEQUENCES
Practice Trials Test Begins
1 2 3 4
1 2 3 4 5
6 7 8 9
10
11 12 13 14 15
16 17 18 19 20
21 22 23 24 25
26 27 28 29 30
32
Words with Pictures
APPENDIX B
ITPA SOUND BLENDING SUBTEST
Words without Pictures
Nonsense Words
1. f-oot
2. m-an
3. sh-oe
4. c-ap
5. c-ar
6. c-u-p
7. sh-i-p
8. ea-t
9. e-gg
10. u-p
11. c-ow
12. m-e
13. f-i-sh
14. c-a-t
15. b-i-g
X D s-a-a
17. b-oa-t
18. n-o-s-e
19. d-i-nn-er
20. f-ea-th-er
21. 1-i-tt-le
22. k-e-tch-u-p
23. b-a-b-ie-s
25. 1-e-k
26. a-f-e
27. v-u-m
28. r-a-s-t
29. t-e-k-o
30. t-a-p-i-k
31. r-u-s-o-p
32. 'o-p-a-s-t-'o
24. t-e-1-e-ph-o-ne
33
APPENDIX C
TEST OF VISUAL MEMORY
Practice Trials Test Begins
1. 3-1 2. 6-2
1. 2. 3. 4. 5.
6. 7. 8. 9.
10.
11. 12. 13. 14. 15.
16. 17. 18. 19. 20.
21. 22. 23. 24. 25.
26. 27. 28. 29. 30.
6-4 1-9 6-4-2 9-7-4 4-7 3
3-8-6 4-6-1-5 5-1-9-7 7-4-3-2 9-6-5-7
1-6-8-5-3 5-2-1-9-6 2-1-7-6-3 7-4-2-3-9 8-5-3-2-7-1
7-5-2-9-1-6 9-4-6-5-8-3 2-4-7-9-3-6 2-8-5-6-3-4-7 5-6-3-2-1-7-4
7-5-1-9-3-2-4 5-9-4-7-3-1-2 3-6-1-7-8-9-4-2 1-2-7-3-5-8-9-4 4-6-2-9-1-3-7-8
7-8-6-5-9-4-2-1 1-5-2-6-8-9-3-4-7 7-5-6-1-2-9-3-4-8 8-9-3-1-7-5-4-6-2 7-6-9-5-2-8-3-1-4
34
APPENDIX D
ITPA VISUAL-MOTOR SEQUENCING SUBTEST
1. bed-telephone 11. z-3-z-d-o
2. hammer-pencil 12. d-3-8-z-8
3. cat-potato-dog 13. d-z-6-3-d
4. s-s-3 14. 3-5-8-d-d-z
5. s-3-o 15. 3-6-8-3-5-z
6. o-s-d-d
7. s-s-8-d
8. d-8-d-z
9. 3-z-d-8
10. 8-d-z-6
Key:
1. Square (s)
2. Triangle (3)
3. Circle (o)
4. Diamond (d)
5. Octagon (8)
6. Trapazoid (z)
7. Sextagon (6)
8. Pentagon (5)
6. thundering
7. 5 X 936
8. 67 - 519
9. H ^ = :
10. ^ ^ 7 ^
• >
APPENDIX E
SLINGERLAND TEST #5
35
1. puddle
2. first
3. sports
4. would
5. crumb
m 11. V"
12.
13. from these
14. blue barn
15. wild animals and birds
APPENDIX F
ADJUSTED STANDARD SCORES FOR THREE SUBJECT GROUPS ON ALL TESTS
36
1
'̂ l
2
^2
Minimally Brain Injur
^1
^2
S3
^4
^5
^6
S7
^8
Good
2 ]
2?
^3
S4
S5
^6
^7
^8
9.10
9.74
9.95
10.17
8.03
11.03
9.53
Spellers
10.81
10.38
10.17
10.60
10.60
10.38
10.38
10.38
9.80
10.75
9.80
10.37
9.80
10.56
8.09
8.66
(3^)
10.94
8.09
11.32
9.04
9.80
8.47
10.94
11.32
3
^3
ed Group
10.69
9.85
9.52
10.36
9.85
9.69
10.36
11.02
10.29
11.19
9.69
10.19
9.19
9.19
10.69
4
^4
(B^)
9.80
9.80
10.93
9.97
9.48
10.77
8.84
11.26
10.29
11.26
9.48
9.64
10.29
10.45
12.03
5
^5
9.18
10.23
8.39
9.97
7.61
9.70
0 0 0
8.66
10.23
9.97
10.75
10.23
10.49
10.49
10.23
10.75
6 Age
10-6
9-8
9-11
9-7
10-11
10-6
8-11
9-3
10-3
9-11
9-10
10-1
10-6
10-5
9-0
9-2
7 IQ
92
115
106
89
91
107
1 c\r\
92
87
110
111
85
95
102
97
95
37
APPENDIX F--Continued
Poor
^1
^2
^3
^4
S ^6
^7
^8
1
'̂ l
Spellers
10.38
9.53
10.38
6.74
9.10
9.74
11.24
11.03
2
^2
^^3^
10.37
10.94
10.75
10.75
10.37
10.37
9.99
8.66
3
^3
10.36
11.36
11.19
9.85
11.02
11.36
10.19
10.19
4
^4
9.16
11.74
11.42
9.97
10.93
10.77
10.77
9.80
5
^5
8.92
11.02
11.02
9.97
9.97
11.02
10.75
9.44
6 Age
10-1
9-7
9-9
9-10
10-10
10-6
9-5
9-2
7 IQ
97
115
111
91
88
105
105
96
Key:
1. ITPA-Sound Blending (A )
2. Miller Test (A^)
3. ITPA-Visual-Motor Sequencing (A^)
4. Experimental Test of Visual Sequencing (A^)
5. Slingerland Test (A^)
6. Age
7. Intelligence Quotient (IQ)