Embed Size (px)
Citation preview

The attractiveness of world-class business districtsParis La Défense vs. its global competitorsNovember 2017

3The attractiveness of world-class business districts
Cont
ents
Contents 3
Editorial 4
Executive summary 6
The factors shaping the attractiveness of business districts are changing fast 6Paris La Défense ranks fourth worldwide and second in Europe 7Five trends shaping the future of global business districts 7
Introduction: a landmark survey of the attractiveness of global business districts 8
EY-ULI survey of the attractiveness of world-class business districts aims to evaluate how district attractiveness really compares 9Conducted by an international team of experts 9Selecting and reviewing 17 global business districts 10
The five key drivers for business district attractiveness 13
Part 1: The 2017 Global Business Districts ranking 16
Overall ranking: Paris La Défense is fourth among global business districts in 2017 17Factor 1: Capacity to attract and retain talent 20Factor 2: Quality of urban environment 22Factor 3: Proximity to markets, clients and partners 24Factor 4: Location with national and global influence 26Factor 5: Offering numerous and high-quality offices 28
Part 2: Five trends shaping the future of global business districts 30
1. The attractiveness of business districts and their metropolises is entwined 312. Business districts are becoming places to be 323. More flexible use of space is transforming the cost equation 354. Business districts are opening up to start-ups 365. Image building and marketing are key for business districts 37
Methodology 38
Ranking methodology: an approach built around the priorities of global users 39
For complementary information check out our website: business-districts-attractiveness.com
The attractiveness of world-class business districts4
Carried out jointly by EY and the Urban Land Institute (ULI), the study is based upon a global survey of users and property professionals, complemented by a battery of quantitative, objective and comparable metrics.
Why study the world’s leading business districts? Firstly, because they are leading centers of economic power. They are home to global companies and their service providers, and to many of the world’s banks.They are increasingly centers for retailing, culture and tourism. Although conceived as office parks, modern business districts have become cities within cities. They are increasingly open, diverse and connected, and more than ever essential to the attractiveness of their host cities.
Secondly, because the global economic order is being transformed by the emergence of powerful new companies, disruptive innovation, and profound environmental and demographic changes. To remain attractive, business districts must appeal to emerging activities and new generations, which their planners and developers cannot ignore. Global shock waves are accentuating competition between districts to host strategic functions as the contest between leading European cities on the eve of Brexit attests.
Finally, because our study demonstrates that, in the race to enhance attractiveness, new factors have become critical: access to talent, developing mixed uses, openness to start-ups and the capacity to adapt to new ways of working.
Confronted by these new imperatives, cities and their business districts are proving more agile than states and their governments. They are expanding, refurbishing and transforming themselves so as to retain and attract companies, entrepreneurs, students, residents and visitors to dense city districts that blend high-rise buildings with an ever-richer tableau of activities and attractions.
In this first edition of our international business districts survey, we have focused on the ways in which business districts are adapting and changing to meet new challenges. We would like to thank the hundreds of business executives, architects, property professionals, experts and residents of the world’s business districts who helped the ULI and EY teams explore the fascinating transformation that is now under way in business districts around the world.
Marc LhermitteEY Advisory Partner
Editorial EY
This is the world’s first survey of the attractiveness of international business districts, and its findings about their development and performance are revelatory.
5The attractiveness of world-class business districts
This report highlights how expectations are changing around the environment that business districts must provide to remain competitive. In the past, the availability of a large amount of top-quality commercial space would have been enough to attract international corporate tenants. Today, however, the single-use business district — deserted after the end of the working day — is no longer an attractive proposition. Our research shows that, first and foremost, businesses want offices in locations with access to skills and talent. To attract this talent, business districts must create a live-work-play environment.
From Singapore to Amsterdam, business districts are becoming increasingly mixed–use and less distinguishable from traditional city centers. Housing, co-working spaces, street food markets and event spaces are now all common features of business districts. These features have shifted in a relatively short period of time from being a value-add to a baseline requirement to compete.
The findings of this research reflect a transition occurring across the real estate industry. A prime location and quality physical spaces remain key elements to remaining competitive, but the definitions of "prime" and "quality" are changing quickly. Driven by the competition for talent, companies that occupy space in business districts increasingly demand a more pleasant environment to work, relax and live in. To thrive, business districts will need to offer what ULI calls "good density" – mixed-use, well-connected environments with high-quality green and public space. This strong demand for mixed use implies that the traditional boundaries between sectors such as office, retail and residential are blurring.
Companies also require more services and greater flexibility from asset owners and managers. For business districts, remaining competitive in this environment requires a joined-up approach across sectors and offering "space as a service" instead of just letting a building. This is particularly important when trying to attract start-ups, technology companies and other businesses that make up the innovation economy. To attract these companies in particular, business districts need to offer a more diverse and affordable range of options to potential tenants, including co-working spaces. Policy-makers and public officials who oversee business districts must work with asset owners, managers and occupiers to create the type of district that can thrive in this new climate.
The study also highlights the connection between the attractiveness of business districts and the appeal of the city in which they are located. As ULI has highlighted in other recent research, city competitiveness is related to an array of characteristics, from the quality of the labor force to the regulatory environment. While many of these factors will be outside the control of those who oversee business districts, this research identifies a number of innovative initiatives that business districts are undertaking to create attractive urban settings. These range from projects focusing on placemaking and improving the urban landscape, to creating incubators to support start-ups and training programs to nurture talent.
This report was informed by our members —industry leaders whose survey responses and interviews helped establish the criteria for successful business districts. Their views and opinions make one thing very clear: successful business districts are no longer just locations for work. The business districts of today and the future must be diverse, dynamic and multidimensional places for living.
Lisette Van DoornChief Executive Officer, ULI Europe
Editorial ULI
ULI is pleased to have worked with EY on this groundbreaking assessment of the attractiveness of business districts globally. The findings reflect many of the major trends we have observed through our research that are reshaping the real estate industry.
The attractiveness of world-class business districts is a unique study carried out for Paris’s La Défense business district by EY and ULI, which were chosen for their expertise in attractiveness issues and urban development, and for their global reach.
The survey measures the comparative attractiveness of 17 leading business districts around the world. It is based upon almost 40 objective and quantifiable indicators, a global online survey of 226 members of the ULI network, and 35 in-depth interviews with experts in the 17 selected business districts.
Executive summary
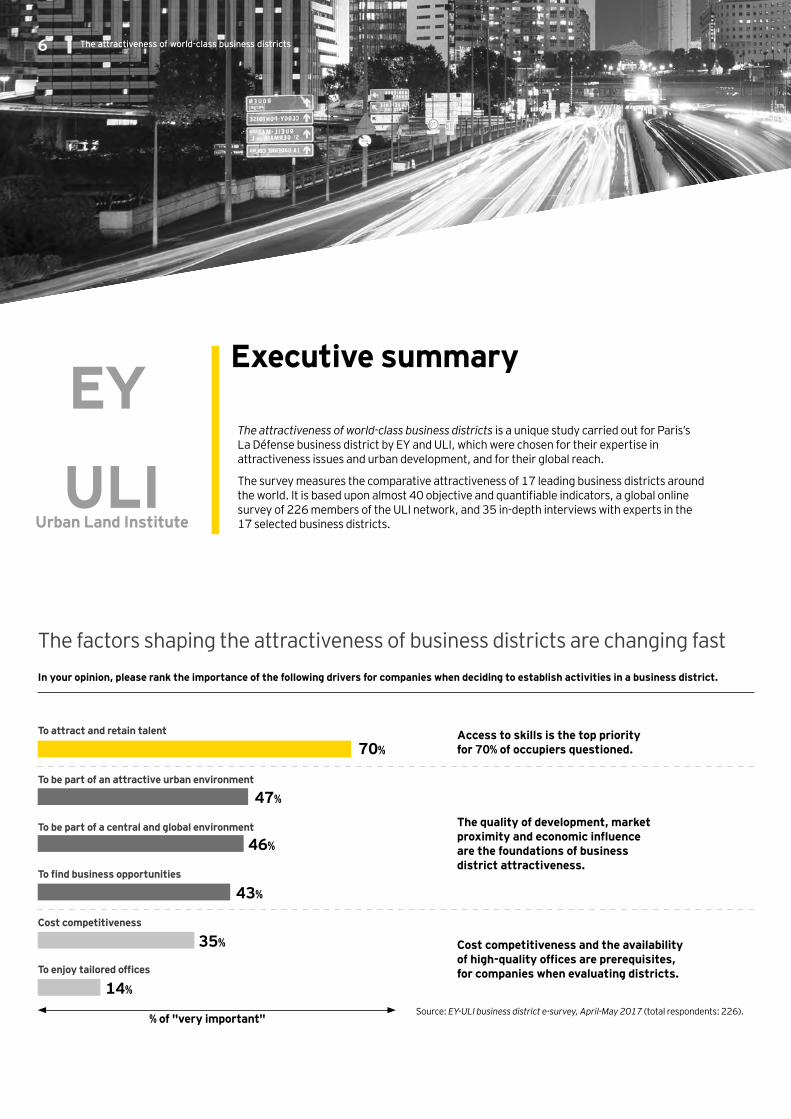
The factors shaping the attractiveness of business districts are changing fastIn your opinion, please rank the importance of the following drivers for companies when deciding to establish activities in a business district.
Access to skills is the top priority for 70% of occupiers questioned.
The quality of development, market proximity and economic influence are the foundations of business district attractiveness.
Cost competitiveness and the availability of high-quality offices are prerequisites, for companies when evaluating districts.
To attract and retain talent
70%
To be part of an attractive urban environment
47%
To be part of a central and global environment
46%
To find business opportunities
43%
Cost competitiveness
35%
To enjoy tailored offices
14%
% of "very important"Source: EY-ULI business district e-survey, April-May 2017 (total respondents: 226).
EY
ULI Urban Land Institute
The attractiveness of world-class business districts6
7The attractiveness of world-class business districts
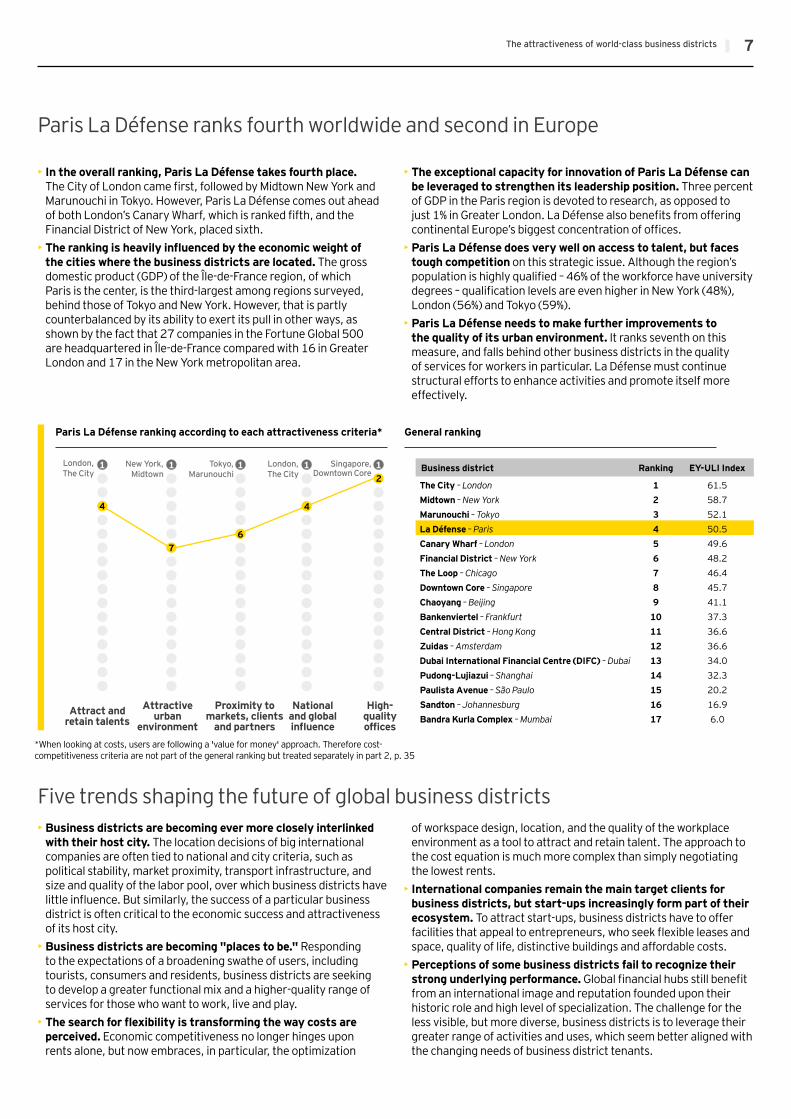
• In the overall ranking, Paris La Défense takes fourth place. The City of London came first, followed by Midtown New York and Marunouchi in Tokyo. However, Paris La Défense comes out ahead of both London’s Canary Wharf, which is ranked fifth, and the Financial District of New York, placed sixth.
• The ranking is heavily influenced by the economic weight of the cities where the business districts are located. The gross domestic product (GDP) of the Île-de-France region, of which Paris is the center, is the third-largest among regions surveyed, behind those of Tokyo and New York. However, that is partly counterbalanced by its ability to exert its pull in other ways, as shown by the fact that 27 companies in the Fortune Global 500 are headquartered in Île-de-France compared with 16 in Greater London and 17 in the New York metropolitan area.
• The exceptional capacity for innovation of Paris La Défense can be leveraged to strengthen its leadership position. Three percent of GDP in the Paris region is devoted to research, as opposed to just 1% in Greater London. La Défense also benefits from offering continental Europe’s biggest concentration of offices.
• Paris La Défense does very well on access to talent, but faces tough competition on this strategic issue. Although the region’s population is highly qualified – 46% of the workforce have university degrees – qualification levels are even higher in New York (48%), London (56%) and Tokyo (59%).
• Paris La Défense needs to make further improvements to the quality of its urban environment. It ranks seventh on this measure, and falls behind other business districts in the quality of services for workers in particular. La Défense must continue structural efforts to enhance activities and promote itself more effectively.
Paris La Défense ranks fourth worldwide and second in Europe
Five trends shaping the future of global business districts• Business districts are becoming ever more closely interlinked
with their host city. The location decisions of big international companies are often tied to national and city criteria, such as political stability, market proximity, transport infrastructure, and size and quality of the labor pool, over which business districts have little influence. But similarly, the success of a particular business district is often critical to the economic success and attractiveness of its host city.
• Business districts are becoming "places to be." Responding to the expectations of a broadening swathe of users, including tourists, consumers and residents, business districts are seeking to develop a greater functional mix and a higher-quality range of services for those who want to work, live and play.
• The search for flexibility is transforming the way costs are perceived. Economic competitiveness no longer hinges upon rents alone, but now embraces, in particular, the optimization
of workspace design, location, and the quality of the workplace environment as a tool to attract and retain talent. The approach to the cost equation is much more complex than simply negotiating the lowest rents.
• International companies remain the main target clients for business districts, but start-ups increasingly form part of their ecosystem. To attract start-ups, business districts have to offer facilities that appeal to entrepreneurs, who seek flexible leases and space, quality of life, distinctive buildings and affordable costs.
• Perceptions of some business districts fail to recognize their strong underlying performance. Global financial hubs still benefit from an international image and reputation founded upon their historic role and high level of specialization. The challenge for the less visible, but more diverse, business districts is to leverage their greater range of activities and uses, which seem better aligned with the changing needs of business district tenants.
Attract and retain talents
Attractive urban
environment
Proximity to markets, clients
and partners
National and global influence
High- quality offices
Paris La Défense ranking according to each attractiveness criteria*
Business district Ranking EY-ULI Index
The City – London 1 61.5Midtown – New York 2 58.7Marunouchi – Tokyo 3 52.1La Défense – Paris 4 50.5Canary Wharf – London 5 49.6Financial District – New York 6 48.2The Loop – Chicago 7 46.4Downtown Core – Singapore 8 45.7Chaoyang – Beijing 9 41.1Bankenviertel – Frankfurt 10 37.3Central District – Hong Kong 11 36.6Zuidas – Amsterdam 12 36.6Dubai International Financial Centre (DIFC) – Dubai 13 34.0Pudong-Lujiazui – Shanghai 14 32.3Paulista Avenue – São Paulo 15 20.2Sandton – Johannesburg 16 16.9Bandra Kurla Complex – Mumbai 17 6.0
General ranking
4
76
4
21 1 1 1 1London,
The CitySingapore,
Downtown CoreTokyo,
MarunouchiLondon, The City
New York, Midtown
*When looking at costs, users are following a 'value for money' approach. Therefore cost-competitiveness criteria are not part of the general ranking but treated separately in part 2, p. 35

Introduction

9The attractiveness of world-class business districts
A landmark survey of the attractiveness of global business districts
EY-ULI survey of the attractiveness of world-class business districts aims to evaluate how district attractiveness really compares
Conducted by an international team of experts
The project, which began in January 2017, was carried out by two organizations whose knowledge is recognized worldwide.
EY advises public and private organizations in defining, implementing and evaluating their development, competitiveness and attractiveness strategies. EY also publishes benchmark international surveys (such as its attractiveness surveys) that bring together public and private perspectives. With its International Location Advisory Services (ILAS), EY developed a renowned expertise in helping major companies with their location strategies around the world.
ULI is a nonprofit research and education organization supported by its members. Founded in Chicago in 1936, it now has almost 40,000 members worldwide, representing the entire spectrum of land use and real estate development disciplines, working in private enterprise and public service. ULI has a strong history of balanced and objective research, publishing data and analysis that help land use leaders anticipate emerging trends and issues, and explore new approaches and creative solutions.
Outstanding experience in territorial attractiveness and business location strategies
An independent research and education organizationEY ULI
Initated by Paris La Défense, this study was conducted against a backdrop of profound changes in the world economy, and intensified competition between countries and cities.
This survey is very timely for business districts generally, and especially for Paris La Défense, for three reasons. Firstly, some global business districts are in the throes of profound change. Secondly, progress with the 814km² Grand Paris development project and its associated infrastructure could alter the attractiveness of Paris and its surrounding Île-de-France region. And finally, Brexit – the intended departure of the UK from the European Union (EU) – could lead to the relocation of certain activities to districts in other EU countries. Brexit is already reshaping the competitive landscape between European business districts.
The aim of the first attractiveness survey of global business districts is to identify the drivers of attractiveness in the world’s leading business districts, understand the dynamics and measure the performance of 17 selected business districts.
Paris La Défense, which commissioned this study, aims to draw on the findings of the survey to enhance its international competitiveness and identify opportunities for improvement.
The attractiveness of world-class business districts10
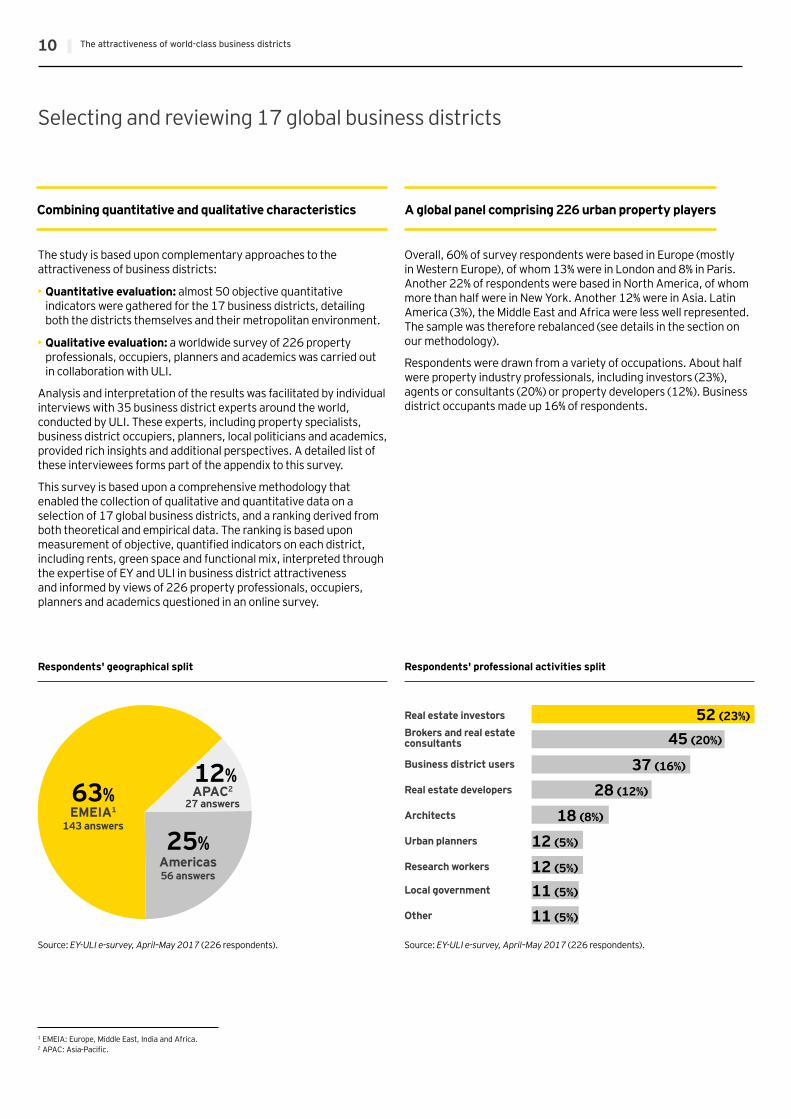
Overall, 60% of survey respondents were based in Europe (mostly in Western Europe), of whom 13% were in London and 8% in Paris. Another 22% of respondents were based in North America, of whom more than half were in New York. Another 12% were in Asia. Latin America (3%), the Middle East and Africa were less well represented. The sample was therefore rebalanced (see details in the section on our methodology).
Respondents were drawn from a variety of occupations. About half were property industry professionals, including investors (23%), agents or consultants (20%) or property developers (12%). Business district occupants made up 16% of respondents.
Selecting and reviewing 17 global business districts
The study is based upon complementary approaches to the attractiveness of business districts:
• Quantitative evaluation: almost 50 objective quantitative indicators were gathered for the 17 business districts, detailing both the districts themselves and their metropolitan environment.
• Qualitative evaluation: a worldwide survey of 226 property professionals, occupiers, planners and academics was carried out in collaboration with ULI.
Analysis and interpretation of the results was facilitated by individual interviews with 35 business district experts around the world, conducted by ULI. These experts, including property specialists, business district occupiers, planners, local politicians and academics, provided rich insights and additional perspectives. A detailed list of these interviewees forms part of the appendix to this survey.
This survey is based upon a comprehensive methodology that enabled the collection of qualitative and quantitative data on a selection of 17 global business districts, and a ranking derived from both theoretical and empirical data. The ranking is based upon measurement of objective, quantified indicators on each district, including rents, green space and functional mix, interpreted through the expertise of EY and ULI in business district attractiveness and informed by views of 226 property professionals, occupiers, planners and academics questioned in an online survey.
Combining quantitative and qualitative characteristics A global panel comprising 226 urban property players
Respondents' geographical split Respondents' professional activities split
EMEIA1
143 answers
APAC2
27 answers
Americas56 answers
63%12%
25%
Source: EY-ULI e-survey, April–May 2017 (226 respondents). Source: EY-ULI e-survey, April–May 2017 (226 respondents).
Real estate investorsBrokers and real estate consultants
Business district users
Real estate developers
Architects
Urban planners
Research workers
Local government
Other
52 (23%)
45 (20%)
37 (16%)
28 (12%)
18 (8%)
12 (5%)
12 (5%)
11 (5%)
11 (5%)
1 EMEIA: Europe, Middle East, India and Africa. 2 APAC: Asia-Pacific.
11The attractiveness of world-class business districts
A business district is a geographically defined district with a high concentration of high value-added tertiary activities, within a given metropolitan area.
Studies of business districts have identified five common characteristics that form the foundation of the definition used in the survey.
Our districts:• Form part of one of the world’s 100 most populous cities
• Have significant volumes of Class A offices (in excess of one million square meters, except at Zuidas, Amsterdam, which is included because it is a competitor in the context of Brexit)
• Have a sizeable labor pool within the metropolis (more than 50,000 jobs today or within the period of their development plan)
• Have a concentration of advanced tertiary activities and head office activities that are synonymous with the presence of headquarters of leading companies
• Have a concentration of dense development and high-rise buildings
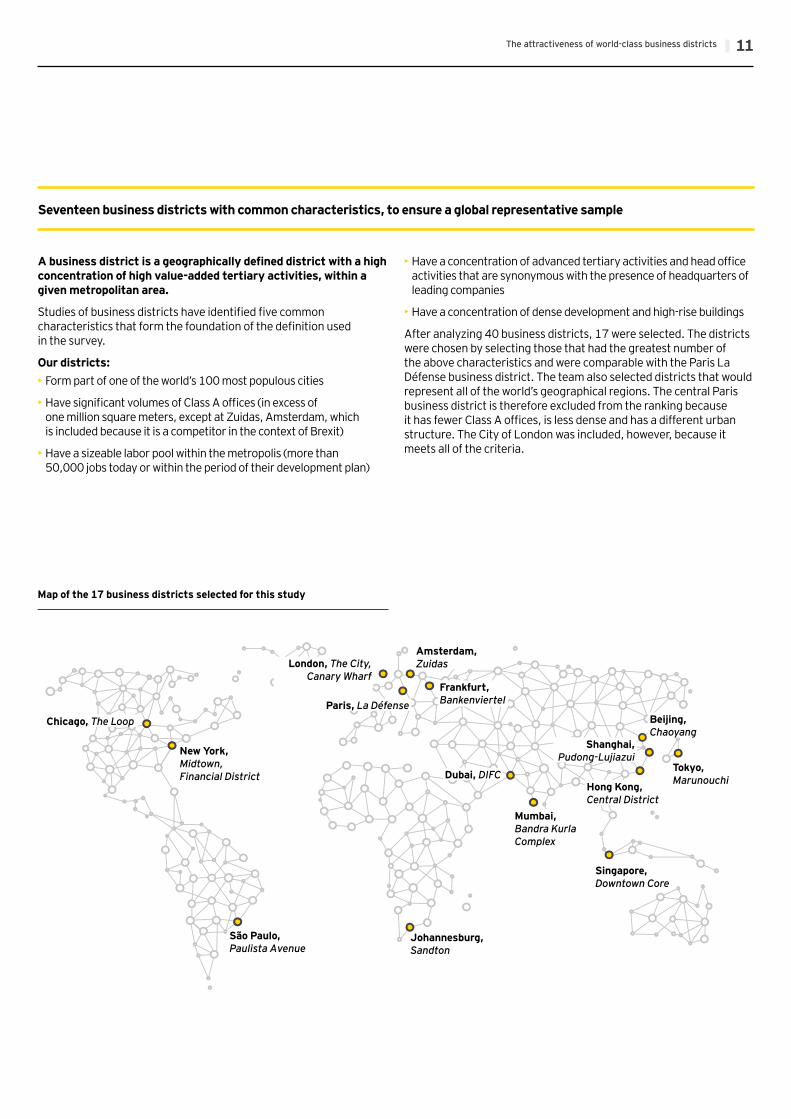
After analyzing 40 business districts, 17 were selected. The districts were chosen by selecting those that had the greatest number of the above characteristics and were comparable with the Paris La Défense business district. The team also selected districts that would represent all of the world’s geographical regions. The central Paris business district is therefore excluded from the ranking because it has fewer Class A offices, is less dense and has a different urban structure. The City of London was included, however, because it meets all of the criteria.
Seventeen business districts with common characteristics, to ensure a global representative sample
Map of the 17 business districts selected for this study
Chicago, The Loop
New York, Midtown, Financial District
São Paulo, Paulista Avenue
Johannesburg, Sandton
Singapore, Downtown Core
Mumbai, Bandra Kurla Complex
Dubai, DIFC
Frankfurt, BankenviertelParis, La Défense
Amsterdam,ZuidasLondon, The City,
Canary Wharf
Shanghai,Pudong-Lujiazui
Beijing,Chaoyang
Hong Kong,Central District
Tokyo, Marunouchi
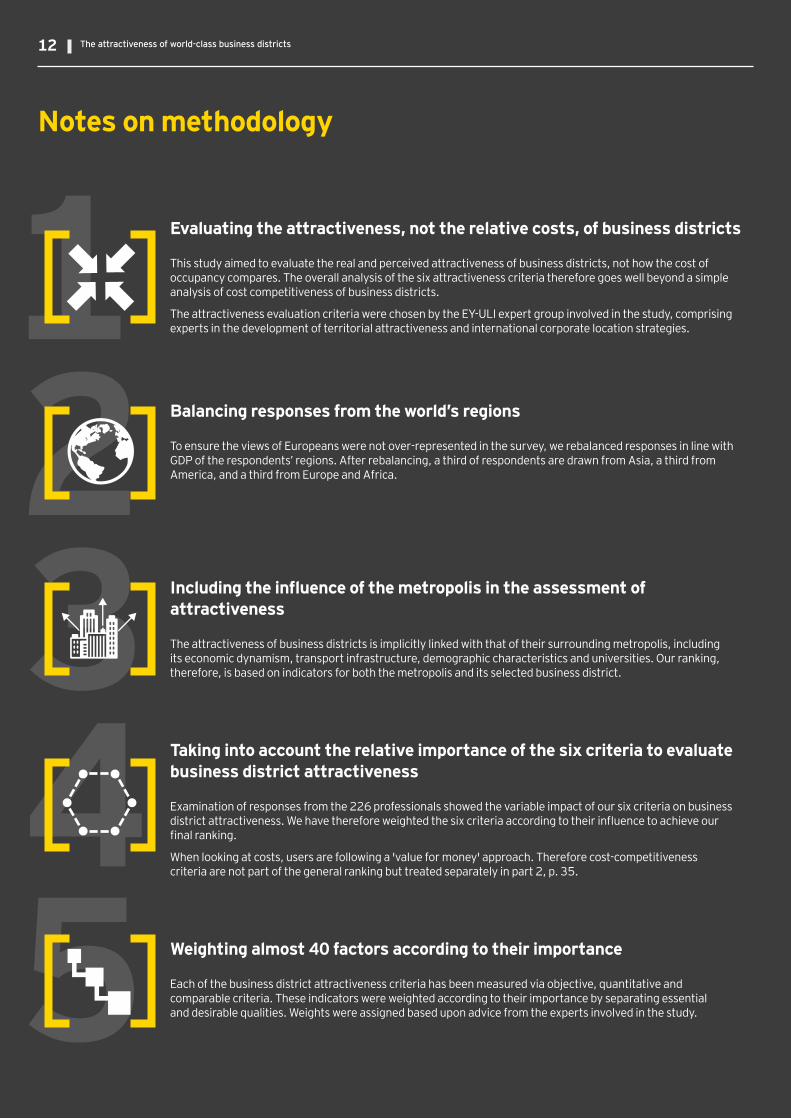
Evaluating the attractiveness, not the relative costs, of business districts
This study aimed to evaluate the real and perceived attractiveness of business districts, not how the cost of occupancy compares. The overall analysis of the six attractiveness criteria therefore goes well beyond a simple analysis of cost competitiveness of business districts.
The attractiveness evaluation criteria were chosen by the EY-ULI expert group involved in the study, comprising experts in the development of territorial attractiveness and international corporate location strategies.
Balancing responses from the world’s regions
To ensure the views of Europeans were not over-represented in the survey, we rebalanced responses in line with GDP of the respondents’ regions. After rebalancing, a third of respondents are drawn from Asia, a third from America, and a third from Europe and Africa.
Including the influence of the metropolis in the assessment of attractiveness
The attractiveness of business districts is implicitly linked with that of their surrounding metropolis, including its economic dynamism, transport infrastructure, demographic characteristics and universities. Our ranking, therefore, is based on indicators for both the metropolis and its selected business district.
Taking into account the relative importance of the six criteria to evaluate business district attractiveness
Examination of responses from the 226 professionals showed the variable impact of our six criteria on business district attractiveness. We have therefore weighted the six criteria according to their influence to achieve our final ranking.
When looking at costs, users are following a 'value for money' approach. Therefore cost-competitiveness criteria are not part of the general ranking but treated separately in part 2, p. 35.
Weighting almost 40 factors according to their importance
Each of the business district attractiveness criteria has been measured via objective, quantitative and comparable criteria. These indicators were weighted according to their importance by separating essential and desirable qualities. Weights were assigned based upon advice from the experts involved in the study.
Notes on methodology
The attractiveness of world-class business districts12

for business district attractiveness
The five key drivers
The attractiveness of world-class business districts14
Of all the potential qualities of international business districts, access to skills is by far the most important driver of attractiveness: 70% of respondents consider it "very important" for their location choice.
Business district occupiers chiefly recruit staff focused on national markets.4 This can be seen from the roles and qualifications of their hires. EY’s Global Talents in Global Cities Survey (2015) defined five leading categories of talent: students, researchers, business managers, entrepreneurs and creatives.
Interviews with business district occupiers identified two priority levels:
• The ability to recruit executives to top national roles. This concerns two distinct groups of recruits: those at the beginning of their professional life and experienced business leaders. These
two groups of employees are essential to businesses. This poses a real recruitment challenge, particularly because some may live a considerable distance from the business district. That makes easy travel to and from the business district essential. So access to talent is evaluated in terms of the metropolitan labor pool, not that of the business district.
• Access to researchers, entrepreneurs and creatives is becoming increasingly important because it facilitates development of an innovation-friendly environment. However, availability of this group is secondary.
Business district attractiveness is founded upon an attractive urban environment, good transport links, business connections (proximity to markets, clients and partners), and national and global reach. The quality of the urban environment is considered "very important" by 47% of respondents. Being in a good business ecosystem is similarly important for 46%, and being central with global connections is vital for 43%.
The priority given to the quality of the environment reflects the importance of accessing talent. To attract the skills they need, companies have to offer employees an attractive quality of life. It is not enough for a business district to be easily accessible. For occupiers to persuade highly skilled employees to agree to work there and continue working there, the business district must ensure company staff can "work, live and play" in the business district. Increasingly, when making decisions about where to locate, companies are considering the needs and preferences of their staff, on top of more traditional factors such as costs and city profile.
From a corporate perspective, the capacity of business districts to offer an environment that is favorable to innovation is the strongest differentiating factor. Now, and in the years ahead, innovation will be a powerful lever for companies and a key to their performance.5 We know that an environment conducive to innovation correlates positively with GDP per head,6 especially because of the link between creative environments and entrepreneurship. Ultimately, the ability to attract young, innovative companies is an opportunity to enhance the productivity of leading services businesses established in international business districts.
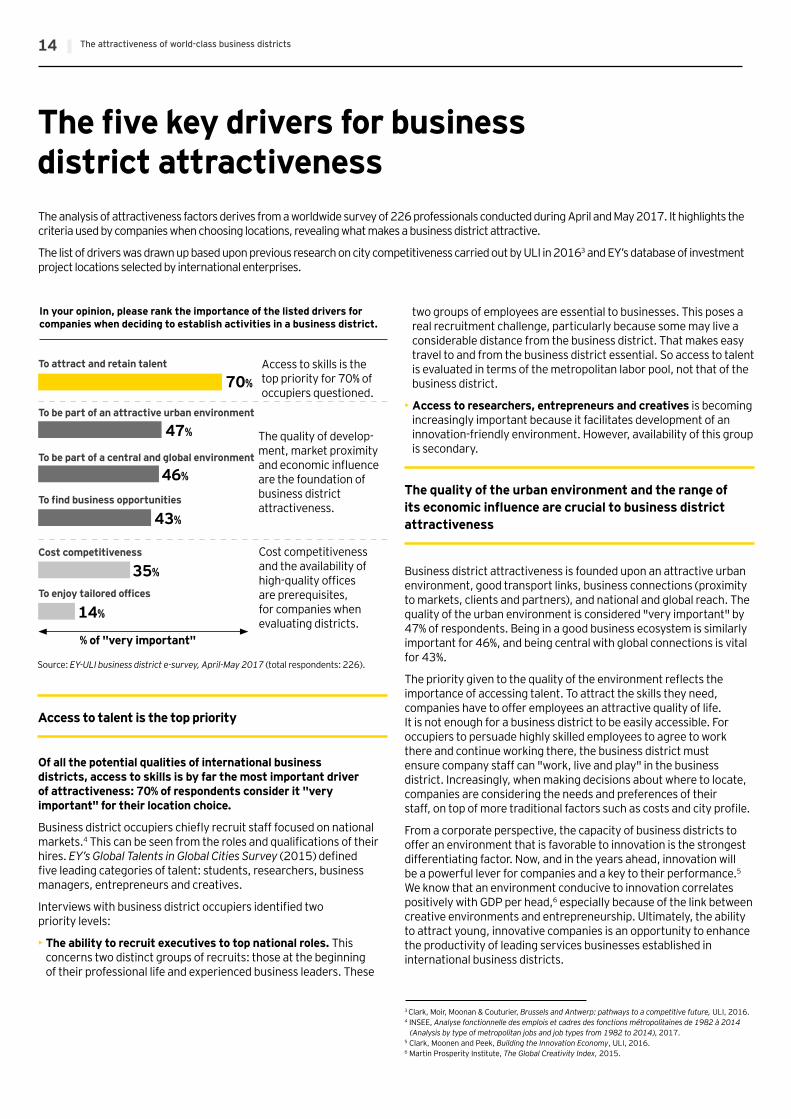
The five key drivers for business district attractiveness The analysis of attractiveness factors derives from a worldwide survey of 226 professionals conducted during April and May 2017. It highlights the criteria used by companies when choosing locations, revealing what makes a business district attractive.
The list of drivers was drawn up based upon previous research on city competitiveness carried out by ULI in 20163 and EY’s database of investment project locations selected by international enterprises.
Access to talent is the top priority
The quality of the urban environment and the range of its economic influence are crucial to business district attractiveness
3 Clark, Moir, Moonan & Couturier, Brussels and Antwerp: pathways to a competitive future, ULI, 2016.4 INSEE, Analyse fonctionnelle des emplois et cadres des fonctions métropolitaines de 1982 à 2014 (Analysis by type of metropolitan jobs and job types from 1982 to 2014), 2017.5 Clark, Moonen and Peek, Building the Innovation Economy, ULI, 2016.6 Martin Prosperity Institute, The Global Creativity Index, 2015.
In your opinion, please rank the importance of the listed drivers for companies when deciding to establish activities in a business district.
To attract and retain talent
70%
To be part of an attractive urban environment
47%
To be part of a central and global environment
46%
To find business opportunities
43%
Cost competitiveness
35%
To enjoy tailored offices
14%
Source: EY-ULI business district e-survey, April-May 2017 (total respondents: 226).
% of "very important"
Access to skills is the top priority for 70% of occupiers questioned.
The quality of develop-ment, market proximity and economic influence are the foundation of business district attractiveness.
Cost competitiveness and the availability of high-quality offices are prerequisites, for companies when evaluating districts.

15The attractiveness of world-class business districts
Ensuring the development of a start-up ecosystem is really the means to secure the availability of an innovation ecosystem for large companies within a business district. Big companies say they want access to an innovation ecosystem, though they don’t necessarily need it to be located in the heart of the business district. In reality, big companies take a common approach to accessing talent and innovation: they look for it across the metropolitan area.
Though fewer respondents — 35% — say cost competitiveness is "very important," occupiers nonetheless analyze it closely, systematically and in fine detail. Companies take a "value for money" approach to the relationship between costs and quality, integrating nonmaterial factors. Cost competitiveness therefore goes far beyond property costs and now embraces all of the hidden costs, including the values of a central location, modern facilities and connections, which shape attractiveness and staff retention.
All respondents rank the quality of property the least important factor for a business district. Having access to appropriate offices is identified as being "very important" by only 14% of respondents and 24% of occupiers, for whom this is a basic need. But that doesn’t mean companies don’t care about the quality of offices and facilities, or their modernity and flexibility. Rather, it shows that high-quality offices, along with affordable operating costs, are seen as a prerequisite for business district competitiveness. High-quality offices are so essential for companies that they don’t see them as a differentiating factor, except in terms of the services they offer corporate employees, which can enhance productivity, economic efficiency and employee loyalty.
Property is the second-highest category of expenditure for service companies, so optimizing costs in this area remains an effective lever of business efficiency. In 2015, the average workstation in Île-de-France7 was allocated 19m². But "offices of tomorrow" are likely to target occupation space of 10m² net per employee. Better building layouts and increased use of technology will enable companies to occupy less space, with a substantial impact on rental costs and charges.
Property experts underline the importance of the different types of workspaces available for employees. Properties are evaluated not just in terms of costs per square meter, but in terms of the performance and services offered by different properties, such as the availability of collaborative space, which contributes to a more friendly working environment, better adapted to the working methods and needs of new generations of workers.
Cost competitiveness is increasingly crucial and complex
The quality of offices available and location issues
7 ARSEG, presentation of the Buzzy Ratios 2015 survey, 2015.

The 2017 Global Business Districts ranking
Part 1:
17The attractiveness of world-class business districts
The 2017 Global Business Districts ranking
Overall ranking: Paris La Défense is fourth among global business districts in 2017
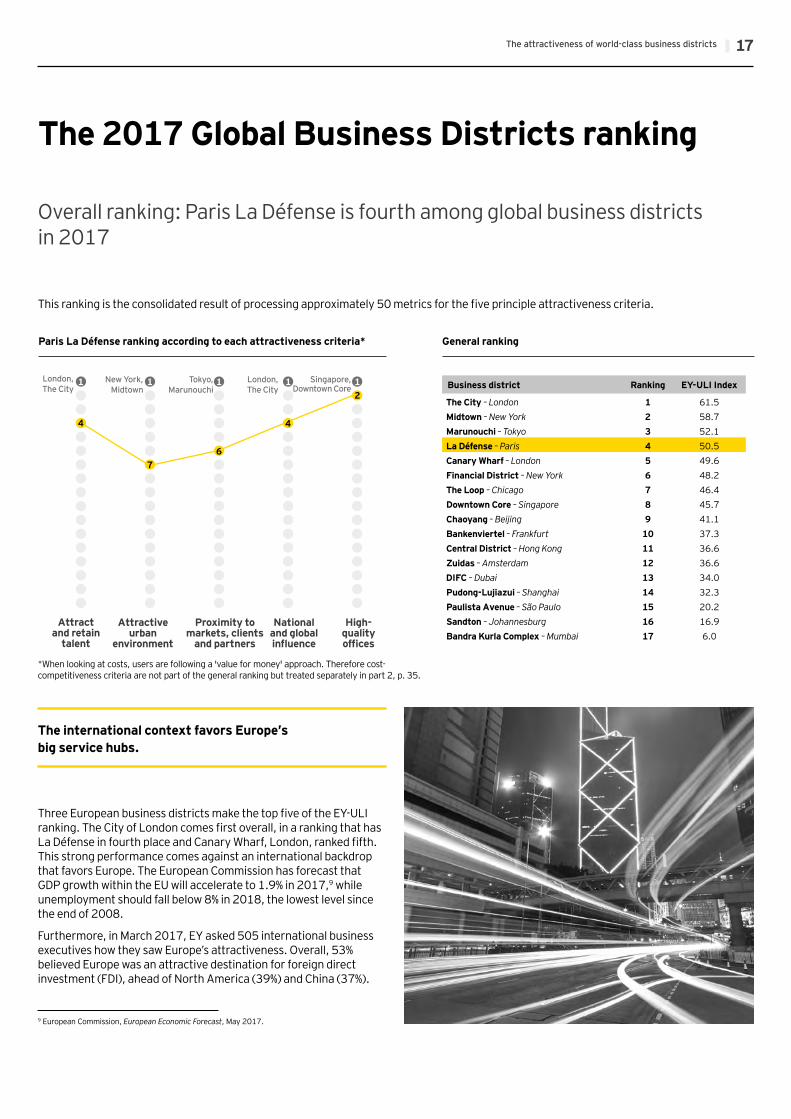
This ranking is the consolidated result of processing approximately 50 metrics for the five principle attractiveness criteria.
General ranking
Attract and retain
talent
Attractive urban
environment
Proximity to markets, clients
and partners
National and global influence
High- quality offices
Paris La Défense ranking according to each attractiveness criteria*
4
76
4
21 1 1 1 1
Three European business districts make the top five of the EY-ULI ranking. The City of London comes first overall, in a ranking that has La Défense in fourth place and Canary Wharf, London, ranked fifth. This strong performance comes against an international backdrop that favors Europe. The European Commission has forecast that GDP growth within the EU will accelerate to 1.9% in 2017,9 while unemployment should fall below 8% in 2018, the lowest level since the end of 2008.
Furthermore, in March 2017, EY asked 505 international business executives how they saw Europe’s attractiveness. Overall, 53% believed Europe was an attractive destination for foreign direct investment (FDI), ahead of North America (39%) and China (37%).
The international context favors Europe’s big service hubs.
9 European Commission, European Economic Forecast, May 2017.
*When looking at costs, users are following a 'value for money' approach. Therefore cost-competitiveness criteria are not part of the general ranking but treated separately in part 2, p. 35.
London, The City
Singapore, Downtown Core
Tokyo, Marunouchi
London, The City
New York, Midtown Business district Ranking EY-ULI Index
The City – London 1 61.5Midtown – New York 2 58.7Marunouchi – Tokyo 3 52.1La Défense – Paris 4 50.5Canary Wharf – London 5 49.6Financial District – New York 6 48.2The Loop – Chicago 7 46.4Downtown Core – Singapore 8 45.7Chaoyang – Beijing 9 41.1Bankenviertel – Frankfurt 10 37.3Central District – Hong Kong 11 36.6Zuidas – Amsterdam 12 36.6DIFC – Dubai 13 34.0Pudong-Lujiazui – Shanghai 14 32.3Paulista Avenue – São Paulo 15 20.2Sandton – Johannesburg 16 16.9Bandra Kurla Complex – Mumbai 17 6.0
A balanced performance across the different drivers: Paris La Défense takes fourth place behind The City of London, Midtown New York and Marunouchi, Tokyo. Paris La Défense does well in each of the five categories, except for the quality of its urban environment, where it falls to seventh place. Despite this strong performance, it fails to match The City and Midtown. The City systematically outperforms other business districts on the critical factor of talent availability (first compared with fourth for La Défense) and for its national and global influence (first compared with second for Midtown and fourth for La Défense).
A strong property development dynamic: La Défense benefits from a active property development scene, finishing second on this criteria in the overall ranking, ahead of London’s Canary Wharf and the Financial District of New York. One reason is that the Paris district has a dynamic policy for renewing its office towers together with substantial scope for growth.
The "Greater Paris" effect: the strong performance of La Défense is partly explained by its location within a dynamic metropolitan environment. For example, it forms part of a highly innovative community: Paris is awarded 2.41 patents for every 10,000 inhabitants, compared with 1.59 for New York and 0.93 for London. La Défense is also rich in opportunities: it is home to the headquarters of 27 Fortune 2016 Global 500 companies, well ahead of New York, which has 17, and London (16) — although Beijing outperforms them all with 57.
Within Europe, Paris La Défense is increasingly competitive with The City
Although it ranks among the top six on our five key attractiveness drivers, Paris La Défense has scope for improvement on a number of aspects. The most pressing is its relatively weak performance on the quality of its urban environment.
This raises issues about differing perspectives between users and those looking from outside. Overall, 90% of those who work in Paris La Défense consider it a good place to work.9 Efforts are under way to renovate the district and enhance activities and facilities. But some of the drawbacks are intrinsic, such as the limited availability of dining options, and others stem from wider perceptions of the quality of life available in Paris.
Nonetheless, Paris La Défense is exceptionally mixed use10: it is home to 40,000 residents (22% of mixed use) and, on this measure, ranks third behind São Paulo, where 29,000 residents account for 53% of usage, and Beijing, where 58,000 residents form 32% of users.
Finally, the ranking of Paris La Défense is also hampered by perceptions of France: it ranks 14th for corporation tax, 12th on political stability, 11th for being business-friendly, 10th for the quality of English spoken by its workforce and 9th for hiring and employee flexibility.
Paris La Défense comes out well, but has room to improve
9 BVA for Defacto, Baromètre salariés (Pay survey), 2015.10 Number of residents/number of workers.
18
Brexit: as the attractiveness of the UK declines, France and Paris emerge as more appealing locations
The launch of two-year Brexit negotiations in March 2017 has triggered an international contest to attract activities — especially financial services - that are likely to be relocated from London to other business districts in the EU.
Fourteen percent of international companies active in the UK that were questioned for EY’s special post-referendum European Attractiveness Survey 201711 expected to transfer all or part of their activities outside the UK.
Against a background of intense ongoing uncertainties around Brexit, EY has sought, researched and published many insights for business leaders and policy-makers:• London’s appeal has declined since the Brexit referendum.
Though international investors still consider London to be Europe’s most attractive location, its share of votes has slumped to 32% in 2017, from 52% in 2015.12 EY’s European Attractiveness Survey 2017 measures the fallout: the number of new FDI projects in the UK grew by just 7% in 2016, down from 20% in 2015. And that was before the process of businesses relocating activities from the UK to other places in the EU had begun. Many had yet to decide how best to respond to the UK’s planned exit from the EU, preferring to wait for a clearer vision of the future.
• France is in second place, behind Germany, in terms of its attractiveness for activities that are relocating from the UK, followed by the Netherlands and Ireland.13
• It is not only the financial sector that is expected to relocate some of its activities elsewhere in the EU.14 High-tech companies and small and medium-sized enterprises, along with financial services, are likely to be most affected by Brexit. But a considerable part of the industrial sector is also expected to be impacted. British companies that buy components from suppliers elsewhere in the EU will be obliged to review their value chains.
11 EY's European Attractiveness Survey, 2017.12 Ibid.13 Ibid.14 Ibid.
19The attractiveness of world-class business districts

Business district Ranking EY-ULI Index
The City – London 1 75.6Canary Wharf – London 2 69.0Midtown – New York 3 59.8La Défense – Paris 4 53.8Financial District – New York 5 51.2The Loop – Chicago 6 50.3Downtown Core – Singapore 7 47.5Zuidas – Amsterdam 8 45.9Marunouchi – Tokyo 9 44.6Central District – Hong Kong 10 40.1DIFC – Dubai 11 39.8Bankenviertel – Frankfurt 12 38.2Chaoyang – Beijing 13 30.2Pudong-Lujiazui – Shanghai 14 23.5Sandton – Johannesburg 15 18.6Paulista Avenue – São Paulo 16 17.8Bandra Kurla Complex – Mumbai 17 5.3
Factor 1: Capacity to attract and retain talent
Essential qualities√ Share of population with university degrees √ Quality of metropolitan transport system√ Proportion of metropolitan employment in
the business district√ Number of universities in the Times Higher
Education Top 200 ranking
Desirable qualities√ Number of students in the metropolis √ Proportion of international students in the metropolis √ National level of mastery of English √ Cost of living in the metropolis (especially housing)
Indicators are 2016 or most recently available figures.
Weighting of metrics
The attractiveness of world-class business districts20

The best performers on this factor are business districts in London, Paris, New York and Chicago, which offer a high proportion of workers with degree-level qualifications (56% in London, 47% in New York, 46% in Paris and 43% in Chicago).
London, New York and Paris are also ranked by our survey as having the best transport infrastructure in 2016, along with Frankfurt.
The top districts combine a highly qualified workforce with outstanding transport infrastructure
Paris La Défense: improving transport connectionsLa Défense has become France’s second-busiest domestic travel hub after the Paris city center transport interchange at Châtelet-les-Halles. Every day, 500,000 passengers pass through the rail and metro stations at La Défense. A combination of five rail, subway and tram lines, and an extensive bus network, make La Défense one of the best-served locations in Paris. A 2016 survey for Defacto found that 84% of workers found it easy to get to La Défense on weekdays.
Present and future projects will considerably improve transport infrastructure in the Île-de-France region, and La Défense will be a big beneficiary. An extension of Line E of the RER commuter rail service (EOLE) will enhance connections with West Paris. From 2022 onward, the journey time to Mantes-la-Jolie, in the western suburbs of Paris, will be slashed from 1 hour to just 35 minutes. This development will help to ease pressure on existing lines, especially the RER Line A. La Défense will also be served by a new subway route, Line 15. Two new stations, one each side of the Grande Arche building, will provide direct connections to the Palais des Congrès exhibition center, and the long-distance rail stations of St Lazare and, in particular, Gare du Nord, which has high-speed trains to London, Belgium, Luxembourg and the Netherlands.
In total, these developments will double the capacity of transport links to La Défense and provide a 30-minute connection to the Roissy-Charles de Gaulle airport, matching the connectivity of rival business districts.
The ranking looks across each metropolitan employment pool to assess the district’s capacity to attract and retain talent. Paris ranked fourth, behind London. We found that 46% of the workforce in the Île-de-France region have university degrees. That is below the level of Tokyo (59%) and London (56%), but ahead of Frankfurt (32%) and Amsterdam (42%).
Paris La Défense also benefits from the high concentration of students in Île-de-France (660,000 in 2016 against 380,000 in 2015 in Greater London), although London has more universities in the upper echelons of the Times Higher Education Top 200 ranking.
Relatively attractive living costs are also a plus for Paris, which is more affordable than London, New York or Hong Kong. Mercer ranked Hong Kong the world’s most expensive city for expatriates in 2016. New York ranked 11th and London 17th, while Paris, in 44th place, was much more affordable.
University challenge
Paris La Défense: upgrading the talent poolThough it already benefits from having a high proportion of graduates in its labor pool, the Île-de-France region is upgrading the quality of its workforce. The proportion of graduates rose by 5.5 percentage points between 2011 and 2015, the second-biggest increase after Singapore (6.7 points). The increase in education levels in the Paris region outpaced those in Tokyo (5.4 points), London (5.3 points) and New York (2.8 points). With a labor force comprising 46% graduates, the Paris region lags Tokyo (59%) and London (56%), but is closing on New York City (48%). Some 45,000 students study within the Paris La Défense district, including at the Paris Nanterre University.
21The attractiveness of world-class business districts
Business district Ranking EY-ULI Index
Midtown – New York 1 59.5
The Loop – Chicago 2 59.1
Downtown Core – Singapore 3 57.3
Bankenviertel – Frankfurt 4 50.6
The City – London 5 50.5
Financial District – New York 6 49.1
La Défense – Paris 7 47.3
Pudong-Lujiazui – Shanghai 8 47.2
Paulista Avenue – São Paulo 9 42.2
Zuidas – Amsterdam 10 42.1
Chaoyang – Beijing 11 41.1
DIFC – Dubai 12 39.7
Central District – Hong Kong 13 36.5
Marunouchi – Tokyo 14 32.2
Canary Wharf – London 15 27.8
Sandton – Johannesburg 16 20.8
Bandra Kurla Complex – Mumbai 17 3.1
Factor 2: Quality of urban environment
Essential qualities√ Ranking of metropolises by quality of life √ Usage diversity (ratio of business district residents
to workers) √ Amount of retail space in business district√ Range of cultural and leisure facilities in the
business district√ Proportion of green space in business district
Desirable qualities√ Ranking of metropolises by residents’ satisfaction
(a subjective measure) √ Air quality in the metropolis√ Number of restaurants per 10,000 workers in
the business district
Indicators are for 2016 or most recent available figures.
Weighting of metrics
The attractiveness of world-class business districts22
Although it has Europe’s biggest shopping center, the Quatre Temps, at its heart and a significant amount of residential accommodation (ranking fourth on this metric) Paris La Défense is ranked ninth overall for its urban environment. The district has made obvious efforts to improve its public spaces and introduce more green space and a better mix of services. Yet metrics show Paris La Défense still trails in the provision of services for its workforce. It offers only 8 restaurants per 10,000 workers, compared with 10 at Amsterdam Zuidas, 25 in London The City and more than 40 in the Financial District of New York or Shanghai’s Pudong-Lujiazui.
La Défense is also hampered by the relatively poor performance of its surrounding metropolitan area. Greater Paris is ranked eighth in the OECD Life Satisfaction Index and ninth for air quality, below other European and North American metropolises.
Looking ahead, the La Défense business district should benefit from its continued westward expansion toward the neighboring town of Nanterre. That will be helped by the opening during 2017 of the U Arena, which will be France’s biggest concert venue, with a capacity of 40,000 people. More housing, shops and restaurants are also being developed to improve both the quantity and quality of the available offer. The proportion of non-office buildings has already increased markedly, from just 13% in 2011 to 22% in 2015.
The urban environment of La Défense remains its Achilles' heel
Singapore’s Downtown Core leads on security and on square meters dedicated to retail, culture and leisure. Frankfurt’s Bankenviertel stands out for the high quality of life in the city and ready access to green spaces from the business district. New York Midtown and the Chicago Loop also offer large retail districts, suggesting a lively town center (450,000m² in Midtown and 570,000m² in the Loop).
The top business districts are underpinned by different strengths
Developing Paris La DéfenseThe development of Paris La Défense to the west, especially toward Nanterre, can help to improve its urban environment. Expanding the boundaries has already benefited its usage mix. The ratio of residents to employees increased by 9.7 percentage points between 2011 and 2016, while there was little change at rival centers: The City of London saw no relative rise in residents. Frankfurt Bankenviertel improved its residence percentage by just 0.1 point, and the Financial District of New York 0.6 points, while Midtown, minus 0.5 points, saw its residential diversity decline.
Paris La Défense can really only benefit from its westward extension if Greater Paris remains a pleasant place to live. Yet between 2012 and 2017, Paris fell nine places in the Quality of Living Ranking published by Mercer. That was the second-largest fall after Beijing, which slumped 10 places. Looking across the 17 global business districts, none climbed the ranking between 2012 and 2017. Only Frankfurt, Amsterdam, New York and Singapore maintained their quality of life. Across Europe and North America, mid-sized cities are gaining ground in the quality of life they offer relative to big cities. Yet Paris must not be left behind by its rivals, especially London, which only slipped two places between 2012 and 2017.
23The attractiveness of world-class business districts
Business district Ranking EY-ULI Index
Marunouchi – Tokyo 1 81.0
Midtown – New York 2 59.1
Chaoyang – Beijing 3 54.5
Financial District – New York 4 50.8
The City – London 5 49.0
La Défense – Paris 6 45.3
The Loop – Chicago 7 44.0
Canary Wharf – London 8 42.7
Downtown Core – Singapore 9 39.4
Central District – Hong Kong 10 35.4
Bankenviertel – Frankfurt 11 34.8
Pudong-Lujiazui – Shanghai 12 30.8
Zuidas – Amsterdam 13 28.2
DIFC – Dubai 14 23.0
Paulista Avenue – São Paulo 15 14.9
Sandton – Johannesburg 16 14.4
Bandra Kurla Complex – Mumbai 17 6.5
Factor 3: Proximity to markets, clients and partners
Essential qualities√ National business climate index√ GDP of metropolis √ Number of Fortune 500 companies headquartered
in the business district√ Share of metropolis GDP invested in R&D
Desirable qualities√ Index of national political stability√ Number of Fortune 500 companies headquartered
in the metropolis√ Number of FDIs in sales and marketing projects
in the metropolis √ Number of patent applications per 10,000
metropolitan residents
Metrics are 2016 or most recent available figures.
Weighting of metrics
The attractiveness of world-class business districts24
London’s business districts are highly successful in attracting FDI, but their innovation ecosystem is weaker than that of the Paris region.
While London ranks 14th for the share of GDP devoted to R&D, Île-de-France ranks 5th behind Tokyo, the Chinese metropolises and Chicago. It also benefits from the presence of 27 Fortune 2016 Global 500 company headquarters in Greater Paris, compared with 57 in Beijing, 17 in New York and 16 in London.
In 2015, however, North American business districts benefited from greater political stability than The City, Canary Wharf and La Défense. Political stability in the US was better than in the UK or France according to the World Bank Index. However, recent developments in these three countries could lead to major changes in future stability scores.
A tight race among the business districts of New York, Paris and London
Tokyo is ranked first on this factor, thanks to the size of its local market (it has the biggest metropolitan GDP), a dense concentration of Fortune 2016 Global 500 company headquarters and a strong performance on innovation. The city of Tokyo is home to 37 Fortune 2016 Global 500 companies, outstripped only by Beijing (57). Tokyo also outperforms on patent applications, with 10 filings per 10,000 people, beating Paris, which placed second among the 17 centers with 2.4 applications per 10,000 inhabitants.
Marunouchi, Tokyo, benefits from a concentration of people and businesses
Paris La Défense: building business momentumParis La Défense looks set to improve its performance on this factor in the years ahead. France’s appeal as a business location recovered sharply in 2016, and the improvement was especially marked in Île-de-France. The number of new FDI projects in the Paris region surged 55% between 2012 and 2016, against 45% for Greater London. Île-de-France is Europe’s second most successful region for attracting FDI, after Greater London. Its performance accelerated strongly between 2015, when it secured 159 projects, and 2016, when it attracted 270.
25The attractiveness of world-class business districts
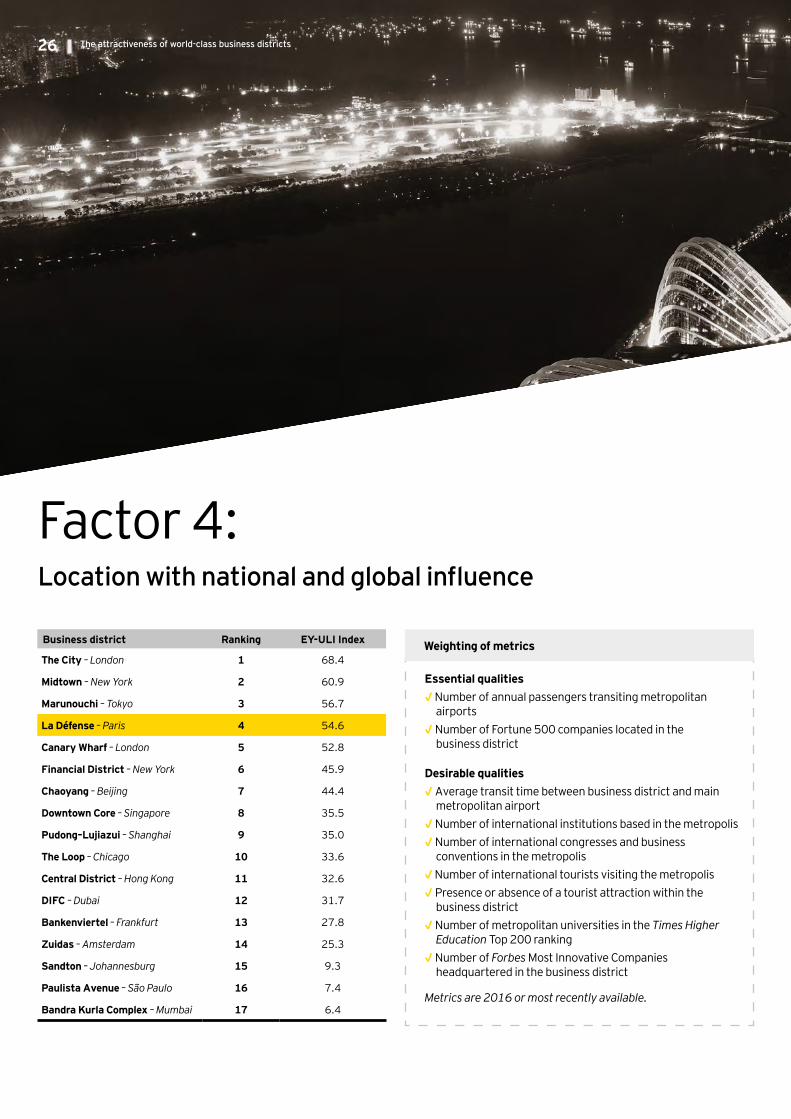
Business district Ranking EY-ULI Index
The City – London 1 68.4
Midtown – New York 2 60.9
Marunouchi – Tokyo 3 56.7
La Défense – Paris 4 54.6
Canary Wharf – London 5 52.8
Financial District – New York 6 45.9
Chaoyang – Beijing 7 44.4
Downtown Core – Singapore 8 35.5
Pudong–Lujiazui – Shanghai 9 35.0
The Loop – Chicago 10 33.6
Central District – Hong Kong 11 32.6
DIFC – Dubai 12 31.7
Bankenviertel – Frankfurt 13 27.8
Zuidas – Amsterdam 14 25.3
Sandton – Johannesburg 15 9.3
Paulista Avenue – São Paulo 16 7.4
Bandra Kurla Complex – Mumbai 17 6.4
Factor 4: Location with national and global influence
Essential qualities√ Number of annual passengers transiting metropolitan
airports√ Number of Fortune 500 companies located in the
business district
Desirable qualities√ Average transit time between business district and main
metropolitan airport √ Number of international institutions based in the metropolis √ Number of international congresses and business
conventions in the metropolis √ Number of international tourists visiting the metropolis√ Presence or absence of a tourist attraction within the
business district √ Number of metropolitan universities in the Times Higher
Education Top 200 ranking√ Number of Forbes Most Innovative Companies
headquartered in the business district
Metrics are 2016 or most recently available.
Weighting of metrics
The attractiveness of world-class business districts26
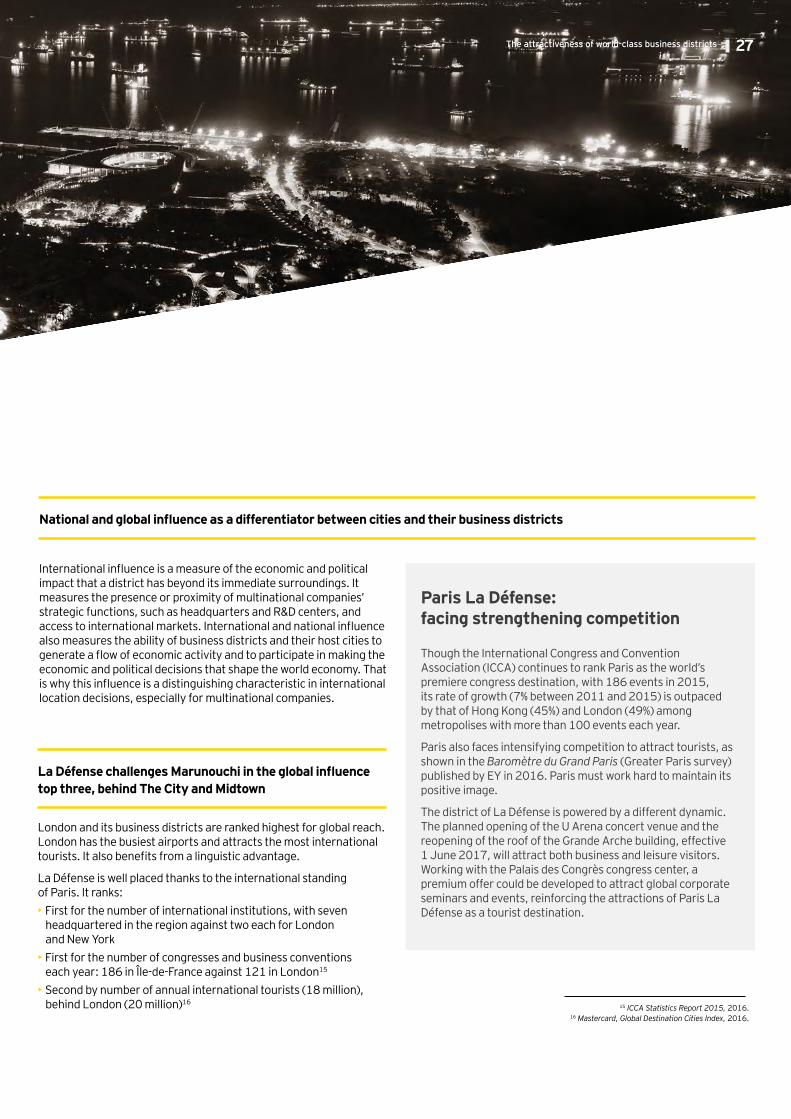
London and its business districts are ranked highest for global reach. London has the busiest airports and attracts the most international tourists. It also benefits from a linguistic advantage.
La Défense is well placed thanks to the international standing of Paris. It ranks:• First for the number of international institutions, with seven
headquartered in the region against two each for London and New York
• First for the number of congresses and business conventions each year: 186 in Île-de-France against 121 in London15
• Second by number of annual international tourists (18 million), behind London (20 million)16
International influence is a measure of the economic and political impact that a district has beyond its immediate surroundings. It measures the presence or proximity of multinational companies’ strategic functions, such as headquarters and R&D centers, and access to international markets. International and national influence also measures the ability of business districts and their host cities to generate a flow of economic activity and to participate in making the economic and political decisions that shape the world economy. That is why this influence is a distinguishing characteristic in international location decisions, especially for multinational companies.
La Défense challenges Marunouchi in the global influence top three, behind The City and Midtown
National and global influence as a differentiator between cities and their business districts
Paris La Défense: facing strengthening competition
Though the International Congress and Convention Association (ICCA) continues to rank Paris as the world’s premiere congress destination, with 186 events in 2015, its rate of growth (7% between 2011 and 2015) is outpaced by that of Hong Kong (45%) and London (49%) among metropolises with more than 100 events each year.
Paris also faces intensifying competition to attract tourists, as shown in the Baromètre du Grand Paris (Greater Paris survey) published by EY in 2016. Paris must work hard to maintain its positive image.
The district of La Défense is powered by a different dynamic. The planned opening of the U Arena concert venue and the reopening of the roof of the Grande Arche building, effective 1 June 2017, will attract both business and leisure visitors. Working with the Palais des Congrès congress center, a premium offer could be developed to attract global corporate seminars and events, reinforcing the attractions of Paris La Défense as a tourist destination.
15 ICCA Statistics Report 2015, 2016.16 Mastercard, Global Destination Cities Index, 2016.
27The attractiveness of world-class business districts
The attractiveness of world-class business districts28
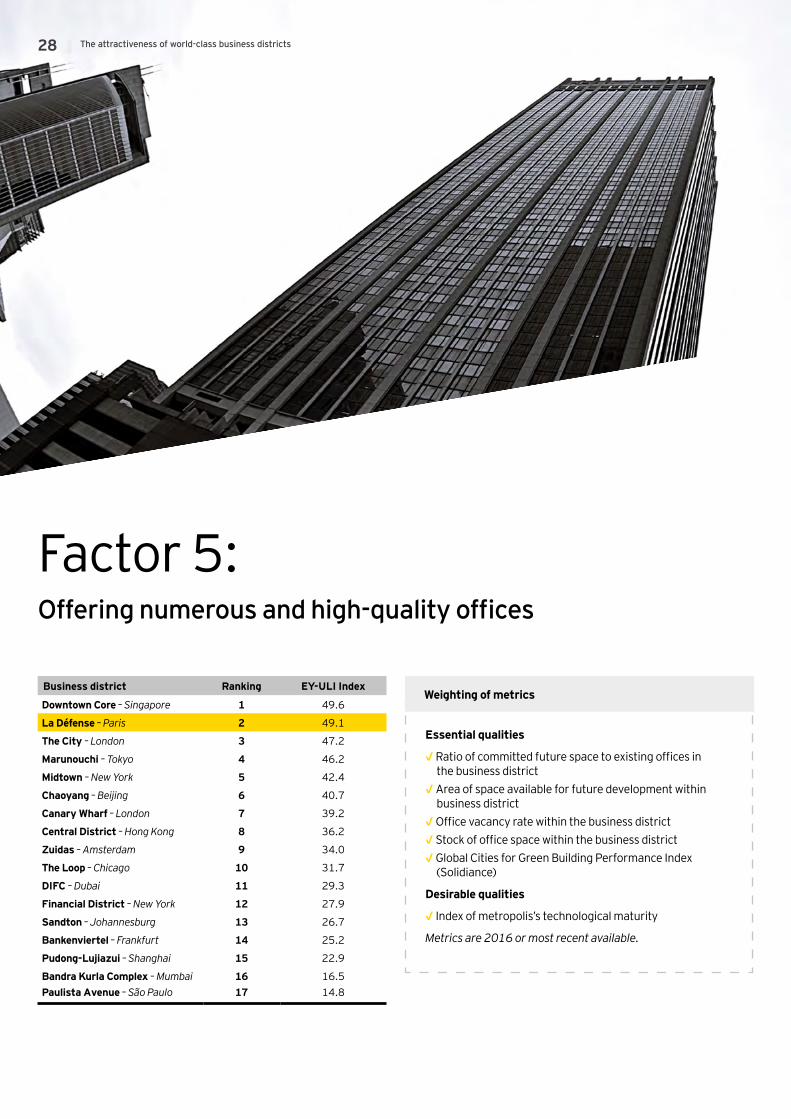
Business district Ranking EY-ULI Index
Downtown Core – Singapore 1 49.6
La Défense – Paris 2 49.1
The City – London 3 47.2
Marunouchi – Tokyo 4 46.2
Midtown – New York 5 42.4
Chaoyang – Beijing 6 40.7
Canary Wharf – London 7 39.2
Central District – Hong Kong 8 36.2
Zuidas – Amsterdam 9 34.0
The Loop – Chicago 10 31.7
DIFC – Dubai 11 29.3
Financial District – New York 12 27.9
Sandton – Johannesburg 13 26.7
Bankenviertel – Frankfurt 14 25.2
Pudong-Lujiazui – Shanghai 15 22.9
Bandra Kurla Complex – Mumbai 16 16.5Paulista Avenue – São Paulo 17 14.8
Factor 5: Offering numerous and high-quality offices
Essential qualities
√ Ratio of committed future space to existing offices in the business district
√ Area of space available for future development withinbusiness district
√ Office vacancy rate within the business district√ Stock of office space within the business district √ Global Cities for Green Building Performance Index
(Solidiance)
Desirable qualities
√ Index of metropolis’s technological maturity
Metrics are 2016 or most recent available.
Weighting of metrics
29The attractiveness of world-class business districts
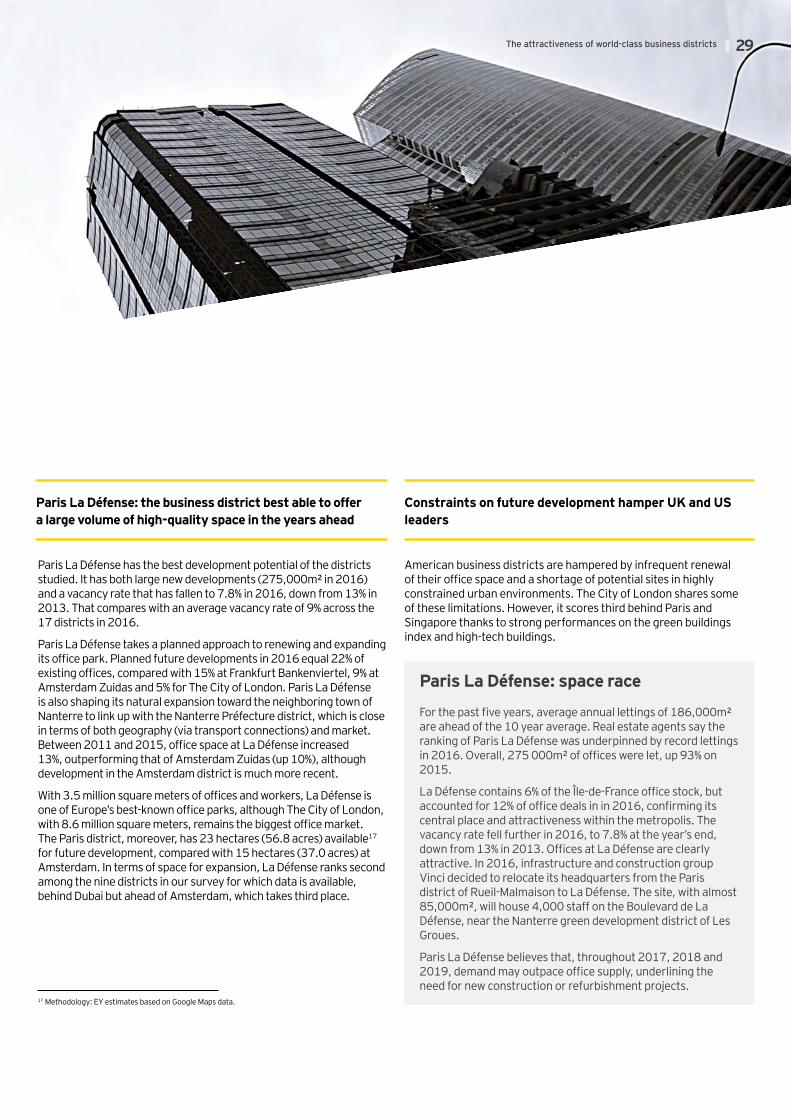
Paris La Défense: space race
For the past five years, average annual lettings of 186,000m² are ahead of the 10 year average. Real estate agents say the ranking of Paris La Défense was underpinned by record lettings in 2016. Overall, 275 000m² of offices were let, up 93% on 2015.
La Défense contains 6% of the Île-de-France office stock, but accounted for 12% of office deals in in 2016, confirming its central place and attractiveness within the metropolis. The vacancy rate fell further in 2016, to 7.8% at the year’s end, down from 13% in 2013. Offices at La Défense are clearly attractive. In 2016, infrastructure and construction group Vinci decided to relocate its headquarters from the Paris district of Rueil-Malmaison to La Défense. The site, with almost 85,000m², will house 4,000 staff on the Boulevard de La Défense, near the Nanterre green development district of Les Groues.
Paris La Défense believes that, throughout 2017, 2018 and 2019, demand may outpace office supply, underlining the need for new construction or refurbishment projects.
Paris La Défense has the best development potential of the districts studied. It has both large new developments (275,000m² in 2016) and a vacancy rate that has fallen to 7.8% in 2016, down from 13% in 2013. That compares with an average vacancy rate of 9% across the 17 districts in 2016.
Paris La Défense takes a planned approach to renewing and expanding its office park. Planned future developments in 2016 equal 22% of existing offices, compared with 15% at Frankfurt Bankenviertel, 9% at Amsterdam Zuidas and 5% for The City of London. Paris La Défense is also shaping its natural expansion toward the neighboring town of Nanterre to link up with the Nanterre Préfecture district, which is close in terms of both geography (via transport connections) and market. Between 2011 and 2015, office space at La Défense increased 13%, outperforming that of Amsterdam Zuidas (up 10%), although development in the Amsterdam district is much more recent.
With 3.5 million square meters of offices and workers, La Défense is one of Europe’s best-known office parks, although The City of London, with 8.6 million square meters, remains the biggest office market. The Paris district, moreover, has 23 hectares (56.8 acres) available17 for future development, compared with 15 hectares (37.0 acres) at Amsterdam. In terms of space for expansion, La Défense ranks second among the nine districts in our survey for which data is available, behind Dubai but ahead of Amsterdam, which takes third place.
American business districts are hampered by infrequent renewal of their office space and a shortage of potential sites in highly constrained urban environments. The City of London shares some of these limitations. However, it scores third behind Paris and Singapore thanks to strong performances on the green buildings index and high-tech buildings.
Paris La Défense: the business district best able to offer a large volume of high-quality space in the years ahead
Constraints on future development hamper UK and US leaders
17 Methodology: EY estimates based on Google Maps data.

Five trends shaping the future of global business districts
Part 2:
31The attractiveness of world-class business districts
Five trends shaping the future of global business districts
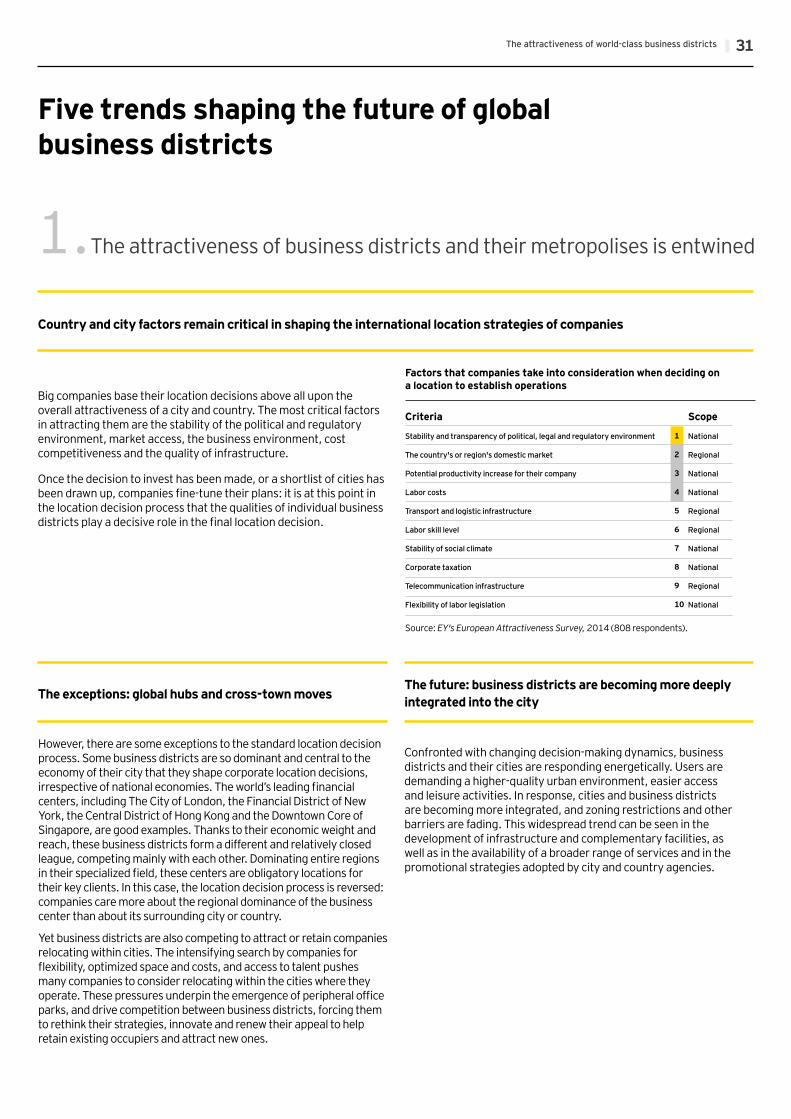
The attractiveness of business districts and their metropolises is entwined 1.Country and city factors remain critical in shaping the international location strategies of companies
Big companies base their location decisions above all upon the overall attractiveness of a city and country. The most critical factors in attracting them are the stability of the political and regulatory environment, market access, the business environment, cost competitiveness and the quality of infrastructure.
Once the decision to invest has been made, or a shortlist of cities has been drawn up, companies fine-tune their plans: it is at this point in the location decision process that the qualities of individual business districts play a decisive role in the final location decision.
Factors that companies take into consideration when deciding on a location to establish operations
The exceptions: global hubs and cross-town moves The future: business districts are becoming more deeply integrated into the city
However, there are some exceptions to the standard location decision process. Some business districts are so dominant and central to the economy of their city that they shape corporate location decisions, irrespective of national economies. The world’s leading financial centers, including The City of London, the Financial District of New York, the Central District of Hong Kong and the Downtown Core of Singapore, are good examples. Thanks to their economic weight and reach, these business districts form a different and relatively closed league, competing mainly with each other. Dominating entire regions in their specialized field, these centers are obligatory locations for their key clients. In this case, the location decision process is reversed: companies care more about the regional dominance of the business center than about its surrounding city or country.
Yet business districts are also competing to attract or retain companies relocating within cities. The intensifying search by companies for flexibility, optimized space and costs, and access to talent pushes many companies to consider relocating within the cities where they operate. These pressures underpin the emergence of peripheral office parks, and drive competition between business districts, forcing them to rethink their strategies, innovate and renew their appeal to help retain existing occupiers and attract new ones.
Confronted with changing decision-making dynamics, business districts and their cities are responding energetically. Users are demanding a higher-quality urban environment, easier access and leisure activities. In response, cities and business districts are becoming more integrated, and zoning restrictions and other barriers are fading. This widespread trend can be seen in the development of infrastructure and complementary facilities, as well as in the availability of a broader range of services and in the promotional strategies adopted by city and country agencies.
Criteria
Stability and transparency of political, legal and regulatory environment
The country's or region's domestic market
Potential productivity increase for their company
Labor costs
Transport and logistic infrastructure
Labor skill level
Stability of social climate
Corporate taxation
Telecommunication infrastructure
Flexibility of labor legislation
Scope
National
Regional
National
National
Regional
Regional
National
National
Regional
National
1
2
3
4
5
6
7
8
9
10
Source: EY's European Attractiveness Survey, 2014 (808 respondents).
The attractiveness of world-class business districts32
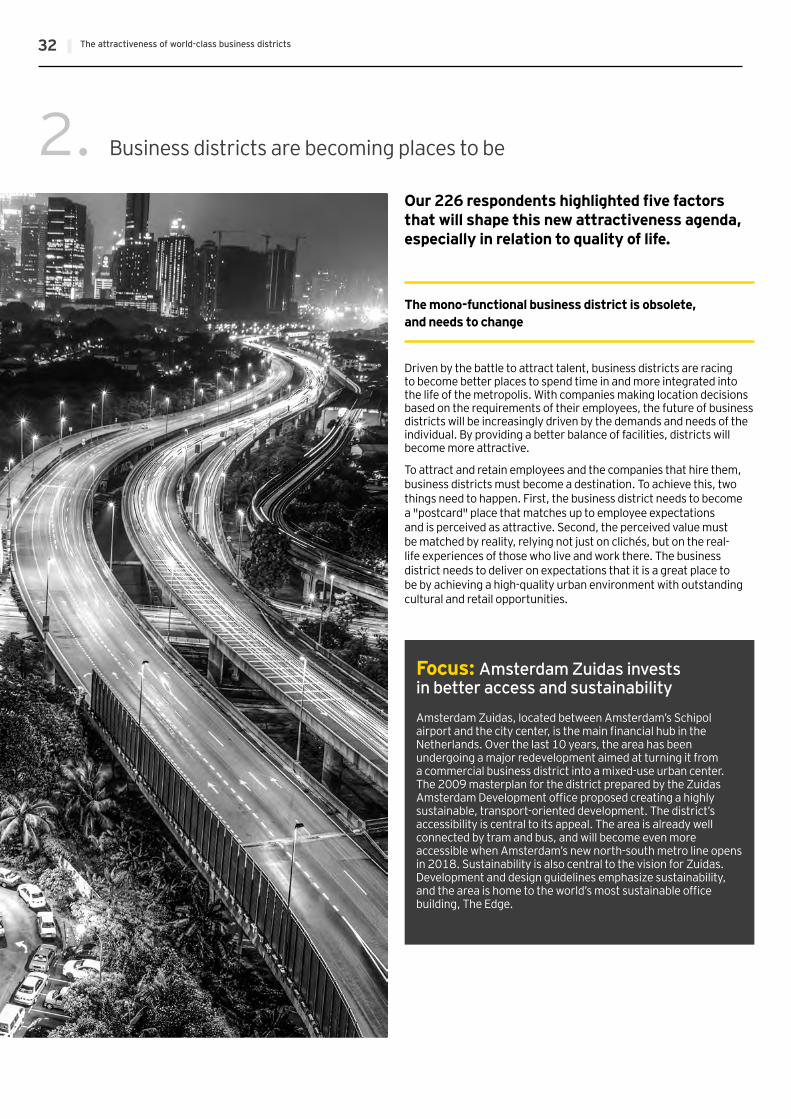
Business districts are becoming places to be2.
The mono-functional business district is obsolete, and needs to change
Driven by the battle to attract talent, business districts are racing to become better places to spend time in and more integrated into the life of the metropolis. With companies making location decisions based on the requirements of their employees, the future of business districts will be increasingly driven by the demands and needs of the individual. By providing a better balance of facilities, districts will become more attractive.
To attract and retain employees and the companies that hire them, business districts must become a destination. To achieve this, two things need to happen. First, the business district needs to become a "postcard" place that matches up to employee expectations and is perceived as attractive. Second, the perceived value must be matched by reality, relying not just on clichés, but on the real-life experiences of those who live and work there. The business district needs to deliver on expectations that it is a great place to be by achieving a high-quality urban environment with outstanding cultural and retail opportunities.
Focus: Amsterdam Zuidas invests in better access and sustainability
Amsterdam Zuidas, located between Amsterdam’s Schipol airport and the city center, is the main financial hub in the Netherlands. Over the last 10 years, the area has been undergoing a major redevelopment aimed at turning it from a commercial business district into a mixed-use urban center. The 2009 masterplan for the district prepared by the Zuidas Amsterdam Development office proposed creating a highly sustainable, transport-oriented development. The district’s accessibility is central to its appeal. The area is already well connected by tram and bus, and will become even more accessible when Amsterdam’s new north-south metro line opens in 2018. Sustainability is also central to the vision for Zuidas. Development and design guidelines emphasize sustainability, and the area is home to the world’s most sustainable office building, The Edge.
Our 226 respondents highlighted five factors that will shape this new attractiveness agenda, especially in relation to quality of life.
33The attractiveness of world-class business districts
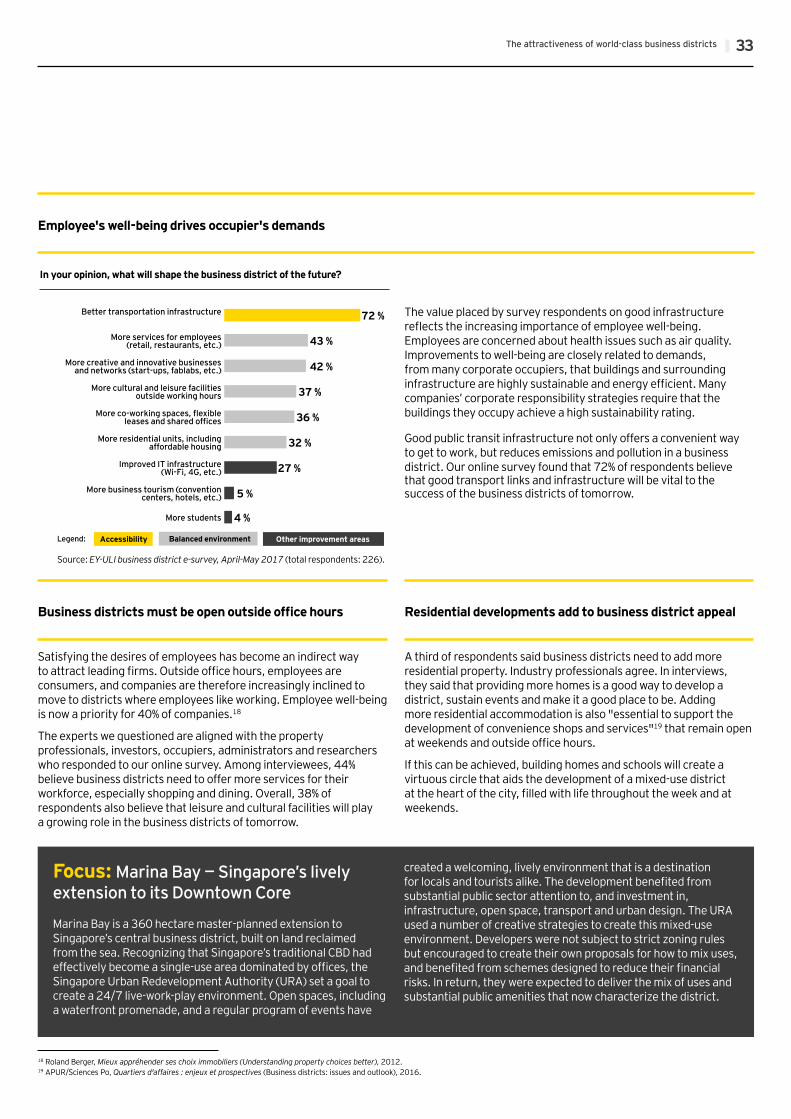
In your opinion, what will shape the business district of the future?
Source: EY-ULI business district e-survey, April-May 2017 (total respondents: 226).
Better transportation infrastructure 72 %
More services for employees (retail, restaurants, etc.) 43 %
More creative and innovative businesses and networks (start-ups, fablabs, etc.) 42 %
More cultural and leisure facilities outside working hours 37 %
More co-working spaces, flexible leases and shared offices 36 %
More residential units, including affordable housing 32 %
Improved IT infrastructure (Wi-Fi, 4G, etc.) 27 %
More business tourism (convention centers, hotels, etc.) 5 %
More students 4 %
Accessibility Balanced environment Other improvement areasLegend:
Business districts must be open outside office hours
Employee's well-being drives occupier's demands
Satisfying the desires of employees has become an indirect way to attract leading firms. Outside office hours, employees are consumers, and companies are therefore increasingly inclined to move to districts where employees like working. Employee well-being is now a priority for 40% of companies.18
The experts we questioned are aligned with the property professionals, investors, occupiers, administrators and researchers who responded to our online survey. Among interviewees, 44% believe business districts need to offer more services for their workforce, especially shopping and dining. Overall, 38% of respondents also believe that leisure and cultural facilities will play a growing role in the business districts of tomorrow.
Focus: Marina Bay — Singapore’s livelyextension to its Downtown Core
Marina Bay is a 360 hectare master-planned extension to Singapore’s central business district, built on land reclaimed from the sea. Recognizing that Singapore’s traditional CBD had effectively become a single-use area dominated by offices, the Singapore Urban Redevelopment Authority (URA) set a goal to create a 24/7 live-work-play environment. Open spaces, including a waterfront promenade, and a regular program of events have
created a welcoming, lively environment that is a destination for locals and tourists alike. The development benefited from substantial public sector attention to, and investment in, infrastructure, open space, transport and urban design. The URA used a number of creative strategies to create this mixed-use environment. Developers were not subject to strict zoning rules but encouraged to create their own proposals for how to mix uses, and benefited from schemes designed to reduce their financial risks. In return, they were expected to deliver the mix of uses and substantial public amenities that now characterize the district.
Residential developments add to business district appeal
A third of respondents said business districts need to add more residential property. Industry professionals agree. In interviews, they said that providing more homes is a good way to develop a district, sustain events and make it a good place to be. Adding more residential accommodation is also "essential to support the development of convenience shops and services"19 that remain open at weekends and outside office hours.
If this can be achieved, building homes and schools will create a virtuous circle that aids the development of a mixed-use district at the heart of the city, filled with life throughout the week and at weekends.
18 Roland Berger, Mieux appréhender ses choix immobiliers (Understanding property choices better), 2012.19 APUR/Sciences Po, Quartiers d'affaires : enjeux et prospectives (Business districts: issues and outlook), 2016.
The value placed by survey respondents on good infrastructure reflects the increasing importance of employee well-being. Employees are concerned about health issues such as air quality. Improvements to well-being are closely related to demands, from many corporate occupiers, that buildings and surrounding infrastructure are highly sustainable and energy efficient. Many companies’ corporate responsibility strategies require that the buildings they occupy achieve a high sustainability rating.
Good public transit infrastructure not only offers a convenient way to get to work, but reduces emissions and pollution in a business district. Our online survey found that 72% of respondents believe that good transport links and infrastructure will be vital to the success of the business districts of tomorrow.
The attractiveness of world-class business districts34
The search for greater workplace flexibility coincides with profound shifts in the way we work and consume. Young people have very different expectations of their workplace, as confirmed by a survey for the 2015 EY-LinkedIn report La révolution des métiers (Revolution at work) and the work of the Revolution@Work forum organized by Defacto in December 2016 at Paris La Défense. New ways of working are changing the ways companies choose their locations.
Within buildings, interior fit-outs are becoming as varied as companies. Walls are being replaced by moveable partitions. Open-plan offices intended to aid collaborative working are giving way to more varied workspaces conceived to encourage creativity. Business districts no longer offer just offices, but rather workplaces that can reflect the management culture of a business.
Shared spaces are becoming more important, whether they are rest areas, shared meeting rooms or collaborative workspaces integrated with rest areas. These spaces enable employees from different firms to relax and collaborate. This trend looks set to continue: our interviewees expect collaborative workspaces to triple within five years.
The changing use of office space coincides with a profound transformation in the public spaces of business districts. Once seen as uneconomic, because it could not be rented and does not generate revenue, public space has become the key to increasing a district’s value. This is reflected in increased attention paid to green space, walkways and street furniture. These changes aim to improve the quality of life of occupiers’ employees.
Focus: Paris La Défense, committed to workplace innovation Paris La Défense is already exploring the factors that will shape the offices, and business districts, of the future. On 8 and 9 December 2016, Defacto brought together 2,000 corporate executives, human resources directors, real estate advisors, start-up experts and researchers from around the world to discuss office innovation and review developments in the world’s international business districts.
Some new projects are already emerging from this innovative thinking about property and public spaces. One is OXYGEN, a co-working space that opened at the beginning of 2016. Another is the Alternatif project to convert the Villon car park, previously dedicated to the Île-de-France and Majunga buildings, into a mutlifunctional seminar and concert venue. A new co-working space, the biggest in Paris La Défense, will be opened by Nextdoor within the Tour Cœur Défense in 2017, offering more than 8,000m² of space.
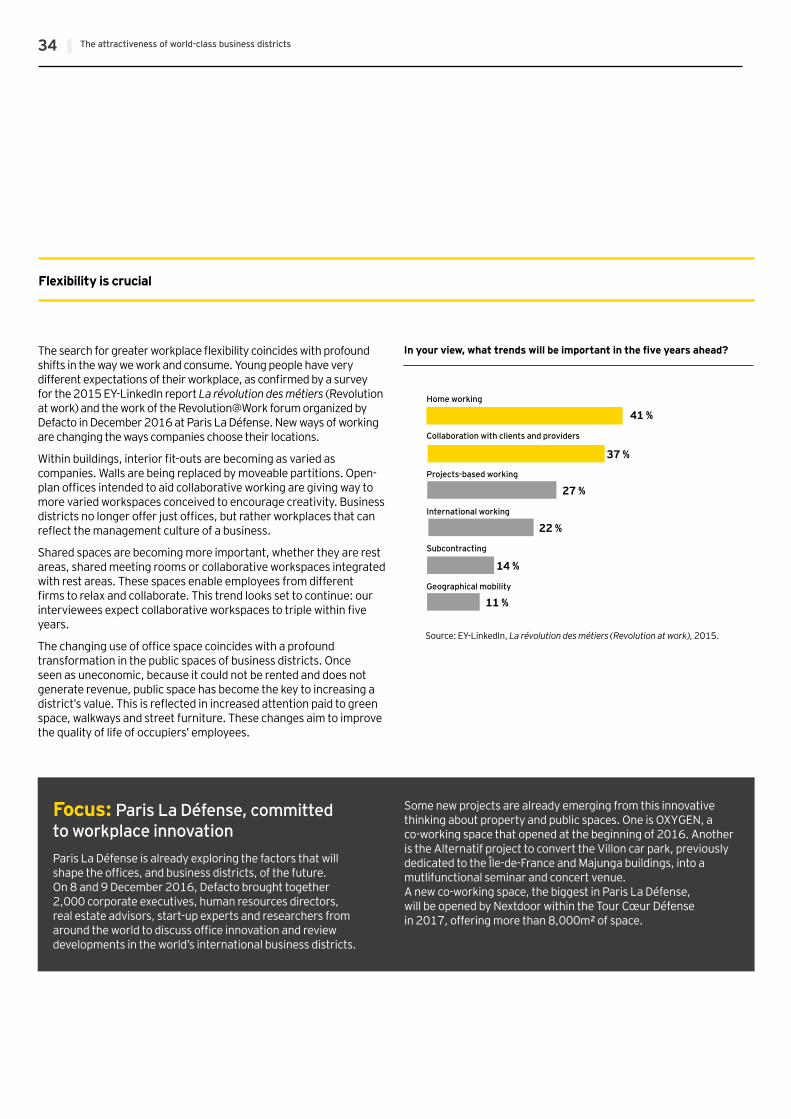
In your view, what trends will be important in the five years ahead?
11 %Geographical mobility
14 %
Subcontracting
22 %International working
27 %Projects-based working
37 %
Collaboration with clients and providers
41 %Home working
Source: EY-LinkedIn, La révolution des métiers (Revolution at work), 2015.
Flexibility is crucial
35The attractiveness of world-class business districts
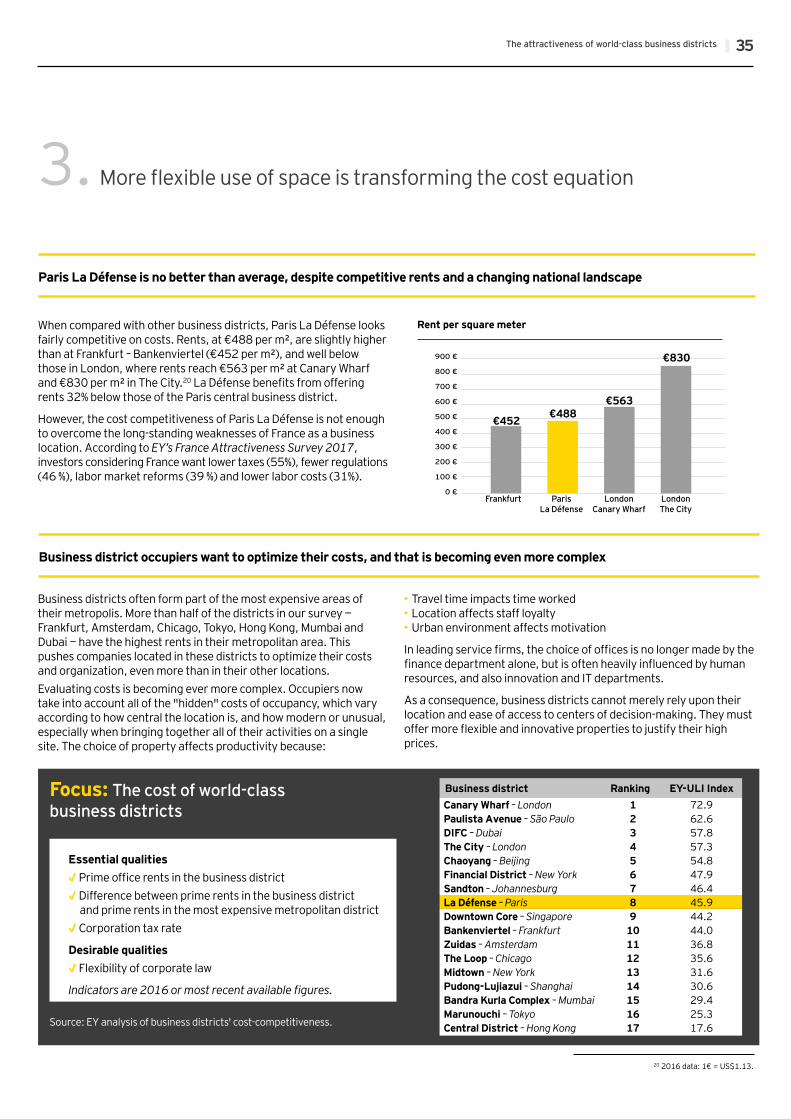
Focus: The cost of world-class business districts
Paris La Défense is no better than average, despite competitive rents and a changing national landscape
Business district occupiers want to optimize their costs, and that is becoming even more complex
Business district Ranking EY-ULI IndexCanary Wharf – London 1 72.9Paulista Avenue – São Paulo 2 62.6DIFC – Dubai 3 57.8The City – London 4 57.3Chaoyang – Beijing 5 54.8Financial District – New York 6 47.9Sandton – Johannesburg 7 46.4La Défense – Paris 8 45.9Downtown Core – Singapore 9 44.2Bankenviertel – Frankfurt 10 44.0Zuidas – Amsterdam 11 36.8The Loop – Chicago 12 35.6Midtown – New York 13 31.6Pudong-Lujiazui – Shanghai 14 30.6Bandra Kurla Complex – Mumbai 15 29.4Marunouchi – Tokyo 16 25.3Central District – Hong Kong 17 17.6
When compared with other business districts, Paris La Défense looks fairly competitive on costs. Rents, at €488 per m², are slightly higher than at Frankfurt – Bankenviertel (€452 per m²), and well below those in London, where rents reach €563 per m² at Canary Wharf and €830 per m² in The City.20 La Défense benefits from offering rents 32% below those of the Paris central business district.
However, the cost competitiveness of Paris La Défense is not enough to overcome the long-standing weaknesses of France as a business location. According to EY’s France Attractiveness Survey 2017, investors considering France want lower taxes (55%), fewer regulations (46 %), labor market reforms (39 %) and lower labor costs (31%).
Rent per square meter
€452 €488€563
€830
Frankfurt Paris La Défense
London Canary Wharf
London The City
Business districts often form part of the most expensive areas of their metropolis. More than half of the districts in our survey — Frankfurt, Amsterdam, Chicago, Tokyo, Hong Kong, Mumbai and Dubai — have the highest rents in their metropolitan area. This pushes companies located in these districts to optimize their costs and organization, even more than in their other locations. Evaluating costs is becoming ever more complex. Occupiers now take into account all of the "hidden" costs of occupancy, which vary according to how central the location is, and how modern or unusual, especially when bringing together all of their activities on a single site. The choice of property affects productivity because:
• Travel time impacts time worked• Location affects staff loyalty• Urban environment affects motivation
In leading service firms, the choice of offices is no longer made by the finance department alone, but is often heavily influenced by human resources, and also innovation and IT departments.
As a consequence, business districts cannot merely rely upon their location and ease of access to centers of decision-making. They must offer more flexible and innovative properties to justify their high prices.
20 2016 data: 1€ = US$1.13.
More flexible use of space is transforming the cost equation3.
Essential qualities√ Prime office rents in the business district√ Difference between prime rents in the business district
and prime rents in the most expensive metropolitan district √ Corporation tax rate
Desirable qualities√ Flexibility of corporate law
Indicators are 2016 or most recent available figures.
Source: EY analysis of business districts' cost-competitiveness.
The attractiveness of world-class business districts36
Looking ahead, experts do not foresee any radical shift in the business district client base. Big companies and high value-added activities that need large amounts of office space, historically the main occupiers, will
continue to dominate. Finance, banking, audit, consultancy and insurance will likely remain the main tenants.21 High rents will continue to discourage other activities from moving in.
The core market for business districts is unchanged: big companies and high value-added activities
Business districts need to attract start-ups, too
Focus: In London, The City is seeking to diversify by creating a technology innovation ecosystem While often seen as a hub of large companies, The City of London is in fact highly diverse. More than 98% of City tenants are small to medium-sized businesses.22 The local government for The City, the Corporation of London, recently launched a strategy to support this diverse ecosystem of businesses, and attract and retain digital businesses in particular.23 Their vision is a business district where small start-ups work on creating the products demanded by larger corporate tenants, from FinTech to artificial intelligence. One action The City is taking to achieve this is welcoming and encouraging the development of flexible workspaces. London’s co-working office market is already the largest in the world, and continues to grow. Flexible workspace in London as a whole grew from 9% of the market in 2015 to 16% in 2016.24 To complement the demand for flexibility and co-working, The City is also prioritizing placemaking, enlivening existing open spaces by using them to host events, particularly outside traditional office hours and prioritizing a greater diversity of retail offerings.
Business districts cannot afford to ignore start-ups, because their presence is becoming an effective way to attract big companies that are constantly seeking new sources of growth and innovation. The presence of start-ups also demonstrates the ability of a business district to innovate and enhances its image.
Attracting start-ups should be a priority for all business districts: 42% of experts surveyed believe start-ups are critical to the future development of business districts. However, property professionals and occupiers alike do not yet see much of a trend for start-ups
to move in. Experts interviewed for this research believe business districts need to adapt their culture to that of start-up founders and employees. That means offering not just more affordable but appropriate workspaces, with more flexible leases and a more attractive working environment.
Where possible, business districts should provide less standardized refurbished buildings, which are clearly distinct from Class A offices.
Business districts are opening up to start-ups4.
21 APUR/Sciences Po, Quartiers d’affaires : enjeux et prospective (Business districts: issues and outlook), 2016.22 City of London, Introducing the Original Co-Working Space, March 2017.23 City of London Corporation and City Property Association, Tech x The City, March 2017.24 The Instant Group, Global Cities Report, The flexible workspace market review, 2017.
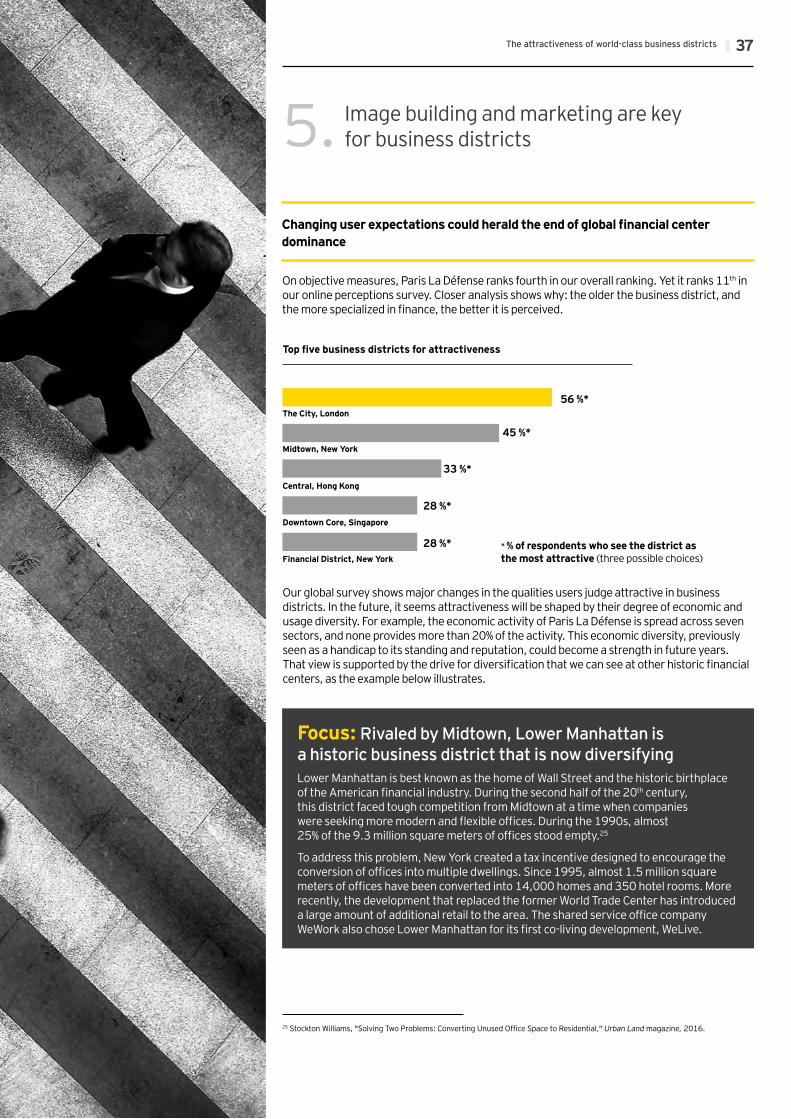
37The attractiveness of world-class business districts
Image building and marketing are key for business districts
Changing user expectations could herald the end of global financial center dominance
On objective measures, Paris La Défense ranks fourth in our overall ranking. Yet it ranks 11th in our online perceptions survey. Closer analysis shows why: the older the business district, and the more specialized in finance, the better it is perceived.
Focus: Rivaled by Midtown, Lower Manhattan is a historic business district that is now diversifyingLower Manhattan is best known as the home of Wall Street and the historic birthplace of the American financial industry. During the second half of the 20th century, this district faced tough competition from Midtown at a time when companies were seeking more modern and flexible offices. During the 1990s, almost 25% of the 9.3 million square meters of offices stood empty.25
To address this problem, New York created a tax incentive designed to encourage the conversion of offices into multiple dwellings. Since 1995, almost 1.5 million square meters of offices have been converted into 14,000 homes and 350 hotel rooms. More recently, the development that replaced the former World Trade Center has introduced a large amount of additional retail to the area. The shared service office company WeWork also chose Lower Manhattan for its first co-living development, WeLive.
5.
25 Stockton Williams, "Solving Two Problems: Converting Unused Office Space to Residential," Urban Land magazine, 2016.
Top five business districts for attractiveness
56 %*The City, London
45 %*Midtown, New York
28 %*Financial District, New York
* % of respondents who see the district as the most attractive (three possible choices)
33 %*Central, Hong Kong
28 %*Downtown Core, Singapore
Our global survey shows major changes in the qualities users judge attractive in business districts. In the future, it seems attractiveness will be shaped by their degree of economic and usage diversity. For example, the economic activity of Paris La Défense is spread across seven sectors, and none provides more than 20% of the activity. This economic diversity, previously seen as a handicap to its standing and reputation, could become a strength in future years. That view is supported by the drive for diversification that we can see at other historic financial centers, as the example below illustrates.

Methodology
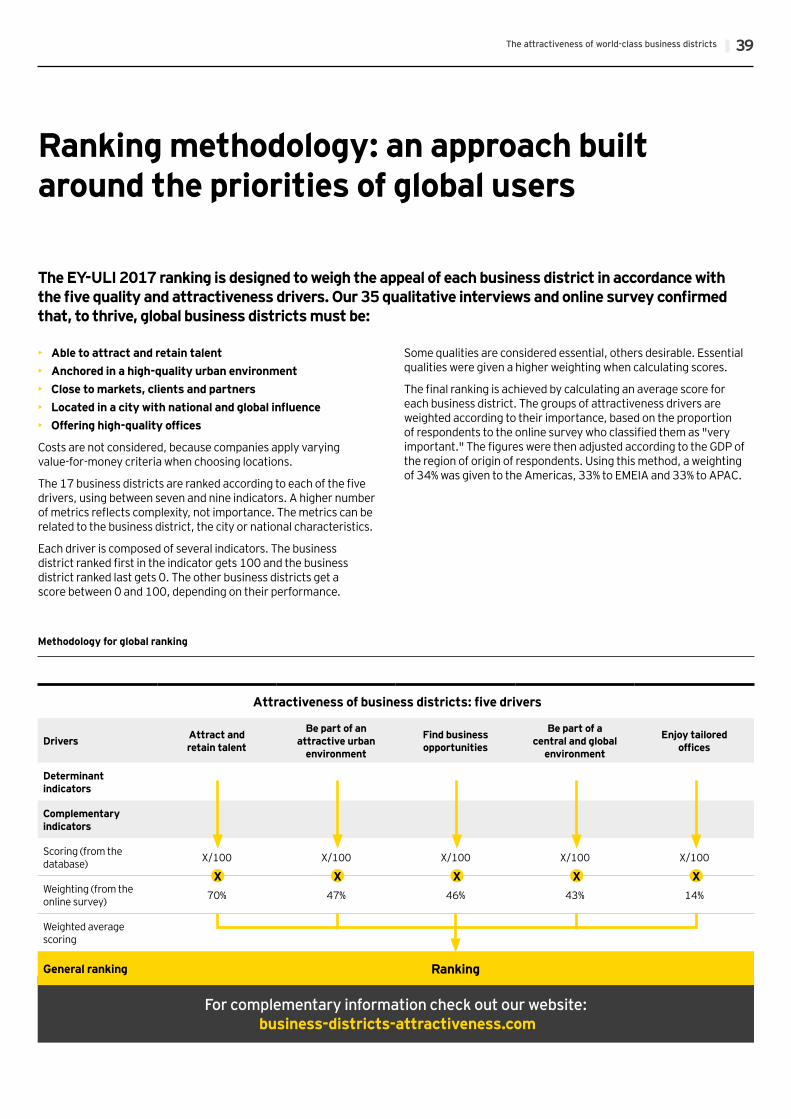
39The attractiveness of world-class business districts
For complementary information check out our website: business-districts-attractiveness.com
• Able to attract and retain talent• Anchored in a high-quality urban environment• Close to markets, clients and partners • Located in a city with national and global influence • Offering high-quality offices
Costs are not considered, because companies apply varying value-for-money criteria when choosing locations.
The 17 business districts are ranked according to each of the five drivers, using between seven and nine indicators. A higher number of metrics reflects complexity, not importance. The metrics can be related to the business district, the city or national characteristics.
Each driver is composed of several indicators. The business district ranked first in the indicator gets 100 and the business district ranked last gets 0. The other business districts get a score between 0 and 100, depending on their performance.
Some qualities are considered essential, others desirable. Essential qualities were given a higher weighting when calculating scores.
The final ranking is achieved by calculating an average score for each business district. The groups of attractiveness drivers are weighted according to their importance, based on the proportion of respondents to the online survey who classified them as "very important." The figures were then adjusted according to the GDP of the region of origin of respondents. Using this method, a weighting of 34% was given to the Americas, 33% to EMEIA and 33% to APAC.
The EY-ULI 2017 ranking is designed to weigh the appeal of each business district in accordance with the five quality and attractiveness drivers. Our 35 qualitative interviews and online survey confirmed that, to thrive, global business districts must be:
Methodology for global ranking
Attractiveness of business districts: five drivers
Drivers Attract and retain talent
Be part of an attractive urban
environment
Find business opportunities
Be part of a central and global
environment
Enjoy tailored offices
Determinant indicators
Complementary indicators
Scoring (from the database) X/100 X/100 X/100 X/100 X/100
Weighting (from the online survey) 70% 47% 46% 43% 14%
Weighted average scoring
General ranking Ranking
X X X X X
Ranking methodology: an approach built around the priorities of global users

Appendices
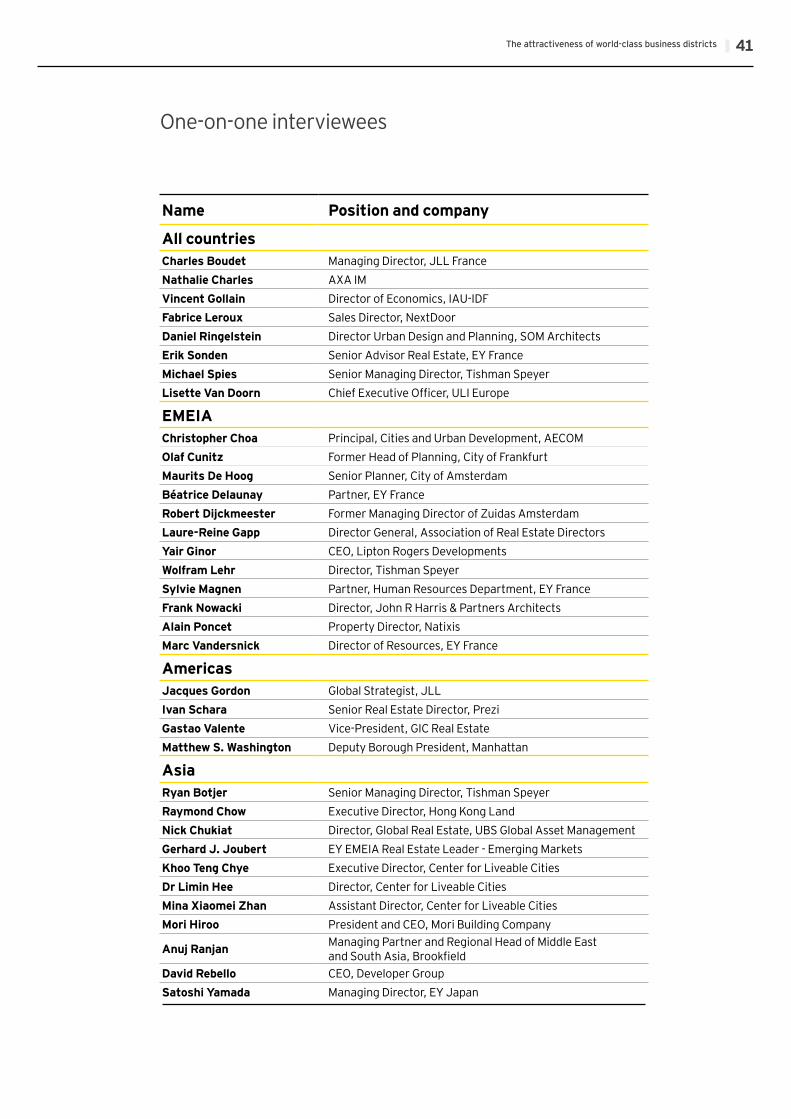
41The attractiveness of world-class business districts
One-on-one interviewees
Name Position and company
All countriesCharles Boudet Managing Director, JLL FranceNathalie Charles AXA IMVincent Gollain Director of Economics, IAU-IDFFabrice Leroux Sales Director, NextDoorDaniel Ringelstein Director Urban Design and Planning, SOM ArchitectsErik Sonden Senior Advisor Real Estate, EY FranceMichael Spies Senior Managing Director, Tishman SpeyerLisette Van Doorn Chief Executive Officer, ULI Europe
EMEIAChristopher Choa Principal, Cities and Urban Development, AECOMOlaf Cunitz Former Head of Planning, City of FrankfurtMaurits De Hoog Senior Planner, City of AmsterdamBéatrice Delaunay Partner, EY FranceRobert Dijckmeester Former Managing Director of Zuidas AmsterdamLaure-Reine Gapp Director General, Association of Real Estate DirectorsYair Ginor CEO, Lipton Rogers DevelopmentsWolfram Lehr Director, Tishman SpeyerSylvie Magnen Partner, Human Resources Department, EY FranceFrank Nowacki Director, John R Harris & Partners ArchitectsAlain Poncet Property Director, NatixisMarc Vandersnick Director of Resources, EY France
AmericasJacques Gordon Global Strategist, JLLIvan Schara Senior Real Estate Director, PreziGastao Valente Vice-President, GIC Real EstateMatthew S. Washington Deputy Borough President, Manhattan
AsiaRyan Botjer Senior Managing Director, Tishman SpeyerRaymond Chow Executive Director, Hong Kong LandNick Chukiat Director, Global Real Estate, UBS Global Asset ManagementGerhard J. Joubert EY EMEIA Real Estate Leader - Emerging MarketsKhoo Teng Chye Executive Director, Center for Liveable CitiesDr Limin Hee Director, Center for Liveable CitiesMina Xiaomei Zhan Assistant Director, Center for Liveable CitiesMori Hiroo President and CEO, Mori Building Company
Anuj Ranjan Managing Partner and Regional Head of Middle East and South Asia, Brookfield
David Rebello CEO, Developer GroupSatoshi Yamada Managing Director, EY Japan
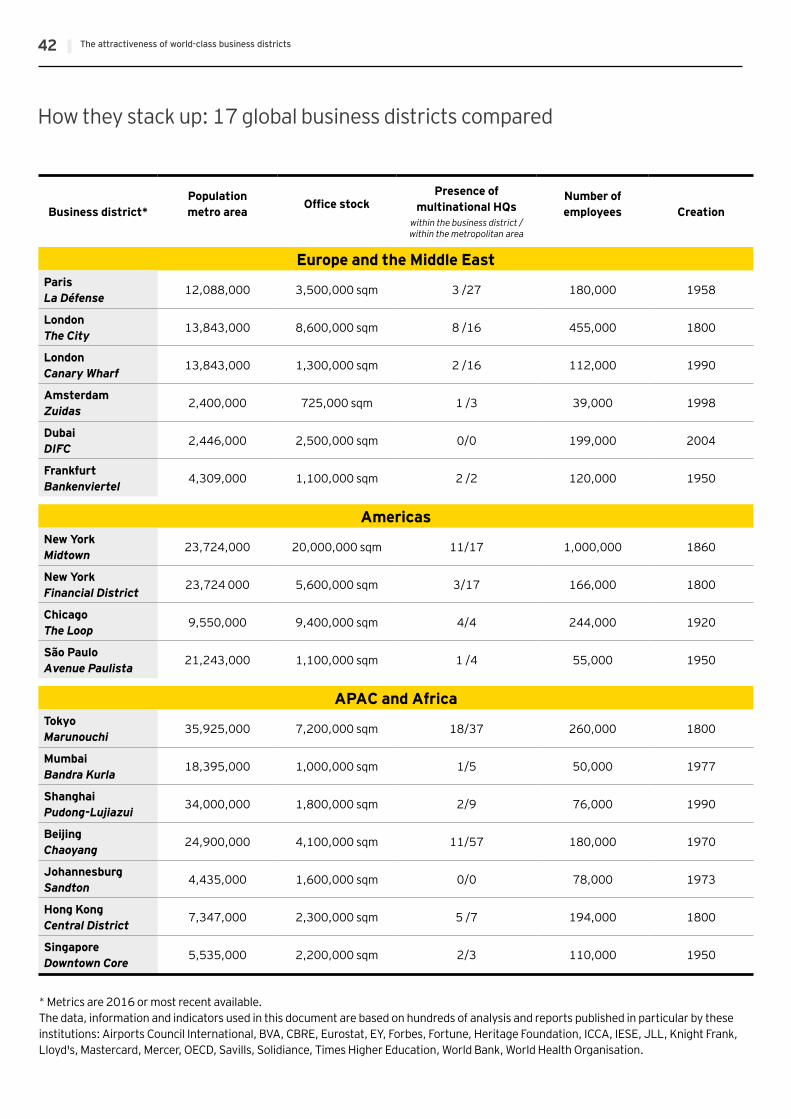
The attractiveness of world-class business districts42
How they stack up: 17 global business districts compared
Business district*Population metro area
Office stock Presence of
multinational HQswithin the business district / within the metropolitan area
Number of employees Creation
Europe and the Middle EastParis La Défense
12,088,000 3,500,000 sqm 3 /27 180,000 1958
London The City
13,843,000 8,600,000 sqm 8 /16 455,000 1800
London Canary Wharf
13,843,000 1,300,000 sqm 2 /16 112,000 1990
AmsterdamZuidas
2,400,000 725,000 sqm 1 /3 39,000 1998
DubaiDIFC
2,446,000 2,500,000 sqm 0/0 199,000 2004
FrankfurtBankenviertel
4,309,000 1,100,000 sqm 2 /2 120,000 1950
AmericasNew YorkMidtown
23,724,000 20,000,000 sqm 11/17 1,000,000 1860
New YorkFinancial District
23,724 000 5,600,000 sqm 3/17 166,000 1800
ChicagoThe Loop
9,550,000 9,400,000 sqm 4/4 244,000 1920
São PauloAvenue Paulista
21,243,000 1,100,000 sqm 1 /4 55,000 1950
APAC and AfricaTokyoMarunouchi
35,925,000 7,200,000 sqm 18/37 260,000 1800
MumbaiBandra Kurla
18,395,000 1,000,000 sqm 1/5 50,000 1977
ShanghaiPudong-Lujiazui
34,000,000 1,800,000 sqm 2/9 76,000 1990
BeijingChaoyang
24,900,000 4,100,000 sqm 11/57 180,000 1970
JohannesburgSandton
4,435,000 1,600,000 sqm 0/0 78,000 1973
Hong KongCentral District
7,347,000 2,300,000 sqm 5 /7 194,000 1800
Singapore Downtown Core
5,535,000 2,200,000 sqm 2/3 110,000 1950
* Metrics are 2016 or most recent available.The data, information and indicators used in this document are based on hundreds of analysis and reports published in particular by these institutions: Airports Council International, BVA, CBRE, Eurostat, EY, Forbes, Fortune, Heritage Foundation, ICCA, IESE, JLL, Knight Frank, Lloyd's, Mastercard, Mercer, OECD, Savills, Solidiance, Times Higher Education, World Bank, World Health Organisation.

43Baromètre d’attractivité des quartiers d’affaires mondiaux
Notes

ContactsEY | Assurance | Tax | Transactions | AdvisoryAbout EYEY is a global leader in assurance, tax, transaction and advisory services. The insights and quality services we deliver help build trust and confidence in the capital markets and in economies the world over. We develop outstanding leaders who team to deliver on our promises to all of our stakeholders. In so doing, we play a critical role in building a better working world for our people, for our clients and for our communities.
EY refers to the global organization and may refer to one or more of the member firms of Ernst & Young Global Limited, each of which is a separate legal entity. Ernst & Young Global Limited, a UK company limited by guarantee, does not provide services to clients. For more information about our organization, please visit ey.com.
© 2017 EYGM Limited. All Rights Reserved.
EYG no. 05943-172GblGraphic studio France: 1708SG543ED None
In line with EY’s commitment to minimize its impact on the environment, this document has been printed on paper with a high recycled content.
This material has been prepared for general informational purposes only and it is not intended to be relied upon as accounting, tax or other professional advice. Please refer to your advisors for specific advice.
ey.com
Marc LhermittePartner, EY AdvisoryTel.: +33 1 46 93 72 76Email: [email protected]
Vincent RaufastSenior Manager, EY AdvisoryTel.: +33 1 46 93 44 51Email: [email protected]
Lisette Van DoornChief Executive Officer, ULI Europe Tel.: +44 20 7487 9580 Mail: [email protected]
For complementary information check out
our website:business-districts-attractiveness.com