Embed Size (px)
Citation preview

The attached slides were used at the Analyst Presentation by John Hirst and Andrew Fisher on the 9th September 2003.
The slides could be incomplete without the oral commentary.

Cautionary Statement for Purposes of the "Safe Harbor" Provisions of the United States Private Securities Litigation Reform Act of 1995: The U.S. Private Securities Litigation Reform Act of 1995 provides a "safe harbor" for forward-looking statements. This press release contains certain forward-looking statements relating to the business of the Group and certain of its plans and objectives, including, but not limited to, future capital expenditures, future ordinary expenditures and future actions to be taken by the Group in connection with such capital and ordinary expenditures, the introduction of new information technology and e-commerce platforms, the expected benefits and future actions to be taken by the Group in respect of certain sales and marketing initiatives, operating efficiencies and economies of scale. By their nature forward-looking statements involve risk and uncertainty because they relate to events and depend on circumstances that will occur in the future. Actual expenditures made and actions taken may differ materially from the Group's expectations contained in the forward-looking statements as a result of various factors, many of which are beyond the control of the Group. These factors include, but are not limited to, the implementation of cost-saving initiatives to offset current market conditions, the ability to recruit and retain management personnel, integration of new information systems, continued use and acceptance of e-commerce programs and systems and the impact on other distribution systems, the ability to expand into new markets and territories, the implementation of new sales and marketing initiatives, changes in demand for electronic, electrical, electromagnetic and industrial products, rapid changes in distribution of products and customer expectations, the ability to introduce and customers' acceptance of new services, products and product lines, product availability, the impact of competitive pricing, fluctuations in foreign currencies, and changes in interest rates and overall market conditions, particularly the impact of changes in world-wide and national economies.

Second quarter and half year resultsFor the period ended 3rd August 2003

Agenda
Andrew Fisher
Half year financial results
John Hirst Strategy and divisional review

Group Finance Director
Andrew Fisher

Financial Summary26 weeks ended 3rd August 2003 Sales £390.6m - up 3.1%
Operating profit £36.4m - operating margin 9.3% (before goodwill
amortisation and one off branding costs)
No evidence of improvement in major markets
Investment in working capital to support product range expansion
Net debt at £228.9m - interest cover 4.9 times
Unchanged interim dividend

Financial SummaryGroup
£m 2003/4 2002/3
Q1 Q2 H1 H1
Reported sales 201.8 188.8 390.6 392.6
SPD growth* 3.3% 2.8% 3.1% 1.0%
Gross margin** 40.1% 40.3% 40.2% 40.9%
Operating profit*** 19.4 17.0 36.4 41.9
ROS 9.6% 9.0% 9.3% 10.7%
* Continuing businesses at constant exchange rates
** Gross margin is measured after net costs of freight, packaging, discounts and inventory adjustments
*** Before goodwill amortisation and one-off branding costs

Like for like sales per day growth
£m 2003/4 2002/3
Reported sales H1 390.6 392.6
Exchange rate adjustment 8.4
Discontinued operations (0.7) (6.4)
Adjusted sales 398.3 386.2
Weighted average working days 126 126
SPD (£’000) 3,161 3,065
Sales growth 3.1%

0.0
0.5
1.0
1.5
2.0
2.5
3.0
Q1 Q2 Q3 Q4 Q1 Q2 Q3 Q4 Q1 Q2-40%
-30%
-20%
-10%
0%
2001/2 2002/3
$m
MDD Americas SPD and year on year growth rates
2003/4

0
200
400
600
800
1,000
1,200
1,400
1,600
Q1 Q2 Q3 Q4 Q1 Q2 Q3 Q4 Q1 Q2
-20%
-10%
0%
10%
20%
2001/2 2002/3
£k
MDD Europe & Asia Pacific SPD and year on year growth rates(excluding BuckHickman InOne)
2003/4

0
200
400
600
800
1,000
1,200
Q1 Q2 Q3 Q4 Q1 Q2 Q3 Q4 Q1 Q2
-20%
-10%
0%
10%
20%
2001/2 2002/3
£k
MDD UK SPD and year on year growth rates(excluding BuckHickman InOne)
2003/4

0
100
200
300
400
500
600
Q1 Q2 Q3 Q4 Q1 Q2 Q3 Q4 Q1 Q2
-20%
-10%
0%
10%
20%
30%
2001/2 2002/3
£k
MDD BuckHickman InOne SPD and year on year growth rates
2003/4

300
400
500
Q1 Q2 Q3 Q4 Q1 Q2 Q3 Q4 Q1 Q2
-20%
-10%
0%
10%
20%
30%
2001/2 2002/3
£k
MDD Mainland Europe & Asia Pacific SPD and year on year growth rates
2003/4

0
50
100
150
200
Q1 Q2 Q3 Q4 Q1 Q2 Q3 Q4 Q1 Q2 Q3 Q4 Q1 Q2
0%
2%
4%
6%
8%
10%
12%
14%
Sa
les P
en
etra
tion
MDD North America
MDD Europe & Asia Pacific (excl BHIO)
2000/1 2001/2
£k
E-commerce SPD - Restated prior year & EDI
2003/42002/3

Financial SummaryGroup
£m 2003/4 2002/3
Q1 Q2 H1 H1
Reported sales 201.8 188.8 390.6 392.6
SPD growth* 3.3% 2.8% 3.1% 1.0%
Gross margin** 40.1% 40.3% 40.2% 40.9%
Operating profit*** 19.4 17.0 36.4 41.9
ROS 9.6% 9.0% 9.3% 10.7%
* Continuing businesses at constant exchange rates
** Gross margin is measured after net costs of freight, packaging, discounts and inventory adjustments
*** Before goodwill amortisation and one-off branding costs

20%
25%
30%
35%
40%
45%
50%
FY FY FY H1
2000/1 2001/2
Gross margin progression
2002/3
MDD (excl BHIO)
BHIO
Note : Gross margin is measured after cost of freight, packaging, discounts and inventory adjustments
2003/4

Financial SummaryFirst half incremental SG&A costs
£m
Front office systems depreciation 2.6
Liege warehouse 1.3
Reduction in net pension credit 0.8
North American healthcare costs 0.4
On-going 5.1
One-off branding 2.4
Total 7.5

Financial SummaryIndustrial Products Division
£m 2003/4H1
2002/3H1
Sales - continuing 48.5 47.1
- businesses sold 0.7 6.4
- total 49.2 53.5
SPD growth* 4.4% 1.0%
ROS 13.8% 14.2%
* Continuing businesses at constant exchange rates

Profit and loss accountSecond quarter and first half to 3rd August 2003£m 2003/4
Q2 Q1 H1
Operating profit * 16.4 16.3 32.7
Interest (3.5) (3.9) (7.4)
Exceptional item 0.1 - 0.1
Profit before tax 13.0 12.4 25.4
Tax (4.1) (4.0) (8.1)
Profit after tax 8.9 8.4 17.3
Preference dividend (3.3)
Attributable to ordinary shareholders 14.0
Adjusted EPS 4.7p
* Includes goodwill amortisation

Taxation2003/4
£m H1
Profit before tax 25.4
Adjusted for : goodwill amortisation 1.3
gain on disposal (0.1)
26.6
Tax charge at 30.5% 8.1

Summarised cash flowsSecond quarter and first half to 3rd August 2003
£m 2003/4
Q2 Q1 H1
Operating profit 16.4 16.3 32.7
Depreciation (net of gains on disposals) 4.7 4.4 9.1
Amortisation of goodwill 0.6 0.7 1.3
Net pension credit (1.4) (1.4) (2.8)
Working capital (8.9) (5.7) (14.6)
Operating cash flow 11.4 14.3 25.7
Net capital expenditure (4.4) (3.5) (7.9)
Interest & preference dividend (9.9) (0.4) (10.3)
Tax (2.6) (4.2) (6.8)
Free cash flow (5.5) 6.2 0.7

Debtor days
46
48
50
52
54
56
58
60
Q1 Q2 Q3 Q4 Q1 Q2 Q3 Q4 Q1 Q2
2001/2 2002/3
Days
2003/4

100
110
120
130
140
150
160
170
Q1 Q2 Q3 Q4 Q1 Q2 Q3 Q4 Q1 Q2
0.0
0.5
1.0
1.5
2.0
2.5
3.0
3.5
Turns
2001/2
£m
Inventory
2002/3
At 2003/4 Q2 end exchange rates
2003/4
Liege warehouse
Newark InOne new product

£m 2003/4
Front office systems 3.0
IT 2.2
Liege warehouse 1.4
Other 2.7
Total 9.3
Sale of fixed assets (1.4)
Net capital expenditure 7.9
Capital expenditure

Movement in net debt
£m First half
Opening net debt (209.2)
Free cash flow 0.7Ordinary dividends (18.1)
(17.4)Disposal of business 0.8Capital retirement (2.3)Translation (0.8)
Closing net debt (228.9)
US$ Senior Notes due 2006, 2010 & 2013 (236.1)Other loans (25.4)
Cash and short term deposits 32.6(228.9)

Debt profile
- - - - - - Amount drawn at 3 August 2003
Bilateral bank facilities to 2006 at LIBOR + 0.5%
$155m 7.2% Senior Notes repayable 2006
$66m 5.3% Senior Notes repayable 2010
$159m 5.9% Senior Notes repayable 2013
2004 2006 2008 2010 20120
100
200
300
258
£m 357

Group CEO
John Hirst

What we’ve done - Talent, Technology and Service
Talent Laurence Bain appointed to Board, Stephen Canham - MD, Europe
& Asia Pacific
Enhanced leadership quality
Technology Product and customer data bases
Publication management system
Siebel CRM systems in UK/US - others to follow
eCommerce - eProcurement flexibility
Information for customers and suppliers

Service and Services
Logistics simplification in Americas and Europe
Focus on product ranges and service levels
Development of new services VMI/Stockroom solutions
Product Find - NIC sourcing
Product Watch - obsolescence
eProcurement
and all during possibly the longest down turn in the history of electronics industry

Further Actions
Portfolio rationalisation Maintenance Inc.
Acquisition Merkelbach
Entry to new markets Mexico, China, Austria, Italy, Spain
Key account focus Vauxhall, Rolls-Royce, Lockhead, successes Motorola, etc.
Market segmentation H&S, Government, Education, Design Engineers
Rebranding InOne

Market trends - as differentiation increases
Differentiation
Profits
Commodity
Product
Service
Customer experience
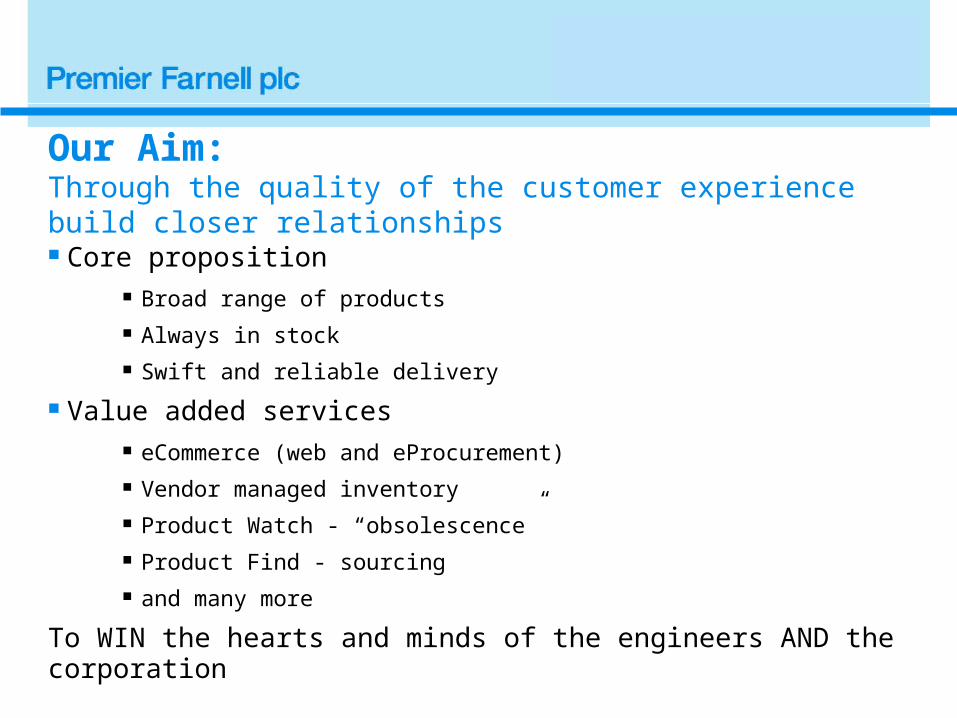
Our Aim:Through the quality of the customer experience build closer relationships Core proposition
Broad range of products
Always in stock
Swift and reliable delivery
Value added services eCommerce (web and eProcurement)
Vendor managed inventory
Product Watch - “obsolescence”
Product Find - sourcing
and many more
To WIN the hearts and minds of the engineers AND thecorporation
Our Aim:Through the combination of Premier Farnell and customers’ technology
Enable customers to: Drive down their total procurement costs
Increase their productivity and efficiency
Spend more of their time on core tasks
Thus delivering Economic benefit
Peace of mind
Appropriate for all customers - large and small

Progress - First half
IPD Akron
European and Australia successes
OEM market strong in first half
New product development continues
TPC Sales per day +3.4% in difficult market
New products and Mexican sales progress
KENT Progress in most countries
New products success

Progress - First half
MDD Newark InOne Direct Ship in Europe and Asia and Farnell InOne
in Americas
Re-branding plans smoothly implemented
CRM software - tangible benefit
7 globally managed accounts
Punch out for Motorola - China

Progress - First half
MDD - Americas Sales volatile in difficult market (SPD -3.4%) (Jan-June NEDA;
semis -6%; overall -4%)
US Government sales +17%
254 Stockrooms Managed
130 eProcurement partnerships McCain, Proctor & Gamble, Daimler Chrysler + 48 potential
42K new products - semi’s, passives and electromechanical
Siebel implemented training proceeding
campaigns underway

Progress - First half
MDD - Americas Mexico and Brazil sales progress
MCM sales growth in Q2

Progress - First half
MDD - Europe & Asia Pacific Market remains difficult - SPD +8.4%
UK SPD +10.8%, BHIO +23.1%
Mainland Europe - SPD +2.3% increases in Germany and Netherlands
Asia - SPD +15.1%, Australasia - SPD +2.9%
Major account sales up in many countries UK +112% Holland +8%
France + 19% Australia +6%
H&S segment sales +42%

Progress - First half
MDD - Europe & Asia Pacific Siebel - benefits now accruing to Farnell InOne UK business
Website - SPD +75%
168 UK Stockrooms managed
eProcurement partnerships 121 (59 potential) Pirelli, TNO, Disneyland
Liege on schedule for full operation in September

Outlook
No evidence yet of improvement in North America
European markets still weak
Focus on customer experience service
value added services
product range
Control of costs
Ready for 2004

Summary Extensive capabilities in place
Use of CRM to develop sales
Major accounts developing using services
252 eProcurement partnerships achieved 100+ in discussion
Stockrooms managed Americas 254
Europe & Asia Pacific 168
Segment progress
Absorbed £5 million of fixed cost
Poised for market improvement
![2018.06.11 Hirst Judgment - SEC.gov | HOMEGARY T. HIRST, and GAVIN L. HAMELS, : : : Defendants. : ----- x [PROPOSED] FINAL JUDGMENT AS TO DEFENDANT GARY T. HIRST The Securities and](https://img.pdfslide.us/doc/110x75/610c1a826ef82c4ffa5602e3/20180611-hirst-judgment-secgov-home-gary-t-hirst-and-gavin-l-hamels-.jpg)