Embed Size (px)
Citation preview

The Association between Management Earnings Forecast Errors and Accruals
Guojin Gong Department of Accounting Smeal College of Business
Pennsylvania State University [email protected]
Laura Yue Li
Department of Accountancy College of Business
University of Illinois at Urbana-Champaign [email protected]
Hong Xie
Lubin School of Accounting Whitman School of Management
Syracuse University [email protected]
April 2008
We would like to thank Leslie Hodder (FARS discussant), Xiaoling Chen, Dan Givoly, Steven Huddart, Bin Ke, Andrew Leone, James McKeown, Mort Pincus, Yong Yu, Theodore Sougiannis, Raghu Venugopalan, and workshop participants at the 2008 Financial Accounting and Reporting Section (FARS) Annual Meeting, Kansas University, Pennsylvania State University, University of Illinois at Urbana-Champaign, and Syracuse University for helpful comments.

The Association between Management Earnings Forecast Errors and Accruals
ABSTRACT
We investigate the association between the errors in management forecasts of next year’s earnings and current year’s accruals. We propose that managers’ assessment about their firms’ business prospects is necessarily imperfect given the uncertainty in the operating environment. When managers’ imperfect business assessment manifests in both accrual generation and earnings forecasts, managers likely display greater optimism (pessimism) in forecasting earnings when accruals are relatively high (low). Consistent with our proposition, we find a positive association between management earnings forecast errors and accruals, and this positive association is stronger for firms operating in a highly uncertain business environment and for industries exhibiting strong co-variation between accruals and employee growth. Supplementary analysis reveals that the presence of management earnings forecasts does not significantly reduce accrual mispricing. Overall, our results support the view that voluntarily disclosed information may contain errors that are predictable based on mandatorily reported information, which potentially limits the efficacy of voluntary disclosure in assisting investors to better understand mandatorily reported information.
Keywords: voluntary disclosure; management earnings forecasts; mandatory disclosure;
accruals. Data Availability: Data used in this study are available from sources indicated in the paper.

1
I. INTRODUCTION
Mandatory and voluntary disclosures represent two important channels by which
managers communicate information to outside shareholders.1 While a considerable literature has
shown that both corporate disclosures contain value-relevant information and significantly
influence security prices (see Kothari (2001) and Healy and Palepu (2001) for literature reviews),
the question of whether voluntarily disclosed information contains errors that can be predicted
based on mandatorily reported information is largely unexplored in the extant research. A formal
investigation of this issue can further our understanding of the informational value of voluntary
disclosure which has important implications for investors and standard setters.
In this paper we examine the association between the errors in management forecasts of
next year’s earnings and current year’s accruals. We are interested in accruals and management
earnings forecasts because both accrual creation and earnings forecasts involve a high degree of
managerial subjectivity. We propose that, under an uncertain operating environment, managers’
knowledge about their firms’ business prospects is necessarily imperfect, which results in
unintentional errors in managers’ assessment of future firm performance. When managers have
flexibility to convey their imperfect business assessment through both accruals and earnings
forecasts, these two information disclosures likely contain common errors. Therefore, we expect
managers to display greater optimism (pessimism) in forecasting earnings when accruals are
relatively high (low).2
1 The U.S. Securities and Exchange Commission (SEC) mandates a variety of corporate filings that provide information on firms’ financial performance, governance structure, compensation practice, and major corporate transactions. Managers also voluntarily provide the capital market with additional relevant disclosures through forecasts of key accounting numbers (such as earnings, cash flows and sales), press releases, conference calls, internet sites, and other communication channels. 2 See Section II for further discussions of our conjecture.

2
Our proposition that managers’ imperfect foresight manifests in both voluntary and
mandatory disclosures is in line with recent studies showing that managers’ personal beliefs
affect multiple dimensions of corporate decisions. Malmendier and Tate (2005, 2008) show that
CEOs who overestimate the future returns of their firms (measured by a failure to divest
company-specific risk on their personal accounts) tend to undertake excessive capital
investments or pursuit unnecessary acquisitions when they have abundant internal funds at their
disposal. Ben-David et al. (2007) further document that CFO overconfidence (measured as mis-
calibrated beliefs based on a survey) induces distortions in a series of corporate decisions,
including investing, external financing and payout decisions. Similar to these studies, our
proposition that managers’ imperfect assessment of business prospects simultaneously affects
both mandatory and voluntary disclosures is consistent with the spillover effect of managerial
judgmental errors from one domain to another.
Using the First Call’s Company Issued Guidance (“CIG”) database, we find a
significantly positive association between management earnings forecast errors (defined as
forecasted earnings minus actual earnings) and accruals. If this positive association indeed stems
from unintentional errors in managers’ assessment of business prospects, we expect to observe a
stronger positive association among firms operating in a more uncertain business environment
where managers’ projection errors are likely to be more substantial. Empirical results confirm
our expectation. We find that the positive relation between management forecast errors and
accruals is stronger for firms having higher sales growth volatility, higher cash flow volatility, or
longer operating cycle.
Even with uncertainty in the operating environment, a positive association between
management forecast errors and accruals may not exist if managers have little flexibility in

3
conveying their business assessment through accruals. The degree to which managers can utilize
accruals to convey their subjective beliefs varies depending on the nature of the business,
industry practice, and available accounting choices allowed by the Generally Accepted
Accounting Principles (GAAP). If the positive association between management forecast errors
and accruals arises as a result of managerial judgmental errors being revealed in both information
disclosures, we expect to find a stronger positive association for firms exhibiting higher co-
variation between accruals and growth-related activities that capture managers’ assessment of
business prospects (e.g., employee growth as proposed by Zhang (2007)). Empirical results show
that for industries in which accruals highly co-vary with employee growth, management forecast
errors exhibit significantly positive relation with accruals. In contrast, for industries in which
accruals show little co-variation with employee growth, the relation between management
forecast errors and accruals is insignificant. These findings lend further support to the
proposition that common errors imbedded in managers’ business assessment manifest in both
accruals and earnings forecasts, which induces a positive relation between management forecast
errors and accruals.
We recognize that the positive relation between management forecast errors and accruals
may also arise from managers’ intentional misrepresentation in both information disclosures for
the purpose of reaping private benefits. To shed some light on this issue, we use managers’
trading direction (i.e., purchase or sale) as indication of their true beliefs concerning future
business prospects. We find that the association between management forecast errors and
accruals is significantly positive when the level of accruals more likely reflects managers’ true
beliefs about future firm performance (such as high/low accruals followed by share
purchases/sales). On the other hand, this association is virtually non-existent when accruals are

4
more likely manipulated to enhance managers’ trading profitability (such as high/low accruals
followed by share sales/purchases). These findings do not support the intentional
misrepresentation view that managers manipulate accruals and earnings forecasts in the same
direction in order to boost trading gains, but are consistent with the notion that both accruals and
earnings forecasts reflect managers’ unintentional errors about firms’ business prospects. One
explanation for these findings is that high litigation risk surrounding insider trading deters
managers from issuing intentionally biased public earnings forecasts which are easily verified ex
post. Nevertheless, managers potentially face a variety of economic incentives (besides insider
trading) when making disclosure decisions. We acknowledge that our study cannot completely
rule out this intentional misrepresentation explanation and additional research is required to fully
discriminate between competing explanations for managers’ accrual-related forecast errors.
This paper extends the literature on the interaction between mandatory and voluntary
disclosures. Prior research has proposed that voluntary disclosure provides useful information
that helps outsiders better understand financial information reported in regulatory filings (e.g.,
Kimbrough 2005; Drake et al. 2007; Louis et al. 2007). However, our results indicate that when
mandatory reporting (such as accruals) and voluntary disclosure (such as management earnings
forecasts) both involve a high degree of managerial subjectivity, mandatory and voluntary
disclosures may display common errors, which potentially undermines the informational value of
voluntary disclosure in facilitating more efficient pricing of mandatorily reported information.
Indeed, our supplementary analysis suggests that the availability of management earnings
forecasts has no significant impact on accrual mispricing.
Our study also provides new evidence for the management earnings forecast literature.
Prior research has proposed various factors (such as information asymmetry, managerial

5
incentives, and managers’ personal traits) that may affect the issuance and properties of
management earnings forecasts (See Hirst et al. (2007) for a recent literature review). We add to
this literature by showing that management earnings forecasts contain predictable errors in
relation to historically reported accruals. Our results caution investors to carefully evaluate
management earnings forecasts in forming their earnings expectations, especially when the firm
operates in a highly uncertain business environment or belongs to an industry where accruals
highly co-vary with growth-related activities.
Furthermore, our findings have important implications for regulators and standard setters.
Before drafting accounting standard changes or proposing disclosure-related policies, regulators
and standard setters need to consider the possibility that mandatory and voluntary disclosures
may display common errors under certain circumstances. Encouraging expanded voluntary
disclosure or greater managerial subjectivity in financial reporting may not necessarily improve a
firm’s information environment if the resulting corporate disclosures simply reflect the common
errors in managers’ assessment of business prospects.
Finally, our study offers complementary evidence to the accrual mispricing literature.
The accrual mispricing literature since Sloan (1996) has not reached a consensus regarding
whether the accrual-based hedge portfolio returns reflect market mispricing of accruals or
compensation for higher risk associated with extreme accruals. 3 Our findings indicate that
managers, similar to financial analysts (Bradshaw et al. 2001), 4 make more optimistic
3 Prior research on accrual mispricing mostly concurs that the accrual-based hedge portfolio returns reflect investors’ inefficient processing of accruals information (e.g., Sloan 1996; Bradshaw et al. 2001; Collins et al. 2003; Fairfield et al. 2003). Recently, a few studies propose rational explanations for the accrual-based hedge portfolio returns (e.g. Khan 2007; Ng 2005; Wu et al. 2007). Furthermore, Kraft et al. (2006) identify a few research design flaws that exist in prior accrual mispricing studies. 4 Bradshaw et al. (2001) find a positive association between analyst earnings forecast errors (defined as analyst consensus forecasts minus actual earnings) and accruals. They interpret this finding as analysts failing to efficiently assess the future earnings implications of accruals in forming earnings expectations, which supports the mispricing interpretation of the accrual-based hedge portfolio returns.

6
(pessimistic) earnings forecasts following periods of high (low) accruals. Given management
earnings forecasts significantly affect market earnings expectations (e.g., Ajinkya and Gift 1984;
Waymire 1984; Pownall and Waymire 1989), we thus provide additional corroborating evidence,
in a similar spirit to Bradshaw et al. (2001), that the accrual anomaly is at least partly driven by
market participants’ failure to correctly assess the future earnings implications of accruals.
The remainder of the paper is organized as follows. In the next section we review related
literature. Section III develops our hypotheses. Section IV describes the sample selection process
and the empirical regression model used to test the relation between management earnings
forecast errors and accruals. Section V presents and discusses empirical results. Section VI
provides supplementary analysis concerning the impact of management earnings forecasts on
accrual mispricing. The study concludes in Section VII.
II. RELATED LITERATURE
Prior Literature on Management Earnings Forecast Errors
Prior studies have proposed various incentive-related factors that may motivate managers
to bias their earnings forecasts for the purpose of inflating market earnings expectations (Frost
1997; Koch 1999; Rogers and Buskirk 2006), deterring industry entrants (Newman and Sansing
1993); facilitating equity issuance (Frankel et al. 1995; Lang and Lundholm 2000), improving
trading profitability (Aboody and Kasznik 2000; Noe 1999; Rogers and Stocken 2005), or
reducing expected legal costs (Skinner 1994, 1997; Baginski et al. 2002; Rogers and Stocken
2005). Asides from managerial incentives, McNichols (1989) finds that management earnings
forecasts contain predictable errors in relation to historical stock returns, suggesting that
managers fail to efficiently incorporate information contained in past stock prices in their

7
earnings forecasts. Despite these studies, little research has examined the relation between
management earnings forecast errors and mandatorily reported accounting information.
Prior Literature on the Relation between Mandatory and Voluntary Disclosures
Prior studies examining the relation between mandatory and voluntary disclosures are
motivated primarily from the discretionary nature of voluntary disclosure. Analytically, Einhorn
(2005) demonstrates that various features of mandatory reporting (such as the level of discretion
in mandatory reporting and the information quality of mandatory disclosure) affect managers’
propensity to provide voluntary disclosure. Empirically, it is well documented that volatile
earnings tend to reduce the frequency of management earnings forecasts (e.g., Waymire 1985;
Cox 1985; Imhoff 1978). More recently, Francis et al. (2008) find that firms exhibiting good
earnings quality provide a larger quantity of voluntary disclosures in annual reports and 10Ks
than firms exhibiting poor earnings quality.
Several other studies use market-based measures of mandatory reporting properties to
examine the relation between mandatory and voluntary disclosures. Lennox and Park (2006) find
that historical earnings response coefficient is positively associated with management’s issuance
of earnings forecasts. However, Lang and Lundholm (1993) find a negative association between
the earnings-return correlation and AIMR disclosure ratings, and Tasker (1998) also documents a
negative association between her proxy for financial statement informativeness and the
occurrence of conference calls.
Overall, this line of research has mostly focused on the occurrence or the quantity of
voluntary disclosure and its relation with mandatory reporting properties. In this paper we extend
prior research by examining the error in voluntarily disclosed forward-looking information (i.e.,

8
management earnings forecast errors) and its relation with a key aspect of mandatory reporting,
accruals.5
III. HYPOTHESIS DEVELOPMENT
Relation between Management Earnings Forecast Errors and Accruals
We propose that mandatory and voluntary disclosures likely contain common errors
resulting from managers’ imperfect assessment of business prospects being reflected in both
disclosures. A firm’s operating environment is replete with uncertainty due to changing business
conditions (such as unpredictable shifts in market demand and competitor strategies). This
implies that managers’ knowledge of their firms’ business environment is necessarily imperfect.
Managers’ imperfect knowledge unavoidably generates errors in managers’ assessment of firms’
business prospects. In addition, uncertainty in operating environment may induce or exacerbate
managers’ cognitive biases in processing information (e.g., Hirshleifer 2001; Zhang 2006),
which also lead to errors in managers’ assessment of business prospects. When managers
communicate their biased business assessment through both voluntary and mandatory disclosures,
these two information disclosures likely contain common errors.
To empirically test this conjecture, we examine whether the errors in management
forecasts of next year’s earnings (defined as forecasted earnings minus actual earnings) are
positively related to current year’s accruals. We focus on management earnings forecasts instead
of other forms of voluntary disclosure because, in addition to reflecting managers’ projections
5 A related paper by Kasznik (1999) examines the relation between management earnings forecasts and discretionary accruals. He predicts and finds that legal costs and reputation concerns motivate managers to inflate accruals in order to minimize optimistic forecast errors. The key difference between our study and Kasznik (1999) is that we focus on current accruals and their relation with management forecasts of future earnings, while Kasnik (1999) focuses on future accruals reported after management earnings forecasts.

9
about future firm performance, these forecasts are quantitative and ex post verifiable.6 We
choose to examine accruals because reporting accruals involves substantial managerial
projections about firms’ business prospects. Since forecasting earnings and reporting accruals
both involve a high degree of managerial subjectivity, errors imbedded in managers’ business
assessment likely manifest in both management earnings forecasts and accruals. For instance,
when managers are optimistic (pessimistic) about the firm’s future market demand, they tend to
over- (under-) stock inventory, thus creating high (low) level of accruals through increases in
inventory.7 At the same time, management earnings forecasts would display similar optimism
(pessimism) reflecting managers’ personal beliefs about future firm performance. Therefore, we
hypothesize that management earnings forecasts contain greater optimistic (pessimistic) errors
when accruals are relatively high (low), or a positive relation between management earnings
forecast errors and accruals.8
H1: There is a positive association between management earnings forecast errors and accruals.
Impacts of Uncertainty in Operating Environment and Accruals-Growth Co-variation
A positive association between management forecast errors and accruals (as proposed
above) will exist as long as the following two conditions hold. First, there is uncertainty in the
operating environment such that managers unavoidably commit errors in assessing their firms’
business prospects. Second, managers have flexibility to convey their subjective assessment
6 In contrast, other types of voluntary disclosures are not necessarily followed by confirmatory reports for verification (such as projections of market trend) or do not reveal forward-looking information (such as disclosures of historical customer satisfaction). 7 Similarly, when managers are optimistic (pessimistic) about the collectibility of existing accounts receivable, they tend to under- (over-) estimate receivable allowances, thus creating high (low) level of accruals through increases in accounts receivable. 8 Besides reflecting managers’ personal assessment about firms’ business prospects, accruals are also influenced by firms’ underlying economics. In subsequent empirical tests, we control for various firm characteristics (such as operating performance and growth) to account for firms’ underlying economics that may affect accruals.

10
about firms’ business prospects through both accruals and earnings forecasts. The cross-sectional
variations in environmental uncertainty and in managerial reporting flexibility, thus, have
predictable implications to our proposition.
Greater uncertainty in operating environment naturally results in greater errors in
managers’ assessment of firms’ business prospects. Greater uncertainty also leaves more room
for psychological biases (Hirshleifer 2001). Hence, under a more uncertain operating
environment, management earnings forecasts and accruals are likely affected to a greater extent
by common errors in managers’ business assessment. We therefore expect to observe a stronger
positive association between management forecast errors and accruals when there is greater
uncertainty in firms’ operating environment.
H2: The positive association between management earnings forecast errors and accruals is stronger for firms operating in a more uncertain business environment.
Even with uncertainty in the operating environment, a positive association between
management forecast errors and accruals may not exist unless managers are allowed to convey
their biased assessment through both disclosure channels. While management earnings forecasts
largely reflect managers’ personal beliefs regarding future firm performance, reported accruals
may not. The degree to which accruals convey managers’ subjective assessment varies with the
nature of the business, industry practice, and available accounting choices allowed by GAAP.
For example, managers in retail industries may increase inventory purchases to convey their
expectations of improving future market demand. However, such a strategy would not be
applicable to service industries or firms with no inventories. When managers have limited
flexibility in communicating their projections through accruals, the errors imbedded in

11
management earnings forecasts may not appear in accruals, thus weakening the positive
association between management forecast errors and accruals.
We use the co-variation between accruals and managers’ growth-related activities to
measure managerial flexibility in using accruals to convey their subjective assessment.9 The
premise is that growth-related activities capture managers’ assessment of their firms’ business
prospects. If managers have plenty of flexibility to convey their business assessment through
accruals, we would observe high co-variation between accruals and growth-related activities. We
therefore hypothesize that firms exhibiting high co-variation between accruals and growth-
related activities have a stronger positive association between management forecast errors and
accruals.
H3: The positive association between management earnings forecast errors and accrualsis stronger for firms exhibiting high co-variation between accruals and growth-related activities.
An Alternative Explanation – Intentional Misrepresentation of Information Disclosures
We have proposed that unintentional errors in managers’ assessment of future business
prospects result in a positive association between management forecast errors and accruals.
However, we recognize that this positive association could also arise from managers’ intentional
misrepresentation of multiple information disclosures for the purpose of reaping private benefits.
Such intentional misrepresentation is costly to managers due to potential legal actions from
shareholders (e.g., Skinner 1994, 1997; Francis et al. 1994) and loss of reputation (e.g., Williams
1996; Hutton and Stocken 2007). Nevertheless, the expanded safe-harbor provisions in the
Private Securities Litigation Reform Act of 1995 alleviate the legal concern associated with
9 See Section 4 for the measurement of the co-variation between accruals and managers’ growth-related activities.

12
forward-looking disclosures, which potentially increases managers’ propensity for intentional
misrepresentation.
Managers have various incentives to bias their earnings forecasts and reported accruals.
For instance, managers may manipulate accruals downwards prior to share repurchases or stock
option grants to boost potential gains from repurchased stocks or awarded stock options (Gong et
al. 2008; Baker et al. 2003), and these firms may also provide pessimistic earnings forecasts prior
to these events (Brockman et al. 2008; Aboody and Kasznik 2000). Alternatively, external
financing activities may motivate managers to inflate accruals (Teoh et al. 1998a, 1998b) and
knowingly introduce optimistic biases to voluntary disclosures (Lang and Lundholm 2000),
although empirical evidence is still mixed concerning these conjectures (Ball and Shivakumar
2007; Shivakumar 2000; Frankel et al. 1995). 10 It is worth noting that prior studies only
separately examine managers’ manipulation of accruals versus management earnings forecasts.
Whether managers simultaneously utilize both information disclosures to reap private benefits
remains an empirical issue.
Rather than providing a comprehensive examination of various managerial incentives,
which is beyond the scope of our study, we choose to examine insider trading to distinguish the
intentional misrepresentation explanation from the unintentional mis-assessment view. Insider
trading (executed subsequent to management earnings forecasts) has potential to reflect
managers’ assessment of business prospects and at the same time, possibly reveal their
10 Teoh et al. (1998a, 1998b) show that firms inflate earnings prior to initial public offerings (IPOs) and seasoned public offerings (SEOs), but Ball and Shivakumar (2007) conclude that the average IPO firm does not inflate earnings prior to the IPO. In addition, Shivakumar (2000) proposes that the documented earnings inflation prior to SEOs results from managers’ rational response to anticipated investor reactions at offering announcements rather than the intention to deceive investors. Regarding voluntary disclosure, Frankel et al. (1995) find that external financing activities (including both equity and bond issuances) do not lead to more optimistically biased management earnings forecasts. However, Lang and Lundhom (2000) document that firms that substantially increase their disclosure activities prior to SEOs experience price increases prior to the offering, suggesting that SEO firms increase voluntary disclosures to “hype the stock.”

13
manipulative incentives. Specifically, we rely on the trading direction to infer managers’ true
beliefs about future firm performance, with share purchases indicating favorable outlooks and
share sales implying future performance declines.11 We then identify cases where accruals likely
reflect managers’ true beliefs concerning future firm performance (such as high/low accruals
followed by share purchases/sales), and cases where accruals are likely manipulated to boost
managers’ trading gains (such as high/low accruals followed by share sales/purchases). Our
purpose is to examine whether the positive association between management forecast errors and
accruals is attributable to unintentional mis-assessment (likely captured by the former case) or
intentional manipulation (likely captured by the latter case) being manifested in both accruals
and management earnings forecasts.
If it is the unintentional mis-assessment that drives the positive association between
management forecast errors and accruals, we expect this positive association to be stronger for
firms with accruals reflecting managers’ true beliefs about future firm performance than firms
where accruals are likely manipulated to enhance managers’ trading profitability. In other words,
we expect a stronger positive association between management forecast errors and accruals when
managers purchase (sell) shares following periods of high (low) accruals.
H4a: Under the unintentional error explanation, the positive association between management earnings forecast errors and accruals is stronger for firms where managers purchase (sell) shares following periods of high (low) accruals than firms where managers sell (purchase) shares following periods of high (low) accruals.
Alternative, if intentional misrepresentation underlies the positive association between
management forecast errors and accruals, we expect this positive association to be stronger when
11 Although non-information-based liquidity trading may add noises to our tests, it unlikely biases our inferences towards a particular direction.

14
accruals primarily serve to boost managers’ trading gains as opposed to revealing managers’
personal business assessment. In other words, we expect a stronger positive association between
management forecast errors and accruals when managers sell (purchase) shares following
periods of high (low) accruals.
H4b: Under the intentional misrepresentation explanation, the positive association between management earnings forecast errors and accruals is stronger for firms where managers sell (purchase) shares following periods of high (low) accruals than firms where managers purchase (sell) shares following periods of high (low) accruals.
IV. SAMPLE SELECTION AND RESEARCH DESIGN
Sample Selection
We collect management earnings forecasts for fiscal years 1996-2006 from the First
Call’s Company Issued Guidance (“CIG”) database. The sample period starts in 1996 because
the passage of the Private Securities Litigation Reform Act of 1995 expanded the safe-harbor
protection to firms issuing forward-looking information and thus changed firms’ legal
environment. We only include point and range forecasts because forecast errors are less clearly
defined for other forms of forecasts (such as open-ended and qualitative). To assure that
managers have knowledge of accruals when issuing next year’s earnings forecasts, for each firm-
year, we retain the first management earnings forecasts issued at or after current year (year t)
earnings announcement. To avoid confounding effects of year t+1 quarterly earnings, we
exclude management earnings forecasts issued at or after year t+1 first quarter earnings
announcement.12 We also exclude firms with insufficient data on the Compustat and CRSP to
12 Accruals information is fully disclosed in annual reports and may not be available at earnings announcements to outsiders, although an increasing percentage of firms voluntarily disclose balance sheet information (which can be used to infer accruals information) at earnings announcements (e.g., Louis et al. 2007). We assume that managers possess full knowledge of year t accruals by year t earnings announcement. Since a large proportion of management

15
measure accruals and related firm characteristics. The sample selection procedure, summarized
in Panel A of Table 1, yield a final sample of 1,648 firms with 4,443 firm-year observations. We
present the time-series distribution of the sample in Panel B of Table 1. As shown, the number of
forecasting firms increases over the sample period, consistent with an increasing propensity for
managers to provide earnings guidance.13
Research Design
To test our hypotheses, we regress management earnings forecast errors on accruals and
previously identified determinants of management forecast errors, using the ordinary least
squares (OLS) regression with standard errors adjusted for heteroscedasticity and firm-level
clustering (firm subscripts are suppressed):14
1
12111098
7165432
101
)(
)(
+
+
+
+++
++++++
++++++
+=
∑∑ tiiii
tttt
ttttt
Rttt
YearDummymmyIndustryDuBMNANALYSTSMVLnRETURNLITIGATION
TRADEXFINIndConAltmanZESURPROA
orWCACCWCACCMFE
εγλ
βββββ
ββββββ
βα
(1)
Where:
MFEt+1 = The first management forecast of year t+1 earnings per share (adjusted for stock splits and dividends) issued at or after year t earnings announcement but before year t+1 first quarter earnings announcement minus year t+1 actual earnings per share, scaled by the closing share price at the end of year t;
WCACCt
( RtWCACC )
= Working capital accruals (Decile Ranks of working capital accruals scaled to range from 0 to 1), measured as – [Increase in accounts
forecasts for year t+1 earnings are issued with year t earnings announcements (87% for our sample), this measurement window (from year t earnings announcement to year t+1 first quarter earnings announcement) allows us to collect a reasonable sample of management earnings forecasts without being confounded by year t+1 quarterly earnings realizations. Our results are qualitatively similar if we measure management forecast errors based on the first management earnings forecasts issued during the second quarter of year t+1. 13 The increasing trend in the number of forecasting firms may also reflect more comprehensive coverage by First Call since 1998 (Anilowski et al. 2007). 14 Specifically, we use SURVEYREG procedure and CLUSTER statement in SAS to account for the potential firm-level serial-correlation when estimating the coefficients and standard errors.

16
receivable (Compustat annual data item #302) + Increase in inventory (#303) + Decrease in accounts payable (#304) + Decrease in income tax payable (#305) + Net change in other accrued liabilities (#307)] / lagged total assets (#6);
ROAt = Return-on-assets, measured as earnings before extraordinary items (#123) divided by lagged total assets (#6);
ESURPt = Earnings surprise, measured as actual earnings for year t minus the most recent analyst consensus (median) forecast prior to year t earnings announcement (if the firm has no analyst following, we use earnings change), scaled by the closing share price at the end of year t;
AltmanZt = Altman’s Z score (Altman 1968), computed as [1.2 × working capital (#4 – #5) / total assets – 1.4 × retained earnings (#36) / total assets + 3.3 × operating income (#178) / total assets + 0.6 × market value of equity (#25×#199) / total liabilities (#181) + sales (#12) / total assets];
IndCont = Industry Concentration, measured as the Herfindahl index calculated as the sum of the squares of the market shares of the firms’ sales within each four-digit SIC industry;
XFINt+1 = External financing, measured as net equity financing plus net debt financing scaled by lagged total assets (#6), where net equity financing equals cash proceeds from the sale of common and preferred stock (#108) minus cash payments for the purchase of common and preferred stock (#115) minus cash payments for dividends (#127), and net debt issuance equals cash proceeds from the issuance of long-term debt (#111) minus cash payments for long-term debt reductions (#114) minus the net changes in current debt (#301);
TRADE = Net sales (in thousands of shares) from open market transactions or stock option transactions (i.e., option grants or option exercises) by the top five executives during the one-month period following management earnings forecasts (per Thomson Financial Insider Trading database);
LITIGATIONt = Equals one for litigious industries including Bio-technology (SIC 2833 to 2836), Computer Hardware (SIC 3570 to 3577), Electronics (SIC 3600 to 3674), Retailing (SIC 5200 to 5961), and Computer Software (SIC 7371 to 7379), and zero otherwise;
RETURNt = Buy-and-hold 12-month market-adjusted stock returns for year t; Ln(MVt) = Natural logarithm of market value of equity (MV), where MV equals
year-end stock price (#25) multiplied by common shares outstanding (#199), in millions of dollars;
NANALYSTS = Number of individual analyst’s forecasts in the most recent consensus analyst forecast prior to management earnings forecasts (per First Call);
BMt = Book-to-market ratio, measured as book value of equity (#60) divided by market value of equity (MV);
Industry Dummy = Fama-French 12 industry dummies; and Year Dummy = Year dummies.

17
Our primary interest is the coefficient on working capital accruals (i.e., β1). We focus on
working capital accruals because, relative to total accruals, they largely reflect managerial
estimation and projection about near-term earnings (e.g., stock inventory in anticipation of
improving market demand for the next year) as opposed to long-term earnings growth (e.g.,
increase plant investments to expand production capacity in anticipation of sustained future
growth). Thus, future earnings implications of working capital accruals are better aligned with
the forecasting horizon of management one-year-ahead earnings forecasts. Based on Hypothesis
1 (H1) which predicts a positive relation between management forecast errors and accruals, we
expect the coefficient β1 to be significantly positive.
We control for various factors that may affect management earnings forecast errors and
potentially confound the association between management forecast errors and accruals. First,
prior research suggest that managers of poorly performing firms or financially distressed firms
have greater incentives to provide optimistic earnings forecasts to support market earnings
expectations (e.g., Frost 1997; Koch 1999; Rogers and Stocken 2005; Rogers and Buskirk 2006).
Firms’ operating performance also directly affects the level of accruals through the accrual
accounting system. We thus include return-on-assets (ROA), prior year’s earnings surprises
(ESURP), and Altman’s Z-score (AltmanZ) to control for the potential impacts of firm
performance and distress risk on managers’ forecast errors and accruals.
Second, industry competition may motivate managers to hide firm profitability possibly
via pessimistic earnings forecasts (Newman and Sansing 1993). We thus include industry
concentration ratio (IndCon) to control for this effect. Third, we control for external financing
(XFIN) in the regression since external financing has been proposed as an important factor that
may induce managerial optimism in forecasting earnings (e.g., Frankel et al. 1995; Lang and

18
Lundholm 2000) as well as earnings inflation through income-increasing abnormal accruals (e.g.,
Teoh et al. 1998a, 1998b), although empirical findings concerning these conjectures are still
mixed.15 Fourth, incentives to maximize potential gains from trading the firm’s securities may
induce managers to issue biased earnings forecasts (Aboody and Kasznik 2000; Rogers and
Stocken 2005). We thus control for insider trading (TRADE) in the regression. Fifth, we include
a dummy variable identifying litigious industries (LITIGATION) since the litigation environment
affects managers’ incentives to intentionally bias voluntarily disclosed information (e.g., Skinner
1994, 1997; Baginski et al. 2002; Rogers and Stocken 2005). Sixth, McNichols (1989) finds a
significantly negative relation between management forecast errors and past stock returns,
arguing that management earnings forecast do not fully reflect information contained in
historical stock prices. We thus control for past stock returns (RETURN) in the regression.
We add several additional control variables relating to the general information
environment that may affect the cost-benefit tradeoff of issuing biased or inaccurate management
earnings forecasts. We control for firm size (MV) and analyst coverage (NANALYSTS) since
larger firms and firms followed by a larger number of analysts generally face greater public
scrutiny and thus have greater incentives to avoid excessive errors in management earnings
forecasts (e.g., Baginski et al. 2002). We also control for firm growth (BM) since high growth
firms’ valuation largely hinges on expected future cash flows (rather than the value of assets in
place), which intensifies the market demand and public scrutiny for forward-looking information
disclosures. In this case, managers may have incentives to forecast optimistically to “hype the
stock”, but also expose themselves to heightened litigation risks and loss of reputation. Rogers
and Stocken (2005) find an insignificant relationship between management forecast errors and
15 See footnote 9 for a discussion of the mixed empirical evidence.

19
firm growth. Finally, we add industry dummies and year dummies to control for fixed industry
and time effects. To mitigate the influences of outliers and errors in the data, we winsorize the
top and bottom one-percentiles of the regression variables (except IndCon, LITIGATION, and
NANALYSTS).
V. EMPIRICAL RESULTS Descriptive Statistics
Panel A of Table 2 outlines the descriptive statistics for our sample of 4,443 firm-years.
Consistent with prior studies showing optimistic biases in management earnings forecasts issued
early-in-the-year (e.g., Choi and Ziebart 2004), we find that the average management forecast
errors (MFEt+1) is significantly positive at 0.006. As also shown in the table, the average
working capital accruals (WCACC) and total accruals (TACC) are 0.014 and -0.059 respectively.
As expected, our sample contains large firms with average (median) market capitalization (MV)
of $5,241 million ($1,082 million).
Panel B of Table 2 contains pair-wise correlations between management forecast errors,
accruals, and other regression variables included in equation (1). We find that management
forecast errors are positively correlated with working capital accruals (Pearson correlation =
0.129) and total accruals (Pearson correlation = 0.092), suggesting that managers who issue more
optimistic (pessimistic) forecasts of next year’s earnings tend to report relatively high (low)
accruals. In addition, the correlations between working capital accruals and other regression
variables are mostly modest (correlations are mostly less than 0.1 in magnitude), suggesting that
multicolinearity concern unlikely affects our empirical inferences.

20
Univariate Analysis on the Relation between Management Forecast Errors and Accruals
Table 3 presents the mean and median of management forecast errors (MFEt+1) across
deciles of working capital accruals (WCACCt) portfolios. As shown, the mean (median) value of
MFEt+1 increases from 0.001 (-0.002) for the lowest WCACCt decile to 0.015 (0.003) for the
highest WCACCt decile. The difference in the mean (median) MFEt+1 between the highest and
lowest WCACCt deciles is statistically significant at less than 1% (1%) level based on a two-tail
t-test (z-test). To put these numbers into perspective, with a price-to-earnings ratio of 12 (the
sample median), the average management forecast errors in the lowest and highest WCACC
deciles amount to 1.2% and 18% of reported earnings, respectively. The positive relation
between MFEt+1 and WCACCt is also transparent as illustrated in Figure 1.
As a robustness check, we also examine the mean and median of MFEt+1 across deciles
of total accruals (TACCt). We measure total accruals as income before extraordinary items (#123)
minus operating cash flows (#308 – #124) deflated by lagged total assets (#6). Our findings are
also reported in Table 3. Similar to the results based on WCACCt, the mean and median MFEt+1
increase with the level of TACCt. In summary, the univariate results in Table 3 provide initial
evidence that managers reporting relatively high (low) accruals tend to issue more (less)
optimistically biased forecasts of next year’s earnings.
Multivariate Analysis on the Relation between Management Forecast Errors and Accruals
Table 4 presents the multivariate regression results from estimating equation (1). As
shown, the coefficient on WCACC is significantly positive (Coefficient = 0.084, t-stat = 4.44),
consistent with earlier univariate findings that management forecasts are relatively more
optimistic (pessimistic) following periods of high (low) accruals. The effect of WCACC on

21
management forecast errors is not only statistically significant, but also economically significant.
With a price-to-earnings ratio of 12 (the sample median), a 1% increase in working capital
accruals (as a percentage of total assets) would increase the errors in management forecasts by
about 0.84% of reported earnings (i.e., 12×0.070×1% = 0.84%). Results also show that this
positive coefficient remains highly significant when we measure WCACC using scaled decile
rankings (Coefficient = 0.011, t-stat = 3.85).16
As a robustness check, we again examine the relation between management forecast
errors and total accruals after controlling for other factors that also affect management forecast
errors. As reported under the last two columns of Table 4, the coefficient on TACC is
significantly positive (Coefficient = 0.046, t-statistics = 5.31) and so is the coefficient on TACCR
(Coefficient = 0.008, t-statistics = 4.35). Overall, results reported in Table 4 provide strong
evidence that management earnings forecasts are positively related to both working capital
accruals and total accruals, supporting Hypothesis 1 (H1).
Turning to control variables, we find a significantly positive coefficient on operating
performance (ROA), suggesting that managers appear to over-extrapolate past performance in
forecasting future earnings.17 We also observe that management earnings forecasts are more
optimistic when past earnings surprises (ESURP) are more negative, consistent with recent
16 In untabulate results, we find that management earnings forecast errors exhibit significantly positive relations with each major component of working capital accruals (including changes in receivable, changes in inventory, changes in accounts payable and other working capital accruals). 17 Our observed positive relation between management earnings forecast errors and accruals may be confounded by managers’ over-extrapolation of realized performance in forecasting earnings because high (low) accruals may result from superior (poor) economic performance and a neutral application of accounting rules, rather than managers’ proactive choices that aim to convey their personal assessment about the firm’s business prospects. To further ensure that our results are not driven by managers’ extrapolation of past economic performance, we identify cases where accruals are least likely driven by concurrent firm performance. Specifically, we select firms ranked in the top (bottom) quintile of WCACC but ranked in the bottom (top) quintile of ROA, and re-estimate equation (1) for these firms. Untabulated results show a significantly positive coefficient on WCACCR (Coefficient = 0.022, t-stat = 2.23), suggesting that over-extrapolation of past performance unlikely fully explain the positive association between management forecast errors and accruals.

22
evidence that managers bundle negative earnings surprises with optimistic earnings forecasts to
support market earnings expectations (Rogers and Buskirk 2006). In addition, we document a
significantly positive coefficient on LITIGATION, suggesting that managers in litigious
industries on average display greater optimism in forecasting earnings.18 We also find that past
stock returns are negatively related with management forecast errors, consistent with
McNichols’s (1989) finding that stock prices reflect information beyond that in management
earnings forecasts. Finally, larger firms and high growth firms tend to forecast more
conservatively in our sample.19
Influence of Uncertainty in Operating Environment on the Relation between Management Forecast Errors and Accruals
We propose that managerial mis-assessment of business prospects introduce common
errors in accruals and earnings forecasts, thus inducing a positive relation between management
forecast errors and accruals. Suppose this managerial mis-assessment explanation holds,
Hypothesis 2 (H2) predicts that the positive relation between management forecast errors and
accruals is stronger for firms operating in an uncertain business environment than firms
operating in a stable business environment.
We measure the uncertainty in operating environment based on three alternative proxies:
(1) cash flow volatility (CFOVOL), defined as standard deviation of operating cash flows
(divided by lagged total assets) over the prior five years scaled by the magnitude of average
18 This finding seems inconsistent with the deterrence effect of litigation on optimistic forecasts. One possibility is that litigation concern is more relevant for management forecasts issued shortly before the earnings announcement (see Soffer et al. 2000), but we focus on management forecasts issued early in the year. 19 Kasznik (1999) suggests that managers use positive discretionary accruals to manage reported earnings upward to minimize optimistic errors in management earnings forecasts. We thus include year t+1’s discretionary accruals (based on cross-sectional Modified Jones’ Model) to re-estimate equation (1). Similar as Rogers and Stocken (2005), we find an insignificant coefficient on next year’s discretionary accruals (untabulated). The coefficient on working capital accruals remains significantly positive.

23
operating cash flows (divided by lagged total assets) over the same period; (2) sales growth
volatility (SALESGRVOL), defined as standard deviation of sales growth over the prior five years
scaled by the average sales growth over the same period, and (3) operating cycle (OPCYCLE),
defined as average accounts receivable divided by sales plus average inventory divided by cost
of goods sold then multiplied by 365. These proxies are intended to capture multiple aspects of
environmental uncertainty. In particular, volatility in operating cash flows potentially originates
from unstable market conditions that affect the firms’ cash flow generating abilities; sales growth
volatility largely reflects temporal fluctuations in customer demand; and the length of operating
cycle depends on the firm’s production function and business model Collectively, these measures
parsimoniously capture the inherent uncertainty in measuring accruals and forecasting earnings.
As shown in Panel A of Table 5, the correlations among these measures are fairly low, consistent
with the idea that these variables reflect different dimensions of environmental uncertainty.
Panel B of Table 5 reports OLS regression results for equation (1) across subsamples of
firms ranked in the top, middle and bottom thirds of each environmental uncertainty proxy. For
firms ranked in the bottom third of CFOVOL, the coefficient on WCACCR is significantly
positive (Coefficient = 0.006, t-stat = 2.48). Moving to the subsample ranked in the top third of
CFOVOL, the magnitude of the coefficient on WCACCR is more than doubled (Coefficient =
0.013, t-stat = 3.46). The coefficient difference between the top and bottom subsamples is
statistically significant at less than 1% level based on a two-tail F-test. Similarly, we find that the
coefficient on WCACCR is significantly more positive for firms ranked in the top third of
SALESGRVOL or OPCYCLE than firms ranked in the bottom third of SALESGRVOL or
OPCYCLE.

24
As a sensitive check, we also examine how the positive relation between management
forecast errors and total accruals varies with the level of environment uncertainty. In untabulated
results, we find that the positive relation between management forecast errors and totals accruals
is significantly stronger for subsample firms ranked in the top third of CFOVOL, SALESGRVOL
or OPCYCLE, respectively, than their bottom-third counterparts. These results are consistent
with the conjecture that managers who cope with a highly uncertain operating environment likely
make greater errors in assessing the firm’s business prospects, thus strengthening the positive
relation between management forecast errors and accruals.
Influence of Accrual-Growth Co-variation on the Relation between Management Forecast Errors and Accruals
Suppose managerial mis-assessment of business prospects contribute to the positive
relation between management forecast errors and accruals, Hypothesis 3 (H3) predicts that this
positive relation is stronger when accruals highly co-vary with growth-related activities that
reflect managerial projections about firms’ future prospects.
We use growth in the number of employees to capture managers’ projections about firm’s
business prospects (Zhang 2007). Employee growth reflects managers’ growth expectations as
revealed through human capital investment decisions and is free of any biases in the firm’s
financial reporting system.20 Similar as Zhang (2007), we categorize industries based on the co-
variation of accruals with growth in the number of employees. Specifically, for each year, we
regress working capital accruals (scaled by lagged total assets) on concurrent employee growth
within each Fama-French 48-industry classification. The coefficient on employee growth
20 Zhang (2007) argues that growth in the number of employees is a better measure for firm growth than conventional growth measures based on financial information (such as market-to-book, growth in cash sales, growth in total assets, etc.) because employee growth is a non-accounting-based variable and, therefore, is free of any measurement error or discretionary choices inherent in the accounting system.

25
represents the extent to which accruals co-vary with concurrent employment decisions. We then
rank industries based on the average co-variation between accruals and employee growth over
our sample period (COV_ACCREMPGR). As expected, retailers, wholesalers, and manufacturers
tend to have high co-variation between accruals and employee growth. For example, the top five
industries with the highest COV_ACCREMPGR include Tobacco Products, Wholesale,
Chemicals, Machinery and Fabricated Products. On the other extreme, service and agriculture
production industries often have low accrual-growth co-variation. In particular, Trading, Coal,
Entertainment, Insurance and Agriculture are among the industries exhibiting the lowest co-
variation between accruals and employee growth.
Panel A of Table 6 provides summary statistics for COV_ACCREMPGR. As shown, the
inter-industry variation in this variable is large, ranging from 0.009 in the lower quartile to 0.074
in the upper quartile. Panel B of Table 6 reports OLS regression results for equation (1) across
industries ranked in the top, middle, and bottom thirds of COV_ACCREMPGR. Results show
that the relation between management forecast errors and working capital accruals is
insignificant for industries exhibiting the lowest co-variations between working capital accruals
and employee growth (Coefficient = 0.002, t-stat = 0.35). In contrast, for industries in which
working capital accruals co-vary strongly with employee growth, the coefficient on WCACCR is
significantly positive (Coefficient = 0.012, t-stat = 3.75). The coefficient difference between
these two subsamples is statistically significant at less than 1% level based on a two-tail F-test.
We similarly construct the accrual-employee growth co-variation based on total accruals
(COV_TACCREMPGR). In untabulated results, we find that the association between
management forecast errors and totals accruals is statistically insignificant for industries ranked
among the bottom third of COV_TACCREMPGR, whereas this association is significantly

26
positive for industries ranked in the top third of COV_TACCREMPGR. These results further
support the conjecture that managerial mis-assessment of business prospects, which manifests in
both accruals and management earnings forecasts, contributes to the positive relation between
management forecast errors and accruals.
Intentional Misrepresentation as an Alternative Explanation
While we have proposed that the positive association between management forecast
errors and accruals is caused by managers’ unintentional errors in assessing firms’ future
prospects, this positive association could also arise from managers’ intentional misrepresentation
of their earnings forecasts and accruals. That is, managers may intentionally bias their earnings
forecasts upward (downward) when reported accruals are relatively high (low), even though they
fully understand that high (low) accruals are likely followed by poorer (better) performance than
forecasted.
To distinguish between these two explanations, we examine the implications of insider
trading on the association between management forecast errors and accruals. We measure insider
trading based on net acquisition/disposition of stocks and options by the top five executives
(CEO, Chairman, CFO, COO, and Vice President) during the one-month period following the
management forecasts. Under the unintentional mis-assessment explanation, Hypotheses 4a (H4a)
predicts that the positive association between management earnings forecast errors and accruals
is stronger when managers purchase (sell) shares following periods of high (low) accruals. Under
the alternative intentional misrepresentation explanation, Hypotheses 4b (H4b) predicts that the
positive association between management earnings forecast errors and accruals is stronger when
managers sell (purchase) shares following periods of high (low) accruals. We thus form two

27
subsamples of firms to test these hypotheses. Sample A consists of firm-years ranked in the top
(bottom) quintile of WCACC and with managers’ share purchases (sales) subsequent to
management forecasts. Sample B includes firm-years ranked in the top (bottom) quintile of
WCACC and with managers’ share sales (purchases) following management forecasts. We
expect Sample A to represent cases where the level of accruals more likely reflects managers’
personal beliefs about future firm performance, and Sample B to identify cases where accruals
are more likely manipulated to boost managers’ trading profitability.
Table 7 reports OLS regression results for equation (1) for Sample A and Sample B. As
shown, for Sample A where accruals more likely reflect managers’ true beliefs about future firm
performance, the coefficient on WCACCR is significantly positive (Coefficient = 0.013, t-stat =
2.77). In contrast, the coefficient on WCACCR is insignificant (Coefficient = 0.001, t-stat = 0.10)
for Sample B where accruals are more likely manipulated to boost trading gains.
In untabulated sensitivity checks, we find that the relation between management forecast
errors and total accruals is significantly positive when total accruals are likely to reflect
managers’ true beliefs about future firm performance (i.e., top/bottom quintile of TACC followed
by share purchases/sales). In contrast, we no longer observe a significant association between
management forecast errors and total accruals when total accruals are likely manipulated to boost
managers’ trading gains (i.e., top/bottom quintile of TACC followed by share sales/purchases).
These results do not support the conjecture that managerial self-serving incentives lead to
intentional misrepresentation in managers’ multiple information disclosures such as accruals and
earnings forecasts. On the contrary, these results provide strong supporting evidence for the
unintentional explanation that the reflection of managers’ imperfect business assessment in both
disclosures causes the positive relationship.

28
To further corroborate our findings, we examine insider trading activities for firm-years
that drive the positive association between management forecast errors and accruals. Specifically,
we select firm-years ranked in the top (bottom) quintile of WCACC and also issued optimistic
(pessimistic) earnings forecasts. Untabulated results show that when top quintile accruals are
followed by optimistic management forecasts, a majority of managers (54%) purchase, as
opposed to sell, shares. On the other hand, when bottom quintile accruals are followed by
pessimistic management forecasts, a majority of managers (55%) chooses to sell, rather than
purchase, shares. These results again are inconsistent with managers’ intentional
misrepresentation of accruals and earnings forecasts to enhance trading profitability.
VI. SUPPLEMENTARY ANALYSIS: THE INFLUENCE OF MANAGEMENT EARNINGS FORECASTS ON ACCRUAL MISPRICING
Prior literature generally advocates voluntary disclosure as a valuable source of
information that helps reduce mispricing of accounting information (e.g., Drake et al. 2007;
Kimbrough 2005; Louis et al. 2007). However, given management earnings forecasts contain
predictable errors in relation to accruals (as suggested in our findings above), it is ex ante unclear
whether biased management earnings forecasts are able to facilitate more efficient pricing of
accruals information. On one hand, managers’ optimistic (pessimistic) forecasts following
periods of high (low) accruals may exacerbate investors’ over-reaction to accruals. On the other
hand, biased management earnings forecasts may still be able to improve earnings expectations
formed without management forecasts and thus help investors better understand accruals.
Empirically, it is also possible that managers, analysts, and investors all make similar judgmental
errors in projecting the firm’s business prospects, which implies a null effect of management
earnings forecasts on accrual mispricing.

29
We address this issue by testing whether the availability of management earnings
forecasts affects the profitability from an accrual-based trading strategy. Specifically, we
estimate the following model using ordinary least squares (OLS) regression with standard errors
adjusted for heteroscedasticity and firm-level clustering:
165432
1211211
+
+
++++++
×+×++=
ttR
ttRt
Rt
Rt
Rtt
IMRatioEPBETABMMV
MFWCACCNoMFWCACCMFNoMFSARET
εβββββ
ββαα (2)
where SARETt+1 is the buy-and-hold 12-month size-adjusted returns cumulated from the fourth
month after the end of year t and estimated strictly following the recommendation of Kraft et al.
(2006). NOMF (MF) is a dummy variable that equals one (zero) for firm-years having no
management earnings forecasts issued during the year (based on First Call’s population), and
zero (one) for firm-years having at least one management one-year-ahead earnings forecast
issued at or after year t earnings announcement and before year t+1 first quarter earnings
announcement (i.e., the same sample used in earlier analyses). WCACCR, MVR, BMR, and EPR are
decile ranks of WCACC, MV, BM, and EP (earnings-to-price ratio), scaled to range from 0 to1.
BETA is market beta estimated over the 36-month period prior to the end of year t.
Since managers have ample flexibilities to either withhold or provide earnings forecasts,
we control for the endogenous nature of the management forecast issuance decision by including
the Inverse Mill’s Ratio (IMRatio) generated from the following probit regression aiming to
predict the issuance decision of management earnings forecasts.
))(
()1Pr(
1
109876
5143210
+
+
+++
+++++
+++++==
∑∑ tiiii
tttt
ttttt
YearDummymmyIndustryDuBMNANALYSTSMVLnLITIGATIONEARNVOL
RTNVOLAFEERCROAWCACCfMF
εγλ
βββββ
βββββα
(3)
Following Lennox and Park (2006), we include return-on-assets (ROA), earnings
response coefficient (ERC), the magnitude of analyst forecast errors (|AFE|), return volatility

30
(RTNVOL), earnings volatility (EARNVOL), litigious industry dummy (LITIGATION), firm size
(LnMV), analyst following (NANALYSTS), book-to-market ratio (BM), and industry and year
dummies (See Lennox and Park (2006) for details on variable measurement).21 In addition, we
include the magnitude of working capital accruals because more extreme accruals are generally
more difficult to assess by analysts and outside investors (e.g., Sloan 1996; Bradshaw et al.
2001). To reduce information asymmetry, managers therefore may have greater incentive to
provide earnings forecasts when accruals are more extreme.
Panel B of Table 8 reports our findings from estimating equation (2). As shown under the
column Model (2), the coefficients on WCACCR×NoMF and WCACCR×MF are both significantly
negative with similar statistical significance levels (Coefficient = -0.055 and -0.054, t-statistics =
-2.22 and -2.23, respectively). A formal test of the difference in these two coefficients cannot
reject the null of no difference (two-tail p-value = 0.965), suggesting that investors appear to
overreact to working capital accruals to the same extent regardless of whether managers provide
earnings forecasts or not.22 Hence, management earnings forecasts do not appear to help market
participants better assess accruals’ implications for future earnings. Consistent with prior studies,
we also find that future size-adjusted returns are positively related with book-to-market ratio and
market beta and negatively related with firm size (e.g., Fama and French 1992; Basu 1977; Sloan
1996; Desai et al. 2004).
VII. CONCLUSION
21 Lennox and Park (2006) also include analyst forecast revisions of two-period-head earnings. We do not include analyst forecast revisions of two-year-ahead earnings since doing so will substantially reduce our sample size. 22 We also examine the impact of management earnings forecasts on accrual mispricing conditional on the environmental uncertainty or accruals-growth co-variation. Untabulated results show that the differences between the accrual-based hedge portfolio returns are statistically insignificant between firms with relatively stable versus highly uncertain operating environment and across industries exhibiting low versus high co-variation between accruals and employee growth.

31
This paper documents that managers tend to forecast next year’s earnings more
optimistically (pessimistically) when current year’s accruals are relatively high (low), and that
managers’ unintentional mis-assessment of firm’s business prospects likely contributes to the
positive relation between management earnings forecast errors and accruals.
Our findings have important implications for the general investment community and
academic researchers. First, the positive relation between management forecasts errors and
accruals cautions investors to carefully evaluate forward-looking information disclosures from
the management when forming earnings expectations. Second, the empirical evidence implies
that voluntary disclosure may not always facilitate efficient pricing of accounting information
due to the possibility that voluntarily disclosed information may contain predictable errors that
are correlated with reported accounting information. This perspective stands in contrast to the
conclusion in many prior studies that voluntary disclosure provides useful information that helps
outsiders better understand accounting information reported in regulatory filings (e.g.,
Kimbrough 2005; Drake et al. 2007; Louis et al. 2007). Regulators and standard setters should be
aware of the possibility that expanded voluntary disclosure, when containing predictable errors
related to mandatory disclosure, may not facilitate more efficient pricing of mandatorily
disclosed information. Lastly, our findings suggest that future research examining the sources of
market mispricing of accounting information needs to consider corporate insiders’ inefficiency in
assessing business prospects, in addition to outsiders (such as investors’ and analysts’)
inefficiency in information processing.

32
REFERENCES Aboody, D., and R. Kasznik. 2000. CEO stock option awards ad the timing of corporate
voluntary disclosures. Journal of Accounting and Economics 29 (3): 73-100. Ajinkya, B., and M. J. Gift. 1984. Corporate managers' earnings forecasts and symmetrical
adjustments of market expectations. Journal of Accounting Research 22 (2): 425-444. Altman, E. 1968. Financial ratios, discriminant analysis and the prediction of corporate
bankruptcy. The Journal of Finance 23 (4): 589-609. Anilowski, C., M. Feng, and D. Skinner. 2007. Does earnings guidance affect market returns?
The nature and information content of aggregate earnings guidance. Journal of Accounting and Economics 44 (1-2): 36-63.
Baginski, S, E. Conrad, and M. Kimbrough. 2002. The effect of legal environment on voluntary
disclosure: Evidence from management earnings forecasts issued in U.S. and Canadian markets. The Accounting Review 77 (1): 25-50.
Baker, T., Collins, D., Reitenga, A., 2003. Stock option compensation and earnings management
incentives. Journal of Accounting, Auditing and Finance 18: 557-582. Ball, R. and L. Shivakumar, 2007, Earnings quality at initial public offerings: Managerial
opportunism or public-firm conservatism. Journal of Accounting and Economics (forthcoming).
Bamber, L. S., and Y. S. Cheon. 1998. Discretionary management earnings forecast disclosures:
Antecedents and outcomes associated with forecast venue and forecast specificity choices. Journal of Accounting Research 36 (2): 167-190.
Basu, S. 1977. Investment performance of common stocks in relation to their price-earnings
ratios: A test of the efficient market hypothesis. Journal of Finance 32 (3): 663-682. Ben-David, I., J. R. Graham and C.R. Harvey. 2007. Managerial overconfidence and corporate
policies. Working Paper. University of Chicago Bradshaw, M., S. Richardson, and R. Sloan. 2001. Do analysts and auditors use information in
accruals? Journal of Accounting Research 39 (June): 45-74. Choi, J. H., and D. A. Ziebart. 2004. Management earnings forecasts and the market’s reaction to
predicted bias in the forecast. Asia-Pacific Journal of Accounting and Economics 11 (2): 167-192.
Collins, D. W., G. Gong, and P. Hribar. 2003. Investor sophistication and the mispricing of
accruals. Review of Accounting Studies 8 (2-3): 251-276.

33
Comment, R., and G. Jarrell. 1991. The relative signaling power of Dutch-auction and fixed-price self-tender offers and open-market share repurchases. Journal of Finance 46: 1243-1271.
Cox, C. 1985. Further evidence on the representativeness of management earnings forecasts. The
Accounting Review 60 (3): 692-701. Dechow, P. 1994. Accounting earnings and cash flows as measures of firm performance: The
role of accounting accruals. Journal of Accounting and Economics 18 (1): 3-42. Dechow, P., S. Richardson, and R. Sloan. 2006. The persistence and pricing of the cash
component of earnings. Working Paper. University of Michigan. Desai, H., S. Rajgopal, and M. Venkatachalam. 2004. Value-glamour and accruals mispricing:
One anomaly or two? The Accounting Review 79 (2): 355-385. Drake, M. S., J. N. Myers and L. A. Myers. 2007. Disclosure quality and the mispricing of
accruals and cash flow. Working Paper, Texas A&M University. Fama E., and K. French. 1992. The cross-section of expected stock returns. Journal of Finance,
47 (3): 427-465. Fairfield, P., S. Whisenant and T. Yohn. 2003. Accrued earnings and Growth: Implications for
future profitability and market mispricing. The Accounting Review 78 (1): 353-371. Francis J., D. Philbrick, and K. Schipper. 1994. Shareholder litigation and corporate disclosure.
Journal of Accounting Research 32: 137-164. Frankel, R., M. McNichols and G. P. Wilson. 1995. Discretionary disclosure and external
financing. The Accounting Review 70 (1):135-150. Frost, C. 1997. Disclosure policy choices of U.K. firms receiving modified audit reports. Journal
of Accounting and Economics 23 (2): 163-187. Gong, G., H. Louis, and A. Sun. 2008. Earnings management and firm performance following
open-market repurchases. Journal of Finance 63 (2): 947-986. Graham, J., C. R. Harvey, and S. Rajgopal. 2005. The economic implications of corporate
financial reporting. Journal of Accounting and Economics 40: 3-73. Healy, P. M. and K. G. Palepu. 2001. Information asymmetry, corporate disclosure, and the
capital markets: A review of the empirical disclosure literature. Journal of Accounting and Economics 31: 405-440.
Hirshleifer, D. 2001. Investor psychology and asset pricing. Journal of Finance 56, 1533–1596.

34
Hutton, A., and P. Stocken. 2007. Effect of reputation on the credibility of management forecasts. Working Paper, Boston College.
Ikenberry, D., J. Lakonishock, and T. Vermaelen. 1995. Market underreaction to open market
share repurchases. Journal of Financial Economics 39: 181-208. Kasznik, R., and B. Lev. 1995. To warn or not to warn: Management disclosure in the face of an
earnings surprise. The Accounting Review 70 (1): 113-134. Khan, M. 2007. Are accruals mispriced? Evidence from tests of an intertemporal capital asset
pricing model. Journal of Accounting and Economics 45 (1): 55-77. Kimbrough, M. D. 2005. The effect of conference calls on analyst and market underreaction to
earnings announcements. The Accounting Review 80: 189-219. Koch, A. 1999. Financial distress and the credibility of management earnings forecasts. Working
Paper, Carnegie Mellon University. Kothari, S. P. 2001. Capital markets research in accounting. Journal of Accounting and
Economics 31: 105-231. Kraft, A., A. J. Leone, and C. Wasley. 2006. An analysis of the theories and explanations
offered for the mispricing of accruals and accrual components. Journal of Accounting Research 44 (May): 297-339.
Kraft, A., A. J. Leone, and C. Wasley. 2007. Regression-based tests of the market pricing of
accounting numbers: The Mishkin test and ordinary least squares. Journal of Accounting Research, forthcoming.
Lang, M. H., and R. J. Lundholm. 2000. Voluntary disclosure and equity offerings: Reducing
information asymmetry or hyping the stock? Contemporary Accounting Research 17 (4): 623-662.
Lennox, C., and C. Park. 2006. The informativeness of earnings and management’s issuance of
earnings forecasts. Journal of Accounting and Economics 42: 439-458. Louis, H., D. Robinson, and A. Sbaraglia. 2007. An integrated analysis of the association
between accrual disclosure and the abnormal accrual anomaly. Review of Accounting Studies, forthcoming.
Malmendier, U. and G. Tate. 2003. Who makes acquisitions? CEO overconfidence and the
market’s reaction. Journal of Financial Economics, forthcoming. Malmendier, U. and G. Tate. 2005. CEO overconfidence and corporate investment. Journal of
Finance 60 (6): 2661-2700.

35
McNichols, M. 1989. Evidence of informational asymmetries from management earnings forecasts and stock returns. The Accounting Review 64 (January): 1-27.
Newman, P., and R. Sansing. 1993. Disclosure policies with multiple users. Journal of
Accounting Research 31 (1): 92-112. Ng, J., 2005. Distress risk information in accruals. Working Paper, University of Pennsylvania. Pownall, G., and G. Waymire. 1989. Voluntary disclosure credibility and securities prices:
Evidence from management earnings forecasts, 1969-73. Journal of Accounting Research 27 (2): 227-245.
Roger, J., and A. Buskirk. 2006. Management forecasts bundled with negative earnings surprises:
credibility-building versus opportunism. Working Paper, University of Chicago. Rogers, J., and P.C. Stocken. 2005. Credibility of management forecast. The Accounting Review
80 (4): 1233-1260 Shivakumar, L. 2000. Do firms mislead investors by overstating earnings before seasoned equity
offerings? Journal of Accounting and Economics 29: 339-371. Skinner, D. 1994. Why firms voluntarily disclose bad news. Journal of Accounting Research 32
(1): 38-60. Skinner, D. 1997. Earnings disclosure and stockholder lawsuits. Journal of Accounting and
Economics 23 (3): 249–282. Sloan, R. G. 1996. Do stock prices fully reflect information in accruals and cash flows about
future earnings? The Accounting Review 71 (3): 289-315. Soffer, L.C., S.R. Thiagarajan, and B. Walther. 2000. Earnings preannouncement strategies.
Review of Accounting Studies 5 (1): 5–26. Subramanyam K. R. 1996. The pricing of discretionary accruals. Journal of Accounting and
Economics 22 (1-3): 249-281. Tasker, S. 1998. Bridging the information gap: quarterly conference calls as a medium for
voluntary disclosure. Review of Accounting Studies 3 (1998): 137-167. Teoh, S. H., I. Welch, and T. J. Wong. 1998a. Earnings management and the underperformance
of seasoned equity offerings. Journal of Financial Economics 50 (October): 63–99. Teoh, S. H., I. Welch, and T. J. Wong. 1998b. Earnings management and the long-run market
performance of initial public offerings. The Journal of Finance 53 (December): 1935–1974.

36
Waymire, G. 1984. Additional evidence on the information content of management earnings forecasts. Journal of Accounting Research 22 (2): 703-718.
Waymire, G. 1985. Earnings volatility and voluntary management forecast disclosure. Journal
of Accounting Research 23 (1): 268-295. Williams, P. 1996. The relation between a prior earnings forecast by management and analyst
response to a current management forecast. The Accounting Review 71 (1): 103-115. Wu, G., L. Zhang, and F. Zhang. 2007. The accrual anomaly: Exploring the optimal investment
hypothesis. Working Paper, University of Georgia. Xie, H. 2001. The mispricing of abnormal accruals. The Accounting Review 76 (3): 357- 373. Zhang, F. 2007. Accruals, investment, and the accrual anomaly. The Accounting Review 82 (5):
1333-1363.

37
FIGURE 1 Management Earnings Forecast Errors across Working Capital Accruals Deciles
This figure presents mean and median management forecast errors (MFE) across deciles of working capital accruals (WCACC). MFE is measured as the first management forecast of year t+1’s earnings per share issued during the period from year t’s earnings announcement to year t+1’s first quarter earnings announcement minus actual earnings per share for year t+1, scaled by closing share price at the beginning of year t+1. WCACC is measured as increase in accounts receivable (-Compustat annual data item #302) plus increase in inventory (-#303) plus decrease in accounts payable (-#304) plus decrease in income tax payable (-#305) plus net change in other accrued liabilities (-#307) for year t, deflated by lagged total asset (#6) (missing values of #304, #305, and #307 are replaced with zero in computing WCACC). Firm-year observations are ranked annually and assigned in equal numbers to decile portfolios based on WCACC. The sample has 4,911 firm-years for which WCACC and control variables in Equation (1) are available from the Compustat Annual file and CRSP, and quantitative (point or range) management forecasts are available on the First Call’s Company Issued Guidance (“CIG”) file. Sample period from 1996 to 2006.

38
TABLE 1 The Sample
Panel A: Sample Selection # Annual management earnings forecasts for fiscal years 1996-2006 38,357
Less: Qualitative, maximum and minimum management earnings forecasts (3,837) Less: Missing earnings announcement dates from Compustat (2,129)
# Point and range annual management earnings forecasts 32,391 Representing firm-years 11,260
Less: management forecasts issued prior to year t earnings (25,629) announcement or after year t+1 first quarter earnings announcement # Management earnings forecasts issued at or after year t earnings announcement but before year t+1 first quarter earnings announcement 6,762 Representing firm-years 5,794
Less: firm-years missing control variables in Equation (1) (from 1995-2005) (1,351) Final Sample: 4,443 Panel B: Distribution of the Management Forecast Sample
Forecast Year # firm-years % 1996 37 0.83 1997 61 1.37 1998 74 1.67 1999 143 3.22 2000 154 3.47 2001 453 10.2 2002 548 12.33 2003 648 14.58 2004 780 17.56 2005 755 16.99 2006 790 17.78 Total 4,443 100.00

39
TABLE 2 Descriptive Statistics and Correlation Matrix
Panel A: Descriptive Statistics
Variable Mean Standard
DeviationLower
Quartile MedianUpper
Quartile N MFEt+1 0.006 0.038 -0.006 0.000 0.011 4,443WCACCt 0.014 0.062 -0.015 0.007 0.035 4,443TACCt -0.059 0.081 -0.093 -0.052 -0.021 4,443ROAt 0.062 0.104 0.030 0.062 0.106 4,443ESURPt 0.001 0.029 0.000 0.001 0.003 4,443AltmanZt 5.292 5.195 2.439 3.790 6.081 4,443IndCont 0.234 0.183 0.103 0.190 0.313 4,443XFINt+1 0.022 0.269 -0.059 -0.009 0.034 4,443TRADE (thousand) -0.013 0.181 0.000 0.000 0.000 4,443LITIGATIONt 0.305 0.460 0.000 0.000 1.000 4,443RETURNt 0.189 0.609 -0.154 0.073 0.356 4,443MVt ($millions) 5241.090 13104.370 384.249 1082.320 3669.740 4,443NANALYSTSt 7.265 6.615 2.000 6.000 11.000 4,443BMt 0.461 0.342 0.239 0.382 0.590 4,443

40
Panel B: Correlations among Regression Variables
(1) (2) (3) (4) (5) (6) (7) (8) (9) (10) (11) (12) (13) (14)
(1) MFEt+1 0.129 0.092 -0.051 -0.118 -0.055 0.013 -0.026 -0.007 0.019 -0.145 -0.059 -0.090 0.224
(2) WCACCt 0.153 0.633 0.082 0.054 0.107 0.029 0.045 0.027 -0.062 -0.001 -0.033 -0.046 -0.034
(3) TACCt 0.115 0.641 0.343 0.145 0.003 0.058 -0.020 0.009 -0.110 -0.025 0.018 -0.051 0.028
(4) ROAt -0.059 0.078 0.152 0.199 0.283 0.050 -0.125 0.067 -0.030 0.134 0.120 0.103 -0.273
(5) ESUEPt -0.162 -0.020 0.036 0.131 0.024 0.010 0.035 0.022 0.010 0.133 -0.011 -0.022 -0.108
(6) AltmanZt -0.032 0.053 -0.019 0.572 0.027 -0.027 0.063 0.063 0.178 0.205 0.060 0.056 -0.332
(7) IndCont 0.005 0.055 0.067 0.077 0.020 0.082 -0.009 -0.013 -0.214 0.001 0.021 -0.101 0.003
(8) XFINt+1 0.012 0.104 0.033 -0.110 0.076 -0.004 -0.047 0.028 0.040 0.123 -0.088 -0.101 -0.042
(9) TRADE -0.048 0.022 -0.013 0.104 0.075 0.115 0.008 0.055 -0.010 0.076 -0.063 -0.050 -0.017
(10) LITIGATIONt 0.017 -0.075 -0.113 0.049 -0.005 0.240 -0.237 0.052 0.008 0.022 0.096 0.168 -0.093
(11) RETURNt -0.173 -0.071 -0.062 0.157 0.206 0.140 0.008 0.089 0.100 -0.020 -0.054 -0.097 -0.230
(12) MVt -0.132 -0.076 -0.003 0.188 -0.094 0.002 -0.041 -0.222 -0.052 -0.009 0.025 0.524 -0.212
(13) NANALYSTSt -0.074 -0.035 -0.042 0.133 -0.176 0.046 -0.111 -0.107 -0.018 0.130 -0.061 0.692 -0.252
(14) BMt 0.159 -0.021 0.087 -0.481 -0.021 -0.442 -0.018 0.059 -0.090 -0.126 -0.259 -0.382 -0.260 Panel A presents descriptive statistics for the sample. Panel B presents Pearson correlations (above diagonal) and Spearman correlations (below diagonal) between management forecast biases, accruals, and other regression variables. Bold figures indicate significance levels at less than 1%. Variable definitions: MFEt+1 = The first management forecast of year t+1 earnings per share (adjusted for stock splits and dividends) issued at or after year t earnings
announcement but before year t+1 first quarter earnings announcement minus year t+1 actual earnings per share, scaled by the closing share price at the end of year t;
WCACCt
= Working capital accruals, measured as – [Increase in accounts receivable (Compustat annual data item #302) + Increase in inventory (#303) + Decrease in accounts payable (#304) + Decrease in income tax payable (#305) + Net change in other accrued liabilities (#307)] / lagged total assets (#6);
TACCt = Total accruals, measured as income before extraordinary items (#123) minus operating cash flows (#308 – #124) deflated by lagged

41
total assets (#6). ROAt = Return-on-assets, measured as earnings before extraordinary items (#123) divided by lagged total assets (#6); ESURPt = Earnings surprise, measured as actual earnings for year t minus the most recent analyst consensus (median) forecast prior to year t
earnings announcement (if the firm has no analyst following, we use earnings change), scaled by the closing share price at the end of year t;
AltmanZt = Altman’s Z score (Altman 1968), computed as [1.2 × working capital (#4 – #5) / total assets – 1.4 × retained earnings (#36) / total assets + 3.3 × operating income (#178) / total assets + 0.6 × market value of equity (#25×#199) / total liabilities (#181) + sales (#12) / total assets];
IndCont = Industry Concentration, measured as the Herfindahl index calculated as the sum of the squares of the market shares of the firms’ sales within each four-digit SIC industry;
XFINt+1 = External financing, measured as net equity financing plus net debt financing scaled by lagged total assets (#6), where net equity financing equals cash proceeds from the sale of common and preferred stock (#108) minus cash payments for the purchase of common and preferred stock (#115) minus cash payments for dividends (#127), and net debt issuance equals cash proceeds from the issuance of long-term debt (#111) minus cash payments for long-term debt reductions (#114) minus the net changes in current debt (#301);
TRADE = Net sales (in thousands of shares) from open market transactions or stock option transactions (i.e., option grants or option exercises) by the top five executives during the one-month period following management earnings forecasts (per Thomson Financial Insider Trading database);
LITIGATIONt = Equals one for litigious industries including Bio-technology (SIC 2833 to 2836), Computer Hardware (SIC 3570 to 3577), Electronics (SIC 3600 to 3674), Retailing (SIC 5200 to 5961), and Computer Software (SIC 7371 to 7379), and zero otherwise;
RETURNt = Buy-and-hold 12-month market-adjusted stock returns for year t; Ln(MVt) = Natural logarithm of market value of equity (MV), where MV equals year-end stock price (#25) multiplied by common shares
outstanding (#199), in millions of dollars; NANALYSTS = Number of individual analyst’s forecasts in the most recent consensus analyst forecast prior to management earnings forecasts (per
First Call); BMt = Book-to-market ratio, measured as book value of equity (#60) divided by market value of equity (MV); Industry Dummy = Fama-French 12 industry dummies; and Year Dummy = Year dummies.

42
TABLE 3 Univariate Relation between Management Forecast Errors and Accruals
Across WCACCt Ranks Across TACCt Ranks Decile Ranks of WCACCt or TACCt Mean MFEt+1
(%Positive) Median MFEt+1 Mean MFEt+1
(%Positive) Median MFEt+1
Lowest 0.001 -0.002 0.000 -0.001
(39%) (44%) 2 0.003 -0.002 0.004 -0.001 (42%) (43%) 3 0.004 -0.001 0.005 0.000 (44%) (45%) 4 0.006 0.000 0.004 0.000 (46%) (45%) 5 0.005 0.000 0.004 0.000 (48%) (45%) 6 0.005 0.000 0.006 0.000 (50%) (48%) 7 0.004 0.000 0.006 0.001 (51%) (52%) 8 0.007 0.001 0.008 0.001 (53%) (54%) 9 0.010 0.003 0.008 0.002 (58%) (55%)
Highest 0.015 0.003 0.014 0.003 (60%) (59%)
Highest - Lowest 0.014 0.005 0.014 0.004 [p-value] [0.000] [0. 000] [0.000] [0. 000]
This table reports the mean and median of management earnings forecast errors (MFE) across deciles of working capital accruals (WCACC) and total accruals (TACC). The percentage of optimistic management earnings forecasts (%Positive) are reported in parentheses. See Table 2 for variable definitions. *** indicate significance level at less than 1% based on two-tail t-tests (z-tests) on the mean (median) difference in MFE across the highest and the lowest accrual deciles. Sample period from 1996 to 2006.

43
TABLE 4 Ordinary Least Squares Regressions of Management Forecast Errors on Accruals
Coeff.
(t-stat) Coeff. (t-stat)
Coeff. (t-stat)
Coeff. (t-stat)
WCACCt 0.070*** (5.94) WCACCt
R 0.010*** (5.26) TACCt 0.046*** (5.31) TACCt
R 0.008*** (4.35) ROAt 0.022*** 0.023*** 0.011 0.019** (2.80) (3.02) (1.42) (2.41) ESURPt -0.121*** -0.118*** -0.126*** -0.120*** (-3.31) (-3.23) (-3.44) (-3.26) AltmanZt 0.000 0.000 0.000 0.000 (-1.54) (-1.25) (-0.65) (-0.90) IndCont 0.003 0.004 0.003 0.003 (0.91) (0.93) (0.87) (0.90) XFINt+1 -0.002 -0.002 -0.002 -0.002 (-0.93) (-0.90) (-0.95) (-0.90) TRADE -0.002 -0.002 -0.002 -0.002 (-0.94) (-0.91) (-0.81) (-0.78) LITIGATIONt 0.005*** 0.005*** 0.004** 0.004** (2.76) (2.64) (2.50) (2.47) RETURNt -0.007*** -0.007*** -0.007*** -0.007*** (-6.49) (-6.49) (-6.47) (-6.54) Ln(MVt) -0.002*** -0.003*** -0.003*** -0.003*** (-3.72) (-3.88) (-4.29) (-4.36) NANALYSTSt 0.000 0.000 0.000 0.000 (0.47) (0.57) (1.04) (0.97) BMt
0.016*** 0.015*** 0.014*** 0.014*** (4.34) (4.30) (3.87) (3.92) Intercept 0.017 0.016 0.025** 0.019 (1.50) (1.39) (2.23) (1.73) Adjusted R2 0.131 0.125 0.127 0.123 # firm-years 4,443 4,443 4,443 4,443
This table reports ordinary least squares (OLS) regression results of management forecast errors (MFE) on working capital accruals (WCACC) or total accruals (TACC). See Table 2 for variable definitions. When estimating the coefficients’ standard errors, we use a clustering procedure that accounts for serial dependence across years of a given firm. Industry dummies and year dummies are included in the regressions; the results are not tabulated. T-statistics are presented in parentheses. For ease of exposition, coefficients on AltmanZ, TRADE, SALESGRVOL, CFOVOL, OPCYCLE, and NANALYSTS are multiplied by 100. ***/**/* indicate significance level at less than 1%/5%/10% based on two-tail t-tests. Sample period from 1996 to 2006.
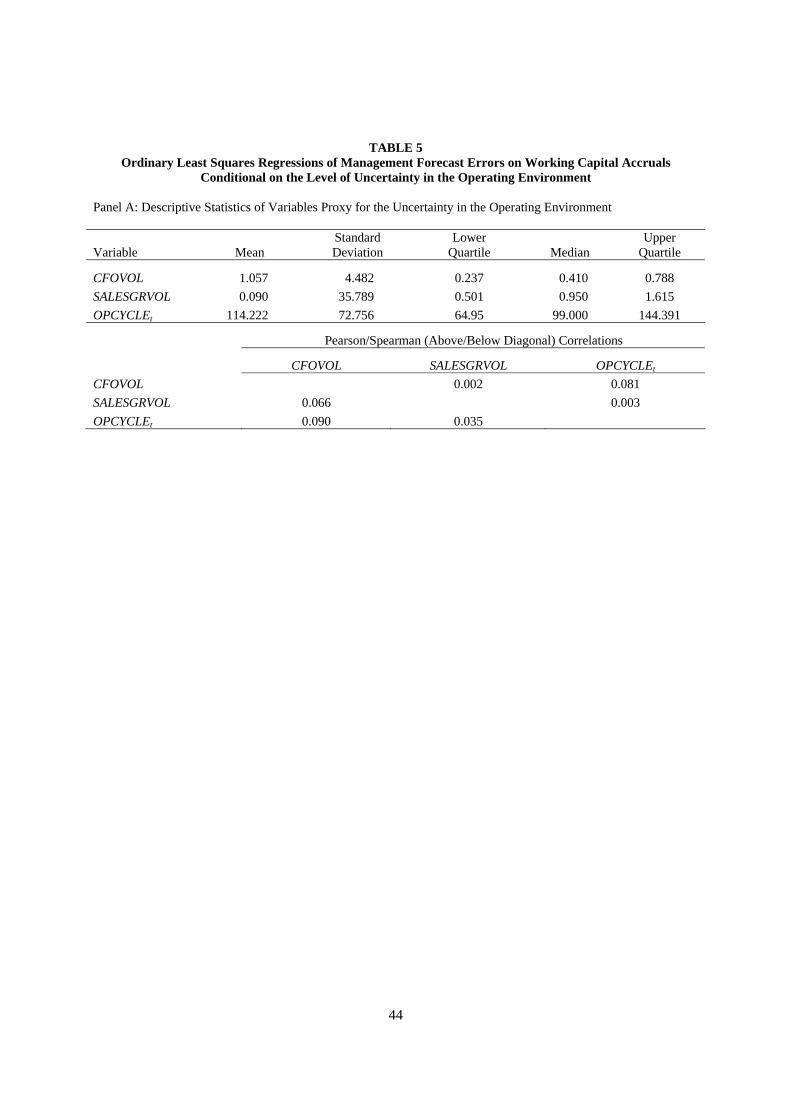
44
TABLE 5 Ordinary Least Squares Regressions of Management Forecast Errors on Working Capital Accruals
Conditional on the Level of Uncertainty in the Operating Environment Panel A: Descriptive Statistics of Variables Proxy for the Uncertainty in the Operating Environment
Variable Mean Standard Deviation
Lower Quartile Median
Upper Quartile
CFOVOL 1.057 4.482 0.237 0.410 0.788 SALESGRVOL 0.090 35.789 0.501 0.950 1.615 OPCYCLEt 114.222 72.756 64.95 99.000 144.391
Pearson/Spearman (Above/Below Diagonal) Correlations
CFOVOL SALESGRVOL OPCYCLEt CFOVOL 0.002 0.081 SALESGRVOL 0.066 0.003 OPCYCLEt 0.090 0.035

45
Panel B: Subsample Regression Results Low CFOVOL Moderate CFOVOL High CFOVOL
Coeff. (t-stat)
Coeff. (t-stat)
Coeff. (t-stat)
WCACCtR 0.006** 0.006** 0.013***
(2.48) (2.29) (3.46) Control Variables Included Included Included Coefficient difference in WCACCt
R between: High CFOVOL versus Low CFOVOL 0.007 [Two-tail p-value] [0.000] Adjusted R2 0.131 0.147 0.140 # firm-years 1,477 1,485 1,481 Low SALESGRVOL Moderate SALESGRVOL High SALESGRVOL
Coeff. (t-stat)
Coeff. (t-stat)
Coeff. (t-stat)
WCACCtR 0.008** 0.007** 0.012***
(2.85) (2.23) (3.46) Control Variables Included Included Included Coefficient difference in WCACCt
R between: High SALESGRVOL versus Low SALESGRVOL 0.004 [Two-tail p-value] [0.000] Adjusted R2 0.154 0.135 0.153 # firm-years 1,477 1,487 1,479 Low OPCYCLE Moderate OPCYCLE High OPCYCLE
Coeff. (t-stat)
Coeff. (t-stat)
Coeff. (t-stat)
WCACCtR 0.006* 0.011*** 0.012***
(1.95) (3.49) (3.47) Control Variables Included Included Included Coefficient difference in WCACCt
R between: High OPCYCLE versus Low OPCYCLE 0.006 [Two-tail p-value] [0.000] Adjusted R2 0.109 0.178 0.130 # firm-years 1,477 1,485 1,481 Panel A presents summary statistics and Pearson correlations (above diagonal) and Spearman correlations (below diagonal) for the three variables used to proxy for the uncertainty in the operating environment. CFOVOL is defined

46
as the standard deviation of operating cash flows (#308-#124) divided by lagged total assets (#6) during the past 5 years (including year t) scaled by the magnitude of average operating cash flows (divided by lagged total assets) over the same period. SALESGRVOL is defined as the standard deviation of sales growth (#12) during the past 5 years (including year t) scaled by the magnitude of average sales growth over the same period. OPCYCLE is defined as average accounts receivable (#2) divided by sales (#12) plus average inventory (#3) divided by cost of goods sold (#41) then multiplied by 365. Panel B reports ordinary least squares (OLS) regression results of management forecast errors (MFE) on working capital accruals (WCACC) conditional on the level of environmental uncertainty. The Low / Moderate / High subsamples include firm-years ranked in the bottom / middle / top third of each environmental uncertainty proxy. See Table 2 for the other variable definitions. When estimating the coefficients’ standard errors, we use a clustering procedure that accounts for serial dependence across years of a given firm. Industry dummies and year dummies are included in the regressions; the results are not tabulated. T-statistics are presented in parentheses and two-tail p-values based on F-tests are presented in brackets. ***/**/* indicate significance level at less than 1%/5%/10% based on two-tail t-tests. Sample period from 1996 to 2006.
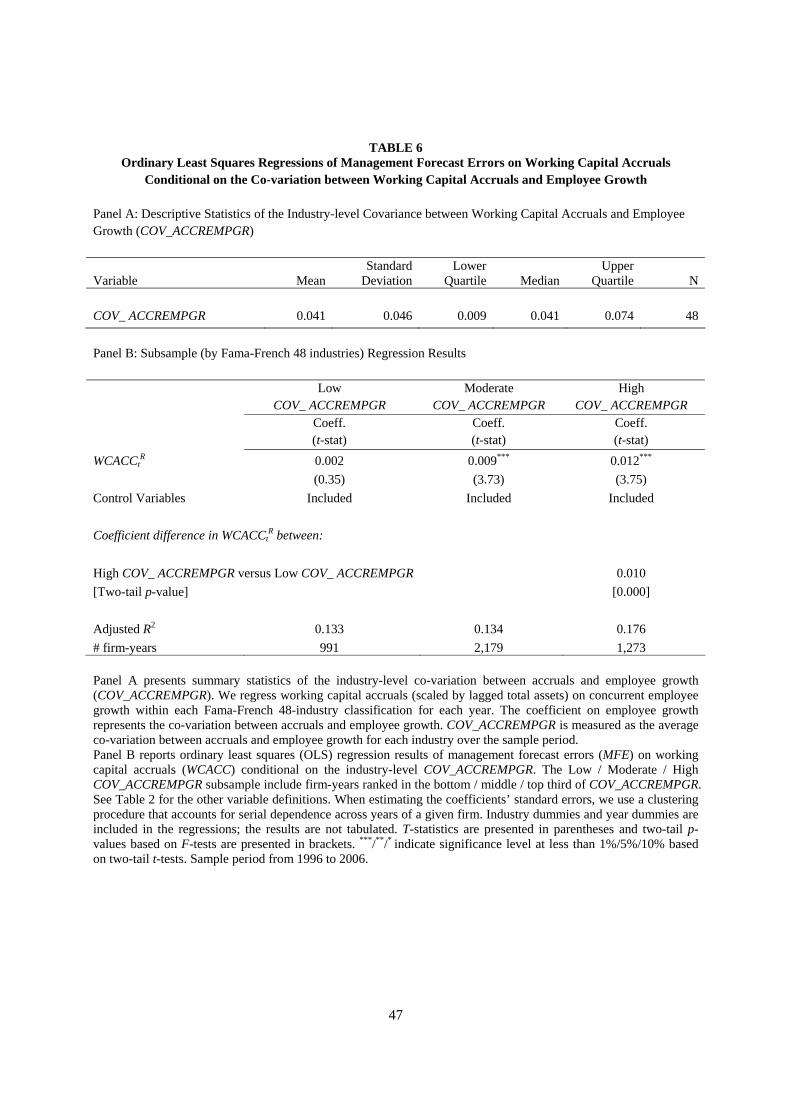
47
TABLE 6 Ordinary Least Squares Regressions of Management Forecast Errors on Working Capital Accruals
Conditional on the Co-variation between Working Capital Accruals and Employee Growth Panel A: Descriptive Statistics of the Industry-level Covariance between Working Capital Accruals and Employee Growth (COV_ACCREMPGR)
Variable Mean Standard
DeviationLower
Quartile Median Upper
Quartile N COV_ ACCREMPGR 0.041 0.046 0.009 0.041 0.074 48 Panel B: Subsample (by Fama-French 48 industries) Regression Results
Low
COV_ ACCREMPGR Moderate
COV_ ACCREMPGR High
COV_ ACCREMPGR Coeff.
(t-stat) Coeff. (t-stat)
Coeff. (t-stat)
WCACCtR 0.002 0.009*** 0.012***
(0.35) (3.73) (3.75) Control Variables Included Included Included Coefficient difference in WCACCt
R between:
High COV_ ACCREMPGR versus Low COV_ ACCREMPGR 0.010 [Two-tail p-value] [0.000] Adjusted R2 0.133 0.134 0.176 # firm-years 991 2,179 1,273 Panel A presents summary statistics of the industry-level co-variation between accruals and employee growth (COV_ACCREMPGR). We regress working capital accruals (scaled by lagged total assets) on concurrent employee growth within each Fama-French 48-industry classification for each year. The coefficient on employee growth represents the co-variation between accruals and employee growth. COV_ACCREMPGR is measured as the average co-variation between accruals and employee growth for each industry over the sample period. Panel B reports ordinary least squares (OLS) regression results of management forecast errors (MFE) on working capital accruals (WCACC) conditional on the industry-level COV_ACCREMPGR. The Low / Moderate / High COV_ACCREMPGR subsample include firm-years ranked in the bottom / middle / top third of COV_ACCREMPGR. See Table 2 for the other variable definitions. When estimating the coefficients’ standard errors, we use a clustering procedure that accounts for serial dependence across years of a given firm. Industry dummies and year dummies are included in the regressions; the results are not tabulated. T-statistics are presented in parentheses and two-tail p-values based on F-tests are presented in brackets. ***/**/* indicate significance level at less than 1%/5%/10% based on two-tail t-tests. Sample period from 1996 to 2006.

48
TABLE 7 Ordinary Least Squares Regressions of Management Forecast Errors on Working Capital Accruals
Conditional on Insider Trading
Sample A (Top/Bottom Quintile of WCACC followed by Net Purchases/Sales)
Sample B (Top/Bottom Quintile of WCACC followed by Net Sales/Purchases)
Coeff. (t-stat)
Coeff. (t-stat)
WCACCtR 0.013*** 0.001
(2.77) (0.10) Control Variables Included Included Coefficient difference in WCACCt
R between: Sample A versus Sample B 0.012 [Two-tail p-value] [0.074] Adjusted R2 0.221 0.124 # firm-years 360 375
This table reports ordinary least squares (OLS) regression results of management forecast errors (MFE) on working capital accruals (WCACC) conditional on insider trading activities. Sample A consists of firm-years with accruals ranked in the top (bottom) quintile of WCACC and with managers’ share purchases (sales) following management forecasts. Sample B consists of firm-years ranked in the top (bottom) quintile of WCACC and with managers’ share sales (purchases) following management forecasts. See Table 2 for variable definitions. When estimating the coefficients’ standard errors, we use a clustering procedure that accounts for serial dependence across years of a given firm. Industry dummies and year dummies are included in the regressions; the results are not tabulated. T-statistics are presented in parentheses and two-tail p-values based on F-tests are presented in brackets. ***/**/*
indicate significance level at less than 1%/5%/10% based on two-tail t-tests. Sample period from 1996 to 2006.

49
TABLE 8 Cross-sectional Test of the Association between One-year-ahead Size-adjusted Returns and Working Capital
Accruals Conditional on the Issuance of Management Earnings Forecasts
Panel A: Descriptive Statistics of the Sample
Variable Mean Standard
DeviationLower
Quartile MedianUpper
Quartile N SARETt+1 0.058 -0.044 0.803 -1.935 21.921 19,190MVt ($millions) 2,134 343 6,159 8 46,377 19,190BMt 0.563 0.448 0.511 -0.460 2.908 19,190BETAt 1.125 0.974 0.890 -0.654 4.411 19,190EPt 0.041 0.073 0.202 -1.026 0.588 19,190| WCACCt| 0.052 0.029 0.064 0.000 0.367 19,190ROAt -0.015 0.037 0.221 -1.093 0.367 19,190ERC 10.803 1.296 30.663 -61.794 175.925 19,190|AFEt+1| 0.074 0.019 0.157 0.000 0.934 19,190RTNVOL 0.157 0.135 0.091 0.025 0.504 19,190EARNVOL 0.038 0.016 0.062 0.000 0.422 19,190LITIGATIONt 0.007 0.004 0.011 0.001 0.277 19,190NANALYSTSt 4 2 5 0 40 19,190

50
Panel B: Two-Stage Regression Results
Model (1) Model (2)
Dependent Variable: MF Dependent Variable: SARETt+1
Coeff. (z-stat)
Coeff. (t-stat)
| WCACCt| 0.561** WCACCtR×MF -0.054**
(2.11) (-2.31) ROAt 1.297*** WCACCt
R×NoMF -0.055**
(10.61) (-2.22) ERC 0.002*** MVt
R -0.076***
(3.77) (-3.47) |AFEt+1| -0.866*** BMt
R 0.050** (-4.71) (2.17) BMt 0.004 BETAt 0.113*** (0.08) (5.50) RTNVOL -0.727*** EPt
R 0.000 (-2.60) (-0.02) EARNVOL -0.615 NoMF 0.043* (-1.51) (1.72) LITIGATIONt 1.999* MF 0.039 (1.74) (1.35) Ln(MVt) 0.195*** Inverse Mill's Ratio -0.016 (10.49) from Model (1) (-0.76) NANALYSTSt 0.023*** (4.42) WCACCR×MF – WCACCR×NoMF = 0.001 Intercept -3.290*** [Two-tail p-value] [0.965] (-18.86) # forecast years 4,439 # firm-years 19,190 # no-forecast years 14,751 Adjusted R2 0.009 Pseudo R2 0.455
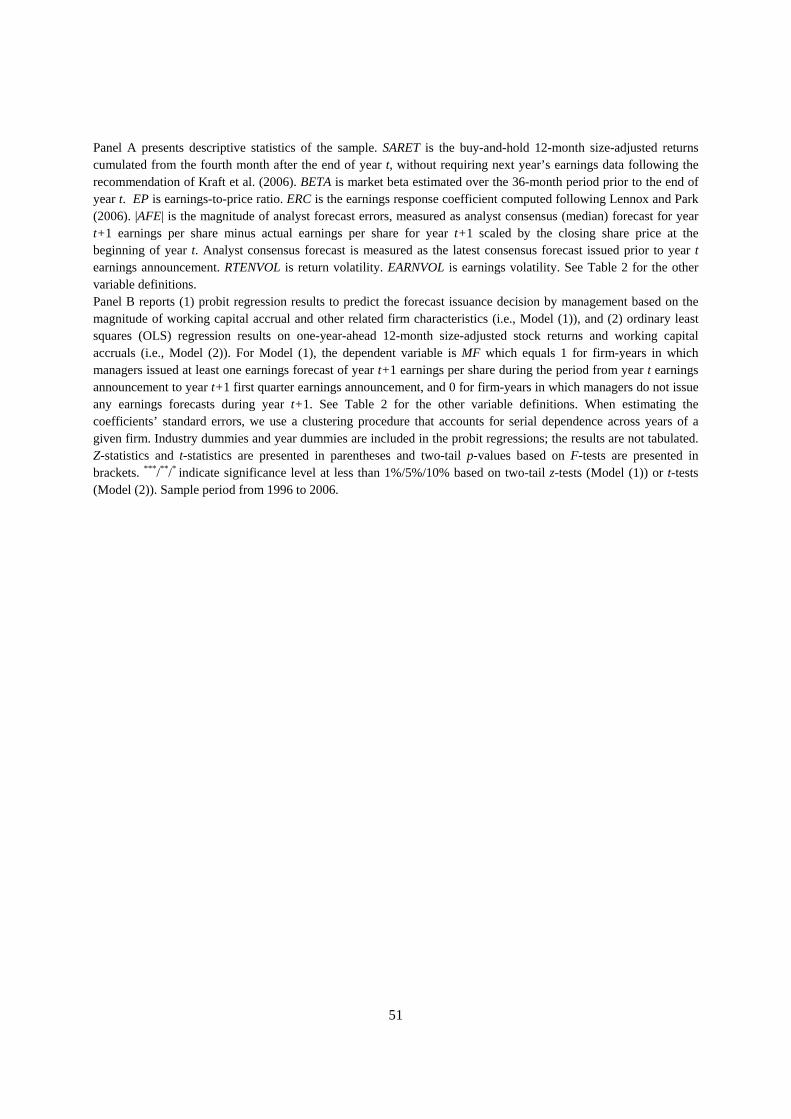
51
Panel A presents descriptive statistics of the sample. SARET is the buy-and-hold 12-month size-adjusted returns cumulated from the fourth month after the end of year t, without requiring next year’s earnings data following the recommendation of Kraft et al. (2006). BETA is market beta estimated over the 36-month period prior to the end of year t. EP is earnings-to-price ratio. ERC is the earnings response coefficient computed following Lennox and Park (2006). |AFE| is the magnitude of analyst forecast errors, measured as analyst consensus (median) forecast for year t+1 earnings per share minus actual earnings per share for year t+1 scaled by the closing share price at the beginning of year t. Analyst consensus forecast is measured as the latest consensus forecast issued prior to year t earnings announcement. RTENVOL is return volatility. EARNVOL is earnings volatility. See Table 2 for the other variable definitions. Panel B reports (1) probit regression results to predict the forecast issuance decision by management based on the magnitude of working capital accrual and other related firm characteristics (i.e., Model (1)), and (2) ordinary least squares (OLS) regression results on one-year-ahead 12-month size-adjusted stock returns and working capital accruals (i.e., Model (2)). For Model (1), the dependent variable is MF which equals 1 for firm-years in which managers issued at least one earnings forecast of year t+1 earnings per share during the period from year t earnings announcement to year t+1 first quarter earnings announcement, and 0 for firm-years in which managers do not issue any earnings forecasts during year t+1. See Table 2 for the other variable definitions. When estimating the coefficients’ standard errors, we use a clustering procedure that accounts for serial dependence across years of a given firm. Industry dummies and year dummies are included in the probit regressions; the results are not tabulated. Z-statistics and t-statistics are presented in parentheses and two-tail p-values based on F-tests are presented in brackets. ***/**/* indicate significance level at less than 1%/5%/10% based on two-tail z-tests (Model (1)) or t-tests (Model (2)). Sample period from 1996 to 2006.