Embed Size (px)
Citation preview

The association betweenground hardness and injuryover the course of a season in
professional football
David Rennie
Head Physiotherapist
Leicester City Football Club

Health & safety at work act 1974
• “An employer must makeevery reasonable practicaleffort to ensure the healthand safety of employees atwork”.
• The pitch is their place ofwork.
Daily mail on line 14.04.2010

Fear of escalating injury costs
Daily mail on line 09.02.2010

Pitch construction and maintenance

Current standards player surface•• IOG 2001IOG 2001
• High: 65-120 (G).
• Standard: 55-140 (G).
• Basic 35-200 (G).
•• Why?Why?

Current standards: evaluate & manageexpectations

Current standards player surface
•• IOG 2001:IOG 2001:
• High: 65-120 (G).
• Standard: 55-140 (G).
• Basic 35-200 (G).
• What values do injuriesoccur?
• What types of injuries arethey likely to be?
•• Links need to be made.Links need to be made.

Aetiology of injury within football
• Risk of injury >1000 high riskindustrial occupations.
• Intrinsic:
• Age, previous injury, corestability, biomechanics,ethnicity.
• Extensive literatureaddressing interventionprotocols.

Aetiology of injury within football
• Participation exposesindividual to external orextrinsic risk.
• Extrinsic Factors
• Pitch/Stadia surroundings.
• Opponents.
• Footwear.
• Climatic conditions.
• Surface Traction.
• Ground hardness.
Available evidence:
Ground hardness & injury• Ekstrand & Nigg (1989) 24%
injury attributable.
• Orchard (2001 & 2002) studyAFL
• Takemura et al (2007) NZrugby.
• Twomey et al (2009)Community AFL no relationship.
• Norton et al (2001)Relationships ground hardnessand game speed.
• No objective research inprofessional football

Research questions in professionalfootball
• Is injury associated withground hardness ?
• Is there a differencebetween training andmatch data?
• Does pitch constructionaffect injury?

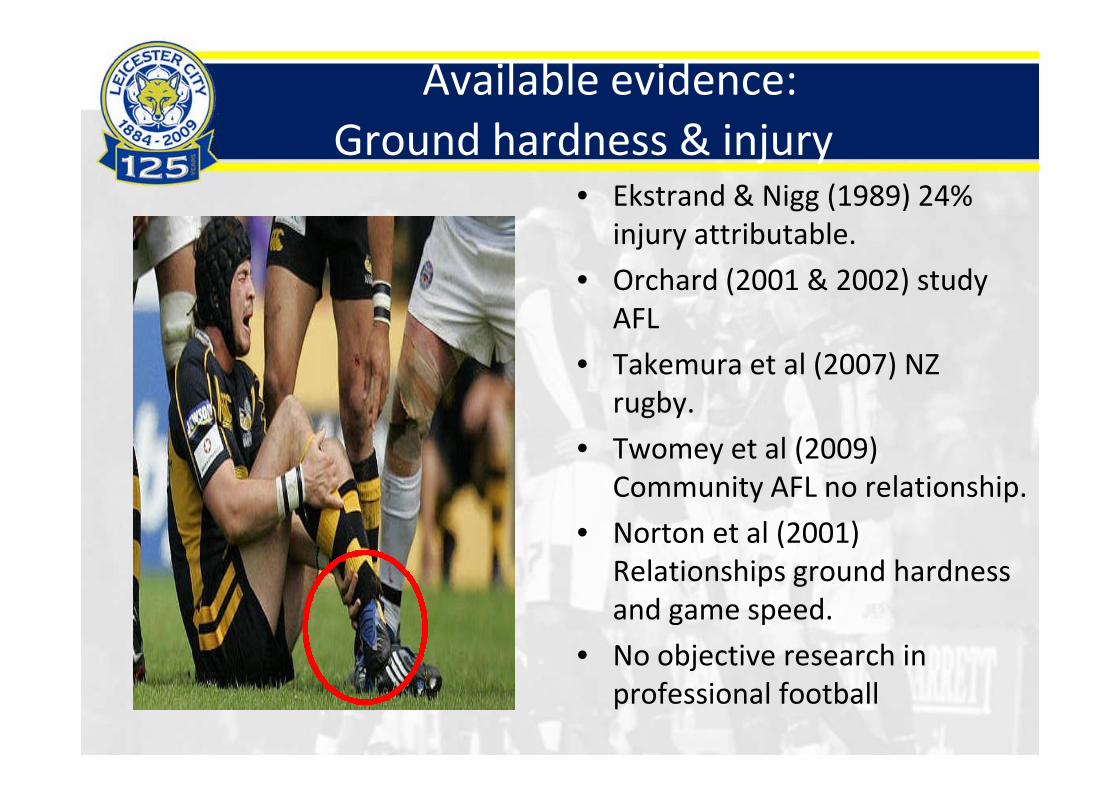
Methodology
• LCFC Professional Players.
• N=42.
• Mean age 24.26 yrs (17-39).
• Injury incidence: trainingtrainingand matchesmatches prospectivelyrecorded.
• Injury defined: ‘any pain orany pain ordisability suffered by adisability suffered by aplayer during a match orplayer during a match ortraining session andtraining session andsubsequently assessed bysubsequently assessed bythe head physiotherapistthe head physiotherapist’.
Methodology
• Ground hardness:2.25kg Clegg- Hammer.
• 15 sites: 5 readings(1m2) each site.
• Prior to every trainingsession or match.

Results: Seasonal variability
0
20
40
60
80
100
120
Gro
un
dh
ard
nes
s(G
)
Calendar Month
Graph 1. Ground hardness variability for training and match data over the2008-2009 season
August October DecemberSeptember November January February March April May

Table 1. Training and Match Ground hardness andinjury in relation to pitch construction
Pitch type Exposure Mean
Hardness
Standard
deviation
Range Average
Injuries
per game
Sand soil
mix
100 81.50 5.06 116.20-
53.20
0.60
Sand soil
mix
13 74.6 7.77 112.79 –
51.39
1.23
Fibre sand 40 88.5 5.7 111.4-
58.0
1.35
Desso 2 75.8 7.4 94.07-
57.59
1.50

Results
0
5
10
15
20
25
30
35
0.00
20.00
40.00
60.00
80.00
100.00
120.00
Tota
lin
juri
es
Gro
un
dh
ard
ne
ss(G
)
Calender Month
Average monthly ground hardness and incidence of injuries in Training
Aug Sept Oct Nov Dec Jan Feb Mar MayMayApr
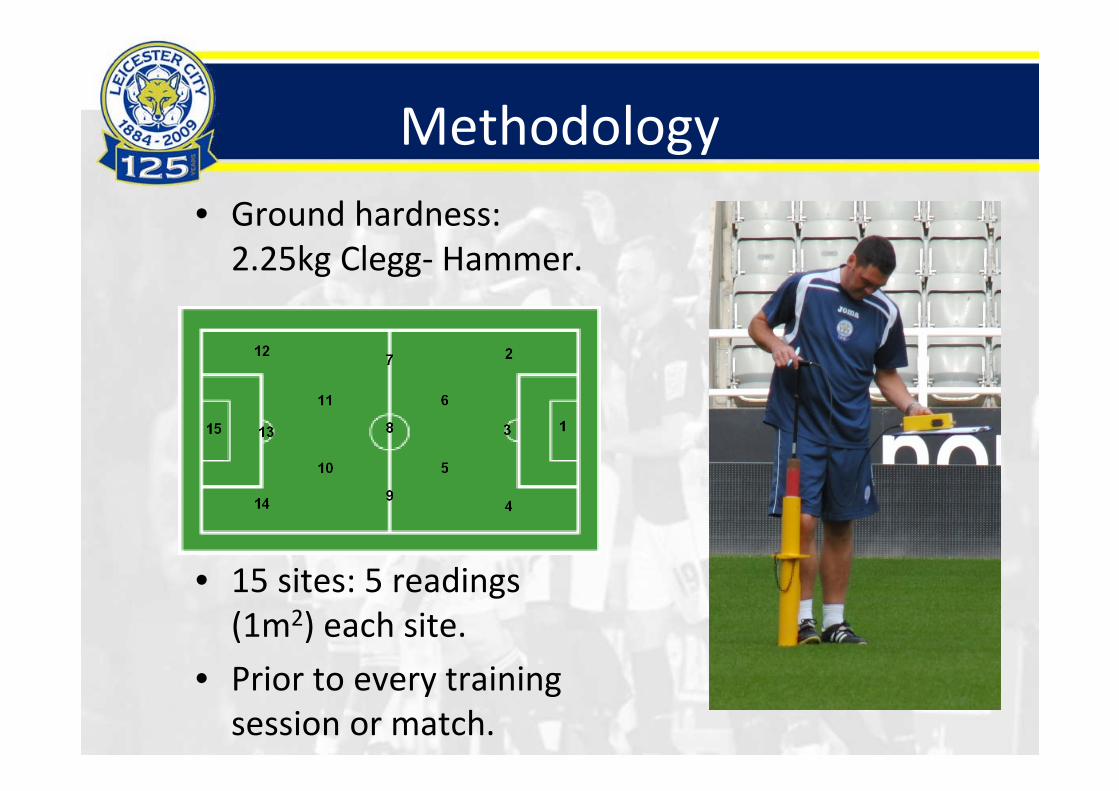
Results
0
5
10
15
20
25
0
10
20
30
40
50
60
70
80
90
100
Tota
lin
juri
es
Gro
un
dh
ard
ne
ss(G
Calender Month
Average monthly ground hardness and incidence of injuries in Matches
Aug Oct Nov Dec MarFebSept Jan Apr

Results: correlation and binary logisticregression analysis
The association between ground hardness and all injuriesincurred during training in the 2008-9 season, r=0.36 (P<0.001)
1201101009080706050
9
8
7
6
5
4
3
2
1
0
Hardness
all
inju
rie
s

Results: correlation and binary logisticregression analysis
12 01 1 010 09 08 07 0605 0
1 2
1 0
8
6
4
2
0
Ha r d n e s s
all
inju
rie
s
The association between ground hardness and allmatch-day injuries incurred in the 2008-9 season(P>0.05)

Results
• Elementary differentialcalculus.
• Minimum risk of injuryoccurs when groundhardness =0.59/(2*0.003)=98 (G)

Discussion
• Pitches soften over thecourse of the season.
• Different findings tothat of AFL and Rugby.
• Training.
• Matches.
• Limitations.

The Future
• Continue longitudinalstudy.
• Objective tests moisture,traction, hardness, GPS.
• Performance Indicators asa factor of groundhardness.
• Prozone information:Heat Maps reflect a moreaccurate exposure to thesurface.

Thank you & Questions?

Appendix
• 1. Raw training data.
• 2. Raw Match Data.
• 3. Bibliography.
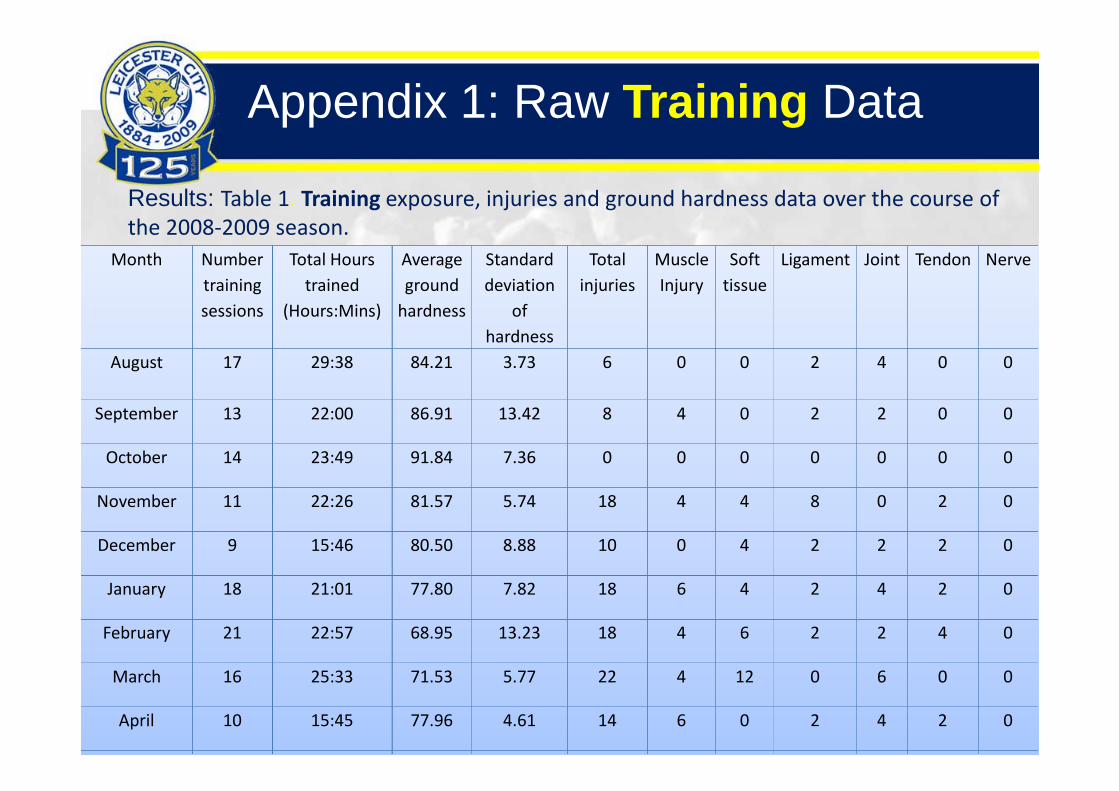
Month Number
training
sessions
Total Hours
trained
(Hours:Mins)
Average
ground
hardness
Standard
deviation
of
hardness
Total
injuries
Muscle
Injury
Soft
tissue
Ligament Joint Tendon Nerve
August 17 29:38 84.21 3.73 6 0 0 2 4 0 0
September 13 22:00 86.91 13.42 8 4 0 2 2 0 0
October 14 23:49 91.84 7.36 0 0 0 0 0 0 0
November 11 22:26 81.57 5.74 18 4 4 8 0 2 0
December 9 15:46 80.50 8.88 10 0 4 2 2 2 0
January 18 21:01 77.80 7.82 18 6 4 2 4 2 0
February 21 22:57 68.95 13.23 18 4 6 2 2 4 0
March 16 25:33 71.53 5.77 22 4 12 0 6 0 0
April 10 15:45 77.96 4.61 14 6 0 2 4 2 0
Total 129 208:22 80.15 7.84 114 28 30 20 24 12 0
Results: Table 1. Training exposure, injuries and ground hardness data over the course ofthe 2008-2009 season.
Appendix 1: Raw Training Data

Table 2. Match exposure, injuries and ground hardness data over the course of the 2008-2009 season.
Month Number
matches
Total Match
Hours
(Hours:Mins)
Average
ground
hardness
Standard
deviation of
hardness
Total
injuries
Muscle
Injury
Soft
tissue
Ligament Joint Tendon Nerve
August 6 9:00 85.40 11.06 6 0 4 2 0 0 0
September 6 9:00 89.89 3.83 14 2 0 2 8 2 0
October 5 7:30 93.19 16.74 14 6 2 2 4 0 0
November 8 12:00 81.79 14.92 16 0 12 2 0 2 0
December 5 7:30 87.57 7.74 28 6 16 2 2 2 0
January 7 10:30 83.75 24.82 30 2 8 6 10 2 2
February 6 9:00 73.76 14.97 27 2 5 4 16 0 0
March 6 9:00 80.52 10.91 8 0 2 2 4 0 0
April 5 7:30 84.30 14.48 4 0 2 0 2 0 0
Appendix 2: Raw Match Data

BibliographyAdams, W.A. & Gibbs, R.J. (1994) Natural turf for sport and amenity: science and practice. Wallingford, Oxon, UK: CAB International.
Adams, W.A., Gibbs, R.J., Baker, S., & Lance, D. (1992) Making the most of natural turf pitches. A national survey of winter games pitcheswith high quality drainage designs. Natural Turf Pitch Prototypes Advisory Panel Report No. 10, Sports Council.
Bahr, R., & Engbretsen (2009) Handbook of sports medicine and science: Sports Injury Prevention. Wiley-Blackwell, Chichester, Uk.
Baker, S. (1985) Playing standards for natural turf sports surfaces. In: Shildrick, J.P., Ed. Proceedings of the 3rd National TurfgrassConference, Nottingham, Bingley, England: National Turfgrass Council, 31-41.
Baker, S. (1999) The playing quality of turfgrass sports surfaces. In: Aldous, D.E., Ed. International turf management handbook. Melbourne,Australia: Inkata Press, 231-244.
Baker, S., Gibbs, R.J., & Adams, W.A. (1990) Making the most of natural turf pitches. Final results of a case studies approach: I. Ground coverand botanical analysis. Natural Turf Pitch Prototypes Advisory Panel Report No. 6, Sports Council.
Baker, S.W. & Bell, M.J. (1986) The playing characteristics of natural turf and synthetic turf surfaces for association football. Journal of theSports Turf Research Institute, 62, 9-35.
Baker, S.W. & Isaac, S.P. (1987a) The effect of rootzone composition on the performance of winter games pitches. I. Sward characteristics.Journal of the Sports Turf Research Institute, 63, 57-66.
Baker, S.W. & Isaac, S.P. (1987b) The effect of rootzone composition on the performance of winter games pitches. II. Playing quality. Journalof the Sports Turf Research Institute, 63, 67-81.
Bell, M.J., Baker, S.W., & Canaway, P.M. (1985) Playing quality of sports surfaces: a review. Journal of the Sports Turf Research Institute, 61,26-44.
Canaway, P.M., Bell, M.J., Holmes, G., & Baker, S.W. (1990) Standards for the playing quality of natural turf for association football. In:Schmidt, R.C., Hoerner, E.F., Milner, E.N., & Morehouse, C.A., Eds. Natural and Artificial playing fields: characteristics and safety features,Phoenix, Arizona, Philadelphia: ASTM, 29-47.
Clegg, B. (1976) An impact testing device for in situ base course evaluation. Proceedings of the Australian Road Research Bureau, 8, 1-6.
BibliographyEkstrand, J. & Nigg, B.M. (1989) Surface related injuries in soccer. Sports Medicine, 8, 56-62.
Football Association (2004) Performance quality standard. Available at:http://www.thefa.com/Grassroots/FacilityDevelopment/Guidance+Notes/Postings/2004/12/Pitches_PerformanceQualityStandard. Accessed 8thOctober 2005.
Fuller, C.W. & Hawkins, R.D. (1997) Assessment of football grounds for player safety. Safety Science, 27 (2), 115-128.
Hawkins, R.D. & Fuller, C.W. (1999) A prospective epidemiological study of injuries in four English professional football clubs. British Journal of SportsMedicine, 33, 196-203.
IOG (2001) Guidelines for performance quality standards part one; sports surfaces natural and non turf. Milton Keynes, UK: The Institute ofGroundsmanship.
IOG (2004) An Introduction to performance quality standards. 2nd ed. Milton Keynes, UK: The Institute of Groundsmanship.
McClements, I. & Baker, S.W. (1994) The playing quality of rugby pitches. Journal of the Sports Turf Research Institute, 70, 29-43.
McNitt, A.S., Landschoot, P.J., & Petrukak, D.M. (2004) Evaluation of the playing surface hardness of an infilled synthetic turf system. In: Nektarios,P.A., Ed. Proceedings of the first international conference on turfgrass management and science for sports fields, Athens, Greece, Leuven, Belgium:ISHS, 559-569.
Milburn, P.D. & Barry, E.B. (1998) Shoe-surface interaction and the reduction of injury in rugby union. Sports Medicine, 25 (5), 319-327.
Orchard, J. (2001) The AFL penetrometer study: Work in progress. Journal of Science and Medicine in Sport, 4 (2): 220-232.
Orchard, J. (2002) Is there a relationship between ground and climatic conditions and injuries in football? Sports Medicine, 32 (7): 419-432
Orchard, J. & Powell, J.W. (2003) Risk of knee and ankle sprains under various weather conditions in American football. Medicine & Science in Sportsand exercise, 35: (7), 1118-1123.
Rogers III, J.N. & Waddington, D.V. (1990) Portable apparatus for assessing impact characteristics of athletic field surfaces. In: Schmidt, R.C.,Hoerner, E.F., Milner, E.N., & Morehouse, C.A., Eds. Natural and artificial playing fields: characteristics and safety features, Phoenix, Arizona,Philadelphia: ASTM, 96-110.
Bibliography
Shildrick, J.P. & Dye, A.L. (1983) A review of playing surfaces research. London: National Turfgrass Council.
Takemura, M., Schneiders, A.G., Bell., & Milburn, P.D. Association of ground hardness with injuries in rugby union. British journal of sportsmedicine, (2007): 41: 582-587.
Thornton, D.J. (1973) A field trial of sportsfield construction materials extremely high in sand. Journal of the Sports Turf Research Institute,49, 29-44.
van Wijk, A.L.M. (1980) Playing conditions of grass sports fields. Wageningen: Centre for Agricultural Publishing and Documentation.