Embed Size (px)
Citation preview
i
THE ASSOCIATION BETWEEN AGRICULTURAL EXTENSION SERVICES
AND FOOD SECURITY AMONG SMALL-HOLDER FARMING
HOUSEHOLDS IN UASIN GISHU COUNTY, KENYA
CAROLINE JEMELI TOROITICH
A THESIS SUBMITTED IN PARTIAL FULFILMENT FOR THE
REQUIREMENTS FOR THE AWARD OF DEGREE OF DOCTOR OF
PHILOSOPHY IN THE SCHOOL OF AGRICULTURE, UNIVERSITY OF
ELDORET, KENYA
JUNE, 2021
i
DECLARATION
DECLARATION BY THE CANDIDATE
This thesis is my original work and has not been submitted for any academic award of
a degree in any institution; and shall not be reproduced in part or full, or in any format
without written permission from the author and/or University of Eldoret.
Toroitich Jemeli Caroline
______________________________ _____________________
AGR/PhD/2013/13 Date
DECLARATION BY THE SUPERVISORS
This Thesis has been submitted with our approval as University Supervisors:
______________________________ _____________________
Prof. Violet K. Mugalavai Date
School of Agriculture and Biotechnology
University of Eldoret, Kenya
______________________________ _____________________
Prof. Julius O. Ochuodho Date
School of Agriculture and Biotechnology
University of Eldoret, Kenya

ii
DEDICATION
To my son Steven Kiptoo and my parents: Christopher Kimaru (late) and Margarina
Kimaru.
iii
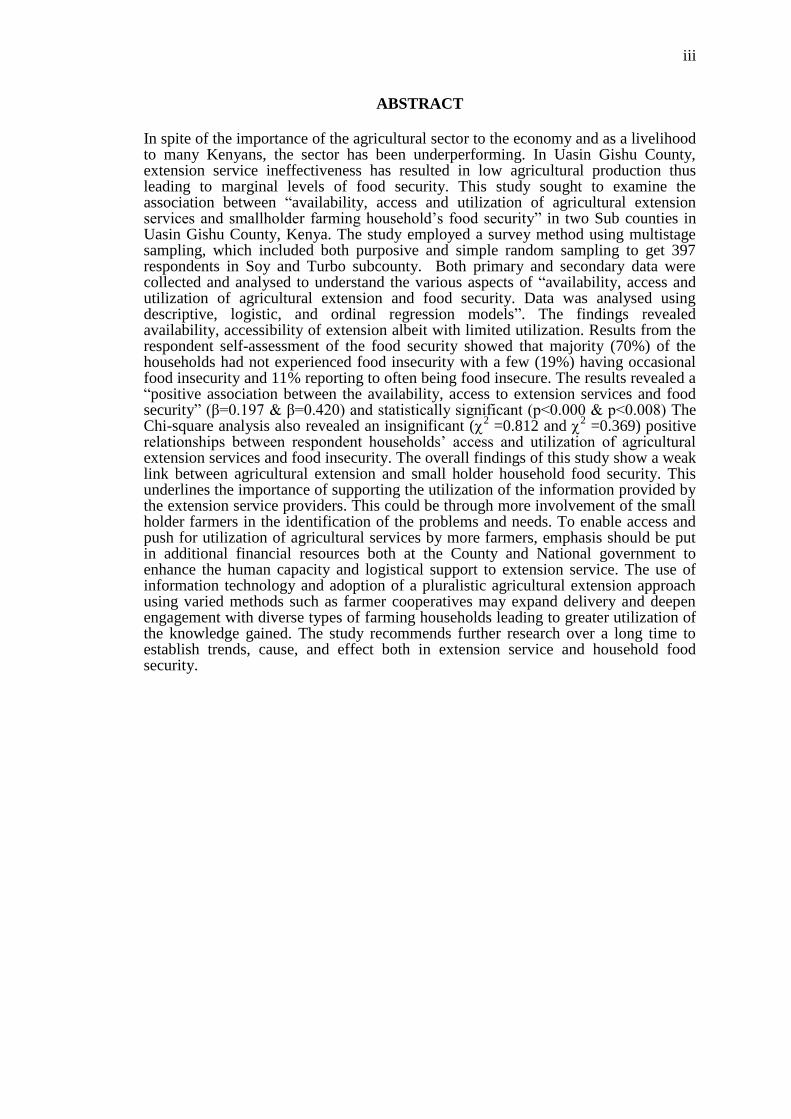
ABSTRACT
In spite of the importance of the agricultural sector to the economy and as a livelihood to many Kenyans, the sector has been underperforming. In Uasin Gishu County, extension service ineffectiveness has resulted in low agricultural production thus leading to marginal levels of food security. This study sought to examine the association between “availability, access and utilization of agricultural extension services and smallholder farming household’s food security” in two Sub counties in Uasin Gishu County, Kenya. The study employed a survey method using multistage sampling, which included both purposive and simple random sampling to get 397 respondents in Soy and Turbo subcounty. Both primary and secondary data were collected and analysed to understand the various aspects of “availability, access and utilization of agricultural extension and food security. Data was analysed using descriptive, logistic, and ordinal regression models”. The findings revealed availability, accessibility of extension albeit with limited utilization. Results from the respondent self-assessment of the food security showed that majority (70%) of the households had not experienced food insecurity with a few (19%) having occasional food insecurity and 11% reporting to often being food insecure. The results revealed a “positive association between the availability, access to extension services and food security” (β=0.197 & β=0.420) and statistically significant (p<0.000 & p<0.008) The Chi-square analysis also revealed an insignificant (
2 =0.812 and
2 =0.369) positive
relationships between respondent households’ access and utilization of agricultural extension services and food insecurity. The overall findings of this study show a weak link between agricultural extension and small holder household food security. This underlines the importance of supporting the utilization of the information provided by the extension service providers. This could be through more involvement of the small holder farmers in the identification of the problems and needs. To enable access and push for utilization of agricultural services by more farmers, emphasis should be put in additional financial resources both at the County and National government to enhance the human capacity and logistical support to extension service. The use of information technology and adoption of a pluralistic agricultural extension approach using varied methods such as farmer cooperatives may expand delivery and deepen engagement with diverse types of farming households leading to greater utilization of the knowledge gained. The study recommends further research over a long time to establish trends, cause, and effect both in extension service and household food security.
iv
TABLE OF CONTENTS
DECLARATION ........................................................................................................... I
DEDICATION .............................................................................................................. II
ABSTRACT ................................................................................................................. III
TABLE OF CONTENTS ............................................................................................. IV
LIST OF FIGURES ..................................................................................................... IX
LIST OF ABBREVIATIONS ....................................................................................... X
OPERATIONAL DEFINITION OF TERMS ........................................................... XII
ACKNOWLEDGEMENT ........................................................................................ XIV
CHAPTER ONE .......................................................................................................... 1
INTRODUCTION........................................................................................................ 1
1.1 OVERVIEW ............................................................................................................ 1
1.2 BACKGROUND OF THE STUDY ............................................................................... 1
1.3 STATEMENT OF THE PROBLEM .............................................................................. 9
1.4 OBJECTIVES ........................................................................................................ 11
1.4.1. General Objective ...................................................................................... 11
1.4.2. Specific Objectives .................................................................................... 11
1.5 RESEARCH HYPOTHESES ..................................................................................... 12
1.6 SIGNIFICANCE OF THE STUDY .............................................................................. 12
1.7 SCOPE OF THE STUDY .......................................................................................... 12
1.8 LIMITATIONS AND DELIMITATIONS OF THE STUDY .............................................. 13
CHAPTER TWO ....................................................................................................... 15
LITERATURE REVIEW ......................................................................................... 15
2.1. OVERVIEW ......................................................................................................... 15
2.2 SMALL HOLDER FARMING HOUSEHOLDS ......................................................... 15
2.3. GLOBAL PERSPECTIVE OF AGRICULTURAL EXTENSION SERVICES ................. 16
2.3.1. Changes in Agricultural Extension Service ............................................... 17
2.4. AGRICULTURAL EXTENSION IN KENYA ........................................................... 20
2.4.1 Evolution of Kenya’s Agricultural Extension Service................................ 20
2.4.3 Kenya’s Agricultural Policy Frameworks .................................................. 25
2.5. FOOD SECURITY AMONG SMALL HOLDER FARMING HOUSEHOLDS ................... 28
2.5.1The Influence of Agricultural Extension Services on Smallholder Food
Security ................................................................................................................ 36
2.6. THEORETICAL REVIEW ....................................................................................... 43
2.6.1 Agricultural Extension Theory .................................................................. 44
2.6.2 Knowledge Transfer Theory ...................................................................... 45
2.6.3 Theory of Behaviour Change ..................................................................... 48
2.6.4 Human Development Approaches .............................................................. 50
2.6.5 Farmer Decision making Processes ............................................................ 52
v
2.6.6 Co-operative Decision-Making Approach .................................................. 53
2.7. CONCEPTUAL FRAMEWORK ............................................................................... 55
2.8. KNOWLEDGE GAPS ............................................................................................ 58
CHAPTER THREE ................................................................................................... 60
RESEARCH METHODOLOGY ............................................................................. 60
3.1. INTRODUCTION................................................................................................... 60
3.2 DESCRIPTION OF THE STUDY SITE ..................................................................... 60
3.3 RESEARCH METHOD .......................................................................................... 63
3.4 THE TARGET POPULATION ................................................................................. 64
3.5 SAMPLE SIZE AND SAMPLING TECHNIQUE ......................................................... 64
3.6 DATA COLLECTION PROCEDURE AND INSTRUMENTS ......................................... 66
3.6.1 Type of Data ............................................................................................... 66
3.6.2 Research Instruments .................................................................................. 66
3.6.3 Key Informants Interview ........................................................................... 67
3.7 DATA COLLECTION METHOD .............................................................................. 67
3.8 DATA ANALYSIS AND PRESENTATION .............................................................. 68
3.9 VALIDITY AND RELIABILITY .............................................................................. 70
3.9.1 Validity ....................................................................................................... 70
3.9.2 Reliability ................................................................................................... 70
3.10 PILOT TEST ..................................................................................................... 71
3.11. ETHICAL CONSIDERATIONS AND DATA MANAGEMENT ................................ 71
CHAPTER FOUR ...................................................................................................... 72
RESEARCH RESULTS ............................................................................................ 72
4.1. INTRODUCTION................................................................................................... 72
4.2 DEMOGRAPHIC AND CHARACTERISTICS OF SMALLHOLDER FARMERS ................ 72
4.2.1 Household Headship and Selected Demographic Characteristics .............. 75
4.3. AGRICULTURAL EXTENSION SERVICES AND TECHNOLOGIES .......................... 77
4.3.1. Availability of Agricultural Extension Services ........................................ 77
4.3.3. Access to Agricultural Extension Services ................................................ 79
4.3.4. Agricultural Extension Service Delivery Method Preference ................... 80
4.3.5. Constraints Hindering Access to Agricultural Extension Services ............ 80
4.3.7. Utilization of Agricultural Extension Services .......................................... 81
4.3.8. Perception on Usefulness of Agricultural Extension Services on Improving
Agricultural Productivity ..................................................................................... 83
4.3.9. Summary of Key informant Interviews Findings on Availability and
Challenges of Agricultural Services in the Study Area ....................................... 84
4.4. STATE OF RESPONDENTS HOUSEHOLD FOOD SECURITY ................................. 85
4.4.1. Household Source of Food......................................................................... 85
4.4.2. Food Security Status .................................................................................. 86
4.4.3. Utilization of Agricultural Extension Service and Household Food
Satisfaction ........................................................................................................... 88
4.5 CORRELATION ANALYSIS .................................................................................... 90
4.5.1 Correlation analysis for household food security and Respondent
Demographic Characteristics ............................................................................... 90
vi
4.5.2 Correlation Analysis between Farm Size and Farming Experience and Food
Security ................................................................................................................ 92
4.5.3 Correlation between Availability and Access to Agricultural extension
services and Food Security. ................................................................................. 93
4.5.4 Correlations between Utilization of Agricultural Extension Services and
Respondent Household Food Security ................................................................. 95
4.6. INFERENTIAL RESULTS AND TEST OF HYPOTHESIS ........................................ 96
4.6.1. Logistic Regressions Results ..................................................................... 96
4.6.2 Pearson Chi-Square Results ....................................................................... 99
4.6.3 Hypothesis Testing.................................................................................... 105
CHAPTER FIVE ..................................................................................................... 107
DISCUSSIONS ......................................................................................................... 107
5.1 INTRODUCTION ................................................................................................. 107
5.2 HOUSEHOLD DEMOGRAPHIC AND FARM CHARACTERISTICS OF RESPONDENTS 107
5.3 AVAILABILITY OF AGRICULTURAL EXTENSION SERVICES ................................ 109
5.4. ACCESSIBILITY AND UTILIZATIONS OF AGRICULTURAL EXTENSION SERVICES 113
5.5. SMALLHOLDER HOUSEHOLD FOOD SECURITY SITUATION ............................... 115
5.5.1 Association between Household Demographic, Farm Characteristics and
Food Security ..................................................................................................... 117
5.5.2 Association between Availability, Access and Utilization of Agricultural
Extension Services and Smallholder Food Security .......................................... 119
CHAPTER SIX ........................................................................................................ 121
CONCLUSIONS AND RECOMMENDATIONS ................................................. 121
6.1 INTRODUCTION ................................................................................................ 121
6.2 CONCLUSION ................................................................................................... 121
6.3 RECOMMENDATIONS ....................................................................................... 123
6.3.1. Recommendations for Practice: The Community -Based Extension Service
Agents (CESA) .................................................................................................. 124
6.3.2. Recommendation for Sustainable Agricultural Extension Services for
Food Security ..................................................................................................... 127
6.3.3. Recommendation for Policy .................................................................. 128
6.4. AREAS FOR FURTHER RESEARCH ................................................................... 129
REFERENCES ......................................................................................................... 130
APPENDIXES .......................................................................................................... 148
APPENDIX I. INTRODUCTION LETTER ...................................................................... 148
APPENDIX II. RESEARCH ASSISTANT INTRODUCTORY LETTER ............................... 149
APPENDIX III. HOUSEHOLD SURVEY QUESTIONNAIRE ............................................ 150
APPENDIX IV: ADDITIONAL DATA .......................................................................... 169
APPENDIX V: SIMILARITY REPORT ......................................................................... 170
vii
LIST OF TABLES
Table 1. Uasin Gishu Sub Counties and Wards ........................................................... 61
Table 2. Smallholder farmers’ demographic information............................................ 73
Table 2. Smallholder farm characteristics ................................................................... 74
Table 3. Cross tabulation of age and farm size ............................................................ 75
Table 4. Gender and highest level of education of household head ............................ 76
Table 5. Cross tabulation between gender of household head and land ownership .... 76
Table 6. Cross tabulation gender of household head and size of land ......................... 76
Table 7. Awareness and type of agricultural extension service providers in soy and
turbo sub counties. ....................................................................................................... 77
Table 8. Types of agricultural extension service available in the area surveyed ....... 78
Table 9. Indicators of access to agricultural extension services by the surveyed
smallholder households ................................................................................................ 79
Table 10. Agricultural extension service delivery methods preferred by the
smallholder farmers ..................................................................................................... 80
Table 11. Constraint’s in accessing extension officers as perceived by the respondents
...................................................................................................................................... 81
Table 12. The extent of utilization of agricultural extension services by smallholder
farmers ......................................................................................................................... 82
Table 13. Utilization, effectiveness, and usefulness of agricultural extension services
as perceived by the smallholder farmers. ..................................................................... 83
Table 14. Main sources of household food .................................................................. 85
Table 15. Status of food security in Soy and Turbo Sub Counties .............................. 86
Table 16. AES utilization and food satisfaction ......................................................... 88
Table 17. AES utilization and food consumption changes .......................................... 89
Table 18. AES utilization and food shortage ............................................................... 90
Table 19. Correlation Analysis between Socio-demographic Characteristics and
Household food security .............................................................................................. 91
Table 20 Correlation analysis of farm size, farming experience and household food
security. ........................................................................................................................ 92
Table 21 Correlation analysis availability and access to agricultural extension services
and food security .......................................................................................................... 94
Table 22 Pearson correlation analysis on utilization of agricultural extension services
and food security .......................................................................................................... 95
viii
Table 23. T-test analysis between Demographic characteristics and access to
agricultural extension services ..................................................................................... 97
Table 24. T-test analysis between Demographic characteristics and smallholder food
security ......................................................................................................................... 98
Table 25 Regression analysis between accessibility and utilization of agricultural
extension services and smallholder food security ........................................................ 99
Table 26. Chi-square relationship between demographic characteristics and household
food security............................................................................................................... 101
Table 27 Pearson Chi-Square Analysis between farming characteristics and household
food security............................................................................................................... 102
Table 28 Chi-square analysis between accessibility to agricultural extension service
and household food security ...................................................................................... 103
Table 29. Chi-square relationship between AES utilization and household food
security ....................................................................................................................... 105
Table 30 Membership in agricultural cooperative societies ...................................... 169

ix
LIST OF FIGURES
Figure 1. Conceptual Framework ................................................................................ 57
Figure 2 Study Area ..................................................................................................... 63
Figure 3. Multistage Sampling Flow Chart.................................................................. 65
Figure 4: Household Food Security Status .................................................................. 87
Figure 5. Proposed Agricultural Extension Delivery Model ..................................... 125
x
LIST OF ABBREVIATIONS
AES: Agricultural Extension Service
AGRA: Agricultural Green Revolution in Africa
CAP: Community Action Plans
CBOs:
CESA:
Community Based Organizations
Community-Based Extension Service Agent
CIMMYT: International Maize and Wheat Improvement Centre
CRF: Coffee Research Foundation
ELM: Elaboration Likelihood Model
FAO: Food and Agriculture Organization
FBOs: Faith Based Organizations
FFDS: Farmer Field Days
FFS: Farmer Field Schools
FPEAK: Fresh Produce Exporters Association of Kenya
FSAP: Farm Specific Action Plans
FSR&E: Farming Systems Research and Extension
GDP: Gross Domestic Product
GRT: Green Revolution Technologies
ICRISAT: International Crops Research Institute for Semi-Arid Tropics
ICT: Information Communication Technology
IFAD: International Fund for Agriculture and Development
IFPRI: International Food Policy Research Institute
IITA: International Institute of Tropical Agriculture
KALRO: Kenya Agricultural and Livestock Research Organization
KENAFF: Kenya National Federation of Farmers
xi
KESREF: Kenya Sugar Research Foundation
KNFP: Kenya Food and Nutrition Policy
NAEP: National Agricultural Extension Policy
NALEP: National Agriculture and Livestock Extension Programme
NASEP: National Agricultural Sector Extension Policy
NEP: National Extension Programme
SCT: Social Cognitive Theory
SIDA: Swedish International Development Agency
T&V: Training and Visit Model
TPB: Theory of Planned Behaviour
TRA: Theory of Reasoned Action
TRFK: Tea Research Foundation of Kenya
xii
OPERATIONAL DEFINITION OF TERMS
Agricultural Extension: a “service or system which assists farm people, through
educational procedures, in improving farming methods and techniques, increasing
production efficiency and income, bettering their levels of living and lifting the social
and educational standards of rural life” (World Conference on Agrarian Reform and
Rural Development (WCARRD).
Agricultural Extension Technologies: These are the new and/or existing
information as introduced and relayed by extension service providers. Extension
technologies may be tangible of non-tangible (i.e., can sometimes be just
information).
Agricultural Extension Package: This relates to grouping of extension services
related to one aspect of agricultural production system e.g., crop production or
livestock production, for crop this would relate all aspects from soil testing, input,
crop management to post harvest management and marketing.
Agricultural Households: A group of families practicing agricultural activities for
their livelihoods.
Availability of Agricultural Extension: This relates to enough supply and
appropriate number of agricultural extension providers, with the competencies and
skill‐mix to match agricultural needs of the population.
Accessibility of Agricultural Extension: The ability of the agricultural extension
service providers to reach and benefit small holder farming the considering the
demographic composition, farming households’ density and under‐served areas or
populations.
Farmer Field School: It is an “experiential group-based learning approach, seeking
to empower farmers to learn, understand and make informed decisions. In a farmer
xiii
field school, groups of farmers meet regularly in the field with a facilitator to observe,
talk, ask questions and learn together” on a particular subject.
Food Security: It refers to a “situation when all people at all times, have physical,
social, and economic access to enough, safe and nutritious food that meets their
dietary needs and food preferences for an active and healthy life"(FAO, 1996)
Household: It is a group of people who live together and feed in one place.
Household Head: In this study, it refers to the lead member of the household who
responsible in making crucial decisions of the household on a day to-day operation.
Pluralistic Extension Systems: Encompasses a “range of service providers,
approaches, funding streams, and sources of information available to farmers and
clients.”
Utilization of Agricultural Information: This relates to conversion into action of the
knowledge and information by the smallholder farming households to perform their
agricultural production activity.
Smallholder Farming Household: this refers to families owning less than 2 hectares
of land on which they grow subsistence crops, keep few livestock and sometimes
engage in off-fare activities.
xiv
ACKNOWLEDGEMENT
First, I would like to thank the Almighty God for His grace, which enabled me to
undertake this PhD.
My sincere gratitude goes my supervisors Professor Violet K. Mugalavai, Professor
Julius Ochuodho and all others who encouraged me push ahead and not to give up on
this journey.
I am indebted to my parents, the entire Kimaru family, for their financial and moral
support. Special thanks to my Mother Margarina Kimaru, who is my role model.
To you all, I say thank you!
1
CHAPTER ONE
INTRODUCTION
1.1 Overview
This chapter is an introduction and offers a summary of the basic concepts;
background information, problem statement, objectives, hypotheses, justification,
scope, and limitations of the study.
1.2 Background of the Study
Other than being one of the major global debates, agriculture is a critical economic
growth driver. It is also essential in reducing poverty for most developing countries
and a crucial investment area as well as a source of food security. According to a
2018 report by FAO, “global food security mainly relies on productivity of 570
million farms that differ broadly by size, production system, product, resource base,
level of technology, productivity among other factors, majority (90%) of these farms
are family enterprises.” The role played by agriculture in industrial growth and
immense development of most industrialized countries can not be emphasized
enough. In developing countries like Kenya, the significance of this sector is more
pronounced. Muhammud (2009) asserts that, “it is the central survival thrust of the
nation, employment and food.” For the rural people, agriculture is even more
significant because it is their central way of life. Although agriculture’s significance
as an essential contributor to the country’s GDP, “agriculture still represents an
important input to the national economy and to rural livelihoods in Kenya” (Ephrem
2009).
According to the Republic of Kenya (2002), “Kenya’s economy is heavily dependent
on the agricultural sector that also provides the basis for the development of the other

2
sectors.” It directly contributes to 25% of the GDP and further contributes indirectly
to 27% by means of “linkages with agro-based and associated industries.” (KARI
2002). Additionally, “The sector employs about 75% of the total labour force,
generates 60% of export earnings, and provides 75% of industrial raw materials and
45% of Government revenue” (KARI 2002). Maize farming is specifically practiced
by most people living in the rural areas, and KARI (2002) adds that, “about 80% of
Kenya’s population live in the rural areas and are engaged in agricultural activities
including maize farming. The majority of the populations are smallholder farmers
who account for 75% of the total agricultural output in the country”.
Adult education is critical in any country and Indabwa & Mpofu (2006) defines it as,
“any learning or educational activity that occurs outside the structure of the formal
education system and is undertaken by people who are considered to be adults in their
society.” Several scholars highlight the significance of adult education, mentioning
that it “seeks to meet the learning needs and interests of adults outside the formal
education.” (Indabawa & Mpofu, 2006). Non-formal education is defined as, “an
activity outside the structure of the formal education system that is consciously aimed
at meeting specific learning needs of particular subgroups in the 3 community be they
children, youth or adults.” (Fordham, 1993). Extension is a form or non-formal
education that focuses on adults in the rural areas, who belong outside the formal
school system. Its central aim is to better the quality of life through acquisition of
knowledge and skills. Extension education for farmers often occur outside formal
institutions. Agricultural extension “focuses on the non-formal education of rural
adults, in particular farmers, to improve their agricultural knowledge and skills for
increasing farm production, which is meant to result in enhanced income for farmers,
leading to improvement in their lives. Adult education can cover community health
3
education, nutrition, and agricultural extension, vocational skills training, in short, any
form of education and training for adults.” (Gboku & Lekojot).
The intervention of agricultural extension has become common in the rural areas with
the main intention of making their lives better. This has also seen the coming up of
extensive extension programmes. Despite the popularity of these programmes,
Habtemariam (2007) asserted that, “the impacts of all of these extension interventions
have not had much influence in terms of improving the life of the rural population in
general and the mode of maize farming and productivity in particular.”
Worldwide, “agricultural extension has been recognized as a formal institution with
legal structural arrangements with various approaches relying on government
extension, private services and other stakeholders on pluralistic systems” (Rivera,
1991). “Agricultural extension was institutionalized and organized in the 1960s and
1970s in many countries across the world” (Swanson, 2008). However, there is
difference among farmers in “their access to and utilization of agricultural
information from extension service providers and other agricultural sources”.
Smallholder farmers are recognized for their contribution to food supply in the better
parts of the world. Guneralp et al., (2017) posits that an approximate of “500 million
smallholder farmers produce 80% of food supply in Sub Saharan Africa and Asia”. It
is important to note that this remains consequential to these farmers since they are
needed to adapt for more productivity, diversification, and resilience in the existence
of climate change and any other changes that may occur based on nature. These have
consequences on smallholder farmers who need to adapt to become more productive,
diversified, and resilient in the presence of climate change and other nature-based
changes.
4
Agricultural extension has also been described as advisory services for agriculture. In
practical terms, it involves giving farmers agronomic knowledge, skills and
techniques that would aid them in improving their productivity, livelihoods, and food
security. It involves two main components; delivering practical information on
aspects such as soil quality, management of water, crop protection, and how to apply
this knowledge on the farm to achieve desired objectives.
One of the major identifications of agricultural extension across the globe is its role as
an institution. Rivera (1991) describes it as having “legal structural arrangements with
various approaches relying on government extension, private services and other
stakeholders on pluralistic systems”. However, there is difference among farmers in
terms of accessing and utilizing information offered by extension service providers
among other sources.
The significance of agricultural extension is emphasized by Ijatuyi, Omatayo &
Mabel (2017), who mention that “agricultural extension means provision of need and
demand-based knowledge in agronomic techniques and skills to improve production,
income and general livelihoods and quality of life”. Both participatory and methodical
delivery modes were implemented. Challenges in rural development are best tackled
through agricultural extensions which offer technology and information access for
development purposes. It is important to highlight the smallholder farmers’ need of
sufficient information and skills. These two elements are achieved through formation
of links between farmers’ organizations and other important players (Davis &
Heemskerk, 2012).
5
Investment and supportive policy and regulatory framework and institutional changes
can enhance agricultural extension and food security (FAO, 2010). However, budget
allocation in agriculture in Africa has remained low. While the average government
expenditure in Africa is 4.5% as me provided by the International Budget Partnership
(IBP), the Kenya Government allocations to the agricultural sector has been below
par. IBP adds that, “they were two percent in 2015/16, 1.3 percent in 2016/2017 and
1.8 percent in 2017/18”. Mengoub (2018) mentions that “In 2018, only four African
countries (Malawi (23 %), Mozambique (18 %), Niger (12 %) and Zimbabwe (10 %)
exceeded the level of agricultural expenditures compared to the total public
expenditures of 10% set by the African Union within the Maputo Declaration”. The
extension departments remain under funded, on average county governments have
allocated a budget of 6% of their total budget to the agricultural sector, limiting the
equipping of existing staff and recruitment of new staff. The underfunding has
remained persistent over the last decades, further compromising the extension service
and the growth of the agricultural sector. Reduced farm incomes as well as
unemployment are the two major causes of poverty.
According to Lowder et al. (2016), Africa’s 51 million farms are relatively “smaller
of these farms 80% are smaller than two hectares in size with the number of such
farms increasing due to land subdivisions”. Larson et al., (2014) add that most of
these farms produce at efficient costs compared to the larger farms that enjoy the
advantage of fair opportunity. The small farms produce approximately 30% of total
agricultural output.
6
Both hunger and food security are among the priorities of the Achieving Sustainable
Development Goal. This is made possible through promotion of sustainable
agriculture that fosters more production of food.
However, hunger remains prevalent in Africa, with undernourishment rising from
17.6% in 2014 to 19.1% in 2019. (FAO et al., 2020). One of the main aspects of food
security in any rural household is farming, especially because majority of household
expenditure include food purchases (van de Ven et al., 2020).
For countries with advanced agricultural sectors such as US, Canada, and Australia,
extension services are very strong and offer increased benefits to the farmers. This is
very different in developing countries where the existing extension services fail time
and again to comprehensively meet the needs of the farmers. In a bid to offset this
failure, the World Bank established the training and visit system that played a critical
role in the 1970s Green Revolution in India. However, this system was not successful
as it failed in significant areas such as diversified farming systems in areas with
increased rainfall. The system also failed to meet the evolved challenges such as
improved sustainability, promotion of diversification, and linking farmers to markets.
Prioritizing agricultural extension in Africa will therefore play a great role in
promoting and sustaining food security and livelihoods for smallholder farmers. This
will further enhance technology adoption to boost agricultural production though it
has been slow in Sub-Saharan Africa (Raidimi, & Kabiti (2017). Udry, 2010; Duflo,
Kremer & Robinson, 2011).
It has become paramount for farmers to constantly adapt and innovate over time due
to different opportunities, circumstances and the immense global demand for food and
other farm produce. A 2018 FAO report mentions that “Continuous farm-level
7
invention will be essential to meet an expected 59-98% increase in global demand for
food between 2005 and 2050”.
One of the positive aspects of agricultural extension is the resultant constructive
behavioral changes among smallholder farmers. It also serves as a source of
information regarding issues around food storage, processing, management of the
farm and marketing (Rivera et al. 2001). Agricultural effectiveness is one of the major
approaches recommended by Zwane (2012)) for viewing agricultural extension.
Services from extension present a chance to better resilience of rural households. This
is attained by “improving the access to actual resources including knowledge and
inputs. All these factors foster the productivity of the farm that eventually has a
positive impact on food security” (Spielman, et. al 2008). Educating and training the
farmers are some of the main features of agricultural extension. It ensures that these
farmers gain knowledge regarding the appropriate farm activities to engage in and
how to best apply scientific research for agricultural success.
Kenya’s small-scale farmers living in high potential areas (owning less than 10
hectares) produce “more than 75% of the total agricultural production and 70% of
marketed production”. When drought is a non-factor, these farmers produce majority
of the country’s food requirements. Due to recent deficits against crops such as sugar,
rice, maize and consumable oils. The reduction in production is linked to the reduced
sizes of arable land, high costs of agricultural inputs and reduced soil fertility
(Chukwu, 2014). It is clear that the sector’s productivity is dwindling leading to food
insecurity in nearly most parts of the country.
8
The agricultural production of smallholders’ farmers has been gradually declining,
hence the need for agricultural extension reforms. In Kenya, the policy of agricultural
development acknowledges the role played by the public and private sector that
operates on the extension service. This existence guides the country towards goal of
transforming semi-substance farming into a modern aspect that allows the
achievement of food security. It also helps to improve the incomes and actively
reduce poverty. The means for proper management and agricultural extension
organization have been highlighted by the National Agricultural Sector Extension
Policy (NASEP) 2012.
Extension service providers include specific actors such as ministries in the public
sector including agricultural departments. Other actors are in non-profit sector that
comprises if NGO, community-based organizations, commercial companies from the
private sector. Anderson et al., (2004) mentions that “effective extension involves
adequate and timely access by farmers to relevant advice, with appropriate
motivations to adopt the new technology if it suits their socioeconomic and
agroecological circumstances”.
The Kenya Integrated Household Budget Survey (KIHBS) 2015/16, indicated that
“41% of the population in the county live below the poverty line while the Kenya
Demographic and Health Survey stated that thirty-two percent of households in Uasin
Gishu County experienced food shortages.” From the KDHS (2014), “prevalence of
stunting was 31.2% with 11.5% of children under-five being underweight. This
scenario is primarily attributable to less diet diversification with overdependence on
maize meals”.

9
The Uasin Gishu County Integrated Development plan (CIDP) 2018-2019 recognises
that investment in agriculture, being the mainstay of the county, will ensure food
security and improve the nutritional status of the people of the county. It is recognised
that the sector has continued to face challenges including high cost of inputs, post-
harvest losses and low profitability of the sector. With this backdrop, the County as
outlined in the CIDP plans to revamp extension services by ensuring sufficient
officers and integrate information communication technology ICT into extension
service, support post-harvest management and subsize farm inputs (seeds and
fertilizer).
The changing climate will worsen the scenario above. The County has been facing
rainfall variability which has increasingly been compromising productivity and hence
food security. Climate projections indicates even greater challenges in the coming
years if farmers are not supported to build their resilience.
The Kenya Vision 2030 depends on food security as one of its main drivers as
provided by the Kenyan Government. In the Jubilee administration, food security has
been highlighted as one of the major agendas. When farmers access these extension
services, they are able to improve farm productivity and help solve the issue of food
insecurity.
1.3 Statement of the Problem
The agricultural sector in Kenya mostly comprises of small to medium scale farmers,
owning an average of 0.2 to 3 hectares, and these farmers “account for 78% total
production and 70% of commercial production” (World Bank, 2015). Kenya’s
historical analysis of agricultural productivity recorded steady and modest growth
between 1961 and 2008 (Fugile and Rada, 2013). However, there have been reported
10
decline in productivity of cereals, for example, yields per hectare of maize has been
decreasing.
Smallholder farmers are undergoing “agricultural production decline as arable land
sizes are also decreasing, rising cost of agricultural inputs, soil fertility is declining;
coupled with low rates of technology adoption and changes in climate leading to low
amounts of rainfall among others” (Chukwu, 2014). In Kenya’s economy, extension
service is a critical change agent playing an important role in technology transfer,
knowledge sharing and linking farmers to other actors along the value chain. Since the
1980’s, extension service has been provided by the public sector, however the
continued low budgetary allocation and recent transfer to the county level, has
hindered the effectiveness and the subsequent transformation of small holder
agriculture. A correlation exists between reduced productivity and low utilization of
extension services. Some of these challenges could be addressed through a
functioning and effective extension service.
The effectiveness and efficiency in the delivery of extension services is one of the
main objectives of the National Agricultural Sector Extension Policy (NASEP). The
policy mainly focuses on fostering an inclusive extension service that is driven by
demand. However, there is limited access to extension by a large proportion of
Kenyan farmers, whereby the national extension to farmer ratio stands at 1:1500
against the recommended ratio of 1:400. This has the effect of compromising the
extension service, a situation that has not changed with a devolved system under the
Constitution of Kenya 2010.
On the other hand, the policy objective on pluralism of the extension service was
anchored on the premise that pluralistic extension service would provide suitable mix
11
of players from public and private institutions and delivery system which would
achieve varied agricultural goals and serve diverse target population (Zhou, 2010,
Ong’ayo, 2017), however the evidence of success of plural service providers in
extension is scanty.
This study will determine the current availability, accessibility, and utilization of
agricultural extension services. The broad aim being to understand the types of
agricultural extension service providers, availability, and accessibility of the service;
and finally, level of utilization and establish its association to the status of food
security in the smallholder farming households.
1.4 Objectives
1.4.1. General Objective
The purpose of this study was to assess the association of “availability, accessibility
and utilization of agricultural extension services on food security of smallholder
farmers in Uasin Gishu County”.
1.4.2. Specific Objectives
i. To ascertain the availability of agricultural extension services and its
association with food security of smallholder farming households
ii. To assess the accessibility to agricultural extension services and its
association with food security of smallholder farming households.
iii. To establish the utilization of knowledge and practises of agricultural
extension services and its association with food security of smallholder
farming households.
iv. To assess the association food security situation of smallholder farming
households.
12
1.5 Research Hypotheses
Ho1: Enhancing availability of agricultural extension improves the food security of
smallholder farming households.
Ho2 Enhancing the accessibility to agricultural extension improves the food security of
smallholder farming households.
Ho3: Enhanced utilization of agricultural extension services improves the food security
of smallholder farming households.
Ho4: The small holder farming households in Uasin Gishu are food secure.
1.6 Significance of the Study
Production of food was deteriorating when this study was conducted, with the risk of
food security for the growing population. Agricultural extension services enhance
agricultural productivity. Over time, agricultural extension has evolved in its
structure, delivery, and approach but there is a gap in knowledge and understanding as
far as “availability, accessibility and utilization of the agricultural knowledge and
technologies” is concerned. Furthermore, the nexus between the agricultural service
accessibility and utilization to smallholder farmers’ food security of is not well
established.
This study will offer significance contribution to the literature on understanding the
effects of agricultural extension on food security as well as provide recommendations
to policy makers on improvement of agricultural extension services for increased farm
productivity and ultimately household food security.
1.7 Scope of the Study
This study was conducted in Turbo and Soy Sub-Counties of Uasin Gishu County.
The two sub-counties were chosen purposively, the main consideration being areas
13
with high concentration of smallholder farming households with maize growing as the
main agricultural activity in relatively smaller farm sizes compared to the other Sub
Counties. The study centred on smallholder farmers’ socio-economic characteristics,
availability, accessibility, utilization of extension services and their effect on
household food security. Availability of extension focused on the type of institutions
of offering the extension services, accessibility emphasized on the characteristics of
the agricultural system, the extension techniques used, the quality of services, the
timeliness and effectiveness as perceived by the respondents, utilization focused on
the use of knowledge to inform the farming decision.
The Household Food Insecurity Access Scale (HFIAS) helped establish the extent of
food insecurity. Using this method factored in the idea that reduced access to food
security results in actions that can be recorded and analysed by means of survey and
summarized in a scale. This is a qualitative measure that provides insights on
household’s experience food insecurity for the last 12 months before the survey. The
questions to respondents aimed at obtaining information on these main areas: 1)
anxiety levels regarding food supply and budget 2) perceptions of inadequacy of food
quality or quantity 3) reported reductions and consequences of a reduction in the
intake of food among adults and children. By using the study’s results, assigning
households according to the severity of food insecurity.
1.8 Limitations and Delimitations of the Study
Food security is a “multidimensional issue which cannot be adequately measured by a
single indicator”. A multidimensional measurement approach was used indicator was
used at any particular time may bring the risks of inability of respondents to
accurately recall coupled with changing rain patterns on an annual basis, this limits
14
the extent of use of the conclusions on food security status based on an assessment of
only one period.
Due to time and resource constraints, this research modified food security
measurements questions, asking respondents to report on the occurrence of conditions
and behaviors that reflect constraints to household food access and satisfaction. For
the same reasons, the study focused on availability, accessibility and utilization of
agricultural extension and the resultant effect on current food security situation of the
sampled households. It did not measure the actual farm productivity arising from
adoption of the knowledge gained from agricultural extension services. Findings from
this study can be generalized for other smallholder households in as far as they reside
in similar agro-ecological zones in Kenya.
15
CHAPTER TWO
LITERATURE REVIEW
2.1. Overview
This chapter reviewed the literature relevant to the research study objectives on
agricultural extension. It provided an overview of trends in agricultural extension
service globally and locally. It also summarised the extension models and state of
food security. This chapter also reviewed relevant theories on adoption and human
behaviour.
2.2 Small holder Farming Households
There are roughly “1.5 billion smallholder farmers in the world, a figure that
incorporates 75% of the world’s poorest people” (Ferris et al. 2014). Agriculture is
depended by most of the people that are extremely poor. In most developing
countries, 80% of the food is produced by smallholder farmers. This does not prevent
the under-sourcing of the farmers as well as lack of access to better farming inputs,
and better markets. All these result in reduced productivity and missing opportunities
to break the chain of poverty. Anderson & Feder (2007) posit that, “agricultural
productivity in many developing countries, and predominantly in Africa, remains far
below that of developed countries and many middle-income countries; ineffective and
inefficient extension services is one explanation, among others.”
According to IFAD, (2012), agricultural investments and policy have not led to small
holder farmers empowerment. Smallholder farmers have often been left out in policy
making on the future of agriculture (Wiggins 2011; Vorley et al., 2012). Murphy
(2010) posits that farming households “are defined by marginalization, in terms of
ease of access, resources, information, technology, capital and assets.”
16
In Kenya, smallholder farmers owning about 0.47ha of land produce over 63% of the
total agricultural output. The farms provide food for home-consumption and for the
market (Rapsomanikis, 2015).
2.3. Global Perspective of Agricultural Extension Services
Agriculture is key in addressing rural poverty, hunger, and livelihoods. Improved
agricultural productivity is a factor of research and development of technologies and
good practices for better yields, promotion of crops resistant to climate change
impacts, improved access to markets, among others. The agricultural extension
service communicates this information to farmers. Agricultural extension includes “all
the activities that provide information and services required and demanded by farmers
and other actors to support them to improve their production and livelihoods.
Technologies and practices can only lead to expected development impact if they are
communicated well and implemented appropriately by farmers and other users at
scale.”
During post-independence, the agricultural extension service was mainly public led.
Across many developing countries, agricultural extension has evolved significantly
over the years with a transition from traditional government -led approaches to a
pluralistic system. Mbo’o-Tchouawou, & Colverson, (2014) mention that. “most of
the approaches were built from Training and Visit (T&V) model designed to train
extension agents on technical skills to be passed on to the farmers using on-farm
demonstrations, farmer field days and in-service training courses.” The T&V though
reported to have achieved some positive outcomes was proven not to be effective and
viable due to its “inflexibility, top-down nature, high operational costs, and
inadequate funding”. Farmers’ inactive role arising from the approach, “non-
responsiveness to farmer’s concerns plus the inability to consider in country specific
17
economic, social, cultural and institutional contexts contributed to its failure”
(Anderson et al., 2006; Birner et al., 2009). The exclusive provision of AES by the
public sector remains debatable given the challenges in budgets and general
inefficiencies in the public sector.
There was little consideration to the farmer’s participation in problem characterisation
or design of extension programs. Further, the latter half of 20th
century saw
developing countries and governments funding public extension systems with
inadequate resources organized top-down (Swanson, 2008). Likewise, experiments
and demonstrations were largely carried out in research stations rather than in the
farms of farmers (Davis & Place, 2003). Furthermore, resource-deficient and food
insecure farmers perceived to be less likely innovative and unlikely to adopt the
propagated technologies were often disregarded.
2.3.1. Changes in Agricultural Extension Service
Arising from past failures, agricultural extension service has witnessed evolution
towards a more sustainable and inclusive approach. These “range from demand-
driven systems to decentralised pluralistic extension approaches” (Mbo’o-Tchouawou
& Colverson, 2014).
These methods aim at promoting farmers contributions to AES delivery process.
Examples include farmer first, farmer-to-farmer, farmer-field schools, among others.
These approaches based on the common principle of participatory models with the
farmers being the main actors whereas the extension agent becomes the facilitator.
supporting and coordinating knowledge acquisition.
18
Other reforms include the “decentralization and privatization of rural agricultural
service delivery systems”. Consequently, there has been multiplicity of non-state
actors involved in AES delivery with differing clientele, quality, and nature of AES
provision. Despite this increasing number of actors offering diversified options in
provision of AES, challenges remain in exploiting the full capacity and potential of
agricultural extension systems. NGOS and cooperatives are constrained by limited
funding and capacity while the private companies often target well-off farmers
growing high-value agricultural commodities mainly for export hence leaving behind
rural poor and subsistence farmers (Hassan et al. 2013).
The recent advancement in “economics and agricultural extension literature has
focused on the need to address key constraints to improving performance” and
changing the persistent low productivity of smallholder agriculture for enhancement
of food security. “Numerous verified technologies and improved farming practices
have a huge potential for boosting agricultural production and reducing poverty in
developing countries. However, the adoption of such technologies by smallholder
farmers, in Sub Saharan Africa, has been persistently remained low and slow” (Udry
2010; Duflo, Kremer & Robinson 2011) resulting in persistent low agricultural
productivity (World Bank 2008).
According to Commission on Sustainable Agriculture and Climate Change, (2011),
“limited awareness and low understanding of Climate Smart Agriculture technologies
by smallholder farmers, together with the related high cost of farming technologies
have been major impediments to adoption of current and emerging climate smart
technologies and practices”.
19
Most research on agricultural extension have focused on the “adoption of
comparatively expensive agricultural inputs, such as high yielding seed varieties”
(HYSV) and chemical fertilizers; on the other hand, there is limited empirical
evidence on the adoption and the results of improved basic cultivation methods. Or
even such basic methods such as crop rotation and use of organic manure which could
be extremely important for marginalized smallholder farmers, who are less likely to
adopt improved cultivation techniques on their own. In addition, a small number of
studies have reviewed the causal relationship between “extension achievements
beyond input adoption and production” (Anderson & Feder 2007).
According to Pan et al., (2018), “agricultural extension programs have recorded
mixed success”. They add that the effects of extension services have been highlighted
in “seed varieties fertilizer, and pesticide use, and on productivity on crop yield per
hectare, crop value, and net profits from agriculture, results from this examination are
mixed”.
“Smallholders in many developing countries remain deprived when it comes to
accessing quality agricultural extension and advisory services (EAS)” (Glendenning
et al., 2010). Manfre et al., (2013) adds that, “An examination of the selection criteria
for farmer targeting in Kenya, notes the addition of ‘unofficial’ selection factors such
as minimum land size, literacy, and ability to purchase inputs, apparently was
designed to increase the probability of production increase by the farmers”. They
found that it was often the village leaders and chiefs plus the field extension agents,
generally of male gender men who made this selection, and that, because of the
underlying biases in the selection criteria, comparatively few women ever received
services.
20
2.4. Agricultural Extension in Kenya
Agricultural extension in Kenya often involves “recommendations for improved soil
fertility management that are disseminated to farmers in a farming area, covering
certain regions in the country” (Shehu et al. 2018). However, “such agricultural
extension practices fail to consider the varied and complicated biophysical and socio-
economic conditions of smallholder farming” (McCarthy et al., 2018). Agricultural
extension that is site-specific incorporates suggestions that are tailored to the
condition and situation of an individual farmer or farm.
The effectiveness of these suggestions in causing productivity are more compared to
former practices of extension. “Information, and communication technology (ICT)
driven decision support tools (DSTs) offer great potential in improving the capacity of
agricultural extension providers in the delivery of site-specific extension
recommendations in a more cost effective and innovative way to farmers” (Fu &
Akter, 2016, Vanlauwe et al., 2017, & Verma & Sinha, 2018).
Kondylis, Mueller & Zhu (2017), a detailed and rigorous study that aimed at
addressing the “impact of an extension activity on adoption of basic farming methods
found out that adding extra contact (to the model) farmer training to their existing
extension program training had no impact on adoption choices of other farmers.”
2.4.1 Evolution of Kenya’s Agricultural Extension Service
Kenya’s agricultural extension is more than 100 years old, having begun in the early
1900s. The extension system has changed tremendously over the years. Certain
approaches were used in the colonial times were purposed to serve the farming
systems of the settlers. They included comprehensive programs marked with
extension services and subsidized inputs. Indigenous Africans were only served by the
21
extension approach since their systems were not complex. It was also because they
indulged in activities such as pastoralism and the coerciveness nature made it difficult
to be accepted (Mwangi, 1998).
Upon attaining independence, increasingly persuasive and educational approaches
were utilized and enabled through projects funded by donors. Notable success during
this period was the dissemination of hybrid maize technology. This system
characterized by farm level participation in the form of farmer input in on-farm trials
(Collinson, 2000). The “peculiar feature of the FSR&E technique was its three-way
connection between farmers, researchers, and extension service providers. However,
the above systems were costly, inefficient, and performing below its potential”
(Gautam, 2000).
The farming systems, training, and visit approaches were introduced in the 1980s and
1990s, alongside these, the “commodity specialized approach’ was mostly used in the
large export commodity subsector spearheaded by commodity boards and private
companies. In 1982, Training and Visit (T&V) agricultural extension system was
introduced in collaboration with the World Bank. This system employed profitably in
Turkey and India was initiated to correct the deficiencies of top-down approach and
FSR & E systems. Kenya became “the first African country in which this model was
applied” (Farrington, 1998). The World Bank “funded T&V in two phases, under the
National Extension Program (NEP) I and NEP II to develop institutional
arrangements that would provide efficient and effective delivery of agricultural
extension services to smallholder farmers” (Mwangi, 1999).
FAO (1997) asserted that, “after the implementation of structural adjustment
programs (SAPs) in the 1980s, the Kenyan government came under substantial
22
pressure to scale down its central role in national economy”. “At the same time, the
performance of the public agricultural extension service in Kenya was questioned and
its effectiveness became a very contentious subject” (Gautam and Anderson 1999).
The “traditional public extension system was perceived as outdated, top-down,
authoritarian, uniform (one-size fits-all), rigid, subject to bureaucratic inefficiencies
and therefore unable to cope with the dynamic demands of modern agriculture”. The
unitary top-down extension mainly comprising the Training and Visit system (T&V)
delivered messages to “groups of farmers, promoting the adoption of Green
Revolution technologies”(Leeuwis & van den Ban, 2004). Nonetheless, Purcell &
Anderson (1997) found evidence of “accountability problems in many World Bank
extension projects including training and visit, crop-oriented programs, farm
demonstrations programs and land grant college approach.”
Preference has been “towards decentralized and demand-driven public extension
systems” (Rivera et al., 2001). This was motivated by the desire for dissemination of
technologies that are suitable to “explicit agro-ecological and socio-economic
conditions” (Swanson, 2008). In addition, there has been an inclination towards
privatization (Umali-Deininger, 1997). Input suppliers have been deploying extension
service through contract farming, these are food processing and distribution
companies (Swinnen & Maertens, 2007). In addition, “producer cooperatives and civil
society organizations began to participate in the provision of extension services to
poor farmers in pluralistic extension systems based on public-private partnerships.
However, private, and pluralistic arrangements of agricultural extension have not yet
broadened explicitly in the poorest ones” (Anderson & Feder, 2004)
23
To respond to the changes and to encourage main improvements in delivering
extension services, the Ministry of Agriculture and Rural Development in 2001
formulated the National Agricultural Extension Policy (NAEP). The NAEP
“acknowledged the need to diversify, decentralize and strengthen the provision of
extension services to increase their sustainability and relevance to farmers. The NAEP
was supposed to form the basis for all extension work within the government and in
its interaction with other stakeholders in agricultural research and development. It
was structured to bring on board both public and private service providers as a way of
finding means of addressing the intricate, methodical issues that affect rural
communities” (Mwangi, 1999).
To operationalize the NAEP, “the ministry prepared a National Agricultural and
Livestock Extension Program (NALEP) and NALEP Implementation Framework”.
(MoA & MoLD, 2010)
2.4.2 Objectives and Activities of NALEP
NALEP’s main implementation strategy was “to form and promote institutions at the
local level. These institutions were to sustain programme initiatives and activities and
support agricultural sector reforms related to the delivery of agricultural research and
extension services and strengthen research extension-farmers linkages” (NALEP,
2007). NALEP, I started in July 2000 ending in 2005, while Phase II begun in 2007
ending in 2011. NALEP had two-pronged goal: to ensure development within the
agricultural sector and contribute to the nation’s priority of eliminating poverty.
NALEP was created from the experiences of the National Soil and Water
Conservation Programme (NSWCP), a programme funded by the Sida from 1974 to
2000. The NSWCP was a land husbandry programme registering success in leading to

24
considerable decrease in soil erosion and increased agricultural productivity reaching
1.5 million small holder farmers.
NALEP Activities were in “four components: (1) Planning, Monitoring and
Evaluation; (2) Training; (3) Collaboration and Research and (4) Gender and Poverty
Focus” (NALEP). The programme emphasized “a systems approach to diagnosing
problems at farm level with efforts to ensure that farmers in the focal areas were
equipped with an individual farm action plan (FSAP). It also emphasized the role of
the extension service as a facilitator, connecting the farmer with private sector
services rather than managing government handouts. The focus was on a demand-
driven and participatory delivery of extension services in a transparent and
accountable manner. The farm level plans were drawn up as a joint effort between the
extension agents and the farmers, while the transparency and accountability were
promoted through a decentralized activity planning and budgeting process.”
The aim was to “make extension demand driven, increasing efficiency in extension
service provision, and mobilise alternative funding apart from the exchequer,
promoting gender equality and controlling environmental degradation” (Deschamps-
Laporte, 2013). In addition, NALEP identified and targeted vulnerable groups such as
“the disabled, orphans and resource-disadvantaged among the clientele ensuring they
access extension messages and outreach programmes” (Deschamps-Laporte, 2013).
The current extension system is “a product of gradual evolution in extension
management practices and the entry of private sector, NGOs, and civil society players
over time in response to changes in economic policies”.
25
Additionally, the past decade has seen widespread use of “mobile phone-based
applications and services in the agricultural sector, providing information on market
prices, weather, transport and agricultural techniques via voice, short message service
(SMS), radio and internet. While they are innovative and cost effective, it is known if
and how they will substitute existing agricultural extension systems”. (Aker et al,
2010). It may also not be affordable to smallholder farmers (Aker et al, 2010).
However, use of mobile phones in agricultural extension is not affordable by several
smallholder farmers and the empirical evidence on their impact remains limited.
2.4.3 Kenya’s Agricultural Policy Frameworks
In June 2008, the GoK adopted Vision 2030 as a new blueprint for Kenya’s
development. This “provides a road map for the country’s economic and social
development over the next two decades. It aims at transforming Kenya into a newly
industrialized, middle income country providing a high quality of life to all its citizens
in a clean and secure environment”. (GoK, Vision 2030)
Vision 2030 identifies “Agriculture as a key sector in achieving the envisaged annual
economic growth rate in. This is through the transformation of smallholder agriculture
from subsistence to a modern, innovative, and market-oriented part of Kenya’s
economy.” (Mwangi, 2010).
Implementation of Vision 2030 agriculture objectives is through the Agricultural
Sector Development Strategy (ASDS) 2010 – 2020, guided by the Agriculture and
Fisheries Act of 2013. The aim of the ASDS, “aligned to both the Kenya Vision 2030,
and the Comprehensive Africa Agriculture Development Program (CAADP), is to
realize increased sector productivity, commercialization, and competitiveness, as well
26
as the development and more effective and efficient management of key factors of
production. The ASDS implementation is through three (3) year Medium Term
Investment Plans (MTIP) linked to the national planning and budgeting process.”
(Mwangi, 2010).
Kenya is in its Third Medium Plan, this period has seen prioritization of “Big Four:
food security, affordable housing, manufacturing, and affordable healthcare” for all.
The food security agenda is aims at increasing the average daily income of farmers by
34%, “reduce malnutrition among children under 5 years of age by 27% and create
1000 agro-processing SMEs and 600,000 new jobs.” “Fifty percent reduction in the
number of food insecure Kenyans, 48% increase in agriculture contribution to GDP
and 47% reduction in the cost of food as a percentage of income”. In driving small
holder productivity, some initiatives have been proposed including establishment of
“1,000 targeted production level SMEs using a performance-based incentive model in
the entire value chain and improving access to credit/input for farmers through
Warehouse Receipt System and strengthen commodity fund”.
Kenya has also developed a “Country Programme Paper (CPP) on Ending Drought
Emergencies (EDE) as part of the IGAD Drought Disaster Resilience and
Sustainability Strategy”. The paper presents Kenya’s framework approach towards
ending recurrent drought emergencies. The paper translated into a medium-term plan
“under the leadership of the National Drought Management Authority (NDMA),
implements key components of the ASAL policy and Vision 2030’s strategy for the
development of northern Kenya and other arid lands. The paper focuses on creating a
more conducive environment for building drought resilience through building
stronger foundations and institutions for development.”
27
Kenya’s Constitution 2010 ushered in a new governance system from centralised to
devolved system. “The Fourth Schedule of the Constitution provides for devolution of
specific functions in agriculture to the county governments namely: crop and animal
husbandry; livestock sale yards; county abattoirs; plant and animal disease control and
fisheries. The National government retains the functions of policy making under Part
1 Section 29 of the Fourth Schedule; establishment of quality standards; capacity
building and technical assistance; information management and technology transfer;
drought and flood disaster preparedness; conservation of crop, animal, and forage
genetic resources; research agenda setting and promotion of private sector investment
in agriculture. Other functions of the National Government include coordination of
livestock agribusiness, value addition and product value chain; development of
strategic marketing infrastructure and management of National agricultural training
institutions. Implementation of national policies mainly takes at the county level.”
(GoK, 2010).
Several policies have been drafted to “provide the overall framework for the new
devolved system of governance such as Agriculture Sector Transformation and
Growth Strategy” (ASTGS 2019 – 2029) which replaced the Agriculture Sector
Development Strategy (ASDS 2010 - 2020) “change in government in early 2013 saw
the establishment of the Ministry of Agriculture, Livestock and Fisheries (effectively
combining three ministries into one”. In Uasin Gishu, the agricultural sector goal is to
enhance food security and improve livelihoods through increased agricultural
production and productivity. In fulfilment of its mandate, the county has made
progress as reported in the CIDP 2018-22, the county has trained farmers, recruited
additional extension officers, subsidized maize seed, established a soil testing
laboratory, constructed potato cold storage store, ware potato stores and one diffuse
28
light store to contribute post-harvest management and reduce post-harvest losses,
among others (CIDP 2018-2022
2.5. Food Security among Small Holder Farming Households
Food security is defined as a “situation in which all people, at all times, have physical,
social, and economic access to enough, safe, and nutritious food which meets their
dietary needs and food preferences for an active and healthy life” (FAO, 1996). Apart
from availability of food, there are other equally “fundamental dimensions of food
security such as access to and utilization of food, agricultural supply, and
productivity” (Burchi & Muro, 2016). Food insecurity has a time-related dimension
defined as temporary when a person suffers from a short-term decline in food
consumption.
Chronic food insecurity is a situation where a person is continuously unable to secure
enough food. During transitory food insecurity period, a household adopt several
coping strategies, including depletion of productive assets, mainly common in poor
households, which may lead to chronic food insecurity in the longer term.
The Sustainable Development Goals (SDGs) number two rally “countries and
stakeholders to work together to end hunger and prevent all forms of malnutrition” by
2030. It “seeks sustainable solutions to end hunger in all its forms by 2030 and to
achieve food security.”
The aim is to “ensure that everyone everywhere has enough good-quality food to lead
a healthy life. Achieving this Goal will require better access to food”. This means
working on “improving the productivity and incomes of small-scale farmers by
promoting access to land, technology and markets, sustainable food production
29
systems and resilient agricultural practices. It also requires increased investments
through international cooperation to strengthen the productive capacity of agriculture
in developing countries” (UN, 2015).
There are an “estimated 500 million smallholder farmers in the world, contributing to
most of the food consumed in low-income countries” (Lowder, 2014). These
smallholder farmers mainly relying on rain fed agriculture are frequently food
insecure. The “smallholder farmers have limited resource endowments starting from
the limited land size, mainly use household labour and have minimal training and
finance to enable adoption of new technology. Smallholder farmers with limited
capacity to invest in good agricultural management practices and technology to
increase productivity are sometimes not able to produce more than they consume
throughout the year, and many are therefore net buyers of the food crops that they
produce” (Niles & Brown, 2017). Additionally, complex factors influence the
inability by smallholder farmers to ensure consistent food security, among them are,
“agricultural management of farming system, social capital of household as it relates
to networks in the community, and household characteristics such as education level
and gender of the head of households” (Brown, 2015).
There is evidence that “agricultural interventions built in productivity enhancing
agricultural technologies such as quality fertilizer and better seed varieties have the
potential to increase income by 80-140%” (Holland et al., 2017). In addition, social
capital in the form of farmer-to-farmer knowledge and information access increases
food security. Consequently, “access to financial capital increases adaptive capacity to
food shortages and it is positively associated with market access” (Lowitt et al. 2016,
Holland et al. 2017).
30
In a 12-country assessment in East and West Africa and South Asia of “factors related
to food security in varying rainfall conditions” Niles & Brown, (2017), found that
“food insecurity is prevalent across the countries with 80% of households
experiencing at least one month of food insecurity.” The study further reports that
“among two otherwise equal households, those having certain agricultural inputs,
agricultural practices, financial access and participating in groups are all correlated
with reduced occurrence of food insecurity outside the context of rainfall anomalies.
This demonstrates that agricultural extension could provide smallholder farmer
households with strategies to reduce food insecurity without consideration of rainfall
as a factor”.
A cross-country study by Irz et al. (2001) in Asia and Sub-Saharan Africa on “the
links between agricultural yields and poverty”, found “strong evidence of crop yields
increases leading to a decrease in the number of the poor by about 0.7 per cent. The
study estimated every 10 per cent increase in farm yields, reduces poverty by seven
and five per respectively in Africa and Asia. Small holder farmers tend to spend extra
income locally, on construction materials, locally made furniture, entertainment,
thereby stimulating local (small-scale) business and job creation” (Diao et al., 2010;
Wiggins, 2011).
World Bank (2008) states that, “Expansion of smallholder farming leads to faster rate
of poverty reduction, by raising the incomes of farmers and reducing food
expenditure, and thus contributing to reduction in income inequality”. Majority of
“impact evaluations conducted in Sub-Saharan Africa have reported a positive impact
of agricultural extension programmes, with a return on investment in the range of
13%-500%” (Birkhaeuser et al., 1991). The studies have measured the “impact of
public agricultural extension programmes on farmers’ knowledge of technologies,
31
best agronomic practices, rate of adoption of technology and practices, farmer
productivity and efficiency and level of output.”
In Ethiopia, and India (Feder & Slade, 1993) reported that in “areas where farmers
accessed extension, there was higher probability of adoption of recommended
technology information as compared to non-agricultural extension areas which led to
better production and thus improvement in farmers food security”. Everson (2001), in
economic impact of extension, found that extension have an increasing effect on
“farm productivity, farm income and overall farmers food security with a mean
estimated rate of return of about 40%. Notably, some empirical studies have reported
mixed results, some point to failure of present-day extension systems to lead to
growth of agricultural productivity and income gains” (Feder et al, 2004).
Other studies have also reported “positive effects of extension on agricultural
productivity, rural incomes, and poverty reduction”. In Ethiopia, Dercon et al. (2009),
analysis of the “impact of agricultural extension in Ethiopia found that public
extension visits reduced poverty headcount by 9.8 percent and increased consumption
levels by 7.1 percent”; however, the two (poverty headcount and consumption) only
capture the survey period status.
A study on “impacts of extension access and cooperative membership on technology
adoption and household food security” by Wossen et al., (2015), found that “the
impact of extension access on poverty reduction had a strong significant effect on the
small holder’s access to formal credit than for those without access”. Therefore,
suggesting that financial inclusion can optimise “the positive impacts of extension
services on farmer’s productivity and food security. Improving the access to extension
services by small holders is a better pathway for breaking the poverty trap” (Andersen

32
& Feder, 2007; Shiferaw et al. 2008). Therefore, access to extension can accelerate
economic growth, create market linkages and opportunities, and hence assist in
moving farmers out of poverty. Extension access is “a supply-side policy instruments
that influences agricultural productivity in developing countries. It also facilitates
improved household food security by educating farmers on the best farming and
management practices that shall guarantee better productivity” (Anderson & Feder et
al., 2007).
In addition, formation of farmer-controlled cooperatives is highly esteemed as a
crucial institutional arrangement that helps overcome the constraints that hinder
smallholders’ access to extension and the market. These farmer-controlled
cooperatives can provide credit to ease capital constraints farmers’ face. They can
also improve farmer livelihood sources by availing market condition. They can also
improve farmer income by “offering better prices for their produce and lastly pooling
different resources to create economies of scale and hence improve farmers’ welfare”
(Abebaw & Haile, 2013). Gebremichael (2014) found that being a member of farmer-
controlled cooperative improves household’s welfare through improved “food
security especially for rural women, thus, suggesting that cooperative membership
helps households to diversify their livelihoods through extension access, improves
market bargaining power and promote opportunities for gender equity and equality.”
Studies provide evidence of “linkages between agriculture, health, food, and nutrition
confirming in a dynamic and multifaceted nature” (Gillespie, 2001). There are studies
that have pointed out the weaknesses of the impact evaluations; they argue that the
outcomes of the impact evaluations are not consistent with the agricultural growth
trends and that some of the studies are contradictory. Ayele et al., (2005) and IFPRI
33
(2008) reports a positive and significant effect of agricultural extension service on
smallholder farmer’s productivity in Ethiopia.
Another study conducted by EEA/EEPRI (2006) asserted that “the Ethiopian
extension programme suffers from various problems and its impact on farm income,
productivity, food security and poverty is not significant”, contradicting the study by
Ayele et al., (2005) and IFPRI (2008) which reported a “positive and significant
contribution of agricultural extension in Ethiopia”. Walker et al. (2004) study in
Mozambique reported a “negative and statistically insignificant impact of agricultural
extension on individual and household income. It reported that agricultural extension
services did not lead to any perceived improvement in the economic condition of
household. They postulated that the absence of positive and statistically significant
results on household and community variables could be due to limited access to
improved inputs and location-specific adapted technologies.”
The “importance of agricultural extension in relation to the fight against poverty has
been underscored in the Strategy to Revitalize Agriculture (SRA). A general 20
consensus exist that agricultural extension services, if properly designed and
implemented, improve agricultural productivity” (Rahaman, 1991 & Levinson,2001).
The “term „extension‟ is here understood to mean „advisory and other services‟ that
help rural families to make the best possible use of the productive resources at their
disposal” (Katz 2002). Agricultural extension services provide farmers with
“important information, such as patterns in crop prices, new seed varieties, crop
management, and marketing. Exposure to extension education services is intended to
increase farmers‟ ability to optimize the use of their resources. Further at times even
when technologies are available farmers do not access them. Many educators argue
34
that participation is the basis for grassroots development” Gboku & Lekoko (2007),
for example, emphasize that “sustainable development can only be ensured through
people’s participation”. Oakley (1991) identifies some of the “benefits of promoting
people‟s participation: to obtain information about needs, priorities and capabilities of
local people, to mobilize local resources, to improve utilization of facilities and
services, to obtain more reliable feedback, to build the capacity of local institutions.”
Involving maize farmers in training programmes is “vital for social change when they
start valuing the process of collective analysis. It is also important to enable maize
farmers to identify what types of change they wish to achieve and how to go about
attaining that change.” There are various degrees of “participation ranging from
simple consultation to self-management by maize farmers themselves. The specific
degree of participation of different stakeholders is determined through a negotiation.”
The World Bank Economic Analysis (2006) rejected the above conclusion reporting
that “extension services in Mozambique had positive effects on rural livelihoods
achieved through promotion of new varieties, inputs such as natural pesticides and
soil conservation practices”. These contradictions have led to “scepticisms of the
outcomes of evaluation studies conducted in sub-Saharan Africa. There are various
reasons for such contradictions and exaggerations in impact evaluation studies
conducted on agricultural extension programmes in the region” (Davis 2008). They
relate to “challenges and limitations that arise from the nature of impact evaluation,
extension science applied, the impact evaluation procedures” and competence of the
evaluators.
35
Farmers assess extension services based on availability, sufficiency, accessibility, and
timeliness; extension workers on the other hand “perceive communication skills to be
the primary competency that they require” (Lopokoiyit et al. 2012).
Furthermore, studies propose that “core competencies for extension professionals may
vary from place to place for the reason that competencies are contextual” (Suvedi and
Ghimire 2015). “Lack of political will and a dedicated bureaucracy prevent
enhancement of the capabilities of extension service providers including their
communication and innovation skills. Extension agents have limited motivation and
couple with lack of incentives to improve because current compensation schemes do
not reward performance, staff are rewarded at the same level.”
In addition, “staff morale is low because of such things as frequent transfer of
extension staff members from extension unit to farms or technical departments” (FAO
2010). Because the few field-level extension technicians must provide services to
many farmers, there is minimal access to extension technical services. For
strengthening the linkages, an innovation system could entrench “technological
change within a larger, more complex system of actions and interactions among
diverse actors, social and economic institutions, and organizational cultures and
practices. Such a system goes beyond the traditional linear thinking centred on
research systems” (World Bank 2006), “leading to an in-depth analysis of farmer-
oriented, integrated policy intervention in agricultural extension.”
The Kenya Integrated Household Budget Survey (KIHBS) 2015/16, reported 41% of
people living below the poverty level in the Uasin Gishu. As reported in the CIDP
2018-2022, “some of the root causes of poverty in the County include; limited
economic diversity with over dependency on subsistence agriculture, households
36
producing for their own food as well as incomes, limited opportunities for
employment, inadequate access to credit, disempowered groups especially women
and youths who have limited access to property and incomes as well as lack of
relevant skills amongst the youths to enable them to participate in the labour market”.
The County proposes to “promote agribusiness given the county has a high
agricultural potential sufficient to address the poverty problem; promotion of
horticulture as opposed to traditional cash crops; and promotion of value addition by
developing and supporting agro-processing initiatives and soliciting for both local and
international markets for local agricultural produce.”
2.5.1. The Influence of Agricultural Extension Services on Smallholder Food
Security
Agricultural knowledge is important in livelihood transformation for those “relying on
agriculture for a living and in enhancing food security” (Lwoga 2011). Agricultural
knowledge access is associated with “acquiring skills and techniques for enhancing
farming practices, sustaining the environment, and optimising production within a
given farm size. For this to happen, a strong linkage between agricultural research and
farmers is required. The linkage is through effective extension and various outreach
channels” (Nazari, Bin & Hassan, 2011). If “agricultural technologies and
developments are not accessible to farmers, transforming agriculture and farmers’
livelihoods remains impossible.”
There is growing worldwide interest in better “leveraging Agricultural Extension
Services (AES) as a foundation for food and nutrition security. Agricultural extension
is one of the effective tools in attaining the Sustainable Development Goals related to
end extreme poverty and hunger globally”. A review by de Graaff et al. (2010) of the
37
food security and agricultural trends in the past 40 years in Sub-Sahara Africa shows
“challenges in achieving food and that food aid will still be indispensable. Moreover,
the rural households in most developing countries remain disproportionally poor. As a
result, the primary goal of many of the developing countries remains producing
enough food” (de Graaff et al. 2011; Luan et al. 2013). The aim of extension services
is undisputed in its role to “increase agricultural production in the world where about
85% of the population depend on rain fed agriculture for their livelihoods.”
Smallholder farmers normally produce for both their own consumption and for the
market and may obtain half or more of their food from the marketplace (Remans,
Flynn et al. 2011). According to Chege et.al (2018), the major task of extension is
assisting “farmers to make their own decisions by increasing the number of choices
from which they can select, and by helping them to develop insight into the outcomes
of each option”. As well, it helps in promoting farm technologies by working closely
with the smallholder farming communities.
Despite the many years of extension services in countries, it is evident that not much
improvement in household food security has been achieved. The literature presented
here critically analyse the level of access to agricultural extension services and its
influence on food security. Traditionally, “agricultural extension is often implemented
through extension officers who visited individual farmers to provide advice on
specific topics” (Anderson and Feder, 2004). “Newer extension approaches often
operate through farmer groups, which can not only increase cost-effectiveness but
also facilitate mutual learning and sharing of experiences among farmers” (Fischer
and Qaim, 2012). Kipkurgat & Tuigong (2015), postulates that “extension is both a
political and an organizational instrument implemented to enable development
38
ranging from transfer of mono-crop technology to participatory problem-solving
educational approaches”. This aims at “ending poverty and enhancing smallholder
farming households’ involvement in the processes of achieving food security” (Rivera
and Qamar, 2003).
In Uganda, Pan et al. (2015) found that “adoption of agricultural extension services
that focused on improving the cultivation method increased agricultural production,
savings, and wage income. There are also many studies that investigate adoption
decisions of various agricultural technologies” (Abate et al. (2016), Abiy et al. (2017),
Beaman et al. (2015), Magrini et al. (2014), Teklewold et al. (2013). A study by Duflo
et al. (2011), stated that “involvement through skill development, increased the
opportunities for improving food security status, employment, and a rise in
community wealth and lastly, it gave farmers the opportunity to build the skills and
networks that were needed to address social marginalization.”
Tchale (2009) reported that “extension was one of the factors among several others
(farmer organisation, favourable commodity, and input costs) that would improve
efficiency of smallholder farmers”. On the other hand, Phiri et al. (2018) found that
farmers were aware of information sources and unlike in this study, predominant
source of information was a fellow farmer. This suggest that there is need to
strengthen both extension services and farmers to farmer interaction. Recent research
revealed that the “adoption of pro-nutrition technologies is higher in settings where
farmers have a good grasp of the technologies’ agronomic and nutritional attributes”
(de Brauw et al. 2018). This suggests that “training and extension could play a major
role in technology dissemination. Agricultural extension services have the obligation
to facilitate technology transfer and improve innovation processes in the farming

39
sector, but solid experience with pro-nutrition technologies hardly exists.” (de Brauw
et al., 2018).
Wossen et al. (2017) study in rural Nigeria on the impacts of “extension access and
cooperative membership on technology adoption and household welfare found a very
strong relationship between socio-economic and demographic characteristics of the
households.” The study further established that older households and those who are
more learned had a higher tendency of seeking extension access. Farm size had a
negative and statistically significant influence on the likelihood of receiving extension
services suggesting that the extension agents are more likely to target small holders.
Ragasa, Mazunda and Kadzamira (2016) studied the “impact of agricultural extension
services on Heavily Subsidized Input System in Malawi. They established that years
of education and age of the household head was statistically significant in explaining
access to agricultural extension services”. As well, male-headed household were more
likely to receive agricultural advice than those headed by female. Moreover,
household wealth index revealed it was a significant determinant of access to
agricultural extension services.
Despite differences in modalities and success across countries, extension has five
elements: “transferring knowledge from researchers to farmers; advising farmers in
making choices; educating farmers to make similar choices in future; enabling farmers
to make clear their own goals, competences and to achieve them; and stimulating
desirable agricultural developments with stimulation of desirable agricultural
development” (Purcell & Anderson, 1997). According to Anderson (2007), “adoption
of technologies and better practices is the core of extension interventions, a valuable
tool for improving productivity and increasing farmers’ incomes.”
40
Target farmers in extension just need to pass through awareness, knowledge, and
adoption of technology to achieve goals of improving productivity. Therefore, various
extension methods are used such as extension farmer contact, meetings, mass media,
and farm demonstrations, among others. Furthermore, farmers pass technologies,
knowledge, and practices through their informal networks.
Thus, agricultural extension is “both a system and the set of functions that stimulates
voluntary change among rural people”. The set of roles include “transferring
technology and capacity to educate, build human resources, and enhance local
capacity, for example in integrated pest management, market intelligence, farm
management, and in negotiating financial, input, and market services whereas a
system includes all public and private institutions that transfer, mobilize, and educate
rural people” (Zijp,1998). Experience shows that a “major impediment for more
widespread coverage include the high personnel and logistics costs of reaching out to
farm households in rural areas for nutrition and health education campaigns” (Ruel,
Quisumbing and Balagamwala, 2018).
In Kenya, although farmers favor “public extension service system, the service
providers select the well-endowed households, a trend that is being observed also with
the private for-profit service providers” (Tegemeo Institute 2018). This is a bigger
risk seeing that smallholder farmers produce about 60% of the required food in the
country and thus should be the key beneficiaries of the extension service. The army
worm’s invasion led to major losses, Tegemeo Institute has reported that “lack of
extension information services to control armyworms and post-harvest losses could
have costed Kenya an approximate of 10 million bags of maize worth 32 billion in
2018.”
41
These losses would have considerably been reduced through availability and use of
agricultural information by farmers minimizing the food loss and hence food
insecurity susceptibility. Studies have shown that “levels of returns to extension and
research are as high as 80%, therefore, strengthening and supporting agricultural
extension at the local level would foster an enabling environment for innovation and
entrepreneurialism and empower local farmers to lead in solving their own problems.”
A strong case therefore exists for greater support to extension, which can provide the
“last mile” support technologies, and better practices for reach and adoption by
potential users.
Other benefits of agricultural extension include contribution to social cohesion and
governance through emphasis on solving community-level problems, “participatory
learning, group dynamics and advocacy to support broader efforts that promote
democracy and decentralization. It is a key social service often provided to the rural
poor as a “public good” and a commitment by the government to support rural
development. Furthermore, through extension services the women and youth can
access technologies and information with potentially life-changing opportunities,
promoting equity in development.”
The national government allocation to agriculture has been low, though they have
steadily been rising from 1.2% in 2014/15 to 1.6% in 2015/16 to 1.8% in 2016/17 and
finally 2.3% in 2017/18. The total allocation is still below the 10% that the
government committed itself to allocate under the Malabo declaration, with an
average of 6% of the budget allocated to agriculture. This trend in financing has seen
most County governments collectively fund 10% of the priorities identified in the
CIDPs in the agricultural sector. The low budgetary allocation to the sector has made
42
it difficult to support the enhancement of technical competency among the staff;
improve their communication and group facilitation skills as well as extension
management, as such, the sector continues to stagnate.
Farmers have persistently reported low interactions with agricultural extension
services in the country. A study by Tegemeo Institute of Egerton University shows
that “a relatively 21% of farmers accessed agricultural information in Kenya in 2014.
During the same period, the number of extension staff in public and private service
was 5000 and 1000, respectively”. At the time of devolution, “the ratio of extension
service providers to farmers was 1:1000 against the expected optimal ratio of 1:400
for better services” (GoK, 2012) Therefore, it is important to improve planning and
budget allocation for the agricultural sector, especially at the County where majority
of the functions are nested. Improving planning for the sector will result in projects
that are realistic and respond to the localized needs of farmers in respective regions.
This then forms a strong background for resource allocation. The national government
allocation to agriculture has been low, though they have steadily been rising from
1.2% in 2014/15 to 1.6% in 2015/16 to 1.8% in 2016/17 and finally 2.3% in 2017/18.
The total allocation is still below the 10% that the government committed itself to
allocate under the Malabo declaration, with an average of 6% of the budget allocated
to agriculture. This trend in financing has seen most County governments collectively
fund 10% of the priorities identified in the CIDPs in the agricultural sector.
Agriculture in developing countries is dominated by women either as farm owners or
managers, farm partners, unpaid family workers or as agricultural wage labourers.
Despite their critical role, they are “virtually ignored by agricultural extension
services. When women attend receive extension agents or attend extension training,
they are frequently taught home economics and other subjects unrelated to their
43
agricultural roles”. In jointly managed farms, women rarely receive agricultural
information from their husbands or other male household members more so if the
work on specific crops or tasks are divided by sex.
Women limited access to extension services is related to the orientation and structure
of institutions providing agricultural extension services, the kind of services provided,
the types of delivery programmes utilized, the staffing of the institutions. When
extensionists do contact women, “it is often to provide information and advice that
pertains to women's household, rather than farming, responsibilities. Some Ministries
of Agriculture have separate extension units for women that are devoted to home
economics, which generally touch on agricultural matters only insofar as they relate to
nutrition and family welfare” (Beeyi et al., 2018). Other governments provide this
type of extension service “for women within a separate agency or ministry, such as a
Ministry of Social Welfare. In farmer training centres, instruction for women has also
oriented toward home economics” (Beevi et al,. 2018). This approach “offers little
hope for including women in the expanding commercialization of food production
that is taking place as Third World countries develop. These factors are influenced by
the characteristics of the women farmers” (Kabunga, Dubois & Qaim, 2012).
2.6. Theoretical Review
The following section reviews some applicable theories to the study. This section
explores agricultural extension theory, human development approaches, theory of
behavioural change, socio-cultural theories of learning, farmer decision making
processes, knowledge transfer theory and the cooperative decision-making approach.
44
2.6.1 Agricultural Extension Theory
Agricultural extension theory evolved in line with the ‘enlightenment’ and thinking
concerns in the 1950 to 1970 period with the ‘adoption and diffusion’ of science-
based innovations. During this period, extension scientists developed an interest in
technology adoption decisions. According to Adams (1984), “agricultural extension is
the assistance given to farmers to help them identify and analyse their production
problems and become aware of the opportunities for improvement.” The Agricultural
extension theory draws its main lessons from social knowledge and consulting of
farmers and educating them on rationale of farming.
Agricultural extension has emphasized that extension is a premeditated, planned,
programmed, systematically designed, goal-directed, and purposeful activity. It is an
intervention in agricultural production. Roling (1998) explains that “extension science
evolved from rural sociology and over time, it has become more and more aligned
with social psychology. Traditionally, it was assumed all farmers would eventually
see the benefit of innovations and adopt them”. Success was measured on the level of
technology adoption. The assumption was that information on the innovation
communicated through farmer’s social networks would increase adoption rates.
Another assumption was that “if agricultural producers are to make sound decisions
about future production strategies, they need information on current and new
technology, and its performance in real farm settings. More often, some farmers have
taken up new ideas for which there is little economic justification” and a few farmers
lack access to business management advice, and information on markets and market
opportunities.
45
Briefly, extension theory is very critical in understanding the contextual factors of the
adoption process and insights into the communication aspects to influence adoption
decision-making by farmers. This study centres on finding out current extension
services approaches, understanding farmer’s experiences and perceptions. This helps
in modelling ideas and lessons that are better embraced by farmers hence changing
their behaviours and to farming practices.
2.6.2 Knowledge Transfer Theory
Extension service largely coordinated by the Ministry of Agriculture, dominates the
current way of agricultural knowledge diffusion in Sub Saharan Africa (SSA).
Extension service is a “channel between the research community and the farmers”
(Marsh, Pannell & Lindner, 2000). Extension service “plays a significant role in
introducing new ideas and innovations to the farmer during initial stages of adoption.
Over the years, different approaches, frameworks, and models have explained and
guided activities around knowledge diffusion in agricultural practices” (Davis, 2008).
“The kind of interactions and communication channels employed are equally diverse
and include demonstrations, farmer field schools, mentoring, one-on-one meetings,
community radio, training, and visits” (Manning, 2013). Among the above, face-to-
face interactions are significant modes of knowledge exchange. Extension models
assume that innovations (and knowledge) originate in science and transferred to
farmers for adoption.
This transfer is expected to follow a linear and sequential ‘one-way’ path (Black,
2000). Within this viewpoint, “early empirical approaches sought to determine
patterns or predictive factors in the way decisions are made based on farmer socio-
economic factors, and provision of information” (Ilbery, 1978). Farmers were
46
“categorized as ‘laggards’ or ‘innovators’ according to how readily they adopted
innovations” (Rogers, 1986). Besides, “farmer-to-farmer extension work was
regarded as beneficial because both parties communicate in the same language and the
interaction would be relevant and in-context that ensures availability, accountability,
and credibility”.
However, knowledge diffusion in agriculture is not always about the “transfer of
scientific knowledge from research community to farmers as end users. Over
generations, farmers accumulate varied practices and ideas that become part of their
indigenous knowledge stock. Indigenous knowledge (IK) is the primary resource and
social capital that shapes how local farmers engage with the natural environment and
develop problem-solving strategies” (Lwoga, Ngulube, & Stilwell, 2011).
As significant as it is, “IK is generally internal, tacit, unsystematic, and derived from
local experiences” (Lwoga, Ngulube, & Stilwell, 2011). Often compared with local
knowledge, the definition of IK comprises all forms of knowledge, “Including
technologies, know-how skills, practices and beliefs that enable the community to
achieve stable livelihoods in their environment” (Manning, 2013). In view of these, it
is apparent to postulate that any knowledge diffusion activity “needs to start with the
community’s knowledge base, assessment of what is and is not working, build on the
best practices, and improve on the ones that will not yield desired results” (Johnson &
Segura-Bonilla, 2001).
The goal of knowledge diffusion is to “create a successful environment where end
users benefit from the research findings by adopting new ideas and practices in a
timely manner. In this regard, learning is an integral part of the end-users embracing
innovation and knowledge” (Ghadim, Pannell, Burton, 2005). According to Rogers
47
(1995), “the rate of adoption, the speed with which latest ideas and innovation are
embraced by individuals and groups, is predicated by five factors relative advantage,
compatibility, level of complexity, trial-ability, and observability.”
Knowledge transfer was the dominant paradigm (Rogers, 1986) and “captured the
concerns of the so-called ‘productivity’ era of the 1970s and 1980s, in describing the
translation of science to encourage and promote efficient production. However, it has
since been found limiting” (Buttel, 2001). Criticisms can be grouped under three main
concerns: “firstly, that the approach is no longer appropriate for modern multi-
functional agriculture; secondly, that it does not reflect the empirical evidence of how
farmers use information; and finally, that it takes no account of other influences upon
the uptake of information and advice. The uni-linear approach also fails to represent
the many different sources from which knowledge is generated” (Chambers et al.,
1989; Ruttan, 1996; Roling & Wagemakers, 2000).
A knowledge diffusion framework to be introduced or research activity that “takes
place to improve existing agricultural practices need to factor-in the existing local
knowledge base, often referred to as indigenous knowledge. If any of the research
findings are to trickle down to the frontline in the farm field in a timely and usable
manner, much work needs to be done to package, re-package, and synthesize the
knowledge into context-rich processes, procedures, and guidelines that can readily be
used and acted upon by farmers” (Chambers et al., 1989). The use of this theory in the
study assists in understanding the approach used in the delivery of extension service,
how farmers have contributed to the selection of the delivery method and their
perception of effectiveness of these approaches.
48
2.6.3 Theory of Behaviour Change
The theory of behaviour change and agricultural extension share similar goal of
bringing about change. In agriculture, “behaviour change is usually associated with
the adoption of an innovation (a change in farming practice” According to Thompson
(2009), “the main purpose of the extension service has been to change human
behaviour by teaching people how to apply the results of scientific research”. He
postulates therefore that “all extension workers are change agents-professional
persons- who attempt to influence adoption decisions in a direction they feel
desirable.” (Thompson, 2009)
Studies into behavioral change in agricultural have focused on “attitudinal theories
such as the Theory of Reasoned Action (TRA) (Fishbein & Ajzen, 1975) which was
later superseded by the Theory of Planned Behaviors, (TPB),” (Ajzen & Madden,
1986). The focus of these models is more on predicting behavior than on how to
influence behavior. The other group of ‘persuasion theories’ “deals with the issue of
how behavior can be altered by changing the beliefs underlying attitudes” (Petty et al.,
1992) This can be useful for “exploring empirical observations, for example, why
trusted sources of information are more likely to induce positive behavioral change on
farms than non-trusted sources.” ( Petty et al., 1992).
“Influential paradigms of persuasion are so-called” “dual-process models” (Crano &
Prislin, 2006) and arguably the “most widely accepted of these is the Elaboration
Likelihood Model (ELM)” (Petty & Cacioppo, 1986). These models contend that
“there are two pathways to changing people’s attitudes. If receivers are able and
motivated, they will systematically examine persuasive messages and if the message

49
is well reasoned, data based and logical it will succeed”. This will produce long-term
attitude change and is more likely to result in behavioral change.
Within this theory is the attribute of the source (source characteristics, type of
institution or organization, approach used) and message (message characteristics), in
concert with motivation and ability to process information (recipient characteristics
such as age, gender, level of education among others which may influence the uptake
of message), that combine to determine whether change is induced.
The ELM further suggests that “these factors can work by different processes in
different situations, and that the process employed (whether central or peripheral) is
critical in terms of understanding the consequences of the new attitude” (Petty et al.,
1992).
One recurring theme from the reviewed literature is the importance of contact from a
trusted source for achieving behavioural change. In general, higher source of
credibility results in higher persuasion in changing behaviour. However, “if the
message is low quality, using a high-quality source is unlikely to aid the take up of the
message. High credibility sources are particularly important when messages are
complex, there is little available experience, and/or a message carries a high personal
risk” (O’Keefe, 2002). O’Keefe (2002) states that “two broad dimensions have
emerged in the source literature namely: ‘expertise’ and ‘trustworthiness’.”
As (a) “experience and occupation are key factors that convince people of the
reliability of the source and (b) people are both more open minded to and more
inclined to process in-group messages, the use of people from farming backgrounds or
trusted networks (local if possible) is likely to enhance message uptake. There are
50
many other source factors, for example liking, similarity and physical attractiveness
which may all contribute to the extent to which the source is able to get the message
across. However, their influence is complex and often contradictory” (O’Keefe,
2002).
In this case, the perception is that the smallholder farmer has on the extension agent
and the choice of delivery method used by the extension service officer determines
the adoption of agricultural technology or extension package.
2.6.4 Human Development Approaches
Criticisms of knowledge transfer have led to “formulations of alternative ‘human
development’ approaches which are based on the principles of participation,
empowerment and ownership of the problem” (Buttel et al., 1990; Vanclay &
Lawrence, 1994; Black, 2000; Russell & Ison, 2000). These approaches also tend to
“give validity to non-expert forms of knowledge and view the extension process as
one of learning rather than passive knowledge utilization.”
This view has underpinned the “development of ‘farmer-first’ ideology and
participatory methods of extension” championed by Chambers et al., (1989).
Constructionist perspectives are considered “more suited to conceptualizing the
exchange of knowledge within these approaches, particularly in the context of
sustainable agriculture” (Morgan & Murdoch, 2000). “The wide range of models and
methodologies used in the field has been reviewed extensively” (Robinson, 2006).
“Human development models recognize the significance of social interaction and
understanding group perspective.”
51
“Communication within a social system or a group is regarded as an important
process in articulating, sharing and exchanging ideas among farmers” (Wilson, 2004).
Theories drawn from knowledge networking (Sobels et al., 2001); social networking,
social movements; social learning (Woodhill & Roling 2000); experiential learning
(Roling & Wagemaker, 2000); social capital, (Kilpatrick 2002) and systems research
(Blackmore, 2002) “underpinned much of the research undertaken which seeks to
understand collective behavior.”
The role of “extension in facilitating collective processes is seen to be critical”
(Roling & Wagemakers, 2000). “The complexity of modern agriculture suggests that
no single model or strategy for influencing positive behaviour is likely to be
sufficient. Whilst the value of human development approaches is recognized, there is
still needed to draw on traditional extension models to achieve policy objectives and
farmers access to reliable scientific information. Therefore, there is a need to manage
the tension between persuasive extension and facilitative advice” (Garforth et al.,
2003). In recognition of these considerations “some approaches have attempted to
combine different strategies” (Greer & Greer, 1996).
“Top-down technology transfer and bottom-up human development approaches are
two ends of a spectrum”; however, “the territory in-between probably provides the
most opportunities and flexibility for future extension approaches if well applied”
(Black, 2000). As such, a “number of doubts and misgivings have emerged over time
regarding the capability approach employed in human development approaches and
this has also caused a renewed soul-searching over the conceptual foundations of
human development.”
52
2.6.5 Farmer Decision making Processes
The Interstate Managerial Study by Johnson et al., (1961) is “one of the few studies of
how farmers make decisions. Most research and teaching have been in how farmers
should make decisions.” Orasanu and Connolly (1993) claim that “most research on
decision making has focused on the decision event, not the process. While the
decision event is critical to good decisions, it is limited in scope. Focusing on the
event requires: assuming the decision maker knows his or her goals, purposes, or
values.”
The decisions must be “clear and stable over time; and the decision maker faces a
fixed set of alternatives for which the consequences (including risks) of each
alternative are known. Normatively-trained, farm management students usually
exhibit a strong tendency to think of the decision process as a series of linear steps.
Johnson et al., (1961) identifies six steps of decision making: problem definition,
observation, analysis, decision, action and responsibility bearing.” Simon (1965)
describes the decision process as a “trichotomy: intelligence, design, and choice.”
Mintzberg et al., (1976) initially described a similar trichotomy: “identification,
development, and selection and then developed a list of 12 routines within the
strategic decision process: decision recognition, diagnosis, search, design, screen,
evaluation--choice, authorization, decision control, decision communication and
political.” Correspondingly, there are few research done to understand the processes
of family decision-making. “Research has focused on the single farmer as the
decision-maker” (Flett et al., 2004).

53
However, emerging evidence suggests “the concept of the principal decision-maker
does not hold true and other family members are also involved in the decision-making
process.”
This particularly “happens on large farms (to varying degrees)” (Errington, 1986;
Marsden, 1984; Marsden et al., (1989), “but the process and its implications for policy
and targeting messages are not well-understood. Based on the research just cited,
farmers should obviously not be expected to follow a common set of steps in any
simple, sequential process.”
However, perhaps because of limited human processing capability, we find it useful to
identify the separate functions (but not steps) of decision making. Mintzberg et al.,
(1976) describes decision making as “a groping, cyclical process. They did not find a
linear process, nor did all of their studied decisions include every one of the 12 basic
routines mentioned earlier. They identified six factors that can create havoc with any
idea of a straight, simple decision process: interrupt; scheduling delays, timing delays
and speedups, feedback delays, comprehension cycles, and failure recycles.”
2.6.6 Co-operative Decision-Making Approach
Institutions can influence (particularly collective) decision-making behavior. A wide
range of factors has been found to enhance the success of collective action
institutions, including “sharing and minimizing costs; harmonizing multiple
objectives; sharing knowledge; sharing and mobilizing resources; increasing
credibility of actions and objectives; allowing flexible, locally relevant responses;
and, building capacity to cope with future changes” (Cline & Collins, 2003; Mills et
al., 2006).
54
Many decision problems involve “multiple decision makers with multiple goals.
Goals can be divided into two types, goals that are mutual for all the decision makers
and goals that are different and require cooperation of multiple decision makers to
achieve a consensus. A cooperative decision making requires free communication
among decision makers. The participants in a decision-making process must pool their
efforts together. They must also work towards a common goal, and they have to
integrate multiple points of view which may not necessarily be compatible. They have
to work together, although not necessarily in the same place or at the same time” They
are committed to a “coordination effort in order to solve the problem, where they have
to divide the task of making the decision into different sub-tasks which will be
assigned to individual contributors.”
Several authors have defined cooperation on several points of view. Schmidt et al.,
(1992) “propose to use the definition of cooperative work as a starting point. They
characterize cooperative work as people working together, who are mutually
dependent for their work and who: support one another in the performance of their
respective tasks.” This definition is given from the viewpoint of an outside observer
of the whole system.
Also, “cooperation can be defined from the point of view of each agent involved in
the general process”. According to de Terssac et al., (1996), “cooperation is the way
of overcoming individual limitations. Cooperation can also be defined as the set of
collective actions finalized and developed to deal with individual limitations. Based
on this cooperative paradigm several associated concepts must be defined as
coordination and collaboration. Cooperation is richer than collaboration in the sense
that a mutual support is generated among the stakeholders.” Coordination is the
55
“management of dependences involved in all collaboration or cooperation processes”
(Zarate, 2013).
There has also been some criticism on the effectiveness of cooperative decision-
making processes. Cooperative decision making normally employ democratic
decision-making processes which it can prove inefficient when conditions call for fast
responses. On the same note, “cooperatives can suffer from ineffective leadership that
stems from a variety of sources” (Zarate, 2013). Either members or management may
lack sufficient or correct business knowledge to assess what the cooperative decision-
making process can realistically be accomplished through agricultural extension.
Cooperative decision-making process also often faces a talent deficit. Like any new
business, “a cooperative decision-making process may need a strong entrepreneurial
personality to get the ball moving, but the limited material returns may function as a
barrier to entrepreneurially minded smallholder farmers.”
2.7. Conceptual framework
Guided by the above literature and theoretical reviews, small holder household food
security depends on increase in farm productivity achieved through utilization of
knowledge and information passed by the agricultural extension service and other
indigenous knowledge by the smallholder household. The utilization of knowledge
from extension depends on the availability and accessibility of the extension service.
The utilization of the extension information will depend on the characteristics of the
agricultural system, the extension techniques used, the content/messages delivery
methods, targeting, timeliness and relevance to the farmers, among others. At the
farmers level utilization will depend on the household socio-economic and farm
characteristics such as age, education level, gender, land size and years of farming

56
experience plus household social capital/farmers (intermediate variables). This
concept is illustrated in Figure 1 below showing the interrelationship between various
factors and the linkage to the household food security.
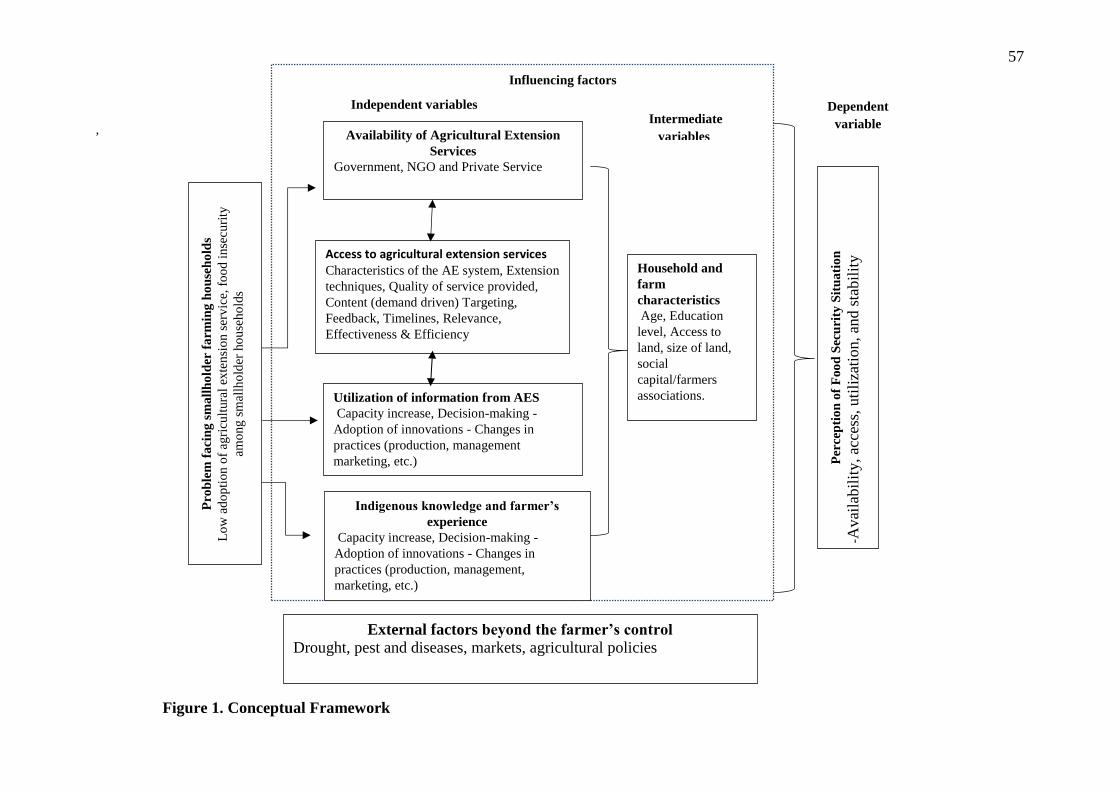
57
,
Independent variables Intermediate
variables
Dependent
variable
Figure 1. Conceptual Framework
Indigenous knowledge and farmer’s
experience
Capacity increase, Decision-making -
Adoption of innovations - Changes in
practices (production, management,
marketing, etc.)
Influencing factors
External factors beyond the farmer’s control
Drought, pest and diseases, markets, agricultural policies
Per
cep
tio
n o
f F
oo
d S
ecu
rity
Sit
ua
tio
n
-Avai
labil
ity,
acce
ss, uti
liza
tion, an
d s
tabil
ity
Availability of Agricultural Extension
Services
Government, NGO and Private Service
Household and
farm
characteristics
Age, Education
level, Access to
land, size of land,
social
capital/farmers
associations.
Access to agricultural extension services Characteristics of the AE system, Extension
techniques, Quality of service provided,
Content (demand driven) Targeting,
Feedback, Timelines, Relevance,
Effectiveness & Efficiency
Utilization of information from AES
Capacity increase, Decision-making -
Adoption of innovations - Changes in
practices (production, management
marketing, etc.)
Pro
ble
m f
aci
ng
sm
all
ho
lder
fa
rmin
g h
ou
seh
old
s
Lo
w a
do
pti
on
of
agri
cult
ura
l ex
ten
sio
n s
erv
ice,
fo
od i
nse
curi
ty
amo
ng
sm
allh
old
er h
ou
seh
old
s
58
2.8. Knowledge Gaps
When properly guided and invested on, smallholder agriculture is critical in fostering
food security and sustainable incomes. Smallholder farmers produce eighty percent of
the food consumed in Asia and Sub-Sahara Africa (FAO, 2017). However,
international investments in agricultural development and policy have lagged
compared to other sectors particularly in empowering smallholder farmers through
agricultural extension (Biodiversity et al. 2012).
Marginalization of smallholder farmers continue in terms of accessibility to resources,
information, technology, capital, and assets as much as there are regular government
budget allocations for agricultural development particularly in Kenya, (Murphy,
2010). Further, smallholder farmer’s farms are becoming infertile and plots sizes are
decreasing (De Schutter, 2011). The “top-down agricultural extension systems have
failed to nurture agricultural growth” (Rivera, 2001). Evidence has shown that
“expansion of smallholder farming can lead to a faster poverty alleviation through
raising the incomes of rural farmers and reduction in food expenditure hence leading
to a faster rate of poverty reduction” (FAO 2017, World Bank, 2008).
The productivity of smallholder agriculture and its contribution to the economy, food
security and poverty reduction depend on a supportive agricultural sector, which
include effective extension service. However, with limited budgetary allocation
agricultural extension services has been left to thrive on demand. This has left many
smallholder farmers unattended or unexposed to new farming technologies.
Moreover, ineffective agricultural extension services have limited technology
adoption by smallholder farmers. The government has not prioritized agricultural
extension provision, which has a big bearing on technology adoption. “Adoption of
59
technologies and better practices being central in extension interventions are valuable
for improving productivity and increasing farmers’ incomes” (Anderson, 2007). There
are no studies yet showing the link between extension approaches and food security in
Uasin Gishu County and therefore, it is not only unclear whether agricultural
extension approaches are effective, but also whether they are contributing to food
security among smallholder farming households, hence this study objectives.
60
CHAPTER THREE
RESEARCH METHODOLOGY
3.1. Introduction
This chapter provides a description of the methods applied in carrying out the
research study. They included: research design, study site and target population,
sample size and sampling technique, research instruments, data collection procedures,
data management and analysis and ethical considerations.
3.2 Description of the Study Site
The study was conducted in Uasin Gishu County. This County was selected
purposively as it is one of the high agricultural potential Counties in Kenya. “The
County sits between longitudes 34o
50’ East and 35o 37’ West and latitudes 0
o 03’
South and 0o
55’ North. It borders Trans Nzoia County to the North, Elgeyo
Marakwet County to the East, Baringo County to the Southeast, Kericho County to
the South, Nandi County to the Southwest and Kakamega County to the Northwest.
The County covers an area of 3,345.2 Sq. Km within the Lake Victoria catchment
zone and all its rivers” (Sosiani, Kipkaren, Kerita, Nderugut, Daragwa, and Sambu)
draining into Lake Victoria. The County’s climate is favorable for agriculture, has a
small number of tourist attractions and home to a large and growing urban population.
Eldoret is the administrative and commercial centre of the County. The County
consists of six Sub-Counties. Turbo, Soy, Ainabkoi, Moiben, Kesses and Kapseret.
There are 30 electoral Wards. Soy Constituency with the highest number of Wards at
seven wards, Turbo six, Moiben and Kapseret have five each, Kesses has four and
lastly three wards in Ainabkoi, this is summarised in the table below.
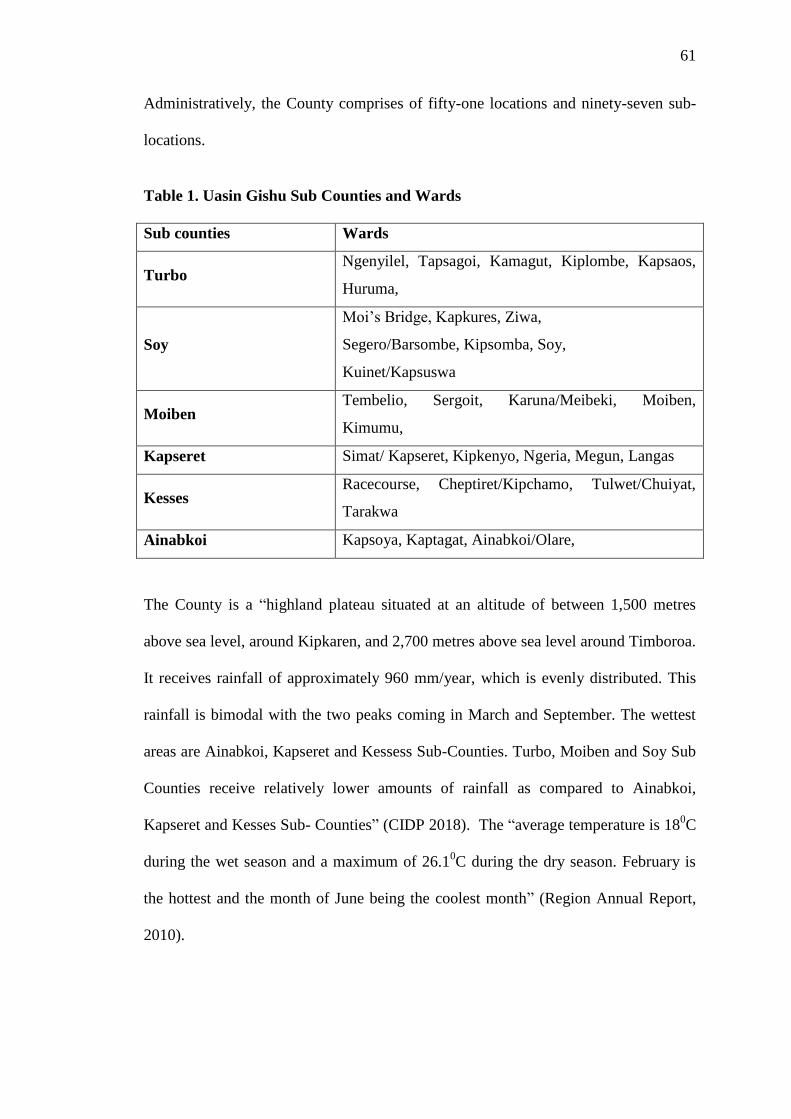
61
Administratively, the County comprises of fifty-one locations and ninety-seven sub-
locations.
Table 1. Uasin Gishu Sub Counties and Wards
Sub counties Wards
Turbo Ngenyilel, Tapsagoi, Kamagut, Kiplombe, Kapsaos,
Huruma,
Soy
Moi’s Bridge, Kapkures, Ziwa,
Segero/Barsombe, Kipsomba, Soy,
Kuinet/Kapsuswa
Moiben Tembelio, Sergoit, Karuna/Meibeki, Moiben,
Kimumu,
Kapseret Simat/ Kapseret, Kipkenyo, Ngeria, Megun, Langas
Kesses Racecourse, Cheptiret/Kipchamo, Tulwet/Chuiyat,
Tarakwa
Ainabkoi Kapsoya, Kaptagat, Ainabkoi/Olare,
The County is a “highland plateau situated at an altitude of between 1,500 metres
above sea level, around Kipkaren, and 2,700 metres above sea level around Timboroa.
It receives rainfall of approximately 960 mm/year, which is evenly distributed. This
rainfall is bimodal with the two peaks coming in March and September. The wettest
areas are Ainabkoi, Kapseret and Kessess Sub-Counties. Turbo, Moiben and Soy Sub
Counties receive relatively lower amounts of rainfall as compared to Ainabkoi,
Kapseret and Kesses Sub- Counties” (CIDP 2018). The “average temperature is 180C
during the wet season and a maximum of 26.10C during the dry season. February is
the hottest and the month of June being the coolest month” (Region Annual Report,
2010).
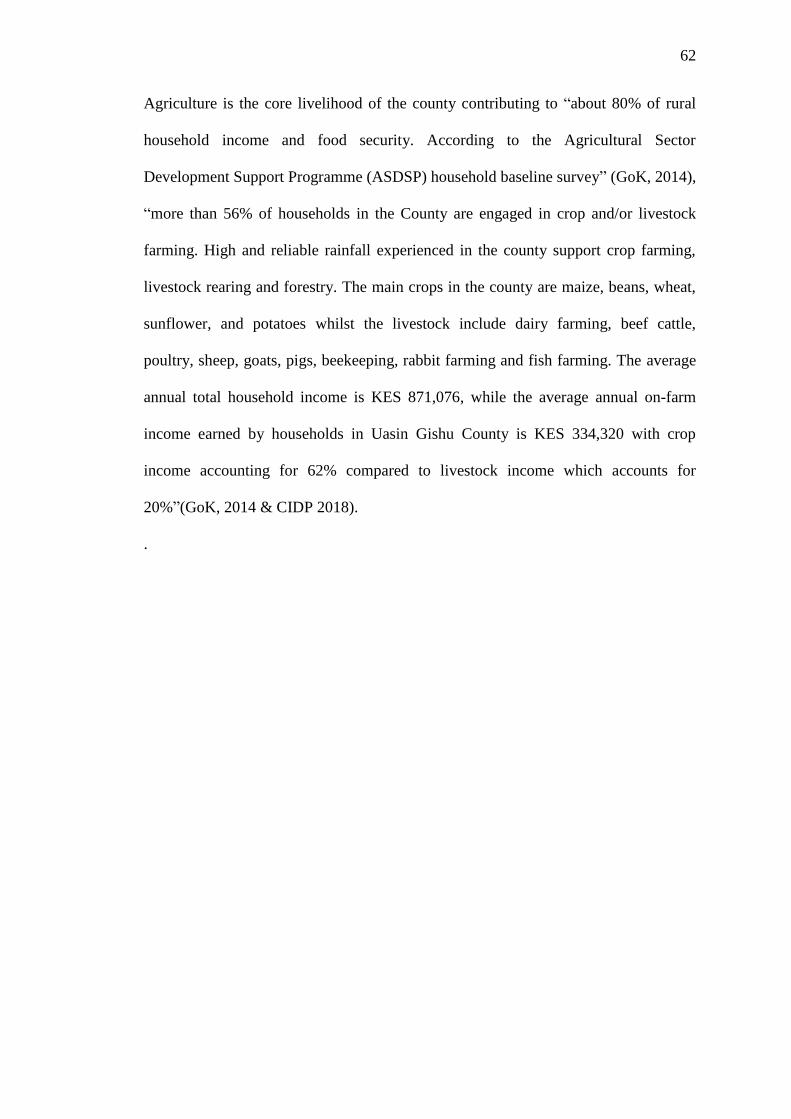
62
Agriculture is the core livelihood of the county contributing to “about 80% of rural
household income and food security. According to the Agricultural Sector
Development Support Programme (ASDSP) household baseline survey” (GoK, 2014),
“more than 56% of households in the County are engaged in crop and/or livestock
farming. High and reliable rainfall experienced in the county support crop farming,
livestock rearing and forestry. The main crops in the county are maize, beans, wheat,
sunflower, and potatoes whilst the livestock include dairy farming, beef cattle,
poultry, sheep, goats, pigs, beekeeping, rabbit farming and fish farming. The average
annual total household income is KES 871,076, while the average annual on-farm
income earned by households in Uasin Gishu County is KES 334,320 with crop
income accounting for 62% compared to livestock income which accounts for
20%”(GoK, 2014 & CIDP 2018).
.
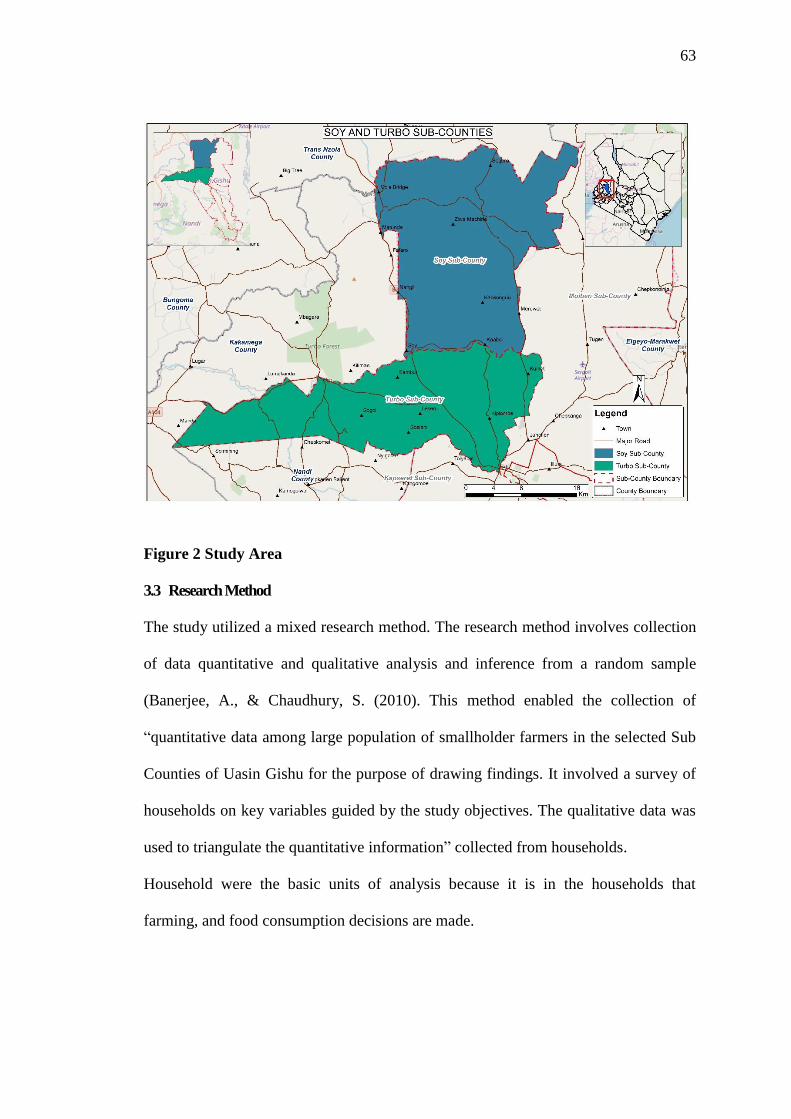
63
Figure 2 Study Area
3.3 Research Method
The study utilized a mixed research method. The research method involves collection
of data quantitative and qualitative analysis and inference from a random sample
(Banerjee, A., & Chaudhury, S. (2010). This method enabled the collection of
“quantitative data among large population of smallholder farmers in the selected Sub
Counties of Uasin Gishu for the purpose of drawing findings. It involved a survey of
households on key variables guided by the study objectives. The qualitative data was
used to triangulate the quantitative information” collected from households.
Household were the basic units of analysis because it is in the households that
farming, and food consumption decisions are made.

64
3.4 The Target Population
“The target population describes the particular group relevant to the study. The target
population of this study were 101,409 smallholder-farming households, a list of which
was provided by the County Government of Uasin Gishu Department of Agriculture”.
Due to funding limitations, two Sub Counties were selected purposively, these are
Soy and Turbo. The two Sub Counties had 30,018 number of smallholder farming
households.
3.5 Sample Size and Sampling Technique
For this study, “multistage purposive and simple random sampling were employed. In
the first stage, Uasin Gishu County, commonly referred as Kenya grain basket was
selected purposively based on it being an agricultural County with presence of
smallholder farmer. The second stage involved purposive selection of Turbo and Soy
Sub-County informed by the budgetary limitation and the characteristics of these sub-
counties having a relatively high concentration of smallholder farmers with smaller
land holdings”. The third stage involved “purposive selection of wards, namely:
Sugoi, Kaptebee and Ngenyilel in Turbo Sub County and Soy, Kipsomba and
Barsombe in Soy Sub County. The wards have a cumulative smallholder household
population of 30,018,” as reported in the County Development Plan of 2018. The
sampling process is summarised in the flow chart, Figure 3. Below
65
Figure 3. Multistage Sampling Flow Chart
A random sample of “397 households were interviewed, 201 from Turbo and 196
from Soy sub-County. This sample was determined using the Cochran’s formula.
Cochran’s formula allows the calculations of an ideal size given a desired level of
precision, desired confidence level and the estimated proportion of the attribute
present in the population. It is considered especially appropriate in situations of large
population” (Al-Hemyari (2018). The formula is as shown below.
Where:
“e is the desired level of precision (i.e. the margin of error- 5%)
p is the (estimated) proportion of the population which has the attribute in
question (50%)
q is 1 – p.”
First Stage Purposive sampling
• Uasin Gishu County being a gain basket of Kenya with concentration of small-holding households
Sub County Selection
• Purposive sampling: Soy and Turbo Sub Counties selected because of the high concentration of small holder farmers
Ward Selection
• Purposve sampling: Sugoi, Kaptebee and Ngenyilel Wards in Turbo, Soy, Kipsomba and Barsombe in Soy Sub county becuase of the relatively high concentration of small holder farmer
Household selection
Simple random sample of
smallholder farming
households- 201 in Turbo
and 196
66
Using the confidence level of 95%
𝑛0 =(1.96∗1.96)(0.5∗0.5)
0.05∗0.05= 385
.
The sample size was increased by a factor of 5 %, to cater for any missing data. A
random sample of 402 households were selected randomly out of which 397
respondent households’ questionnaires were returned complete for use in data
analysis.
3.6 Data Collection Procedure and Instruments
3.6.1 Type of Data
This study utilized “both primary and secondary data. Primary data was collected
using questionnaires and key informant interviews.” While secondary date was sought
from literature.
3.6.2 Research Instruments
The study used a “semi-structured questionnaire” to collect data from the sampled
smallholder farming households. (Appendix II). The questionnaire was designed to
include both structured and structured questions.
The questionnaire was subdivided into seven sections. The first section targeted
information on household demographics characteristics, size of land and years of
farmers farming experience. Section II and III covered the first and second objective
which sought to determine and assess the availability and the level of access of
agricultural extension services by smallholder farmers. Section IV focused on
providing information on objective three that sought information on utilization of
agricultural extension services.
67
Section V and VI assessed food security status of smallholder households in Uasin
Gishu County. The “questionnaire was organized into closed and open-ended
questions.” Likert scales was used to “obtain information on respondent household’s
perceptions on various areas of the study interests such as availability, accessibility,
utilization of agricultural extension services and state of household food security in
the respondent households.”
3.6.3 Key Informants Interview
There was a total of six main informants for the interview including “four ward
administrators and two Sub County Agricultural officers.” They offered information
about the availability of extension services, how accessible they are, some of the
farming practices and the status of food security in the specific areas. This
information would help in triangulating the data collected from the smallholder
farming households.
3.7 Data Collection Method
“Trained research assistants administered the questionnaire using the Computer
Assisted Personal Interviewing (CAPI) method”whereby data collected data for this
study was “aggregated in the survey platform on Open Data Kit (ODK). CAPI had
various advantages including shorter turnaround time as it integrated data collection,
data entry, editing coding and cleaning into a single process”. In addition, it improved
data quality and reduced the researcher’s strain.
Interviews were conducted to using interview guides in face-to-face meetings with the
key informants.
68
3.8 Data Analysis and Presentation
Data analysis was conducted using “Statistical Package for Social Sciences (SPSS
version 23)”. Both “quantitative and qualitative approaches were used in descriptive
and inferential statistics in data analysis. For the presentation of socio-economic
features and agricultural activities, percentages and frequency came in handy. The
descriptive measures are mainly from data on respondent household characteristics
such as age, gender, and education level, among others.” In order to examine the
nature and strength of how independent variables related, binary logistic and ordinal
regression analysis were incorporated. “The binary logistic regression was applied for
the dichotomous questions while the ordinal regression was used for Likert scale and
rating type questions.”
The logistic regression model is as presented below:
Y = b0 + b1X2 + b2X2 + ……bpXp
“Where Y is the expected state of smallholder food security, X1 through to Xp are the
independent variables, b0 is the value of Y when all the independent variables (X1 to
Xp) are equal to zero, and b1 through bp are the coefcients to be estimated.”
The study adopted a limit of 0.05 statistical significance level, with the hypotheses
being rejected when the value of its statistics is equal to or less than significance
level.
Considering the “multidimensionality of food security”, as outlined by the World
Food Summit (1996), practitioners and policy makers have recommended the need for
diversity in its measurement (FAO, 2013). This study used a combination of methods
of measurement to assess the respondent perceptions on the following four
dimensions.
69
Quality (diversity)- nutritious food that meets dietary needs.
Quantity (sufficiency)- physical and economic access.
Acceptability- food preferences.
Stability- always having food.
The “design the questions, the dimensions, and indicators of food security,”
developed by Maxwell et al., (2013) was used. The questions assessed household
“behaviour signifying insufficient quality and quantity as anxiety over insecure
access, frequency, and severity of behaviour in which people engage when they do
not have enough food or enough money to buy food.” The behaviour includes aspects
such as worrying because of lack of money, unable to eat healthy and nutritious food,
eating few kinds or less food, skipping meals or going without food for a whole day
because of lack of food among others. The respondent household food security
assessment was based on 12 months recall period preceding the data collection. The
choice of the 12-month period was to cover for any possible seasonal changes in
household food security. The self-assessed food security dimensions had ordinal
categories (responses: “rarely (once or twice in the past one year) 2Sometimes (three
to ten times in the past one year) Often (more than ten times in the past one year) and
never) with the exact meaning of these responses differing by question.” The
indicators are then combined resulting into “food secure”, “mildly food insecure”,
“moderately food insecure” and “severely food insecure” classification. This
improved the measurement of household food security and reduced the number of
potential false positives and false negatives that would result from solely relying on
one measure.
70
The analysis employed ordinal logistic regression to identify relationships among
variables. The results are reported in “odds ratios (OR), which are calculated by
exponentiation the variables coefficients. This measure tells the expected change in
the odds ratio of food security for each unit increase in each variable. A logistic model
provides a better fit to the data if it demonstrates an improvement over the intercept-
only model (null model)”. The test of hypothesis is based on the Likelihood Ratio
Test and Pearson Chi-Square statistic Test. The “H0 holds that the null model is true
and a P value for the overall model fit that is less than 0.05.”
3.9 Validity and Reliability
3.9.1 Validity
According to Taherdoost, (2016), “validity is measuring what is intended to be
measured. Validity explains how well the collected data covers the actual area of
investigation.” For this study, both content and construct validity were tested. For
validity enhancement, “evaluation of the research tools and verification by the
researcher in consultation with research supervisor checking whether it covered the
purposes of the research and whether the results it produced correlated with other
variables that are expected to be correlated with and not correlated with variables that
are theoretically distinct” (Taherdoost, 2016).
3.9.2 Reliability
As provided by Taherdoost, (2016), “reliability is the extent to which results are
consistent.” This is the consistency of people’s responses across the items in the
questionnaire; the scores on the items should correlate to each other. The reliability of
the “questionnaire items was tested using Cronbach Alpha coefficient α, accepted a

71
minimum coefficient of ≥ 0.70. Cronbach Alpha is the most appropriate measure of
reliability when using Likert scales,” which were largely employed in this study.
3.10 Pilot Test
A pilot test is small study for helping design the main research (Arain et al 2010). A
pilot study was done to test for reliability of the semi-structured household
questionnaire. The questionnaire was “administered to a random sample of 32 farming
household heads randomly selected from Kesses sub-County in Uasin Gishu.”
3.11. Ethical Considerations and Data Management
Authorization to carry out the study was obtained from University of Eldoret with
information communicated to the County Department of Agriculture and the Ward
administrators. The study embraced the principle of voluntary participation for the
sampled respondents; none of respondents was forced into participating in the
research. Additionally, the respondents were informed about the purpose of the study
and that their privacy was assured.

72
CHAPTER FOUR
RESEARCH RESULTS
4.1. Introduction
This chapter presents results of the study. It contains the descriptive and inferential
results. Data was collected at the household level using computer assisted personal
interviews and complimented by key informant interviews with the Sub-County
agriculture officers and ward administrators. The response rate was 99% with 397
respondents (Soy Sub-County 196 and Turbo Sub-County 201).
4.2 Demographic and Characteristics of Smallholder Farmers
Data collected on the demographic characteristics is presented in Table 4.1. Results
show that “majority of respondents were male (56%). The average age of the
respondents was 38 years, with the youngest being 20 years while the oldest” was 74
years, those below 35 years, the youth, were 42%. Most (78%) of the smallholder
household head were married. One hundred and seventy-one (43%) respondents had
secondary school as their highest level of education. In relation to gender of head of
households, most of the households were male headed, at 78%.

73
Table 2. Smallholder farmers’ demographic information
Indicators Frequency Relative
Frequency
Cumulative
Relative
Frequency
Gender of respondent
Male 222 0.56 0.56
Female 175 0.44 1.00
Age (Years)
< 25 57 0.14 0.14
26-35 108 0.27 0.42
36-45 130 0.33 0.74
46-55 50 0.13 0.87
>55 52 0.13 1.00
Marital status
Married 312 0.79 0.79
Divorced/separated 32 0.08 0.87
Widow/widower 22 0.06 0.92
Single 31 0.08 1.00
Highest education level
Primary 106 0.27 0.27
Secondary 171 0.43 0.70
Tertiary 120 0.30 1.00
Gender- Head of household
Male 311 0.78 0.78
Female 86 0.22 1.00
N= 397. Source: Survey Data, 2018
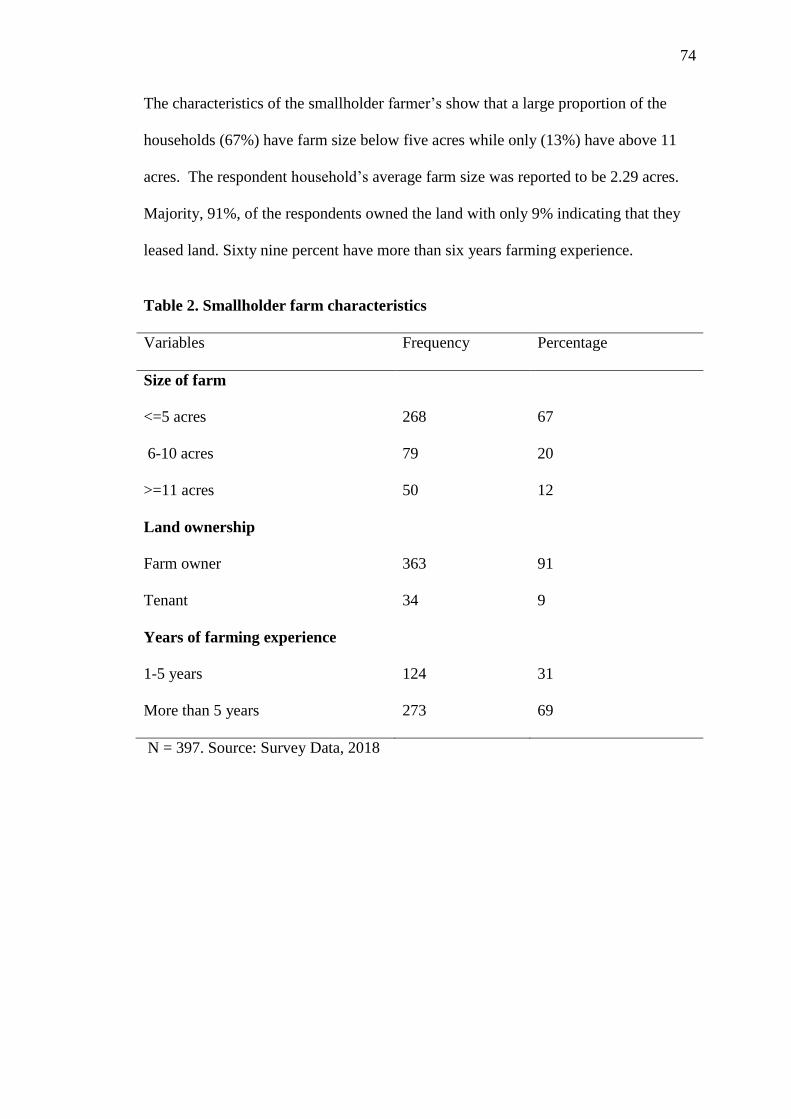
74
The characteristics of the smallholder farmer’s show that a large proportion of the
households (67%) have farm size below five acres while only (13%) have above 11
acres. The respondent household’s average farm size was reported to be 2.29 acres.
Majority, 91%, of the respondents owned the land with only 9% indicating that they
leased land. Sixty nine percent have more than six years farming experience.
Table 2. Smallholder farm characteristics
Variables Frequency Percentage
Size of farm
<=5 acres
6-10 acres
>=11 acres
268
79
50
67
20
12
Land ownership
Farm owner
Tenant
363
34
91
9
Years of farming experience
1-5 years
More than 5 years
124
273
31
69
N = 397. Source: Survey Data, 2018
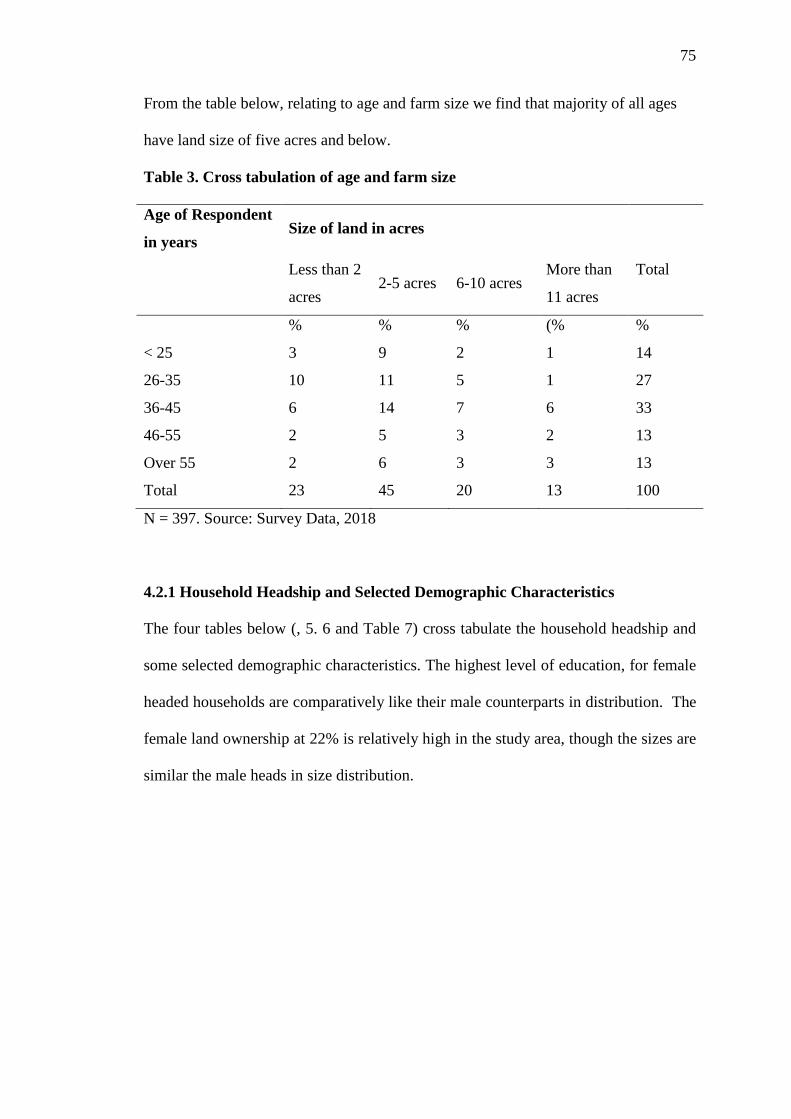
75
From the table below, relating to age and farm size we find that majority of all ages
have land size of five acres and below.
Table 3. Cross tabulation of age and farm size
Age of Respondent
in years Size of land in acres
Less than 2
acres 2-5 acres 6-10 acres
More than
11 acres
Total
% % % (% %
< 25 3 9 2 1 14
26-35 10 11 5 1 27
36-45 6 14 7 6 33
46-55 2 5 3 2 13
Over 55 2 6 3 3 13
Total 23 45 20 13 100
N = 397. Source: Survey Data, 2018
4.2.1 Household Headship and Selected Demographic Characteristics
The four tables below (, 5. 6 and Table 7) cross tabulate the household headship and
some selected demographic characteristics. The highest level of education, for female
headed households are comparatively like their male counterparts in distribution. The
female land ownership at 22% is relatively high in the study area, though the sizes are
similar the male heads in size distribution.
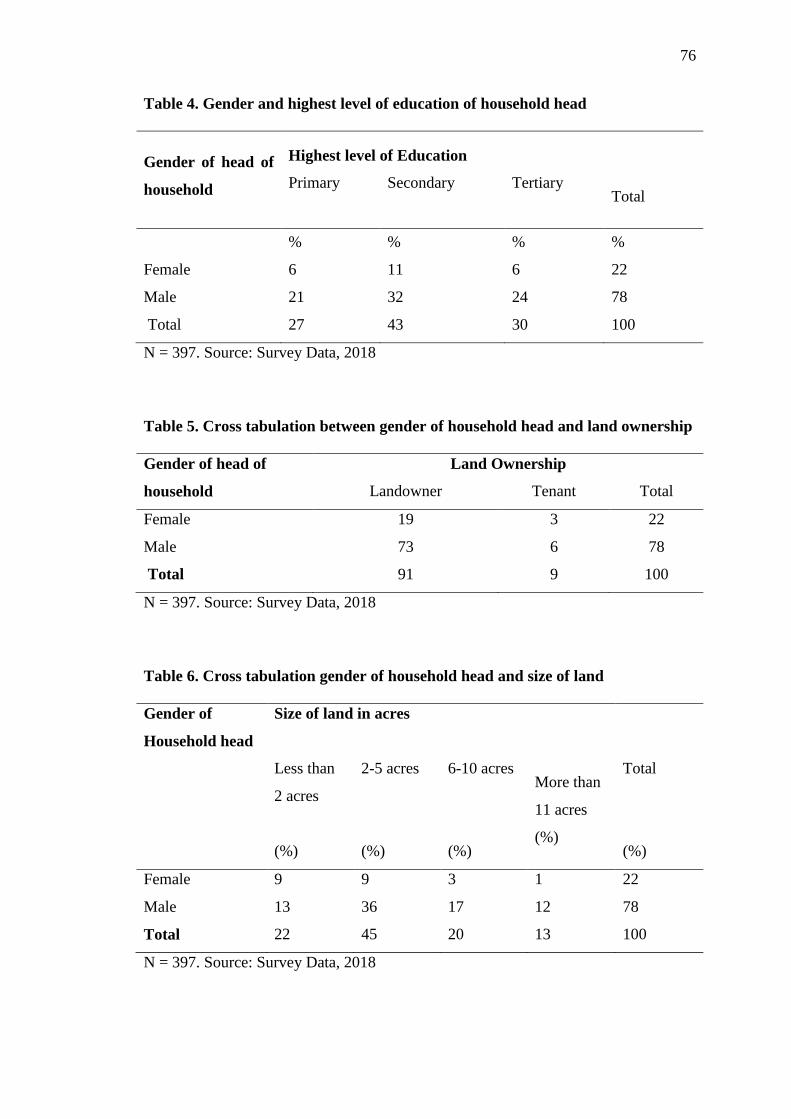
76
Table 4. Gender and highest level of education of household head
Gender of head of
household
Highest level of Education
Primary
Secondary
Tertiary
Total
% % % %
Female 6 11 6 22
Male 21 32 24 78
Total 27 43 30 100
N = 397. Source: Survey Data, 2018
Table 5. Cross tabulation between gender of household head and land ownership
Gender of head of
household
Land Ownership
Landowner Tenant Total
Female 19 3 22
Male 73 6 78
Total 91 9 100
N = 397. Source: Survey Data, 2018
Table 6. Cross tabulation gender of household head and size of land
Gender of
Household head
Size of land in acres
Less than
2 acres
(%)
2-5 acres
(%)
6-10 acres
(%)
More than
11 acres
(%)
Total
(%)
Female 9 9 3 1 22
Male 13 36 17 12 78
Total 22 45 20 13 100
N = 397. Source: Survey Data, 2018
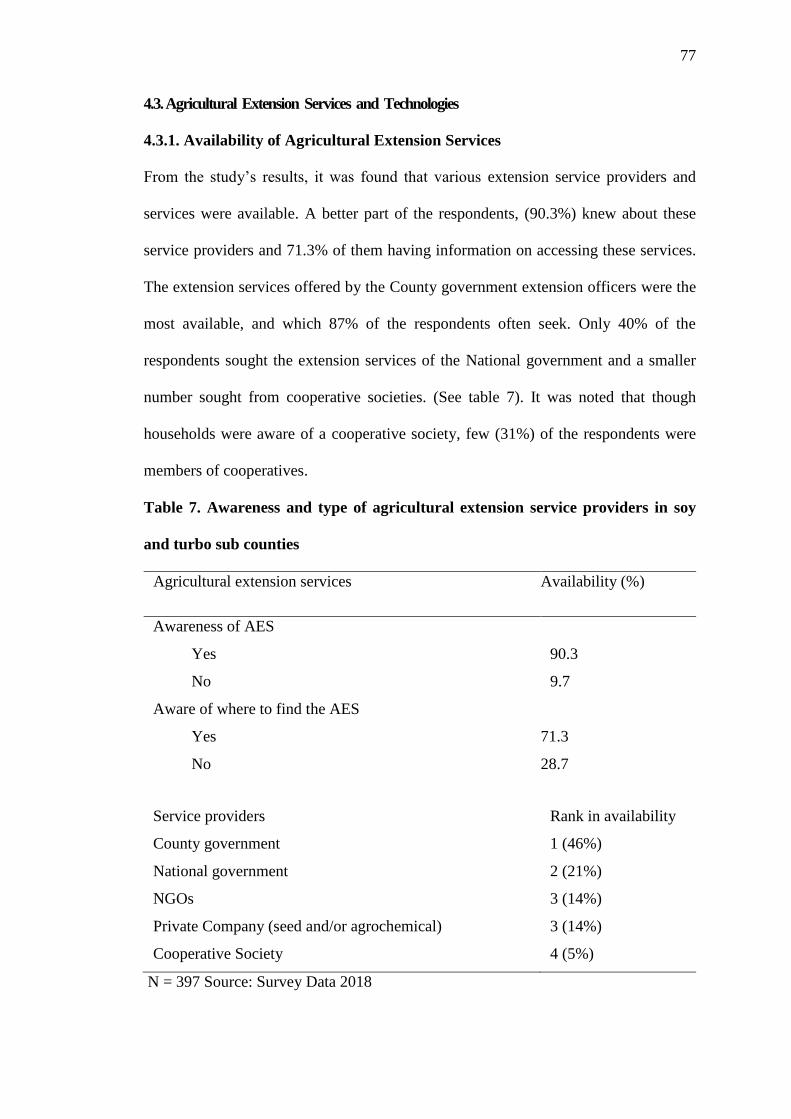
77
4.3. Agricultural Extension Services and Technologies
4.3.1. Availability of Agricultural Extension Services
From the study’s results, it was found that various extension service providers and
services were available. A better part of the respondents, (90.3%) knew about these
service providers and 71.3% of them having information on accessing these services.
The extension services offered by the County government extension officers were the
most available, and which 87% of the respondents often seek. Only 40% of the
respondents sought the extension services of the National government and a smaller
number sought from cooperative societies. (See table 7). It was noted that though
households were aware of a cooperative society, few (31%) of the respondents were
members of cooperatives.
Table 7. Awareness and type of agricultural extension service providers in soy
and turbo sub counties
Agricultural extension services Availability (%)
Awareness of AES
Yes
No
90.3
9.7
Aware of where to find the AES
Yes
No
71.3
28.7
Service providers
County government
Rank in availability
1 (46%)
National government 2 (21%)
NGOs 3 (14%)
Private Company (seed and/or agrochemical) 3 (14%)
Cooperative Society 4 (5%)
N = 397 Source: Survey Data 2018
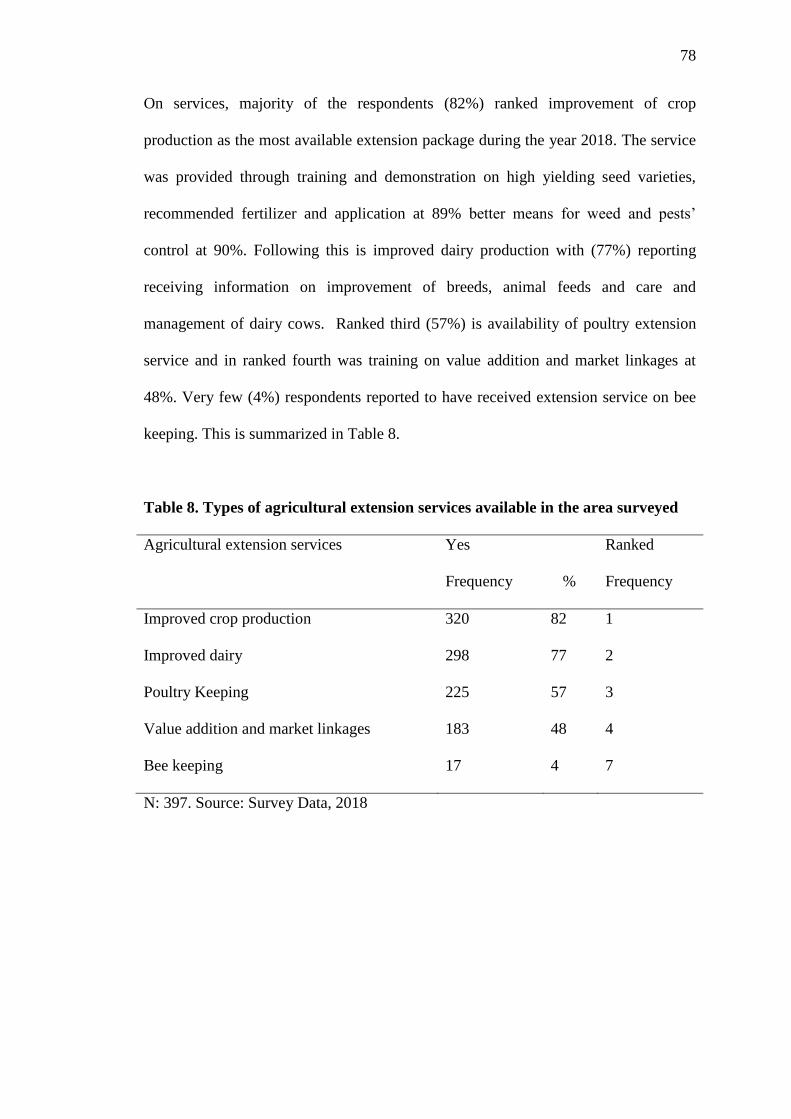
78
On services, majority of the respondents (82%) ranked improvement of crop
production as the most available extension package during the year 2018. The service
was provided through training and demonstration on high yielding seed varieties,
recommended fertilizer and application at 89% better means for weed and pests’
control at 90%. Following this is improved dairy production with (77%) reporting
receiving information on improvement of breeds, animal feeds and care and
management of dairy cows. Ranked third (57%) is availability of poultry extension
service and in ranked fourth was training on value addition and market linkages at
48%. Very few (4%) respondents reported to have received extension service on bee
keeping. This is summarized in Table 8.
Table 8. Types of agricultural extension services available in the area surveyed
Agricultural extension services Yes Ranked
Frequency % Frequency
Improved crop production 320 82 1
Improved dairy 298 77 2
Poultry Keeping 225 57 3
Value addition and market linkages 183 48 4
Bee keeping 17 4 7
N: 397. Source: Survey Data, 2018
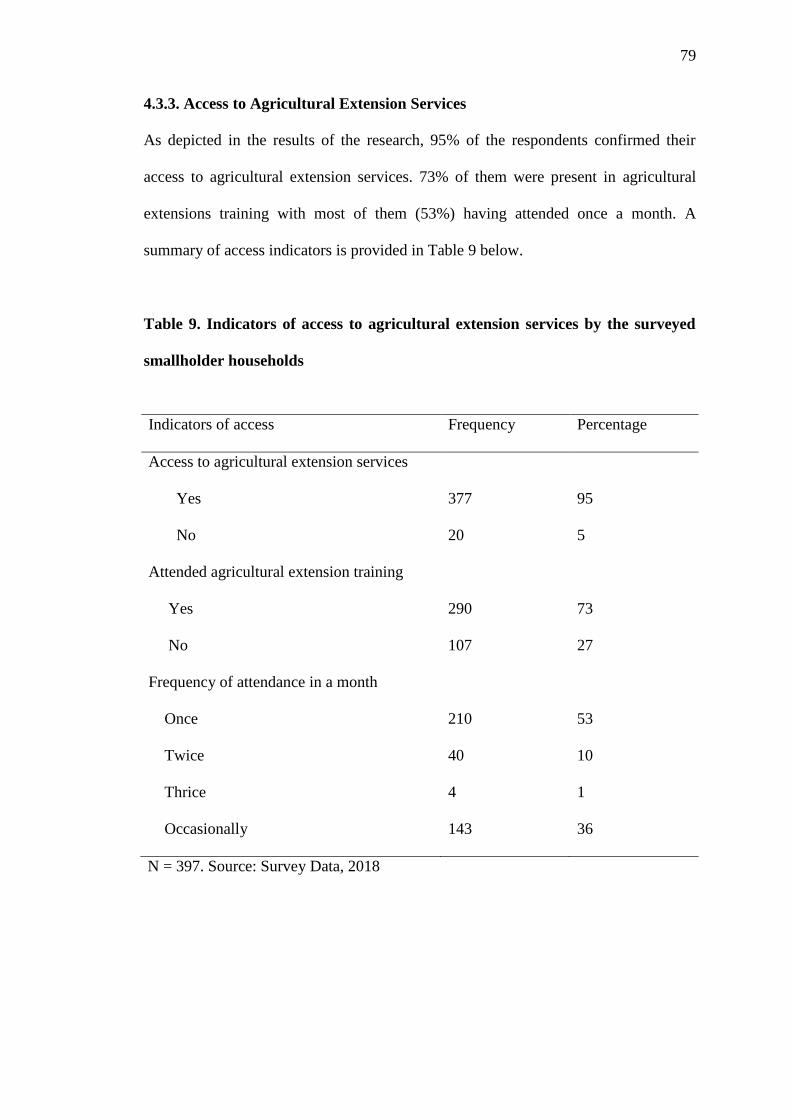
79
4.3.3. Access to Agricultural Extension Services
As depicted in the results of the research, 95% of the respondents confirmed their
access to agricultural extension services. 73% of them were present in agricultural
extensions training with most of them (53%) having attended once a month. A
summary of access indicators is provided in Table 9 below.
Table 9. Indicators of access to agricultural extension services by the surveyed
smallholder households
Indicators of access Frequency Percentage
Access to agricultural extension services
Yes
No
377
20
95
5
Attended agricultural extension training
Yes
No
290
107
73
27
Frequency of attendance in a month
Once
Twice
Thrice
Occasionally
210
40
4
143
53
10
1
36
N = 397. Source: Survey Data, 2018
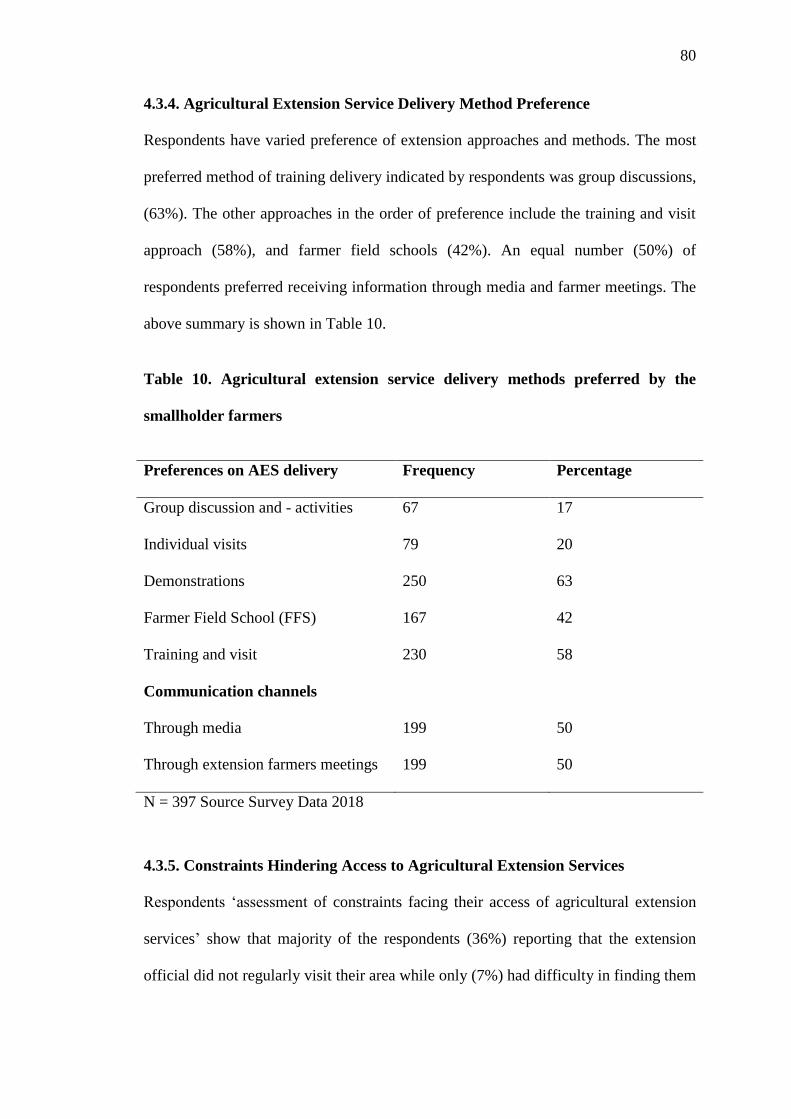
80
4.3.4. Agricultural Extension Service Delivery Method Preference
Respondents have varied preference of extension approaches and methods. The most
preferred method of training delivery indicated by respondents was group discussions,
(63%). The other approaches in the order of preference include the training and visit
approach (58%), and farmer field schools (42%). An equal number (50%) of
respondents preferred receiving information through media and farmer meetings. The
above summary is shown in Table 10.
Table 10. Agricultural extension service delivery methods preferred by the
smallholder farmers
Preferences on AES delivery Frequency Percentage
Group discussion and - activities
Individual visits
Demonstrations
Farmer Field School (FFS)
Training and visit
Communication channels
Through media
Through extension farmers meetings
67
79
250
167
230
199
199
17
20
63
42
58
50
50
N = 397 Source Survey Data 2018
4.3.5. Constraints Hindering Access to Agricultural Extension Services
Respondents ‘assessment of constraints facing their access of agricultural extension
services’ show that majority of the respondents (36%) reporting that the extension
official did not regularly visit their area while only (7%) had difficulty in finding them
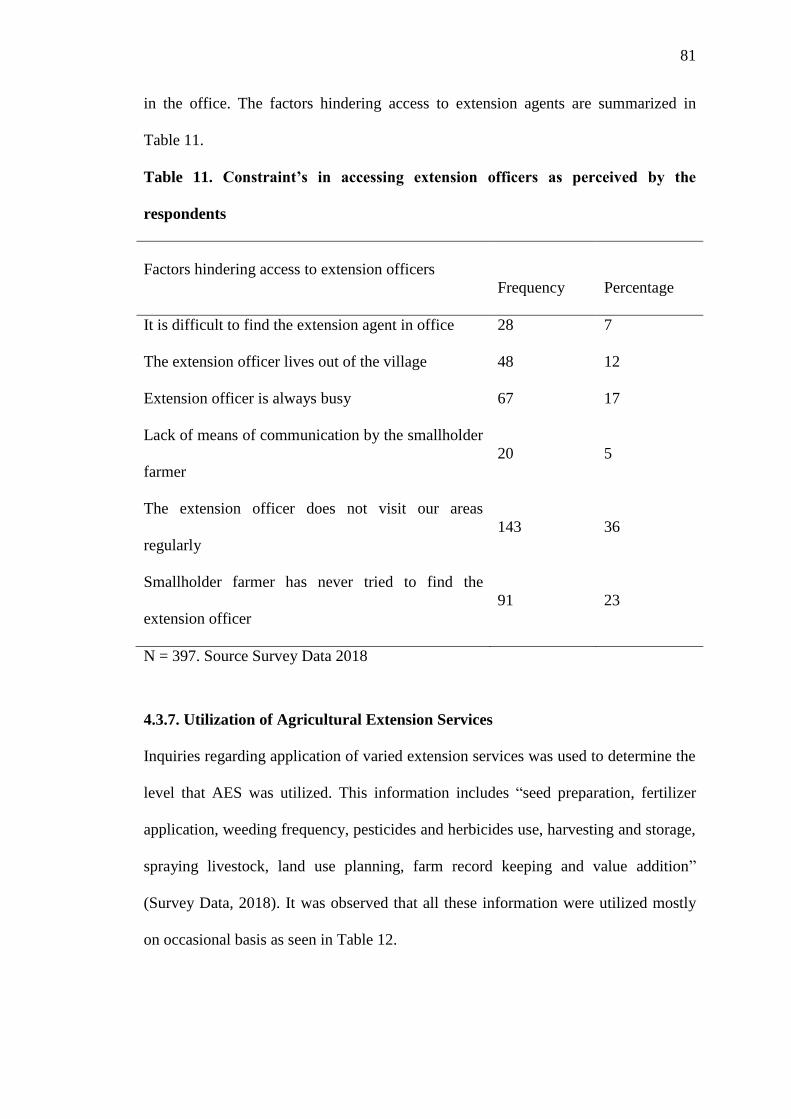
81
in the office. The factors hindering access to extension agents are summarized in
Table 11.
Table 11. Constraint’s in accessing extension officers as perceived by the
respondents
Factors hindering access to extension officers
Frequency Percentage
It is difficult to find the extension agent in office 28 7
The extension officer lives out of the village 48 12
Extension officer is always busy 67 17
Lack of means of communication by the smallholder
farmer
20 5
The extension officer does not visit our areas
regularly
143 36
Smallholder farmer has never tried to find the
extension officer
91 23
N = 397. Source Survey Data 2018
4.3.7. Utilization of Agricultural Extension Services
Inquiries regarding application of varied extension services was used to determine the
level that AES was utilized. This information includes “seed preparation, fertilizer
application, weeding frequency, pesticides and herbicides use, harvesting and storage,
spraying livestock, land use planning, farm record keeping and value addition”
(Survey Data, 2018). It was observed that all these information were utilized mostly
on occasional basis as seen in Table 12.
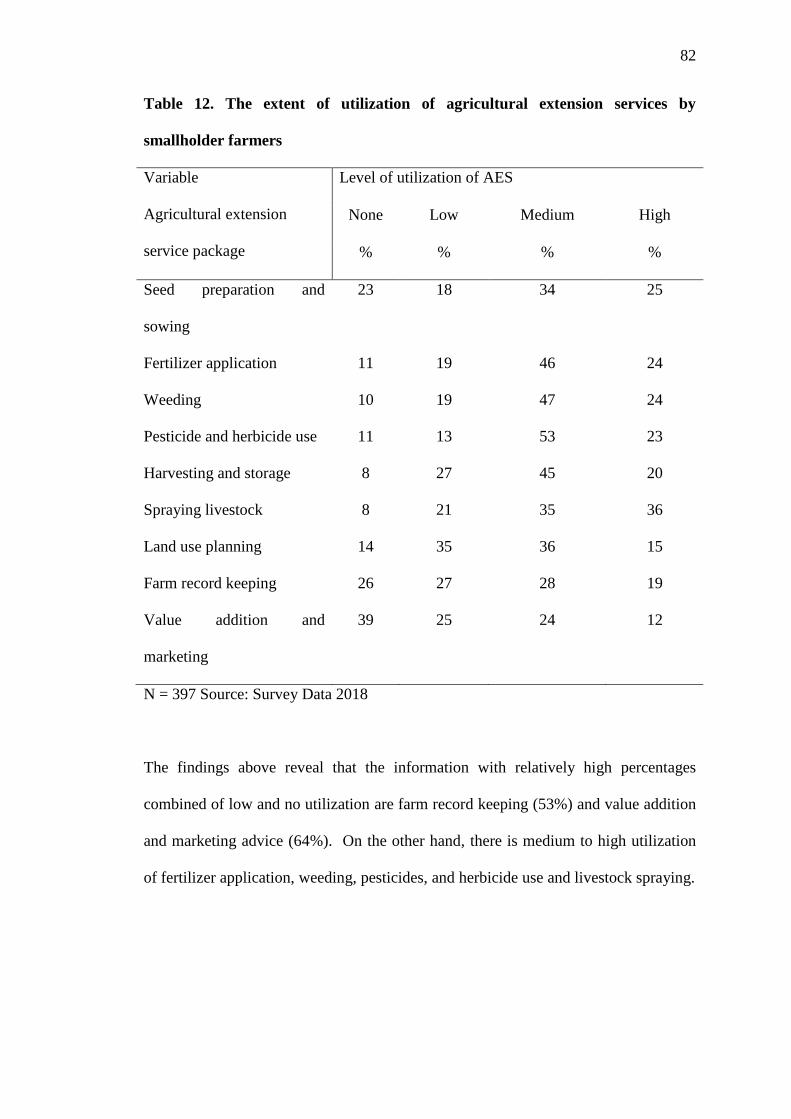
82
Table 12. The extent of utilization of agricultural extension services by
smallholder farmers
Variable
Agricultural extension
service package
Level of utilization of AES
None Low Medium High
% % % %
Seed preparation and
sowing
23 18 34 25
Fertilizer application 11 19 46 24
Weeding 10 19 47 24
Pesticide and herbicide use 11 13 53 23
Harvesting and storage 8 27 45 20
Spraying livestock 8 21 35 36
Land use planning 14 35 36 15
Farm record keeping 26 27 28 19
Value addition and
marketing
39 25 24 12
N = 397 Source: Survey Data 2018
The findings above reveal that the information with relatively high percentages
combined of low and no utilization are farm record keeping (53%) and value addition
and marketing advice (64%). On the other hand, there is medium to high utilization
of fertilizer application, weeding, pesticides, and herbicide use and livestock spraying.
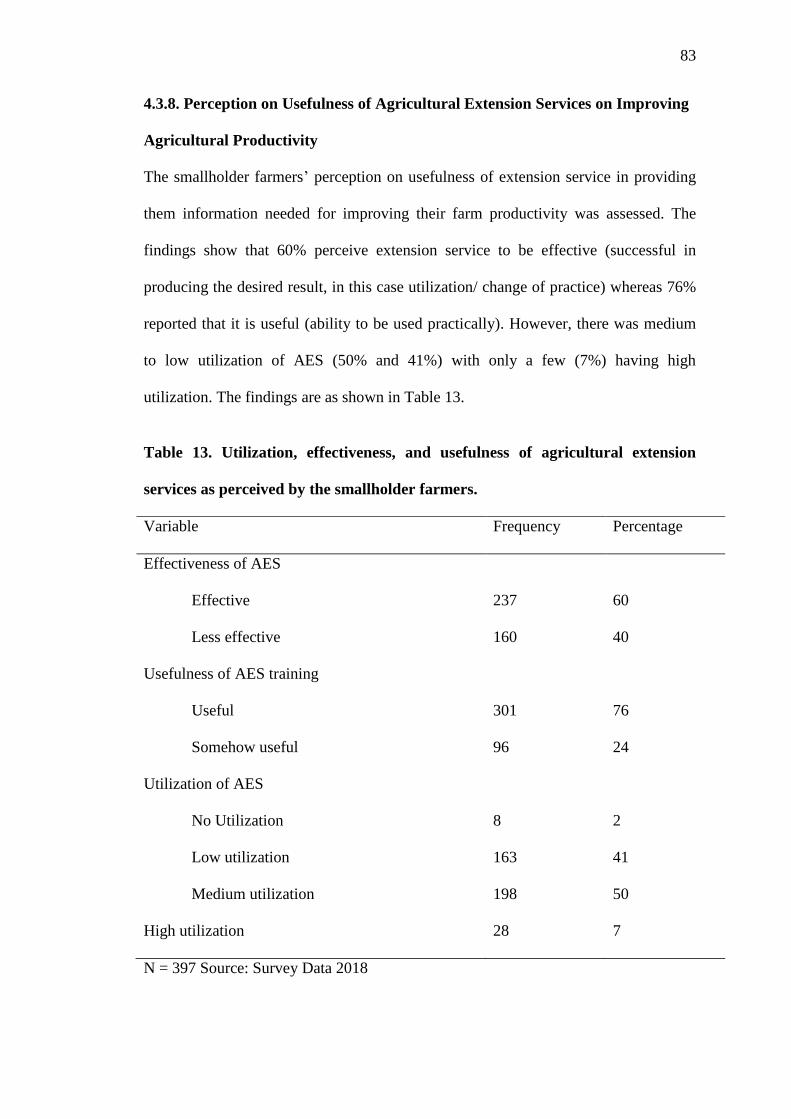
83
4.3.8. Perception on Usefulness of Agricultural Extension Services on Improving
Agricultural Productivity
The smallholder farmers’ perception on usefulness of extension service in providing
them information needed for improving their farm productivity was assessed. The
findings show that 60% perceive extension service to be effective (successful in
producing the desired result, in this case utilization/ change of practice) whereas 76%
reported that it is useful (ability to be used practically). However, there was medium
to low utilization of AES (50% and 41%) with only a few (7%) having high
utilization. The findings are as shown in Table 13.
Table 13. Utilization, effectiveness, and usefulness of agricultural extension
services as perceived by the smallholder farmers.
Variable Frequency Percentage
Effectiveness of AES
Effective
Less effective
237
160
60
40
Usefulness of AES training
Useful
Somehow useful
301
96
76
24
Utilization of AES
No Utilization
Low utilization
Medium utilization
High utilization
8
163
198
28
2
41
50
7
N = 397 Source: Survey Data 2018

84
4.3.9. Summary of Key informant Interviews Findings on Availability and
Challenges of Agricultural Services in the Study Area
Interviews with the key informants, the Ward Administrators and the Sub County
Agricultural Officer confirmed the availability of different options ranging from
public sector mainly county agricultural service with each ward having a livestock
extension and agricultural extension information. Other players include cooperatives
and NGO’s and private companies. These players provide extension service related to
their missions.
Dairy cooperatives mainly provide dairy related extension while NGOs provide
training to farmers as it related to the projects they are implementing. The most
common NGO programmes in both Sub counties are farmer dairy productivity
improvement training on various aspects such as fodder preservation, improvement of
breeds and marketing through facilitation of farmer cooperatives for milk bulking.
The private sector providers are mainly fertilizer and agrochemical companies,
providing information to farmers.
The agricultural extension models commonly found in the study area include the free
public extension services provided when demanded by farmers and through open field
days, the partly cost shared provision of extension service where if the farmer partly
pays for specialized support and fully commercialized service where farmers pay for
the service which is either provided by the private sector or cooperatives.
The public extension service which is available to every smallholder farmer on
demand faces challenges insufficient logistical and delays in release of funds affecting
timeliness and more so farmers living further away from the sub county headquarters.
Other general challenges in the study area are the uncoordinated extension by the
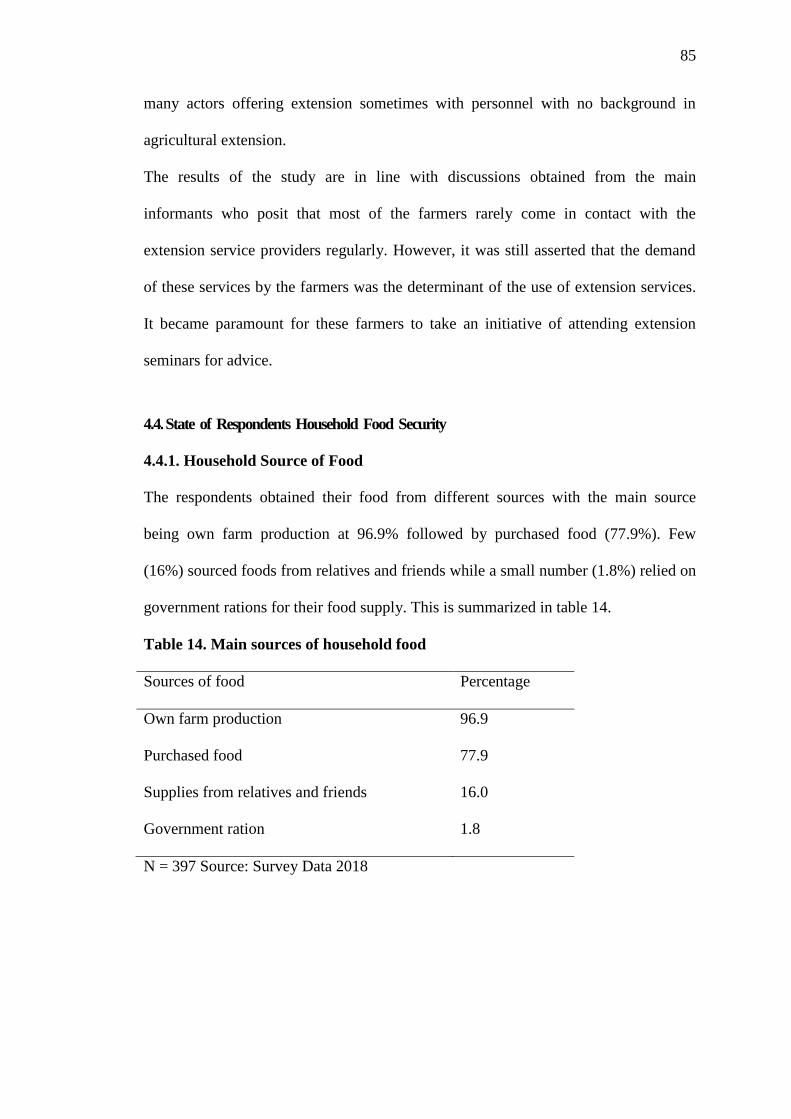
85
many actors offering extension sometimes with personnel with no background in
agricultural extension.
The results of the study are in line with discussions obtained from the main
informants who posit that most of the farmers rarely come in contact with the
extension service providers regularly. However, it was still asserted that the demand
of these services by the farmers was the determinant of the use of extension services.
It became paramount for these farmers to take an initiative of attending extension
seminars for advice.
4.4. State of Respondents Household Food Security
4.4.1. Household Source of Food
The respondents obtained their food from different sources with the main source
being own farm production at 96.9% followed by purchased food (77.9%). Few
(16%) sourced foods from relatives and friends while a small number (1.8%) relied on
government rations for their food supply. This is summarized in table 14.
Table 14. Main sources of household food
Sources of food Percentage
Own farm production 96.9
Purchased food 77.9
Supplies from relatives and friends 16.0
Government ration 1.8
N = 397 Source: Survey Data 2018
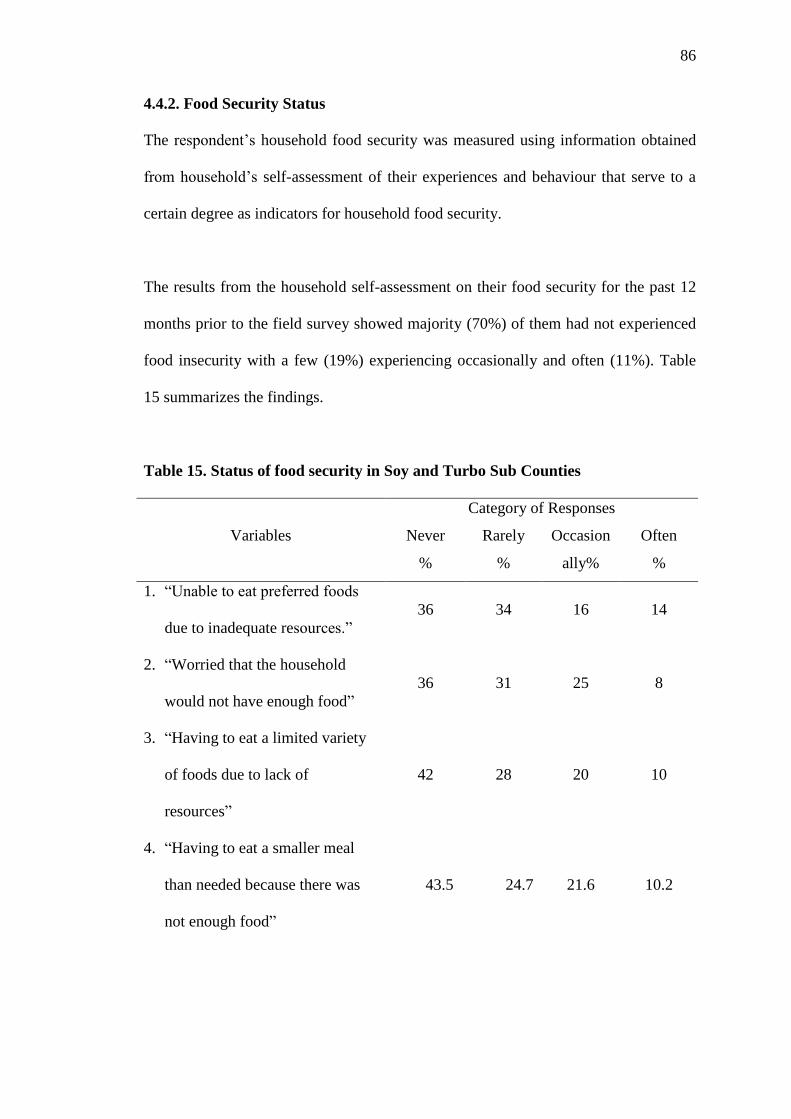
86
4.4.2. Food Security Status
The respondent’s household food security was measured using information obtained
from household’s self-assessment of their experiences and behaviour that serve to a
certain degree as indicators for household food security.
The results from the household self-assessment on their food security for the past 12
months prior to the field survey showed majority (70%) of them had not experienced
food insecurity with a few (19%) experiencing occasionally and often (11%). Table
15 summarizes the findings.
Table 15. Status of food security in Soy and Turbo Sub Counties
Category of Responses
Variables Never
%
Rarely
%
Occasion
ally%
Often
%
1. “Unable to eat preferred foods
due to inadequate resources.”
36 34 16 14
2. “Worried that the household
would not have enough food”
36 31 25 8
3. “Having to eat a limited variety
of foods due to lack of
resources”
42 28 20 10
4. “Having to eat a smaller meal
than needed because there was
not enough food”
43.5 24.7 21.6 10.2
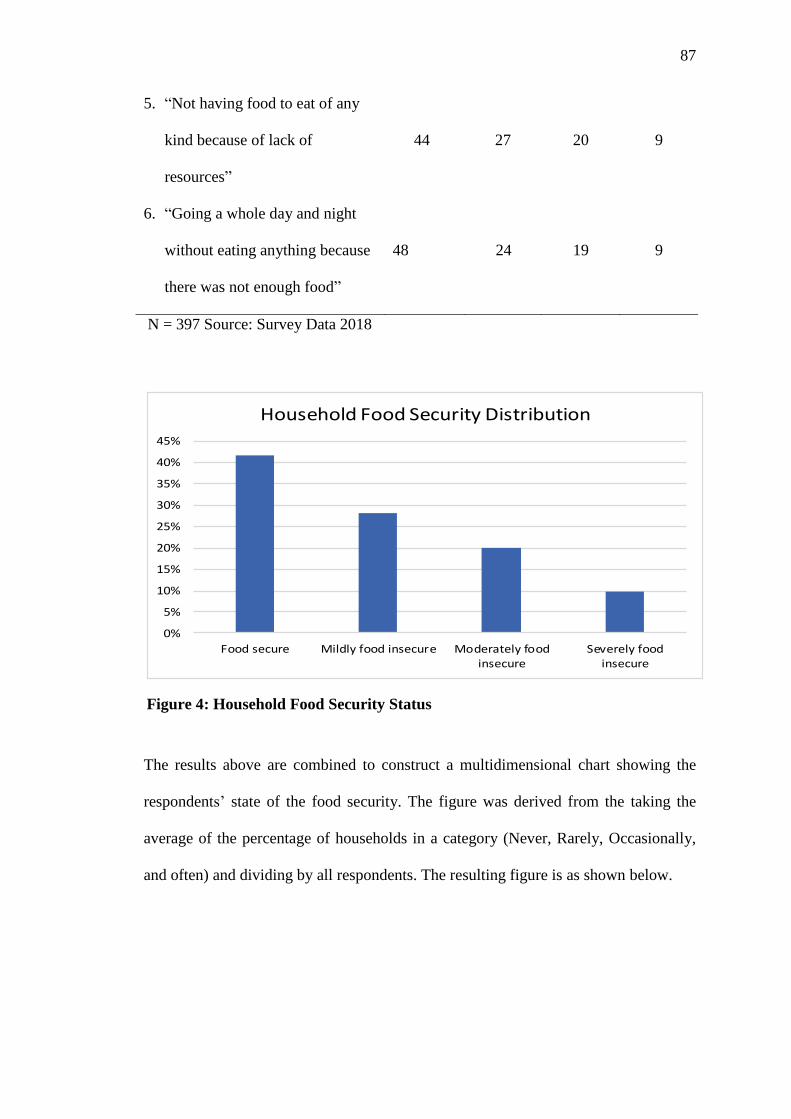
87
0%
5%
10%
15%
20%
25%
30%
35%
40%
45%
Food secure Mildly food insecure Moderately foodinsecure
Severely foodinsecure
Household Food Security Distribution
5. “Not having food to eat of any
kind because of lack of
resources”
44 27 20 9
6. “Going a whole day and night
without eating anything because
there was not enough food”
48 24 19
9
N = 397 Source: Survey Data 2018
The results above are combined to construct a multidimensional chart showing the
respondents’ state of the food security. The figure was derived from the taking the
average of the percentage of households in a category (Never, Rarely, Occasionally,
and often) and dividing by all respondents. The resulting figure is as shown below.
Figure 4: Household Food Security Status

88
4.4.3. Utilization of Agricultural Extension Service and Household Food
Satisfaction
From the results above, it can be asserted that more of the surveyed households (39%)
rarely had issues with food security, 31% of them experienced no problems at all and
18% of the households had issues from time to time while (11%) always had
problems. Cross tabulation was performed to establish the extent of utilizing
extension services and how it is related to the feed security of households.
“A higher percentage of households (19%) with medium level of utilization of
agricultural extensions services never experienced any problem in satisfying their
household food security 12 months prior to the survey. A small percentage of those
who had never utilized (1%) agricultural extensions services always had problems in
their household food security needs while (6%) with medium level of utilization
reported to always being dissatisfied with their food security” as shown in Table 16.
Table 16. AES utilization and food satisfaction
Utilization of Agricultural
Extension Services
Household food security status
Total
%
Never
%
Rarely
%
Occasionally
%
Often
%
No utilization 2 3 1 1 6
Low utilization 11 14 8 4 37
Medium utilization 16 19 8 6 49
High utilization 3 4 1 1 8
Total 31 39 18 11 100
Pearson Chi-Square 4.722 p-value 0.858
N = 397. Source: Survey data 2018
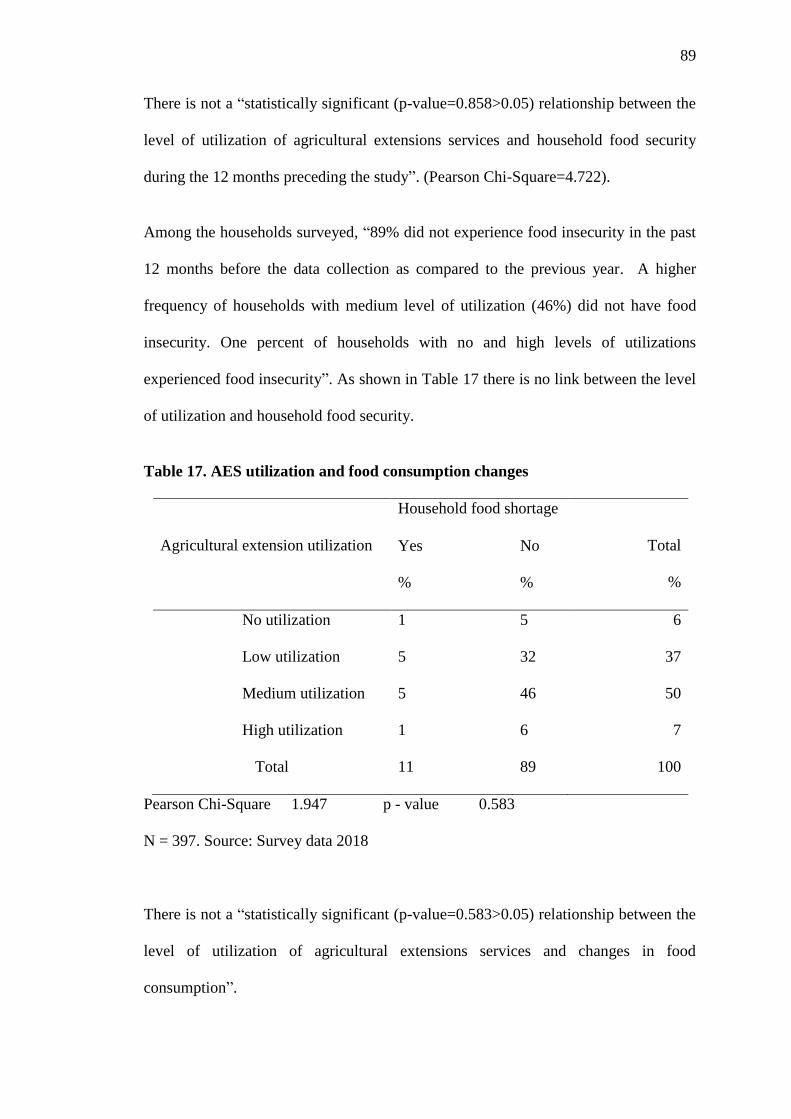
89
There is not a “statistically significant (p-value=0.858>0.05) relationship between the
level of utilization of agricultural extensions services and household food security
during the 12 months preceding the study”. (Pearson Chi-Square=4.722).
Among the households surveyed, “89% did not experience food insecurity in the past
12 months before the data collection as compared to the previous year. A higher
frequency of households with medium level of utilization (46%) did not have food
insecurity. One percent of households with no and high levels of utilizations
experienced food insecurity”. As shown in Table 17 there is no link between the level
of utilization and household food security.
Table 17. AES utilization and food consumption changes
Agricultural extension utilization
Household food shortage
Total
%
Yes
%
No
%
No utilization 1 5 6
Low utilization 5 32 37
Medium utilization 5 46 50
High utilization 1 6 7
Total 11 89 100
Pearson Chi-Square 1.947 p - value 0.583
N = 397. Source: Survey data 2018
There is not a “statistically significant (p-value=0.583>0.05) relationship between the
level of utilization of agricultural extensions services and changes in food
consumption”.
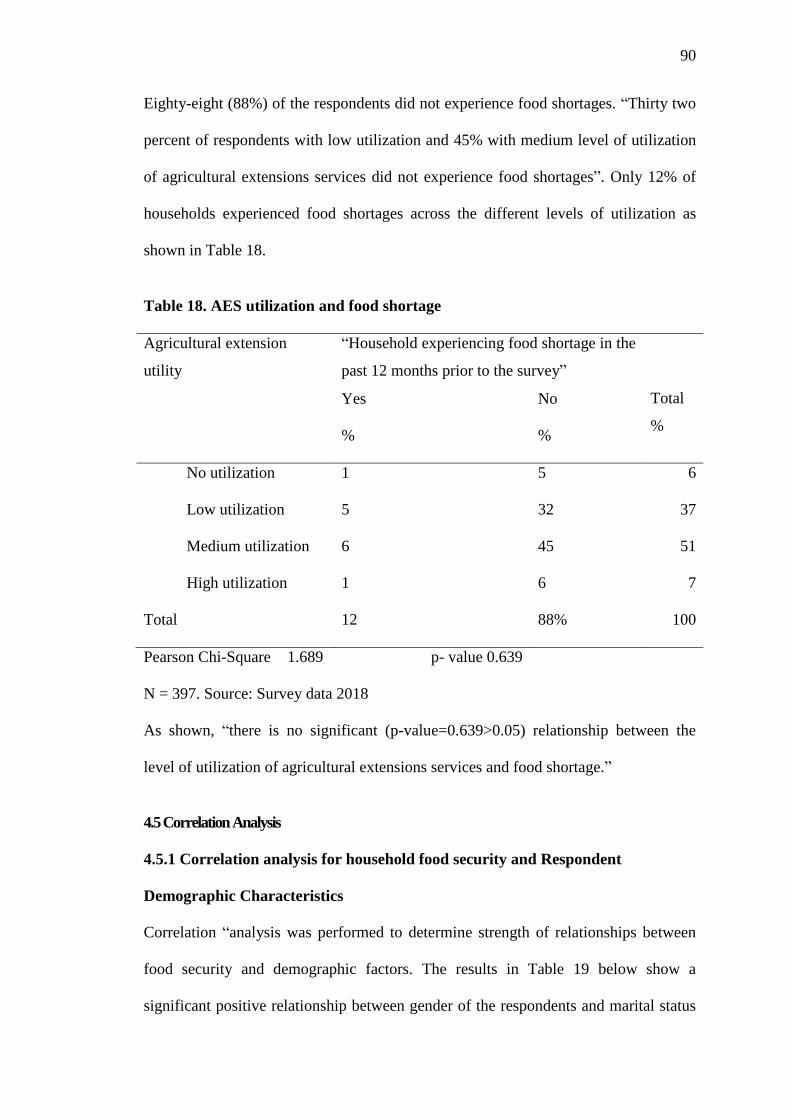
90
Eighty-eight (88%) of the respondents did not experience food shortages. “Thirty two
percent of respondents with low utilization and 45% with medium level of utilization
of agricultural extensions services did not experience food shortages”. Only 12% of
households experienced food shortages across the different levels of utilization as
shown in Table 18.
Table 18. AES utilization and food shortage
Agricultural extension
utility
“Household experiencing food shortage in the
past 12 months prior to the survey”
Total
%
Yes
%
No
%
No utilization 1 5 6
Low utilization 5 32 37
Medium utilization 6 45 51
High utilization 1 6 7
Total 12 88% 100
Pearson Chi-Square 1.689 p- value 0.639
N = 397. Source: Survey data 2018
As shown, “there is no significant (p-value=0.639>0.05) relationship between the
level of utilization of agricultural extensions services and food shortage.”
4.5 Correlation Analysis
4.5.1 Correlation analysis for household food security and Respondent
Demographic Characteristics
Correlation “analysis was performed to determine strength of relationships between
food security and demographic factors. The results in Table 19 below show a
significant positive relationship between gender of the respondents and marital status
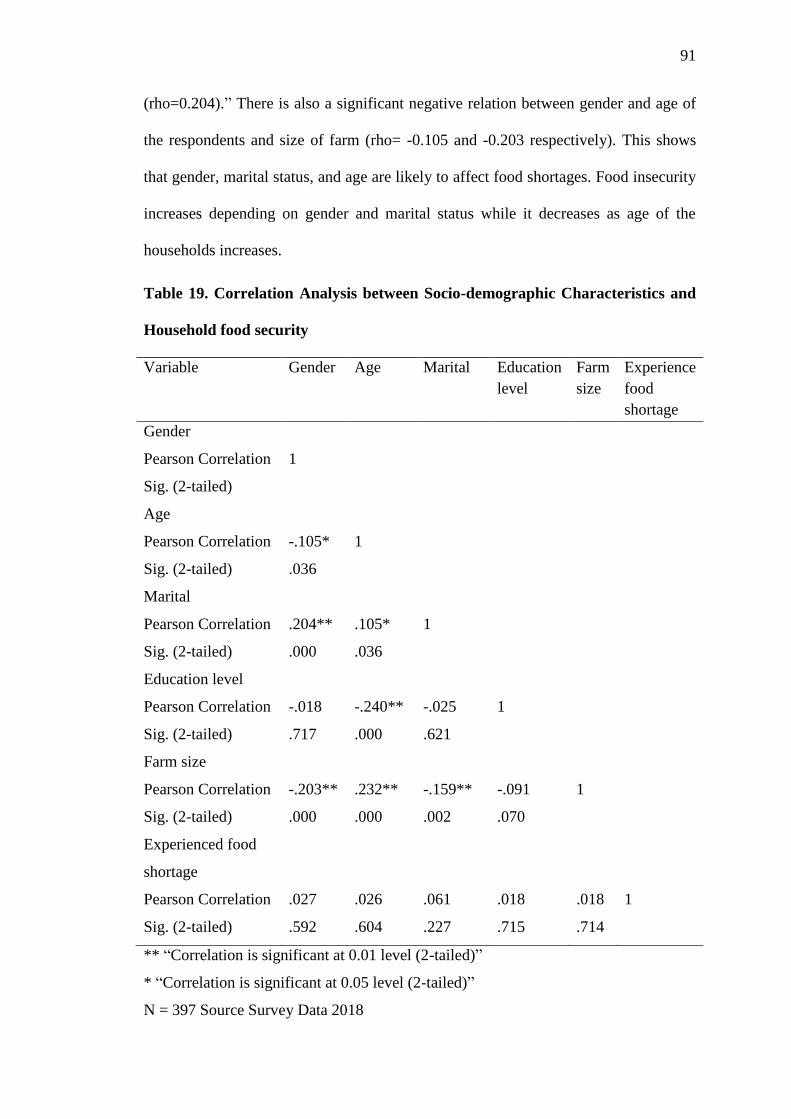
91
(rho=0.204).” There is also a significant negative relation between gender and age of
the respondents and size of farm (rho= -0.105 and -0.203 respectively). This shows
that gender, marital status, and age are likely to affect food shortages. Food insecurity
increases depending on gender and marital status while it decreases as age of the
households increases.
Table 19. Correlation Analysis between Socio-demographic Characteristics and
Household food security
Variable Gender Age Marital Education
level
Farm
size
Experience
food
shortage
Gender
Pearson Correlation 1
Sig. (2-tailed)
Age
Pearson Correlation -.105* 1
Sig. (2-tailed) .036
Marital
Pearson Correlation .204** .105* 1
Sig. (2-tailed) .000 .036
Education level
Pearson Correlation -.018 -.240** -.025 1
Sig. (2-tailed) .717 .000 .621
Farm size
Pearson Correlation -.203** .232** -.159** -.091 1
Sig. (2-tailed) .000 .000 .002 .070
Experienced food
shortage
Pearson Correlation .027 .026 .061 .018 .018 1
Sig. (2-tailed) .592 .604 .227 .715 .714
** “Correlation is significant at 0.01 level (2-tailed)”
* “Correlation is significant at 0.05 level (2-tailed)”
N = 397 Source Survey Data 2018
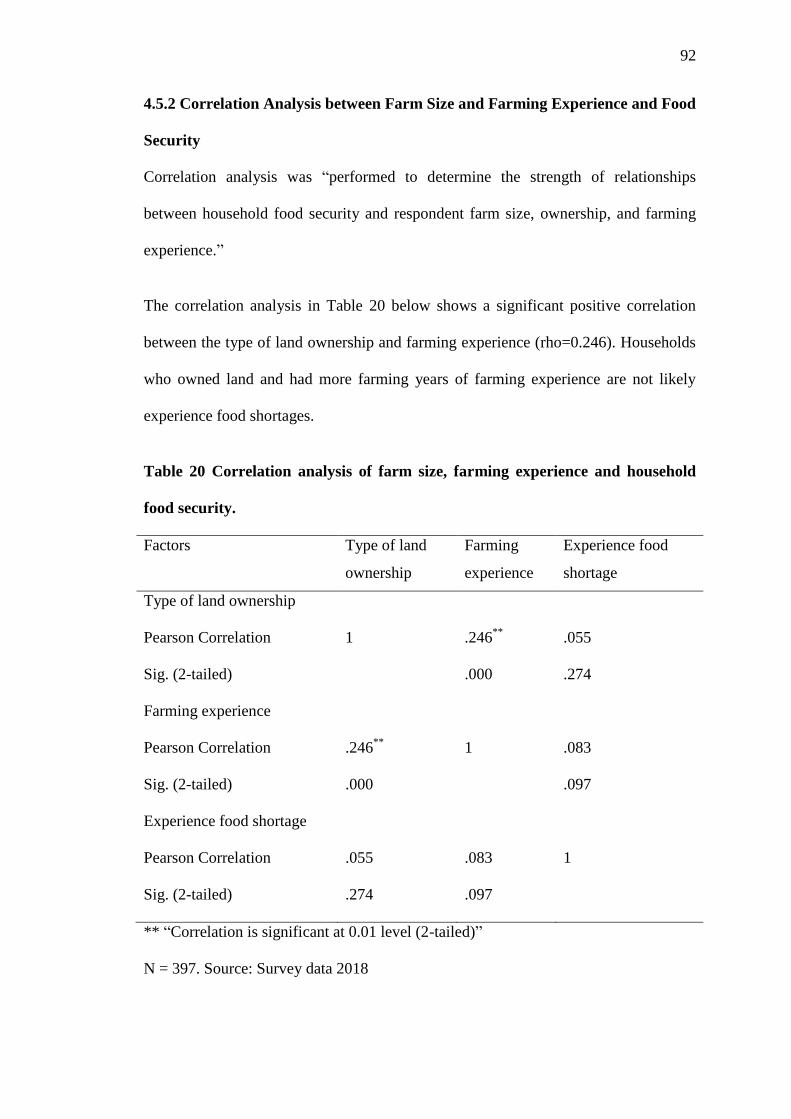
92
4.5.2 Correlation Analysis between Farm Size and Farming Experience and Food
Security
Correlation analysis was “performed to determine the strength of relationships
between household food security and respondent farm size, ownership, and farming
experience.”
The correlation analysis in Table 20 below shows a significant positive correlation
between the type of land ownership and farming experience (rho=0.246). Households
who owned land and had more farming years of farming experience are not likely
experience food shortages.
Table 20 Correlation analysis of farm size, farming experience and household
food security.
Factors Type of land
ownership
Farming
experience
Experience food
shortage
Type of land ownership
Pearson Correlation 1 .246**
.055
Sig. (2-tailed) .000 .274
Farming experience
Pearson Correlation .246**
1 .083
Sig. (2-tailed) .000 .097
Experience food shortage
Pearson Correlation .055 .083 1
Sig. (2-tailed) .274 .097
** “Correlation is significant at 0.01 level (2-tailed)”
N = 397. Source: Survey data 2018
93
4.5.3 Correlation between Availability and Access to Agricultural extension
services and Food Security.
For the determination of how strong the relationships between “availability and access
to agricultural extension services and respondent household food security”,
correlation analysis was performed.
Table 21 below offers a summary of these correlations. There is a “significant positive
relationship between the availability of extension services, attendance of extension
training programmes and monthly frequency of attendance” (rho=0 0.200 and 0.108
respectively). Also, there is a “significant negative correlation between availability of
extension services and knowledge about its understanding by the households” (rho=-
0.237). This shows that “increasing the availability of extension services and
attendance to training programmes increases accessibility and therefore contributes to
household food security.”
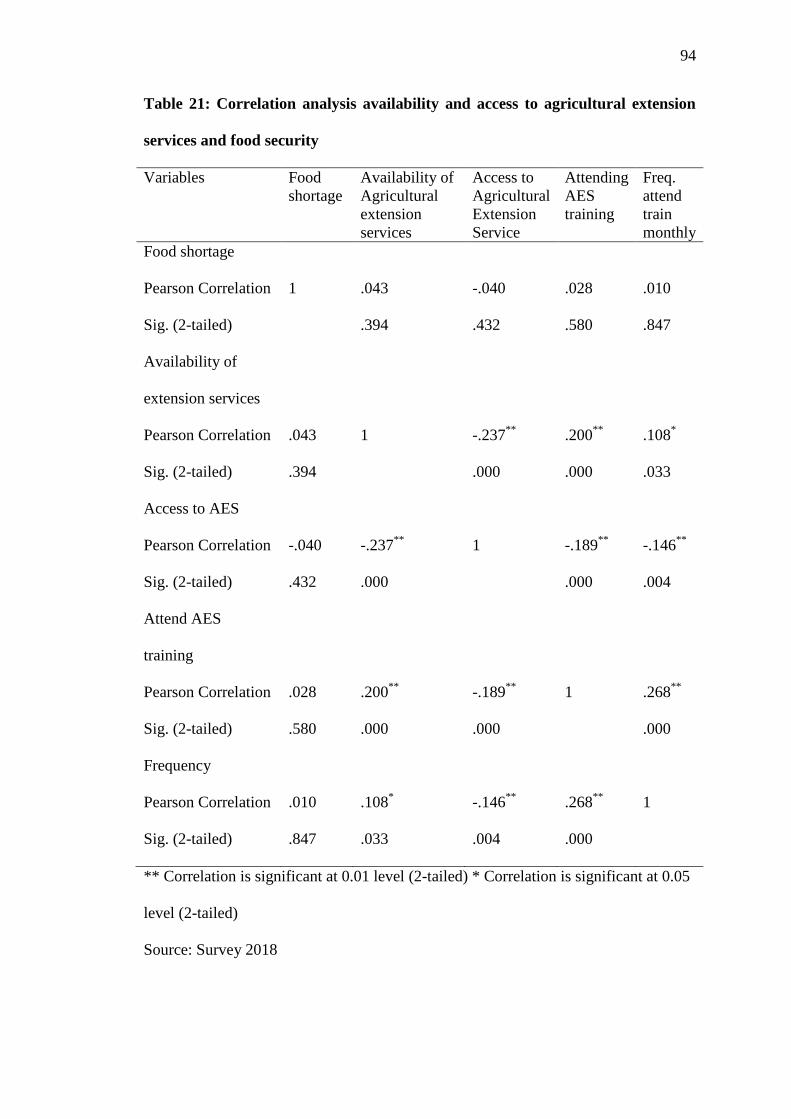
94
Table 21: Correlation analysis availability and access to agricultural extension
services and food security
Variables Food
shortage
Availability of
Agricultural
extension
services
Access to
Agricultural
Extension
Service
Attending
AES
training
Freq.
attend
train
monthly
Food shortage
Pearson Correlation 1 .043 -.040 .028 .010
Sig. (2-tailed) .394 .432 .580 .847
Availability of
extension services
Pearson Correlation .043 1 -.237**
.200**
.108*
Sig. (2-tailed) .394 .000 .000 .033
Access to AES
Pearson Correlation -.040 -.237**
1 -.189**
-.146**
Sig. (2-tailed) .432 .000 .000 .004
Attend AES
training
Pearson Correlation .028 .200**
-.189**
1 .268**
Sig. (2-tailed) .580 .000 .000 .000
Frequency
Pearson Correlation .010 .108* -.146
** .268
** 1
Sig. (2-tailed) .847 .033 .004 .000
** Correlation is significant at 0.01 level (2-tailed) * Correlation is significant at 0.05
level (2-tailed)
Source: Survey 2018
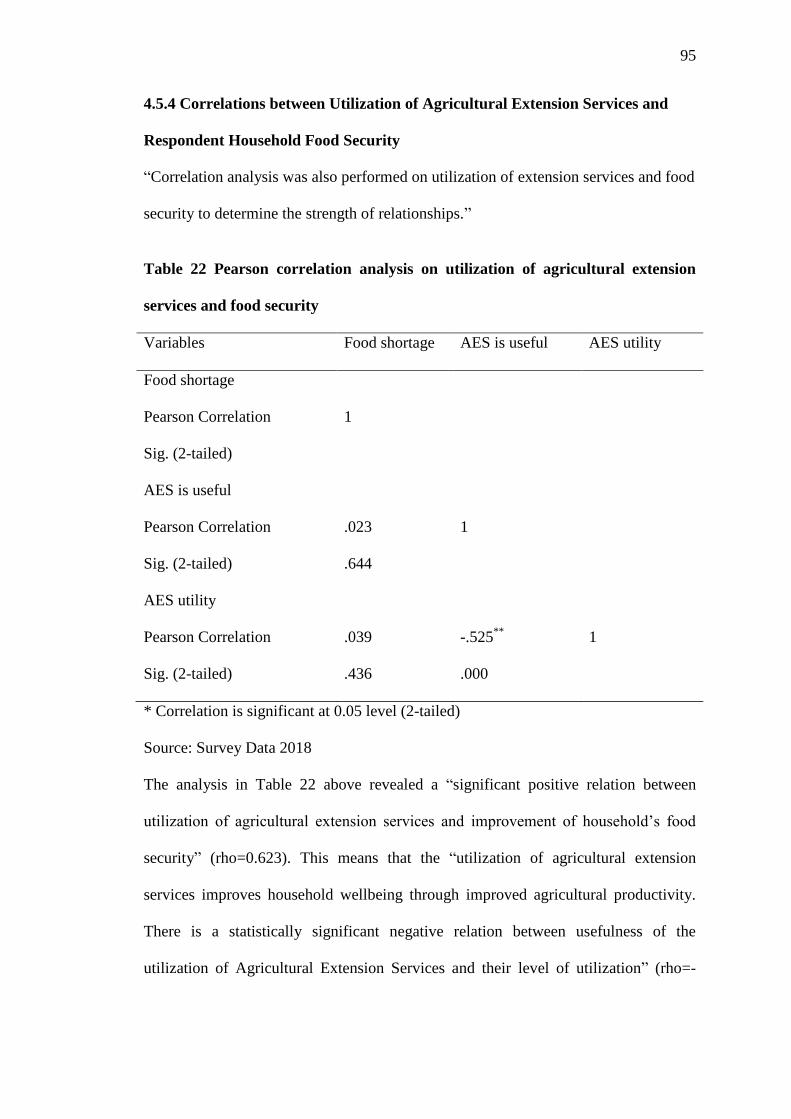
95
4.5.4 Correlations between Utilization of Agricultural Extension Services and
Respondent Household Food Security
“Correlation analysis was also performed on utilization of extension services and food
security to determine the strength of relationships.”
Table 22 Pearson correlation analysis on utilization of agricultural extension
services and food security
Variables Food shortage AES is useful AES utility
Food shortage
Pearson Correlation 1
Sig. (2-tailed)
AES is useful
Pearson Correlation .023 1
Sig. (2-tailed) .644
AES utility
Pearson Correlation .039 -.525**
1
Sig. (2-tailed) .436 .000
* Correlation is significant at 0.05 level (2-tailed)
Source: Survey Data 2018
The analysis in Table 22 above revealed a “significant positive relation between
utilization of agricultural extension services and improvement of household’s food
security” (rho=0.623). This means that the “utilization of agricultural extension
services improves household wellbeing through improved agricultural productivity.
There is a statistically significant negative relation between usefulness of the
utilization of Agricultural Extension Services and their level of utilization” (rho=-
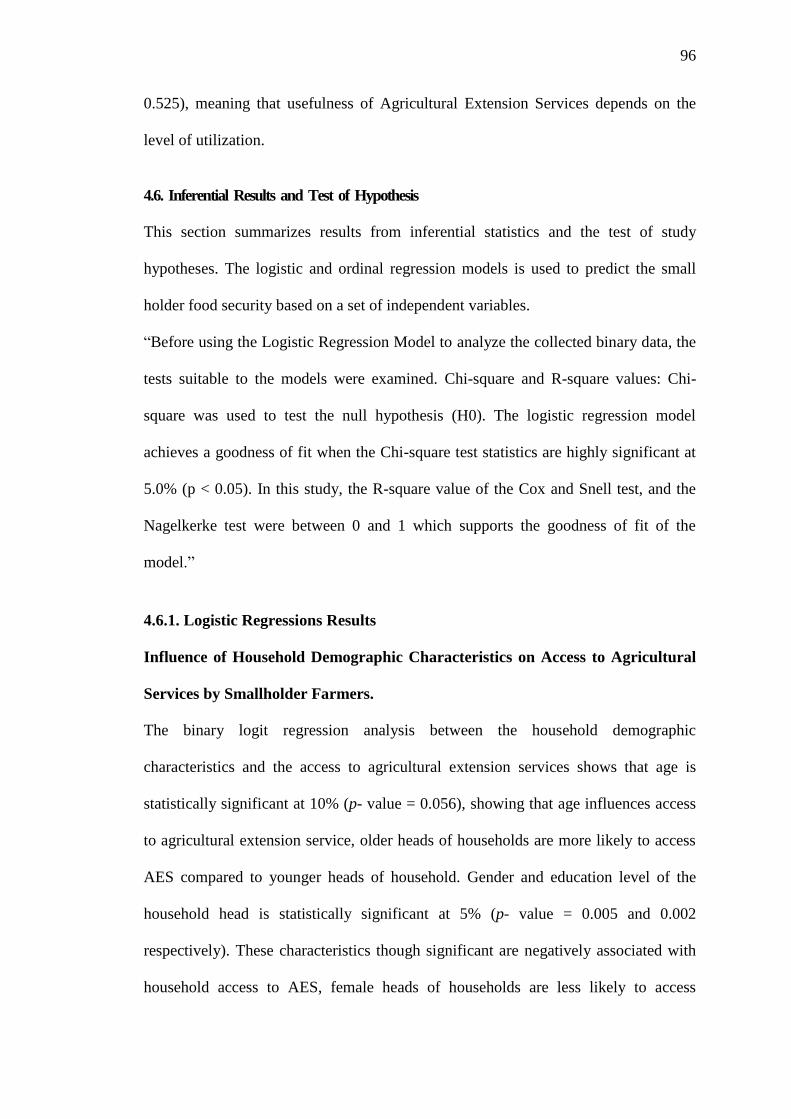
96
0.525), meaning that usefulness of Agricultural Extension Services depends on the
level of utilization.
4.6. Inferential Results and Test of Hypothesis
This section summarizes results from inferential statistics and the test of study
hypotheses. The logistic and ordinal regression models is used to predict the small
holder food security based on a set of independent variables.
“Before using the Logistic Regression Model to analyze the collected binary data, the
tests suitable to the models were examined. Chi-square and R-square values: Chi-
square was used to test the null hypothesis (H0). The logistic regression model
achieves a goodness of fit when the Chi-square test statistics are highly significant at
5.0% (p < 0.05). In this study, the R-square value of the Cox and Snell test, and the
Nagelkerke test were between 0 and 1 which supports the goodness of fit of the
model.”
4.6.1. Logistic Regressions Results
Influence of Household Demographic Characteristics on Access to Agricultural
Services by Smallholder Farmers.
The binary logit regression analysis between the household demographic
characteristics and the access to agricultural extension services shows that age is
statistically significant at 10% (p- value = 0.056), showing that age influences access
to agricultural extension service, older heads of households are more likely to access
AES compared to younger heads of household. Gender and education level of the
household head is statistically significant at 5% (p- value = 0.005 and 0.002
respectively). These characteristics though significant are negatively associated with
household access to AES, female heads of households are less likely to access
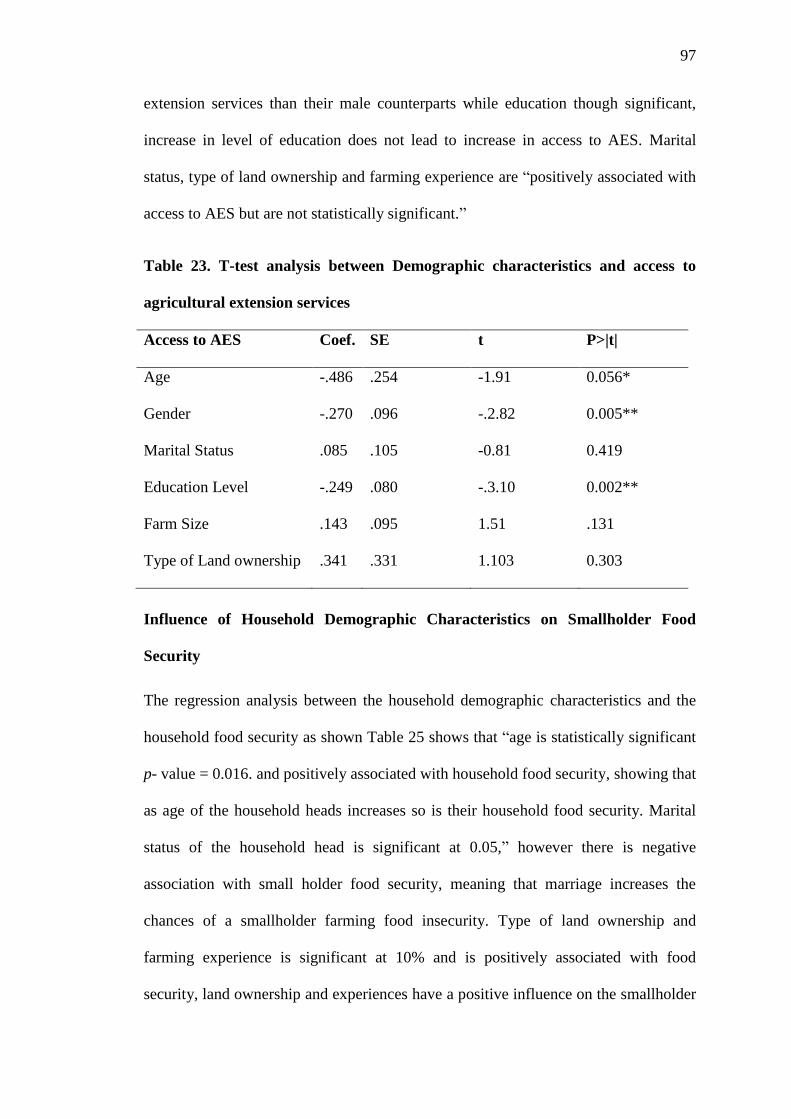
97
extension services than their male counterparts while education though significant,
increase in level of education does not lead to increase in access to AES. Marital
status, type of land ownership and farming experience are “positively associated with
access to AES but are not statistically significant.”
Table 23. T-test analysis between Demographic characteristics and access to
agricultural extension services
Access to AES Coef. SE t P>|t|
Age -.486 .254 -1.91 0.056*
Gender -.270 .096 -.2.82 0.005**
Marital Status .085 .105 -0.81 0.419
Education Level -.249 .080 -.3.10 0.002**
Farm Size .143 .095 1.51 .131
Type of Land ownership .341 .331 1.103 0.303
Influence of Household Demographic Characteristics on Smallholder Food
Security
The regression analysis between the household demographic characteristics and the
household food security as shown Table 25 shows that “age is statistically significant
p- value = 0.016. and positively associated with household food security, showing that
as age of the household heads increases so is their household food security. Marital
status of the household head is significant at 0.05,” however there is negative
association with small holder food security, meaning that marriage increases the
chances of a smallholder farming food insecurity. Type of land ownership and
farming experience is significant at 10% and is positively associated with food
security, land ownership and experiences have a positive influence on the smallholder
98
food security. Gender of the household head, education level and farm size are not
statistically significant.
Table 24. T-test analysis between Demographic characteristics and smallholder
food security
Small holder household
food security
Coefficient. SE t P>|t|
Age .108 .004 2.42 0.016**
Gender .0949 .136 .70 0.487
Marital status -.204 .086 -2.36 0.019**
Education level .0101 .042 .38 0.701
Farm size -.0116 .008 1.40 0.162
Type land ownership .318 .177 1.80 0.073*
Farming experience -.0155 .009 -1.66 0.097*
Constant .142 .446 .032 .749
*Statistical significance at 0.1 level.
N = 397 Source: Survey Data 2018
** Statistical significance at 0.05
level
Influence of Availability, Access, and Utilization of Agricultural extension
Services on Household Food Security
In establishing the relationship between the availability, accessibility, and utilization
of agricultural service to food security by the surveyed smallholder farmers,
awareness of AES, knowledge of where to access the service, frequency of attendance
of AES training and utilization of knowledge gained during the interactions were
analysed. It was found (table 4.19) that farming households who understood where to
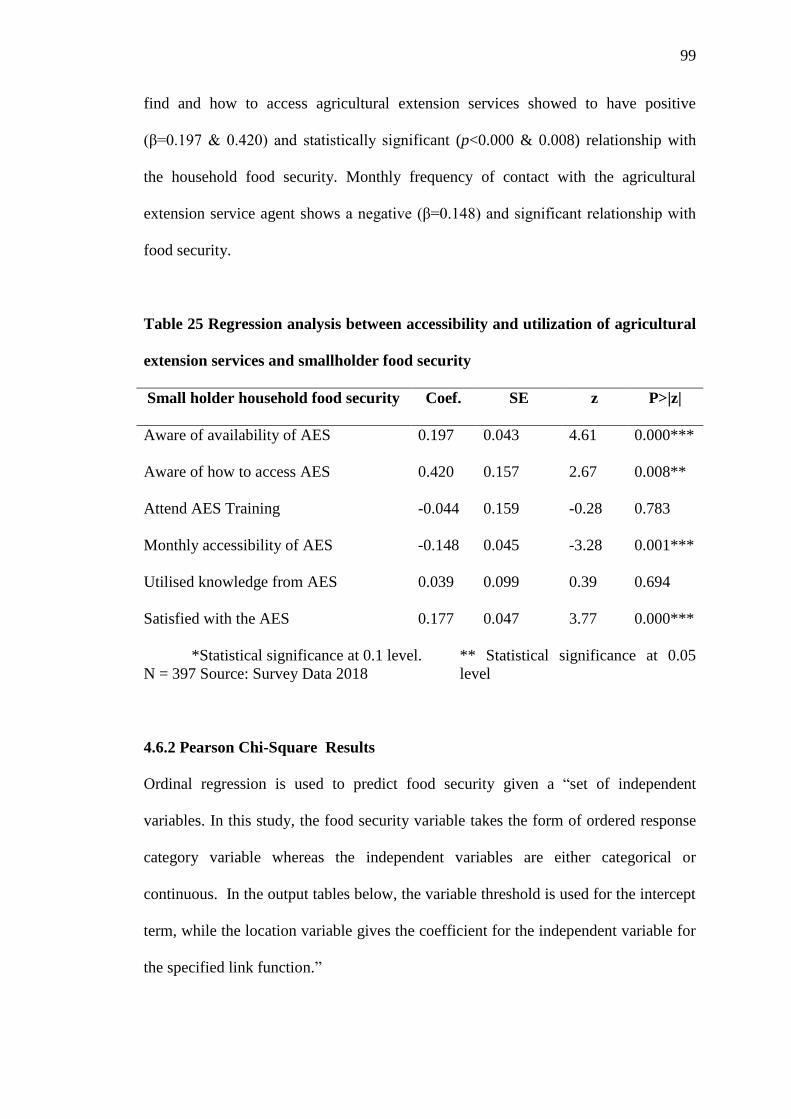
99
find and how to access agricultural extension services showed to have positive
(β=0.197 & 0.420) and statistically significant (p<0.000 & 0.008) relationship with
the household food security. Monthly frequency of contact with the agricultural
extension service agent shows a negative (β=0.148) and significant relationship with
food security.
Table 25 Regression analysis between accessibility and utilization of agricultural
extension services and smallholder food security
Small holder household food security Coef. SE z P>|z|
Aware of availability of AES 0.197 0.043 4.61 0.000***
Aware of how to access AES 0.420 0.157 2.67 0.008**
Attend AES Training -0.044 0.159 -0.28 0.783
Monthly accessibility of AES -0.148 0.045 -3.28 0.001***
Utilised knowledge from AES 0.039 0.099 0.39 0.694
Satisfied with the AES 0.177 0.047 3.77 0.000***
*Statistical significance at 0.1 level.
N = 397 Source: Survey Data 2018
** Statistical significance at 0.05
level
4.6.2 Pearson Chi-Square Results
Ordinal regression is used to predict food security given a “set of independent
variables. In this study, the food security variable takes the form of ordered response
category variable whereas the independent variables are either categorical or
continuous. In the output tables below, the variable threshold is used for the intercept
term, while the location variable gives the coefficient for the independent variable for
the specified link function.”
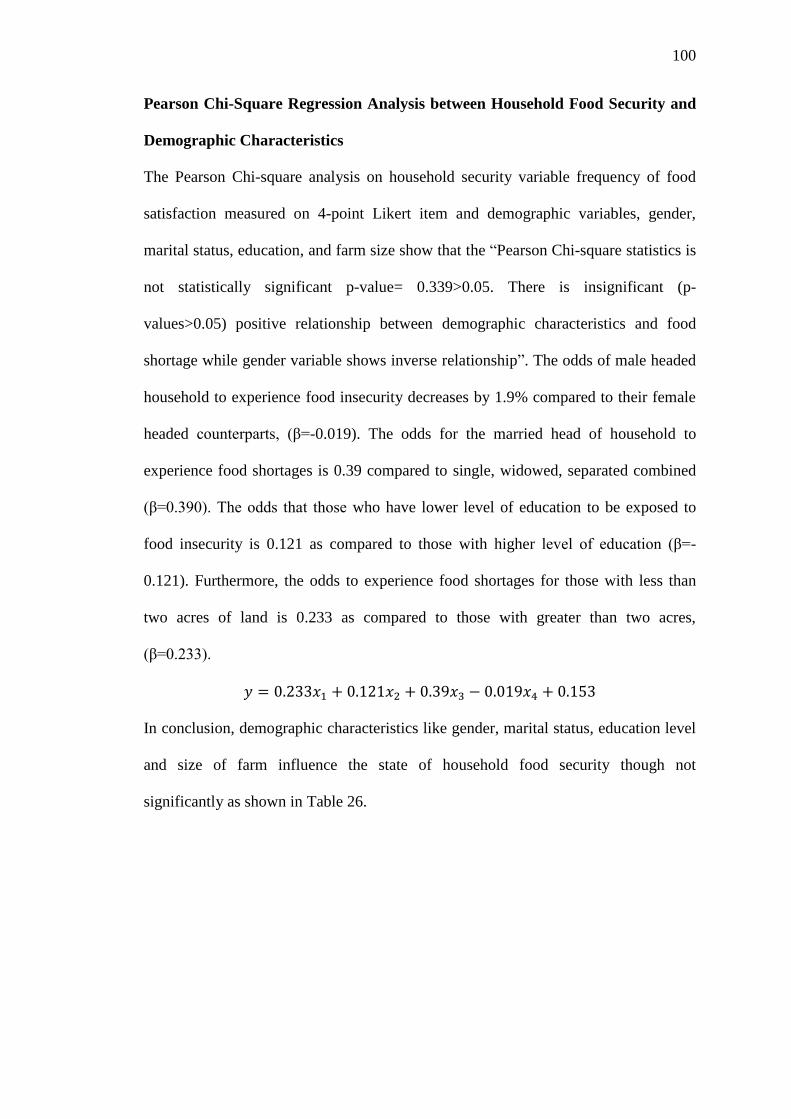
100
Pearson Chi-Square Regression Analysis between Household Food Security and
Demographic Characteristics
The Pearson Chi-square analysis on household security variable frequency of food
satisfaction measured on 4-point Likert item and demographic variables, gender,
marital status, education, and farm size show that the “Pearson Chi-square statistics is
not statistically significant p-value= 0.339>0.05. There is insignificant (p-
values>0.05) positive relationship between demographic characteristics and food
shortage while gender variable shows inverse relationship”. The odds of male headed
household to experience food insecurity decreases by 1.9% compared to their female
headed counterparts, (β=-0.019). The odds for the married head of household to
experience food shortages is 0.39 compared to single, widowed, separated combined
(β=0.390). The odds that those who have lower level of education to be exposed to
food insecurity is 0.121 as compared to those with higher level of education (β=-
0.121). Furthermore, the odds to experience food shortages for those with less than
two acres of land is 0.233 as compared to those with greater than two acres,
(β=0.233).
𝑦 = 0.233𝑥1 + 0.121𝑥2 + 0.39𝑥3 − 0.019𝑥4 + 0.153
In conclusion, demographic characteristics like gender, marital status, education level
and size of farm influence the state of household food security though not
significantly as shown in Table 26.
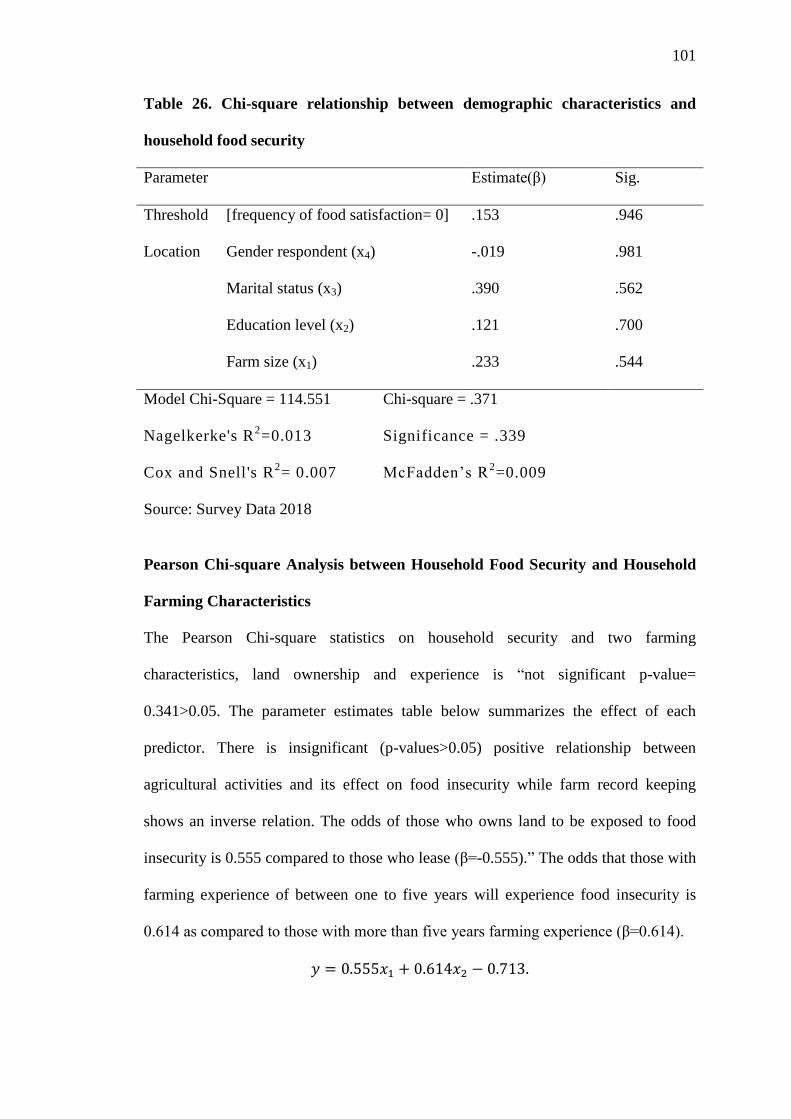
101
Table 26. Chi-square relationship between demographic characteristics and
household food security
Parameter Estimate(β) Sig.
Threshold [frequency of food satisfaction= 0] .153 .946
Location Gender respondent (x4) -.019 .981
Marital status (x3) .390 .562
Education level (x2) .121 .700
Farm size (x1) .233 .544
Model Chi-Square = 114.551 Chi-square = .371
Nagelkerke's R2=0.013 Significance = .339
Cox and Snell's R2= 0.007 McFadden’s R
2=0.009
Source: Survey Data 2018
Pearson Chi-square Analysis between Household Food Security and Household
Farming Characteristics
The Pearson Chi-square statistics on household security and two farming
characteristics, land ownership and experience is “not significant p-value=
0.341>0.05. The parameter estimates table below summarizes the effect of each
predictor. There is insignificant (p-values>0.05) positive relationship between
agricultural activities and its effect on food insecurity while farm record keeping
shows an inverse relation. The odds of those who owns land to be exposed to food
insecurity is 0.555 compared to those who lease (β=-0.555).” The odds that those with
farming experience of between one to five years will experience food insecurity is
0.614 as compared to those with more than five years farming experience (β=0.614).
𝑦 = 0.555𝑥1 + 0.614𝑥2 − 0.713.
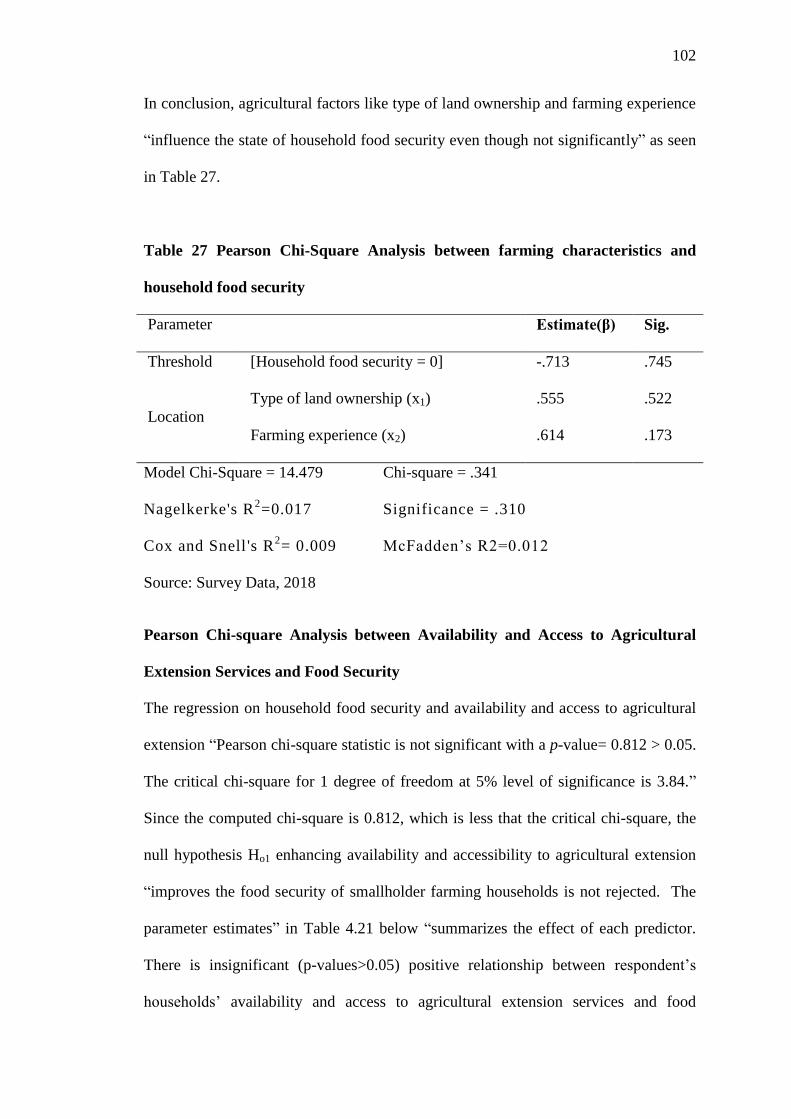
102
In conclusion, agricultural factors like type of land ownership and farming experience
“influence the state of household food security even though not significantly” as seen
in Table 27.
Table 27 Pearson Chi-Square Analysis between farming characteristics and
household food security
Parameter Estimate(β) Sig.
Threshold [Household food security = 0] -.713 .745
Location
Type of land ownership (x1) .555 .522
Farming experience (x2) .614 .173
Model Chi-Square = 14.479 Chi-square = .341
Nagelkerke's R2=0.017 Significance = .310
Cox and Snell 's R2= 0.009 McFadden’s R2=0.012
Source: Survey Data, 2018
Pearson Chi-square Analysis between Availability and Access to Agricultural
Extension Services and Food Security
The regression on household food security and availability and access to agricultural
extension “Pearson chi-square statistic is not significant with a p-value= 0.812 > 0.05.
The critical chi-square for 1 degree of freedom at 5% level of significance is 3.84.”
Since the computed chi-square is 0.812, which is less that the critical chi-square, the
null hypothesis Ho1 enhancing availability and accessibility to agricultural extension
“improves the food security of smallholder farming households is not rejected. The
parameter estimates” in Table 4.21 below “summarizes the effect of each predictor.
There is insignificant (p-values>0.05) positive relationship between respondent’s
households’ availability and access to agricultural extension services and food
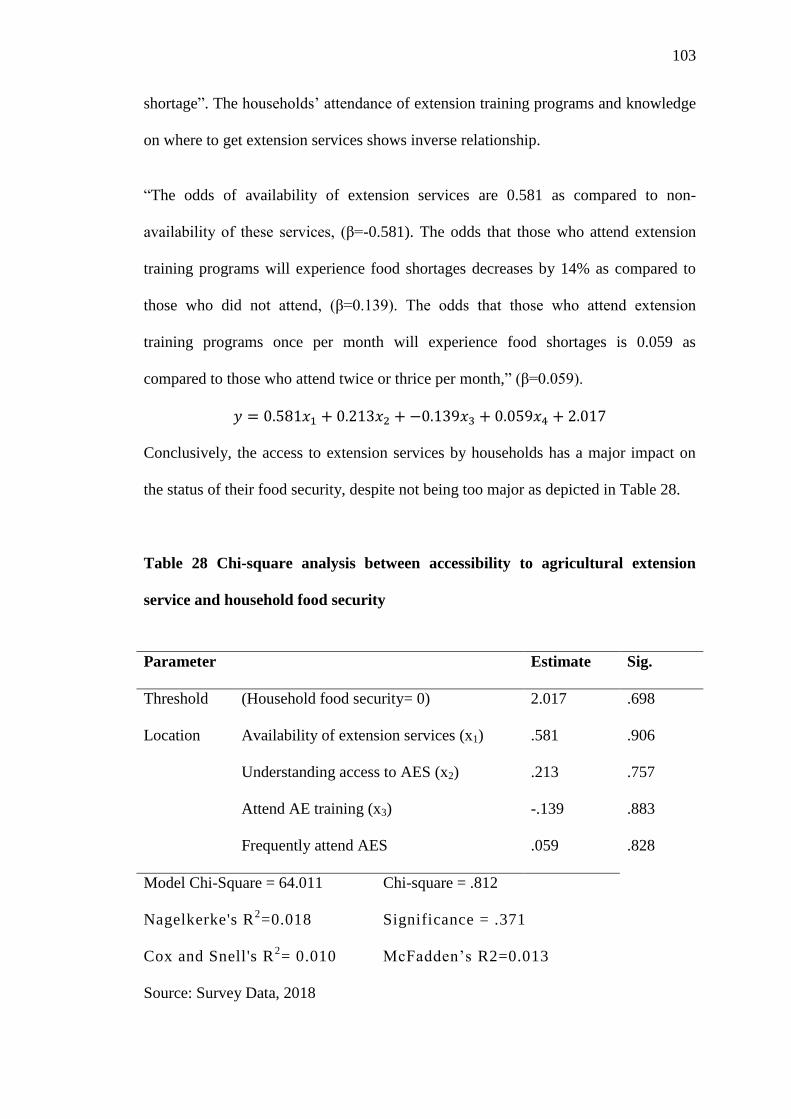
103
shortage”. The households’ attendance of extension training programs and knowledge
on where to get extension services shows inverse relationship.
“The odds of availability of extension services are 0.581 as compared to non-
availability of these services, (β=-0.581). The odds that those who attend extension
training programs will experience food shortages decreases by 14% as compared to
those who did not attend, (β=0.139). The odds that those who attend extension
training programs once per month will experience food shortages is 0.059 as
compared to those who attend twice or thrice per month,” (β=0.059).
𝑦 = 0.581𝑥1 + 0.213𝑥2 +−0.139𝑥3 + 0.059𝑥4 + 2.017
Conclusively, the access to extension services by households has a major impact on
the status of their food security, despite not being too major as depicted in Table 28.
Table 28 Chi-square analysis between accessibility to agricultural extension
service and household food security
Parameter Estimate Sig.
Threshold (Household food security= 0) 2.017 .698
Location Availability of extension services (x1) .581 .906
Understanding access to AES (x2) .213 .757
Attend AE training (x3) -.139 .883
Frequently attend AES .059 .828
Model Chi-Square = 64.011 Chi-square = .812
Nagelkerke's R2=0.018 Significance = .371
Cox and Snell's R2= 0.010 McFadden’s R2=0.013
Source: Survey Data, 2018
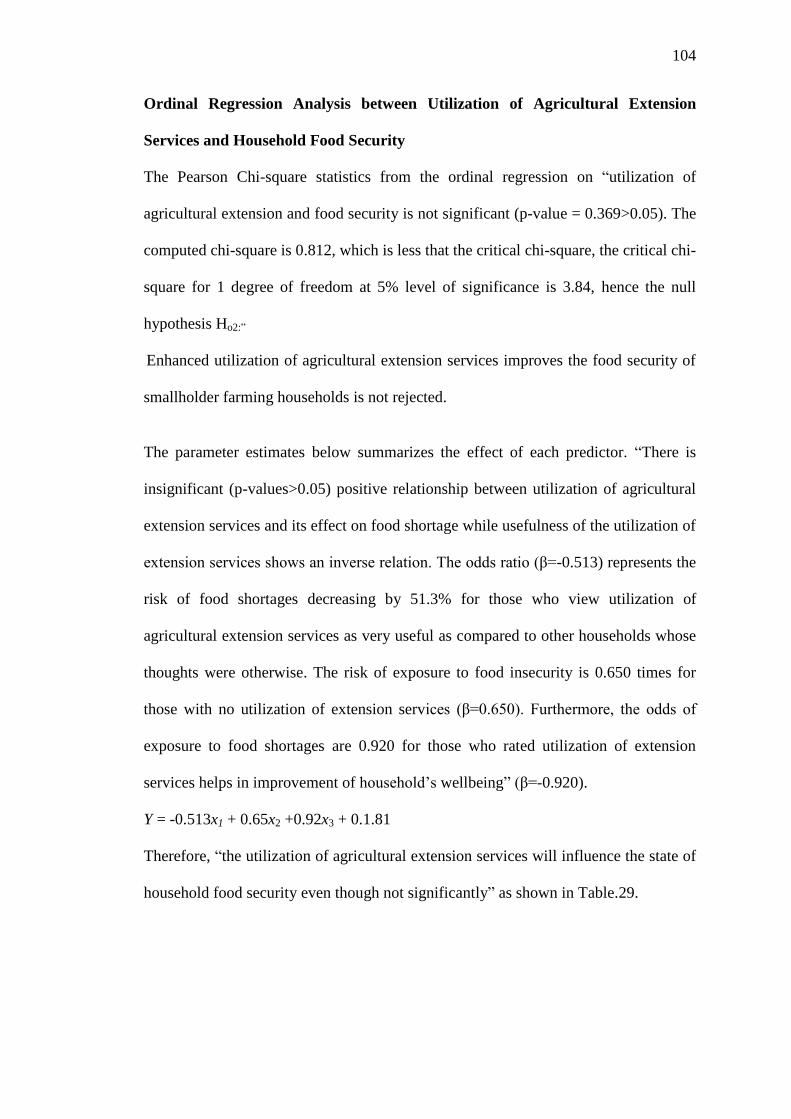
104
Ordinal Regression Analysis between Utilization of Agricultural Extension
Services and Household Food Security
The Pearson Chi-square statistics from the ordinal regression on “utilization of
agricultural extension and food security is not significant (p-value = 0.369>0.05). The
computed chi-square is 0.812, which is less that the critical chi-square, the critical chi-
square for 1 degree of freedom at 5% level of significance is 3.84, hence the null
hypothesis Ho2:”
Enhanced utilization of agricultural extension services improves the food security of
smallholder farming households is not rejected.
The parameter estimates below summarizes the effect of each predictor. “There is
insignificant (p-values>0.05) positive relationship between utilization of agricultural
extension services and its effect on food shortage while usefulness of the utilization of
extension services shows an inverse relation. The odds ratio (β=-0.513) represents the
risk of food shortages decreasing by 51.3% for those who view utilization of
agricultural extension services as very useful as compared to other households whose
thoughts were otherwise. The risk of exposure to food insecurity is 0.650 times for
those with no utilization of extension services (β=0.650). Furthermore, the odds of
exposure to food shortages are 0.920 for those who rated utilization of extension
services helps in improvement of household’s wellbeing” (β=-0.920).
Y = -0.513x1 + 0.65x2 +0.92x3 + 0.1.81
Therefore, “the utilization of agricultural extension services will influence the state of
household food security even though not significantly” as shown in Table.29.
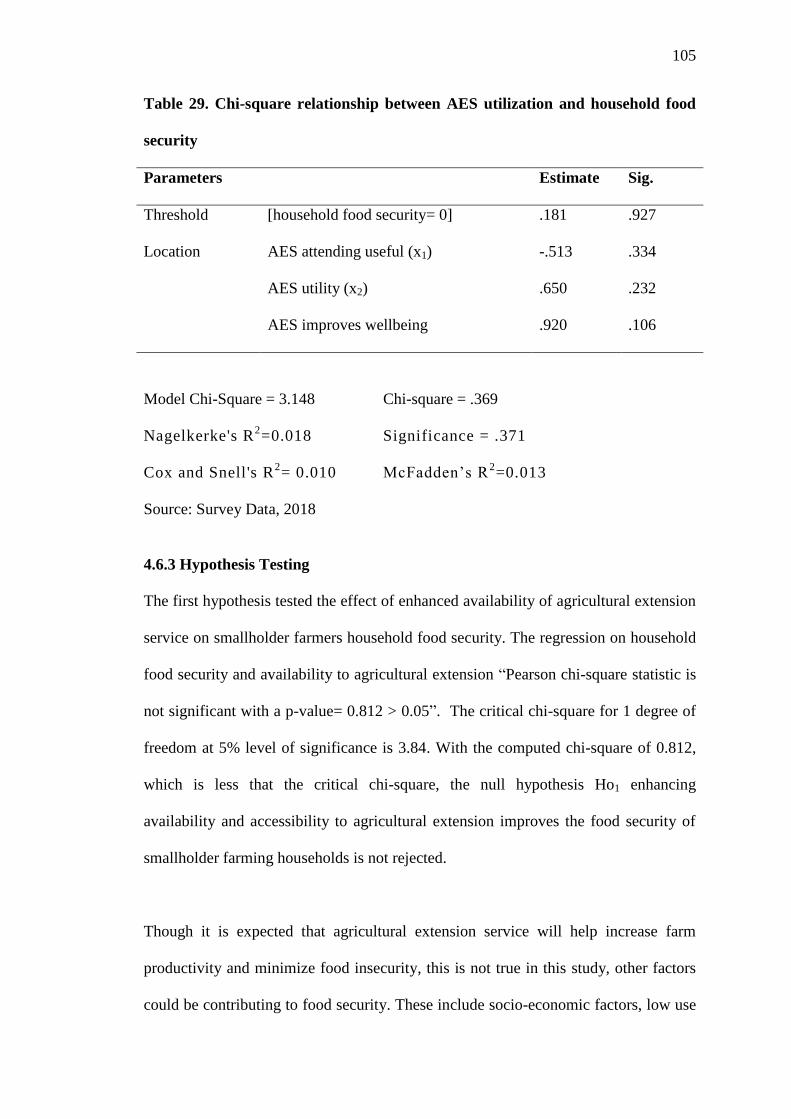
105
Table 29. Chi-square relationship between AES utilization and household food
security
Parameters Estimate Sig.
Threshold [household food security= 0] .181 .927
Location AES attending useful (x1) -.513 .334
AES utility (x2) .650 .232
AES improves wellbeing .920 .106
Model Chi-Square = 3.148 Chi-square = .369
Nagelkerke's R2=0.018 Significance = .371
Cox and Snell's R2= 0.010 McFadden’s R
2=0.013
Source: Survey Data, 2018
4.6.3 Hypothesis Testing
The first hypothesis tested the effect of enhanced availability of agricultural extension
service on smallholder farmers household food security. The regression on household
food security and availability to agricultural extension “Pearson chi-square statistic is
not significant with a p-value= 0.812 > 0.05”. The critical chi-square for 1 degree of
freedom at 5% level of significance is 3.84. With the computed chi-square of 0.812,
which is less that the critical chi-square, the null hypothesis Ho1 enhancing
availability and accessibility to agricultural extension improves the food security of
smallholder farming households is not rejected.
Though it is expected that agricultural extension service will help increase farm
productivity and minimize food insecurity, this is not true in this study, other factors
could be contributing to food security. These include socio-economic factors, low use
106
of technological and environmental factors, limited food production from the low
input use.
Ho2: Enhancing the accessibility to agricultural extension improves the food security
of smallholder farming households. Since the variables: understanding access to
extension services, knowing the extension agent, being a member of farmer group,
frequent attendance to extension trainings, agricultural extension delivery preferred
method and preferred way of getting agricultural information, “are all significant at
1%, we, therefore, reject the null hypothesis that states; Access to agricultural
extension services has no significant effect on smallholder farming household food
security in Uasin Gishu County.”
Ho3: Enhanced utilization of agricultural extension services improves the food security
of smallholder farming households. The “Pearson Chi-square statistics from the
ordinal regression on utilization of agricultural extension and food security show a not
significant (p-value = 0.369>0.05)”. The computed chi-square is 0.369 is less that the
critical chi-square, the critical chi-square for 1 degree of freedom at 5% level of
significance is 3.84, hence the null hypothesis Ho2: Enhanced utilization of agricultural
extension services improves the food security of smallholder farming households is
not rejected. This study focused on the general utilization of agricultural extension
services; it may be that farmers choose to utilize some practices/technologies.
Adoption of technologies is multidimensional; thus, it is essential to study the effects
of multiple technologies as well as control endogenous factors such as household
wealth which has a direct link to household food security.
107
CHAPTER FIVE
DISCUSSIONS
5.1 Introduction
This chapter discusses and synthesises the findings in chapter four. The findings are
interpreted in relation to theoretical and conceptual frameworks and relevant studies.
5.2 Household Demographic and Farm Characteristics of Respondents
The demographic and farm characteristics considered for this study included: age,
gender of the household head, education, farming experience, farm size and farm
ownership. The mean age of the head of household is 38 years, with a range of 20 to
74 years. With only 13% above the age of 55 years, and 41% at the youthful age
(below 35 years) this shows that the respondents are within the productive age. A
study by Ngele et al., (2015) in neighbouring sub county of Moiben in the same
county reported a mean age of 42 years.
Age is a key factor in engagement in farming and general access to information
including “access to agricultural extension service and adoption of technologies. The
age of the household head has a direct relationship with the farming experience.
Farming experience in the study is defined as the time the smallholder farmers has
spent in the farming occupation since she/he started making independent production
decisions”. Sixty-nine of respondents had more than five years farming experience,
with the average age of 38 years, these smallholders’ farmers have had experience in
testing agricultural technologies as disseminated by the AES. Farming experience is a
key factor in agricultural production (Muyanga, 2012). Ainembabazi & Mugisha,
(2014) in a study an “adoption of technology study in Uganda found that the
relationship between adoption of agricultural technologies and farming experience
take the form of an inverted shape in bananas, maize, and coffee, suggesting that
108
farming experience is largely useful in the early stages of adoption, when farmers are
still testing the potential benefits. Farmers then abandon the technology if the benefits
are smaller than the efforts made especially if the technology demand of labour and
larger farm size such as maize”.
Landholding sizes are relatively small with 67% of the sampled households owning
less than five acres with only 12 % owning more than 11 acres. Muyanga in 2013 on
trends on land sizes in Kenya predicted a swift decline of land in the Western
highlands of Kenya from the then average 2.6 hectares. This is attributed to the
“growing populations densities and ensuing land subdivisions, distress land sales as a
result of family financial needs (e.g., education and medical costs) and conversion of
agricultural land at close proximity to urban centres to residential plots gradually
contributing to declining agricultural land” (Muyanga, 2013). This small land holding
has a relationship with the 91% ownership, meaning that the study area is largely
occupied by smallholder farmers who are land constrained, with limited land available
for renting/leasing out.
In determining the interaction between age and land size, the cross tabulations
findings between the two variables shows that majority of respondents across all ages
have land size of five acres and below, meaning that age does not determine land size
in the study area, however respondents between the age 36-45 years have
comparatively smaller land size with 76% of respondents in this age group having less
than five acres.
Seventy eight percent of the respondents were married. Married farmers often feel the
pressure to produce more to cover for the family and also for sale purposes. This
builds the need for more production that results in seeking agricultural information
109
that could also translate to increased household labor. This study did not confirm the
form of ownership whether via inheritance or purchase, A study by the African
Women Studies Centre in 2014 found that “only 20.7 per cent of women in Kenya
own land compared to 43.8 % of men”. The 22% female ownership of land in the
study close to the national average. “Land access and ownership is crucial to gain
security particularly important for women and girls who are heads of households
whether by circumstance or choice.” (African Women Studies Centre, 2014).
Formal education in this study was measured by the highest educational qualification
attained. With 27% of them having attained primary level of education heads and 73%
having secondary and above, we conclude that the respondent had exposure that
enables them to know how to seek for and apply information on improved farm
practices. With the ability to read, the scope of exposure increases through print
media use. Level of education influences access to agricultural knowledge by
respondents.
5.3 Availability of Agricultural Extension Services
Ninety one percent of smallholder households interviewed have access to agricultural
extension services in both sub counties.
The findings reveal “multiplicity of agricultural extension service providers. The main
player is the County Government of Uasin Gishu, whereas others include private
sector, NGOs, and cooperatives”. This finding concurs with Chowa, Garforth, and
Cardey (2013) who confirm that “government led agricultural services are often
supplemented by NGOs and the private sector. Varied extension approaches and
delivery systems were reported They include farmer field schools, training, and visit
(T&V), farmer to farmer and commodity approach in the form of contract farming”.
110
Training and visits accounted for (58%) while 25% represented farmer-to-farmer
approach. “It is not clear from this study if the training and visit reported by the
beneficiaries has the same features as the one initially conceived and promoted by
World Bank which had the extension agent supporting a contact farmer with the
expectation that other farmers would learn from them”.
The agricultural officers reported that “the most common approach used is
demonstrations through field days. In this approach various technologies are
demonstrated in a farm setting” allowing perioding field days for dissemination of the
technologies present at the site. However, participation is often low during field days
especially among women farmers. In a study that evaluated the “effectiveness of
different dissemination pathways in “push-pull” technology in Western Kenya”,
Murage et al., (2011) found that “use of field days was the quickest way to
communicate technology information followed by farmer-trainers”. This implies that
farmers prefer seeing and hearing from their own who have experienced the benefits
of the technology.
Another popular approach is “the farmer to farmer, where information is passed from
farmer to farmer and reinforcing information from field days. Other delivery system
that has been used include farmer field schools, common interest groups, agricultural
shows/ trade fairs and exhibitions.” The most preferred method by the smallholder
farmers in the study areas was demonstration which allows for hands-on experience.
From literature review, we learn from Fischer and Qaim, (2012) that “newer extension
approaches often operate through farmer groups, which can not only increase cost-
effectiveness but also facilitate mutual learning and sharing of experiences among
farmers.”
111
The findings indicate availability of a range of agricultural technologies with majority
of the smallholder reporting higher access to technologies aiming at improving crop
production. Among the technologies delivered in crop production extension service
include improved seed varieties, fertilizer recommendations, and chemicals for weed
and pest management. This is similar to study findings by Loevinsohn et al., (2012)
which reports that “the most common areas of technology development and
promotion for crops include new varieties and management regimes, soil fertility
management and weed and pest management”. It is expected that improved seeds and
inputs will increase the outputs and reduce the “average cost of production, which in
turn results in substantial gains in farm income” (Challa, 2013).
Improved dairy productivity extension service was also available. The main activity
being provision of information aiming for increased production through training on
breeding especially artificial insemination, feed preservation and general dairy animal
care. Other studies report the same technologies as the commonly promoted, a study
in Mosop Sub County in the neighbouring County of Nandi report that extension
service available to dairy farmers comprise of feeding regimes which include “feed
establishment and feed conservation, breeding systems and other technologies such as
record keeping, modern milking parlours, among others”. This study reported low
adoption of the dairy improvement technologies at 30%. Similarly, in this study
though the smallholder farmers recognised the availability of the services there was
low utilization of the technologies.
Other available technologies from the agricultural extension service were poultry,
value addition, market linkages and bee keeping. Poultry mainly included training on
112
feeds, disease control and housing. Poultry extension is critical, there is rising demand
for poultry and eggs influenced by several factors such as population growth and
urbanization coupled with the need for smallholder farmers to diversify and adapt to
climate change. A study by Ochieng (2013) in Western Kenya reported few farmers,
24.2%, adopting and using the good poultry management practices with many
selectively adopting components of the management practices that suit their socio-
economic conditions. Beekeeping was the least available AES in the study area.
Though Kenya is agricultural systems is reported to be most commercialised in sub-
Saharan Africa by World standards, farmer participation is still low, (Chamberlin,
2013). Findings from this study show slightly less than 50% of the respondents were
aware of value addition and market linkages provided as an agricultural extension
service. Kembe & Omondi (2016) findings on a study on market access factors in
Uasin Gishu report that “type of road and distance to market, access to electricity,
access to market conditions, lack of collective organization such as membership to a
cooperative” are some of the factors that affect access to markets. The road network
in the two sub counties is relatively good with relatively more market centres,
therefore this may be factor in low awareness of this service by the extension service
providers as households have access to the market.
There was a negative but “significant relationship between education and access to
agricultural extension services”. The findings by Ainembabazi & J. Mugisha (2012)
and Ugochukwu et al., (2018) also find “that education is not a critical factor in
accessibility and general adoption of agricultural technologies.” This could be
attributed to the fact that people with high education level are likely to engage in other
113
employment that being a full-time farmer and have accessibility to other sources of
information for their agricultural activity.
A study by (Bhatta et al. (2008), stated that “agro-vets and farmers’ cooperatives
have a propensity to offer quality and timely services to farmers. In addition, NGO
staff members had better technical competencies and achieved better results than
public extension officials.”
5.4. Accessibility and Utilizations of Agricultural Extension Services
In the examination of “level of accessibility and utilization of agricultural extension
services by smallholder farming households. The findings show that smallholder
farmers in the study area have high access to agricultural service with 73% having
attended agricultural extensions training with most of them (53%)” having attended at
least once a month.
This research shares that “agricultural extension involves building capacity of
smallholder farmer households in the study area to help them make informed
decisions on food security. However, the effectiveness of agricultural extension
services is highly dependent on the ability and competence of extension agents to
transfer information to the smallholder farmers, and this research focused on
establishing the effects of agricultural extension services on access and utilization of
agricultural knowledge by smallholder farmers.”
Education is positively associated with increased access and utilization of agricultural
extension services. Findings indicated that “all farmers with primary education
mentioned to have been using agricultural extension agents”.
114
and demonstrations in field days as their source of agricultural knowledge. From this
observation, it is expected that higher level of education increases the individual’s
access and utilization of technical information passed on by the extension service
providers and have a high probability of engaging in non-farm related employment
hence can access other agricultural information outside their farming network.
The findings indicated that “more male than female respondents acquired agricultural
extension knowledge for their agricultural activities;” likewise, more male
respondents used agricultural extension knowledge to improve agricultural
production. This gender disparity is reported in other studies, (Doss et al., 2014;
Kiptot et al., 2014; Villarreal 2013), reported that “gender disparities in land access
and ownership affects the ability to reach full potential in agriculture especially for
women”. Some of the barriers to achieving gender equality are existing social and
cultural norms which sets outs their gender roles in agriculture and hence their food
security (Agarwal 2012).
Limited officers, untimely services and lack of awareness of the service among
farming households are some of the issues in extension services. This concurs with
Ong’ayo (2017) who reported “lack of facilitation of agricultural extension officers in
terms of transport” as the main limitation of the extension officer and affects
timeliness and quality of agricultural extension services, all of which hinder farmers’
access to the service.
Other challenges facing agricultural extension services include “limited resources by
extension service officers coupled with the farmers limited knowledge of the demand-
led approach”. A study in Wareng district (now Kesses Sub County) by Kipkurgat &
Tuigong (2015) in the same County, also noted that farmers had limited information
115
on available and extent of extension service. Similar studies in Africa “found that a
major barrier to extension service availability was lack of transport by extension”
(Khaila, et al. 2015 and Mkwambisi et al. 2013). The study revealed that “agricultural
extension activities have high impact (66%) on adoption of new technology”.
Sinkaiye (2005) affirms that “the role of agricultural extension agents is building the
capacity of smallholder farmers and helping them make informed decisions to achieve
better household food security status.”
In addition, “the effectiveness of agricultural extension services is dependent on the
efficacy of agricultural extension agents in disseminating information to the
smallholder farmers”( AL-Sharafat, Altarawneh and Altahat, 2012) . This implies that
“effective agricultural extension is significant towards achieving food security among
smallholder farming households.” (AL-Sharafat, Altarawneh and Altahat, 2012)
5.5. Smallholder Household Food Security Situation
The World Food Summit held in 1996 defined multidimensionality of food security as
“a modified form of food security measurement” this definition has been used in this
research. In practice the assessment used several questions were used to assess the
food security situation among the respondents’ households. These multidimensional
questions captured different aspects of food insecurity. This broad spectrum of
questions allowed for classification of respondents into different categories of food
situations. To avoid the influence of seasonal effects, the state of food security
measurement covered the last 12-months prior to the survey.”
The responses on the series of the questions enabled the categorization of households
into four levels of household food insecurity (access): “food secure, and mild,
moderately, and severely food insecure. Households are categorized as increasingly
116
food insecure as they respond affirmatively to more severe conditions and/or
experience those conditions more frequently. A food secure household experiences
none of the food insecurity (access) conditions, or just experiences worry, but rarely.
A mildly food insecure (access) household worries about not having enough food
sometimes or often, and/or is unable to eat preferred foods, and/or eats a more
monotonous diet than desired and/or some foods considered undesirable, but only
rarely. But it does not cut back on quantity nor experience any of three most severe
conditions (running out of food, going to bed hungry, or going a whole day and night
without eating).”
A moderately food insecure household sacrifices quality more frequently, “by eating a
monotonous diet or undesirable foods sometimes or often, and/or has started to cut
back on quantity by reducing the size of meals or number of meals, rarely or
sometimes. But it does not experience any of the three most severe conditions. A
severely food insecure household has graduated to cutting back on meal size or
number of meals often, and/or experiences any of the three most severe conditions
(running out of food, going to bed hungry, or going a whole day and night without
eating), even as infrequently as rarely”.
The food security indicators used for this study were; “whether the household had to
go a whole day without food (NOFOOD); eat small meals (SMLMEAL); worried that
the household would not have enough food (WORRY); not eat foods they preferred
(PREFER) and ate limited variety of food (LIMVAR)”. From the results, it was
established that “10% of the households surveyed were food insecure in the 12
months prior to the survey, September 2017 to October 2018. Many households
(90%) did not change their consumption patterns in the period with most of them

117
reporting to have taken three meals even though the meals may not necessarily have
been adequate in quality and quantity”.
According to the KDHS, (2014), “food insecurity in the county was at 32%,
characterized by shortage of food at household level, which is mainly prominent in
the months of May to August. Prevalence of stunting is 31.2% while 11.5% of
children under-five are underweight” (KDHS, 2014) “attributable to less diet
diversification due to overdependence on crops such as maize. The national
prevalence of severe food insecurity in the total population was 19% (9.5 million
people) between 2016-2018 while the prevalence of moderate to severe food
insecurity in the total population was 56.5% (28.1 million people).” (FAO 2019)
mainly related to high food prices and income inequalities.
5.5.1 Association between Household Demographic, Farm Characteristics and
Food Security
The household demographic characteristics though significant are negatively
associated with household access to AES. Age significantly and negatively influenced
access to AES. The ordinal regression analysis findings show that higher age and
longer farming experience of the household head increases the probability of a
household being food secure. Farming experience along with skill acquisition are
important for improving farm productivity (Chambo et al., 2007). Other studies
showing a positive association, links the farmers farming experience with increase in
knowledge and skills on improving farmer’s productivity, Agidew (2018) & Kowornu
et al., (2012). However, Amaza (2009) gives a different opinion, that farming
experience can have positive or negative effect, the positive effect would be up to a
118
certain period after which the farming experience may have a negative effect
especially as the farmer ages.
These results are in line with results from a study in Ethiopia by Agidew & Singh
(2018) and another by Bashir et al., (2012) in Pakistan, which reported that “higher
age and farming experience of the household head increases the probability of a
household being food secure. It goes further to conclude that the higher the age of the
household head, the more stable the economy of the household related”. In another
study by Chiputwa et al., (2011), “age had a positive effect on adoption of farm
technologies”. It indicated that older farmers had experience about the benefits of
technology adoption and therefore are quick to adopt when new technologies are
introduced.
More than a third of the households interviewed owned less than five acres of land.
Size of the land influences food security. “Size of land can be considered a proxy for
wealth-related household variables with a direct link to food security.” (Jayne et al.
2016). Study findings in Kihima (2017) in Narok county report that small land
holdings lead to low farm yield, low household’s food availability and low incomes.
Marital status was statistically positively associated with household food security. The
negative association is explained by the fact that marriage increases family size. A
study by Bashir et al., (2012) found that an “increase of one member in the household
decreases the chances of food security by 31% as this increases the dependency ratio
and decreases the chances of food security.”
Land ownership is positively associated with food security. Ownership allows
farming households to make long-term investments to improve farm productivity such
119
as application of soil replenishments and crop rotation. A study carried out by
Muraoka et al., (2014), in Kenya also came up with similar results. They found a
strong positive association between land ownership and food security and that land
productivity tended to be lower for leased plots with farmers making little investment
towards improving the quality of the farm. Whereas land lease markets can be a
solution for poor households to access cultivation spaces, they do not allow rentals for
long-term investments as the right to lease solely lies with the landowner.
Copeland and Guertin (2013) assert that “the right to own, control and access land is
fundamental to both food security and gender equality. Ownership, control and access
to land can ensure that land is used to produce food for household consumption while
the surplus can be sold to provide additional income” for use in meeting healthcare
and other livelihood needs. For women, property ownership “increases their
bargaining power, improves family stability and bolsters household economies. Most
international statutes and national constitutions protect gender equality, especially
with regard to land and other property rights, as well as education and general food
security.” (Copeland and Guertin, 2013)
5.5.2 Association between Availability, Access and Utilization of Agricultural
Extension Services and Smallholder Food Security
From the inferential analysis, it is “observed that those with no utilization of extension
services are 65% likely to be exposed to food insecurity, while the risk of food
insecurity for those who reported extension services being useful decreases by 51.3%
compared to those who think otherwise. These results are similar with other studies
that have reported extension services, though not significant, influence the state of
household food security.”

120
Studies have mixed results on the impact of extension and improved productivity.
They reckon that “extension impacts are difficult to show because of attribution
issues. There are many factors that affect farmer’s agricultural performance leading to
difficulty in quantifying the cause and effect” (Anderson, 2007). Birkhaeuser et al.
(1991) review of extension studies found that “36 studies out of 48 showed
significantly positive effects on knowledge, adoption, and productivity.”
This study showed an “insignificant relationship between availability, access and
utilization of agricultural extension and respondent household food security.”
“Generally, almost all smallholder farmers involved in the study required and
acquired agricultural extension knowledge related to different agricultural activities.
They required capacity and knowledge for value addition to their agricultural produce.
Most smallholder farmers appreciated the fact that the usage of agricultural
knowledge increased agricultural production thus improving their livelihoods. It was
also evident that smallholder farmers are able to evaluate extension services based on
adequacy, availability, and timeliness.”
It is acknowledged that “other multidimensional factors such as household
demographics, high prices of agricultural inputs, diminishing land resources coupled
with poor agricultural practices among others affect food security” (Wachira, 2014 &
Kumba, 2015).
121
CHAPTER SIX
CONCLUSIONS AND RECOMMENDATIONS
6.1 Introduction
This chapter presents the conclusions drawn from the findings of the study and the
recommendations on how the findings obtained can be applied to improve agricultural
extension for improved food security among smallholder farmers.
6.2 Conclusion
With the limited knowledge on the “nature and availability, accessibility and
utilization of agricultural extension services and household food security among small
holder farmers in Uasin Gishu,” the study not only sought to establish the status food
security among small holder farming households, it also established the association
between “household demographic characteristics, availability, accessibility and
utilization of agricultural extension services and household food security” among
small holder farmers.
The household self- assessment of their food security between August 2017-July 2018
(12 months prior to the field survey) shows that only 11% reported to have faced food
insecurity, a similar percnatge of household experiences food security at the national
level.. On the association with household demographic characteristics, the findings
show mixed results, while there are positive relationships between some respondent
demographics specifically land size and ownership, others such as gender and marital
status indicate a negative relationship with household food security.
The smallholder farmers interviewed have general understanding about the
availability of the agricultural extension service, with some of them having accessed
the services through attendance of agricultural dissemination event such as field days
122
and trade affairs. However, the utilization of the knowledge in changing their
agricultural practises is medium. Agricultural extension availability, access and
utilization indicate an insignificant positive relationship to household food security.
Agricultural extension services like improved crop production, dairy improvement,
market linkages, poultry and bee keeping information are all available and provided
mainly by the County Government of Uasin Gishu. Even with the presence of
extension services, few farming households’ access and utilise the extension
information offered. From the study, the researcher observes that application of some
of the extension methods are perceived to be effective by smallholder farmers in the
study area. For instance, regular farm visit is crucial for dissemination of extension
knowledge and should be encouraged. However, visits should be meaningful and have
a purpose in order to have a positive result. In order, for agricultural extension to
achieve results on the household food security of farmers and farming households at
large, there is a need for pluralistic agricultural extension services that apply varied
methods to reach the diverse types of farming households including use of local
community-based agents.
123
6.3 Recommendations
Arising from the study objectives, the findings and conclusion, the research makes the
following recommendations:
To overcome the current the low utilization of AES, the study recommends a model
that allows for adaptive AES. This implies that in “addition to gradual advances in
technology improvements, continuous retraining of experienced farmers is essential
for them to keep updating their farming experiences and to increase the adoption of
improved agricultural technologies. This is particularly important in the framework of
designing and operationalising effective policies for widening the adoption of new
and modern agricultural technologies (AES). “A robust, efficient and effective
extension system should be able disseminate and communicate messages that are
clear, tailored to the varied needs of the audiences and locally relevant.”
Adoption goes beyond simple awareness; farmers should be allowed to try to “make
modifications to match specific on-farm circumstances and receive support during the
trial or when questions arise. This initial adoption stage requires trust and familiarity
in who and how messages are delivered which requires intensive and ongoing
interactions between the extension worker and the farmers.” This interaction is even
more necessary in times when new concepts such as climate-smart and climate
technology adoption are being introduced, which are new concepts and may take long
to comprehend. A trusted extension worker who understands the farmers’ realities
would be best suited to deliver this for adoption and behaviour change to occur. A
proposal to bridge the existing gaps and challenges in extension service would be
strengthening last mile presence of AES via community-based extension agents.
124
The “Ministry of education, collaboration with the County governments, should
consider re-introducing agriculture as a subject to be taught right away from primary
schools as a way of creating awareness among its citizens who will be future farmers
the methods to be used to improve crop yields”. The government, “through the
Ministry of agriculture, should increase funding for agricultural training programmes
to enable the County agricultural officers to equip the training centres with the
physical training facilities, as this will be one of the ways of motivating the farmers to
attend the training programmes.”
6.3.1. Recommendations for Practice: The Community -Based Extension Service
Agents (CESA)
To avoid the generalist agricultural extension services, which sometime fails to
consider the heterogenous and complex biophysical, and socio- economic conditions
of smallholder farmers, the study proposes community-based extension service agents
(CESA) who shall serve as the last mile extension service contact at the village with
linkages to Ward Agricultural Officers (WAOs), and other extension service
providers.
The CESA will be network of self-employed individuals identified from the
community based on a pre-agreed criterion such a level of education, residency in the
community and of good reputation. The selection should be participatory for support
and community acceptance of the CESA’s as legitimate actors. These CESAs will
have a link to the various agencies providing extension services like, government,
private sector and NGOs both in crop and livestock production. These actors will
train, equip and supervise the CESA on their different specialties. The CESA model
has the potential to increase access particularly where there is high demand and low
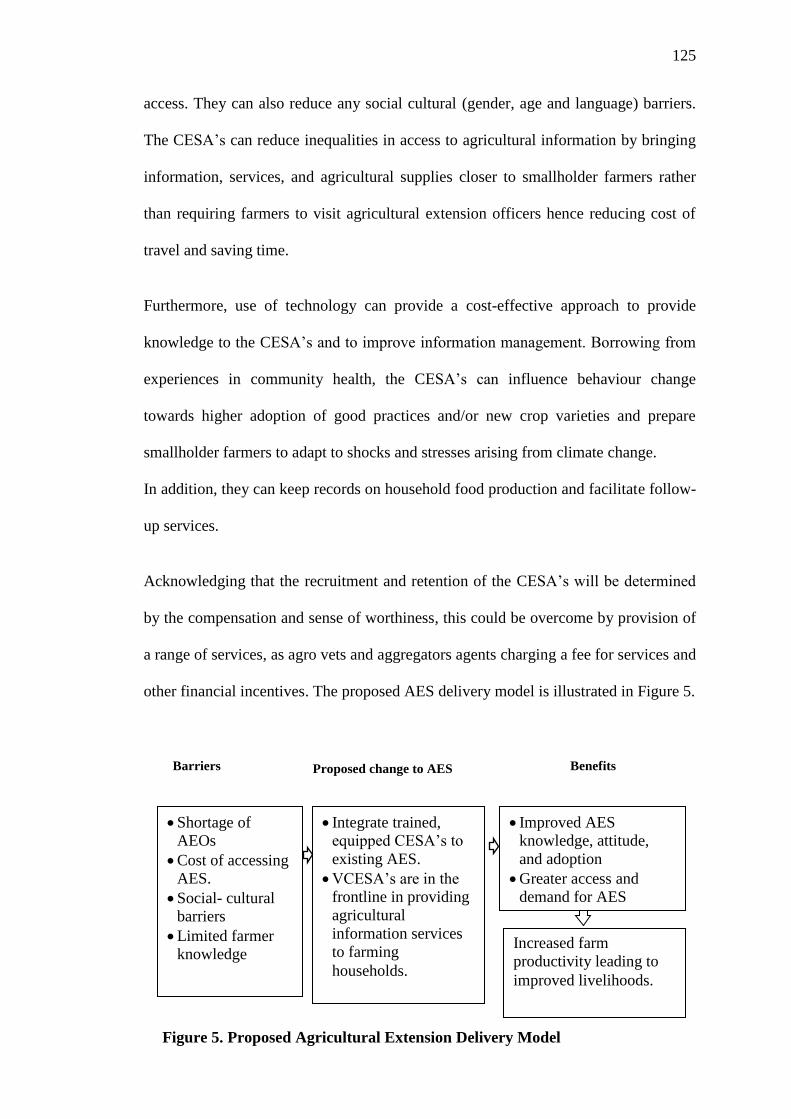
125
access. They can also reduce any social cultural (gender, age and language) barriers.
The CESA’s can reduce inequalities in access to agricultural information by bringing
information, services, and agricultural supplies closer to smallholder farmers rather
than requiring farmers to visit agricultural extension officers hence reducing cost of
travel and saving time.
Furthermore, use of technology can provide a cost-effective approach to provide
knowledge to the CESA’s and to improve information management. Borrowing from
experiences in community health, the CESA’s can influence behaviour change
towards higher adoption of good practices and/or new crop varieties and prepare
smallholder farmers to adapt to shocks and stresses arising from climate change.
In addition, they can keep records on household food production and facilitate follow-
up services.
Acknowledging that the recruitment and retention of the CESA’s will be determined
by the compensation and sense of worthiness, this could be overcome by provision of
a range of services, as agro vets and aggregators agents charging a fee for services and
other financial incentives. The proposed AES delivery model is illustrated in Figure 5.
Barriers
Shortage of
AEOs
Cost of accessing
AES.
Social- cultural
barriers
Limited farmer
knowledge
Integrate trained,
equipped CESA’s to
existing AES.
VCESA’s are in the
frontline in providing
agricultural
information services
to farming
households.
Proposed change to AES Benefits
Improved AES
knowledge, attitude,
and adoption
Greater access and
demand for AES
Increased farm
productivity leading to
improved livelihoods.
Figure 5. Proposed Agricultural Extension Delivery Model
126
Agricultural system strengthening can create an environment of entrepreneurship,
empowering smallholder farmers to solve their own problems and reposition
government and other development actors as facilitators rather than drivers of change.
Farmers should be involved in research, allowing them to set research priorities, to
influence the agenda, and to contribute their indigenous knowledge. This ensures that
interventions address their needs. On the service front, the importance of service
providers cannot be gainsaid, they can strengthen farmers through resource
facilitation- logistical support and continuous training- reaching out to the farmers and
improving their delivery of extension service.
This information on the significance of cooperatives and farmers groups in household
food security is very important, cooperatives and groups ensure that there are
economies of scale in input purchasing, collective marketing of farm produce and
provision of a platform to reach many farmers. From this study, the researcher makes
a recommendation on development and strengthening of policies and interventions
encouraging the participation of farmers in groups and cooperatives as well as
development of strategies to support the growth of cooperatives. In view of the
unexpected active membership of respondents in cooperatives in the study, there is
need to strengthen the farmer cooperatives in the area to make them attractive to the
farming households. Increasing participation in farming cooperatives will make it
easy to organize demand for and access to agricultural service.
Food security can only be enhanced in the study area and other areas by enhancing
knowledge on farming techniques and suitable farming methods. It can also be
achieved by encouraging farmers to diversify their livelihoods and to complement
127
their farming with other non-farm activities in response to the changing climatic
conditions.
6.3.2. Recommendation for Sustainable Agricultural Extension Services for
Food Security
Based on the research findings, for a sustainable agricultural extension service that
can contribute to food security, the following are the suggestions:
a) To enhance the effectiveness of agricultural extension services that recognise
the need for including sustainability into agricultural extension services. If
household food security is to be achieved, farmers resilience to climate change
Embracing sustainable agricultural methods is one way of reducing farmers
dependence on artificial inputs thus less vulnerability to market and climate
changes.
b) To increase access and utilization, extension service providers should involve
all members of the family. Providing information to all adults in household
increases joint decision-making, increases knowledge retention and greater
uptake.
c) To increase availability. The county should increase investment in agricultural
extension service, this is through additional personnel, enhanced their training
in emerging technologies and issues including climate change as well as
enhancing the competence and motivation of the existing ones.
d) To enhance the household food security status, the agricultural extension
services should integrate of food security and nutrition messages into
agricultural extension to maximise the positive role that agriculture plays in
food security.
128
e) To promote youth in agriculture given an aging farming population, promote
youth initiatives including access to agricultural services and finance to
develop their capacity. Facilitate their access to land and other resources to
enable them to engage in agriculture.
f) To make use of developments in the information communication technologies,
embracing use of information technology and other emerging farmer facing
approaches such as use of extension call centres which has the potential to cut
the costs of extension. The world is moving towards a digital economy, big
data and artificial intelligence, digital systems such as automation, robotics is
used to offer mechanised and remote extension service. Digital finance is
increasing financial inclusion in many regions thus facilitating micro-
entrepreneurship. E-commerce platforms are linking smallholder farmers with
national and global markets. Data is very important and dictates what kind of
support and advice farmers require, therefore the country should invest in data
management, analysis and dissemination of information to make decisions that
will increase food security.
6.3.3. Recommendation for Policy
For enhanced adoption of agricultural extension services to achieve food security, the
government should not only invest in the supply side (the extension service providers)
but also understand the farmers’ needs to ensure effectiveness and efficiency in the
use of limited agricultural services.
With the changes in climate and emerging challenges in smallholder farming, policy
interventions are required to push for diversification of livelihoods in the rural areas.
Agricultural policy should consider other factors related to household food security
129
beyond own production and take into consideration other non-farm work to increase
household incomes and ensure food security for smallholder farmers. This could
include policy measures to build household assets in financial and non-farm factors
such as education and infrastructure. This requires concerted efforts across many
stakeholders for a coordinated and integrated approach to build the resilience of
smallholder farmers.
6.4. Areas for Further Research
The research proposes further research in the following areas;
The food security status was measured for a specific point in time (12 months
preceding the survey), it does not consider the variability of the seasons over the
years. Therefore, a study that measures the food security periodically can capture the
varying food security and its relationship with the agricultural cycle.
The study was limited to examining the approaches used and their accessibility but
did not go in-depth to analyse the extent of contact, analysis of extension personnel
capacity and facilities that are available to implement the extension service. This is a
suggestion for further research.
Further research could also examine the process of how extension service is delivered
and assessment of farmer learning and behaviour change, aimed at proposing more
efficient and effective approaches to today’s farmer.
130
REFERENCES
Adams, D., W., Douglas, H. Graham & Von Pischke, J.D. (1984). Undermining
rural development with cheap credit. Washington, D.C.: West view Press.
AAkpo, E., T. Crane, Vissoh, P. V. & Tossou, R. C. (2015). Co-production of
knowledge in multi-stakeholder processes: Analyzing joint experimentation as
social learning. The Journal of Agricultural Education and Extension 21 (4):
369–388.
Abebaw Ejigie, Degnet and Haile, Mekbib, (2013), The impact of cooperatives on
agricultural technology adoption: Empirical evidence from Ethiopia, Food
Policy, 38, issue C, p. 82-91. Retrieved from https://Econ Papers. repec.
org/RePE c: eee: jfpoli:v:38:y:2013:i:c:p:82-91
Anderson, Jock & Feder, Gershon. (2004). Agricultural extension: Good intentions
and hard realities. The World Bank Research Observer. 19.
African Women’s Studies Centre (2014b), Women Experiences on Food Security;
Filling the Granary, Draft Report, University of Nairobi.
Agarwal, B. (2012). Food security, productivity, and gender inequality. IEG Working
no. 320. New Delhi: Institute of Economic Growth.
AGRIINFO. (2015). My agriculture information book. What is agricultural extension?
Retrieved from
http://www.agriinfo.in/default.aspx?page=topic&superid=7&topicid=1440
Ahmed, A.A.T; Filipek, T. & Piotr, S. (2015). The role of agricultural extension in the
transfer and adoption of agricultural technologies. Asian Journal of
Agriculture and Food Sciences. (03).
Ainembabazi J., H & Mugisha, J. (2014) The Role of Farming Experience on the
Adoption of Agricultural Technologies: Evidence from Smallholder Farmers
in Uganda, The Journal of Development Studies, 50:5, 666-
679, DOI: 10.1080/00220388.2013.874556
Ajzen, I., & Madden, T. J. (1986). Prediction of goal directed behavior: Attitudes,
intentions, and perceived behavioral control. Journal of Experimental Social
Psychology. 22, 453-474.
Al-Hemyari, Z. (2018). Re: Is that possible to use Cochran formula (sample size
determination) for heterogeneous groups/populations? Retrieved from:
https://www.researchgate.net/post/Is_that_possible_to_use_Cochran_formula_
sample_size_determination_for_heterogeneous_groups_populations/5b308188
c1c6b18dc33e4557/citation/download.
Alreck, P.L., & Settle, R.B. (2004). The Survey Research Handbook, 3rd Ed. McGraw
Hill Irwin

131
Anderson, J. & Crowder, L. Van. 2000. The present and future of public sector
extension in Africa: contracting out or contracting in public administration
and development. 20, 373-384.
Anderson, J. R. & Feder, G. (2003). Rural extension services. The World Bank,
policy research working paper 2976, Washington, DC; The World Bank, 3-6.
Anderson, J. R., & G. Feder. (2004). Agricultural extension: Good intentions and
hard realities. World Bank Research Observer, 19(1), 112–123.
Anderson, J. R., 2007. Agricultural advisory services. Background paper for World
Development Report 2008. Washington, DC: The World Bank.
Anderson, Jock and Feder, Gershon, (2007). Agricultural extension, ch. 44, p. 2343-
2378 in Evenson, Robert and Pingali, Prabhu eds., Elsevier,
https://EconPapers.repec.org/RePEc:eee:hagchp:5-44 .
Anderson, J.R., Feder, G. and Ganguly, S. (2006). The rise and fall of training and
visit extension: An Asian mini-drama with an African epilogue. World Bank
Policy Research Working Paper no. 3928. Washington, DC, USA: The World
Bank.
Aker, Jenny C., and Isaac M. Mbiti. (2010). "Mobile Phones and Economic
Development in Africa." Journal of Economic Perspectives, 24 (3): 207-32.
Arain, M., Campbell, M. J., Cooper, C. L., & Lancaster, G. A. (2010). What is a pilot
or feasibility study? A review of current practice and editorial policy. BMC
Medical Research Methodology, 10(67). doi: 10.1186/1471-2288-10-67.
Asfaw, S., Kassie, M., Simtowe, F. & Lipper, L. (2012). Poverty reduction effects of
agricultural technology adoption: A micro-evidence from rural Tanzania.
Journal of Development Studies, 48(9), 1288–1305.
Ayele, S., & Wield, D. (2005). Science and technology capacity building and
partnership in African agriculture: perspectives on Mali and Egypt. Journal
of International Development,17(5), 631-646.
Ayele, G., Alemu, D. & Kelemework, F. (2005). The provisions of rural services in
Ethiopia: Characterization, impacts, and farmers’ priorities. Unpublished
manuscript, International Food Policy Research Institute (IFPRI), Washington,
DC.
Bandura, A. (1989). Social Cognitive Theory. In Annals of Child Development. Six
Theories of Child Development, edited by R. Vasta, 1–60. Greenwich, CT:
JAI Press.
Banerjee, A., & Chaudhury, S. (2010). Statistics without tears: Populations and
samples. Industrial psychiatry journal, 19(1), 60–65. Retrieved from
https://doi.org/10.4103/0972-6748.77642
132
Beevi CN, Anshida & Wason, Monika & Beevi CN, Anshida & Wason, Monika &
Padaria, Rabindra. (2018). Gender Sensitivity in Agricultural Extension.
Current science. 115. 10.18520/cs/v115/i6/1035-1036. 18520/cs/v115/i6/1035-
106.
Benin, S., E. Nkonya, G. Okecho, J. Pender, S. Nahdy, S. & Mugarura, et al. (2007).
Assessing the impact of the National Agricultural Advisory Services (NAADS)
in the Uganda rural livelihoods. International Food Policy Res Inst.
BenYishay, A. & Mobarak, A. M. (2013). Communicating with farmers through
social networks.
Birkhaeuser, D., R.E. Evenson & G. Feder. (1991). The Economic impact of
agricultural extension: A Review. Economic Development and Cultural
Change 39:607-650.
Birner, R., Davis, K., Pender, J., Nkonya, E., Ponniah. A., Ekboir, J., Mbabu, A.,
Spielman, D.J., Horna, D., Benin, S. and Cohen, M. (2009). From best practice
to best fit: A framework for designing and analyzing pluralistic agricultural
advisory services worldwide. Journal of Agricultural Education and Extension
15(4):341–355.
Black, R., Kniveton, D. & Schmidt-Verkerk, K. (2011). Migration and climate
change: towards an integrated assessment of sensitivity. Environment and
Planning 43: 431-450.
Black, W.A. (2000). Extension Theory and Practice: A Review. Animal Production
Science. 40. 493-502. 10.1071/EA99083.
Boone, H., Gartin, A., Wright, C., Lawrence, L., & Odell, K. (2002). Adult education
philosophies practiced by agricultural education teachers in Pennsylvania,
Virginia, and West Virginia. Journal of Agricultural Education, 43(3), 37–48.
Burak Güneralp, Shuaib Lwasa, Hillary Masundire4, Susan Parnell and Karen C Seto
(2017). Urbanization in Africa: Challenges and Opportunities for
Conservation. IOP Publishing Ltd
Burchi, Francesco & De Muro, Pasquale. (2016). From food availability to nutritional
capabilities: Advancing food security analysis. Food Policy. 60. 10-19.
10.1016/j.foodpol.2015.03.008
Buttel, F. (1990). The Restructuring of the American Public Agricultural Research
and Technology Transfer System: Implications for Agricultural Extension.
Challa, Merga (2013). Determining Factors and Impacts of Modern Agricultural
Technology Adoption in West Wollega, Munich, GRIN Publishing GmbH. -
modern-agricultural-technology-adoption.
Chambers, Robert. (1989). Editorial Introduction: Vulnerability, Coping and Policy.
IDS bulletin, 20(2): 1–7.

133
Chiputwa B, Langyintuo, A.S, Wall P (2011) Adoption of conservation agriculture
technologies by smallholder famers in the Shamva District Zimbabwe: a Tobit
application. Proceedings of the 2011 meeting of the Southern Agriclutural
Economics Association
Chukwu, R.C (2014). Factors that Attribute to Decrease in Agricultural Production in
Uasin Gishu, Kenya. Journal of Biology, Agriculture and Healthcare.
Collinson, M. (Ed.) (2000) A history of farming systems research. Wallingford, CABI
Publishing and Food and Agriculture Organisation of the United Nations.
County Government of Uasin Gishu, (2018) County Integrated Development Plan
2018-2022
Copeland, F and Guertin, T. (2013), "The Impact of Gender and Land Rights on Food
Security in the Horn of Africa", Civil Military Fusion Centre (CFC)
Cunguara, B., & Moder, K., (2011). Is Agricultural Extension Helping the Poor?
Evidence from Rural Mozambique. Journal of African Economics 20(4), 562-
595.
Davis, D. E. (2008). Extension in Sub-Saharan Africa: Overview and assessment of
past and current models and future prospects. Washington, DC: International
Food Policy Research Institute.
Davis, K.L., & Heemskerk, W.J. (2012). Investment in Extension and Advisory
Services as Part of Agricultural Innovation Systems. Retrieved from
https://doi.org/10.1596%2F9780821386842_CH03
Davis, K., E. Nkonya, E. Kato, D. A. Mekonnen, M. Odendo, R. Miiro, & J. Nkuba
(2012). Impact of farmer schools on agricultural productivity and poverty in
East Africa. World Development 40(2, 413).
Davis, Kristin & Place, Nick. (2003). Current Concepts and Approaches in
Agricultural Extension in Kenya. AIAEE.
Davis, K., & Place, N. (2003). Nongovernmental Organizations as an Important Actor
in Agricultural Extension in Semiarid East Africa. Journal of International
Agricultural and Extension Education 10(1), 31- 36
Dawson, C. (2009). Introduction to Research Methods: A practical guide for anyone
undertaking a research project. How to Books Ltd, 3 Newtec Place, United
Kingdom.
Dercon, S., & Shapiro, J. S. (2007). Moving on, staying behind, Getting Lost: Lessons
on Poverty Mobility from Longitudinal Data. Washington, D.C., and New
York: World Bank and Palgrave Macmillan.
Deschamps-Laporte, J-P. (2013). The impact of extension services on farming
households in Western Kenya: A propensity score approach. Economics
Department, Örebro Business School, Örebro University, Örebro
134
De Schutter, O. (2011). How not to think of land-grabbing: three critiques of large-
scale investments in farmland, The Journal of Peasant Studies, 38:2, 249-
279, DOI: 10.1080/03066150.2011.559008
Diao, X. (2010). Economic importance of agriculture for sustainable development
and poverty reduction: The case study of Ethiopia. Paper presented at the
OECD Global Forum on Agriculture: Policies for Agricultural Development,
Poverty Reduction and Food Security, Paris, 29-30 November 2010.
Dinar, A., (1996). Extension Commercialization: How much to charge for extension
services. American Journal of Agricultural Economics 78(1): 1-12
Dixon, R. M.; Karda, W.; Hosking, B. J.; Egan, A. R.(2003). Effects of oilseed meals
and grain-urea supplements fed infrequently on digestion in sheep. 2. Cereal
straw diets. Anim. Feed Sci. Technol., 110 (1/4): 95-110
Doss, C., Summerfield, G., &Tsikata, D. (2014). Land, gender and food security.
Feminist Economics, 20(1)1-23.
Duflo, Esther, Michael Kremer, & Jonathan R. (2011). Nudging Farmers to Use
Fertilizer: Theory and Experimental Evidence from Kenya.” American
Economic Review, 101(6): 2350–90.
Ember, C.R & Ember M. (2009) Cross-Cultural Research Methods. Altamira press.
Errington, A. J. (1986). The Delegation of Decisions on the farm in Agricultural
Systems, 19, 299-317.
Evans, C.L (2014) Review of Agricultural Extension Interventions in Unlocking
Agriculture Potential through Medium Sized Farms, Kenya. Department of
Agricultural Economics University of Nairobi.
Evenson, E. (2001). Economic impacts of agricultural research and
extension. Handbook of Agricultural Economics, in: B. L. Gardner & G. C.
Rausser (ed.), Handbook of Agricultural Economics, edition 1, volume 1,
chapter 11, pages 573-628 Elsevier
Fan, N. S, Bingxi NYU, Saukra, A (2008) Public Spending in Developing Countries:
Trends, Determination, and Impact. International Food Policy Research
Institute
FAO (2013) Supporting Smallholder Farmers in Africa: A Framework for an
enabling environment. Policy brief/ Paper. Retrieved from
http://www.ruralfinanceandinvestment.org/sites/default/files
FAO, IFAD, UNICEF, WFP, WHO, 2020. The State of Food Security and Nutrition
in the World. Transforming Food Systems to Deliver Affordable Healthy
Diets for All. FAO, Rome.
135
FAO, WFP & IFAD (2012). The State of Food Insecurity in the World-Economic
Growth Is Necessary but Not Sufficient to Accelerate Reduction of Hunger and
Malnutrition. FAO, Rome, Italy.
FAO (2017) Ending Poverty and Hunger by Investing in Agriculture and Rural Areas.
Food and Agriculture Organization of the United Nations: Rome.
FAO (2017) The State of Food and Agriculture. Leveraging Food Systems for
Inclusive Rural Transformation. Rome, Italy.
FAO (2018). The Future of food and agriculture: Alternative Pathways to 2050
FAO (2010). Policies and institutions to support smallholder agriculture. Committee
on Agriculture, 22 Session, Rome.
FAO, IFAD, UNICEF, WFP and WHO. (2019) The State of Food Security and
Nutrition in the World 2019. Safeguarding against economic slowdowns and
downturns. Rome, FAO
Feder, Gershon & Just, Richard & Zilberman, David. (1985). Adoption of Agricultural
Innovations in Developing Countries: A Survey. Economic Development and
Cultural Change. 33. 255-98
Feder, Gershon & Roger, S. (1986). The Impact of Agricultural Extension: The
Training and Visit System in India. The World Bank Research Observer, 1(2):
139–161.
Feder, G. and Slade, R., 1993. Institutional reform in India: The Case of agricultural
extension. The Economics of Rural Organizations, pp.530-542
Fishbein, M. & Ajzen, I. (1975). Belief, attitude, intention, and behavior: An
introduction to theory and research. Reading, MA: Addison-Wesley.
Fu, Fordham, P. (1993). Informal, non-formal and formal education Program.
London: George Williams Press.
Gboku, M., & Lekoko, N.R. (2007). Developing programs for adult learners in
Africa. Hamburg, Germany.
Garforth, C., B. & Angell, et al. (2003). Fragmentation or creative diversity? Options
in the provision of land management advisory services. Land Use Policy 20:
323-333.
Gautam, M. (2000). Agricultural extension: The Kenyan Experience: An impact
evaluation. Washington, DC: The World Bank.
Gautam, Madhur & R. Anderson, Jack. (1999). Reconsidering the Evidence on the
Returns to T&V Extension in Kenya.
https://www.researchgate.net/publication/23549073.
136
Gautam, Y., & Andersen, P., (2016). Rural livelihood diversification and household
wellbeing: Insights from Humla, Nepal. J. Rural Stud. 44, 239–249.
Gebremichael B. A, (2014) The Impact of Subsidy on the Growth of Small and
Medium Enterprises Journal of Economics and Sustainable Development
www.iiste.org ISSN 2222-1700 (Paper) ISSN 2222-2855 (Online) Vol.5,
No.3, 2014
George, D., & Mallery, P. (2003). SPSS for Windows step by step: A simple guide and
reference. (4th ed.). Boston: Allyn & Bacon.
Gerstman, B. (2003). Determining Sample Size. Retrieved from
http://www.sjsu.edu/faculty/gerstman/StatPrimer/sampsize.PDF.
Gillespie, S. (2001). “Health and Nutrition.” In Empowering Women to Achieve Food
Security, Brief 8, edited by A. Quisumbing and R. Meinzen-Dick.
Washington, DC: International Food Policy Research Institute.
Ghadim, A., Pannell, D., & Burton, M., (2005). Risk, Uncertainty, and Learning in
Adoption of Crop innovation. Agricultural Economics 33, 1-9.
Gill, J., & Johnson, P. (2002). Research Methods for Managers, 3rd ed., Sage
Publications, London, United Kingdom.
Glendinning, C. & Challis, David & Fernandez Plotka, Jose-Luis & Jacobs, Sally &
Jones, Kalieo & Knapp, Martin & Manthorpe, Jill & Moran, Nicola & Netten,
Ann & Stevens, Martin & others, & Wilberforce, Mark. (2008). Evaluation of
the individual budgets pilot programme. Social Policy Research Unit,
University of York/Personal Social Services Research Unit, Universities of
Manchester, London School of Economics and Kent/Social Care Workforce
Research Unit, King’s College London.
Graham, John, Shahidur, R. & Mehrab Malek. (2012). Disaster Response and
Emergency Risk Management in Ethiopia. Philadelphia: University of
Pennsylvania Press.
Gravlee, Clarence (2002). Mobile Computer-Assisted Personal Interviewing with
Handheld Computers: The Entry ware System 3.0. Field Methods. 14. 322-
336. 10.1177/1525822X0201400305.
Government of Kenya. (2010). The Constitution of Kenya, 2010
Government of Kenya. (2012). National Agricultural Sector Extension Policy
(NASEP). Agricultural Sector Coordination Unit (ASCU)
Government of Kenya. (2015). Kenya Demographic Health Survey. Retrieved from
https://dhsprogram.com/pubs/pdf/fr308/fr308.pdf
Güneralp, B. Lwasa, S. Masundire, H. Parnell, S. and Seto, C.K. (2017) Urbanization
in Africa: Challenges and Opportunities for Conservation. IOP Publishing
Ltd. Environmental Research Letters, Volume 13, Number 1
137
Taherdoost, Hamed. (2016). Validity and Reliability of the Research Instrument; How
to Test the Validation of a Questionnaire/Survey in a Research. International
Journal of Academic Research in Management. 5. 28-36.
10.2139/ssrn.3205040.
Habtemariam, A. (2007). Targeting extension service and the extension package
approach. Addis Ababa, Ethiopia.
Hardina,D.(2004).Linking citizen participation to empowerment practice. Journal of
Community Practice, 4, 11-38.
Hassen,H.,&Amdisa,T.(1993). Trainers‟ Guide (PP15-36). FAO on Agricultural
Development. Rome: Principles and Methods of Learning.
Houle, C.,O.(2001). The inquiring mind. Madison: University of Wisconsin Press.
Indabawa, S.,&Mpofu, S. (2006). The social context of adult learning in Africa.
Issues in Agricultural Research 14.
Hasan, M., Imai, K. and Sato, T. (2013). Impacts of agricultural extension on crop
productivity, poverty and vulnerability: Evidence from Uganda. Discussion
Paper DP2012-34. Research Institute for Economics and Business
Administration, Kobe University, Japan. Kobe, Japan: Kobe University
Hazell, P. (2011). Five Big Questions about Five Hundred Million Small Farms.
Keynote Paper presented at the IFAD Conference on New Directions for
Smallholder Agriculture, 24-25 January 2011.
Headey, D. D. (2016). The evolution of global farming land: facts and interpretations.
https://doi.org/10.1111/agec.12313
Holland M.B, Shamer, S.Z, Imbach P, Zamora, J.C, Moreno, C.M, Hidalgo, E.J.L,
Donatti, C.I, Martínez-Rodríguez, M.R, Harvey, C.A. (2017). Mapping
adaptive capacity and smallholder agriculture: applying expert knowledge at
the landscape scale. Journal Article published Mar 2017 in Climatic
Change volume 141 issue 1 on pages 139 to 153.
IAASTD. (2009). Agriculture at a crossroads. Global Report. International
Assessment of Agricultural Knowledge, Science and Technology for
Development. Washington DC, Island Press.
IFAD (2012) Smallholders, food security, and the environment. International Fund for
Agricultural Development (IFAD)
IFAD & UNEP. (2013). Smallholders, food security and the environment. Rome
http://www.ifad.org/climate/resources/smallholders_report.pdf.
IFAD. (2011). Proceedings. IFAD Conference on New Directions for Smallholder
Agriculture, 24–25 January 2011. Rome.
138
Ijatuyi, E.J., Mabe, K., & Olusola, O.A. (2017). Factors Affecting the Adoption of
Chemical Use in Yam Storage among Farmers in Orire Local Government
Area of Oyo-State, Nigeria.
Ilbery, B.W (1978) Agricultural decision-making: a behavioural perspective.
Research Article https://doi.org/10.1177/030913257800200303
Ito, J., Bao, Z. Q. Su (2012). Distributional effects of agricultural cooperatives in
China: exclusion of smallholders and potential gains on participation. Food
policy, 37 (6), 700-709
Irz, Xavier & Lin, Lin & Thirtle, Colin & Wiggins, Steve. (2001). Agricultural
Growth and Poverty Alleviation. Development Policy Review. 19. 449 - 466.
10.1111/1467-7679.00144.
Jayne, T.S., Mather, D. & Mghenyi, E. (2010). Principal challenges confronting
smallholder agriculture in sub-Saharan Africa. World Development, 38(10):
1384–1398.
Jayne, T. & Milu, M. (2006). Agricultural Extension in Kenya: Practice and Policy
Lessons. Tegemeo Institute.
Jirstrom, M., Andersson, A. & Djurfeldt, G. (2011). Smallholders caught in poverty –
flickering signs of agricultural dynamism. In African Smallholders: food
crops, markets, and policy. (eds Djurfeldt et al.) London: CABI. Chapter,
4:74-106.
Johnson, J. & Segura-Bonilla, O. (2001). Innovation Systems and Developing
Countries Experiences from the SUDESCA Project, DRUID Working
Papers 01-12, DRUID, Copenhagen Business School, Department of
Industrial Economics and Strategy/Aalborg University, Department of
Business Studies.
Johnston, B.F. & Mellor, J.W. (1961). The role of agriculture in economic
development. American Economic Review, 51: 566–593.
Kabunga, N, Dubois T, Qaim, M (2014). Impact of tissue culture banana technology
on farm household income and food security in Kenya. Food Policy, vol. 45,
issue C, 25-34
Kelemework, F. & Kassa, H. (2006). Assessment of the Current Extension System of
Ethiopia: A Closer Look at Planning and Implementation. Ethiopian
Economic Policy Research Institute (EEPRI). Issue Paper Series No. 2/2006
Kembe, M.A. & Omondi, C.O (2016) The Influence of Market Access Factors on
Commercialization of Smallholder Dairy Value Chain Development in Uasin
Gishu County, Kenya, Urban and Regional Planning. Vol. 1, No. 2, 2016, pp.
23-35.
Khaila, S., Tchuwa, F., Franzel, S. and B. Simpson. (2015). Farmer-to-Farmer
Extension Approach: A survey of lead farmers in Malawi. World Agroforestry
Center Working Paper 189. 2015. Nairobi, Kenya: World Agroforestry Center.
139
Kimaru G. and Jama B. (2006) Improving land management in eastern and southern
Africa: A review of practices and policies. ICRAF Working Paper no. 18.
Nairobi, Kenya. World Agroforestry Centre.
Kipkurgat, T. and Tuigong, D. (2015) Impact of Agricultural Extension on Food
Security among Small Scale Farmers in Wareng District, Kenya. International
Journal of Agricultural Extension and Rural Development Studies Vol.2,
No.1, pp.18-21, July 2015
Kiptot, E., Franzel,s., &Degrande, A. (2014). Gender, agroforestry and food security
in Africa. Current Opinion in Environmental Sustainability, 6 106-109.
Kombo, D. K., & Tromp, D.L.A. (2009). Proposal and Thesis Writing: An
Introduction. Paulines Publications Africa, Don Bosco Printing Press, Nairobi
Kenya
Kosgei, J.K, Ngeno,E.K & Kibett, J.K. (2020). Factors affecting adoption of dairy
cattle milk production technologies in Mosop Sub County, Nandi County,
Kenya. African Journal of Agricultural Research Vol. 15 (1)140-148.
Kondylis, F., Mueller, V. & Zhu, J. (2017). Seeing is believing? Evidence from an
extension network experiment. Journal of Development Economics 125, 1-20.
Kothari, C. (2004). Research Methodology: Methods & Techniques. (2nd edition).
New age International Publishers, New Delhi, India.
Kothari, C.R. (2005). Research Methodology: Methods and Techniques. (2nd edition).
Mumbai.
Land-Bank South-Africa, (2011). Agriculture in South Africa.
Lauzon, A. (2013). From Agricultural Extension to Capacity Development: Exploring
the Foundations of an Emergent Form of Practice. International Journal of
Lifelong Education 32 (2): 247–266.
Larson DF, Otsuka K, Matsumoto T & Kilic T, (2014). Should African rural
development strategies depend on smallholder farms? An exploration of the
inverse-productivity hypothesis. Econ 45 93): 355-367.
Lavrakas, P. (2008). Encyclopedia of Survey Research Methods Vol. 1 & 2. Sage
Publications, Los Angeles, USA.
Leeuwis, C. & vanden Ban, A. (2004). Communication for Rural Innovation:
Rethinking Agricultural Extension. Oxford, Blackwell.
Louis, C., Lawrence, M., & Morrison, K. (2007). Research Methods in Education (6th
edition). Routledge, New York, USA.
Loevinsohn M, Sumberg J, Diagne A (2012) under what circumstances and
conditions does adoption of technology result in increased agricultural
productivity? Protocol. London: EPPI Centre, Social Science Research Unit,
Institute of Education, University of London.
140
Lowder, S. K., Skoet, J., & Raney, T. (2016). The number, size, and distribution of
farms, smallholder farms, and family farms worldwide. World Development,
87, 16–29.
Lowitt, K., Saint- Ville, A, Caroline S. M. Keddy, Leroy E. Phillip & Gordon M.
Hickey (2016) Challenges and opportunities for more integrated regional
food security policy in the Caribbean Community, Regional Studies, Regional
Science, 3:1, 368- 378, DOI: 10.1080/21681376.2016.1209983
Lwoga, E. T., Ngulube, P., & Stilwell, C. (2010). Understanding indigenous
knowledge: Bridging the knowledge gap through a knowledge creation model
for agricultural development. South African Journal of Information
Management, 12(1).
MacCarthy D.S., Kihara J., Masikati P., Adiku S.G.K.(2018) Decision support tools
for site-specific fertilizer recommendations and agricultural planning in
selected countries in Sub-Sahara Africa. Nutr.Cycl.
Agroecosyst. 2018;110,343-359
Mallick, Debdulal & Rafi, Mohammad. (2010). Are Female-Headed Households
More Food Insecure? Evidence from Bangladesh. World Development. 38.
593-605. 10.1016/j.worlddev.2009.11.004.
Manfre C., Rubin D., Allen A., Summerfield A., Colverson K., Akeredolu M., (2013)
Reducing the Gender Gap in Agricultural Extension and Advisory Services:
How to Find the Best Fit for Men and Women Farmers. Meas Brief 2, United
States Agency for International Development, Washington, DC
Manning, L. (2013). A knowledge exchange and diffusion of innovation (KEDI)
model for primary production. British Food Journal, 115(4), 614 – 631.
Marsden, T., Munton, R., Whatmore, S. & Little, J. (1989). Strategies for coping in
capitalist agriculture: an examination of responses of farm families in British
agriculture. Geoforum 20, 114.
Marsh, S.P., Pannell, D.J. & Lindner, R.K. (2000). The impact of agricultural
extension on adoption and diffusion of lupins as a new crop in Western
Australia. Australian Journal of Experimental Agriculture 40(4): 571-583.
Maxwell, D., Coates, J., Vaitla, B (2013). How do different indicators of household
food security Compare? Empirical Evidence from Tigray. Feinstein
International Center Tufts University
Mbo’o-Tchouawou, M. and Colverson, K. (2014). Increasing access to agricultural
extension and advisory services: How effective are new approaches in
reaching women farmers in rural areas? Nairobi, Kenya: International
Livestock Research Institute (ILRI).
McIntyre, B. D., H. R. & Herren, et al., Eds. (2009). Agriculture at a Crossroads.
International assessment of agricultural knowledge, science and technology
for development (IAASTD): global report. Washington, Island Press.
141
Mengoub F. E (2018) OCP Policy Paper. Retrieved from
https://www.policycenter.ma/sites/default/files/OCPPC-PB1802.
Miller, G. J., & Yang, K. (2008). Handbook of Research Methods in Public
Administration. Newyork: Auerbach Publications, Taylor & Francis Group
Modell.
Mintzberg, H., Raisingham, D., Theoret, A. (1976). The structure of 'unstructured'
decision processes. Administrative Science Quarterly 21, 246-275.
Mkwambisi D, Khaila S, Mthinda C, Mulwafu A, Chikowi M. (2013). Baseline Draft
Report for the Agriculture Technology Transfer of the Malawi Agricultural
Sector Wide Approach Support Project (ASWAp-SP). The Millennium Centre
For Research and Development, Malawi.
MoA, & MoLD. (2010). NALEP PHASE II Revised Project Document. Nairobi:
Ministry of Agriculture & Ministry of Livestock Development
Moschitz, H., D. Roep, G. Brunori, & T. Tisenkopfs. (2015). Learning and Innovation
Networks for Sustainable Agriculture: Processes of Co-evolution, Joint
Reflection and Facilitation. The Journal of Agricultural Education and
Extension 21 (1): 1–11.
Mugenda, O. M. & Mugenda, A.G. (2003). Research Methods: Quantitative and
Qualitative Approaches. Nairobi: Acts Press
Murphy, J. (2012).The Contribution of Facilitated Group Learning to Supporting
Innovation Amongst Farmers. Study in Agricultural Economics 114(2):93–98.
Mwangi, J. G., (1998). The role of extension in the transfer and adoption of
agricultural technologies. Journal of International Agricultural and Extension
Education, 5:1-7.
Murphy, S. (2010). Changing perspectives: Small-scale farmers, markets and
globalization. Hivos Knowledge Programme Report. Retrieved from
http:// www.hivos.net/Hivos-Knowledge Programme/Publications2/ Changing
Perspectives- small-scale-farmersmarkets-and- Globalization.
Muyanga C.M (2013). Smallholder agriculture in the context of increasing population
densities in rural Kenya. Michigan State University
Ngele, J. M, Arusei. E, & Saina. C, (2015). Socio-Economic Factors Influencing
Farmers’ participation in Demand driven extension services among small scale
farmers: A Case of National agriculture and livestock extension programme
(NALEP) In Moiben, Uasin Gishu County, Kenya.
http://www.allsubjectjournal.com/download/1183/126.1.1.pdf
Niles, Meredith & Brown, Molly. (2017). A multi-country assessment of factors
related to smallholder food security in varying rainfall conditions. Scientific
Reports. 7. 10.1038/s41598-017-16282-9
142
Ochieng, J., Owuor, G. & Bebe, B.O. (2013). Management practices and challenges
in smallholder indigenous chicken production in Western Kenya. Journal of
Agriculture and Rural Development in the Tropics and Subtropics. Vol.114
No.1 (2013) 51-58
Ugochukwu, Albert & Phillips, Peter. (2018). Technology Adoption by Agricultural
Producers: A Review of the Literature. 10.1007/978-3-319-67958-7_17.
Orasanu, J., Connolly, T., (1993). The reinvention of decision making. In: Klein,
G.A., Orasanu, J., Calderwood, R., Zsambok, C.E. (Eds.), Decision Making in
Action: Models and Methods. Ablex Publishing Corp., Norwood, New Jersey.
Orodho, A. J. (2003). Essentials of Educational and Social Science Research Method.
Nairobi: Masola Publishers.
Orodho AJ, Kombo DK (2002). Research methods. Nairobi. Kenyatta University,
institute of open learning.
Owens, T., J. Hoddinott, J. & Kinsey, B. (2003). The Impact of Agricultural Extension
on Farm Production in Resettlement Areas of Zimbabwe. Economic
Development and Cultural Change 51:337-357.
Pan, Yao & Smith, Stephen & Sulaiman, Munshi. (2018). Agricultural Extension and
Technology Adoption for Food Security: Evidence from Uganda. American
Journal of Agricultural Economics, 100. 10.1093/ajae/aay012.
Parahoo, K. (1997). Nursing research: principles, process and issues. Basingstoke:
Macmillan.
Parviz Koohafkan, Miguel A. Altieri & Eric Holt Gimenez (2012) Green Agriculture:
foundations for biodiverse, resilient and productive agricultural
systems, International Journal of Agricultural Sustainability,10:1, 61-
75, DOI: 10.1080/14735903.2011.610206
Perraton, H. (2012). Theory, evidence and practice in open and distance learning.
University of Oldenburg, Center for Lifelong Learning (C3L).
Phuong, Nguyen-Hoang, and Yinger, John, (2011), The capitalization of school
quality into house values: A review. Journal of Housing Economics, 20, issue
1, p. 30-48, https:// Econ Papers repec.org/RePE c:eee:jhouse:v:20:
y:2011:i:1:p:30-48.
Polit, D., & Beck, C. (2003). Nursing Research: Principles & Methods. (7th Edition)
Lippincott, Williams & Wilkins, United States of America.
Purcell, D. L., & Anderson, J. R. (1997). Agricultural extension and research:
Achievements and problems in national systems. Washington, DC: The World
Bank.
Qamar, M.K. (2000). Agricultural extension at the turn of the millennium: trends and
challenges. In: Human resources in agricultural and rural development.
Qamar, M. K (Ed). Ch. 14.
143
Ragasa, C. & Mazunda, J. (2018). The impact of agricultural extension services in the
context of a heavily subsidized input system: The case of Malawi. World
Development, Elsevier, vol. 105(C), pages 25-47.
Rapsomanikis, George. (2015). The economic lives of smallholder farmers.
10.13140/RG.2.1.3223.9440.
Raidimi, E. N., & Kabiti, H. M. (2017). Agricultural extension, research, and
development for increased food security: the need for public-private sector
partnerships in South Africa. South African Journal of Agricultural
Extension 45(1),49-63. https://dx.doi.org/10.17159/2413-
3221/2017/v45n1a414).
Republic of Kenya (2004). Strategy to Revitalize Agriculture. Ministry of Agriculture;
Ministry of Livestock and Fisheries Development; and Ministry of
Cooperative Development. Nairobi.
Richard E. Petty Duane T. Wegener Leandre R. Fabrigar (1997) Attitudes and
Attitudes Change. Annual Review of Psychology 1997 48:1, 609-647
Rivera, W. M., Qamar, M. K., & Crowder, L. V., (2001). Agricultural and rural
extension worldwide: Options for institutional reform in developing countries.
United Nations: Rome: FAO.
Rivera, W.M, Qamar. M. K. (2003). Agricultural Extension, Rural Development and
the Food Security Challenge. Rome: FAO, Extension, Education and
Communication Services.
Rogers, C. R. (1986). Carl Rogers on the development of the person-centered
approach. Person-Centered Review, 1(3), 257-259.
Rogers, E. (1962). Diffusion of Innovations. New York, Free Press.
Rogers, E.M. (1995) Diffusion of innovations Everett M. Rogers--4th ed. The Free
Press A Division of Simon & Schuster Inc.
Rogers, E.M., Scott, K.L. (1997). The diffusion of Innovations Model and Outreach
from the National Network of Libraries of Medicine to Native American
Communities. Draft paper prepared for the National Network of Libraries of
Medicine, Pacific Northwest Region, Seattle, USA.
Roling, N. (1988). Extension science: Information systems in agricultural and
development. Cambridge University Press, Cambridge, UK.
Salami, A., Abdul, K. & Zuzana, B. (2010). Smallholder Agriculture in East Africa:
Trends, Constraints and Opportunities. No. 105 of Working Papers Series.
Tunis, Tunisia: African Development Bank.
Scarborough, V., Killough, S., Johnson, D.A. & Farrington, A. (1997). Farmer-Led
Extension. Concepts and Practices, Intermediate Technology Publications.
Overseas Development Institute, London.
144
Schunk, D. H., & E. L. Usher. (2012). Social Cognitive Theory and Motivation. In
the Oxford Handbook of Human Motivation, edited by R. M. Ryan, 13–27.
Oxford: Oxford University Press.
Schwab, D. (2005). Research Methods for Organizational Studies. (2nd ed).
Lawrence Erlbaum Associates, London, United Kingdom.
Sekaran, U & Bourgie. (2010). Research Method of Business: a Skill Building
Approach (7th Edition). New York, NY: John Willey & Sons, Inc.
Sekaran, U. (2003). Research Methods for Business: A Skill-Building Approach. (4th
Edition) John Wiley & Sons, New York.
Sewell, A. M., A. M. St George, & Cullen, J. (2013). The Distinctive Features of
Joint Participation in a Community of Learners. Teaching and Teacher
Education 31: 46–55.
Sewell, A. M., D. I. Gray, H. T. Blair, P. D. Kemp, P. R. Kenyon, S. T.& Morris, B.
A. Wood. (2014). Hatching new Ideas about Herb Pastures: Learning
Together in a Community of New Zealand Farmers and Agricultural
Scientists. Agricultural Systems 125: 63–73.
Shiferaw, G., Obare, G. & Muricho. (2008). Rural market imperfections and the role
of institutions in collective action to improve markets for the poor. National
Resource Forum, 32 (1) (2008), 25-38.
Simon, H.A., (1965). The Shape of Automation. Harper and Row, New York.
Solı´s, D., Bravo-Ureta, B.E. & Quiroga, R.E., (2008). Technical Efficiency among
Peasant Farmers Participating in Natural Resource Management Programmes
in Central America. Journal of Agricultural Economics, 60 (1): 202–219.
Solis M.P, Gil-Gonzalez D, Alvarez-Dartet C, & Ruiz- Cantero M. T (2008). Political
and social context of not attaining the Millennium Development Goal to
reduce poverty. SciELO - Scientific Electronic Library Online
Spielman, David & Ekboir, Javier & Davis, Kristin. (2008). An innovation systems
perspective on strengthening agricultural education and training in sub-
Saharan Africa. Agricultural Systems. 98. 1-9. 10.1016/j.agsy.2008.03.004.
Strong, E., J. Rowntree, K. Thurlow, & R. Raven. 2015. The Case for a Paradigm
Shift in Extension from Information-Centric to Community-Centric
Programming. Journal of Extension 53 (4): 1–3.
Swanson, B. E. (2008). The changing role of agricultural extension in a global
economy, Seminar Article Series, 13(3), 5–17.
145
Swanson, Burton E. ; Rajalahti, Riikka. (2010). Strengthening Agricultural Extension
and Advisory Systems: Procedures for Assessing, Transforming, and
Evaluating Extension Systems. Agriculture and Rural Development Discussion
Paper; No. 45. World Bank, Washington, DC. © World Bank. Retreived from
https://openknowledge.worldbank.org/handle/10986/23993 License: CC BY
3.0 IGO.”
Swanson & Rajalahti, 2010). Low technology adoption rates is linked to persistently
low agricultural extension and productivity. World Bank,.
Swinnen, J.F. and Maertens, M. (2007) Globalization, Privatization, and Vertical
Coordination in Food Value Chains in Developing and Transition Countries.
Agricultural Economics, 37, 89-102. Retrieved from
https://doi.org/10.1111/j.1574-0862.2007.00237
Tandi Lwoga, E., Stilwell, C. and Ngulube, P. (2011). Access and use of agricultural
information and knowledge in Tanzania. Library Review, Vol. 60 No. 5, pp.
383-395. https://doi.org/10.1108/00242531111135263
Thompson, Lyndal-Joy. (2009). A farmer-centric approach to decision-making and
behaviour change: unpacking the 'black-box' of decision- making theories in
agriculture.
Udry, C. (1996). Gender, Agricultural Production, and the Theory of the Household.
Journal of Political Economy, University of Chicago Press,104(5), 1010-46.
Udry, Christopher. (2010). The Economics of Agriculture in Africa: Notes toward a
Research Program. African Journal of Agricultural and Resource Economics
5(1): 284–299.
Uganda Bureau of Statistics. (2010). Statistical Abstract. Uganda Bureau of Statistics,
Kampala, Uganda.
Umali-Deininger, D. (1997) Public and Private Agricultural Extension: Partners or
Rivals? The World Bank Research Observer, Volume 12, Issue 2, August
1997, Pages 203–224, https://doi.org/10.1093/wbro/12.2.203
United Nations Environmental Programme, ((2011). Indigenous Knowledge in Africa.
Retrieved from http://www.unep.org/ik/.
Van Campenhout B, Vandevelde S, Walukano W, Van Asten P (2017) Agricultural
Extension Messages Using Video on Portable Devices Increased Knowledge
about Seed Selection, Storage and Handling among Smallholder Potato
Farmers in Southwestern Uganda. PLoS ONE 12(1): e0169557.
https://doi.org/10.1371/journal.pone.0169557
van de Ven, G., de Valença, A., Marinus, W., de Jager, I., Descheemaeker, K.,
Hekman, W., Mellisse, B.T., Baijukya, F., Omari, M., Giller, K.E., 2020.
Living income benchmarking of rural households in less-developed countries.
Food Sec. https://doi.org/10.1007/s12571-020-01099-8.
146
Van den Ban, A. W., & Hawkins, H. S. (1996). Agricultural extension (2nd edition).
Malden,MA: Blackwell.
Vanlauwe, Bernard & AbdelGadir, A. & Adewopo, Julius & adjei-nsiah, Samuel &
Ampadu-Boakye, T & Asare, Richard & Baijukya, Frederick & Baars, Edward
& Bekunda, Mateete & Coyne, D & Dianda, Mahamadi & Nguezet, Paul
Martin & Ebanyat, Peter & Hauser, S. & Huising, Jeroen & Jalloh, Abdulai &
Jassogne, Laurence & Kamai, N & Kamara, Alpha & Mutsaers, Henk. (2017).
Looking back and moving forward: 50 years of soil and soil fertility
management research in sub-Saharan Africa. International Journal of
Agricultural Sustainability. 15. 10.1080/14735903.2017.1393038.
Villarreal, M. (2013. Decreasing gender inequality in agriculture. Key to eradicating
hunger. Brown Journal of World Affairs, 20(1).
Vorley, B., Cotula, L., and Chan, M. K. (2012). Tipping the balance: policies to shape
agricultural investments and markets in favour of small-scale farmers. Oxfam
Policy Practice. 9, 59–146. doi: 10.21201/2012.2288
Waddington, H., White, H. & Anderson, J. (2014). Farmer Field schools: From
agricultural extension to adult education. Systematic review summary.
Walker S., Thomas & Boughton, Duncan & Tschirley, David & Pitoro, Raul & Tomo,
Alda. (2006). Using Rural Household Income Survey Data to Inform Poverty
Analysis: An Example from Mozambique. Department of Agricultural
Economics, Michigan State University East Lansing, MI 48824, USA
Wiggins, W., Argwings-Kodhek, G. Leavy, J and Poulton, C. (2011). Small farm
commercialisation in Africa: Reviewing the issues. Futures Agricultures
Wiggins, S. and Hazell, P. (2011) Access to rural non-farm employment and
enterprise development. Background Paper for the IFAD Rural Poverty
Report.
Wossen T, Abdoulaye T, Alene A, Feleke S, Menkir A, Manyong V. (2017).
Measuring the impacts of adaptation strategies to drought stress: The case of
drought tolerant maize varieties. J Environ Manage. 2017 Dec 1 ;203(Pt 1)
:106-113. doi: .1016/j.jenvman.2017.06.058. Epub 2017 Aug 3
World Bank (2006) Mozambique Agricultural Development Strategy Stimulating
Smallholder Agricultural Growth . World Bank Report.
World Bank. (2008). Agriculture for Development. World Bank Report.
World Bank. 2017. Kenya -Climate Smart Agriculture Project. Washington, D.C.:
World Bank Group.
http://documents.worldbank.org/curated/en/440241486868444705/Kenya-Climate-
Smart-Agriculture-Project
147
Wossen, T. Berger, S. & Di Falco (2015). Social capital, risk preference and adoption
of improved farmland management practices in Ethiopia Agric.
Econ., 46 (2015), 81-97
Zaraté, P. (2013). Tools for Collaborative Decision-Making. John Wiley
Zhou, Y. (2015). Private Sector Extension—Synthesis of the Case Studies.
DOI: 10.1016/B978-0-12-802231-3.00014-0 In book: Knowledge Driven
Development, pp.253-267
Zijp, W. (1998). Improving the Transfer and Use of Agricultural Information: A
Guide to Information Technology. Washington, DC: The World Bank,
Discussion Paper.
Zikmund, G.W., Babin, B.J., Carr, C.J.& Griffin, M. (2010). Business Research
Methods (8th ed.) South-Western, Cengage Learning
Zwane, E. M., (2012). Does extension have a role to play in rural development?
S.Afr. J. Agric. Ext., 40: 16-24.
148
APPENDIXES
Appendix I. Introduction Letter
To: TO WHOM IT MAY CONCERN
Date: 3rd July 2018
RE: Information on PhD Data Collection Exercise by Caroline Toroitich
Ms. Caroline Toroitich (Admission Number AGR/PhD/2013/13) is a PhD student at
the School of Agriculture and Biotechnology in the University of Eldoret. She is
carrying out a survey on “Examining the Nexus between Agricultural Extension
Services and Food Security among Small-Holder Farming Households in Uasin
Gishu County, Kenya”. This study aims at examining how availability, access and
utilization of agricultural extension services affect smallholder farming household’s
food security. The student is required to collect data from a sample of small holder
households in of Sugoi, Kaptebee and Ngenyilel in Turbo Sub County and Soy,
Kipsomba and Barsombe in Soy Sub County
The purpose of this letter is to introduce the student and inform you that she will be
seeking to interview with some County Officers at the Sub County and Ward Level.
Please be assured that names of interviewees will not be revealed in the resultant
research report. If you have any further inquiries, questions or concerns about this
study, please feel free to contact the principal investigator on mobile number
indicated below.
Please provide her with the support she may need. Do not hesitate to contact us in
case of any questions.
Sincerely,
Caroline Toroitich
PhD Student
University of Eldoret
149
Appendix II. Research Assistant Introductory Letter
Dear Respondent,
Ms. Caroline Toroitich (principal investigator) is a PhD student at the University of
Eldoret. Department of Agricultural Extension and Rural Development. She is
carrying out a research on “Access and Utilization of Agricultural Extension
Services by Smallholder Farmers’ and the link to Household Food Security in
Uasin Gishu County, Kenya”. The purpose of the letter is to introduce the survey
and inform you that the bearer of this letter has been appointed by the principal
investigator as a research assistant in the study.
I kindly request for 30-45 minutes of your time to respond to some questions in the
questionnaire. However, feel free to end the interview at any time you choose, also
you should not feel obligated to answer any question that you prefer not to. The
research assistant will be filling in the information on the tablet.
I appreciate your willingness to share your experiences and time. If you have any
further inquiries and questions regarding this study, please feel free to contact the
principal investigator on the mobile number below.
Thank you.
Caroline Toroitich
Principal Investigator
Mobile no. 0722506165
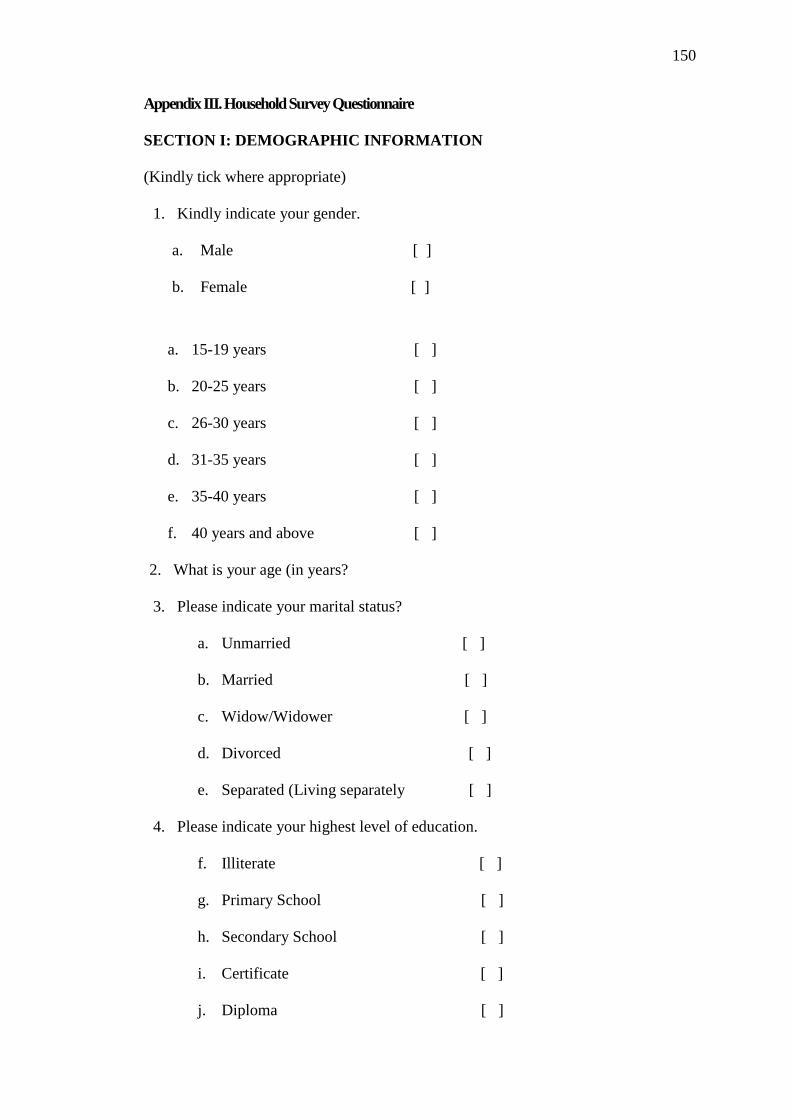
150
Appendix III. Household Survey Questionnaire
SECTION I: DEMOGRAPHIC INFORMATION
(Kindly tick where appropriate)
1. Kindly indicate your gender.
a. Male [ ]
b. Female [ ]
2. What is your age (in years?
3. Please indicate your marital status?
a. Unmarried [ ]
b. Married [ ]
c. Widow/Widower [ ]
d. Divorced [ ]
e. Separated (Living separately [ ]
4. Please indicate your highest level of education.
f. Illiterate [ ]
g. Primary School [ ]
h. Secondary School [ ]
i. Certificate [ ]
j. Diploma [ ]
a. 15-19 years [ ]
b. 20-25 years [ ]
c. 26-30 years [ ]
d. 31-35 years [ ]
e. 35-40 years [ ]
f. 40 years and above [ ]
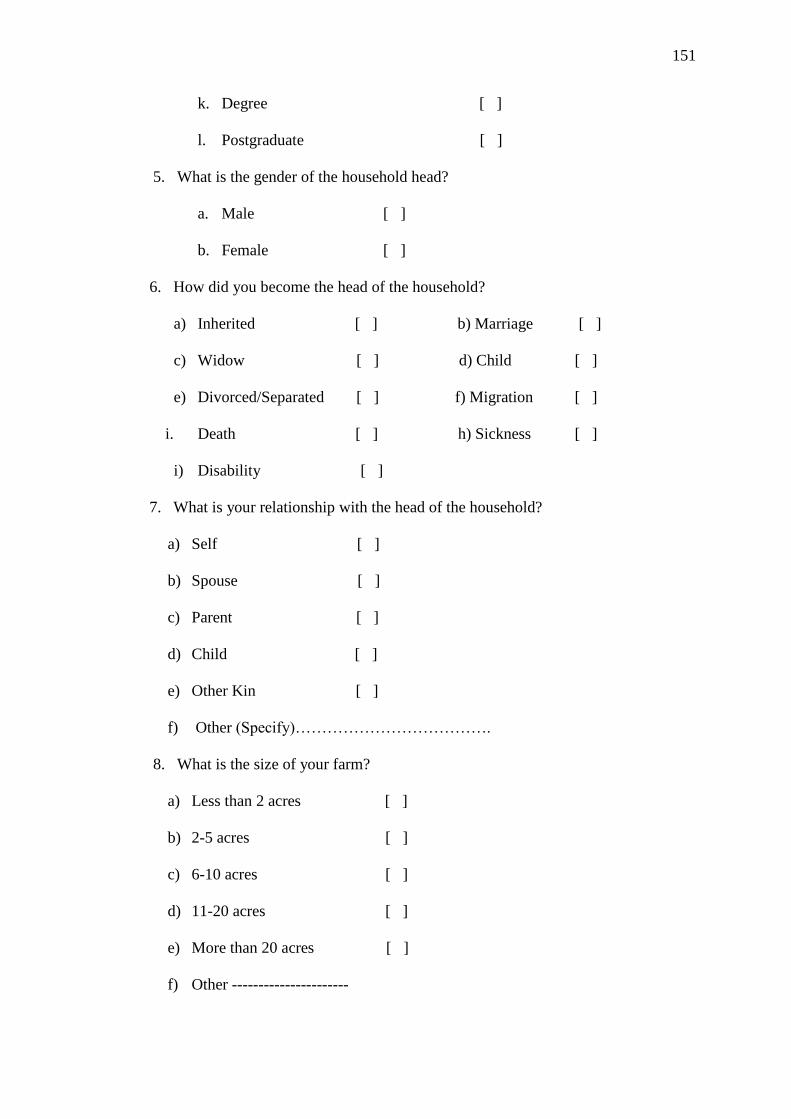
151
k. Degree [ ]
l. Postgraduate [ ]
5. What is the gender of the household head?
a. Male [ ]
b. Female [ ]
6. How did you become the head of the household?
a) Inherited [ ] b) Marriage [ ]
c) Widow [ ] d) Child [ ]
e) Divorced/Separated [ ] f) Migration [ ]
i. Death [ ] h) Sickness [ ]
i) Disability [ ]
7. What is your relationship with the head of the household?
a) Self [ ]
b) Spouse [ ]
c) Parent [ ]
d) Child [ ]
e) Other Kin [ ]
f) Other (Specify)……………………………….
8. What is the size of your farm?
a) Less than 2 acres [ ]
b) 2-5 acres [ ]
c) 6-10 acres [ ]
d) 11-20 acres [ ]
e) More than 20 acres [ ]
f) Other ----------------------

152
9. What is the type of your farming land ownership?
a) Farm Owner [ ]
b) Tenant [ ]
c) If you are a tenant, what is the kind of tenancy?
(i) Fixed tenant [ ]
(ii) Sharecropping [ ]
10. How many years have you spent in conducting farming activities?
a) 1-5 years [ ]
b) 6-10 years [ ]
c) 11-15 years [ ]
d) 16-20 years [ ]
e) Over 21 years [ ]
SECTION II: EXISTING AGRICULTURAL EXTENSION SERVICES
11. Available agricultural extension services
(i) What is your understanding of access to Agricultural extension services?
a) I have no idea what access to agricultural extension services are. [ ]
b) I have some understanding about agricultural extension services [ ]
c) I understand very well what agricultural extension services [ ]
(ii) Are agricultural extension services available in your area?
a) Yes
b) No
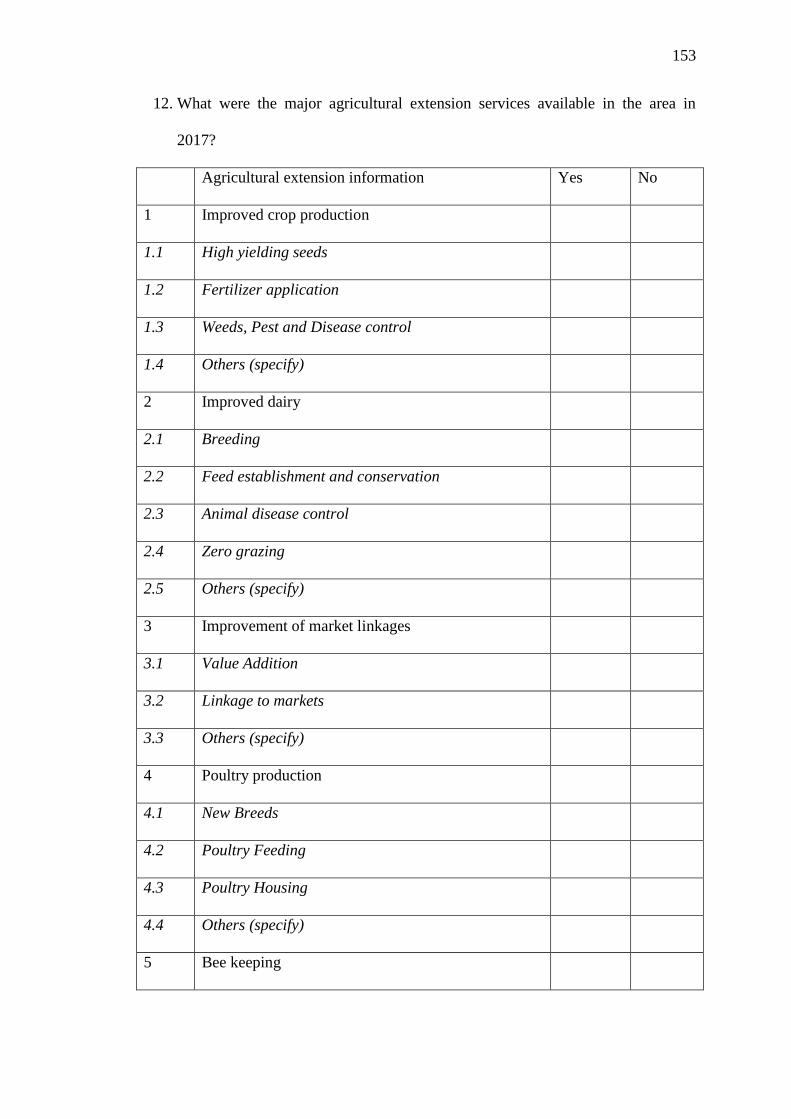
153
12. What were the major agricultural extension services available in the area in
2017?
Agricultural extension information Yes No
1 Improved crop production
1.1 High yielding seeds
1.2 Fertilizer application
1.3 Weeds, Pest and Disease control
1.4 Others (specify)
2 Improved dairy
2.1 Breeding
2.2 Feed establishment and conservation
2.3 Animal disease control
2.4 Zero grazing
2.5 Others (specify)
3 Improvement of market linkages
3.1 Value Addition
3.2 Linkage to markets
3.3 Others (specify)
4 Poultry production
4.1 New Breeds
4.2 Poultry Feeding
4.3 Poultry Housing
4.4 Others (specify)
5 Bee keeping
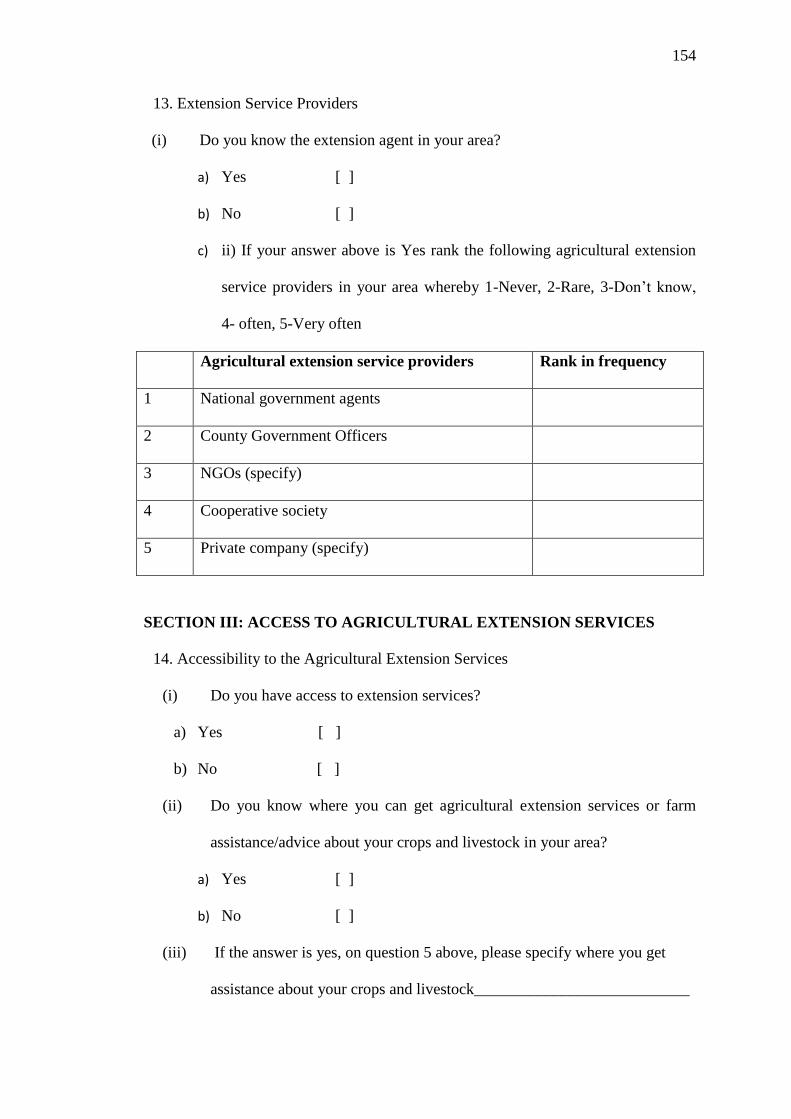
154
13. Extension Service Providers
(i) Do you know the extension agent in your area?
a) Yes [ ]
b) No [ ]
c) ii) If your answer above is Yes rank the following agricultural extension
service providers in your area whereby 1-Never, 2-Rare, 3-Don’t know,
4- often, 5-Very often
Agricultural extension service providers Rank in frequency
1 National government agents
2 County Government Officers
3 NGOs (specify)
4 Cooperative society
5 Private company (specify)
SECTION III: ACCESS TO AGRICULTURAL EXTENSION SERVICES
14. Accessibility to the Agricultural Extension Services
(i) Do you have access to extension services?
a) Yes [ ]
b) No [ ]
(ii) Do you know where you can get agricultural extension services or farm
assistance/advice about your crops and livestock in your area?
a) Yes [ ]
b) No [ ]
(iii) If the answer is yes, on question 5 above, please specify where you get
assistance about your crops and livestock___________________________
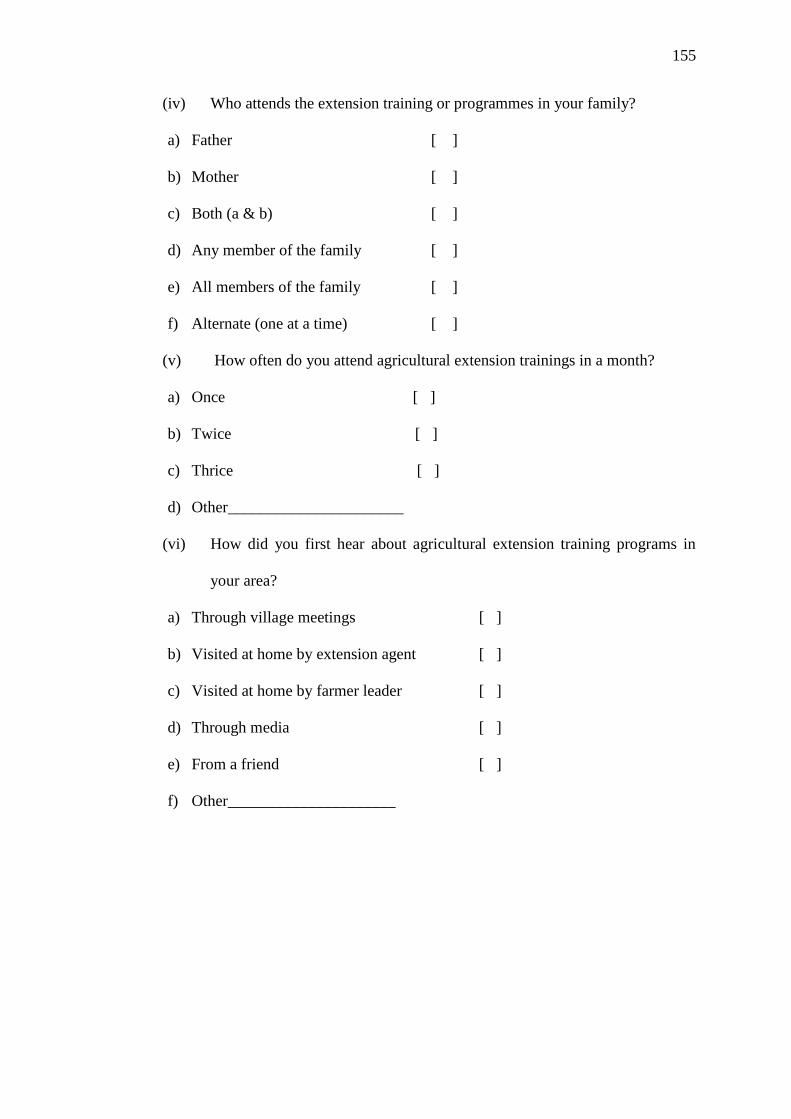
155
(iv) Who attends the extension training or programmes in your family?
a) Father [ ]
b) Mother [ ]
c) Both (a & b) [ ]
d) Any member of the family [ ]
e) All members of the family [ ]
f) Alternate (one at a time) [ ]
(v) How often do you attend agricultural extension trainings in a month?
a) Once [ ]
b) Twice [ ]
c) Thrice [ ]
d) Other______________________
(vi) How did you first hear about agricultural extension training programs in
your area?
a) Through village meetings [ ]
b) Visited at home by extension agent [ ]
c) Visited at home by farmer leader [ ]
d) Through media [ ]
e) From a friend [ ]
f) Other_____________________
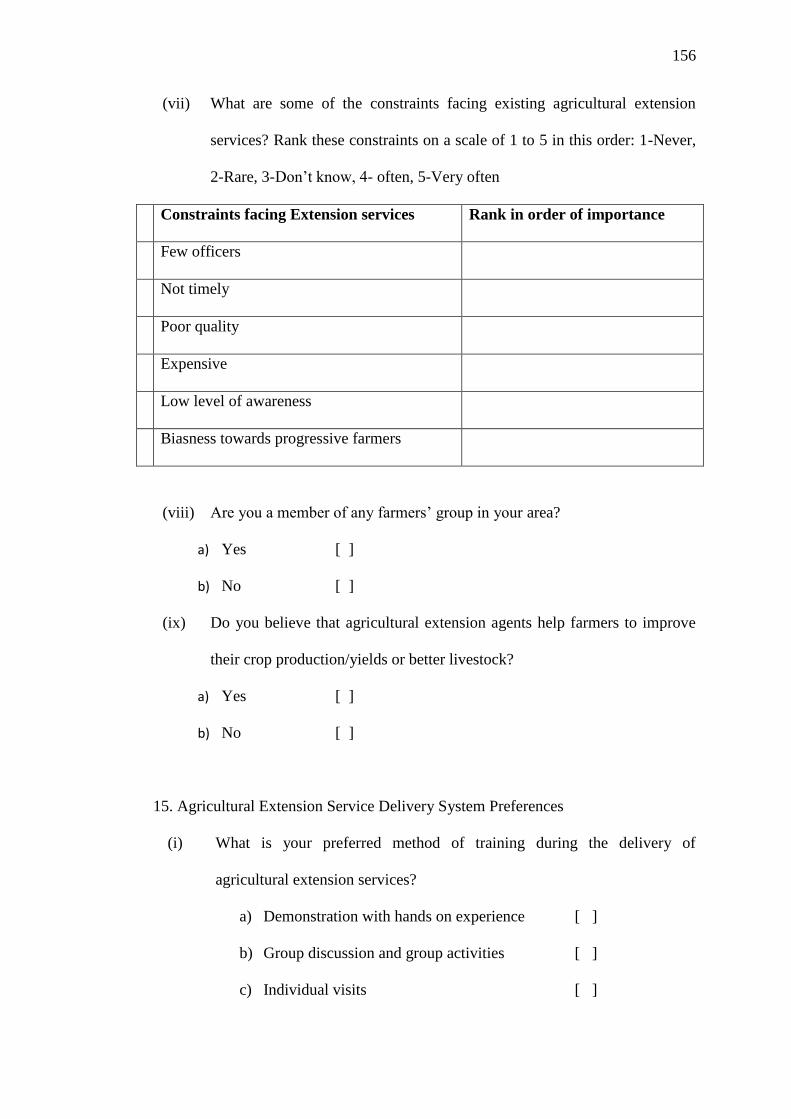
156
(vii) What are some of the constraints facing existing agricultural extension
services? Rank these constraints on a scale of 1 to 5 in this order: 1-Never,
2-Rare, 3-Don’t know, 4- often, 5-Very often
Constraints facing Extension services Rank in order of importance
1. Few officers
2. Not timely
3. Poor quality
4. Expensive
5. Low level of awareness
6. Biasness towards progressive farmers
(viii) Are you a member of any farmers’ group in your area?
a) Yes [ ]
b) No [ ]
(ix) Do you believe that agricultural extension agents help farmers to improve
their crop production/yields or better livestock?
a) Yes [ ]
b) No [ ]
15. Agricultural Extension Service Delivery System Preferences
(i) What is your preferred method of training during the delivery of
agricultural extension services?
a) Demonstration with hands on experience [ ]
b) Group discussion and group activities [ ]
c) Individual visits [ ]
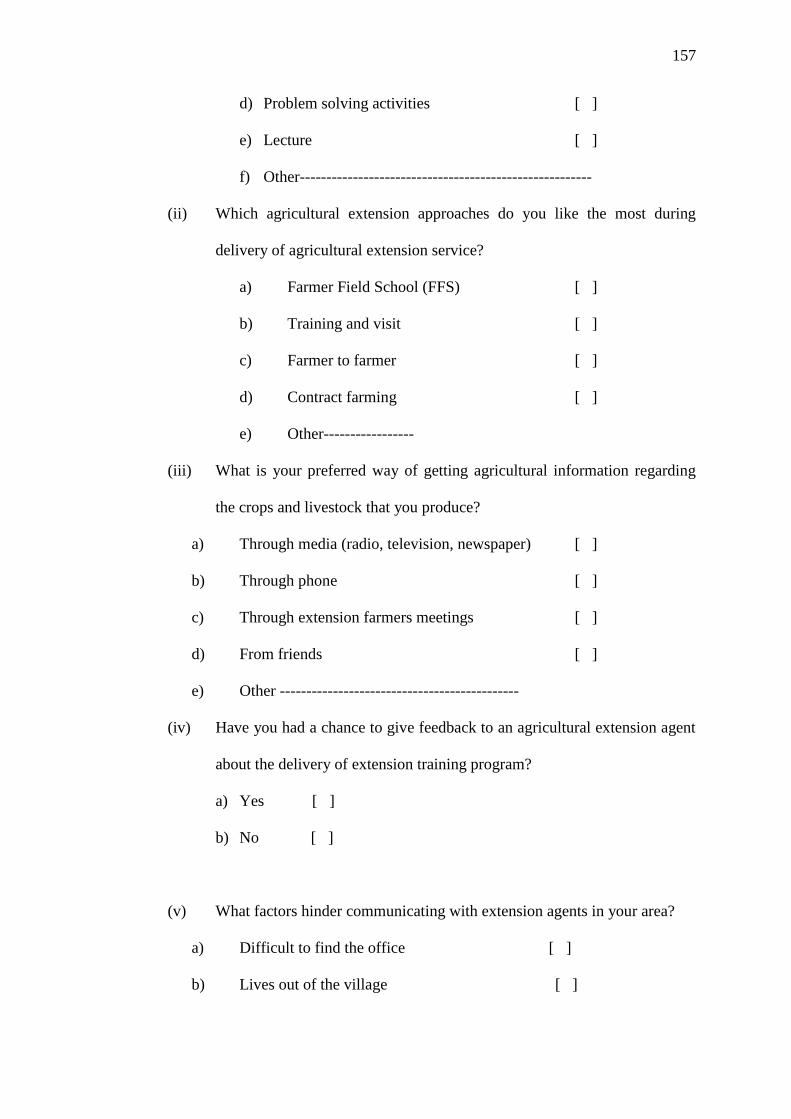
157
d) Problem solving activities [ ]
e) Lecture [ ]
f) Other-------------------------------------------------------
(ii) Which agricultural extension approaches do you like the most during
delivery of agricultural extension service?
a) Farmer Field School (FFS) [ ]
b) Training and visit [ ]
c) Farmer to farmer [ ]
d) Contract farming [ ]
e) Other-----------------
(iii) What is your preferred way of getting agricultural information regarding
the crops and livestock that you produce?
a) Through media (radio, television, newspaper) [ ]
b) Through phone [ ]
c) Through extension farmers meetings [ ]
d) From friends [ ]
e) Other ---------------------------------------------
(iv) Have you had a chance to give feedback to an agricultural extension agent
about the delivery of extension training program?
a) Yes [ ]
b) No [ ]
(v) What factors hinder communicating with extension agents in your area?
a) Difficult to find the office [ ]
b) Lives out of the village [ ]
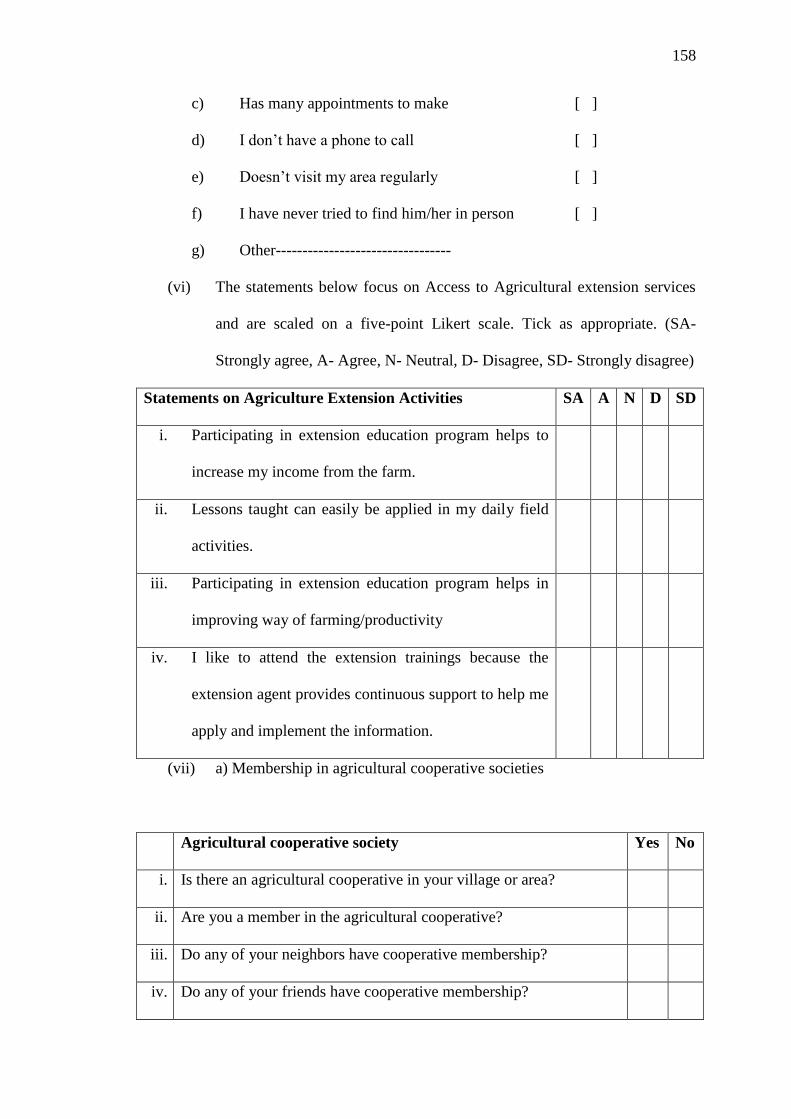
158
c) Has many appointments to make [ ]
d) I don’t have a phone to call [ ]
e) Doesn’t visit my area regularly [ ]
f) I have never tried to find him/her in person [ ]
g) Other---------------------------------
(vi) The statements below focus on Access to Agricultural extension services
and are scaled on a five-point Likert scale. Tick as appropriate. (SA-
Strongly agree, A- Agree, N- Neutral, D- Disagree, SD- Strongly disagree)
Statements on Agriculture Extension Activities SA A N D SD
i. Participating in extension education program helps to
increase my income from the farm.
ii. Lessons taught can easily be applied in my daily field
activities.
iii. Participating in extension education program helps in
improving way of farming/productivity
iv. I like to attend the extension trainings because the
extension agent provides continuous support to help me
apply and implement the information.
(vii) a) Membership in agricultural cooperative societies
Agricultural cooperative society Yes No
i. Is there an agricultural cooperative in your village or area?
ii. Are you a member in the agricultural cooperative?
iii. Do any of your neighbors have cooperative membership?
iv. Do any of your friends have cooperative membership?
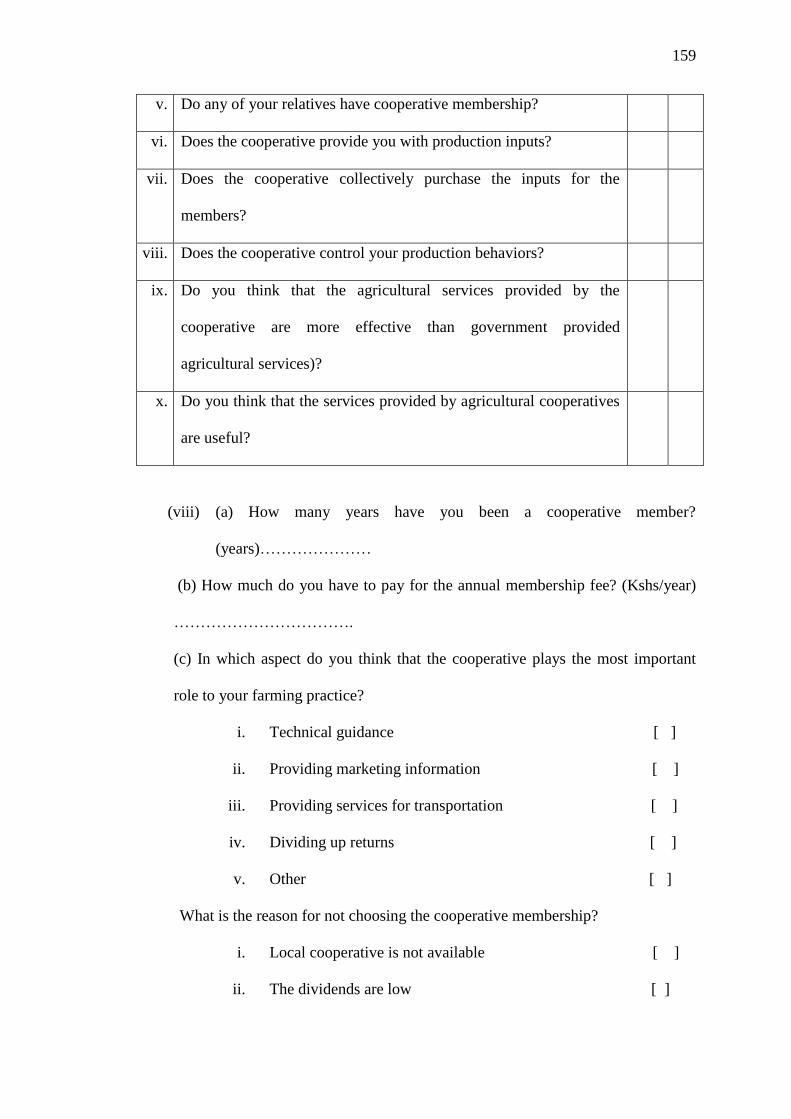
159
v. Do any of your relatives have cooperative membership?
vi. Does the cooperative provide you with production inputs?
vii. Does the cooperative collectively purchase the inputs for the
members?
viii. Does the cooperative control your production behaviors?
ix. Do you think that the agricultural services provided by the
cooperative are more effective than government provided
agricultural services)?
x. Do you think that the services provided by agricultural cooperatives
are useful?
(viii) (a) How many years have you been a cooperative member?
(years)…………………
(b) How much do you have to pay for the annual membership fee? (Kshs/year)
…………………………….
(c) In which aspect do you think that the cooperative plays the most important
role to your farming practice?
i. Technical guidance [ ]
ii. Providing marketing information [ ]
iii. Providing services for transportation [ ]
iv. Dividing up returns [ ]
v. Other [ ]
What is the reason for not choosing the cooperative membership?
i. Local cooperative is not available [ ]
ii. The dividends are low [ ]

160
iii. Farming condition is lower [ ]
iv. I am used to the traditional farming [ ]
v. Others [ ]
SECTION IV: UTILIZATION OF EXTENSION SERVICES
16. Farmers Perception on the Utilization of Agricultural Extension Services
(i) How useful are the agricultural extension training programs you have
attended?
a. Very Useful [ ]
b. Useful [ ]
c. I don’t know [ ]
d. Somehow useful [ ]
e. Not useful [ ]
(ii) Generally, how would you rate the agricultural extension programs in
your area in helping to improve farming households’ wellbeing through
agricultural production?
a. Very effective [ ]
b. Effective [ ]
c. Fair [ ]
d. Less effective [ ]
(iii) Have you utilized the agricultural extension services offered through
trainings?
a) No Utilization [ ]
b) Low Utilization [ ]
c) Medium Utilization [ ]
d) High Utilization [ ]
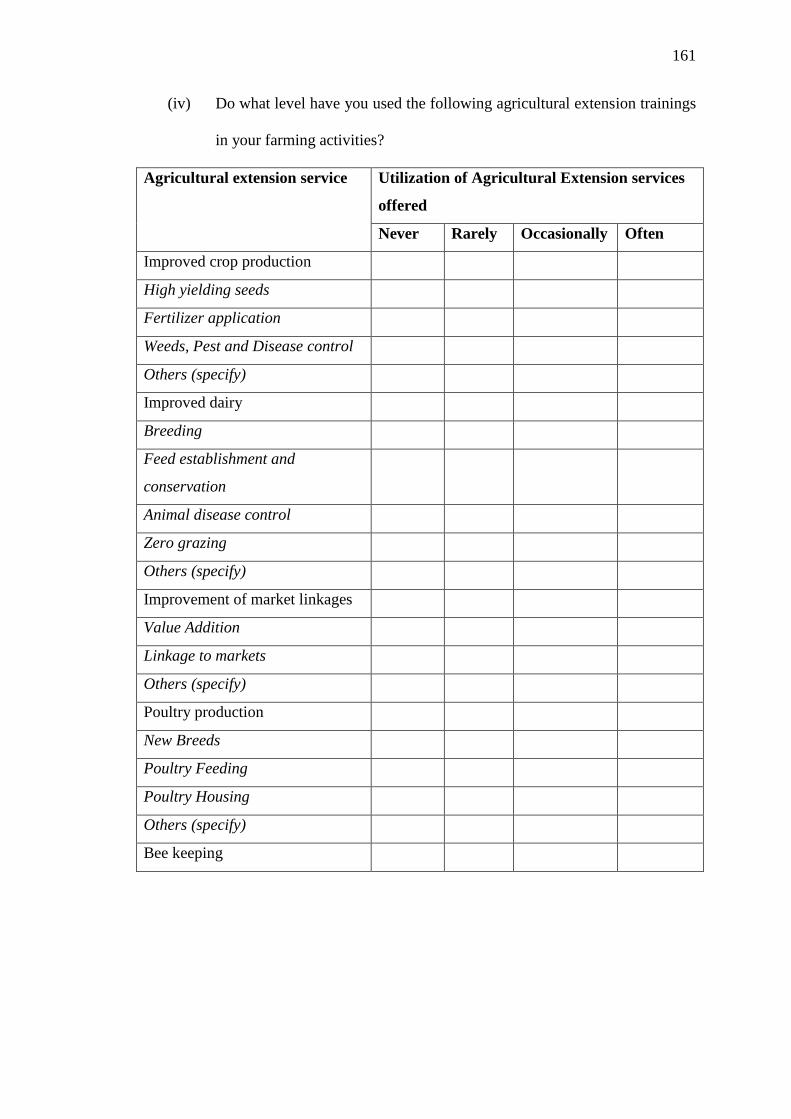
161
(iv) Do what level have you used the following agricultural extension trainings
in your farming activities?
Agricultural extension service Utilization of Agricultural Extension services
offered
Never Rarely Occasionally Often
Improved crop production
High yielding seeds
Fertilizer application
Weeds, Pest and Disease control
Others (specify)
Improved dairy
Breeding
Feed establishment and
conservation
Animal disease control
Zero grazing
Others (specify)
Improvement of market linkages
Value Addition
Linkage to markets
Others (specify)
Poultry production
New Breeds
Poultry Feeding
Poultry Housing
Others (specify)
Bee keeping
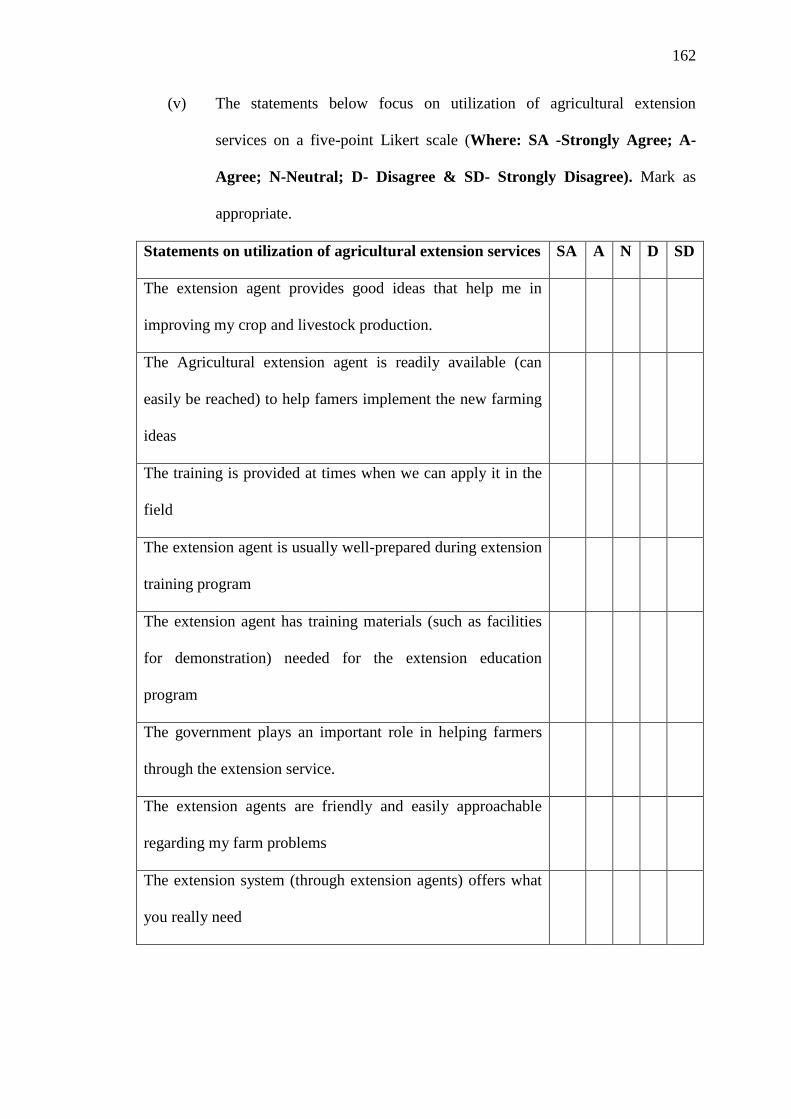
162
(v) The statements below focus on utilization of agricultural extension
services on a five-point Likert scale (Where: SA -Strongly Agree; A-
Agree; N-Neutral; D- Disagree & SD- Strongly Disagree). Mark as
appropriate.
Statements on utilization of agricultural extension services SA A N D SD
The extension agent provides good ideas that help me in
improving my crop and livestock production.
The Agricultural extension agent is readily available (can
easily be reached) to help famers implement the new farming
ideas
The training is provided at times when we can apply it in the
field
The extension agent is usually well-prepared during extension
training program
The extension agent has training materials (such as facilities
for demonstration) needed for the extension education
program
The government plays an important role in helping farmers
through the extension service.
The extension agents are friendly and easily approachable
regarding my farm problems
The extension system (through extension agents) offers what
you really need
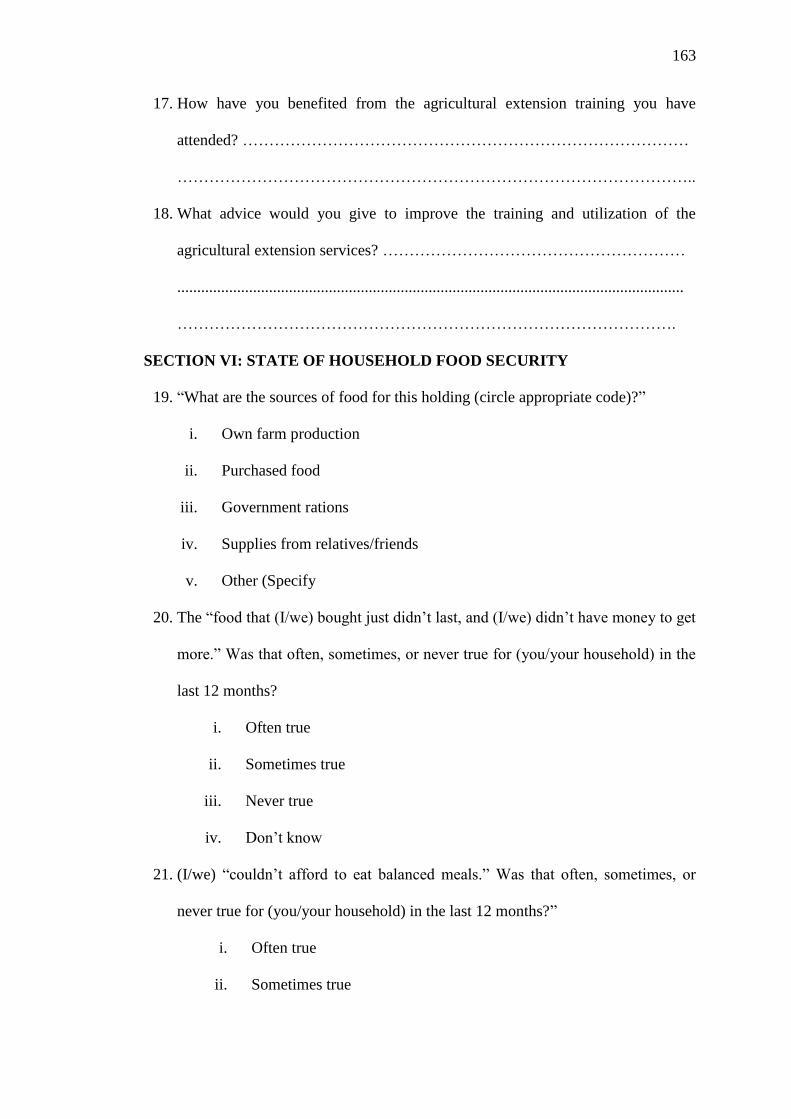
163
17. How have you benefited from the agricultural extension training you have
attended? …………………………………………………………………………
……………………………………………………………………………………..
18. What advice would you give to improve the training and utilization of the
agricultural extension services? …………………………………………………
...............................................................................................................................
………………………………………………………………………………….
SECTION VI: STATE OF HOUSEHOLD FOOD SECURITY
19. “What are the sources of food for this holding (circle appropriate code)?”
i. Own farm production
ii. Purchased food
iii. Government rations
iv. Supplies from relatives/friends
v. Other (Specify
20. The “food that (I/we) bought just didn’t last, and (I/we) didn’t have money to get
more.” Was that often, sometimes, or never true for (you/your household) in the
last 12 months?
i. Often true
ii. Sometimes true
iii. Never true
iv. Don’t know
21. (I/we) “couldn’t afford to eat balanced meals.” Was that often, sometimes, or
never true for (you/your household) in the last 12 months?”
i. Often true
ii. Sometimes true
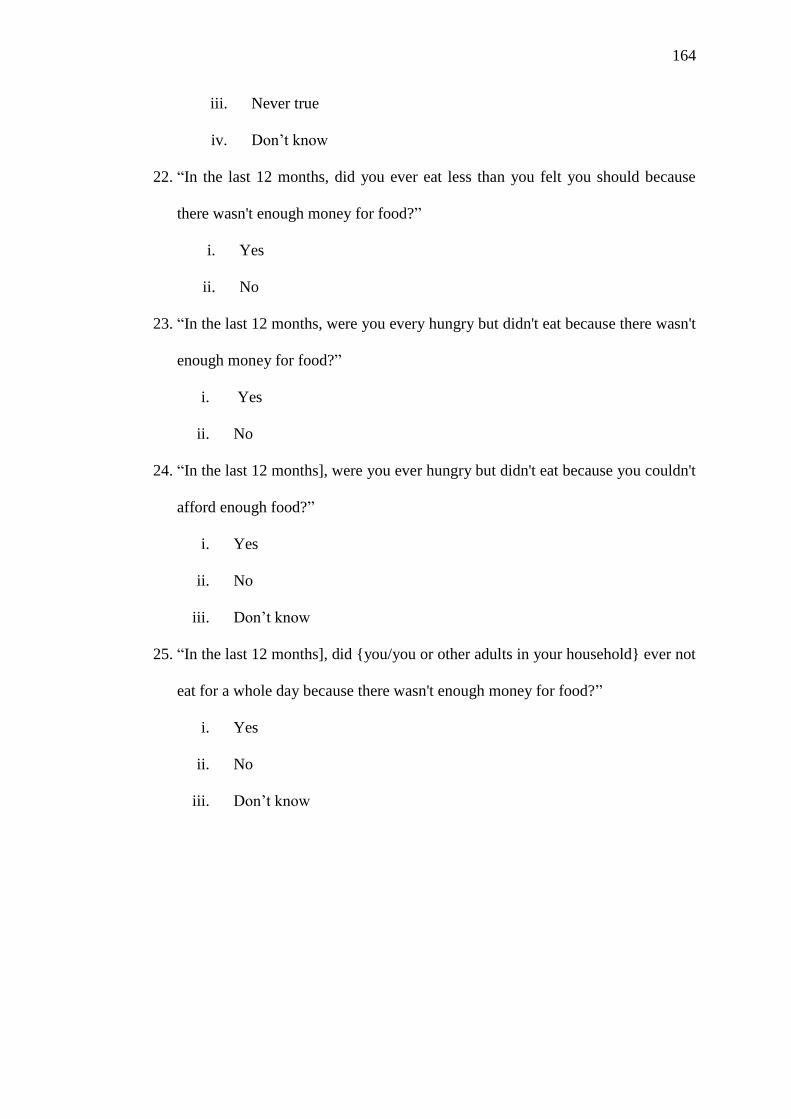
164
iii. Never true
iv. Don’t know
22. “In the last 12 months, did you ever eat less than you felt you should because
there wasn't enough money for food?”
i. Yes
ii. No
23. “In the last 12 months, were you every hungry but didn't eat because there wasn't
enough money for food?”
i. Yes
ii. No
24. “In the last 12 months], were you ever hungry but didn't eat because you couldn't
afford enough food?”
i. Yes
ii. No
iii. Don’t know
25. “In the last 12 months], did {you/you or other adults in your household} ever not
eat for a whole day because there wasn't enough money for food?”
i. Yes
ii. No
iii. Don’t know
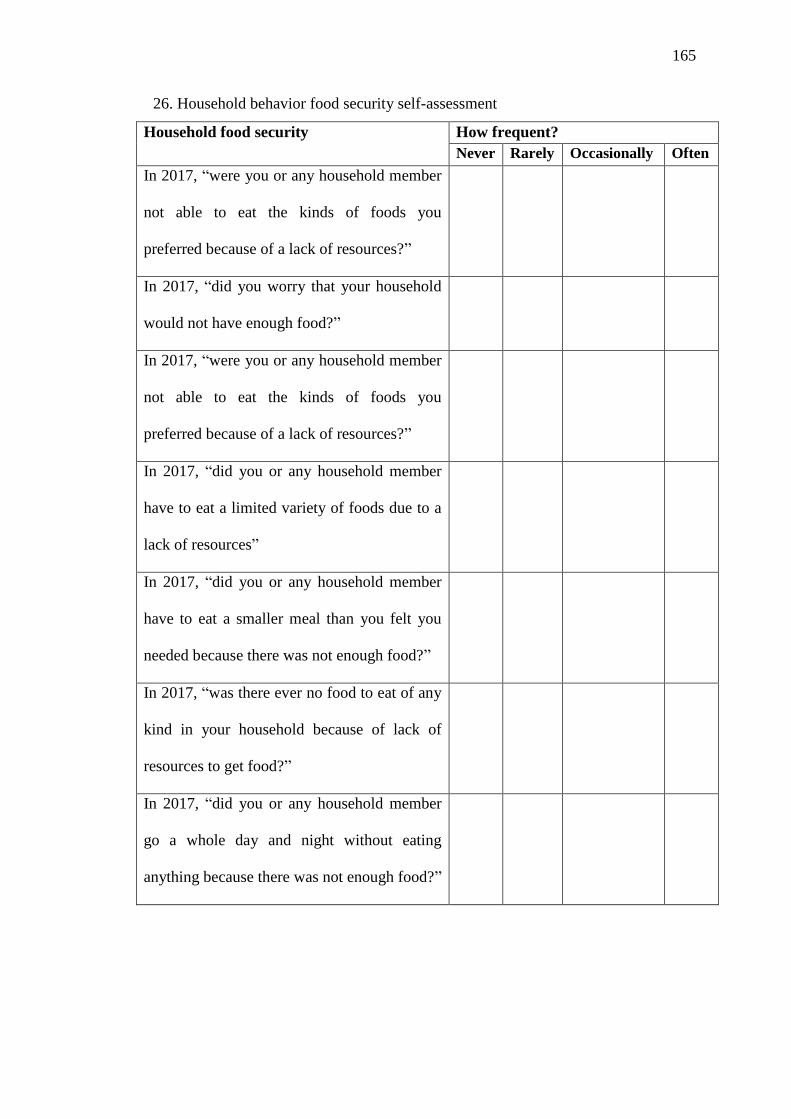
165
26. Household behavior food security self-assessment
Household food security How frequent?
Never Rarely Occasionally Often
In 2017, “were you or any household member
not able to eat the kinds of foods you
preferred because of a lack of resources?”
In 2017, “did you worry that your household
would not have enough food?”
In 2017, “were you or any household member
not able to eat the kinds of foods you
preferred because of a lack of resources?”
In 2017, “did you or any household member
have to eat a limited variety of foods due to a
lack of resources”
In 2017, “did you or any household member
have to eat a smaller meal than you felt you
needed because there was not enough food?”
In 2017, “was there ever no food to eat of any
kind in your household because of lack of
resources to get food?”
In 2017, “did you or any household member
go a whole day and night without eating
anything because there was not enough food?”
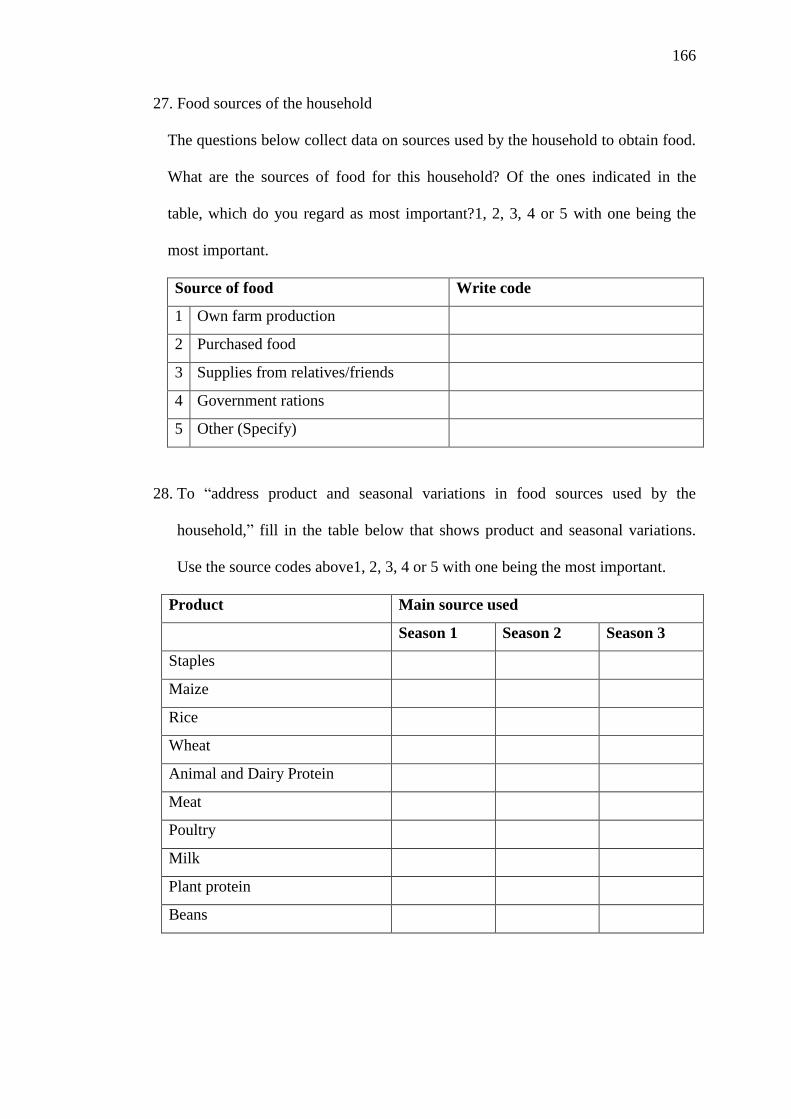
166
27. Food sources of the household
The questions below collect data on sources used by the household to obtain food.
What are the sources of food for this household? Of the ones indicated in the
table, which do you regard as most important?1, 2, 3, 4 or 5 with one being the
most important.
Source of food Write code
1 Own farm production
2 Purchased food
3 Supplies from relatives/friends
4 Government rations
5 Other (Specify)
28. To “address product and seasonal variations in food sources used by the
household,” fill in the table below that shows product and seasonal variations.
Use the source codes above1, 2, 3, 4 or 5 with one being the most important.
Product Main source used
Season 1 Season 2 Season 3
Staples
Maize
Rice
Wheat
Animal and Dairy Protein
Meat
Poultry
Milk
Plant protein
Beans
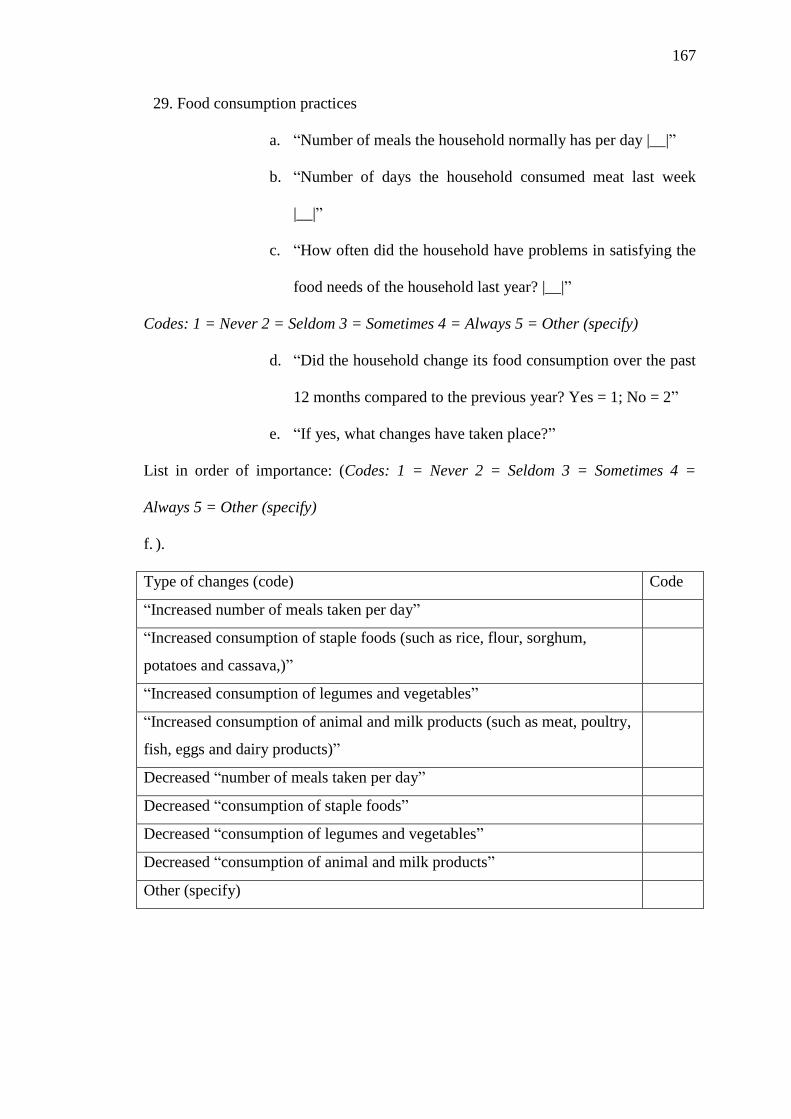
167
29. Food consumption practices
a. “Number of meals the household normally has per day |__|”
b. “Number of days the household consumed meat last week
|__|”
c. “How often did the household have problems in satisfying the
food needs of the household last year? |__|”
Codes: 1 = Never 2 = Seldom 3 = Sometimes 4 = Always 5 = Other (specify)
d. “Did the household change its food consumption over the past
12 months compared to the previous year? Yes = 1; No = 2”
e. “If yes, what changes have taken place?”
List in order of importance: (Codes: 1 = Never 2 = Seldom 3 = Sometimes 4 =
Always 5 = Other (specify)
f. ).
Type of changes (code) Code
“Increased number of meals taken per day”
“Increased consumption of staple foods (such as rice, flour, sorghum,
potatoes and cassava,)”
“Increased consumption of legumes and vegetables”
“Increased consumption of animal and milk products (such as meat, poultry,
fish, eggs and dairy products)”
Decreased “number of meals taken per day”
Decreased “consumption of staple foods”
Decreased “consumption of legumes and vegetables”
Decreased “consumption of animal and milk products”
Other (specify)
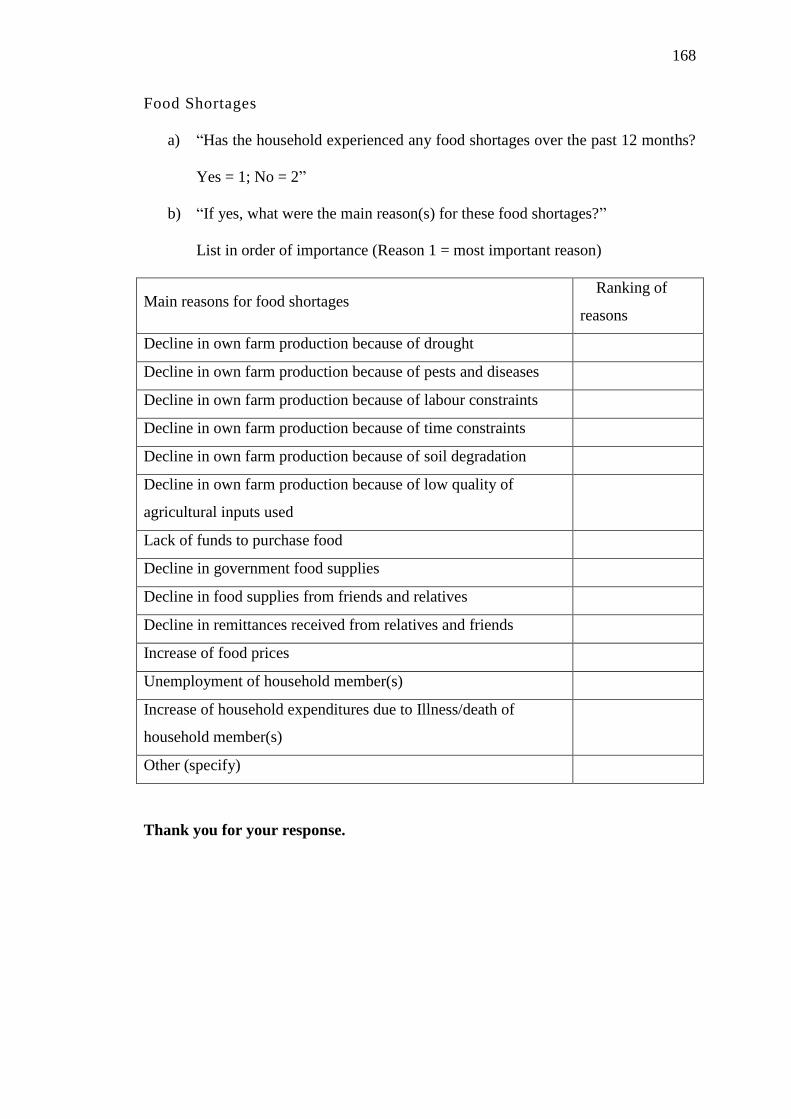
168
Food Shortages
a) “Has the household experienced any food shortages over the past 12 months?
Yes = 1; No = 2”
b) “If yes, what were the main reason(s) for these food shortages?”
List in order of importance (Reason 1 = most important reason)
Main reasons for food shortages Ranking of
reasons
Decline in own farm production because of drought
Decline in own farm production because of pests and diseases
Decline in own farm production because of labour constraints
Decline in own farm production because of time constraints
Decline in own farm production because of soil degradation
Decline in own farm production because of low quality of
agricultural inputs used
Lack of funds to purchase food
Decline in government food supplies
Decline in food supplies from friends and relatives
Decline in remittances received from relatives and friends
Increase of food prices
Unemployment of household member(s)
Increase of household expenditures due to Illness/death of
household member(s)
Other (specify)
Thank you for your response.
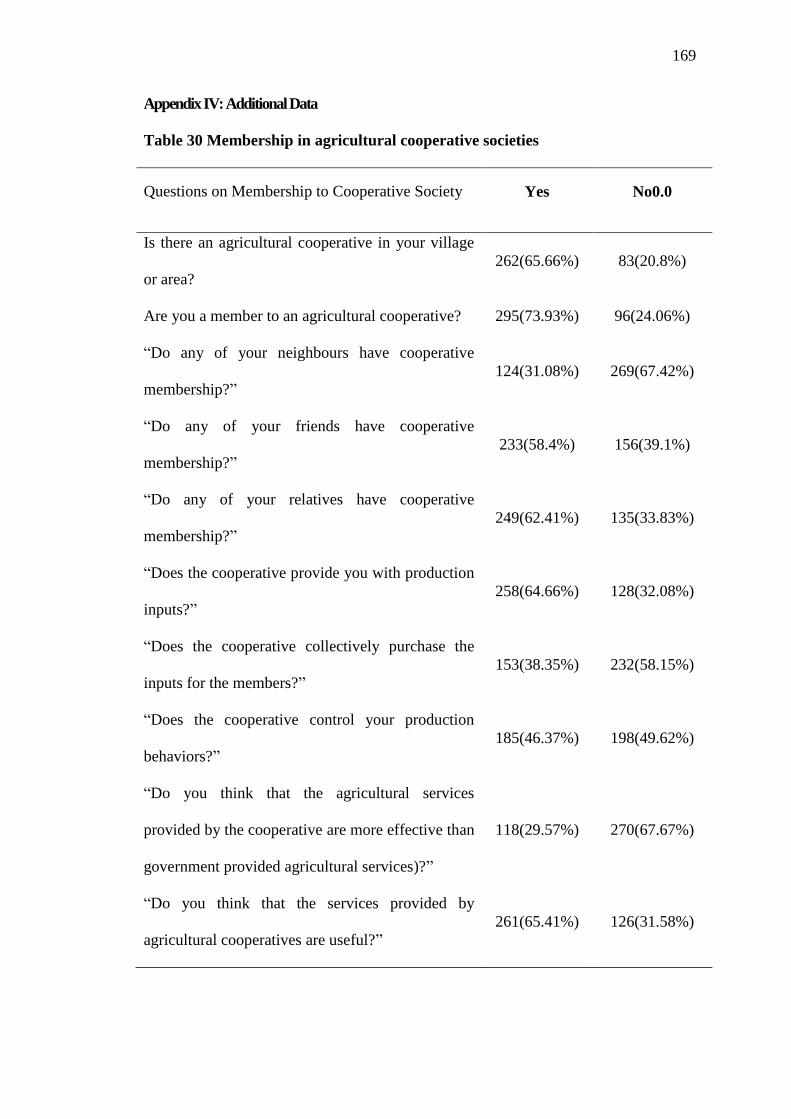
169
Appendix IV: Additional Data
Table 30 Membership in agricultural cooperative societies
Questions on Membership to Cooperative Society Yes No0.0
Is there an agricultural cooperative in your village
or area?
262(65.66%) 83(20.8%)
Are you a member to an agricultural cooperative? 295(73.93%) 96(24.06%)
“Do any of your neighbours have cooperative
membership?”
124(31.08%) 269(67.42%)
“Do any of your friends have cooperative
membership?”
233(58.4%) 156(39.1%)
“Do any of your relatives have cooperative
membership?”
249(62.41%) 135(33.83%)
“Does the cooperative provide you with production
inputs?”
258(64.66%) 128(32.08%)
“Does the cooperative collectively purchase the
inputs for the members?”
153(38.35%) 232(58.15%)
“Does the cooperative control your production
behaviors?”
185(46.37%) 198(49.62%)
“Do you think that the agricultural services
provided by the cooperative are more effective than
government provided agricultural services)?”
118(29.57%) 270(67.67%)
“Do you think that the services provided by
agricultural cooperatives are useful?”
261(65.41%) 126(31.58%)
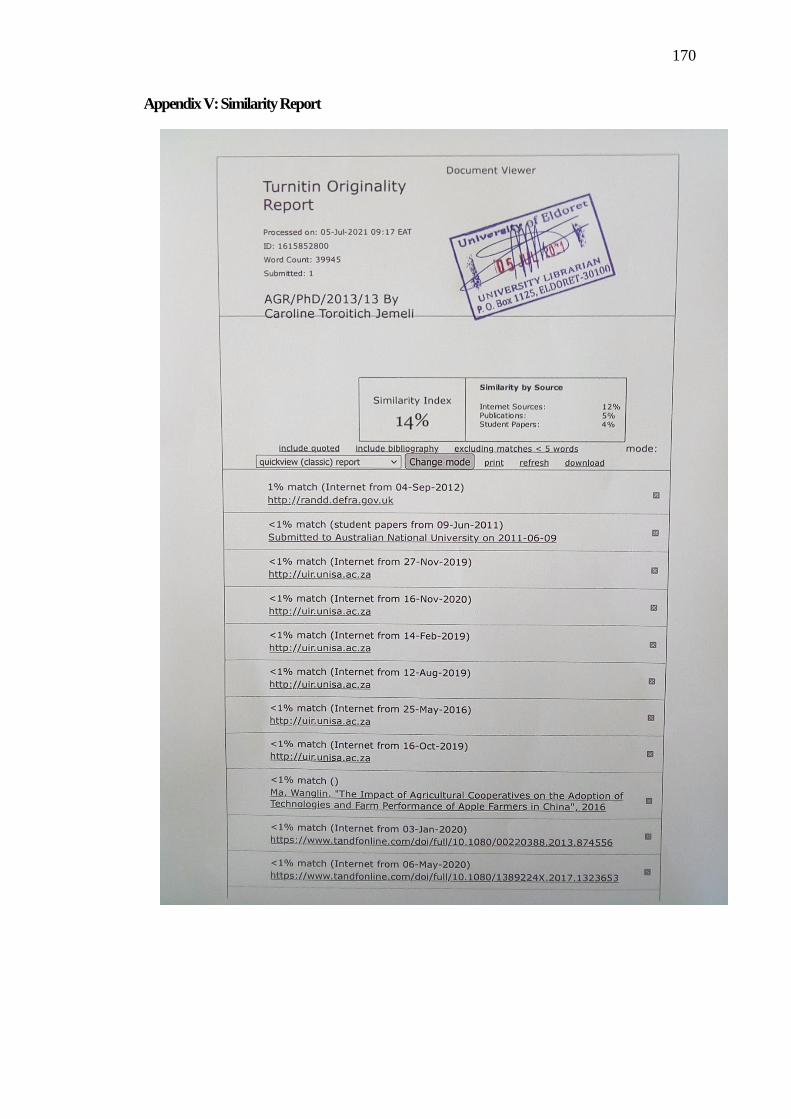
170
Appendix V: Similarity Report