Embed Size (px)
Citation preview
The Assessment of Warrants and Convertibles
Charles Kennedy (1) & Paul Kennedy (2)
(1) 26 Ethelbert Road, Canterbury, Kent CT1 3NF, United Kingdom (2) Prudential Assurance Company Ltd, 8th Floor, 1 Stephen Street, London W1P 2AP,
United Kingdom
summary
This paper is concerned with the assessment of warrants and convertibles from the point of view of the investor and from the standpoint of portfolio planning. After a brief review of earlier approaches that seek to determine the “correct” price of a warrant, the paper proceeds to develop a method of assessment based on a comparison of a suitably-chosen bond-and- warrant mix with a holding of the ordinary share.
Two measures are derived: a measure of the relative total performance of the bond-and- warrant mix and a measure of its downside protection. The bond proportion of the mix is chosen so that the measure of relative total performance is independent of the performance of the share price.
The analysis is at first directed at European warrants, but is later developed so as to take account of the possibility of early exercise in the case of an American warrant. It is then extended so as to cover the case of convertibles.
In the final section the method is applied to samples of warrants and convertibles in the London market, with some rather surprising results.
129
Résumé
Evaluation de Warrants et d’Obligations Echangeables
Cet article s’intéresse à l'évaluation de warrants et d’obligations échangeables du point de vue de l’investisseur et du point de vue de la planification du portefeuille d’investissement. Après une brève étude d’anciennes méthodes qui cherchent à déterminer le prix “correct” d’un warrant, l’article présente une méthode d'évaluation basée sur une comparaison d’un mélange d’obligation et de warrant spécifiquement choisi et d’un portefeuille d’actions ordinaires.
Deux mesures sont dérivées: une mesure de la performance totale relative du mélange obligation et warrant et une mesure de sa protection contre le risque de baisse. La proportion des obligations du mélange est choisie de façon à ce que la mesure de la performance relative totale soit indépendante de la performance du prix des actions.
L’analyse est tout d’abord consacrée aux warrants européens, mais prend ensuite en compte la possibilité d'une levée précoce dans le cas d’un warrant américain. Elle est ensuite étendue de façon à couvrir le cas des obligations échangeables.
Dans la dernière section, la méthode est appliquée à des échantillons de warrants et d’obligations échangeables sur le marché londonien, avec des résultats assez surprenants.
130
THE ASSESSMENT OF WARRANTS AND CONVERTIBLES
1. Introduction
1.1 Motivation
Most current theoretical approaches to the valuation of warrants seek to establish a "correct" or "rational" price for a warrant under certain conditions or assumptions. The old deterministic approach usually starts by expressing the "correct" price as the present value of the transactions that occur when the Warrant is exercised:
C = (S* (1+G) t - X) (1+R)
-t
(1),
where C is the "correct" price of the warrant, S* the current share price, X the exercise price, G the average annual rate of growth in the share price, R the valuer's average annual discount rate, and t the life of the warrant. This formula assumes that the valuer's average discount rate is known; more importantly it requires the valuer to assess how much the share price will grow during the life of the warrant.
An alternative approach, based on the justly celebrated Black-Scholes option-pricing model, also seeks to establish a "correct" price that incorporates the asymmetric performance of warrants. Under certain conditions this Black-Scholes "correct" price may indeed be established in the market as a result of arbitrage operations.
By concentrating on one measure only, however, both approaches seem to overlook the fact that a warrant is a cheap way of obtaining a stake in the equity of a company, and that this enables the investor to combine his warrant holdings with other securities such as bonds. The special attractions of mixed portfolios of bonds and warrants have long been recognised, combining as they do the upside potential of the warrants with the downside protection of the bonds.
To suggest that considerations such as these should be taken into account separately is not to deny the possible existence of a "correct" price that could in ideal conditions be established in the market as a result of arbitrage operations. Rather, it is to make the point that the solution of the problem of the "correct" price for the warrant should not be regarded as the sole end of warrant theory. For a fuller understanding of warrant markets, there is room also for an assessment of warrants from the standpoint of portfolio planning, and it is this assessment that will be attempted in the present paper.
131
In the theoretical literature, two types of warrants are distinguished: "European" warrants, which can only be exercised at their terminal date; and "American" warrants, which can be exercised prior to termination. Since European warrants are easier to analyse. it will be sensible todeal with them first. American warrants are of course much the commoner type of warrant in existence. It can be shown, however, that a capital share in a split-level trust is analytically equivalent to a European warrant (cf Ingersoll (1976)). Hence, the analysis of European warrants can be directly applied to capital shares. It is also an essential first step in the analysis of American warrants.
The plan of the paper will be as follows. European warrants will be analysed in the second section and American warrants in the third section. In the fourth section, the analysis will be extended to cover convertibles. In the fifth section, the techniques derived in earlier sections will be applied to a sample of warrants, capital shares and convertibles in the London market.
1.2 Definitions
To avoid repetition and to give the reader a reference page, all the definitions used are shown below:
C is the value of the warrant C* is the price of the warrant S is the value of the share s* is the share price dS*/S* is the finite proportional change in the share price X is the exercise price G is the assumed average annual increase in the share price during
the life of the policy R is the valuer's average annual discount rate (for RTP purposes,
this is taken to be the average annual return on appropriate fixed interest assets (bonds, loan stocks or preference shares)
r is the valuer's average instantaneous discount rate: In (1+R) is the average annual dividend yield
y is the average instantaneous dividend yield: In (1+Y) t is the life of the warrant in years. Da(Y,G,R,t) is the value of the dividend stream for a dividend yield Y,
during the life of the warrant t, assuming annual dividend growth G, and discounted at R.
I is the effective annual interest payment on convertible loan stock Ia(I,R,t) is the value of the interest stream for annual interest I,
during the conversion period. discounted at R N(d) is the cumulative standardised normal distribution
E s is the instantaneous standard deviation of the share's return is the performance of an equity share portfolio
M is the performance of a bond-and-warrant mix
132
S
r
2. Analysis of European warrants
2.1 Deterministic valuation formulae
We have already introduced the basic deterministic formula in 1.1:
(1)
The snag is the assessment of G. Most investors have a fair idea of the interest rate they should be using, but not of how quickly the share price will grow.
Various attempts have been made to produce a more objective formula. A useful assumption here is that warrants are being used as an alternative to shares, but that the valuer would otherwise be happy to invest in the shares. This allows us to substitute for the S* term in equation (1) and so eliminate, or reduce the dependence on, G.
Thus
Substituting we obtain (2)
The effect of G is now less important, but it will still need to be estimated. In particular, G should be consistent with the growth assumption in the entire value placed on S.
A more useful specification is that dividends should be reinvested. We need to make an assumption about dividends, though not to assume any particular pattern of dividend growth. Instead, we need to specify the average effective annual dividend yield Y, or alternatively we can take the current yield and assume that it remains constant. We shall also assume a constant interest rate. These are the only assumptions of any significance.
Thus
Substituting we obtain (3)
Equation (3) involves specific quantities of warrants, the underlying shares (assuming reinvestment of dividends), and the equivalent risk-free asset (which accumulates to provide the exercise price if R is the risk-free return). It is an important relationship because it allows the investor to assess two alternative investments (shares, and a bond-and-warrant mix) without the need to assess the future growth in the share price G. This feature will prove useful in 2.3.
133
2.2 Option-pricing formulae
An alternative approach, based on the justly celebrated Black-Scholes option-pricing model, also seeks to establish a "correct" price.
Although there have been many developments since, Black and Scholes in their original article (Black & Scholes 1973) derived the correct price of a call option as a function of just five variables: the share price, the exercise price, the time to maturity, the risk-free interest rate, and the short-term volatility of the share price. The first four of these were directly observable, while the fifth could be estimated from market data. Under certain assumptions, the correct price would be established in the market as a result of arbitrage operations.
An important feature of the Black-Scholes solution is that neither the expected future growth in the share price nor the degree of risk-aversion on the part of investors enters into the determination of the correct price.
The relationship in equation (3) has been applied (following Jarrow and Rudd) to the option-pricing model:
(4)
where
This is not the place for a detailed discussion of the assumptions underlying the Black-Scholes model, many of which have in any case later been shown to be dispensable. Attention should be drawn, however, to one feature that is common to all models in the Black-Scholes tradition. Although the future movement of the share price is held to be uncertain, it is nevertheless assumed to be subject to some particular stochastic process. The stochastic process may take different forms, but has to be specified at the outset. This may be a reasonable assumption to make in the short-term, but the notion that the same stochastic process will adhere over a number of years seems less plausible. For this reason, the Black-Scholes analysis may be thought to have more relevance for short-term option markets than for warrant markets.
2.3 Measures of total relative performance and downside protection
2.1 and 2.2 have concentrated on determining the "right" price of a European warrant. In practice, the warrant price C* will be different from the theoretical price C. The investor therefore needs relative measures of cheapness and dearness that he can use alongside measures of downside protection to evaluate the warrants according to his own risk-reward priorities.
134
The method to be used will be to compare the performance of a suitably chosen mix of bonds and warrants with the performance of the corresponding ordinary share. To be more specific, we want to devise measures of the relative total performance of the bond-and-warrant mix and of its downside protection. Moreover, we shall want to devise a measure of relative total performance that is independent of the movement of the share price, and it will be shown that this can always be done by the appropriate choice of the initial proportion of bonds and warrants in the mix. This means we need not make any assumptions whatsoever about the future behaviour of the share price: neither about the direction of its movement nor about the stochastic process to which its movement might be subject.
A convenient starting point for the analysis is equation (3), which can be rearranged as follows:
If we now replace C(min) by C*, we can write
(5) (a)
which can be seen to be a measure of relative cheapness or dearness of the bond-and-warrant mix as compared to the share, and which is at the same time a measure of the relative total performance of the mix of bonds and warrants as compared to the share portfolio.
The bond proportion of the bond-and-warrant mix is also readily recognisable as a measure of downside protection:
(5)(b)
It is worth emphasising here that this particular bond proportion has no prescriptive significance, but is chosen purely so as to arrive at a mix that can be regarded as "equity-equivalent". The individual investor is of course free to choose whatever proportion he likes, in the light of his own attitude to risk and return.
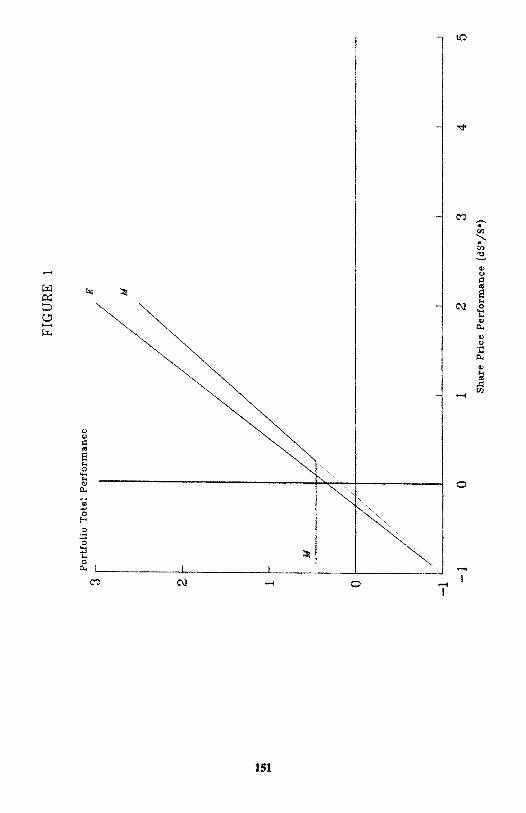
To make it clear that equation (5)(a) is a measure of relative total performance, it is useful to introduce the notion of a performance function, where performance is defined as a proportional increase up to the time of expiry of the warrant. The performances of the equity portfolio (E) and of the bond-and-warrant mix (M) are both functions of the share price performance (dS*/S*). They are illustrated in Figure 1. E is a straight line of slope greater than one if the share is a dividend-paying one. M is a two-part function: it has an upward-sloping
135
part if the warrants are in the end worth exercising. and a horizontal part if the warrants have become valueless and the downside protection of the bonds has come into play. The slope of the upward-part will depend on the initial proportions of bonds and warrants in the mix; but it will always be possible to choose the proportions so that the upward-sloping part if projected to the left would reach the point (-1,-1), as shown by the dotted line in Figure 1.
Since E also starts from this same point, it is evident that to the right of the kink in M the ratio (1+M)/(1+E) will be constant and independent of the share price performance. This ratio is identical with our measure of relative total performance (RTP) in equation (5)(a). It represents the ratio of the terminal value of the mix to the terminal value of the equity portfolio.
It is at once apparent from Figure 1 that, if "dominance" of the mix over the equity portfolio is to be avoided. RTP should be less than 1. This in turn implies that C* > C(min).
2.4 Adjustment for timing of dividends
Y is the annual effective dividend rate. In practice, warrants may be assessed at any time. This can be adjusted for by determining Y at the last dividend payment date, and rounding up t in the share value to include the period from the dividend payment to the assessment date. t in the other terms should not be adjusted.
2.5 Assumption of constant dividend yield
Historically, dividend yields have remained remarkably constant. If, however, the dividend yield is expected to vary, an effective average dividend yield over the period can be used. The only requirement is to assess the overall effect of the reinvestment of dividends over the period on the number of shares held.
2.6 Interest rate assumption
There is no requirement that the interest rate on bonds be constant. Again the effective average return for discounted mean term t can be used. For an institutional investor, it should be possible to hypothecate a notional fixed interest asset with the appropriate discounted mean term. The use of a risk premium discount rate would tend to increase RTP.
3. American warrants
3.1 Deterministic valuation formula
The problem presented by an American warrant arises because of the possibility of early exercise, which makes it clearly inappropriate to treat it as a European warrant exercisable only on the last exercise date. The solution can be found by selecting the value of t that maximises C(min) in equation (3).
136
Writing (3) as C(min) and differentiating,
we obtain: C(min)'
(6)
Note that C(min)''
which is negative at t if y < r. So C(min) is a maximum.
Note also that this is equivalent to choosing a particular mix of bonds and warrants such that dividend income is exactly equal to annual interest on the bonds at the outset.
In practice there may be restrictions on the value of t. If t suggests ε date before the earliest exercise date, or if t is negative, the earliest exercise date should be used. Similarly, if t is beyond the last exercise date, the last exercise date should be used.
The value of C(min) is then obtained by applying this value of t t equation (3).
3.2 Relative total performance
Relative total performance (equation (5)(a)) is generally maximised fo a different value of t, because t will depend on C* rather than C(min).
First we re-write equation (7):
Putting f'
(7)
Note that equation (7) is independent of S*.
which is positive.
f(t) is a minimum and so RTP is a maximum at this value of t.
137
The value of t is relevant because it determines the proportions of bonds and warrants in the equivalent portfolio. The larger the value of t, the smaller the proportion of bonds and so the lower the downside protection. In general (7) requires a smaller value of t (and so an immediate income advantage for the bonds over shares) than equation (6) if C* > C(min). Downside protection (equation (5)(b)) is also thereby increased to compensate for the higher amount at risk C*.
4. Convertibles
4.1 Deterministic formulae
In the United Kingdom. the rating of convertible loan stocks commonly follows the approach adopted in equation (2). The difference is that there is now no need to fund for the exercise price X. Indeed the interest on the loan stock will usually exceed the share dividends forgone, and the difference between them is referred to as the income difference:
(8)
It is assumed that t will be selected so that conversion takes place when dividend income overtakes interest on the loan stock, or as close to that date as the conversion terms allow.
Alternatively, we may seek to follow equation (3). The loan stock plus interest means that there is now no need to hold bonds. Indeed surplus bonds are being held of value Ia(I,R,t). Assuming the investor would normally hold bonds, this surplus can simply be incorporated into the investor's bond portfolio, with adjustments to other stocks to preserve the desired overall discounted mean term.
The optimum value of t may be found as in 3.1.
(9)
Writing K(min) we see immediately from analogy with (6) that K(min) is a maximum when:
4.2 Relative total performance
(10)
As in 2.2, relative total performance is defined in terms of an alternative to shares:
(11)
138
The measure of downside protection derives from the underlying loan stock:
(12)
The value of t that maximises RTP may be found by re-writing (11):
We see immediately from analogy with (11) that RTP is maximised if:
(13)
Note that there is no solution if I > RK* or if y > r. If I > RK*, this means that the loan stock will be cheap as a loan stock ignoring conversion rights, provided of course that R is appropriate and should not be raised to allow for risk of default.
4.3 Rating of the loan stock
The protection afforded by the loan stock is not absolute. This has two effects: firstly, it undermines the usefulness of equation (12); secondly, it may require the use of a higher discount rate. The use of a risk-free rate of return would tend to increase RTP.
In any case, the proposed method of assessment is probably at its least reliable when applied to the convertibles of poorly-performing companies. This is not just because of the possibility of failure, but also because the assumption of a continuation of the current dividend yield would be at its most suspect.
4.4 Liquidity
The potential loss of liquidity through holding a convertible rather than the underlying shares can also be taken into account through an adjustment to the annual interest. In the case of a bond-and-warrant mix, this is probably unnecessary because the extra liquidity of the bonds will more than compensate for the lack of liquidity on the warrants.
139
5. Applications
5.1 General
In this section we have worked out the measures of relative total performance (RTP) and downside protection (DP) for a sample of investment trust warrants and for a few capital shares and also for a sample of convertibles in the London market. The constituents of the samples have not been selected systematically or with any particular purpose in mind. Nevertheless, we believe that in the case of warrants proper and of convertibles, the samples are comprehensive enough to allow some conclusions to be drawn.
In the case of warrants and capital shares we have calculated the measures both for a non-taxpayer and for a taxpayer paying income tax at a rate of 25%. In the case of convertibles, we have restricted ourselves to the non-taxpayer, on the grounds that convertibles are hardly a suitable investment for a tax-payer. No account has been taken of capital gains tax, since neither the exercise of a warrant nor the conversion of a convertible constitutes a disposal for capital gains tax purposes; while experience has shown that on the termination of split-level trusts the capital shareholders have usually been offered an exchange into some other security that does not constitute such a disposal.
From the point of view of input specification the most difficult problem is that of the dividend yield. Faute de mieux we have used historic dividend yields, while recognising that such a procedure is far from ideal and ignores the timing of dividends. In a normal situation of rising equity markets, the use of historic dividend yields would lead to
an underestimation of the required future dividend yields. However, since our data were extracted at a time of historically high dividend yields following a sharp reaction in equity markets, we are reasonably convinced that our use of historic dividend yields on this occasion does not result in an undervaluation of future dividend yields.
As far as interest rates (rates of discount) are concerned, we have in the main based these on the FT-Actuaries table of yields in the Financial Times. For Government Securities, for use with warrants and capital shares, we have taken 11.75% as a rough average. For convertible loan stocks, we have used a rate of 13.5%. On the other hand, the FT-Actuaries figure for the yield on preference shares seemed to us implausibly low, since it was no higher than the rate on loan stocks. Instead, we have arbitrarily taken a figure of 14%, half a percentage point higher than on loan stocks.
5.2 Warrants
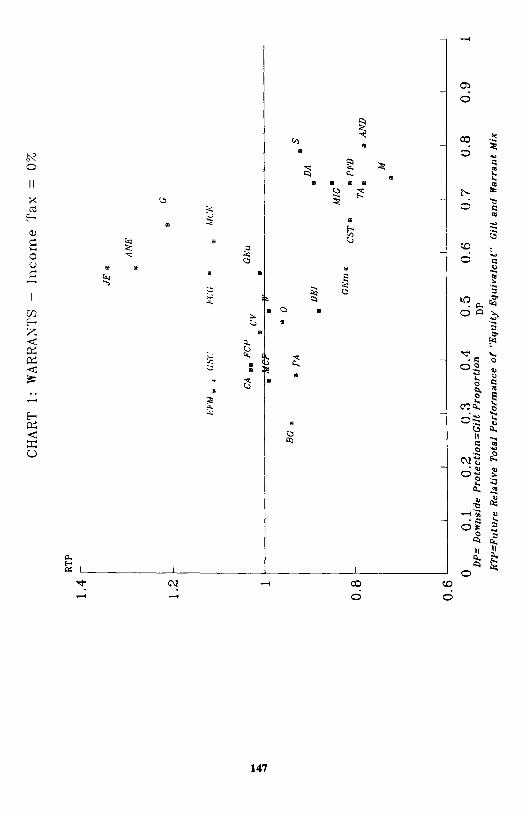
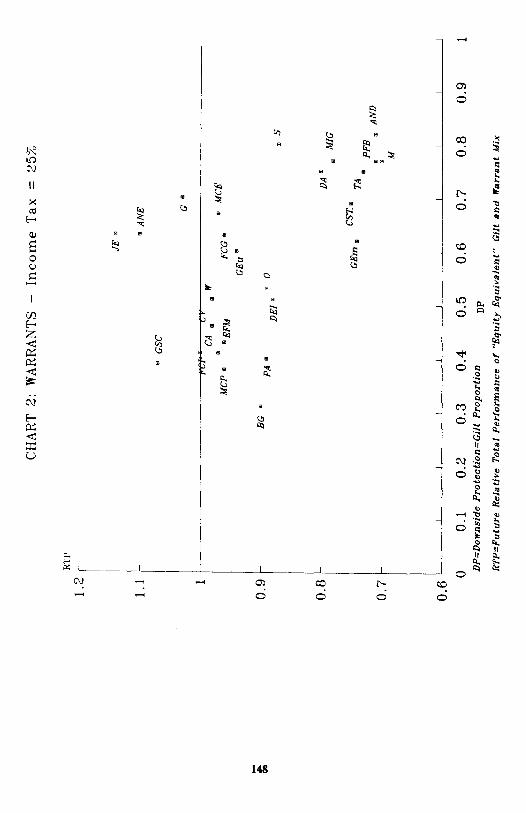
The source of the data used has been the 1 October issue of Cazenove & Co's monthly publication on Investment Trust Companies. The results are given in Table 1 and illustrated on a scatter-diagram in Chart 1 for a non-taxpayer and in Chart 2 for a taxpayer.
140
5.3 Capital shares
It was claimed in 1.1 that a capital share in a split-level trust is the analytical equivalent of a European warrant. The analogue to the ordinary share price is the value per capital share of the gross assets held by the trust. The "exercise price" is the amount per capital share that has to be paid to the income shareholders on termination of the trust. The "dividend yield" is the average dividend yield on the assets held by the trust.
From the point of view of data collection, capital shares present some problems. Much of the information concerning them is to be found in Cazenove & Co's publication, but figures for the value of the gross assets of the trust and figures for the average dividend yield are not readily available. While no doubt these could be estimated from information given in the trusts' annual accounts, we shall confine ourselves here to three split-level trusts for which the figures are more readily available. The three (M&G Dual, M&G Second Dual, and Save & Prosper Linked Investment Trust (SPLIT)) are wholly invested in specific unit trusts run by the managements concerned. The prices of the units and the dividend yields of the units are quoted in the Financial Times.
The results are shown in Table 2.
5.4 Convertibles
There is a complication concerning convertibles that arises from the timing of the conversion periods in relation to the dates for interest payments and for dividend payments. In some, but by no means all, cases there is a cost of conversion in terms of interest forgone or dividends missed. This cost of eventual conversion can be quite significant in the case of a convertible that is ripe for conversion or that is coming to the end of its conversion period. On the other hand, for convertibles that still have many years to run, the cost of eventual conversion is not very significant. Partly for this reason, and partly because there would be no easy way of accommodating the complication within our theoretical framework, we shall ignore it in our calculations.
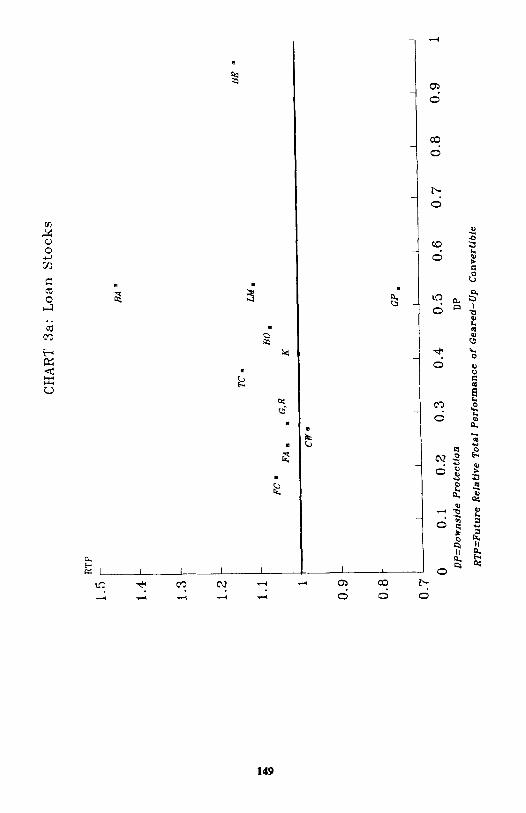
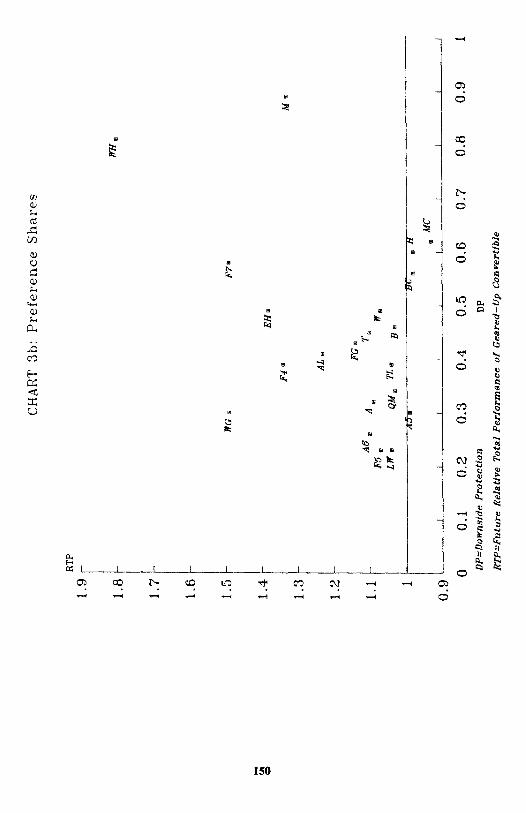
The data on convertibles has been taken from a Datastream print-out. The results are shown in Table 3a for Convertible Unsecured Loan Stocks and in Table 3b for Convertible Preference Shares. They are illustrated on scatter diagrams in Charts 3a and 3b.
5.5 Commentary on the results
To take first the effects of the introduction of tax. It is seen that, in the case of warrants, the introduction of tax lowers RTP and raises DP. This is normal for an American warrant that is at a premium. On the other hand, in the case of capital shares, the introduction of tax raises both RTP and DP. This again is normal for a European warrant that is at a discount.
141
Turning to the more general picture, we see that although there are many warrants that conform with expectations, there are also quite a number that appear anomalously cheap, especially for the non-taxpayer, with RTP greater than one.
A column showing the life of the warrant has been included in Table 1, because there seemed to be a positive association between a high RTP and a long life. While this is evident, it is also true that nearly all the warrants with a long life and RTP greater than one are also Europe- orientated (the exception is EFM Dragon 2005). Thus, there is not enough evidence to decide whether the cheapness of these particular warrants is due to a long life or to a distaste for Europe-orientation, possibly as a result of oversupply. It could be a bit of both. Alternatively it could have resulted from using a common rate of interest instead of following the yield curve.
The three capital shares seem not unreasonably priced for the non-taxpayer, but two of them are distinctly cheap for the taxpayer. Needless to say, the sample is too small and specialised to allow for any inferences to be drawn for capital shares as a whole.
When it comes to convertibles, the results are altogether more startling, and it is difficult to avoid the conclusion that there is something seriously amiss with the valuation of convertibles in the London market. Not only does the sector as a whole appear to be undervalued, but there are also a number of oddities among particular cases. The three Friendly Hotels convertible preference issues provide an interesting example. They are directly comparable, since all three come to the end of their conversion period at roughly the same date. Yet it can be seen that, contrary to expectations, a high RTP is associated with a high DP.
The sceptic may wish to suggest that the surprising nature of the results casts doubt on the validity of our methods rather than on the efficiency of the convertible market. Against this, it can be argued that there are not a few convertibles which can be shown to be anomalously undervalued independently of our particular method of assessment. These are convertibles that are standing at conversion discount even though there is still a considerable income advantage of the convertible over the ordinary. From our list, the convertibles coming into this category are the following: Beazer, Boddington, British Assets, F&C Eurotrust, Guinness, Town Centre among the loan stocks; FII Group, Friendly Hotels 5%, Friendly Hotels 4.75%, Queens Moat Houses, Warburg, Wyevale Garden Centres among the preference shares.
To say that the above cases are transparently undervalued is not to suggest that they are necessarily the most extreme cases of undervaluation. There could be other cases, of which Friendly Hotels 7% is an example, where a modest premium is matched by a very substantial income advantage indeed.
There can be little doubt in our view that convertibles in the London market are undervalued in comparison with the ordinary share. To attempt an explanation of this phenomenon would require a separate paper.
142
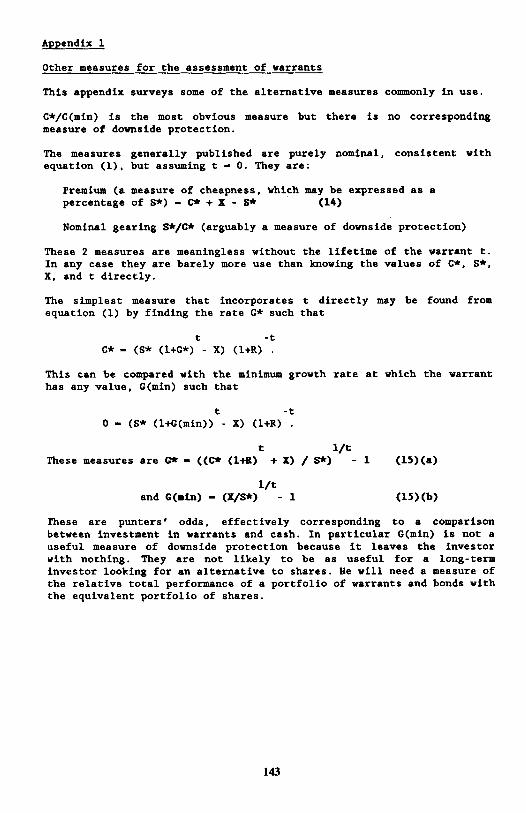
Appendix 1
Other measures for the assessment of warrants
This appendix surveys some of the alternative measures commonly in use.
C*/C(min) is the most obvious measure but there is no corresponding measure of downside protection.
The measures generally published are purely nominal, consistent with equation (1), but assuming t = 0. They are:
Premium (a measure of cheapness, which may be expressed as a percentage of S*) = c* + X - S* (14)
Nominal gearing S*/C* (arguably a measure of downside protection)
These 2 measures are meaningless without the lifetime of the warrant t. In any case they are barely more use than knowing the values of C*, S*, X, and t directly.
The simplest measure that incorporates t directly may be found from equation (1) by finding the rate G* such that
This can be compared with the minimum growth rate at which the warrant has any value, G(min) such that
These measures are (15) (a)
and (15) (b)
These are punters' odds, effectively corresponding to a comparison between investment in warrants and cash. In particular G(min) is not a useful measure of downside protection because it leaves the investor with nothing. They are not likely to be as useful for a long-term investor looking for an alternative to shares. He will need a measure of the relative total performance of a portfolio of warrants and bonds with the equivalent portfolio of shares.
143

References
Black, F. and M. Scholes (1972). The pricing of options and corporate liabilities, Journal of Political Economy 81.
Ingersoll, J.E. Jr (1976), A Theoretical and Empirical Investigation of the Dual Purpose Funds: An Application of Contingent Claim Analysis, Journal of Financial Economics (Volume 3, Nos 1/2, Jan/March 1976).
Jarrow, R.A. and A. Rudd (1983), Option Pricing, Richard Irwin
Acknowledgement
The authors wish to express their thanks to Laura Salvatori for assistance with the Charts.
144
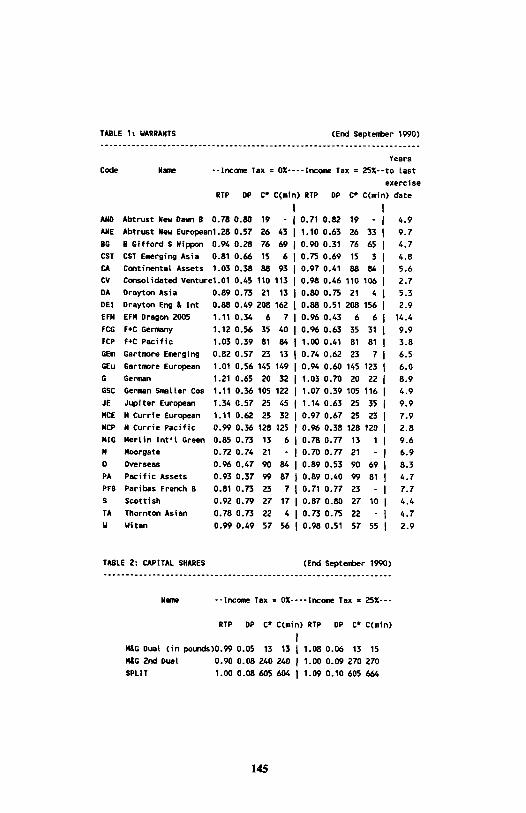
TABLE 1: WARRANTS (End September 1990)
Years
Code Name --Income Tax = O%----Income Tax = 25%--to Last
exercise
RTP DP C* C(min) RTP DP C* C(min) date
AND Abtrust New Dawn 8 0.78 0.80 19 - 0.71 0.82 19 - 4.9
ANE Abtrust New European1.28 0.57 26 43 1.10 0.63 26 33 9.7
BG B Gifford S Nippon 0.94 0.28 76 69 0.90 0.31 76 65 4.7
CST CST Emerging Asia 0.81 0.66 15 6 0.75 0.69 15 3 4.8
CA Continental Assets 1.03 0.38 88 93 0.97 0.41 88 84 5.6
CV Consolidated Venturel.O1 0.45 110 113 0.98 0.46 110 106 2.7
DA Drayton Asia 0.89 0.73 21 13 0.80 0.75 21 4 5.3
DEI Drayton Eng & Int 0.88 0.49 208 162 0.88 0.51 208 156 2.9
EFM EFM Dragon 2005 1.11 0.34 6 7 0.96 0.43 6 6 14.4
FCG F+C Germany 1.12 0.56 35 40 0.96 0.63 35 31 9.9
FCP F+C Pacific 1.03 0.39 81 84 1.00 0.41 81 81 3.8
GEm Gartmore Emerging 0.82 0.57 23 13 0.74 0.62 23 7 6.5
GEu Gartmore European 1.01 0.56 145 149 0.94 0.60 145 123 6.0
G German 1.21 0.65 20 32 1.03 0.70 20 22 8.9
GSC German Smaller Cos 1.11 0.36 105 122 1.07 0.39 105 116 4.9
JE Jupiter European 1.34 0.57 25 45 1.14 0.63 25 35 9.9
MCE M Currie European 1.11 0.62 25 32 0.97 0.67 25 23 7.9
MCP M Currie Pacific 0.99 0.36 128 125 0.96 0.38 128 120 2.8
MIG Merlin Int'l Green 0.85 0.73 13 6 0.78 0.77 13 1 9.6
M Moorgate 0.72 0.74 21 - 0.70 0.77 21 - 6.9
O Overseas 0.96 0.47 90 84 0.89 0.53 90 69 8.3
PA Pacific Assets 0.93 0.37 99 87 0.89 0.40 99 81 4.7
PFB Paribas French B 0.81 0.73 23 7 0.71 0.77 23 - 7.7
S Scottish 0.92 0.79 27 17 0.87 0.80 27 10 4.4
TA Thornton Asian 0.78 0.73 22 4 0.73 0.75 22 - 4.7
W Witan 0.99 0.49 57 56 0.98 0.51 57 55 2.9
TABLE 2: CAPITAL SHARES (End September 1990)
Name --Income Tax = 0%----Income Tax = 25%---
RTP DP C* C(min) RTP DP C* C(min)
M&G Dual (in pounds)O.99 0.05 13 13 1.08 0.06 13 15
M&G 2nd Dual 0.90 0.08 240 240 1.00 0.09 270 270
SPLIT 1.00 0.08 605 604 1.09 0.10 605 664
145
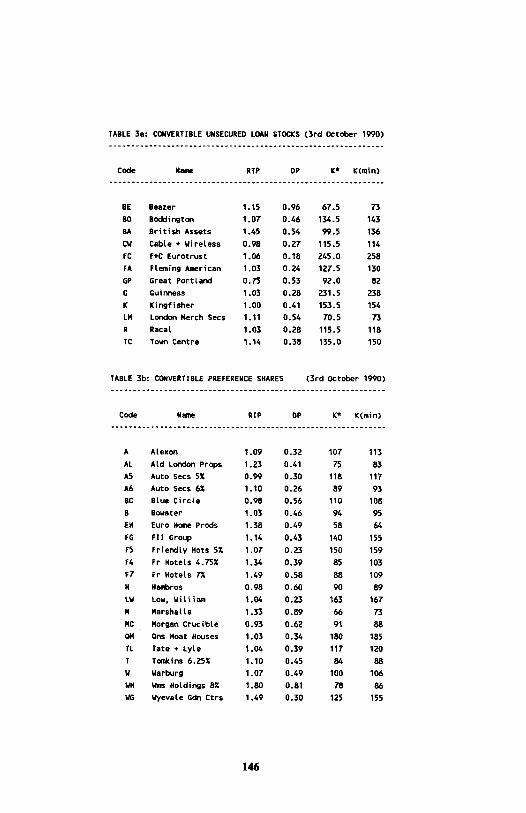
TABLE 3a: CONVERTIBLE UNSECURED LOAN STOCKS (3rd October 1990)
Code Name RTP DP K* K(min)
BE Beazer 1.15 0.96 67.5 73 BO Boddington 1.07 0.46 134.5 143 BA British Assets 1.45 0.54 99.5 136 CW Cable + Wireless 0.98 0.27 115.5 114 FC F+C Eurotrust 1.06 0.18 245.0 258 FA Fleming American 1.03 0.24 127.5 130 GP Great Portland 0.75 0.53 92.0 82 G Guinness 1.03 0.28 231.5 238 K Kingfisher 1.00 0.41 153.5 154 LM London Merch Secs 1.11 0.54 70.5 73 R Racal 1.03 0.28 115.5 118 TC Town Centre 1.14 0.38 135.0 150
TABLE 3b: CONVERTIBLE PREFERENCE SHARES (3rd October 1990)
Code Name RTP
A Alexon 1.09 0.32 107 113 AL Ald London Props 1.23 0.41 75 83 A5 Auto Secs 5% 0.99 0.30 118 117 A6 Auto Secs 6% 1.10 0.26 89 93 BC Blue Circle 0.98 0.56 110 108 B Bowater 1.03 0.46 94 95 EH Euro Home Prods 1.38 0.49 58 64 FG FII Group 1.14 0.43 140 155 F5 Friendly Hots 5% 1.07 0.23 150 159 F4 Fr Hotels 4.75% 1.34 0.39 85 103 F7 Fr Hotels 7% 1.49 0.58 88 109 H Hambros 0.98 0.60 90 89 LW Low, William 1.04 0.23 163 167 M Marshalls 1.33 0.89 66 73 MC Morgan Crucible 0.93 0.62 91 88 OM Ons Moat Houses 1.03 0.34 180 185 TL Tate + Lyle 1.04 0.39 117 120 T Tomkins 6.25% 1.10 0.45 84 88 W Warburg 1.07 0.49 100 106 WH Wms Holdings 8% 1.80 0.81 78 86 WG Wyevale Gdn Ctrs 1.49 0.30 125 155
DP K* K(min)
146
147
148
149
150
151