Embed Size (px)
Citation preview
"The assessment of the cognitive regulation of emotions in bipolar I disorder using galvanic skin
conductance and heart rate"
Fernando Corbalán
Department of Neurology and Neurosurgery
McGill University, Montreal
May 2011
A thesis submitted to McGill University in partial fulfillment of the requirements
of the degree of Master of Science
© Fernando Corbalán 2011
i
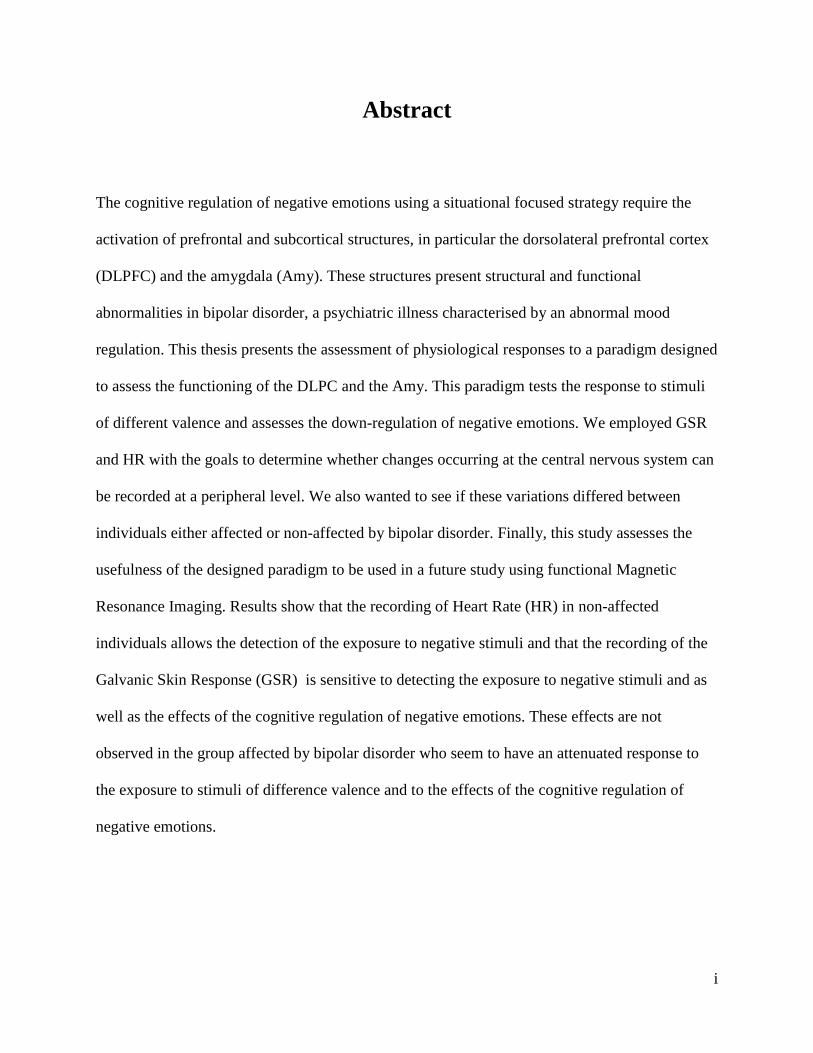
Abstract
The cognitive regulation of negative emotions using a situational focused strategy require the
activation of prefrontal and subcortical structures, in particular the dorsolateral prefrontal cortex
(DLPFC) and the amygdala (Amy). These structures present structural and functional
abnormalities in bipolar disorder, a psychiatric illness characterised by an abnormal mood
regulation. This thesis presents the assessment of physiological responses to a paradigm designed
to assess the functioning of the DLPC and the Amy. This paradigm tests the response to stimuli
of different valence and assesses the down-regulation of negative emotions. We employed GSR
and HR with the goals to determine whether changes occurring at the central nervous system can
be recorded at a peripheral level. We also wanted to see if these variations differed between
individuals either affected or non-affected by bipolar disorder. Finally, this study assesses the
usefulness of the designed paradigm to be used in a future study using functional Magnetic
Resonance Imaging. Results show that the recording of Heart Rate (HR) in non-affected
individuals allows the detection of the exposure to negative stimuli and that the recording of the
Galvanic Skin Response (GSR) is sensitive to detecting the exposure to negative stimuli and as
well as the effects of the cognitive regulation of negative emotions. These effects are not
observed in the group affected by bipolar disorder who seem to have an attenuated response to
the exposure to stimuli of difference valence and to the effects of the cognitive regulation of
negative emotions.
ii
Résumé
La régulation cognitive des émotions négatives avec une concentration sur la stratégie
situationnelle demande l’utilisation de structures préfrontales et subcorticales, en particulier
celles du cortex préfrontal dorsolateral et de l’amygdale. Ces structures présentent des anomalies
structurelles et fonctionnelles dans les troubles bipolaires, maladie qui se caractérise par une
anormale régulation de l’humeur. Cette thèse présente l’évaluation des réponses physiologiques à
un paradigme désigné à évaluer le fonctionnalisme du cortex préfrontal dorsolateral et de
l’amygdale.
Ce paradigme évalue les réponses aux stimuli émotionnels visuels ainsi que la réponse à la
régulation des émotions négatives. La conductance galvanique de la peau et le rythme cardiaque
ont étés employés pour déterminer si les changements qui se présentent au niveau du system
nerveux central peuvent être enregistrés au niveau périphérique. De plus, nous sommes intéressés
à déterminer si ces changements varient entre les personnes atteintes et non atteintes de trouble
bipolaire.
Enfin, cette étude vise à étudier si le paradigme employé serait utile pour une étude à venir en
imagerie cérébrale avec l’utilisation de résonance magnétique fonctionnelle. Les résultats de
cette étude ont démontré que chez les individus non atteint de trouble bipolaire l’enregistrement
du rythme cardiaque permet la détection à l’exposition aux stimuli négatifs. Les résultats ont
aussi démontré que la conductance de la peau est sensible à détecter l’exposition aux stimuli
négatifs ainsi que les effets de la régulation cognitive aux émotions négatives. Ces effets ne sont
pas aperçue chez les sujets atteintes de trouble affective bipolaire, lesquels semblent avoir des

iii
réponses atténués à l’exposition aux stimuli de différents types émotionnels et à l’effet de la
régulation cognitive des émotions négatives.
iv
Acknowledgements
I would like to extend my gratitude to Dr Serge Beaulieu, my supervisor in this thesis, who
directed the project and whose expertise in the field of bipolar disorder was indispensible in his
collaboration; Dr Jorge Armony, my co-supervisor, who actively collaborated in all technical
aspects related to the design and development of the project; to Sarah Izadi, for her invaluable
contribution to the data processing; to Claire Hun, who helped with the experimental procedure;
to Guy Jennings, Biopac Systems Canada, who provided technical support to this project; to all
members of the Bipolar Disorders Programs of the Douglas Hospital who kindly contributed to
the development of this study: Dr Mario Roy, Dr Suzanne Renaud, Dr Andrée Daigneault, Dr
Nancy Poirier, Ellen Paquette, Anton Chow, Rebecca Sable, Sybille Saury, Valerie Francois,
Roxanne Visceri and Julie Budge; and to all participants who accepted to participate in these
research studies.
v
Table of Contents
Abstract .......................................................................................................................................... i
Résumé........................................................................................................................................... ii
Acknowledgments ....................................................................................................................... iv
Contents .........................................................................................................................................v
List of Figures .............................................................................................................................. vi
List of Tables .............................................................................................................................. vii
Glossary ..................................................................................................................................... viii
Chapter 1: Introduction ................................................................................................................1
Chapter 2: Background.................................................................................................................2
2.1 Physiological measures..........................................................................................................2
2.2 Autonomic activation and its correlations .............................................................................8
2.3 Emotions ..............................................................................................................................12
2.4 Emotion regulation...............................................................................................................20
2.5 Bipolar disorder ...................................................................................................................28
Chapter 3: Methods .....................................................................................................................33
3.1 Subjects ................................................................................................................................33
3.2 Procedures............................................................................................................................34
3.3 Data analysis ........................................................................................................................35
Chapter 4: Results........................................................................................................................37
4.1 First experiment: Healthy Control Group ......................................................................37
4.1.1 Demographics .............................................................................................................38
4.1.2 Heart rate.....................................................................................................................38
4.1.3 Galvanic skin response ...............................................................................................39
4.1.4 Ratings ........................................................................................................................45
vi
4.2 Second experiment: Bipolar Group .................................................................................47
4.2.1 Demographics ...............................................................................................................47
4.2.2 Heart rate.......................................................................................................................47
4.2.3 Galvanic skin response .................................................................................................48
4.2.4 Ratings ..........................................................................................................................49
4.3 Bipolar Group versus Control Group..............................................................................50
4.3.1 Demographics ...............................................................................................................50
4.3.2 Heart rate.......................................................................................................................50
4.3.3 Galvanic skin response .................................................................................................52
4.3.4 Ratings ..........................................................................................................................57
Chapter 5: Discussion..................................................................................................................59
5.1 Healthy Control Group ........................................................................................................59
5.2 Bipolar Group ......................................................................................................................64
Chapter 6: Conclusions and Future Work ................................................................................67
Bibliography ................................................................................................................................69
Appendix A: Inclusion and Exclusion Criteria ........................................................................80
Appendix B: GSR and HR recordings ......................................................................................82
vii
List of Figures
FIGURE 1. SCHEME OF THE GLOBAL ORGANIZATION OF THE AUTONOMIC
NERVOUS SYSTEM. ADAPTED FROM SEQUEIRA ET AL. (SEQUEIRA, 2009). ...... 3
FIGURE 2. GLOBAL ORGANIZATION OF THE CENTRAL CONTROL OF
ELECTRODERMAL ACTIVITY RESULTING FROM ANIMAL AND HUMAN DATA.
ADAPTED FROM SEQUEIRA ET AL. (SEQUEIRA, 2009). ............................................. 4
FIGURE 3. DIURNAL VARIATIONS OF MEAN AMPLITUDE OF SKIN CONDUCTANCE
RESPONSES TO UNPLEASANT AND NEUTRAL PICTURES. ADAPTED FROM
SEQUEIRA ET AL. (SEQUEIRA, 2009). ............................................................................. 9
FIGURE 4. DIURNAL VARIATIONS OF MEAN VALUES OF EMOTIONAL EXPERIENCE
OBTAINED BY Z-TRANSFORMATION OF INDIVIDUAL DATA. ADAPTED FROM
HOT ET AL. (HOT, 2005). ................................................................................................. 10
FIGURE 5. “A CONSENSUAL PROCESS MODEL OF EMOTION REGULATION”.
ADAPTED FROM GROSS (GROSS, 1998). ...................................................................... 21
FIGURE 6. “THE EMOTION-GENERATIVE CYCLE”. ADAPTED FROM URRY ET AL.
(URRY H. , 2009)................................................................................................................. 22
viii
List of Tables
TABLE 1...................................................................................................................................... 38
TABLE 2...................................................................................................................................... 47
TABLE 3...................................................................................................................................... 50
ix
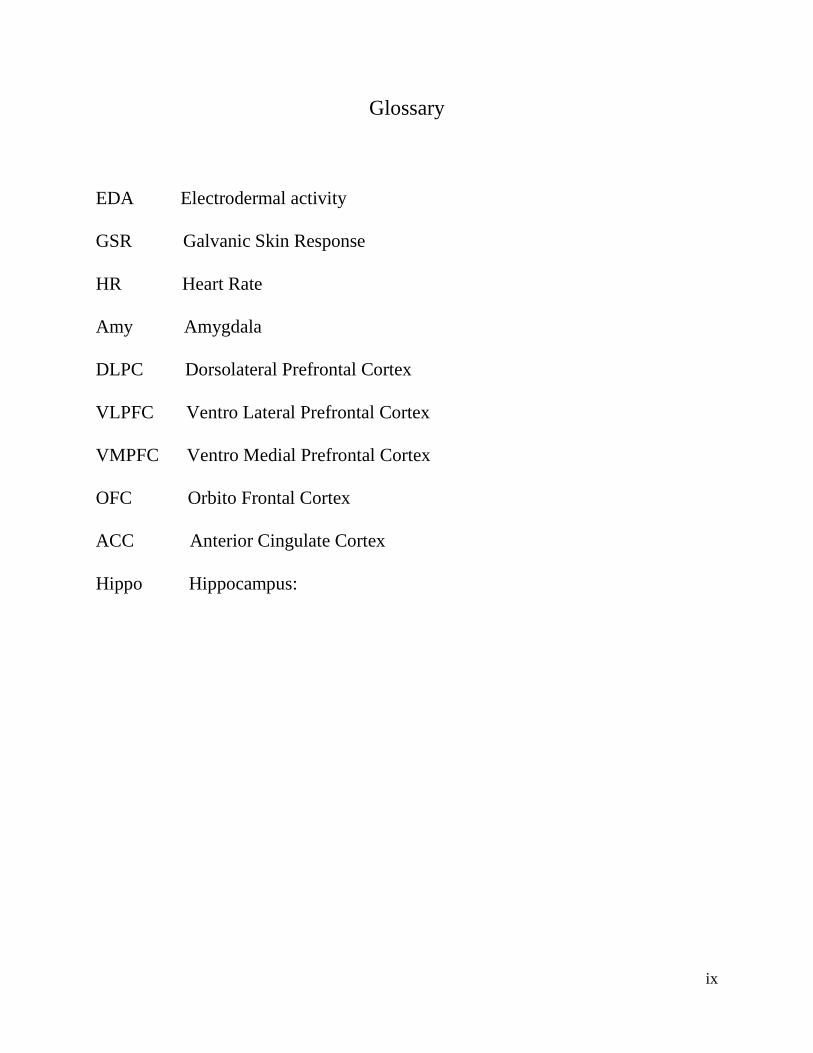
Glossary
EDA Electrodermal activity
GSR Galvanic Skin Response
HR Heart Rate
Amy Amygdala
DLPC Dorsolateral Prefrontal Cortex
VLPFC Ventro Lateral Prefrontal Cortex
VMPFC Ventro Medial Prefrontal Cortex
OFC Orbito Frontal Cortex
ACC Anterior Cingulate Cortex
Hippo Hippocampus:

x
"So, how are you supposed to stick this on your soul?" (Quino)

xi
1
Chapter 1
Introduction
Emotions generate different types of responses that can be measured according to the level of
expression: (1) the brain activation (assessed with brain imaging methods), (2) the autonomic
nervous system activation (assessed, for instance, with the GSR and HR), (3) the subjective
perception of the type of emotion felt and its degree of impact (measured with self rating scales),
and (4) the facial expression displayed in response to emotional states (assessed with the
recording of a facial muscle contraction). People affected by bipolar disorder present increased
activation of the Amy when exposed to negative emotions compared to controls; they also
present decreased activation of the DLPC when they perform cognitive tasks preceded by the
exposure to stimuli with negative content. These differential patterns of activation may lead to
presume that people affected by bipolar disorder will have difficulties in regulating negative
emotions because these processes require of the appropriate activation and interaction between
the DLPC and the Amy.
In this study we wanted to assess if people affected by bipolar disorder present a different pattern
of response to stimuli of different valence and if they have troubles regulating negative emotions
in comparison to a control group. We employed the recording of 2 physiological measures, GSR
and HR.
2
Chapter 2
Background
2.1 Physiological measures
Internal and external processes involving emotions, cognitive processes or physical activity
generate the activation of the autonomic nervous system. This system is composed by two major
divisions, the sympathetic and the parasympathetic, that are responsible of the control of the
involuntary visceral functions, such as the cardiovascular system (heart, blood vessels),
respiration, smooth muscles (most visceral organs), glands (endocrine and exocrine), sensory
systems (eyes, skin) and sexual arousal. The activation of these systems can be assessed by
recording peripheral physiological measures such as HR and GSR that indirectly provide
information about the perception of emotions and cognitive processes.
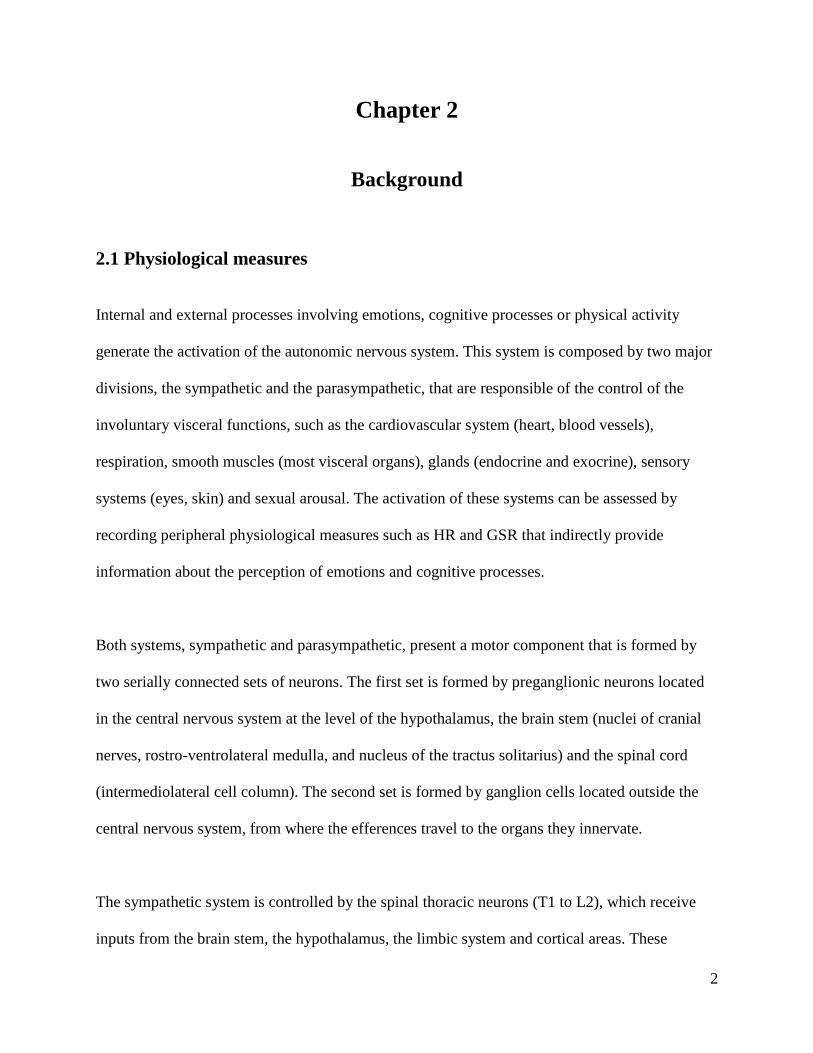
Both systems, sympathetic and parasympathetic, present a motor component that is formed by
two serially connected sets of neurons. The first set is formed by preganglionic neurons located
in the central nervous system at the level of the hypothalamus, the brain stem (nuclei of cranial
nerves, rostro-ventrolateral medulla, and nucleus of the tractus solitarius) and the spinal cord
(intermediolateral cell column). The second set is formed by ganglion cells located outside the
central nervous system, from where the efferences travel to the organs they innervate.
The sympathetic system is controlled by the spinal thoracic neurons (T1 to L2), which receive
inputs from the brain stem, the hypothalamus, the limbic system and cortical areas. These
3
preganglionic neurons synapse with postganglionic neurons (prevertebral, paravertebral and
adrenal medulla) sending the projections to target organs.
The parasympathetic system is controlled by preganglionic autonomic neurons located in the
brain stem (Cranial Nerves 3, 7, 9, 10) and the sacral spinal cord (S2, S3, S4), which synapse
with postganglionic neurons of the head or of organs (via the vagus nerve).
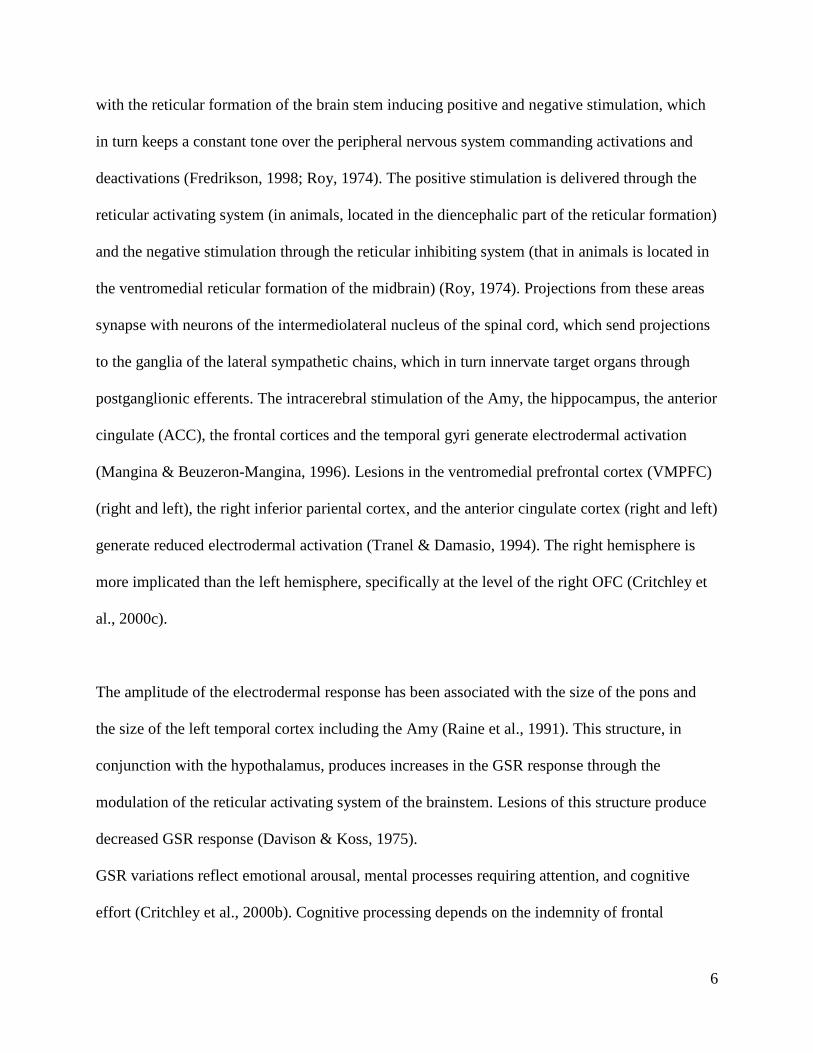
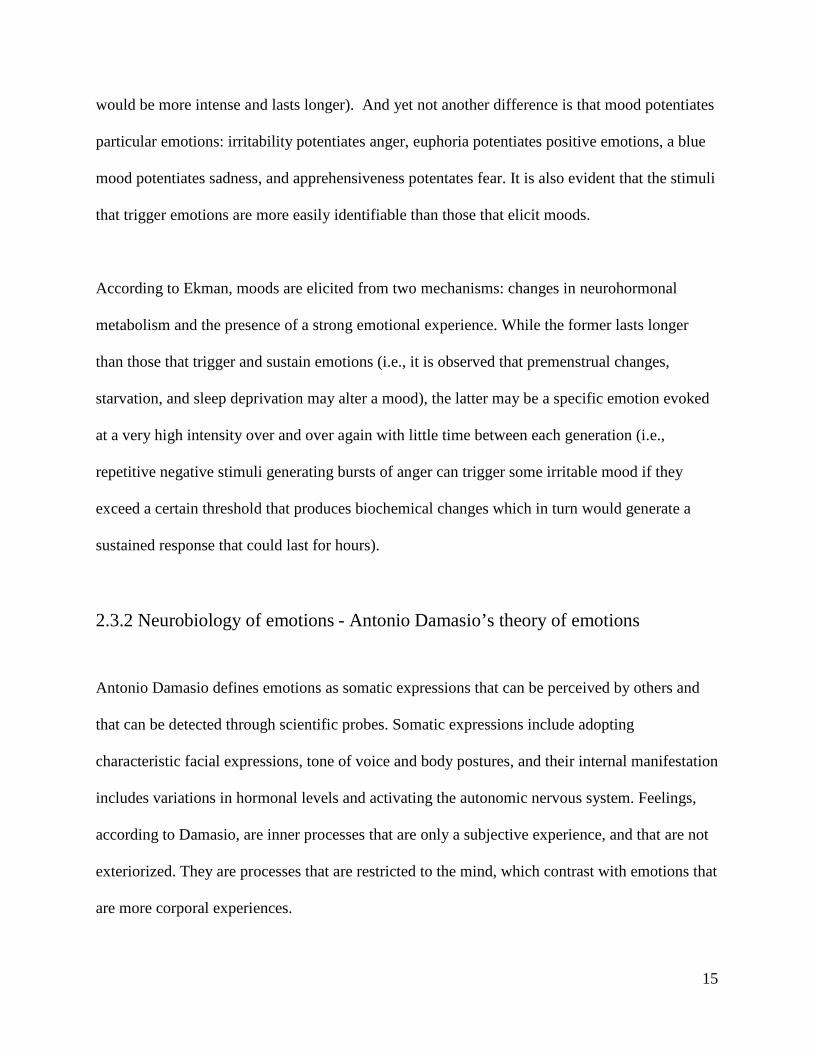
Central Nervous System Peripheral Nervous System Hypothalamus Brain stem Spinal cord Figure 1. Scheme of the global organization of the autonomic nervous system. Adapted from Sequeira et al. (Sequeira, 2009).
1
2
3
Cortical and limbic
Premotor neuron
Preganglionic neuron
4
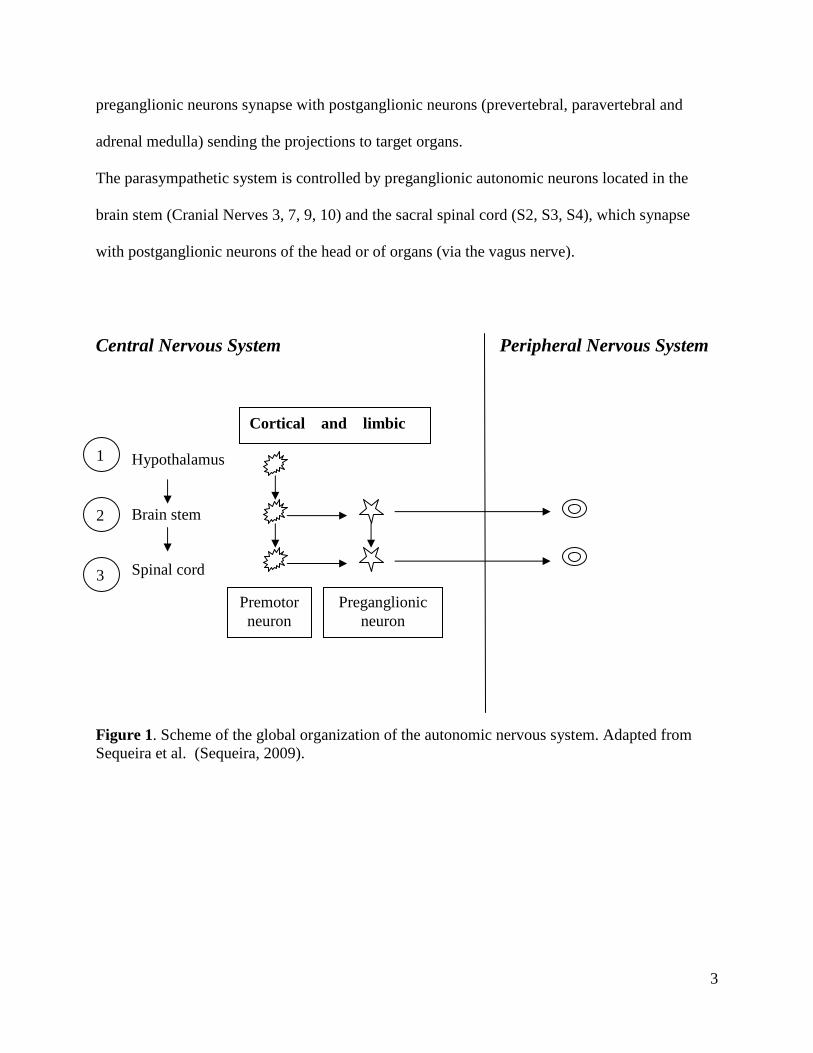
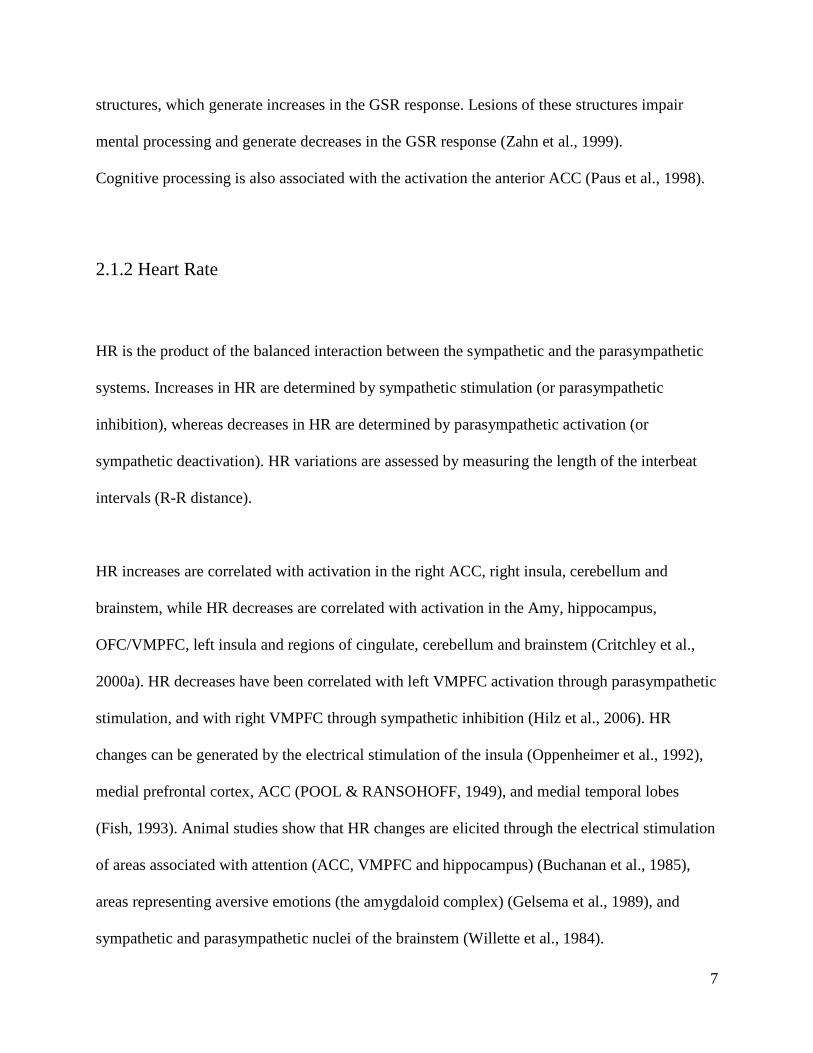
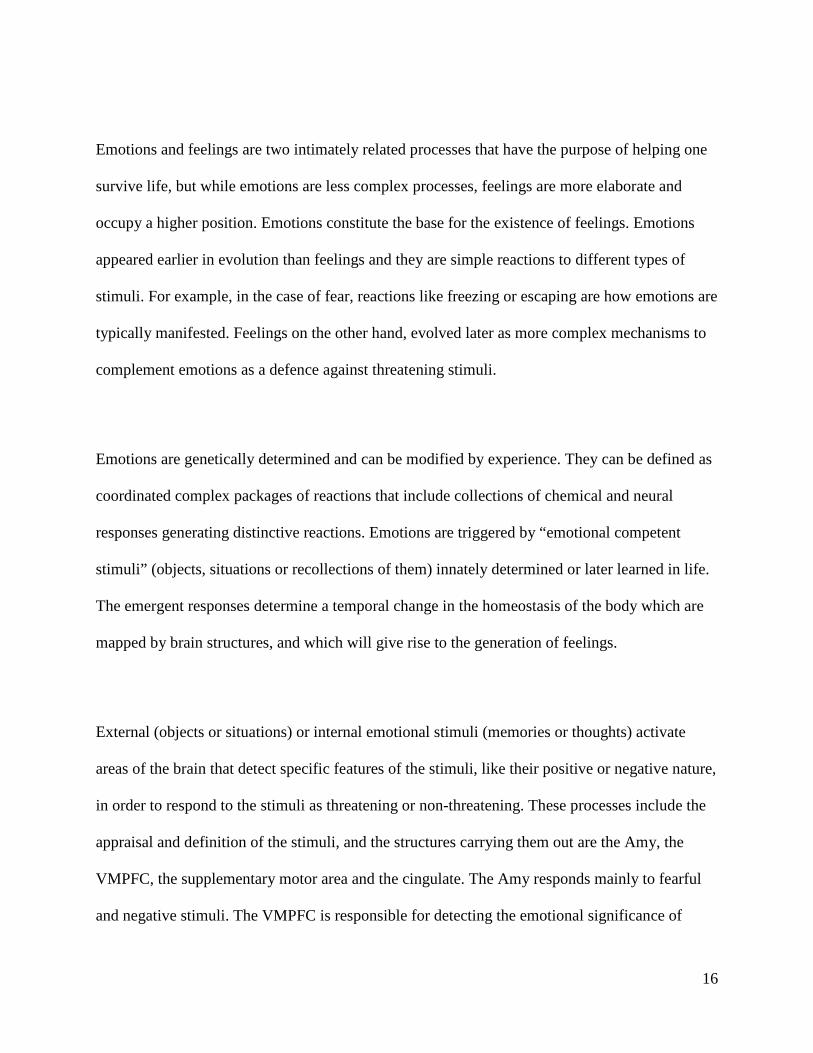
Figure 2. Global organization of the central control of electrodermal activity resulting from animal and human data. Adapted from Sequeira et al. (Sequeira, 2009). The postganglionic parasympathetic neurons lie close to or within the organs or tissues that they
innervate, whereas the sympathetic ganglia lie at a more distant site from their target organs. The
activation time in both systems is also different: the sympathetic response is slower (with a delay
of seconds) than the parasympathetic (expressed in millisenconds). Generally, the sympathetic
and the parasympathetic systems have opposing effects: one stimulates and the other inhibits.
The function of the sympathetic system is summed up by the phrase “fight and fly” (it prepares
for the defence facilitating the expenditure of energy) and the parasympathetic system, by "rest
Pariental Temporal Frontal Occipital
Cingulate Amygdala
Hipothalamus
RAS
RIS
PGN G S
G
Neocortex
Limbic areas
Brain stem
RAS: Reticular Activating System RIS: Reticular Inhibiting System PGN: Pre-Ganglionic Neuron G: Ganglionic Neuron PG: Post-Ganglionic Neuron
5
and digest" (it is activated during rest and sleep facilitating the expenditure of energy). The
sympathetic activity is stimulated by emotion, cognitive effort, cold, exercise, and pain, the
parasympathetic, by fear and relaxation (Sequeira, 2009).
There are a number of methods to assess the autonomic nervous system activity; however, GSR
and HR have been largely employed in the last decades. GSR is sensitive only to the sympathetic
activation, which produces increased responses; HR is sensitive to both activations -sympathetic
and parasympathetic- which produce increases and decreases, respectively.
2.1.1 Galvanic Skin Response
GSR measures the conductivity of the skin to an applied electrical current and depends on the
skin’s moisture determined by the stimulation of eccrine glands (activated by the sympathetic
system). This effect, known as electrodermal activity (EDA) comprises two main components:
electrodermal level and electrodermal responses. Electrodermal level referres to the spontaneous
electrical fluctuations of sweat glands activity resulting from the interaction between tonic
discharges of the sympathetic system and local factors (skin temperature and hydration).
Electrodermal responses, however, referre to the phasic sympathetic nervous discharges
associated with the processing of internal and external inputs.
Upper structures intervene in the elicitation of the EDA: the hypothalamus, the limbic system
(Amy, hippocampus, cingulate gyrus, and anterior insula) (Mangina & Beuzeron-Mangina,
1996), the cerebellum, the cortical frontal (in particular right orbitofrontal (OFC) -BA 47 to BA
11- and medial prefrontal cortex), and parietal areas (Critchley, 2000). These structures interact
6
with the reticular formation of the brain stem inducing positive and negative stimulation, which
in turn keeps a constant tone over the peripheral nervous system commanding activations and
deactivations (Fredrikson, 1998; Roy, 1974). The positive stimulation is delivered through the
reticular activating system (in animals, located in the diencephalic part of the reticular formation)
and the negative stimulation through the reticular inhibiting system (that in animals is located in
the ventromedial reticular formation of the midbrain) (Roy, 1974). Projections from these areas
synapse with neurons of the intermediolateral nucleus of the spinal cord, which send projections
to the ganglia of the lateral sympathetic chains, which in turn innervate target organs through
postganglionic efferents. The intracerebral stimulation of the Amy, the hippocampus, the anterior
cingulate (ACC), the frontal cortices and the temporal gyri generate electrodermal activation
(Mangina & Beuzeron-Mangina, 1996). Lesions in the ventromedial prefrontal cortex (VMPFC)
(right and left), the right inferior pariental cortex, and the anterior cingulate cortex (right and left)
generate reduced electrodermal activation (Tranel & Damasio, 1994). The right hemisphere is
more implicated than the left hemisphere, specifically at the level of the right OFC (Critchley et
al., 2000c).
The amplitude of the electrodermal response has been associated with the size of the pons and
the size of the left temporal cortex including the Amy (Raine et al., 1991). This structure, in
conjunction with the hypothalamus, produces increases in the GSR response through the
modulation of the reticular activating system of the brainstem. Lesions of this structure produce
decreased GSR response (Davison & Koss, 1975).
GSR variations reflect emotional arousal, mental processes requiring attention, and cognitive
effort (Critchley et al., 2000b). Cognitive processing depends on the indemnity of frontal
7
structures, which generate increases in the GSR response. Lesions of these structures impair
mental processing and generate decreases in the GSR response (Zahn et al., 1999).
Cognitive processing is also associated with the activation the anterior ACC (Paus et al., 1998).
2.1.2 Heart Rate
HR is the product of the balanced interaction between the sympathetic and the parasympathetic
systems. Increases in HR are determined by sympathetic stimulation (or parasympathetic
inhibition), whereas decreases in HR are determined by parasympathetic activation (or
sympathetic deactivation). HR variations are assessed by measuring the length of the interbeat
intervals (R-R distance).
HR increases are correlated with activation in the right ACC, right insula, cerebellum and
brainstem, while HR decreases are correlated with activation in the Amy, hippocampus,
OFC/VMPFC, left insula and regions of cingulate, cerebellum and brainstem (Critchley et al.,
2000a). HR decreases have been correlated with left VMPFC activation through parasympathetic
stimulation, and with right VMPFC through sympathetic inhibition (Hilz et al., 2006). HR
changes can be generated by the electrical stimulation of the insula (Oppenheimer et al., 1992),
medial prefrontal cortex, ACC (POOL & RANSOHOFF, 1949), and medial temporal lobes
(Fish, 1993). Animal studies show that HR changes are elicited through the electrical stimulation
of areas associated with attention (ACC, VMPFC and hippocampus) (Buchanan et al., 1985),
areas representing aversive emotions (the amygdaloid complex) (Gelsema et al., 1989), and
sympathetic and parasympathetic nuclei of the brainstem (Willette et al., 1984).
8
The right VMPFC is more important than the left VMPFC for the modulation of the
cardiovascular response to emotional stimuli (as well as for the control of anxiety) (Hilz et al.,
2006), which supports the hypothesis that the right cerebral hemisphere is more involved in
emotional processing than the left hemisphere (Hilz, 2006). This hypothesis is supported by the
observation that right-sided intracarotid sodium amytal injections in epileptic patients produce
faster HR increases and greater vagally mediated HR decreases than left-sided applications
(Ahern et al., 2001). Moreover, the cardiac autonomic innervation of the sinoauricular node of
the heart arises from right sympathetic and parasympathetic branches of both systems (Hilz,
2006).
2.2 Autonomic activation and its correlations
It has been observed that variations in the autonomic activity reflect the activation of brain
structures that participate in the operationalization of cognitive and emotional responses (Bundy
& Fitzgerald, 1975). The magnitude of emotional arousal or the effort performed in a cognitive
task can be assessed by evaluating variations in the activation of the autonomic nervous system
(Critchley et al., 2000a). In the field of emotions, for instance, unpleasant pictures produce
increases in GSR and HR (Palomba et al., 1997). Bradley and Lang have shown that the
amplitude of the EDA increases linearly with the subjective perception of arousal, independently
of the emotional valence (Bradley, 2000).
The magnitude of the emotional responses varies during the day, a fact that has lead to the
hypothesis that there would be a temporal organization of the psychophisiological states that
9
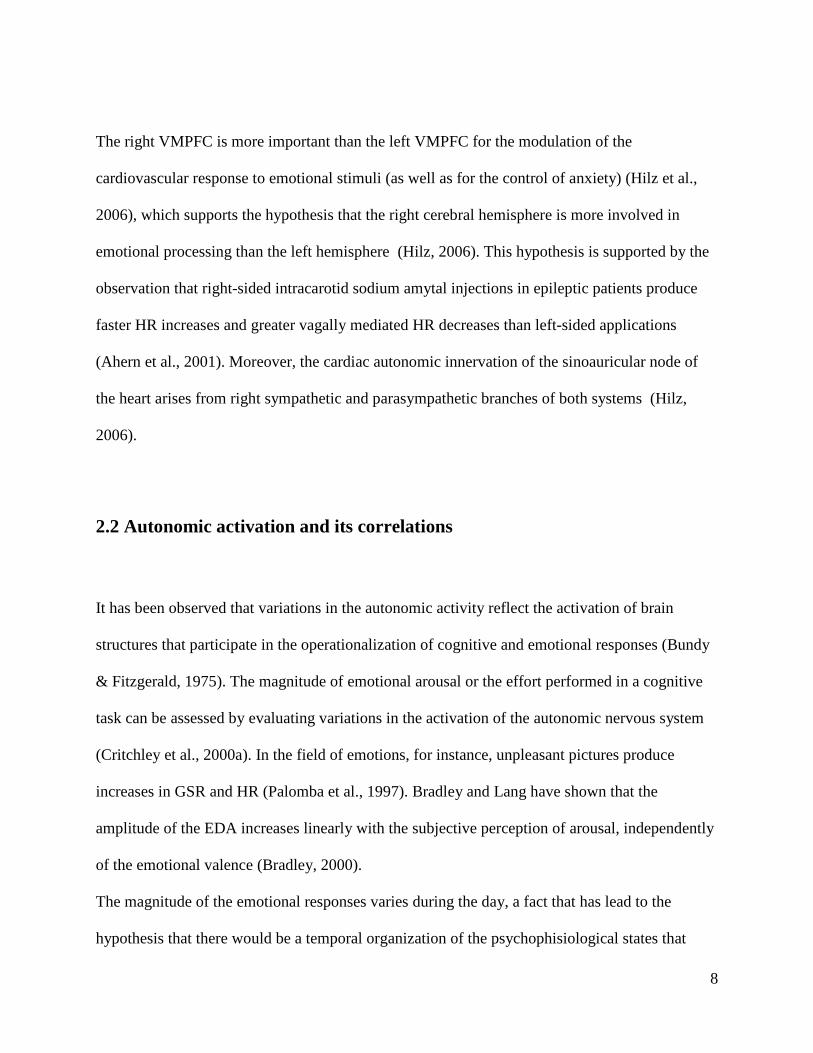
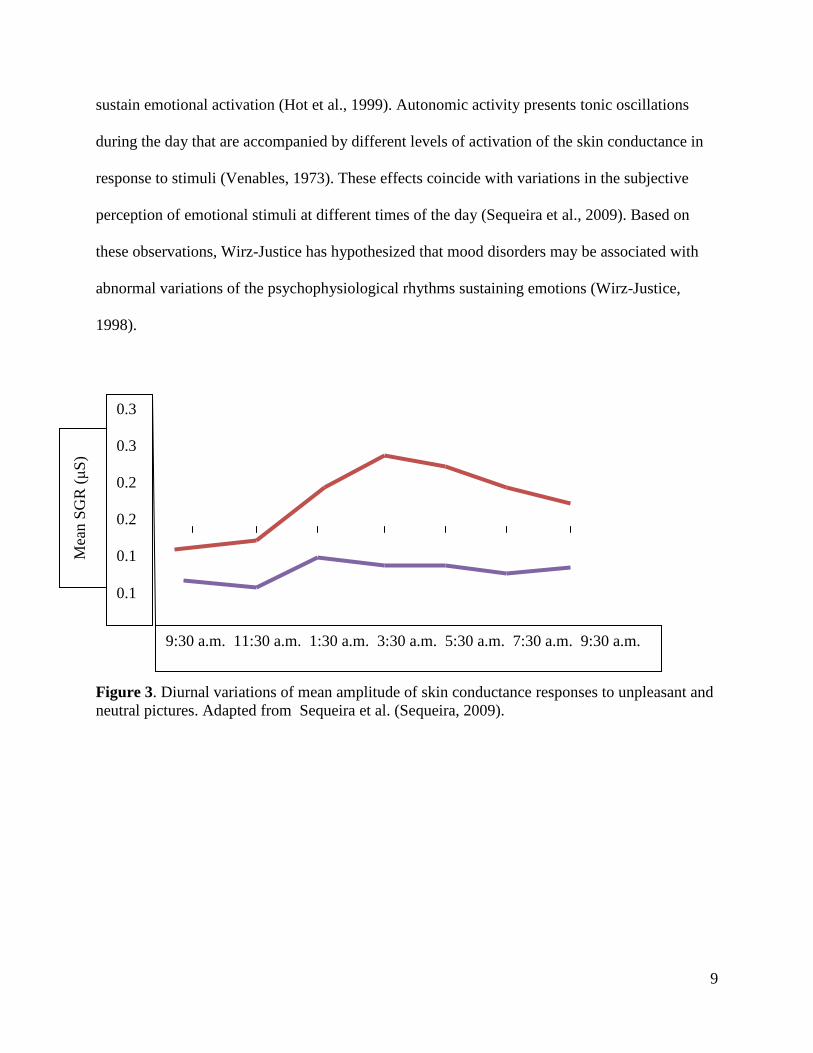
sustain emotional activation (Hot et al., 1999). Autonomic activity presents tonic oscillations
during the day that are accompanied by different levels of activation of the skin conductance in
response to stimuli (Venables, 1973). These effects coincide with variations in the subjective
perception of emotional stimuli at different times of the day (Sequeira et al., 2009). Based on
these observations, Wirz-Justice has hypothesized that mood disorders may be associated with
abnormal variations of the psychophysiological rhythms sustaining emotions (Wirz-Justice,
1998).
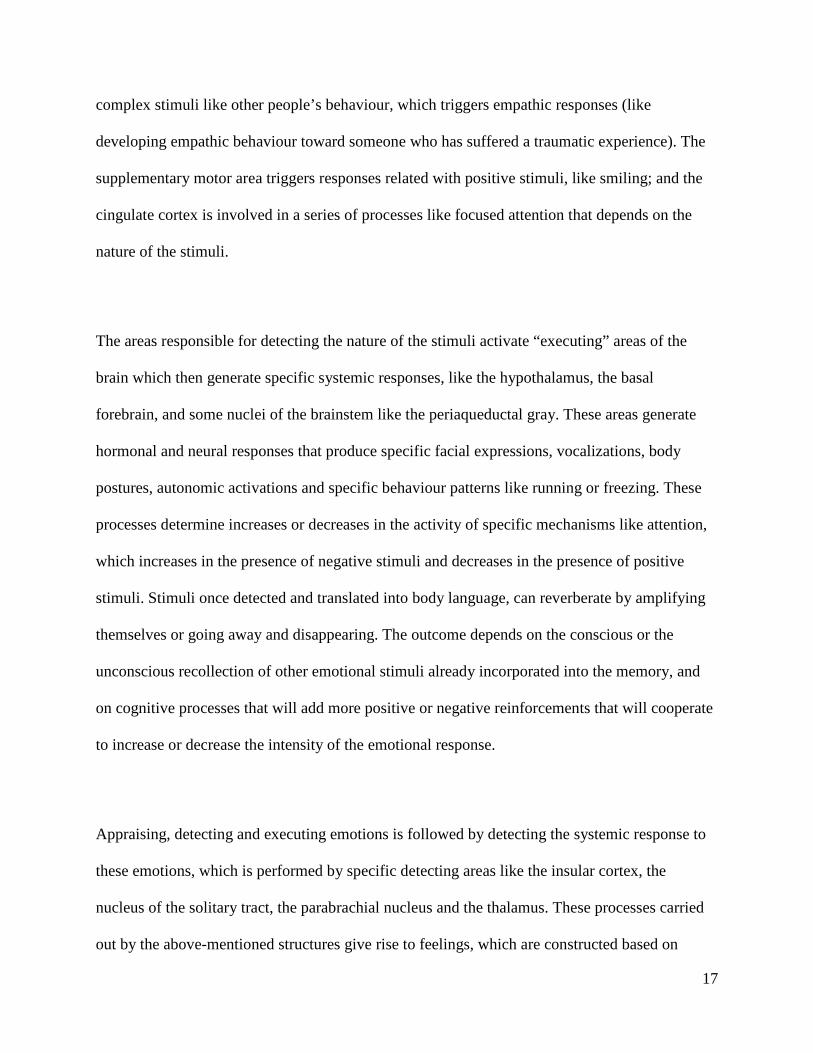
Figure 3. Diurnal variations of mean amplitude of skin conductance responses to unpleasant and neutral pictures. Adapted from Sequeira et al. (Sequeira, 2009).
0.3 0.3 0.2 0.2 0.1 0.1
Mea
n S
GR
(µS
)
9:30 a.m. 11:30 a.m. 1:30 a.m. 3:30 a.m. 5:30 a.m. 7:30 a.m. 9:30 a.m.
10
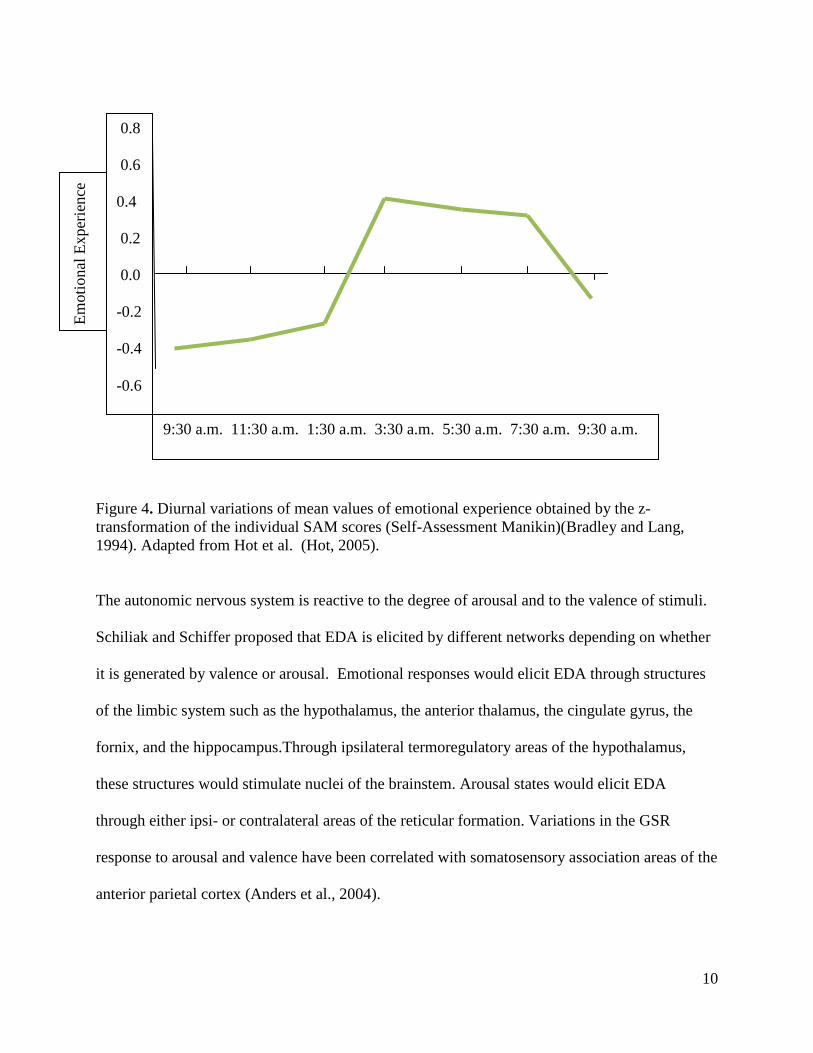
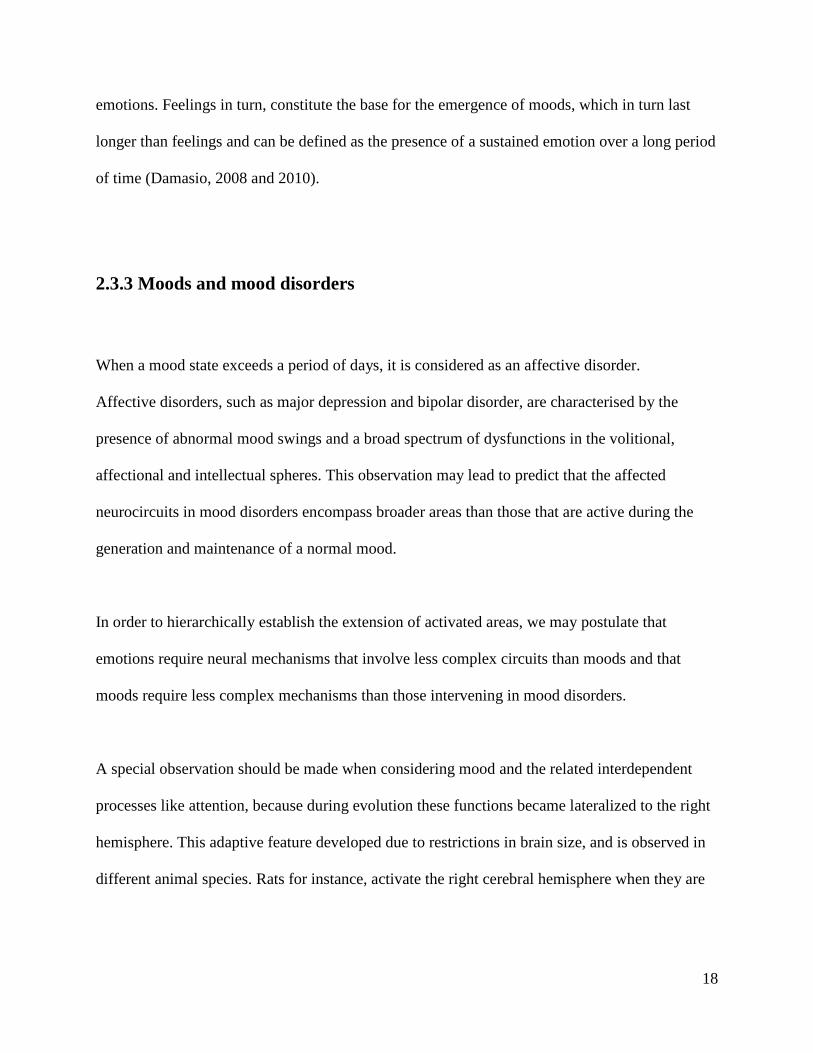
Figure 4. Diurnal variations of mean values of emotional experience obtained by the z-transformation of the individual SAM scores (Self-Assessment Manikin)(Bradley and Lang, 1994). Adapted from Hot et al. (Hot, 2005).
The autonomic nervous system is reactive to the degree of arousal and to the valence of stimuli.
Schiliak and Schiffer proposed that EDA is elicited by different networks depending on whether
it is generated by valence or arousal. Emotional responses would elicit EDA through structures
of the limbic system such as the hypothalamus, the anterior thalamus, the cingulate gyrus, the
fornix, and the hippocampus.Through ipsilateral termoregulatory areas of the hypothalamus,
these structures would stimulate nuclei of the brainstem. Arousal states would elicit EDA
through either ipsi- or contralateral areas of the reticular formation. Variations in the GSR
response to arousal and valence have been correlated with somatosensory association areas of the
anterior parietal cortex (Anders et al., 2004).
0.8 0.6 0.4 0.2 0.0 -0.2 -0.4 -0.6
Em
otio
nal E
xper
ienc
e
9:30 a.m. 11:30 a.m. 1:30 a.m. 3:30 a.m. 5:30 a.m. 7:30 a.m. 9:30 a.m.
11
GSR has been employed to assess strategies to regulate emotions. With reappraisal, for instance,
enhancement of the GSR is found when negative emotions are increased; however, no variations
are found when negative emotions are decreased (Eippert, 2007).
HR studies displaying faces have shown the relationships between HR variations and the type of
emotion displayed. These variations are associated with activations in the Amy, the insula, the
ACC, and the brainstem. Sad and angry faces generate increases in HR compared to happy or
disgusted faces, which are correlated with the Amy activation (Critchley et al., 2005).
Autonomic nervous system responses can be combined with brain imaging techniques to provide
a more complete picture of emotional responses. For instance, Eippert et al. studied the up-and
down-regulation of emotional responses using reappraisal strategies. As methods of study, they
used fMRI, startle eyeblink responses, and skin conductance. They found that the up-regulation
of emotions produced amplified skin conductance responses but produced no consistent effect
during down-regulation; fMRI images showed that the Amy up and down-regulated according to
regulation instructions. Down-regulation instructions activate the left anterior cingulate cortex,
the DLPC, and the OFC. Up-regulation activated the prefrontal cortex, but this was not restricted
to the left hemisphere. The authors concluded that there must be an overlap in cognitive
processes that underlies both up-and down-regulation (Eippert, 2007).
The autonomic nervous system responses can be modulated directly or indirectly by visual and
auditory projection to the thalamus or the frontomedial cortex without passing by the Amy
(Tranel & Damasio, 1994).
12
The time at which the reappraisal is applied influences the outcome of the procedure. Two
experiments have been developed to test this condition; the earlier procedures were found to be
more effective in the regulation of emotions (Sheppes, 2007).
2.3 Emotions
Emotions are biological responses necessary for an appropriate interaction with the environment.
They constitute the essential mechanism for the detection and avoidance of danger and are
critical for the successful development of interpersonal relationships (LeDoux, 1998). Emotions
can be generated by external or internal sources, and they can be regulated to adapt to changing
internal or external demands. Emotions act as fast mechanisms addressed to prepare human
beings for interpersonal encounters based on previous experiences (Ekman, 1992), and they
generate neurological, behavioural, experiential, and physiological responses (Gross J. , 1998).
Emotions are related to goals. For example, happiness relates to the achievement or maintenance
of a goal, sadness relates to the failure to attain or maintain a goal, anger relates to an agent that
causes the loss of a goal and fear relates to the expectation of failure to achieve a goal. Emotions
are perceived as the re-experience of previous emotional events, and therefore influenced by the
experiences of the past (Toobey, 1990).
Emotions are characterised by a series of common and particular features. Common features
include rapid onset; short duration (seconds or minutes, unless they are re-evoked); unbidden
occurrence (involuntary responses that cannot be elicited by their own will); automatic appraisal
13
(two appraisal mechanisms may be considered: one very fast that operates unconsciously and
one slower that is conscious); and coherence among responses. The particular features used to
differentiate emotions are signals (particular facial expression), physiology (distinctive
autonomic nervous response), and antecedent events (common elements in the contexts where
emotions occur).
Experts have tried to classify emotions based on different approaches. For instance, some
researchers divide emotions into “basic emotions” and “non-basic” emotions. Other researchers
consider the degree of emotional arousal (low or high) (Anders, 2004), the degree of
pleasantness (pleasant or unpleasant) or their valence (positive or negative) (Ax, 1953). Johnson
et al. define basic emotions as those accomplished with the 9 characteristics they consider key
elements. Only five types of emotions fulfill these criteria: fear, happiness, sadness, anger, and
disgust. Even though they do not present all the 9 characteristics postulated as key elements,
other types of emotions, such as surprise, contempt, shame, guilt, embarrassment, and awe, may
also be considered as basic emotions (Johnson-Laird, 1989).
Ekman has also postulated that emotions can be grouped into families according to the
characteristics they share, such as common features in expression, physiological activity,
antecedent events and the appraisal processes (Ekman, 1992). A meta-analysis that included 55
studies assessing the neural correlates of fear, anger, disgust, sadness, and happiness showed no
major differences in the brain regions that they activate. Only fear showed significant differential
activation in the Amy and sadness in the subcallosal cingulate cortex (Phan et al., 2002).

14
The displaying of visual emotional stimuli produces the activation of the occipital cortex, Amy,
ACC, and insula when stimulus process is required (compared with passive viewing) (Phan et
al., 2002). The valence of the stimuli is correlated with activation of the Amy (Anders et al.,
2004).
2.3.1 Emotions and moods
Few experts have approached topics regarding the difference between emotions and moods. Paul
Ekman, for instance, considers that the difference between an emotion and a mood can be
determined by the duration of the event, the presence of a trigger and the involved neurocircuit.
According to Ekman, emotions are brief episodes that last anywhere from seconds to minutes
and are generated by triggers. In contrast, moods last longer than emotions, anywhere from hours
to days (even though emotions can be elicited repeatedly on a constant basis and made to
resemble a mood). Emotions and moods are also determined by the involvement of different
neurocircuits that direct and maintain these affective states (Ekman, 1994).
Ekman emphasizes that the main difference between emotions and moods is the duration, even
though other characteristics should be considered when differentiating them.
Moods seem to lower the arousal threshold for emotions, thus some emotions are more easily
generated during a particular mood state (i.e., a person in an already irritable mood tends to
became angrier more easily). Another difference lies in the apparent difficulty to modulate
emotions during the influence of a mood (i.e., a person in an irritable mood has a greater
difficulty to modulate an episode of anger than when not in such a mood and the irritability
15
would be more intense and lasts longer). And yet not another difference is that mood potentiates
particular emotions: irritability potentiates anger, euphoria potentiates positive emotions, a blue
mood potentiates sadness, and apprehensiveness potentates fear. It is also evident that the stimuli
that trigger emotions are more easily identifiable than those that elicit moods.
According to Ekman, moods are elicited from two mechanisms: changes in neurohormonal
metabolism and the presence of a strong emotional experience. While the former lasts longer
than those that trigger and sustain emotions (i.e., it is observed that premenstrual changes,
starvation, and sleep deprivation may alter a mood), the latter may be a specific emotion evoked
at a very high intensity over and over again with little time between each generation (i.e.,
repetitive negative stimuli generating bursts of anger can trigger some irritable mood if they
exceed a certain threshold that produces biochemical changes which in turn would generate a
sustained response that could last for hours).
2.3.2 Neurobiology of emotions - Antonio Damasio’s theory of emotions
Antonio Damasio defines emotions as somatic expressions that can be perceived by others and
that can be detected through scientific probes. Somatic expressions include adopting
characteristic facial expressions, tone of voice and body postures, and their internal manifestation
includes variations in hormonal levels and activating the autonomic nervous system. Feelings,
according to Damasio, are inner processes that are only a subjective experience, and that are not
exteriorized. They are processes that are restricted to the mind, which contrast with emotions that
are more corporal experiences.
16
Emotions and feelings are two intimately related processes that have the purpose of helping one
survive life, but while emotions are less complex processes, feelings are more elaborate and
occupy a higher position. Emotions constitute the base for the existence of feelings. Emotions
appeared earlier in evolution than feelings and they are simple reactions to different types of
stimuli. For example, in the case of fear, reactions like freezing or escaping are how emotions are
typically manifested. Feelings on the other hand, evolved later as more complex mechanisms to
complement emotions as a defence against threatening stimuli.
Emotions are genetically determined and can be modified by experience. They can be defined as
coordinated complex packages of reactions that include collections of chemical and neural
responses generating distinctive reactions. Emotions are triggered by “emotional competent
stimuli” (objects, situations or recollections of them) innately determined or later learned in life.
The emergent responses determine a temporal change in the homeostasis of the body which are
mapped by brain structures, and which will give rise to the generation of feelings.
External (objects or situations) or internal emotional stimuli (memories or thoughts) activate
areas of the brain that detect specific features of the stimuli, like their positive or negative nature,
in order to respond to the stimuli as threatening or non-threatening. These processes include the
appraisal and definition of the stimuli, and the structures carrying them out are the Amy, the
VMPFC, the supplementary motor area and the cingulate. The Amy responds mainly to fearful
and negative stimuli. The VMPFC is responsible for detecting the emotional significance of
17
complex stimuli like other people’s behaviour, which triggers empathic responses (like
developing empathic behaviour toward someone who has suffered a traumatic experience). The
supplementary motor area triggers responses related with positive stimuli, like smiling; and the
cingulate cortex is involved in a series of processes like focused attention that depends on the
nature of the stimuli.
The areas responsible for detecting the nature of the stimuli activate “executing” areas of the
brain which then generate specific systemic responses, like the hypothalamus, the basal
forebrain, and some nuclei of the brainstem like the periaqueductal gray. These areas generate
hormonal and neural responses that produce specific facial expressions, vocalizations, body
postures, autonomic activations and specific behaviour patterns like running or freezing. These
processes determine increases or decreases in the activity of specific mechanisms like attention,
which increases in the presence of negative stimuli and decreases in the presence of positive
stimuli. Stimuli once detected and translated into body language, can reverberate by amplifying
themselves or going away and disappearing. The outcome depends on the conscious or the
unconscious recollection of other emotional stimuli already incorporated into the memory, and
on cognitive processes that will add more positive or negative reinforcements that will cooperate
to increase or decrease the intensity of the emotional response.
Appraising, detecting and executing emotions is followed by detecting the systemic response to
these emotions, which is performed by specific detecting areas like the insular cortex, the
nucleus of the solitary tract, the parabrachial nucleus and the thalamus. These processes carried
out by the above-mentioned structures give rise to feelings, which are constructed based on
18
emotions. Feelings in turn, constitute the base for the emergence of moods, which in turn last
longer than feelings and can be defined as the presence of a sustained emotion over a long period
of time (Damasio, 2008 and 2010).
2.3.3 Moods and mood disorders
When a mood state exceeds a period of days, it is considered as an affective disorder.
Affective disorders, such as major depression and bipolar disorder, are characterised by the
presence of abnormal mood swings and a broad spectrum of dysfunctions in the volitional,
affectional and intellectual spheres. This observation may lead to predict that the affected
neurocircuits in mood disorders encompass broader areas than those that are active during the
generation and maintenance of a normal mood.
In order to hierarchically establish the extension of activated areas, we may postulate that
emotions require neural mechanisms that involve less complex circuits than moods and that
moods require less complex mechanisms than those intervening in mood disorders.
A special observation should be made when considering mood and the related interdependent
processes like attention, because during evolution these functions became lateralized to the right
hemisphere. This adaptive feature developed due to restrictions in brain size, and is observed in
different animal species. Rats for instance, activate the right cerebral hemisphere when they are
19
required to perform tasks involving spatial abilities, and chicks when they are exposed to
emotion-provoking situations (Denenberg, 1981).
Human beings present cerebral lateralization for functions related to emotions. Etcoff showed
that lesions in the right hemisphere produce greater impairments in recognizing facial emotional
expressions (Etcoff, 1989), and Gazzaniga found that behavioural responses to emotion-
provoking stimuli depend also on the same hemisphere being activated (Gazzaniga, 1998).
Studies done by Davidson using EEG showed that negative emotional stimuli cause the right
hemisphere to be activated while positive emotional stimuli generate left hemispheric activation
(Davidson, 1992 and 1990). Geschwind and Galaburda state that the right hemisphere develops
before the left hemisphere prenatally, giving it some advantages in terms of specialization like
hemispheric lateralization of certain functions. One of the major specializations that depends on
the right hemisphere is attention, which functions closely with two other specialized functions
that depend on the right hemisphere: spatial orientation and emotion. Spatial orientation is
related to the analysis of external space and in the orientation of the body within this space, while
emotional processes are related to the subjective experience of emotions and their external
expression (Geschwind and Galaburda, 1987). Lesions affecting the right hemisphere are more
likely to generate mood disorders than lesions in the left hemisphere (Gruzelier, 1979).
20
2.4 Emotion regulation
Emotion regulation is the activation of mental processes to modify the initiation or the ongoing
course of an emotional response (Ochsner & Gross, 2005). These regulatory processes are
essential for the achievement and maintenance of the psychological well-being (Johnson-Laird,
1989). Emotion regulatory processes can be conscious (voluntary) or unconscious (involuntary),
and they allow the enhancement, reduction, or maintenance of emotions (Mauss, 2007).
In 1964, Speisman, Lazarus, Mordkoff, and Davison found that participants who were exposed
to a disgusting film exhibited lower HR and skin conductance levels when they performed an
intellectual task or used denial appraisals, compared to the performance of traumatic appraisals
(Speisman et al., 1964). The same effect was also observed by Lazarus and Alfert when adding a
verbal introduction to the disgusting clip indicating that the clip is neither dangerous nor painful
(LAZARUS & ALFERT, 1964).
21
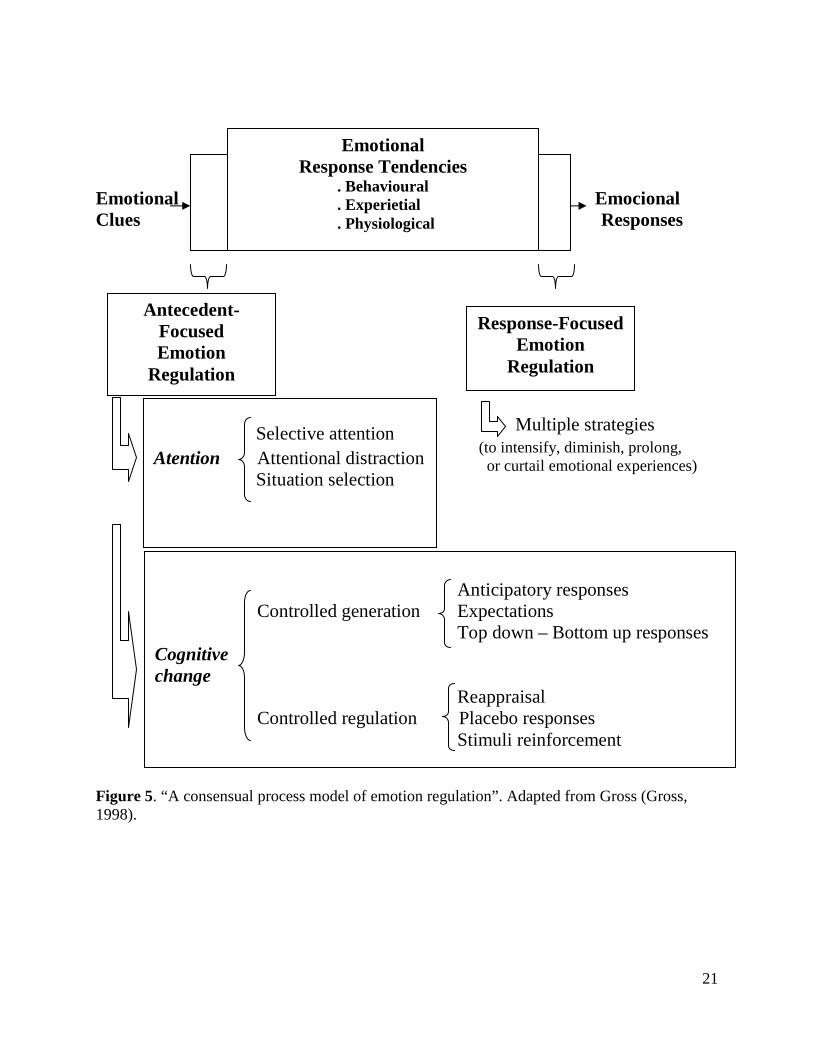
Emotional Emocional Clues Responses Multiple strategies (to intensify, diminish, prolong, or curtail emotional experiences) Figure 5. “A consensual process model of emotion regulation”. Adapted from Gross (Gross, 1998).
Response-Focused Emotion
Regulation
Antecedent-Focused Emotion
Regulation
Selective attention Atention Attentional distraction Situation selection
Anticipatory responses Controlled generation Expectations Top down – Bottom up responses Cognitive change Reappraisal Controlled regulation Placebo responses Stimuli reinforcement
Emotional Response Tendencies
. Behavioural . Experietial . Physiological
22
2.4.1 Types of regulation
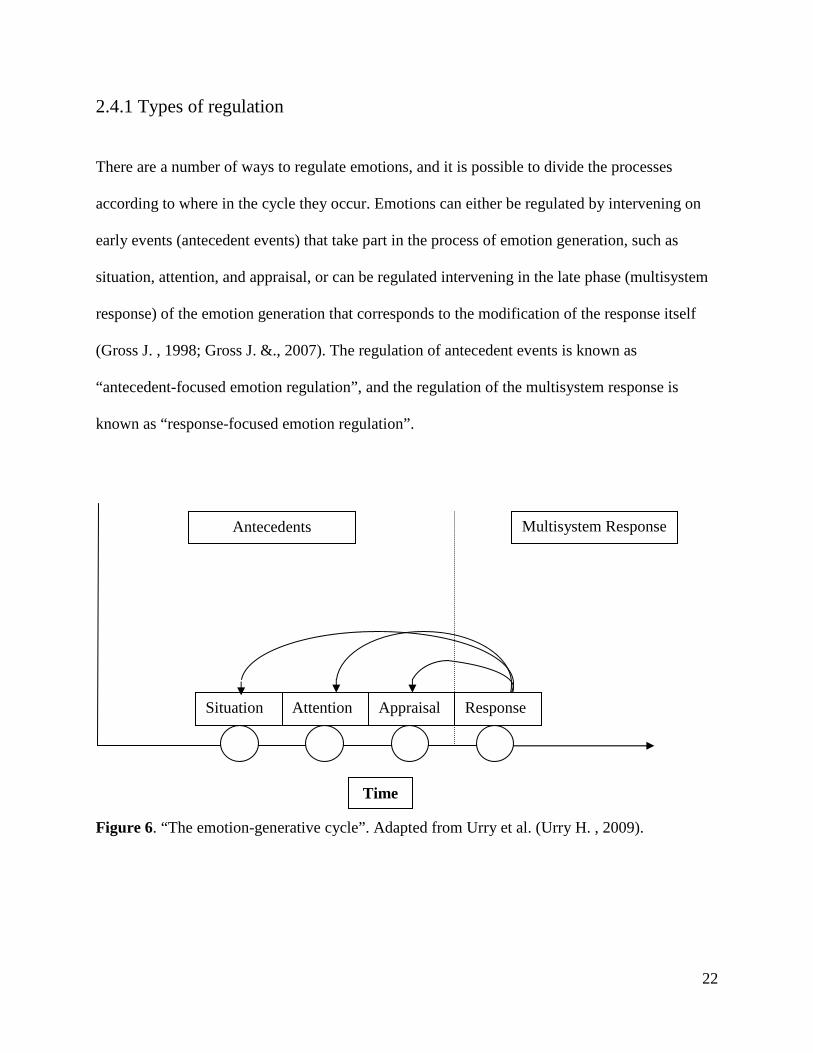
There are a number of ways to regulate emotions, and it is possible to divide the processes
according to where in the cycle they occur. Emotions can either be regulated by intervening on
early events (antecedent events) that take part in the process of emotion generation, such as
situation, attention, and appraisal, or can be regulated intervening in the late phase (multisystem
response) of the emotion generation that corresponds to the modification of the response itself
(Gross J. , 1998; Gross J. &., 2007). The regulation of antecedent events is known as
“antecedent-focused emotion regulation”, and the regulation of the multisystem response is
known as “response-focused emotion regulation”.
Figure 6. “The emotion-generative cycle”. Adapted from Urry et al. (Urry H. , 2009).
Situation Attention Appraisal Response
Time
Antecedents Multisystem Response
23
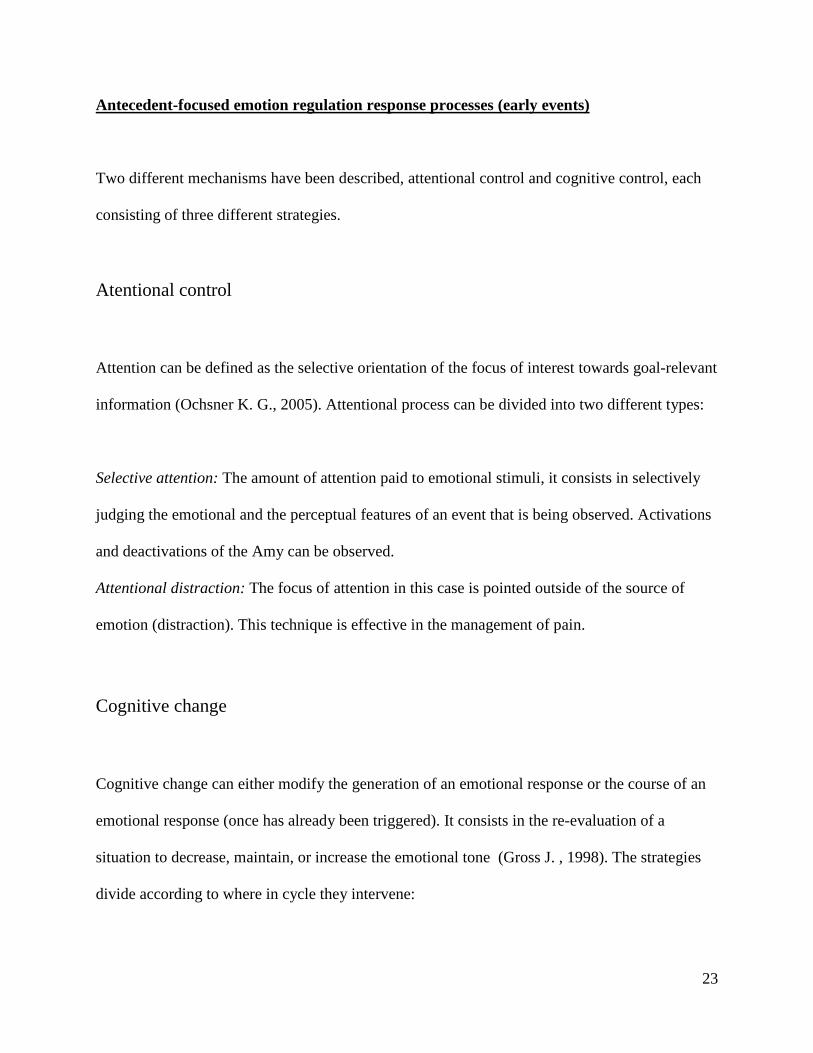
Antecedent-focused emotion regulation response processes (early events)
Two different mechanisms have been described, attentional control and cognitive control, each
consisting of three different strategies.
Atentional control
Attention can be defined as the selective orientation of the focus of interest towards goal-relevant
information (Ochsner K. G., 2005). Attentional process can be divided into two different types:
Selective attention: The amount of attention paid to emotional stimuli, it consists in selectively
judging the emotional and the perceptual features of an event that is being observed. Activations
and deactivations of the Amy can be observed.
Attentional distraction: The focus of attention in this case is pointed outside of the source of
emotion (distraction). This technique is effective in the management of pain.
Cognitive change
Cognitive change can either modify the generation of an emotional response or the course of an
emotional response (once has already been triggered). It consists in the re-evaluation of a
situation to decrease, maintain, or increase the emotional tone (Gross J. , 1998). The strategies
divide according to where in cycle they intervene:
24
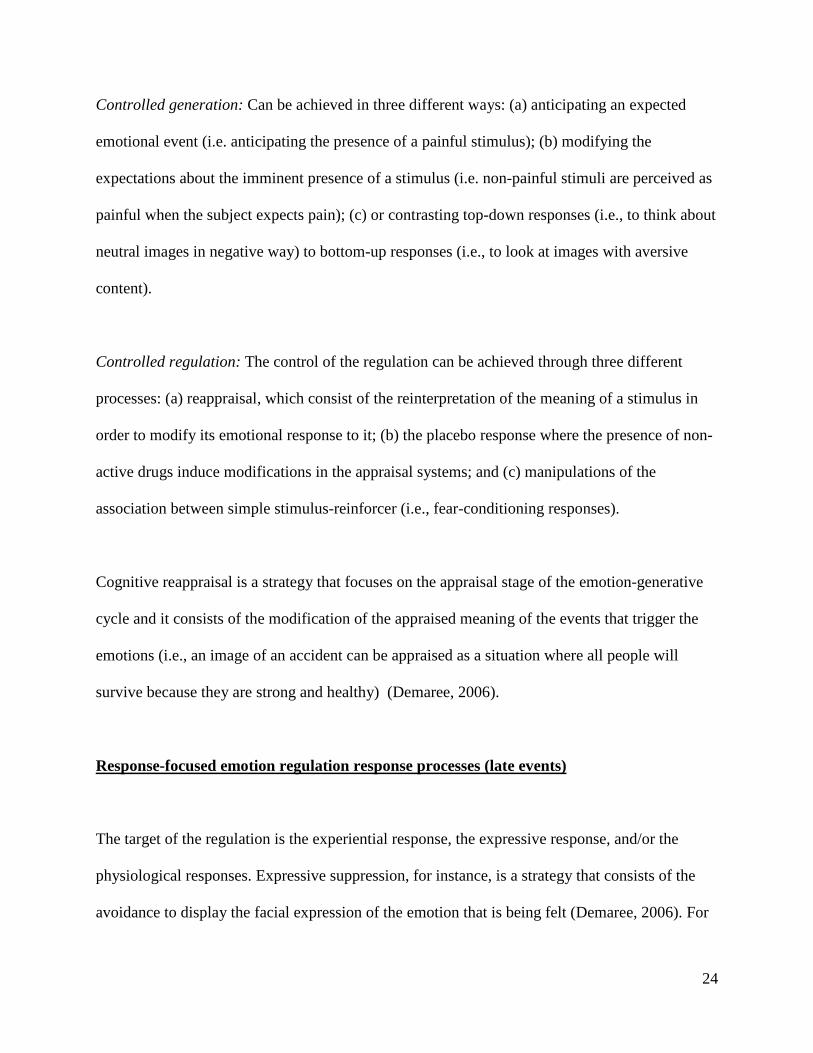
Controlled generation: Can be achieved in three different ways: (a) anticipating an expected
emotional event (i.e. anticipating the presence of a painful stimulus); (b) modifying the
expectations about the imminent presence of a stimulus (i.e. non-painful stimuli are perceived as
painful when the subject expects pain); (c) or contrasting top-down responses (i.e., to think about
neutral images in negative way) to bottom-up responses (i.e., to look at images with aversive
content).
Controlled regulation: The control of the regulation can be achieved through three different
processes: (a) reappraisal, which consist of the reinterpretation of the meaning of a stimulus in
order to modify its emotional response to it; (b) the placebo response where the presence of non-
active drugs induce modifications in the appraisal systems; and (c) manipulations of the
association between simple stimulus-reinforcer (i.e., fear-conditioning responses).
Cognitive reappraisal is a strategy that focuses on the appraisal stage of the emotion-generative
cycle and it consists of the modification of the appraised meaning of the events that trigger the
emotions (i.e., an image of an accident can be appraised as a situation where all people will
survive because they are strong and healthy) (Demaree, 2006).
Response-focused emotion regulation response processes (late events)
The target of the regulation is the experiential response, the expressive response, and/or the
physiological responses. Expressive suppression, for instance, is a strategy that consists of the
avoidance to display the facial expression of the emotion that is being felt (Demaree, 2006). For
25
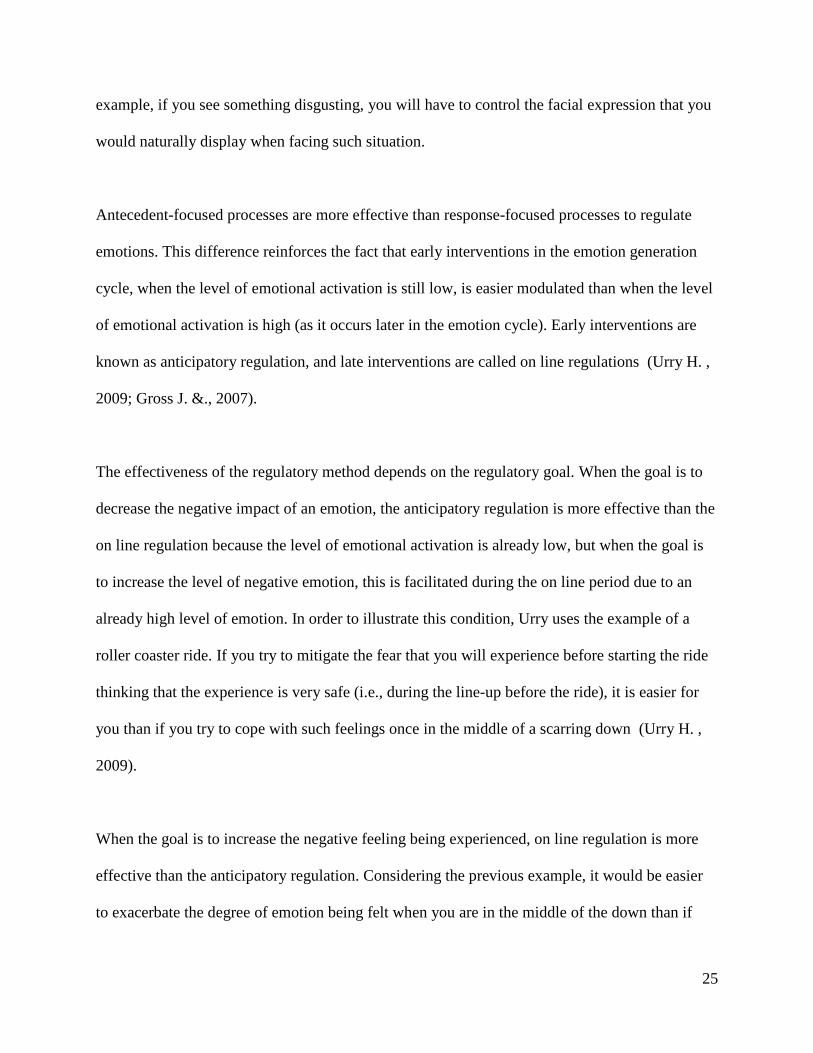
example, if you see something disgusting, you will have to control the facial expression that you
would naturally display when facing such situation.
Antecedent-focused processes are more effective than response-focused processes to regulate
emotions. This difference reinforces the fact that early interventions in the emotion generation
cycle, when the level of emotional activation is still low, is easier modulated than when the level
of emotional activation is high (as it occurs later in the emotion cycle). Early interventions are
known as anticipatory regulation, and late interventions are called on line regulations (Urry H. ,
2009; Gross J. &., 2007).
The effectiveness of the regulatory method depends on the regulatory goal. When the goal is to
decrease the negative impact of an emotion, the anticipatory regulation is more effective than the
on line regulation because the level of emotional activation is already low, but when the goal is
to increase the level of negative emotion, this is facilitated during the on line period due to an
already high level of emotion. In order to illustrate this condition, Urry uses the example of a
roller coaster ride. If you try to mitigate the fear that you will experience before starting the ride
thinking that the experience is very safe (i.e., during the line-up before the ride), it is easier for
you than if you try to cope with such feelings once in the middle of a scarring down (Urry H. ,
2009).
When the goal is to increase the negative feeling being experienced, on line regulation is more
effective than the anticipatory regulation. Considering the previous example, it would be easier
to exacerbate the degree of emotion being felt when you are in the middle of the down than if
26
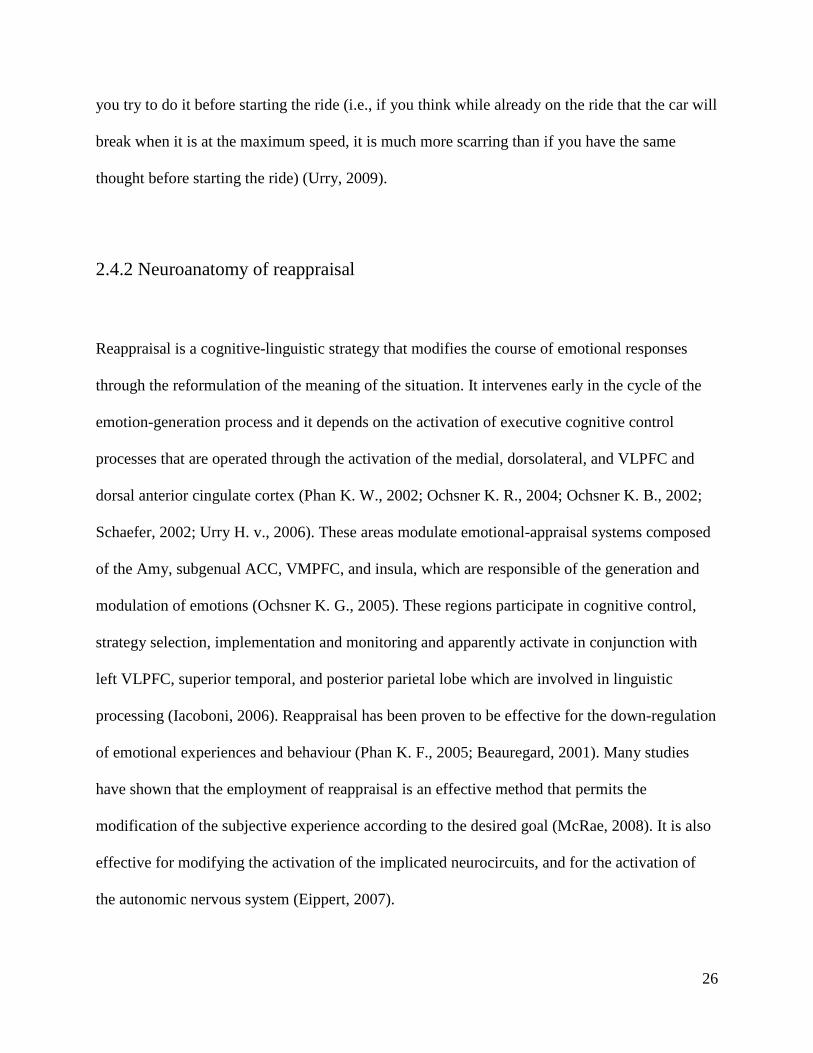
you try to do it before starting the ride (i.e., if you think while already on the ride that the car will
break when it is at the maximum speed, it is much more scarring than if you have the same
thought before starting the ride) (Urry, 2009).
2.4.2 Neuroanatomy of reappraisal
Reappraisal is a cognitive-linguistic strategy that modifies the course of emotional responses
through the reformulation of the meaning of the situation. It intervenes early in the cycle of the
emotion-generation process and it depends on the activation of executive cognitive control
processes that are operated through the activation of the medial, dorsolateral, and VLPFC and
dorsal anterior cingulate cortex (Phan K. W., 2002; Ochsner K. R., 2004; Ochsner K. B., 2002;
Schaefer, 2002; Urry H. v., 2006). These areas modulate emotional-appraisal systems composed
of the Amy, subgenual ACC, VMPFC, and insula, which are responsible of the generation and
modulation of emotions (Ochsner K. G., 2005). These regions participate in cognitive control,
strategy selection, implementation and monitoring and apparently activate in conjunction with
left VLPFC, superior temporal, and posterior parietal lobe which are involved in linguistic
processing (Iacoboni, 2006). Reappraisal has been proven to be effective for the down-regulation
of emotional experiences and behaviour (Phan K. F., 2005; Beauregard, 2001). Many studies
have shown that the employment of reappraisal is an effective method that permits the
modification of the subjective experience according to the desired goal (McRae, 2008). It is also
effective for modifying the activation of the implicated neurocircuits, and for the activation of
the autonomic nervous system (Eippert, 2007).
27
Eipper et al. performed an experiment displaying images with different valences (neutral or
threatening stimuli) where subjects had to view, decrease (detachment strategy) or increase
(engagement with the situation) the displayed affect. During the down regulation of threat-
related stimuli, only the left Amy showed decreased activation compared to the baseline view
condition, while the left cingulate cortex (anterior cingulate gyrus), the left DLPFC (inferior
frontal gyrus and middle frontal gyrus) and the left OFC (left inferior orbitofrontal gyrus)
increased its activation compared to the baseline view condition. During the increase condition
(up-regulation) bilateral activation of the Amy, the left DLPFC (superior frontal gyrus and
middle frontal gyrus), the right DLPFC (superior frontal gyrus, and inferior frontal gyrus), the
ACC (left and right anterior cingulate gyrus), and the OFC (left inferior orbitofrontal gyrus and
left gyrus rectus) was found. As a whole, they observed that only the left Amy was up- and
down-regulated (the right Amy was only up-regulated presenting a non-significant decreased
activation during down-regulation) and the variations in the degree of activation corresponded to
different regions within the Amy. Authors concluded that responses to threat-related stimuli can
be controlled using cognitive strategies that recruit prefrontal areas (Eippert et al., 2007).
Different studies have shown that decreased activation of the Amy correlates with increased
activation of areas involved in cognitive control in the PFC (Davidson, 2003), the ACC (Phan
K. W., 2002; Beauregard, 2001), the DLPFC (Levesque, 2003; Ochsner K. B., 2002) and the
OFC (Levesque, 2003, Ochsner K. R., 2004).
28
2.5 Bipolar disorder
Structural and functional abnormalities have been reported in bipolar disorder (BD). Alterations
have been observed in prefronto-striatal-thalamic circuits (Strakowski et al., 2005) including
hemispheric asymmetries (Caligiuri M. P., 2003). Different regions of the prefrontal cortex have
been implicated: the VLPFC, the DLPFC, the medial prefrontal cortex (MPFC), the ventral
prefrontal cortex (VPFC), and the anterior cingulate cortex (ACC), including the subgenual
anterior cingulate (sgACC). Subcortical structures thought to be affected include the Amy, the
basal ganglia (caudate, putamen, and globus pallidus), the thalamus, and the cerebellum
(Strakowski S. M., 2005) (Brambilla P. G., 2005) (Hajek, 2005). Abnormalities in specific
regions seem to be present since the beginning of the illness, especially in the sgACC, the Amy
and the striatum. Other abnormalities would be determined during the course of the illness (the
number of affective episodes), such as decreased gray matter in the left inferior PFC, decreased
size of the cerebellar vermis and ventriculomegaly (Strakowski S. M., 2005).
Structural abnormalities, such as decreased gray matter volume (Drevets, 1997; Lyoo, 2004;
Lochhead, 2004; Doris, 2004), have been found in the left sgACC of bipolar disorder subjects.
This alteration was found in all phases of the illness and was absent only in patients treated with
lithium (Sassi, 2004). Other studies reported a decreased sgACC volume in patients with familial
bipolar I disorder or in familial affective disorder patients experiencing their first affective
episode of psychosis (Hirayasu, 1999; Sharma, 2003).
29
Post-mortem studies have identified a decreased number of glial cells in the ACC, which was
more prominent in subgroups of subjects with familial BD (Ongur, 1998). Similarly (in BA 24),
Bouras et al. observed a substantial decrease in laminar thickness and neuron densities in layers
III, V, and VI (Bouras, 2001) while Benes et al. found a reduction in the density of the non-
pyramidal neurons in layer II (Benes, 2001). In the Amy, volumetric studies reported different
results, such as enlarged (Brambilla P. H., 2003; Strakowski S. M., 1999; Altshuler, 2000),
decreased (Blumberg, 2003; Pearlson, 1997), or normal size (Swayze, 1992) in bipolar subjects.
Adolescents show decreased Amy volume (Delbello, 2004; Blumberg, 2003; Chen, 2004). Some
of the structural abnormalities found in BDs have been confirmed with spectroscopy, where
decreased levels of NAA/Cr-PCr in DLPFC have been found (Winsberg, 2000).
2.5.1 Functional implications
Neuroimaging has contributed significantly in the last decade to the understanding of
neurocircuits involved in BD; new theories have arisen recently based on these findings. The
presence of subcortical hyperactivity has been proposed as one of the main substrates implicated
in BD pathophysiology (Strakowski S. M., 2004; Chang, 2004; Lawrence, 2004) and has been
associated to a deficient regulation from the prefrontal cortex (Yurgelun-Todd D. A., 2000). A
dysfunction of the anterior limbic network would play a key role in this illness, and the increased
activation of the ACC that has been observed in the different mood states, would imply that the
activation of this subregion may disrupt the cognitive performance of the neural prefrontal
circuits (Strakowski S. M., 2005).
30
Many studies have targeted their efforts toward the assessment of the impact of emotions on
cognitive functions, a well known domain affected in BD (Martinez-Aran, 2004). A major issue
is identifying which mechanisms are responsible for the disruption of the cognitive performance;
studies conducted in recent years have attempted to clarify whether this effect is due to the
hyperactivity of subcortical structures. Although the question of how individuals voluntarily
regulate their emotions has been explored in healthy individuals, little has been done in people
affected by BD. Nonetheless, it is possible to predict that if the functioning of the anterior limbic
network is impaired in conjunction with prefrontal regions that regulate subcortical structures,
the regulation of emotions through cognitive processes would also be impaired. Furthermore,
recent studies have shown that bipolar patients have difficulty with identifying emotional facial
expressions, presenting increased ventral prefrontal cortical responses when seeing faces of mild
and intense fear, mildly happy, and mildly sad expressions, compared with normal controls and
depressed patients (Lawrence, 2004). In the cingulate cortex, manic patients performing an
affective Go/No Go task activate the ventral region selectively in the presence of sad rather than
happy words, an opposite pattern than that seen in control subjects (Elliott, 2004; Whalen, 1988).
Depressed patients also show differential responses in lateral OFC to affectively toned
(particularly sad) distracters (Elliott, 2004).
According to Lawrence, mild and intense fear activates wider neural responses in bipolar
subjects compared to controls, so that the globus pallidus, the anterior thalamus, the left Amy
and the VLPFC are differentially activated in these patients. In contrast, the DLPFC is less
activated in this group, which may imply that the DLPFC could be responsible for the increased
response of the Amy observed in the group (Lawrence, 2004). Chang et al. observed a greater
31
bilateral activation of the ACC, the left DLPFC and the right inferior frontal gyrus in familial
pediatric BD patients using a visuospatial working memory task (cognitive and affective
integrated task). They concluded that the overactivation of some regions in the prefrontal cortex
arise in response to the need to modulate hyperactive limbic areas (Chang, 2004). Yurgelun-
Todd et al reported abnormal responses to facial expressions in euthymic bipolar subjects.
Patients showed reduced DLPFC and enhanced Amy activation in response to the presence of
fearful faces. The hypothesis that executive functions play a role in affective processing and may
be impaired in some individuals with affective disorders is supported by these findings, where
there might be a reduction of prefrontal cortical function which may be associated with affective
as well as attentional processing deficits (Yurgelun-Todd D. A., 2006; Yurgelun-Todd D. A.,
2000). Malhi et al. found that the PFC and the ACC are structures that are activated in bipolar
and healthy control subjects, but that the Amy and other subcortical structures (caudate and
thalamus) are only activated in the bipolar depressed group (Malhi, 2004). These findings would
implicate the need to use additional limbic systems for emotional evaluation when advanced
prefrontal cortical processing is no longer sufficient (Malhi, 2004). Attentional circuits present
disruptions in BD as well. One study using a Continuous Performance Task-Identical Pairs
version showed that euthymic bipolar subjects hyperactivate limbic, paralimbic, and ventrolateral
prefrontal areas as well as visual associational cortices. This abnormality was postulated as a
mechanism that may interfere with a normal performance in the attentional task (Strakowski S.
M., 2004).
Mood states and medication can influence subcortical activity in BD. Caligiuri et al. compared
BD subjects in manic versus depressive states during the performance of a motor task, finding
that the mania patients present increased bilateral activation of the globus pallidus, while the
32
depressed patients overactivate the thalamus and the caudate in the right hemisphere only. This
group also compared patients with and without antipsychotics and mood stabilizers, observing
that those without treatment presented significantly higher levels of activation throughout
cortical and subcortical structures. These findings suggest that antipsychotics and
anticonvulsants may have suppressive effects on specific cortical and subcortical functions
(Caligiuri M. P., 2003).
33
Chapter 3
Methods
3.1 Subjects
We performed two studies: the first study included 43 healthy controls participants (26 females,
mean age 31 SD = ± 12 years, range = 19 – 62, and 17 males, mean age 31 SD = 31 ± 13 years,
range = 19 – 64) and the second study included 20 participants affected by bipolar disorder (11
females, mean age 42 SD =42 ± 10 years, range = 21-64, 7 males, mean age 47 SD = 47 ± 10
years, range = 26 – 65).
Patients were selected from the out-patient population assisted at the Bipolar Disorder Programs
of the Douglas Institute. Suitable patient candidates were recruited by advertising the research
project to the treating psychiatrists and by conducting a chart review of potential candidates
referred to us for the study. Searching for subjects matching in age, gender, and educational
level, normal volunteers were recruited from the community through advertisements. All
patients were under pharmacological treatment, most of them were on lithium or on lithium and a
second generation antipsychotic, and the remaining were on valproate or on valproate and a
second generation antipsychotic.
34
Inclusion criteria:
Both patients and healthy volunteers had to be over 18 years of age. Patients and normal
volunteers with a history of alcohol and/or drug abuse in the past year, panic disorder, post-
traumatic stress disorder, and generalized anxiety disorder were excluded. Patients and normal
volunteers taking barbiturates, carbamazepine, or benzodiazepines were excluded for potential
side effects that might have impaired the performance of the participants in the task. Control
subjects with a family history of affective or anxiety disorders were excluded (panic disorder,
generalized anxiety disorder, depression or bipolar disorder). Both patients and normal
volunteers scoring higher than seven (7) on the Hamilton Depression Rating Scale (HAM-D) (21
items), higher than eight (8) on the Montgomery-Asberg Rating Scale (MADRS), or higher than
four (4) on the Young Mania Rating Scale (YMRS) were excluded from the study.
Appendix 1 (inclusion-exclusion criteria)
3.2 Procedures
Participants were screened with the following questionnaires and scales: Structured Clinical
Interview for DSM IV Axis I, Hamilton Rating Scale (HAM-D) (HAMILTON, 1960),
Montgomery-Asberg Depression Rating Scale (MADRS) (Montgomery, 1979) and Young
Mania Rating Scale (YMRS) (Young, 1978). This study was performed at the Douglas Institute.
35
GSR and HR data were collected using the GSR Biopac™ amplifier and AcqKnowledge™
software. Stimuli were presented using E-Prime software. GSR was recorded using Biopac
EL507 transducers filled with Biopac skin conductance electrode past placed at the non-
dominant middle and fourth fingers. Data were amplified using Biopac’s GSR 100C amplifier
using a gain of 10 µΩ and a low pass filter of 10 Hz. AcqKnowledge™ software identifies all
electrodermal responses, as defined as a 0.05 µS increase in skin conductance. HR was recorded
using two electrodes (disposable Biopac EL503 Ag-AgCl snap electrodes) attached to the left
and the right sides of the thorax, and one on the left leg over the tibia bone. Data were amplified
by Biopac 100C amplifiers set for a gain of 1000 and using a low- and high-pass filters of 35 and
0.05 Hz, respectively.
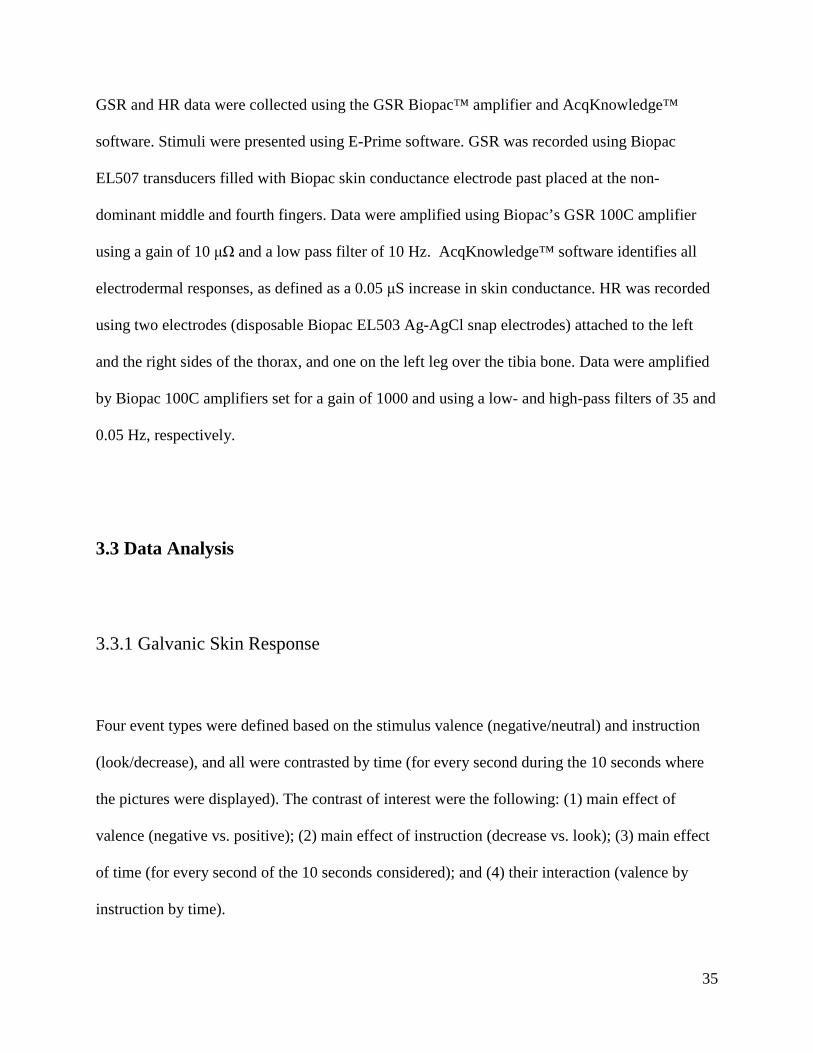
3.3 Data Analysis
3.3.1 Galvanic Skin Response
Four event types were defined based on the stimulus valence (negative/neutral) and instruction
(look/decrease), and all were contrasted by time (for every second during the 10 seconds where
the pictures were displayed). The contrast of interest were the following: (1) main effect of
valence (negative vs. positive); (2) main effect of instruction (decrease vs. look); (3) main effect
of time (for every second of the 10 seconds considered); and (4) their interaction (valence by
instruction by time).
36
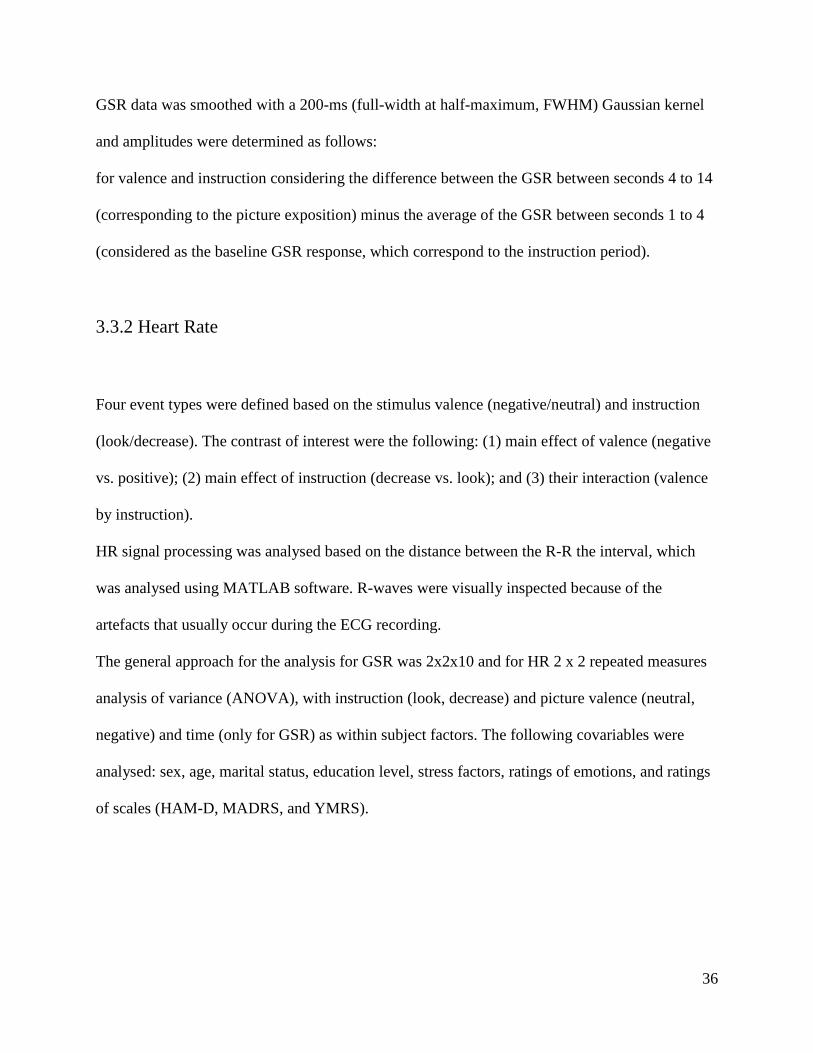
GSR data was smoothed with a 200-ms (full-width at half-maximum, FWHM) Gaussian kernel
and amplitudes were determined as follows:
for valence and instruction considering the difference between the GSR between seconds 4 to 14
(corresponding to the picture exposition) minus the average of the GSR between seconds 1 to 4
(considered as the baseline GSR response, which correspond to the instruction period).
3.3.2 Heart Rate
Four event types were defined based on the stimulus valence (negative/neutral) and instruction
(look/decrease). The contrast of interest were the following: (1) main effect of valence (negative
vs. positive); (2) main effect of instruction (decrease vs. look); and (3) their interaction (valence
by instruction).
HR signal processing was analysed based on the distance between the R-R the interval, which
was analysed using MATLAB software. R-waves were visually inspected because of the
artefacts that usually occur during the ECG recording.
The general approach for the analysis for GSR was 2x2x10 and for HR 2 x 2 repeated measures
analysis of variance (ANOVA), with instruction (look, decrease) and picture valence (neutral,
negative) and time (only for GSR) as within subject factors. The following covariables were
analysed: sex, age, marital status, education level, stress factors, ratings of emotions, and ratings
of scales (HAM-D, MADRS, and YMRS).
37
Chapter 4
Results
Two studies were performed: one in a Healthy Control Group; the other in a Bipolar Group. We
performed a comparison between both groups.
4.1 First experiment: Healthy Control Group
This study was performed in a group of healthy participants (n=43) where HR and GSR were
recorded. The goals of the study were (1) to assess the features of the GSR in healthy participants
(we previously performed a pilot study with 10 subjects and wanted to see if we could replicate
the findings by increasing the number of participants); (2) to compare the differential
sensitiveness between HR and GSR (HR depends on the interaction between the sympathetic and
the parasympathetic activity, while GSR depends exclusively of the sympathetic activation).
Participants in this study were recruited from the community through advertisements (inclusion
and exclusion criteria are mentioned in the methodology section).
38
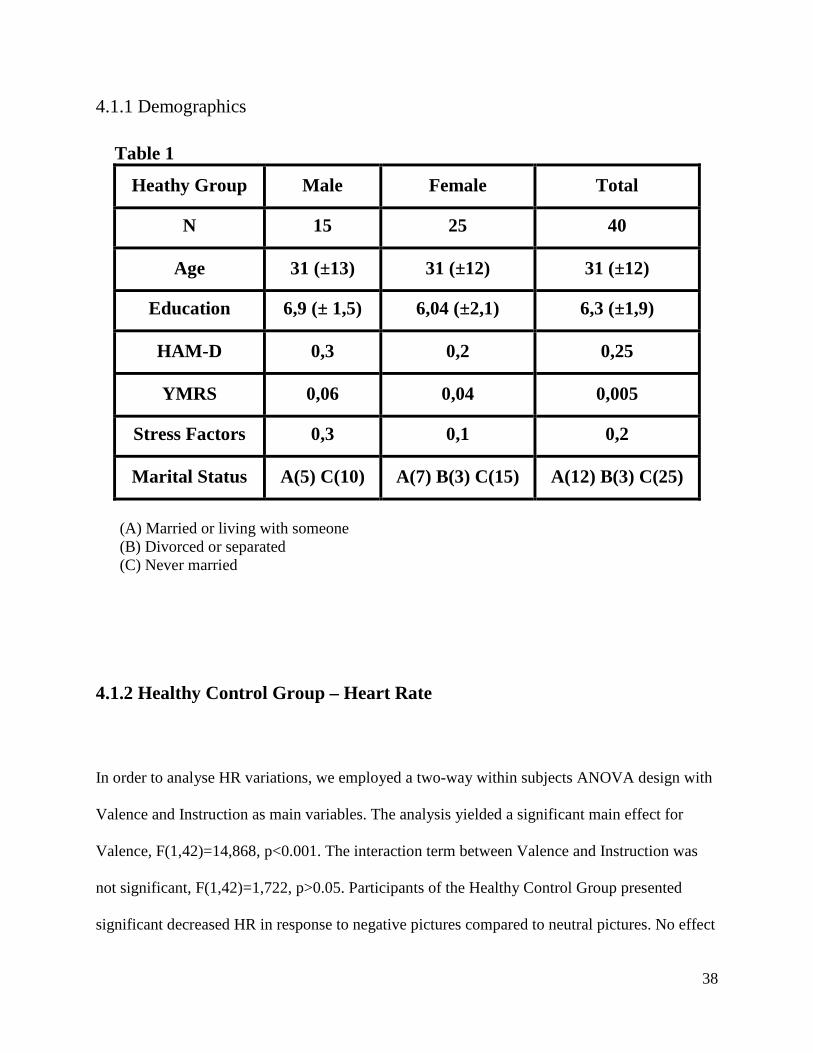
4.1.1 Demographics
Table 1
Heathy Group Male Female Total
N 15 25 40
Age 31 (±13) 31 (±12) 31 (±12)
Education 6,9 (± 1,5) 6,04 (±2,1) 6,3 (±1,9)
HAM-D 0,3 0,2 0,25
YMRS 0,06 0,04 0,005
Stress Factors 0,3 0,1 0,2
Marital Status A(5) C(10) A(7) B(3) C(15) A(12) B(3) C(25)
(A) Married or living with someone (B) Divorced or separated (C) Never married
4.1.2 Healthy Control Group – Heart Rate
In order to analyse HR variations, we employed a two-way within subjects ANOVA design with
Valence and Instruction as main variables. The analysis yielded a significant main effect for
Valence, F(1,42)=14,868, p<0.001. The interaction term between Valence and Instruction was
not significant, F(1,42)=1,722, p>0.05. Participants of the Healthy Control Group presented
significant decreased HR in response to negative pictures compared to neutral pictures. No effect
39
of Instruction was found (Look or Decrease – emotion regulation) on HR. Post Hoc tests (t-tests)
revealed a significant main effect for Valence, F(1,42)=14,868, p<0.001. No significant effects
were detected for instruction type.
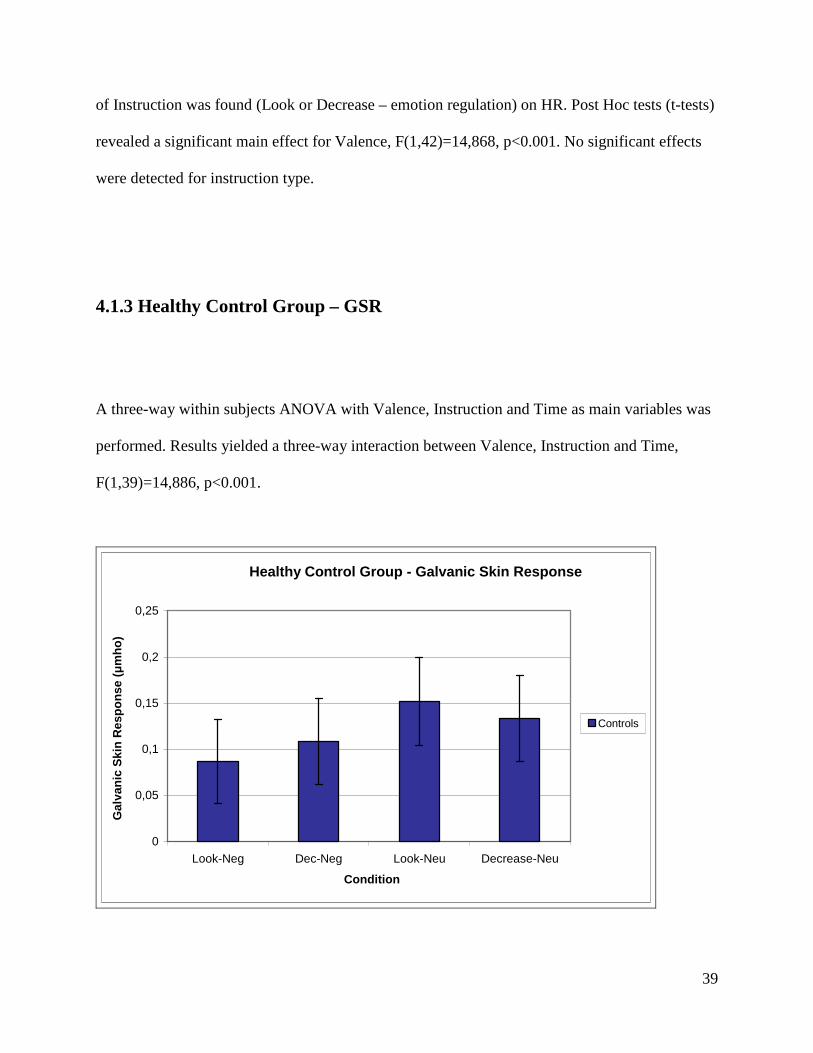
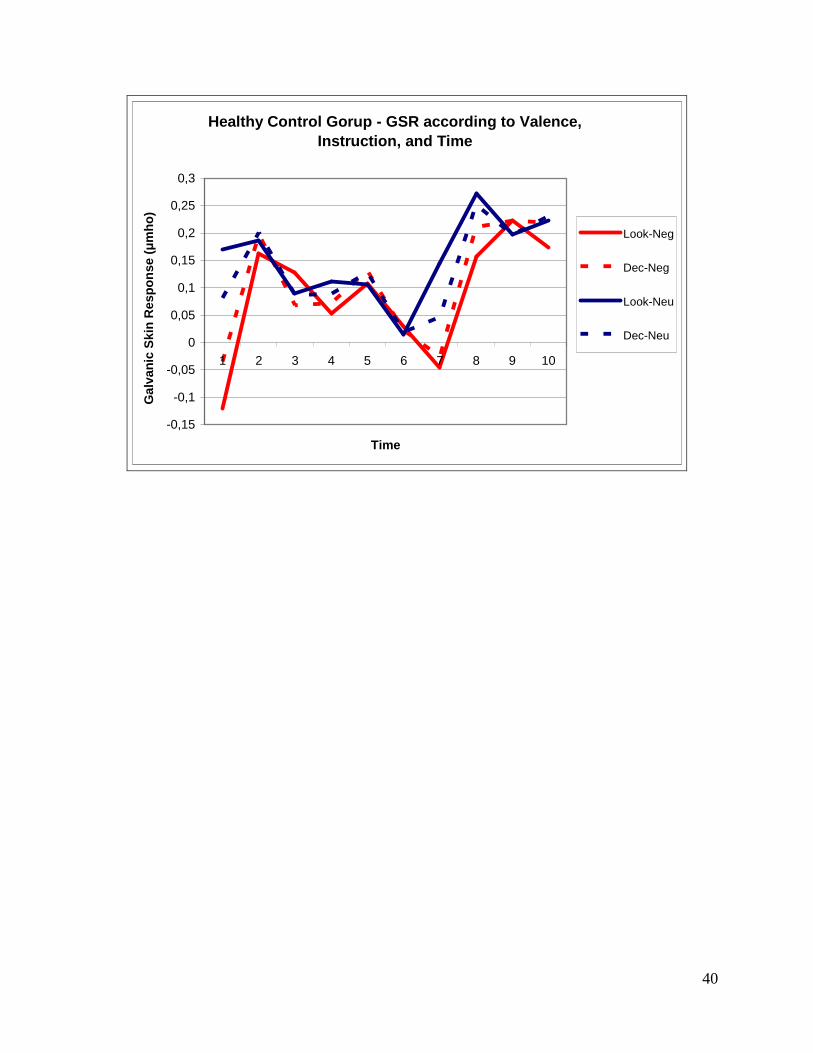
4.1.3 Healthy Control Group – GSR
A three-way within subjects ANOVA with Valence, Instruction and Time as main variables was
performed. Results yielded a three-way interaction between Valence, Instruction and Time,
F(1,39)=14,886, p<0.001.
Healthy Control Group - Galvanic Skin Response
0
0,05
0,1
0,15
0,2
0,25
Look-Neg Dec-Neg Look-Neu Decrease-Neu
Condition
Gal
van
ic S
kin
Res
po
nse
(µ
mh
o)
Controls
40
Healthy Control Gorup - GSR according to Valence, Instruction, and Time
-0,15
-0,1
-0,05
0
0,05
0,1
0,15
0,2
0,25
0,3
1 2 3 4 5 6 7 8 9 10
Time
Gal
van
ic S
kin
Res
po
nse
(µ
mh
o)
Look-Neg
Dec-Neg
Look-Neu
Dec-Neu
41
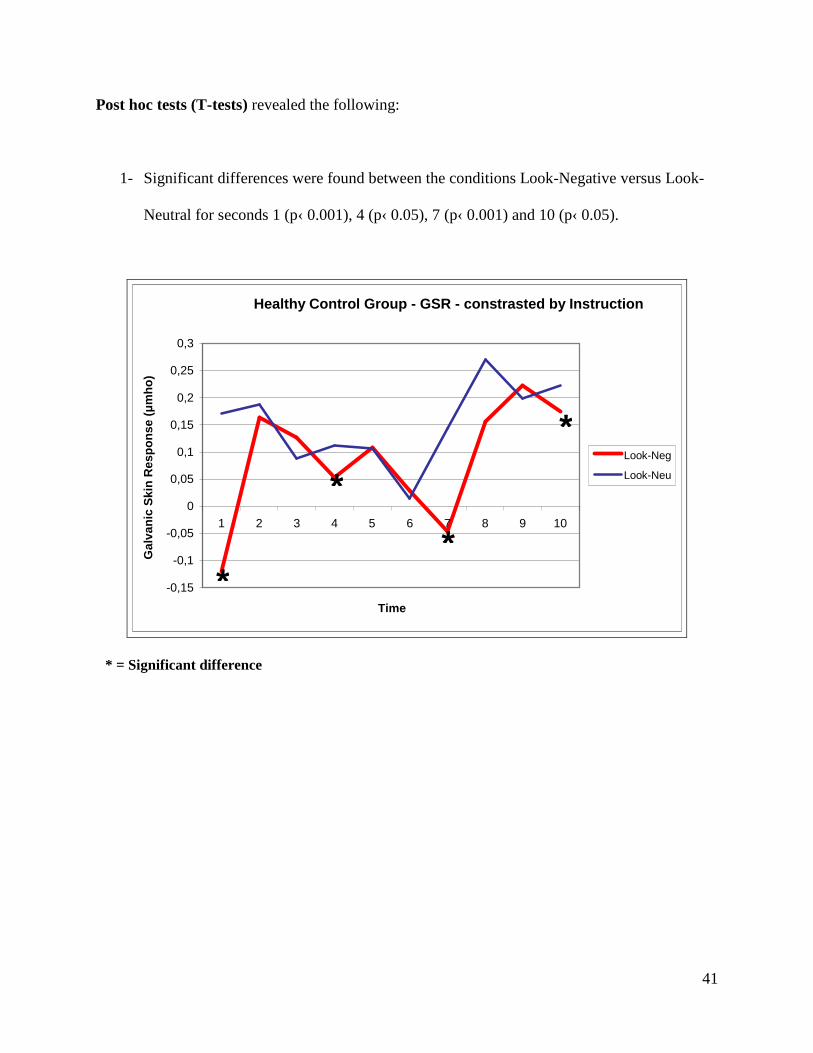
Post hoc tests (T-tests) revealed the following:
1- Significant differences were found between the conditions Look-Negative versus Look-
Neutral for seconds 1 (p‹ 0.001), 4 (p‹ 0.05), 7 (p‹ 0.001) and 10 (p‹ 0.05).
Healthy Control Group - GSR - constrasted by Instruction
-0,15
-0,1
-0,05
0
0,05
0,1
0,15
0,2
0,25
0,3
1 2 3 4 5 6 7 8 9 10
Time
Gal
van
ic S
kin
Res
po
nse
(µ
mh
o)
Look-Neg
Look-Neu
* = Significant difference
*
*
*
*
42
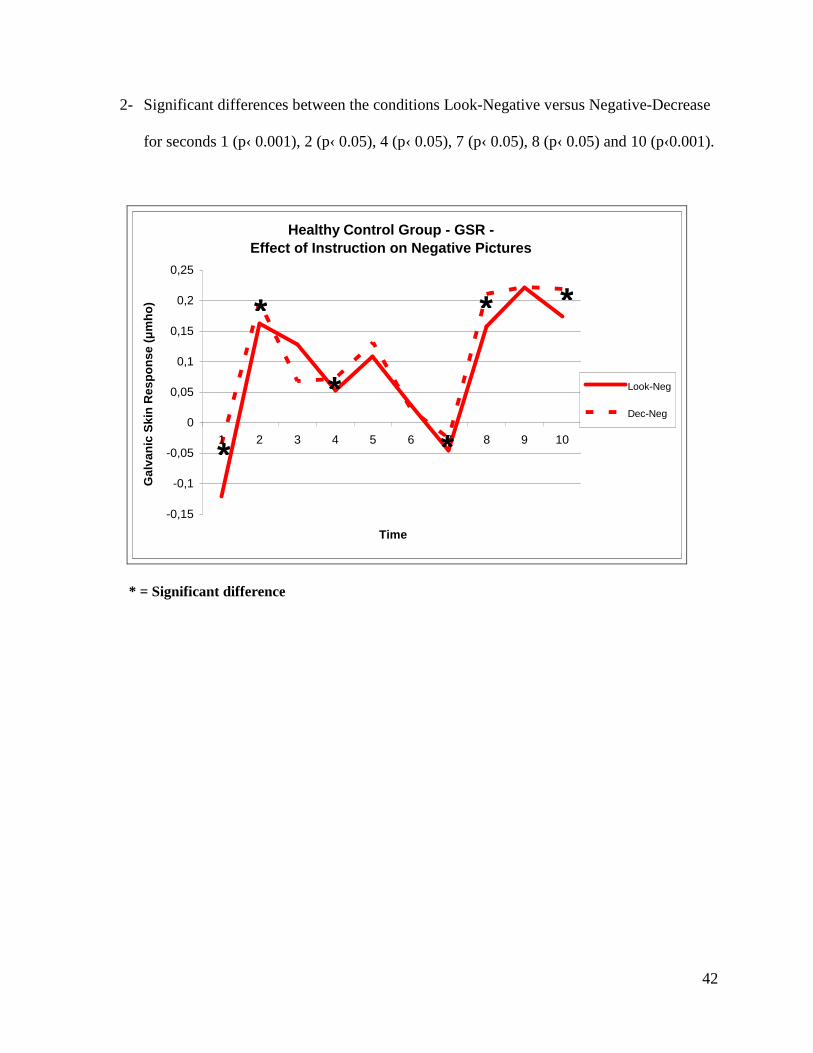
2- Significant differences between the conditions Look-Negative versus Negative-Decrease
for seconds 1 (p‹ 0.001), 2 (p‹ 0.05), 4 (p‹ 0.05), 7 (p‹ 0.05), 8 (p‹ 0.05) and 10 (p‹0.001).
Healthy Control Group - GSR - Effect of Instruction on Negative Pictures
-0,15
-0,1
-0,05
0
0,05
0,1
0,15
0,2
0,25
1 2 3 4 5 6 7 8 9 10
Time
Gal
van
ic S
kin
Res
po
nse
(µ
mh
o)
Look-Neg
Dec-Neg
* = Significant difference
*
*
*
*
* *
43
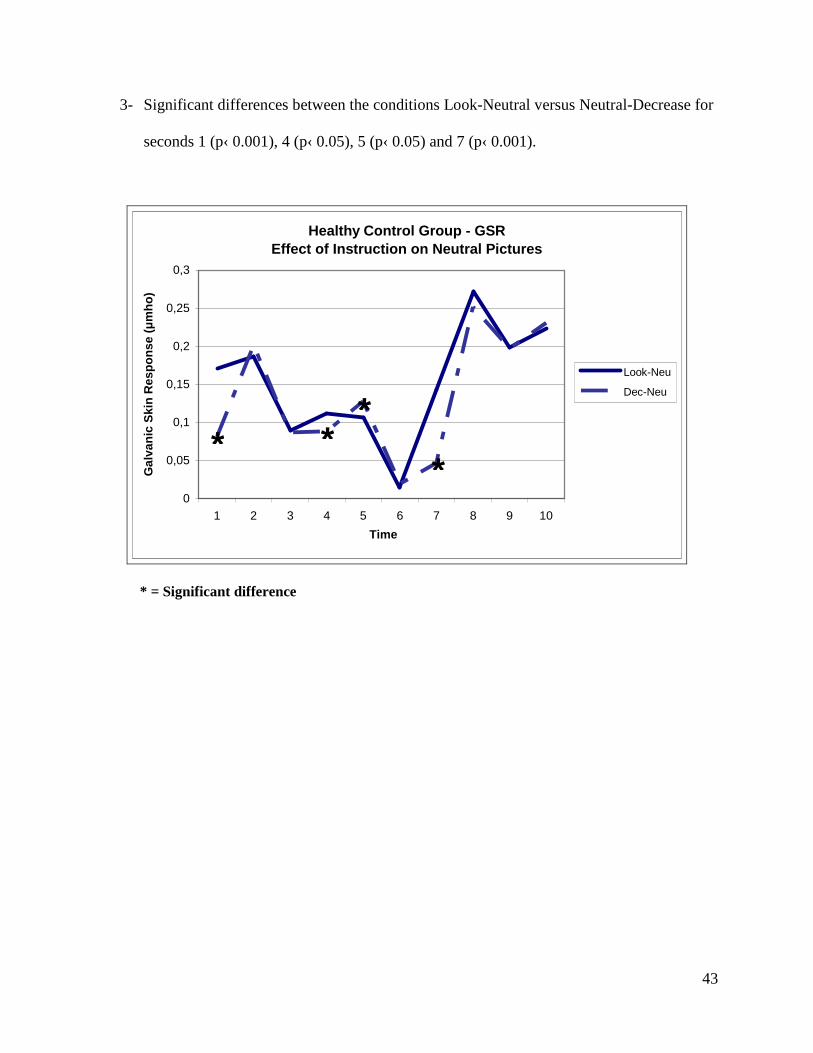
3- Significant differences between the conditions Look-Neutral versus Neutral-Decrease for
seconds 1 (p‹ 0.001), 4 (p‹ 0.05), 5 (p‹ 0.05) and 7 (p‹ 0.001).
Healthy Control Group - GSR Effect of Instruction on Neutral Pictures
0
0,05
0,1
0,15
0,2
0,25
0,3
1 2 3 4 5 6 7 8 9 10
Time
Gal
van
ic S
kin
Res
po
nse
(µ
mh
o)
Look-Neu
Dec-Neu
* = Significant difference
* * *
*
44
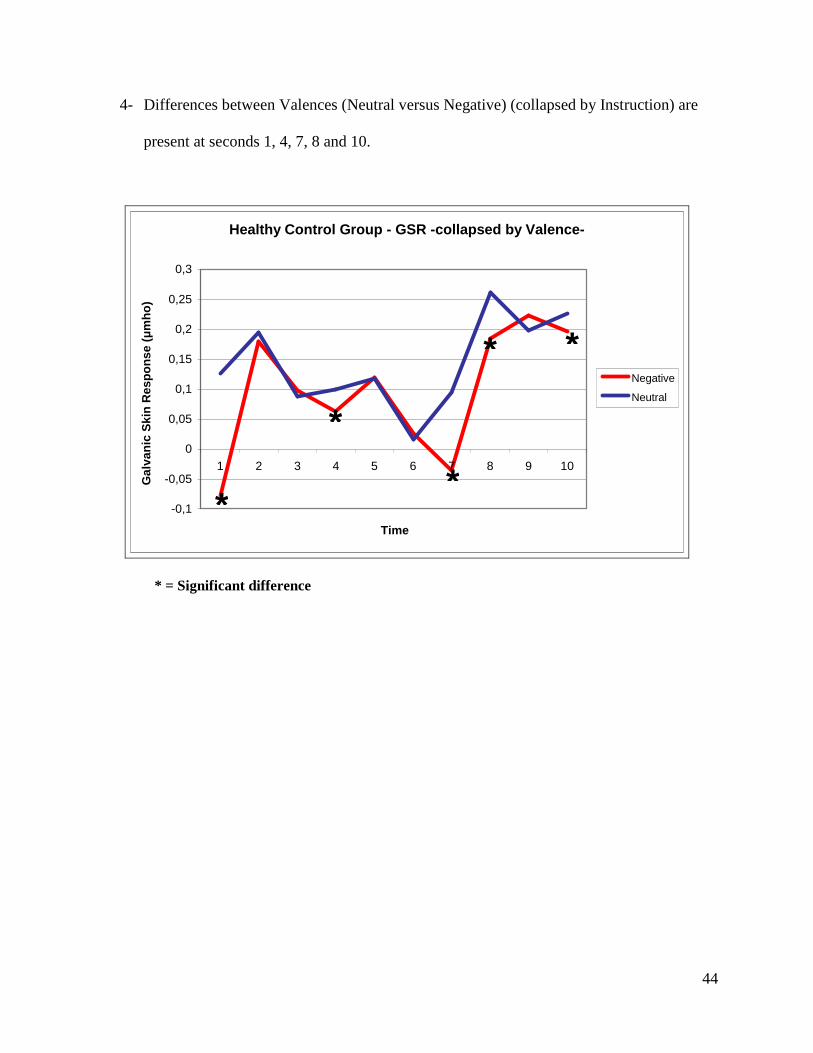
4- Differences between Valences (Neutral versus Negative) (collapsed by Instruction) are
present at seconds 1, 4, 7, 8 and 10.
Healthy Control Group - GSR -collapsed by Valence-
-0,1
-0,05
0
0,05
0,1
0,15
0,2
0,25
0,3
1 2 3 4 5 6 7 8 9 10
Time
Gal
van
ic S
kin
Res
po
nse
(µ
mh
o)
Negative
Neutral
* = Significant difference
*
* *
* *
45
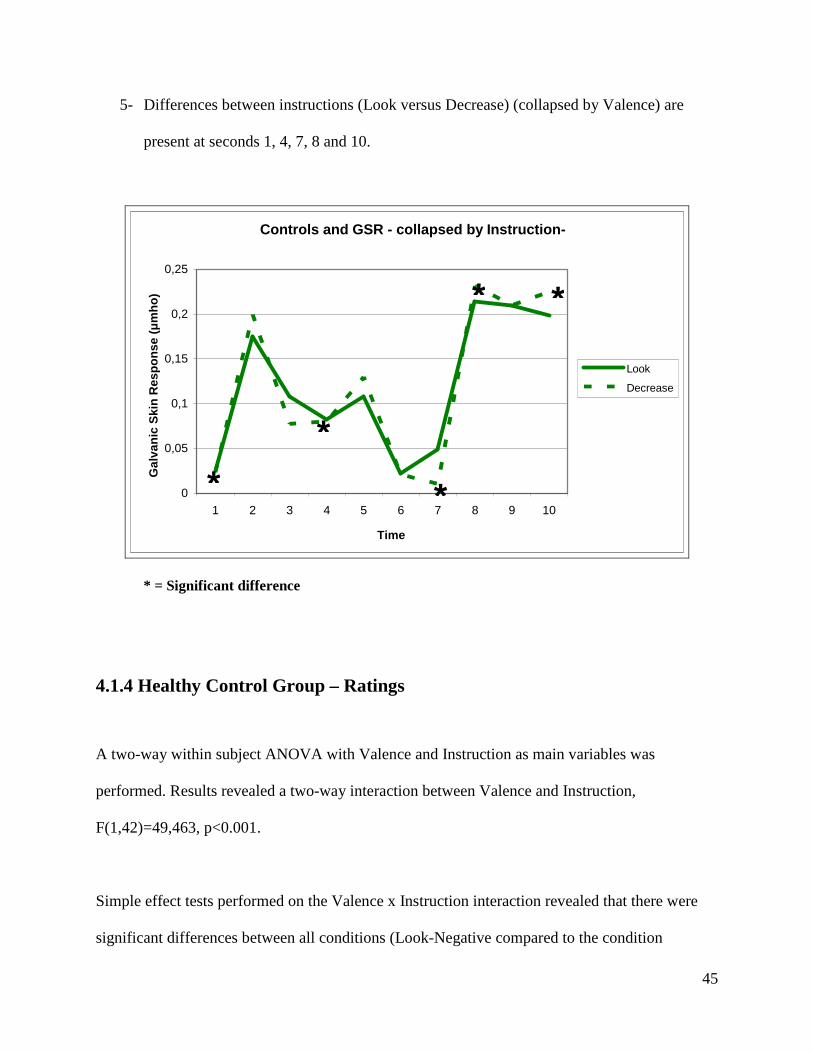
5- Differences between instructions (Look versus Decrease) (collapsed by Valence) are
present at seconds 1, 4, 7, 8 and 10.
Controls and GSR - collapsed by Instruction-
0
0,05
0,1
0,15
0,2
0,25
1 2 3 4 5 6 7 8 9 10
Time
Gal
van
ic S
kin
Res
po
nse
(µ
mh
o)
Look
Decrease
* = Significant difference
4.1.4 Healthy Control Group – Ratings
A two-way within subject ANOVA with Valence and Instruction as main variables was
performed. Results revealed a two-way interaction between Valence and Instruction,
F(1,42)=49,463, p<0.001.
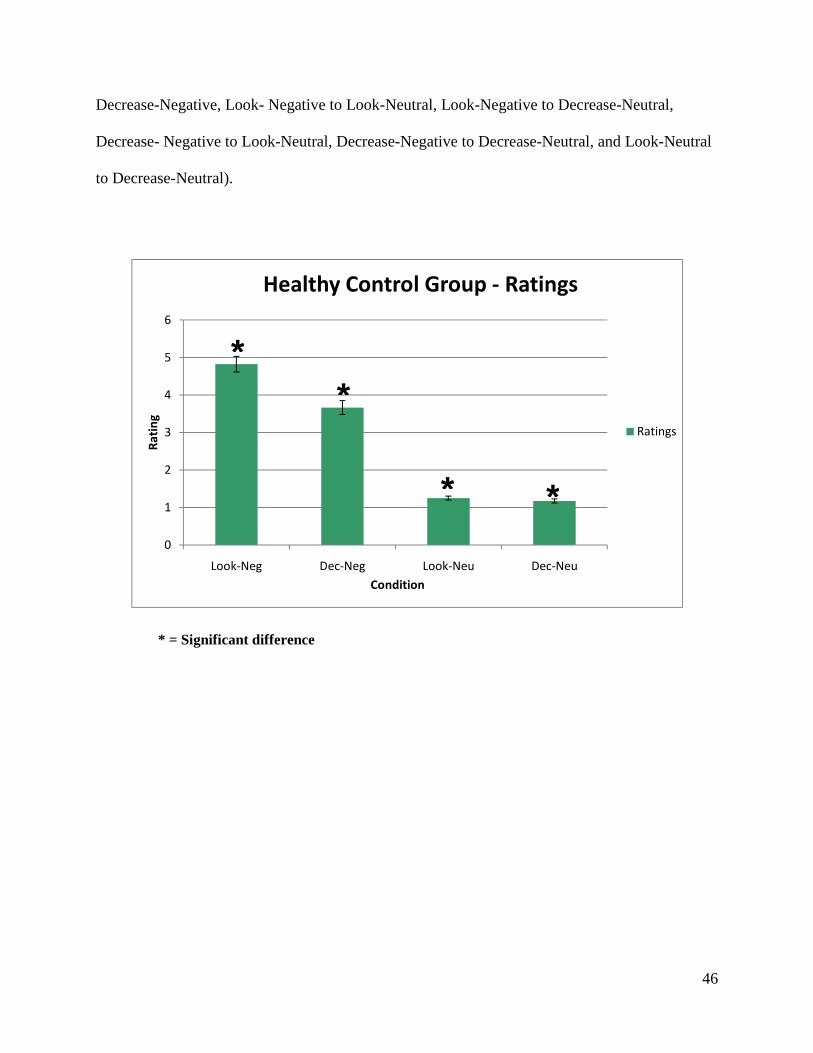
Simple effect tests performed on the Valence x Instruction interaction revealed that there were
significant differences between all conditions (Look-Negative compared to the condition
* *
*
* *
46
Decrease-Negative, Look- Negative to Look-Neutral, Look-Negative to Decrease-Neutral,
Decrease- Negative to Look-Neutral, Decrease-Negative to Decrease-Neutral, and Look-Neutral
to Decrease-Neutral).
0
1
2
3
4
5
6
Look-Neg Dec-Neg Look-Neu Dec-Neu
Ra
tin
g
Condition
Healthy Control Group - Ratings
Ratings
* = Significant difference
* *
* *
47
4.2 Second experiment: Bipolar Group
4.2.1 Demographics
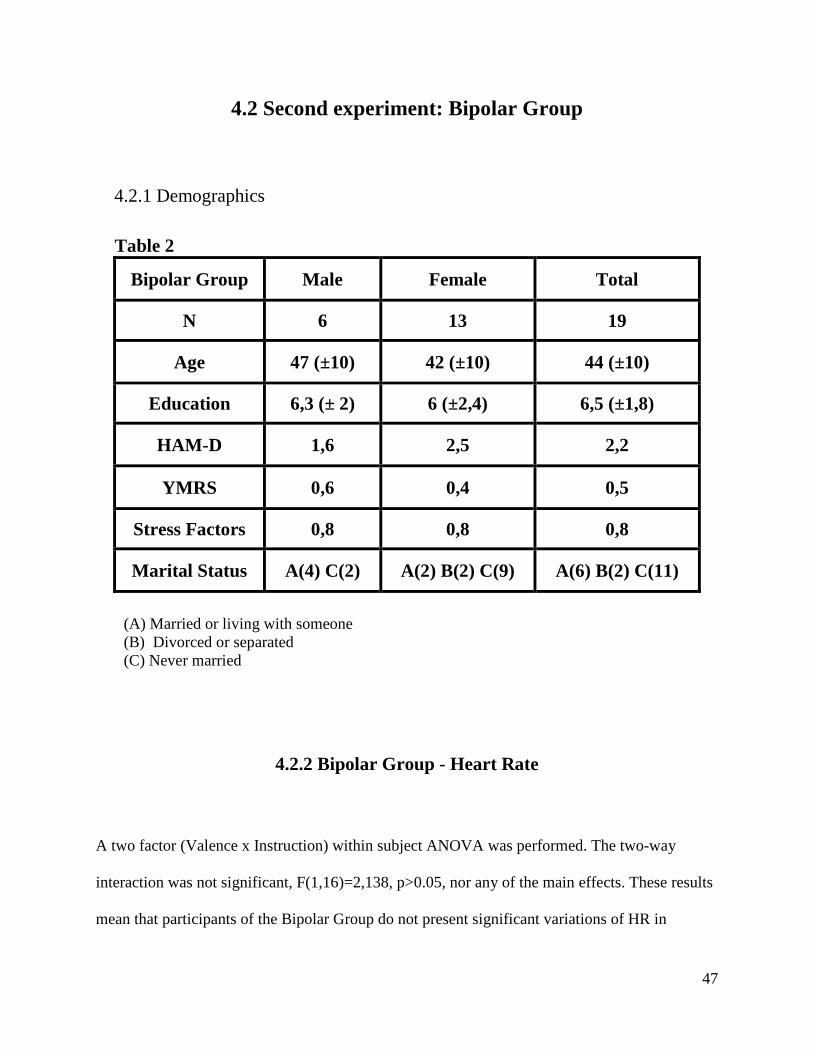
Table 2
Bipolar Group Male Female Total
N 6 13 19
Age 47 (±10) 42 (±10) 44 (±10)
Education 6,3 (± 2) 6 (±2,4) 6,5 (±1,8)
HAM-D 1,6 2,5 2,2
YMRS 0,6 0,4 0,5
Stress Factors 0,8 0,8 0,8
Marital Status A(4) C(2) A(2) B(2) C(9) A(6) B(2) C(11)
(A) Married or living with someone (B) Divorced or separated (C) Never married
4.2.2 Bipolar Group - Heart Rate
A two factor (Valence x Instruction) within subject ANOVA was performed. The two-way
interaction was not significant, F(1,16)=2,138, p>0.05, nor any of the main effects. These results
mean that participants of the Bipolar Group do not present significant variations of HR in
48
response to pictures with different valences or to different type of instructions (emotion
regulation).
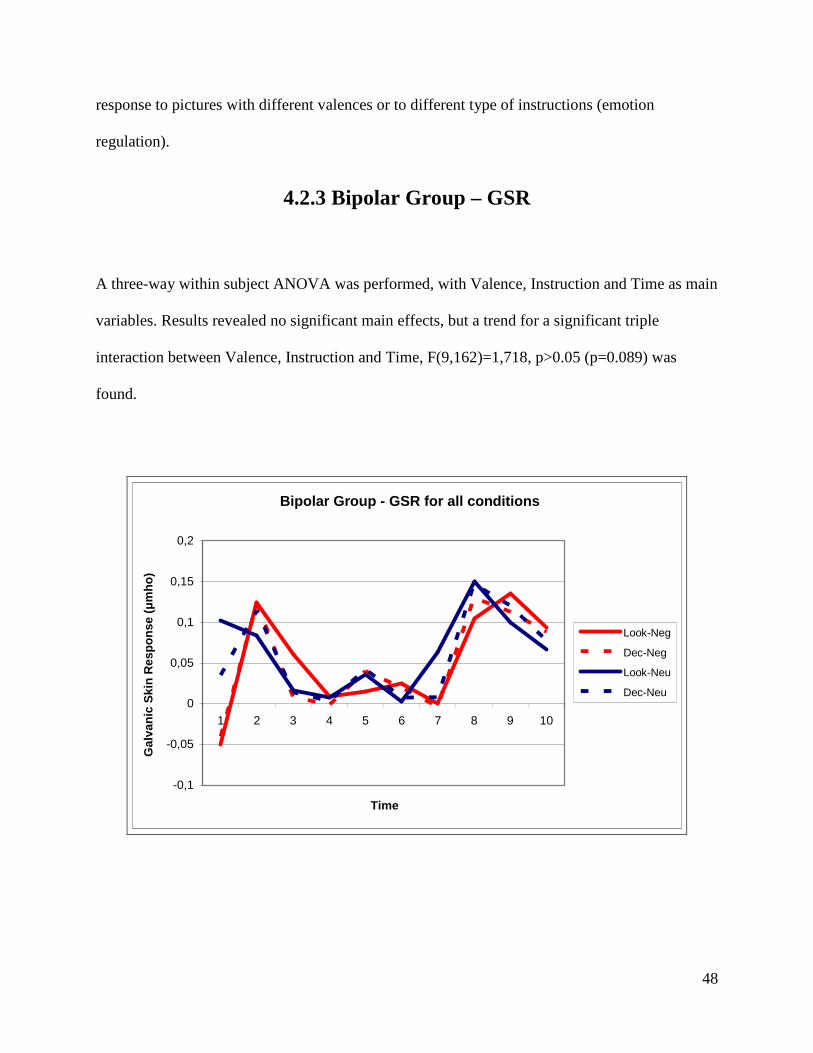
4.2.3 Bipolar Group – GSR
A three-way within subject ANOVA was performed, with Valence, Instruction and Time as main
variables. Results revealed no significant main effects, but a trend for a significant triple
interaction between Valence, Instruction and Time, F(9,162)=1,718, p>0.05 (p=0.089) was
found.
Bipolar Group - GSR for all conditions
-0,1
-0,05
0
0,05
0,1
0,15
0,2
1 2 3 4 5 6 7 8 9 10
Time
Gal
van
ic S
kin
Res
po
nse
(µ
mh
o)
Look-Neg
Dec-Neg
Look-Neu
Dec-Neu
49
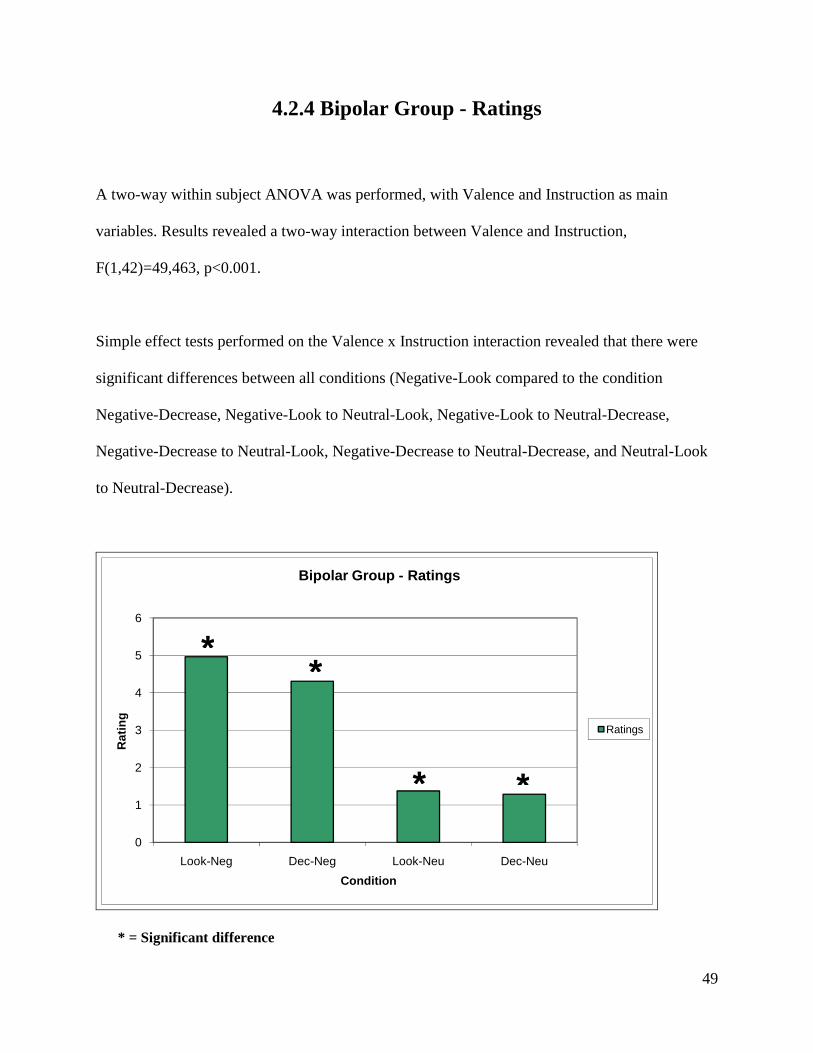
4.2.4 Bipolar Group - Ratings
A two-way within subject ANOVA was performed, with Valence and Instruction as main
variables. Results revealed a two-way interaction between Valence and Instruction,
F(1,42)=49,463, p<0.001.
Simple effect tests performed on the Valence x Instruction interaction revealed that there were
significant differences between all conditions (Negative-Look compared to the condition
Negative-Decrease, Negative-Look to Neutral-Look, Negative-Look to Neutral-Decrease,
Negative-Decrease to Neutral-Look, Negative-Decrease to Neutral-Decrease, and Neutral-Look
to Neutral-Decrease).
0
1
2
3
4
5
6
Look-Neg Dec-Neg Look-Neu Dec-Neu
Rat
ing
Condition
Bipolar Group - Ratings
Ratings
* = Significant difference
* *
* *
50
4.3 Bipolar Group versus Control Group
4.3.1 Demographics
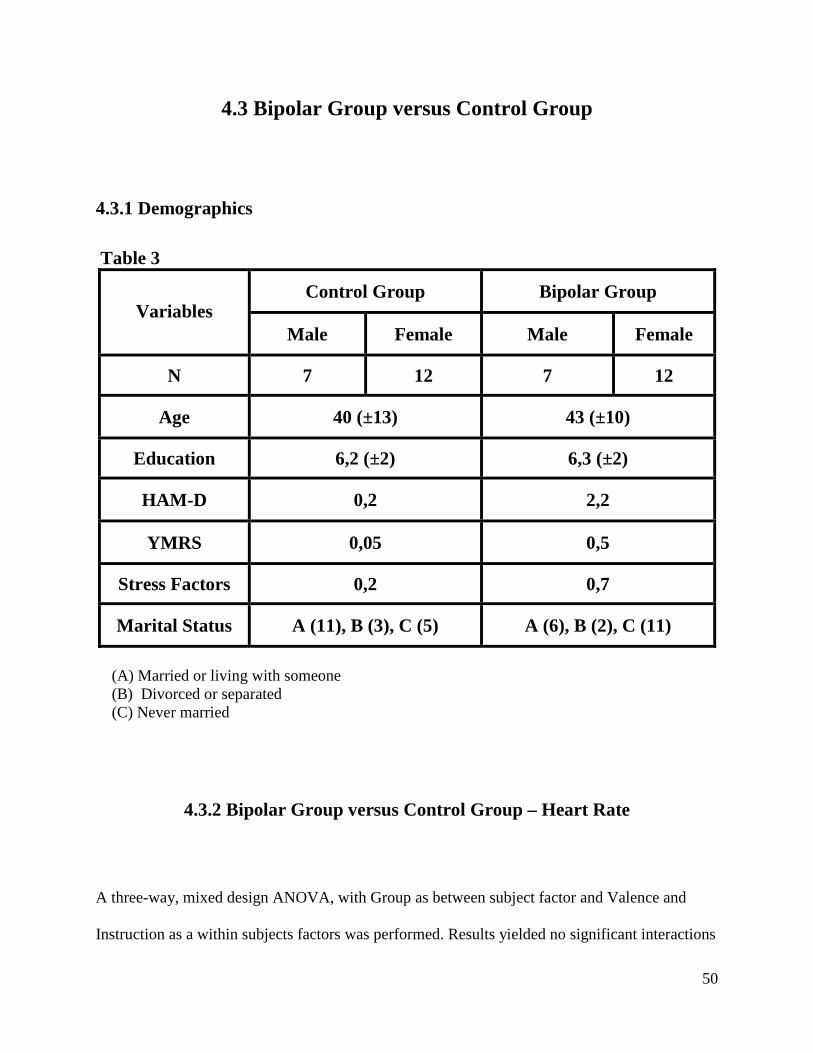
Table 3
Control Group Bipolar Group Variables
Male Female Male Female
N 7 12 7 12
Age 40 (±13) 43 (±10)
Education 6,2 (±2) 6,3 (±2)
HAM-D 0,2 2,2
YMRS 0,05 0,5
Stress Factors 0,2 0,7
Marital Status A (11), B (3), C (5) A (6), B (2), C (11)
(A) Married or living with someone (B) Divorced or separated (C) Never married
4.3.2 Bipolar Group versus Control Group – Heart Rate
A three-way, mixed design ANOVA, with Group as between subject factor and Valence and
Instruction as a within subjects factors was performed. Results yielded no significant interactions
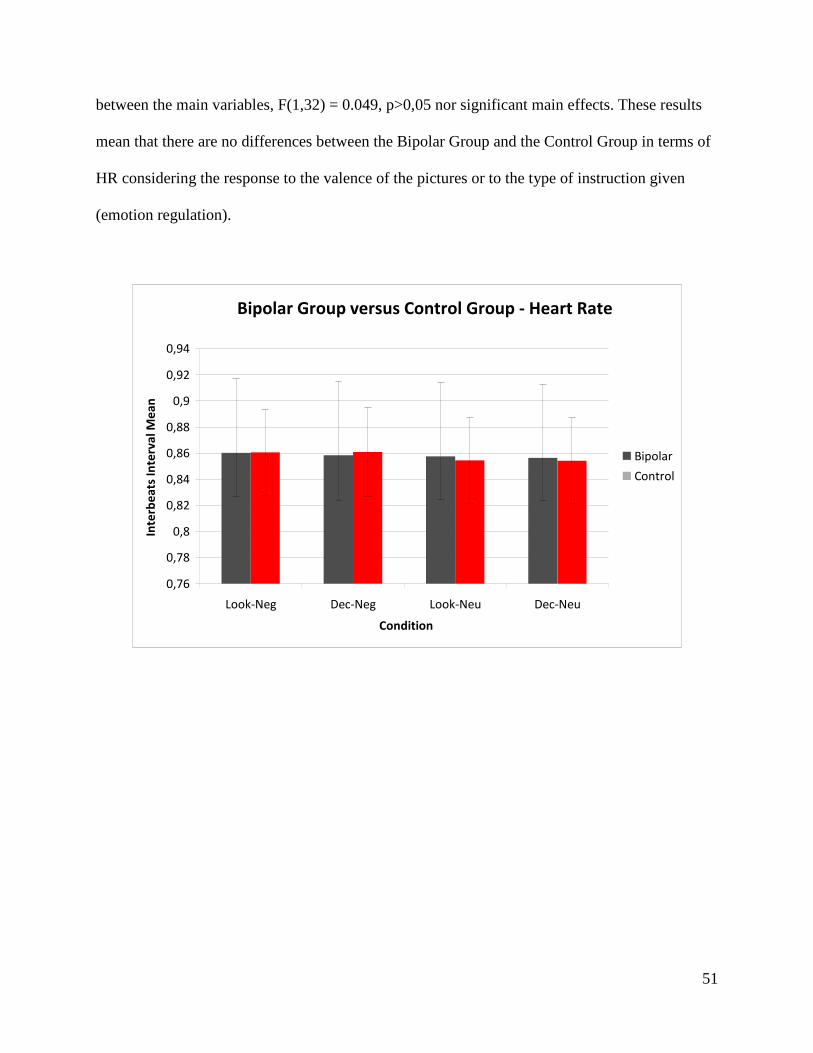
51
between the main variables, F(1,32) = 0.049, p>0,05 nor significant main effects. These results
mean that there are no differences between the Bipolar Group and the Control Group in terms of
HR considering the response to the valence of the pictures or to the type of instruction given
(emotion regulation).
Bipolar Group versus Control Group - Heart Rate
0,76
0,78
0,8
0,82
0,84
0,86
0,88
0,9
0,92
0,94
Look-Neg Dec-Neg Look-Neu Dec-Neu
Condition
Inte
rbe
ats
In
terv
al
Me
an
Bipolar
Control
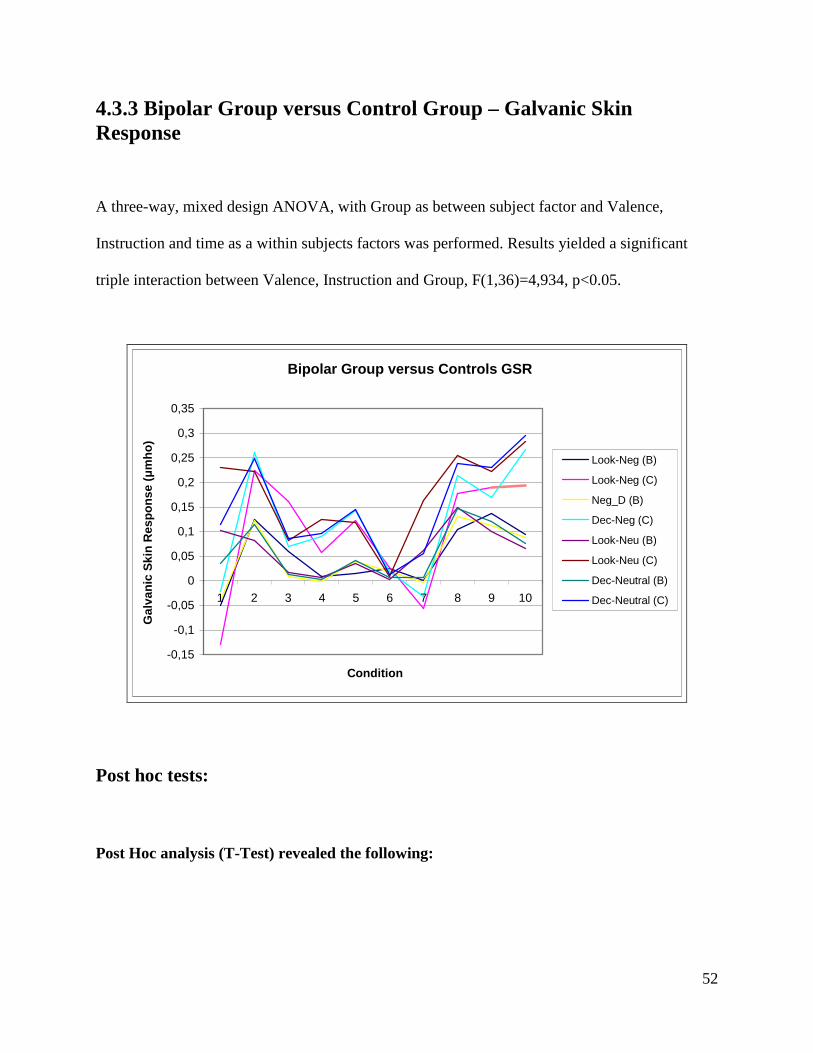
52
4.3.3 Bipolar Group versus Control Group – Galvanic Skin Response
A three-way, mixed design ANOVA, with Group as between subject factor and Valence,
Instruction and time as a within subjects factors was performed. Results yielded a significant
triple interaction between Valence, Instruction and Group, F(1,36)=4,934, p<0.05.
Bipolar Group versus Controls GSR
-0,15
-0,1
-0,05
0
0,05
0,1
0,15
0,2
0,25
0,3
0,35
1 2 3 4 5 6 7 8 9 10
Condition
Gal
van
ic S
kin
Res
po
nse
(µ
mh
o)
Look-Neg (B)
Look-Neg (C)
Neg_D (B)
Dec-Neg (C)
Look-Neu (B)
Look-Neu (C)
Dec-Neutral (B)
Dec-Neutral (C)
Post hoc tests:
Post Hoc analysis (T-Test) revealed the following:
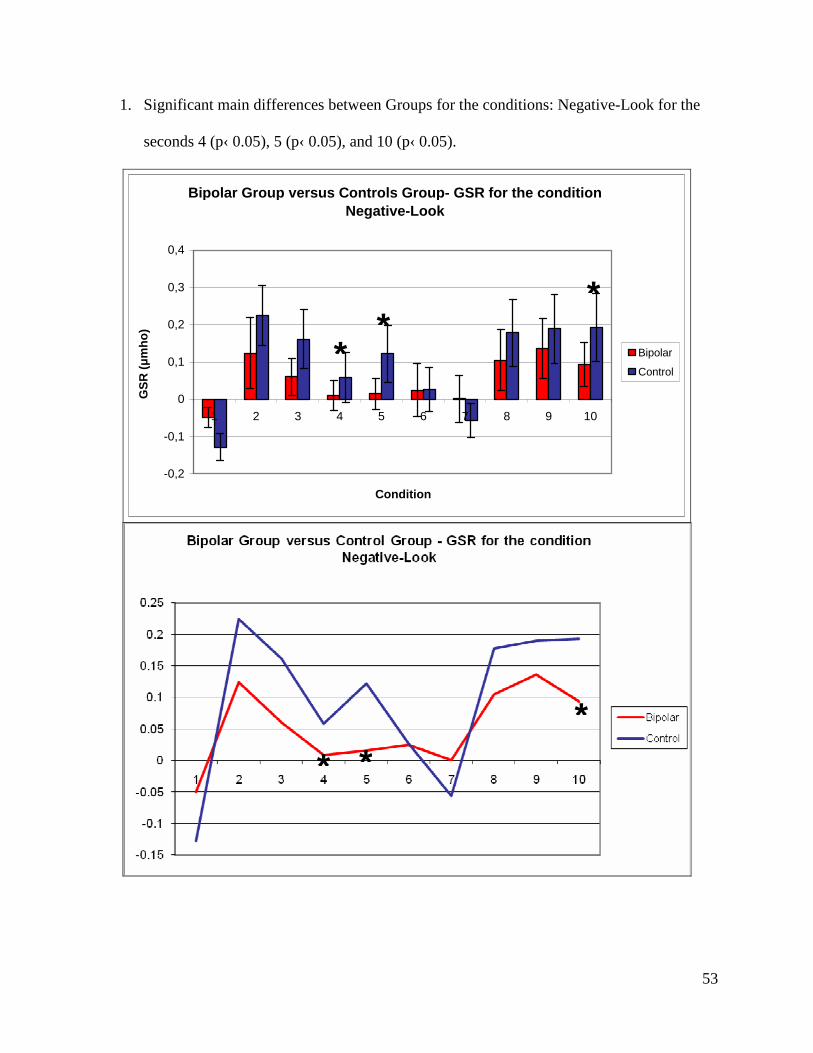
53
1. Significant main differences between Groups for the conditions: Negative-Look for the
seconds 4 (p‹ 0.05), 5 (p‹ 0.05), and 10 (p‹ 0.05).
Bipolar Group versus Controls Group- GSR for the condition Negative-Look
-0,2
-0,1
0
0,1
0,2
0,3
0,4
1 2 3 4 5 6 7 8 9 10
Condition
GS
R (µ
mh
o)
Bipolar
Control
* *
* *
*
*
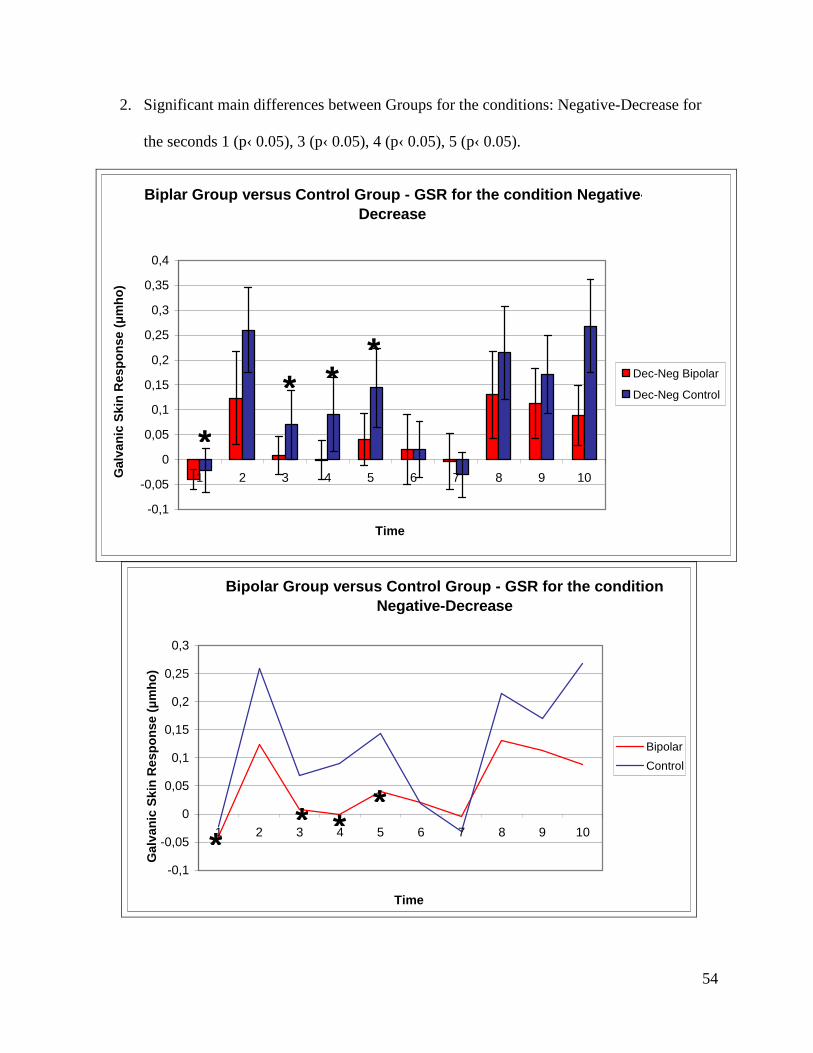
54
2. Significant main differences between Groups for the conditions: Negative-Decrease for
the seconds 1 (p‹ 0.05), 3 (p‹ 0.05), 4 (p‹ 0.05), 5 (p‹ 0.05).
Biplar Group versus Control Group - GSR for the condition Negative-Decrease
-0,1
-0,05
0
0,05
0,1
0,15
0,2
0,25
0,3
0,35
0,4
1 2 3 4 5 6 7 8 9 10
Time
Gal
van
ic S
kin
Res
po
nse
(µ
mh
o)
Dec-Neg Bipolar
Dec-Neg Control
Bipolar Group versus Control Group - GSR for the condition Negative-Decrease
-0,1
-0,05
0
0,05
0,1
0,15
0,2
0,25
0,3
1 2 3 4 5 6 7 8 9 10
Time
Gal
van
ic S
kin
Res
po
nse
(µ
mh
o)
Bipolar
Control
* * *
*
*
* *
*
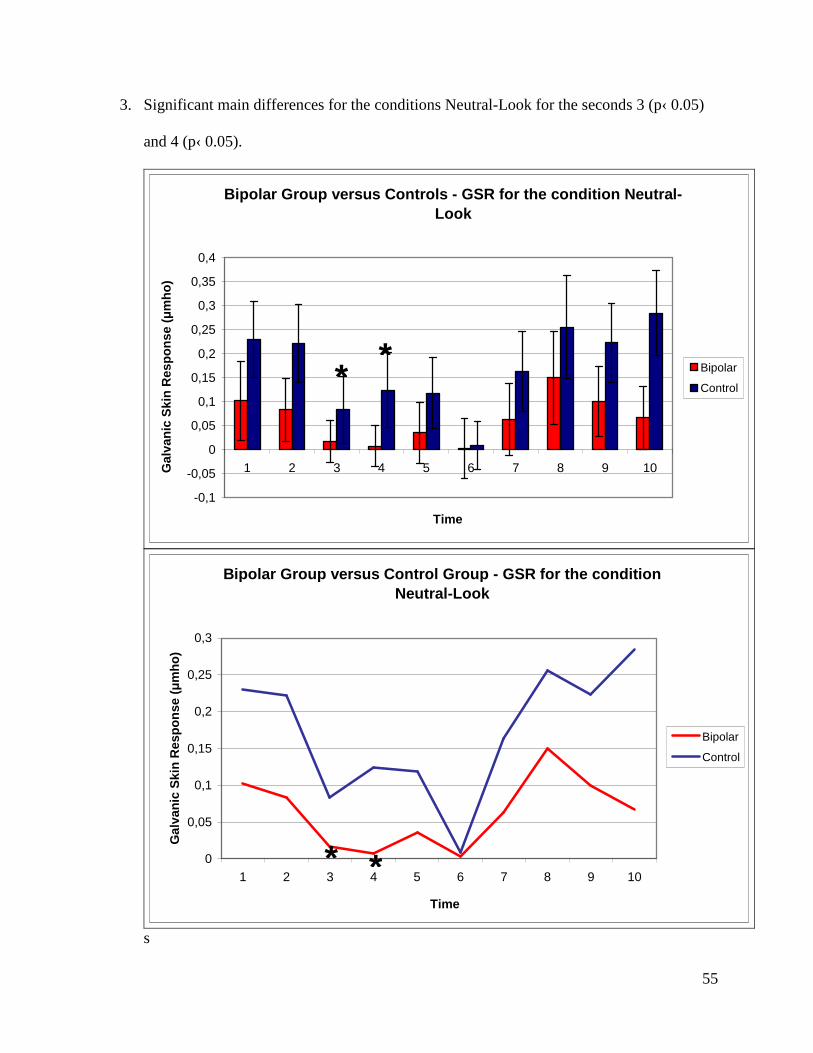
55
3. Significant main differences for the conditions Neutral-Look for the seconds 3 (p‹ 0.05)
and 4 (p‹ 0.05).
Bipolar Group versus Controls - GSR for the condition Neutral-Look
-0,1
-0,05
0
0,05
0,1
0,15
0,2
0,25
0,3
0,35
0,4
1 2 3 4 5 6 7 8 9 10
Time
Gal
van
ic S
kin
Res
po
nse
(µ
mh
o)
Bipolar
Control
Bipolar Group versus Control Group - GSR for the condition Neutral-Look
0
0,05
0,1
0,15
0,2
0,25
0,3
1 2 3 4 5 6 7 8 9 10
Time
Gal
van
ic S
kin
Res
po
nse
(µ
mh
o)
Bipolar
Control
s
* *
* *
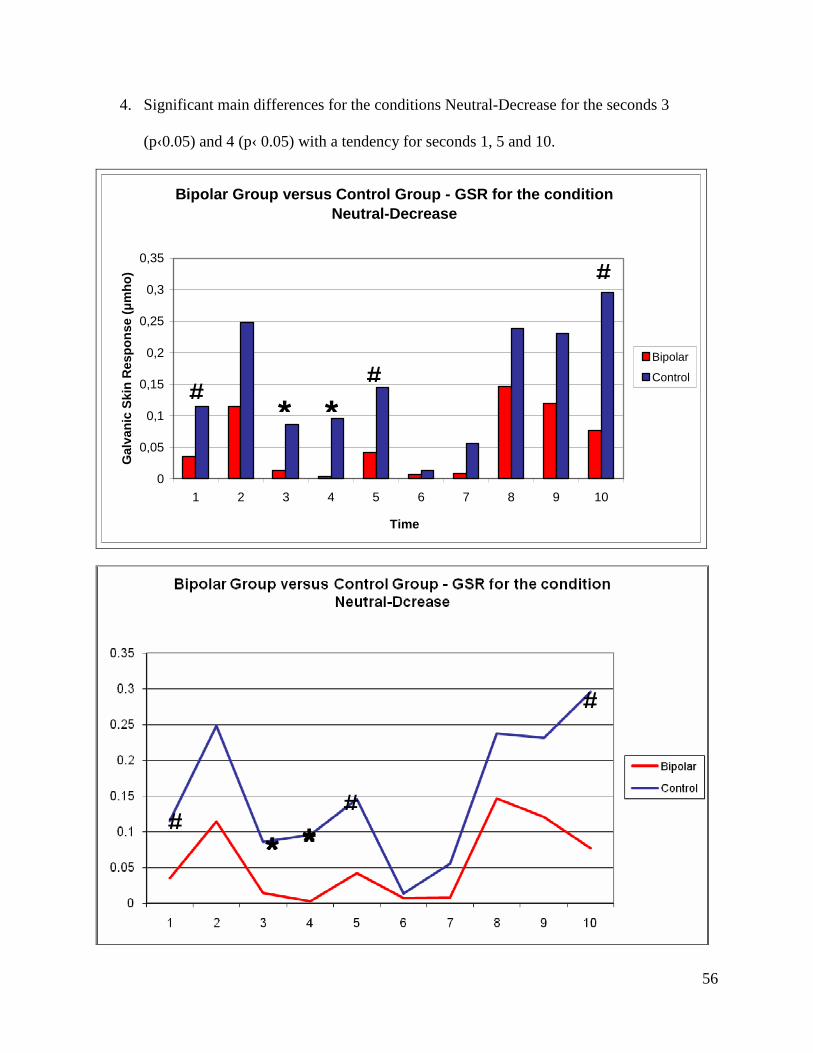
56
4. Significant main differences for the conditions Neutral-Decrease for the seconds 3
(p‹0.05) and 4 (p‹ 0.05) with a tendency for seconds 1, 5 and 10.
Bipolar Group versus Control Group - GSR for the condition Neutral-Decrease
0
0,05
0,1
0,15
0,2
0,25
0,3
0,35
1 2 3 4 5 6 7 8 9 10
Time
Gal
van
ic S
kin
Res
po
nse
(µ
mh
o)
Bipolar
Control
# #
#
* *
# * *
#
#
* *
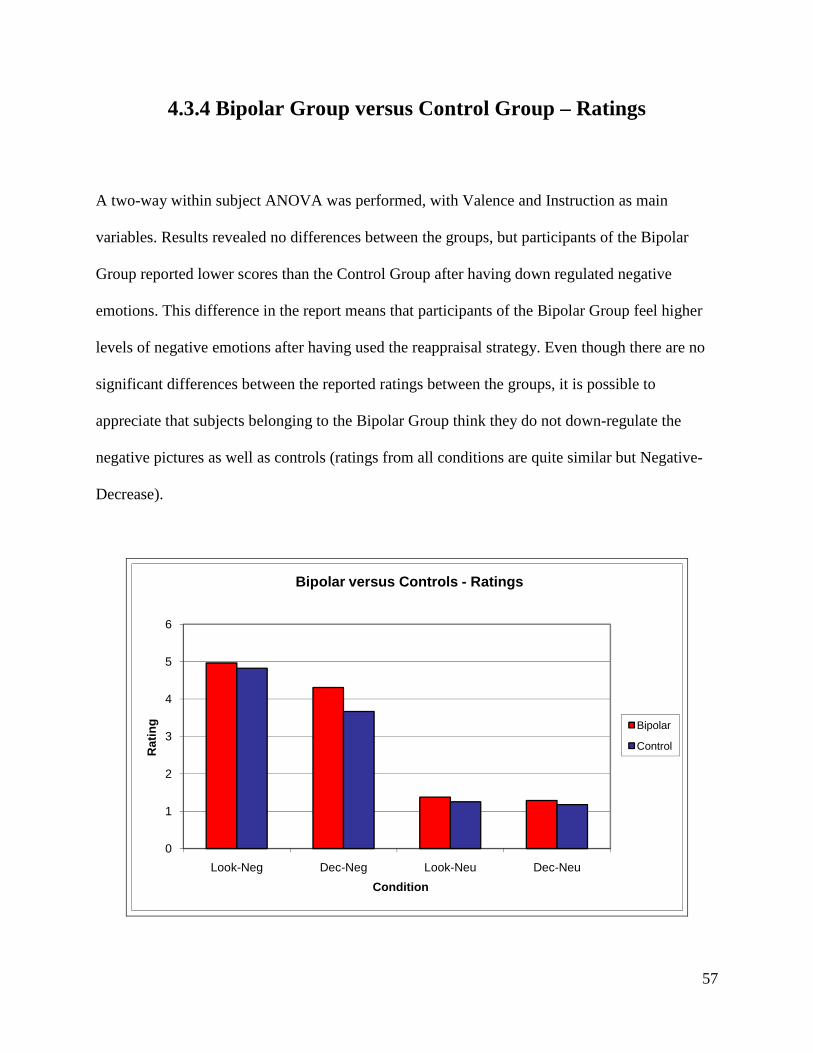
57
4.3.4 Bipolar Group versus Control Group – Ratings
A two-way within subject ANOVA was performed, with Valence and Instruction as main
variables. Results revealed no differences between the groups, but participants of the Bipolar
Group reported lower scores than the Control Group after having down regulated negative
emotions. This difference in the report means that participants of the Bipolar Group feel higher
levels of negative emotions after having used the reappraisal strategy. Even though there are no
significant differences between the reported ratings between the groups, it is possible to
appreciate that subjects belonging to the Bipolar Group think they do not down-regulate the
negative pictures as well as controls (ratings from all conditions are quite similar but Negative-
Decrease).
0
1
2
3
4
5
6
Look-Neg Dec-Neg Look-Neu Dec-Neu
Rat
ing
Condition
Bipolar versus Controls - Ratings
Bipolar
Control
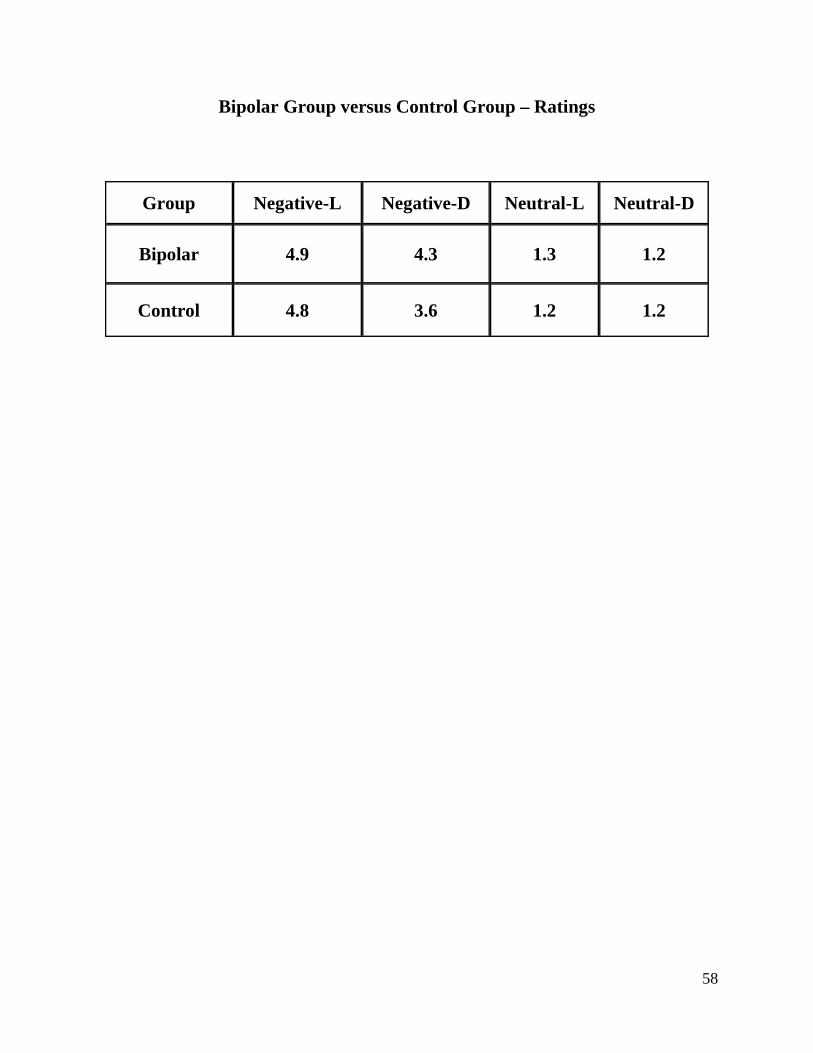
58
Bipolar Group versus Control Group – Ratings
Group Negative-L Negative-D Neutral-L Neutral-D
Bipolar 4.9 4.3 1.3 1.2
Control 4.8 3.6 1.2 1.2
59
Chapter 5
Discussion
Summary of main findings
5.1 Healthy Control Group
5.1.1 Heart Rate
1- HR is sensitive to detect differences in valence (Neutral versus Negative pictures) using this
paradigm (contrasts between conditions Look-Neutral versus Look-Negative).
2- HR is not sensitive to detect differences for instruction type (emotion regulation). According to
the results obtained measuring GSR, there is an effect in the cognitive regulation of negative
emotions, so we presume that the effect at a central level exists but cannot be perceived using
HR. These results can be appreciated in the contrasts between the conditions Look-Negative
versus Decrease-Negative.
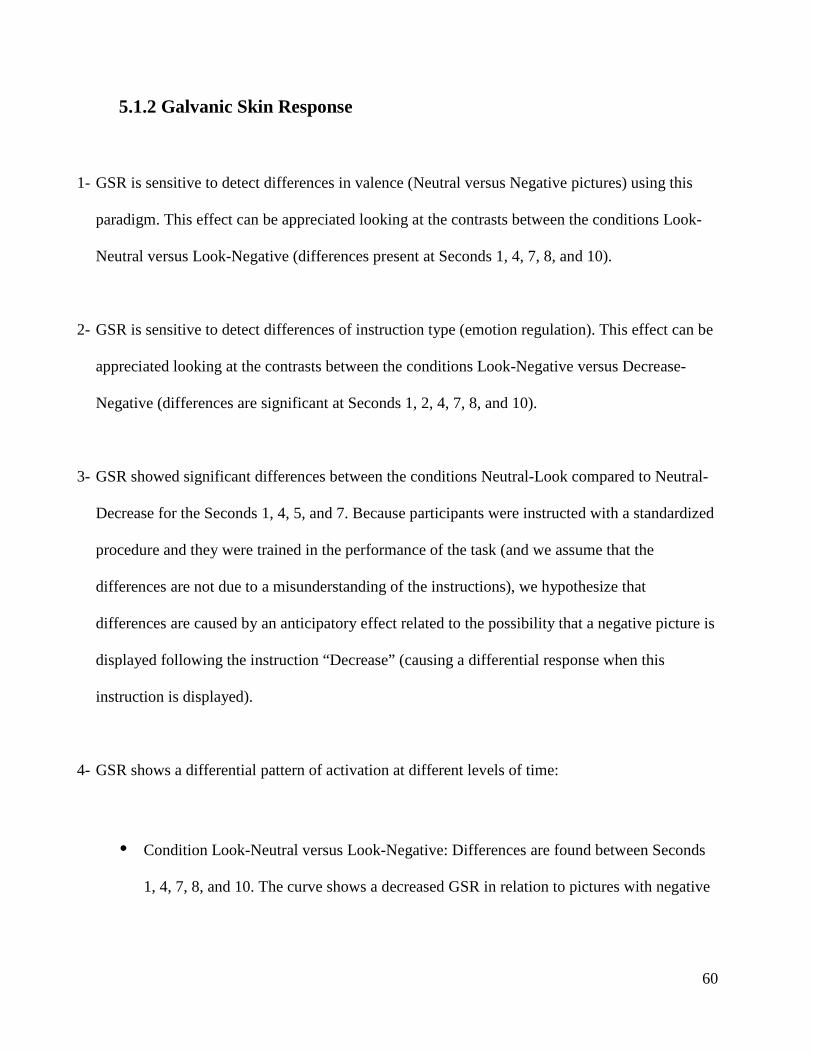
60
5.1.2 Galvanic Skin Response
1- GSR is sensitive to detect differences in valence (Neutral versus Negative pictures) using this
paradigm. This effect can be appreciated looking at the contrasts between the conditions Look-
Neutral versus Look-Negative (differences present at Seconds 1, 4, 7, 8, and 10).
2- GSR is sensitive to detect differences of instruction type (emotion regulation). This effect can be
appreciated looking at the contrasts between the conditions Look-Negative versus Decrease-
Negative (differences are significant at Seconds 1, 2, 4, 7, 8, and 10).
3- GSR showed significant differences between the conditions Neutral-Look compared to Neutral-
Decrease for the Seconds 1, 4, 5, and 7. Because participants were instructed with a standardized
procedure and they were trained in the performance of the task (and we assume that the
differences are not due to a misunderstanding of the instructions), we hypothesize that
differences are caused by an anticipatory effect related to the possibility that a negative picture is
displayed following the instruction “Decrease” (causing a differential response when this
instruction is displayed).
4- GSR shows a differential pattern of activation at different levels of time:
• Condition Look-Neutral versus Look-Negative: Differences are found between Seconds
1, 4, 7, 8, and 10. The curve shows a decreased GSR in relation to pictures with negative
61
content; this shows that the sympathetic response is inhibited in responses to images with
negative content.
At Second 1, the difference cannot be explained by any Instruction or Valence effect,
because the GSR response is a sympathetic response that is activated with a delayed time
of about 2 to 4 seconds. The origin of this difference is related to different levels of
baseline activity. The shape of the slope at this segment is similar, showing that the GSR
signal increases in parallel in both conditions.
At Second 4, there is also a difference that seems to be caused by a more sustained
decrease of the GSR response to pictures with negative content that starts at Second 2 and
lasts until Second 4. The GSR for neutral pictures shows a shorter decrease that goes
from Second 2 to 3 (starts rising at Second 3). We can infer, therefore, that there is a
valence effect responsible for this difference, where negative pictures produce a more
sustained decrease than neutral pictures.
At Second 7, there is a similar effect than the one observed at Second 4. The GSR signal
started decreasing for both types of pictures at Second 5, but in the case of the neutral
pictures, however, the decrease lasts for only 1 second (until Second 6) and then it
increases again. In the case of the negative pictures there is a similar effect but this time
the increase starts at Second 7, which is probably due to a particular effect generated only
for negative pictures.
The similar pattern of responses initiated by the decreased GSR at Seconds 2 and 5 leads
us to think about the existence of two different stages in the processing of visual stimuli,
62
where it is possible to hypothesise that there is a “fast” response arising at Second 2
(probably an involuntary or unconscious response that is generated for all pictures lasting
longer in those displaying negative images) and a “delayed” response starting at Second 5
(probably obeying to a conscious response to visual stimuli), which lasts longer for
images with negative content. After the ending of every phase, there are two apparently
“recovery” phases lasting 1 to 2 seconds.
At Second 8, there is also a difference in the GSR that corresponds to the differences
originated at Seconds 6-7, where GSR reflects the effect of valence. In this case the
slopes in both conditions rise in parallel but differing in intensity.
At Second 10, the curves differ in the slope: rising for neutral pictures and lowering for
negative pictures. At this level, it is likely that the response to stimuli with different
emotional valence is already attenuated and the changes could emerge as a consequence
of changes in the level of attention or residual mental processing related with the impact
produced by the pictures (associative memories or cognitive processes triggered in
relationship with the themes displayed in the pictures).
• Conditions Look-Negative versus Decrease-Negative: The pattern of the response
between these 2 conditions is similar, with the difference being that the GSR is less
decreased for the Decrease condition than for the Look condition at the end of the “fast”
and the “delayed” processing phases. It seems that the effect of down-regulation is
manifested in a decrease of the sympathetic inhibition that is present when subjects are
exposed to negative pictures. The duration of the “fast” and the “delayed” processing is
63
similar and the differences are perceived in the intensity of the GSR. At Second 2, it
seems that the effect of instruction (down-regulation) operates because it is at this level
where there is a differential effect showing a higher GSR response (or decreased
inhibition of the response) that is maintained constant throughout the remaining seconds,
displaying differences at Seconds 4, 7, 8, and 10 (the GSR is less decreased in response to
the condition Decrease compared to Look).
• Conditions Look-Neutral versus Decrease-Neutral: In this contrast, it seems that there is
an anticipatory effect that is evidenced at the level of Seconds 1, 4, 5, and 7. The effect of
anticipation could be interpreted as a stress-related response that exceeds the “fast” and
the “delayed” processing for 1 second producing a delayed recovery of the GSR after the
deepest points reached at Seconds 3 and 6. At Second 5, the perceived difference seems
to be related with a delayed response generated by the effect of the stress (anticipatory
effect) (at the end of the “fast” processing-second 3-) in subjects instructed to “Decrease”.
5.1.3 Ratings
The analysis of the ratings showed that participants subjectively distinguished clear differences
between pictures with different valence (Neutral versus Negative). Participants also refer to
being able to down-regulate the negative impact generated by negative pictures (they refer to
feeling less negative emotions after having down-regulated the pictures with negative content
compared to when they first looked at them - Decrease-Negative versus Look-Negative -). These
64
results mean that subjects are good regulators considering their subjective experience, which is
one of the aspects considered when assessing the cognitive regulation of emotions.
5.2 Bipolar Group
5.2.1 Heart Rate
No significant results were found. This means that in the Bipolar Group HR did not present any
differential activation in the presence of pictures with different value nor during the modulation
of negative emotions. This lack of variation in HR contrasts with the decreases that are recorded
during the exposure to negative pictures in the Control Group. Even though there are no
significant differences between the groups, variations in HR coincide with the direction of the
variations found in the Control Group (the condition Look-Negative presented the highest degree
of HR decrease, followed by the conditions Decrease-Negative, Look-Neutral and Decrease-
Neutral).
5.2.2 GSR
• Conditions Look-Neutral versus Look-Negative: The shape of the GSR signal in the
Bipolar Group is similar to the shape of the signal of the Control Group, but changes in
intensity are less marked in the Bipolar Group. The signal picks up at Second 2 during
the “fast” phase for the conditions Look-Neutral and Look-Negative, presenting a similar
65
pattern to that present in the Control Group (for neutral pictures the GSR decreases for 1
second and for the negative pictures, for 2 seconds). The first “recovery” phase doubles
the time of that found in the Control Group lasting 2 seconds for both conditions, i.e., the
rising in the GSR signal a half of the intensity of the increase found in the control group.
The slope of the “delayed” phase is similar in both conditions, but it is less pronounced in
the Bipolar Group. In both cases, the decreases in the signal last for 1 second, but the
degree of the decrease for negative pictures is shorter in the Bipolar Group where it lasts
longer and reaches a negative value at Second 7.
• Conditions Negative-Look versus Negative-Decrease: The pattern of the GSR is very
similar and resembles that of the Control Group. Only the amplitude of the GSR is
decreased in the Bipolar Group compared to controls. It also seems that during the
Decrease condition the GSR changes are more pronounced than in the Look condition, an
effect that can be observed in the slope of the GSR corresponding to the “fast” phase and
in the “first recovery” phase.
• Conditions Look-Neutral versus Decrease-Neutral: Even though there are no significant
differences in the results, the pattern of the responses correspond very well to those found
in the Control Group. The most remarkable similarity is the difference at the starting of
the slope corresponding to the “second recovery” phase which is less pronounced for the
condition Decrease for 1 second (the same finding is shown in the Control Group, where
there is a significant difference). Differences between the groups are perceived in the
amplitude of the GSR signal, which is larger in the Control Group.
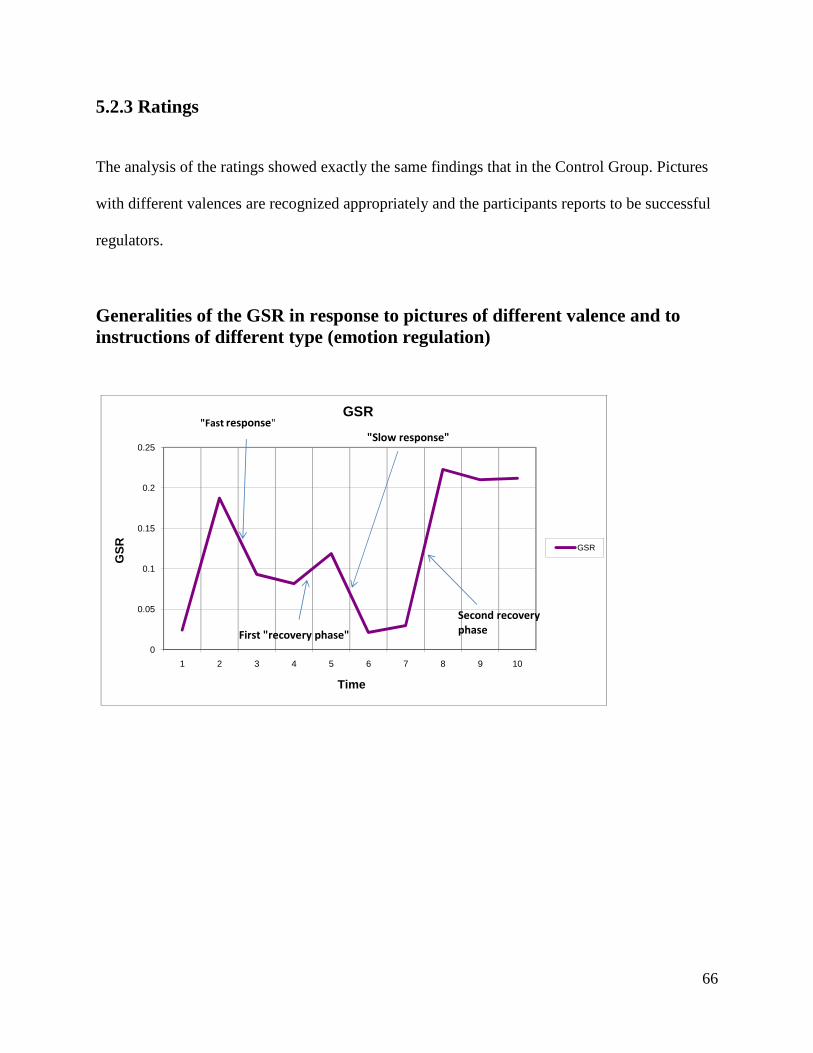
66
5.2.3 Ratings
The analysis of the ratings showed exactly the same findings that in the Control Group. Pictures
with different valences are recognized appropriately and the participants reports to be successful
regulators.
Generalities of the GSR in response to pictures of different valence and to instructions of different type (emotion regulation)
0
0.05
0.1
0.15
0.2
0.25
1 2 3 4 5 6 7 8 9 10
GS
R
Time
GSR
GSR
"Fast response"
"Slow response"
Second recovery
phaseFirst "recovery phase"

67
Chapter 6
Conclusions and Future Work
The findings reported here add information about the possibility to use GSR as a measure for
assessing the down-regulation of negative emotions. It is possible that previous unsuccessful
attempts to register changes in the down-regulation of negative emotions are related to the type
of strategy employed. In this case, using a situational focus-strategy that depends on the
activation of the DLPFC, we found that the effect of the down-regulation of negative emotions
can be assessed with GSR, and probably failures to assess this effect are related to the
employment of other strategies that depend on the activation of areas different of the DLPFC.
The design of the paradigm employed in this study seems to be appropriate for detecting
autonomic changes related to the down-regulation of negative emotions. The 10-seconds length
of the GSR recording seems to be appropriated to register all changes that can emerge in the
process of the down-regulation of negative emotions; it is also important to split the GSR signal
in bins of 1 second because it allows the presence of the different stages of the emotion
regulation process to be appreciated.
The paradigm was not useful to put into evidence the changes of HR in response to emotion
regulation, probably due to the need to display stimuli for longer periods of time (more than 10
seconds). By contrast, HR was sensible to detect changes in the valence of the stimuli.
The Bipolar Group presented decreased GSR and HR response when exposed to emotional
stimuli and when asked to down-regulate negative emotions. Future studies should explore
68
whether these features are correlated to the degree of activation of specific areas of the central
nervous system and see whether they are generated by trait features of the bipolar illness or by
the effect of medication. Independently of the cause of the decrease in the GSR and HR
response, subjects affected by bipolar disorders have a decreased response to pictures of different
valences or to the down-regulation of negative emotions. Participants in the bipolar group
reported lower scores when asked how well they regulate negative emotions.
Future work needs to explore variations of the GSR in time, which can be assessed adding a task
that includes the startle reflex as a new measure (the startle reflex is an accurate marker of
amygdala’s activation and allows relationships between its activation and the “fast” and “slow”
phases of the processing of negative emotions to be established).
It is important to complement the obtained data with functional brain imaging in order to observe
whether GSR and HR variations correlated to sympathetic and parasympathetic activations or
deactivations. It would also be important to see whether at a central level it is possible to
appreciate the differences observed at the peripheral level between the Bipolar Group and the
Healthy Control Group. The use of brain imaging may help to see whether people affected by
bipolar disorder have more difficulties to cope with negative emotions.
69
Bibliography
Ahern, G. S. et al. (2001). Heart rate and heart rate variability changes in the intracarotid sodium
amobarbital test. Epilepsia , 42 (7), 912-21.
Altshuler, L. L. , Bartzokis, G., Grieder, T., Curran, J., Jimenez, T., Leight, K. et al. (2000). An
MRI study of temporal lobe structures in men with bipolar disorder or schizophrenia.
Biol.Psychiatry , 48, 147-162.
Anders, S. L., Lotze, M., Erb, M., Grodd, W., Birbaumer, N (2004). Brain Activity Underlying
Emotional Valence and Arousal: A Response-Related fMRI Study. Human Brain Mapping , 23,
200-209.
Ax, A. (1953). The physiological differentiation between fear and anger in humans.
Psychosomatic Medicine , 15, 433-444.
Ba-M'Hamed, S. S. ., Sequeira, H., Roy, J.C (1993). Bilateral electrodermal activity during sleep
and waiking in the cat. Sleep , 16, 695-701.
Beauregard, M. L. ., Levesque, J., Bourgouin, P. (2001). Neural correlates of conscious self-
regulation of emotion. J Neurosci , 21, RC165.
Benes, F. M. Vincent, S. L., & Todtenkopf, M. (2001). The density of pyramidal and
nonpyramidal neurons in anterior cingulate cortex of schizophrenic and bipolar subjects.
Biol.Psychiatry , 50, 395-406.
Blumberg, H. P. et al. (2003). Amygdala and hippocampal volumes in adolescents and adults
with bipolar disorder. Arch.Gen.Psychiatry , 60, 1201-1208.
70
Blumberg, H. P. et al. (2003). Amygdala and hippocampal volumes in adolescents and adults
with bipolar disorder. Arch.Gen.Psychiatry, 60, 1201-1208. Arch.Gen.Psychiatry , 60, 1201-
1208.
Bouras, C. K. ., Kovari, E., Hof, P. R., Riederer, B. M., & Giannakopoulos, P. (2001). Anterior
cingulate cortex pathology in schizophrenia and bipolar disorder. Acta Neuropathol.(Berl) , 102,
373-379.
Bradley, M. L. ., Lang, P.J. (2000). Measuring emotion: Behavior, feeling and physiology. In M.
Bradley, & R. N. Lane (Ed.), Cognitive Neuroscience of Emotion (pp. 242-276). Oxford: Oxford
University Press.
Bradley, M.M. and Lang P.J. (1994) Measuring emotion: the Self-Assessment Manikin and the
semantic differential, Journal of Behavioral Therapy and Experimental Psychiatry, 25,.49–59.
Brambilla, P. G. ., Glahn, D. C., Balestrieri, M., & Soares, J. C. (2005). Magnetic resonance
findings in bipolar disorder. Psychiatr.Clin.North Am. , 28, 443-467.
Brambilla, P. H. et al. (2003). MRI investigation of temporal lobe structures in bipolar patients.
J.Psychiatr.Res. , 37, 287-295.
Buchanan, S. L., Valentine, J. & Powell, D.A.. (1985). Autonomic responses are elicited by
electrical stimulation of the medial but not lateral frontal cortex in rabbits. Behavioral Brain
Research , 18, 51-62.
Bundy, R. F. ., Fitzgerald, H.E. (1975). Stimulus specificity of electrodermal recovery time: an
examination and reinterpretation of the evidence. Psychophysiology , 12, 406-411.
Caligiuri, M. P. et al. (2004). A functional magnetic resonance imaging study of cortical
asymmetry in bipolar disorder. Bipolar.Disord. , 6, 183-196.
71
Caligiuri, M. P. et al. (2003). An fMRI study of affective state and medication on cortical and
subcortical brain regions during motor performance in bipolar disorder. Psychiatry Res. , 123,
171-182.
Chang, K. A. ., Adleman, N. E., Dienes, K., Simeonova, D. I., Menon, V., & Reiss, A. (2004).
Anomalous prefrontal-subcortical activation in familial pediatric bipolar disorder: a functional
magnetic resonance imaging investigation. Arch.Gen.Psychiatry , 61, 781-792.
Chen, B. K. et al. (2004). Cross-sectional study of abnormal amygdala development in
adolescents and young adults with bipolar disorder. Biol.Psychiatry , 56, 399-405.
Critchley, H. E. ., Elliott, R., Nathias, C.J., Dolan, R.J. (2000). Cerebral correlates of autonomic
cardiovascular arousal: a functional neuroimaging investigation in humans. Journal of
Physiology , 20 (8), 259-270.
Davidson, R. S. (2003). Handbook of affective sciences. New York: Oxford University Press.
Davison, M., & & Koss, M. (1975). Brainstem loci for activation of electrodermal response in
the cat. American Journal of Physiology , 229, 930-934.
Delbello, M. P. ., Zimmerman, M. E., Mills, N. P., Getz, G. E., & Strakowski, S. M. (2004).
Magnetic resonance imaging analysis of amygdala and other subcortical brain regions in
adolescents with bipolar disorder. Bipolar.Disord , 6, 43-52.
Demaree, H. R. ., Robinson, J.L., Pu, J., & Allen, J.J. (2006). Strategies actually employed
during response-focused emotion regulation research: Affective and physiological consequences.
Cognition and Emotion , 20, 1248-1260.
Doris, A. B. ., Belton, E., Ebmeier, K. P., Glabus, M. F., & Marshall, I. (2004). Reduction of
cingulate gray matter density in poor outcome bipolar illness. Psychiatry Res. , 130, 153-159.
72
Drevets, W. C. et al. (1997). Subgenual prefrontal cortex abnormalities in mood disorders.
Nature , 386, 824-827.
Eippert, F. V., Veit, R., Weiskopf, N., Erb, M., Birbaumer, N., Anders, S. (2007). Regulation of
emotional responses elicited by threat-related stimuli. Human Brain Mapping , 28, 409-423.
Ekman, P. (1992). An argument for basic emotions. Cognition and Emotion , 6 (3/4), 169-200.
Ekman, P. (1994). Moods, Emotions, and Traits. In P. &. Ekman, & P. E. Davidson (Ed.), The
Nature of Emotion (pp. 56-58). Oxford University Press.
Elliott, R. O. ., Ogilvie, A., Rubinsztein, J. S., Calderon, G., Dolan, R. J., & Sahakian, B. J.
(2004). Abnormal ventral frontal response during performance of an affective go/no go task in
patients with mania. Biol.Psychiatry , 55, 1163-1170.
Fish, D. G. ., Gloor, P., Quesney, F.L. & Oliver, A. (1993). Clinical responses to electrical brain
stimulation of temporal and frontal lobes in patients with epilepsy. Pathophysiological
implications. Brain , 116, 397-414.
Fredrikson, M., Furmark, T., Tillfors Olsson, M., Fischer, H., Andersson, J., & Langstrom, B.
(1998). Functional neuroanatomical correlates of electrodermal activity: A positron emission
tomographic study. Psychophysiology , 35, 179-185.
Gelsema, A. A. ., Agarwal, S.K. & Calaresu, F.R. (1989). Cardiovascular responses and changes
in neural activity in the rostral ventrolateral medulla elicited by electrical stimulation of the
amygdala of the rat. Journal of the Autonomic Nervous System , 27, 91-100.
Gross, J. J., & Thompson, R.A. (2007). Handbook of Emotion Regulation. (J. Gross, Ed.) New
york: Guilford Press.
73
Gross, J. J. (1998). Antecedent- and response-focused emotion regulation: divergent
consequences for experience, expression, and physiology. J PERS SOC PSYCHOL , 74 (1), 224-
237.
Gross, J. J. (2002). Emotion regulation: affective, cognitive, and social consequences.
Psychophysiology , 39, 281–291.
Hajek, T. C. ., Carrey, N., & Alda, M. (2005). Neuroanatomical abnormalities as risk factors for
bipolar disorder. Bipolar.Disord. , 7, 393-403.
HAMILTON, M. (1960). A rating scale for depression. J.Neurol.Neurosurg.Psychiatry , 23, 56-
62.
Hilz, M. D. , Devinsky, O., Szczepanska, H., Borod, J.C., Marthol, H., and Tutaj M. (2006).
Right ventromedial prefrontal lesions result in paradoxical cardiovascular activation with
emotional stimuli. Brain , 129, 3343-3355.
Hirayasu, Y. S. et al. (1999). Subgenual cingulate cortex volume in first-episode psychosis.
Am.J.Psychiatry , 156, 1091-1093.
Hot, P. N. , Neveteur, J., Leconte, P., Sequeira, H. (2005). Diurnal autonomic variations and
emotional reactivity. Int. J. Psychophysiol. , 69, 261-270.
Hot, P. N. , Neveteur, J., Leconte, P., Sequeira, H. (1999). Diurnal variation of tonic
electrodermal activity. Int. J. Phychophysiol. , 27, 223-230.
Iacoboni, M. W., Wilson, S.M. (2006). Beyond a single area: motor control and language within
a neural architecture. Cortex , 42, 503–506.
Johnson-Laird, P. a. (1989). The language of emotions: An analisys of a semantic field.
Cognition and Emotion , 3, 81-123.
74
Kaur, S. S. (2005). (2005). Cingulate cortex anatomical abnormalities in children and
adolescents with bipolar disorder. Am.J.Psychiatry , 162, 1637-1643.
Lane, R. F. (1997). Neural activation during selective attention to subjective emotional
responses. Neuroreport , 8, 3969-3972.
Lawrence, N. S. (2004). Subcortical and ventral prefrontal cortical neural responses to facial
expressions distinguish patients with bipolar disorder and major depression. Biol.Psychiatry , 55,
578-587.
Lazarus, R. &. (1964). Short-circuiting of threat by experimentally altering cognitive appraisal.
Journal of Abnormal and Social Psychology , 69, 195-205.
LeDoux, J. (1998). The emotional brain: the misterious underpinnings of emotional life. New
York: Simon & Shuster.
Levesque, J. E. (2003). Neural circuitery underlying voluntaru suppresion of sadness. Biol
Psychiatry , 53, 502-510.
Lochhead, R. A. (2004). Regional brain gray matter volume differences in patients with bipolar
disorder as assessed by optimized voxel-based morphometry. Biol.Psychiatry , 55, 1154-1162.
Lyoo, I. K. (2004). (2004). Frontal lobe gray matter density decreases in bipolar I disorder.
Biol.Psychiatry , 55, 648-651.
MacDonald, A. 3. (2000). Dissociating the role of the dorsolateral prefrontal and anterior
cingulate cortex in cognitive control. Science , 288, 1835–1838.
Malhi, G. S. (2004). Cognitive generation of affect in bipolar depression: an fMRI study.
Eur.J.Neurosci. , 19, 741-754.
75
Mangina, C., & & Beuzeron-Mangina, J. ((22)1996). Direct electrical stimulation of specific
human brain structures and bilateral electrodermal activity. International Journal of
Phychophysiology , 22, 1-8.
Martinez-Aran, A. V.-M. (2004). Cognitive impairment in euthymic bipolar patients:
implications for clinical and functional outcome. Bipolar Disord. , 6, 224-232.
Mauss, I. B. (2007). Automatic emotion regulation. Soc. Pers. Psychol. Compass. , 1, 146-167.
McRae, K. O. (2008). Gender differences in emotion regulation: An fMRI study of cognitive
reappraisal. Group Processes and Intergroup Relataions , 11, 143-162.
Montgomery, S. A. (1979). A new depression scale designed to be sensitive to change.
Br.J.Psychiatry , 134, 382-389.
Ochsner, K. B. (2002). Rethinking feelings: An FMRI study of the cognitive. Neuroscience , 14,
1215-1229.
Ochsner, K. G. (2005). The cognitive control of emotions. 9 (5), 242-249.
Ochsner, K. R. (2004). For better or for worse: Neural systems supporting the cognitive down-
and up-regulation of negative emotion. Neuroimage , 23, 483-499.
Ongur, D. D. (1998). Glial reduction in the subgenual prefrontal cortex in mood disorders.
Proc.Natl.Acad.Sci.U.S.A , 95, 13290-13295.
Oppenheimer, S. G. (1992). Cardiovascular effects of human insular cortex stimulation.
Neurology , 42, 1727-1732.
Palomba, D. A. (1997). Visual evoked potentials, heart rate responses and memory to emotional
pictorial stimuli. Int. J. Psychophysiol. , 27, 55-67.
Paus, T. K. (1998). Regional differences in the effects of task difficulty and motor output on
blood flow. NeuroReport , 9, R37-R47.
76
Pearlson, G. D. (1997). Ziskind-Somerfeld Research Award 1996. Medial and superior temporal
gyral volumes and cerebral asymmetry in schizophrenia versus bipolar disorder. Biol.Psychiatry ,
41, 1-14.
Phan, K. F. (2005). Neural substrates for voluntary suppression of negative affect: a functional
magnetic resonance imaging study. Biol Psychiatry , 57, 210–219.
Phan, K. W. (2002). Functional anatomy of emotion: a meta-analysis of emotion activation
studies in PET and fMRI. Neuroimage , 16, 331-348.
Pool, J. &. (1949). Autonomic effects on stimulating the rostral portion of the cingulate gyri in
man. Journal of Neurophysiology , 12, 385-392.
Raine, A., Reynolds, G., & & Sheard, C. (1991). Neuroanatomical correlates of skin conductance
orienting in normal humans: A magnetic resonance imaging study. Psychophysiology , 28, 548-
558.
Roy, J., Delerm, B., & Granger, L. (1974). L'inhibition bubaire de l'activité électrodermale chez
le chat. Electroencephalogr. Clin. neurophysiol. , 37, 621-632.
Sassi, R. B. (2004). (2004). Reduced left anterior cingulate volumes in untreated bipolar patients.
Biol.Psychiatry , 56, 467-475.
Schaefer, S. J.-S. (2002). Modulation of amygdalar activity by the conscious regulation of
negative emotion. J Cogn Neurosci , 14, 913-921.
Sequeira, H., Hot, P., Silvert, L., & Delplanque, S. (2009). Electrical autonomic correlates of
emotion. International Journal of Psychophysiology , 71, 50-56.
Sharma, V. M. (2003). An MRI study of subgenual prefrontal cortex in patients with familial and
non-familial bipolar I disorder. J.Affect.Disord. , 77, 167-171.
77
Sheppes, G. &. (2007). Better late than never? On the dynamics of the on-line regulation of
sadness using distraction and cognitive reappraisal. Personality and Social Psychology Bulletin ,
33, 1518-1532.
Solbakk, A. R. (2005). ERP indices of resource allocation difficulties in mind head injury.
Neurophychol. , 22, 743-760.
Speisman, J. L. (1964). Experimental reduction of stress based on ego-defense theory. Journal of
Abnormal and Social Psychology , 68, 367-380.
Strakowski, S. M. (2004). A preliminary FMRI study of sustained attention in euthymic,
unmedicated bipolar disorder. Neuropsychopharmacology , 29, 1734-1740.
Strakowski, S. M. (1999). Brain magnetic resonance imaging of structural abnormalities in
bipolar disorder. Arch.Gen.Psychiatry , 56, 254-260.
Strakowski, S. M. (2005). The functional neuroanatomy of bipolar disorder: a review of
neuroimaging findings. Mol.Psychiatry , 10, 105-116.
Strakowski, S. M. (2005). The functional neuroanatomy of bipolar disorder: a review of
neuroimaging findings. Mol Psychiatry , 10, 105-116.
Swayze, V. W. (1992). Subcortical and temporal structures in affective disorder and
schizophrenia: a magnetic resonance imaging study. Biol.Psychiatry , 31, 221-240.
Toobey, J. C. (1990). The past explains the present: Emotional adaptations and the structure of
the ancestral environments. Ethology and Sociobiology , 11, 375-424.
Tranel, D. (2000). Electrodermal activity in cognitive neuroscience: neuroanatomical and
neuropsychological correlates. (R. N. Lane, Ed.) New york: Oxford University Press.
Tranel, D., & & Damasio, H. (1994). Neuroanatomical correlates of electrodermal skin
conductance responses. Phychophysiology , 31, 427-438.
78
Urry, H. (2009). Using reappraisal to regulate unpleasant emotional episodes: goals and timing
matter. Emotion , 9 (6), 782-797.
Urry, H. v. (2006). Amygdala and ventromedial prefrontal cortex are inversely coupled during
regulation of negative affect and predict the diurnal pattern of cortisol secretion among older
adults. J Neurosci , 26, 4415–25.
(1973). Mechanisms, instrumentation, recording techniques, and quantification of response. In P.
C. Venables, & W. R. Prokasy (Ed.), Electrodermal activity in Psychological Research (pp. 23-
109). New York: Academic Press.
Wallin, G. F. (1986). The sympathetic nervous system in man - aspects derived from
microelectrode recordings. Trends Neurosci. , 9, 63-67.
Whalen, P. J. (1988). The emotional counting Stroop paradigm: a functional magnetic resonance
imaging probe of the anterior cingulate affective division. Biol.Psychiatry, 44, 1. Biol.Psychiatry
, 44, 1219-1228.
Willette, R. P. (1984). Interdependence of rostral and caudal ventrolateral medullary areas in the
control of blood pressure. Brain research , 321, 169-174.
Winsberg, M. E. (2000). Decreased dorsolateral prefrontal N-acetyl aspartate in bipolar disorder.
Biol.Psychiatry , 47, 475-481.
Wirz-Justice, A. V. (1999). Sleep deprivation in depression: What do we know, where do we go?
Psychiatry , 46, 445-453.
Yamasue, H. K. (2004). Voxel-based analysis of MRI reveals anterior cingulate gray-matter
volume reduction in posttraumatic stress disorder due to terrorism. Proc Natl Acad Sci U S A ,
100, 9039-9043.
79
Young, R. C. (1978). A rating scale for mania: reliability, validity and sensitivity.
Br.J.Psychiatry , 133, 429-435.
Yurgelun-Todd, D. A. (2000). fMRI during affect discrimination in bipolar affective disorder.
Bipolar.Disord , 2, 237-248.
Yurgelun-Todd, D. A. (2006). Functional magnetic resonance imaging studies in bipolar
disorder. CNS.Spectr. , 11, 287-297.
Zahn, T. G. (1999). Frontal lobe lesions and electrodermal activity: effects of significance.
Neurophychologia , 37, 1227-1241.
80
Appendix 1: Inclusion and exclusion criteria
1- Inclusion criteria:
A) Controls
. 18 years old or more. Good physical condition (i.e. no neurological disorder, stable thyroid
function -no changes in synthiroid doses in the last 3 months-).
. To be free of any psychiatric disorder.
B) Patients
. 18 years old or more.
. Good physical condition (i.e. no neurological disorder, stable thyroid function -no
changes in syntroid doses in the last 3 months-).
. To have the diagnosis of bipolar I disorder.
. To be in euthymic phase for 1 month.
2- Exclusion criteria:
A) Controls
. Current or past history of psychiatric illness (DSM IV diagnoses –SCID-).
. Use of benzodiazepines, carbamazepine, barbiturates.
. History of alcohol or drug abuse in the past year (SCID).
81
. History of panic disorder, post-traumatic stress disorder, generalized anxiety
disorder (SCID).
. Family history of mood or anxiety disorders (first degree relatives).
. Hamilton Rating Scale (HAM-D 21) > 7.
. Montgomery-Asberg Depression Rating Scale (MADRS) > 8
. Young Mania Rating Scale (YMRS) > 4
B) Patients
. Use of benzodiazepines, carbamazepine, barbiturates (medical records).
. History of alcohol or drug abuse in the past year (SCID).
. History of panic disorder, post-traumatic stress disorder, generalized anxiety
disorder (SCID).
. Hamilton Rating Scale (HAM-D 21) > 7
. Montgomery-Asberg Depression Rating Scale (MADRS) > 8
. Young Mania Rating Scale (YMRS) > 4
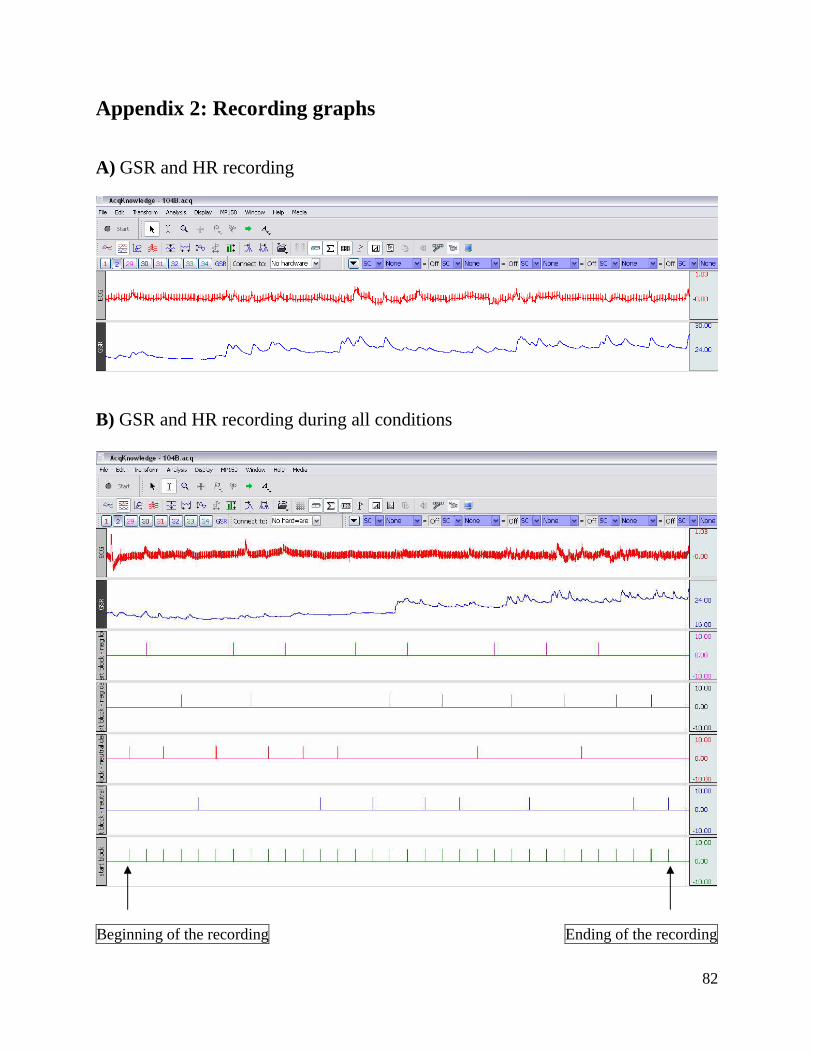
82
Appendix 2: Recording graphs A) GSR and HR recording
B) GSR and HR recording during all conditions
Beginning of the recording Ending of the recording