Embed Size (px)
Citation preview
ISERPWorking Paper 07-02
The Assessment of Poverty andInequality Through ParametricEstimation of Lorenz Curves
AN EVALUATION
CAMELIA MINOIUDEPARTMENT OF ECONOMICS
COLUMBIA UNIVERSITY
SANJAY REDDYDEPARTMENT OF ECONOMICS, BARNARD COLLEGE
COLUMBIA UNIVERSITY
COLUMBIA UNIVERSITY IN THE CITY OF NEW YORK
JANUARY 2007
PIONEERING SOCIAL SCIENCE RESEARCH AND SHAPING PUBLIC POLICY
INSTITUTE FOR SOCIAL AND ECONOMIC RESEARCH AND POLICY
THE ASSESSMENT OF POVERTY AND INEQUALITY THROUGH
PARAMETRIC ESTIMATION OF LORENZ CURVES1
AN EVALUATION
Camelia Minoiu2
Department of Economics Columbia University
Sanjay Reddy3 Department of Economics
Barnard College
ISERP Working Paper 07-024
January 2007
9,328 Words 9 Tables 4 Figures
1 We are grateful for the support of the Bureau of Development Policy and the International Poverty Centre of the United Nations Development Program. We would like to thank Terry McKinley for facilitating that support. We would also like to thank Shaohua Chen, Gaurav Datt, and Martin Ravallion for helpful comments and Sergey Kivalov for assisting us with software development. We would like to thank Catherine Choi and Prabhjot Kaur for research assistance. 2 Dept. of Economics and Institute for Social and Economic Research and Policy, Columbia University. Email: [email protected] Tel. 212-854-6385, Fax. 212-854-7998. 3 Dept. of Economics, Barnard College, Columbia University and Institute for Social and Economic Research and Policy, Columbia University. Email: [email protected]. Tel. 212-854-3790, Fax. 212-854-8947. 4 Updated versions of this paper will be made available on www.columbia.edu/~sr793/povcalnote.pdf
Abstract The estimation of poverty and inequality often requires the use of grouped data as complete household surveys are neither always available to researchers nor easy to analyze. In this study we assess the performance of two functional forms for the Lorenz curve proposed by Kakwani (1980) and Villasenor and Arnold (1989). The methods are implemented using the computational tool POVCAL, developed and distributed by the World Bank. To identify biases associated with this method of estimating the two Lorenz curve functional forms, we analyze unit data from several household surveys and a wide range of theoretical distributions. We find that poverty and inequality is better estimated when the data is generated from unimodal distributions than when it is drawn from multimodal distributions. For unimodal distributions, the biases in the estimation of poverty measures are rarely larger than one percentage point. Inequality (measured by the Gini coefficient) is well estimated in most cases considered. Neither of the two Lorenz curve estimation methods provides consistently superior performance, and performance does not always improve with the number of data points analyzed.
Keywords: grouped data, Lorenz curve, poverty, inequality, income distribution, parametric estimation, POVCAL JEL Classifications: C13, C14, C15, C16, D31, D63, I32 Wordcount: 9,328
1
| 1 | INTRODUCTION
he estimation of poverty and inequality often requires the use of grouped data (i.e. data concerning the mean incomes, or other advantages1, of population quantiles such as quintiles or deciles) as complete household surveys are not always available to
researchers. Moreover, the analysis of complete household surveys is often labour and time-intensive. Some applied research, such as attempts to estimate regional and global poverty, have extensively used estimates derived from grouped data for both of these reasons.2 Grouped data has provided the sole source of information on income distributions of large countries (such as China) which play a crucial role in determining our picture of the extent and trend of world poverty and inequality.3 Further, grouped data often provides the only source of historical data (survey data from the past may no longer be available but summary statistics from these surveys may have been published) and thus plays an important role in the estimation of long run trends.4 Data on the size distribution of firms is also often available only in grouped form.
Several methods have been proposed in the literature to obtain estimates of poverty, inequality, the density function or the Lorenz curve from grouped data: a first approach relies on the parametric estimation of the density function and/or that of the Lorenz curve. A second approach involves nonparametric (e.g. kernel density) estimation of the income density. It has recently been employed by Sala-i-Martin (2002a, 2002b, 2006) and other researchers.5 In this study we analyze the performance of the ready-to-use software POVCAL, developed and distributed by the World Bank, which is widely used to implement one of these methods – parametric estimation of the Lorenz curve.6 POVCAL is used to produce the national poverty estimates used in the construction of global poverty assessments when underlying household surveys are not available but grouped data is available (see, e.g., Bhalla 2002, Chen and Ravallion 2001 and 2004, and Pritchett 2006 in regard to global poverty estimates; Chen and Wang, 2001 and Chen and Ravallion, 2005 in regard to national poverty
1 In what follows, we bear in mind that poverty and inequality analysis can be applied to distributions of consumption, income or other dimensions of personal advantage. However, without loss of generality we refer to income distributions throughout the paper. 2 Quite apart from the lack of availability of surveys for all countries and all years, and the prohibitively large volume of data which needs to be analyzed, the exercise is further complicated by issues relating to the inter-country comparability of surveys and of poverty lines, which we do not address further here. For discussion of the issues involved, see e.g. Deaton (2005), Milanovic (2005), Chen and Ravallion (2004), Reddy and Pogge (2006), Pogge and Reddy (2006), and Reddy, Visaria and Asali (2006). 3 See, for example, Chen and Ravallion (2004) and Reddy and Minoiu (2006). China’s State Statistics Bureau has not made the full household survey data it collects available to outside researchers. 4 See, e.g. Bourguignon and Morrison (2002) for a study heavily relying on such grouped data as the basis for historical comparisons. 5 For example, Ackland et al (2004), Dhongde (2005), and Fuentes (2005). Minoiu and Reddy (2006) provide an assessment of the kernel density estimation approach. 6 Some of the functions of the stand-alone software are built in to the PovcalNet website of the World Bank (http://iresearch.worldbank.org/PovcalNet/jsp/index.jsp), which allows users to obtain poverty estimates for any country in the period covered for a specified poverty line. The user can choose the PPPs to be applied if poverty is to be estimated relative to an international poverty line expressed in US$. A set of PPPs is available as a default option.
T
2
estimates). A number of studies of the progress of specific countries and of the world towards the first Millennium Development Goal (halving severe poverty by the year 2015) have employed POVCAL (see, e.g., Woo et al, 2004 for such an assessment of poverty reduction in China and Karshenas, 2004 for such an assessment for the world and for specific regions).
POVCAL has been used in the construction and reporting of Gini coefficients in the UNU-WIDER World Income Inequality Database V.2.0a (2005) and the World Bank’s Measuring Income Inequality Database (Deininger and Squire, 1996) and has thereby subsequently influenced a large number of cross-country econometric analyses that have employed these two databases.7 POVCAL is extensively used to estimate Lorenz curves and associated poverty and inequality estimates in both academic and operational work. For example, it has been widely used in the preparation of national poverty assessments8 and recommended to practitioners as a standard poverty assessment tool by various development agencies9.
The software fits a Lorenz curve from grouped data using two alternative parameterizations (Kakwani, 1980a and Villasenor and Arnold, 1989) and presents as output estimates of the Lorenz curve and of several poverty and inequality indicators. It estimates parameters for the two functional forms by transforming them into a linear form and using ordinary least squares regression. From this perspective, we are evaluating the use of the functional forms proposed in conjunction with a specific method used to identify best-fitting parameters (OLS regression) which could in principle also be changed (e.g. to maximum likelihood estimation).We seek to assess whether there are sizable or systematic biases in the estimated Lorenz curves and associated measures of poverty and inequality. To this end, we use (i) household survey data from four countries (China, Nicaragua, Tanzania and Vietnam), (ii) data drawn from several theoretical distributions (Weibull, Pareto, Log-normal and Generalized Beta II) with parameter values assigned on the basis of previous empirical estimates, and (iii) Monte Carlo simulations of surveys of a population with incomes distributed according to two distributions (the Dagum distribution and a multimodal distribution corresponding to the world inter-personal distribution of per capita income). We compare the Lorenz curve, poverty and inequality estimates obtained from POVCAL applied to grouped data with those obtained directly from the underlying distributions. Plots of all distributions used in the paper are presented in Figures 1 and 2 in the Appendix.
We find that POVCAL performs relatively well in estimating poverty and inequality from distributions that are unimodal. Larger biases were identified in the case of a multimodal distribution. Inequality (measured by the Gini coefficient) is accurately estimated in most cases considered. We also find that the biases of poverty and inequality estimates vary (albeit not systematically) with the number of datapoints analyzed, the interpolation method, the
7 See, e.g., Lundberg and Squire (2003), Banerjee and Duflo (2003), Milanovic (2002), Forbes (2000), Easterly (1999), and Deininger and Squire (1998). Furthermore, Son and Kakwani (2006), Belkacem and Limam (2004), and Figini and Santarelli (2006) produce their own estimates of inequality and poverty using POVCAL and employ them in cross-country econometric analyses. 8 A small sample of the studies which employ the software for national poverty assessment is the following: Ali and Elbadawi (2002) for Sudan, Asra (2000) for Indonesia, Belkacem (2001) for Algeria, Eele et al (2000) for Tanzania, Acharya (2004) for Nepal, Joekes et al (2000) for Pakistan. 9See, for example, USAID (2004) and World Bank (2003).
3
nature of the underlying true distribution, the poverty line, and the indicator chosen for poverty assessment. We encountered a series of technical problems with the software when using certain distributions (in particular, multimodal and Pareto distributions).
The paper is structured as follows. Section 2 briefly discusses grouped data and previous assessments of the performance of various parametric Lorenz-curve fitting techniques. Our findings concerning biases in POVCAL’s estimates in relation to their true (theoretical) or survey counterparts from underlying distributions are presented in Sections 3 and 4. Some conclusions are drawn in Section 5.

4
| 2 | PARAMETRIC ESTIMATION OF LORENZ CURVES USING POVCAL: THE APPROACH AND PREVIOUS ASSESSMENTS
he Lorenz curve is estimated by POVCAL from grouped data by regression analysis based on two alternative functional forms, each involving three parameters (see Datt 1998, p. 6). The Generalized Quadratic parameterization (henceforth, ‘GQ’) was
proposed by Villasenor and Arnold (1989) while the Beta parameterization was proposed by Kakwani (1980a). The grouped data read by the program may take different forms - e.g. income shares of quantiles (income classes with common population size), mean incomes for quantiles, percentage of the population in given income intervals, etc.
For a user-specified poverty line, the output of the software includes: the poverty headcount ratio (FGT0), the poverty gap index (FGT1), the squared poverty gap (FGT2), and the elasticity of the aforementioned poverty measures with respect to the mean income (assuming a constant distribution). POVCAL also reports the Gini coefficient of inequality. Furthermore, it reports estimates of the Lorenz curve and produces graphs of the curve. Based on goodness-of-fit criteria (namely, minimization of the overall sum of squared fitted errors and the sum of squared fitted errors over the part of the Lorenz curve corresponding to proportions of the population beneath the headcount ratio, it determines which of the two parameterizations offers a better fit to the grouped data. Finally, the software reports on the consistency of the Lorenz curve estimate with the requirements for a valid Lorenz curve.10
Despite its widespread use, evidence on the accuracy of POVCAL’s estimates is limited. One assessment of the performance of these two parameterizations is that by Ravallion and Huppi (1989). The authors used grouped data on household consumption from 50,000 randomly selected Indonesian households and compared estimates of the Lorenz curve obtained via three parametric functional forms - those associated with Villasenor and Arnold (1989), Kakwani and Podder (1976), and Kakwani (1980a) - with the estimates obtained directly from unit data from the survey. The parameterizations considered include the two incorporated into POVCAL. They found that the worst fit is provided by the two-parameter specification of Kakwani and Podder (1976), while the other two specifications give broadly similar results.11 They also found that Villasenor and Arnold’s parameterization provided a 10 The theoretical invalidity of the Kakwani (1980a) Beta functional form is noted by Ortega et al (1991). It can easily be shown algebraically that this functional form always violates conditions required for the validity of the Lorenz curve (in particular by implying a negative slope at the origin). The GQ parameterization gives rise to valid Lorenz curves only under certain conditions on its parameters. Villasenor and Arnold (1989) find that the estimated GQ Lorenz curve is sometimes invalid in empirical estimates. We also find this to be the case. The possibility of negative estimated income shares is inherent in the use of OLS regression as a method of estimating the parameters, since the linear specification cannot be applied in a manner that wholly rules out this possibility. 11 Kakwani and Podder (1976) discuss the goodness of fit of their two-parameter specification. An empirical exercise which they undertake (using data from the 1967-68 Australian Survey of Consumer Expenditures and Finance) reveals underestimation of the mean income of the poorest 5 percent of the population, and overestimation of the mean income of the poorest 10 percent. Anand (1983), and Anand and Kanbur (1993a, 1993b) note that there are reasons in theory to doubt the satisfactoriness of Kakwani and Podder's (1976) proposed functional form for parametric estimation of the Lorenz curve. A related study is that by Dhongde (2004), who theoretically derives the small sample bias of Lorenz curve estimates associated with the earlier parameterization of Kakwani and Podder (1973).
T
5
better fit towards the high end of the income distribution (for higher quantiles), while Kakwani’s 1980 parameterization did so for lower quantiles.
Using the 1967-1968 Australian Survey of Consumer Expenditure, Villasenor and Arnold (1989) assess the goodness of fit of the GQ functional form. The authors find that GQ is superior to three alternative parameterizations (those proposed by Kakwani and Podder (1976), Pakes (1981), and the classical Pareto distribution) based on the criterion of minimizing the sum of squared and absolute errors of the Lorenz curve estimates over the entire support. They also report that the greater the number of income quantiles, the better the fit. The authors judge the performance of their approach to fitting the Lorenz to be satisfactory for bimodal income distributions. However, the best fit of the Lorenz curve by the elliptical curves that they employ was achieved for unimodal distributions. Kakwani (1980a) assesses the goodness-of-fit of Lorenz curve estimates based on the Beta parameterization using the 1974 Australian Household Expenditure Survey. The coefficients of determination from the estimating regressions (not reported in the paper) are close to 0.99, while the estimated values of the Lorenz curve are found to be within two decimal places of the survey-based values.
More recently, Cheong (2002) undertook a comparison of alternative functional forms for parametric estimation of the Lorenz curve. The author assesses the performance of four parameterizations of the Lorenz curve (namely those proposed by Kakwani and Podder (1976), Rasche et al (1980), Kakwani (1980a) and Ortega et al (1991)) in estimating the Gini coefficient from U.S. income data in grouped form (for one hundred income classes). The Pareto Lorenz curve proposed by Rasche et al (1980) was suggested as an alternative to the approach of Kakwani and Podder (1976). The authors point out that the latter approach relies on functional forms which, in principle, always violate the conditions for a valid Lorenz curve. In a response, Kakwani (1980b) defended the parameterization on the grounds that it performed well empirically for a wide range of income distributions. In his study, Cheong (2002) found that Kakwani’s Beta form provides as good a fit to the data as does that of Rache et al.
While many Lorenz curve functional forms have been proposed in the literature12, an exhaustive assessment of their performance is not the object of this study. The main reason for restricting our attention to Villasenor and Arnold (1989) and Kakwani (1980a) is that these two parameterizations are the most extensively used in applied work (and in particular, with a view to estimating national, regional and global poverty) due to their availability through the computational tool POVCAL.
12 See also Gupta (1984), Basmann et al (1990), and Ogwang and Rao (1996).
6
| 3 | MONTE CARLO STUDIES n this section, we describe the results of a Monte Carlo analysis of the interpolation techniques used by POVCAL. We use grouped data drawn from a flexible parametric distribution - the Dagum distibution13 - and from a multimodal distribution
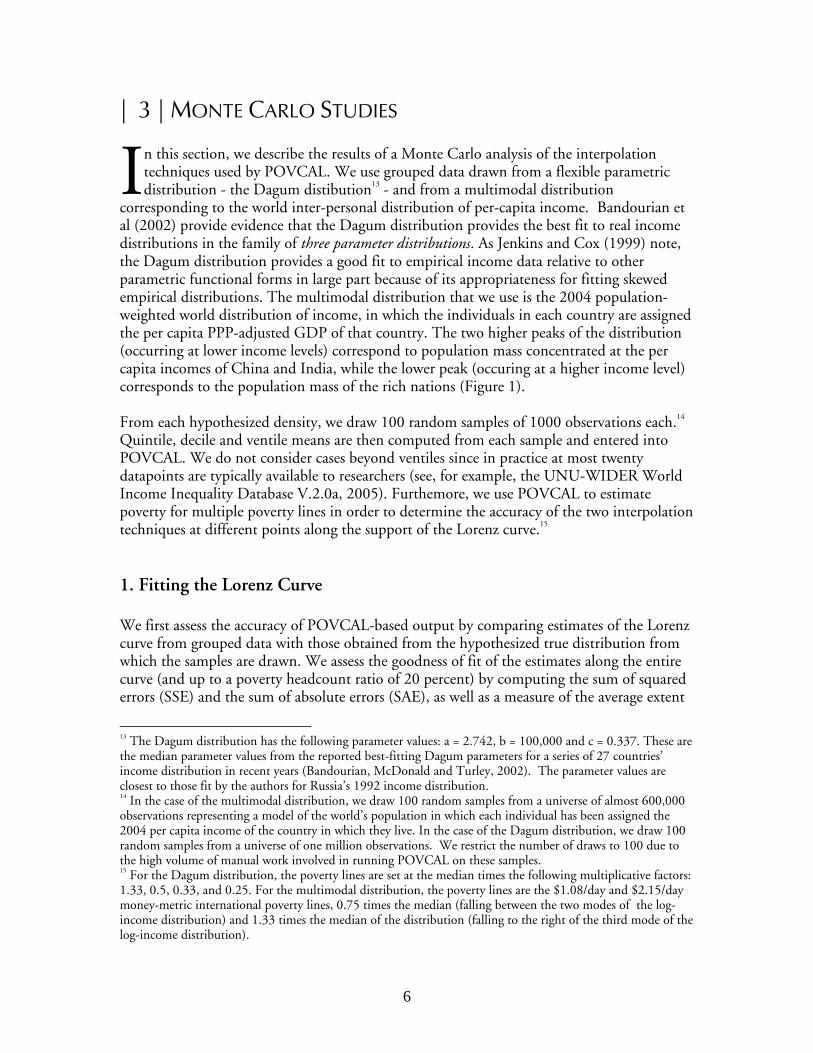
corresponding to the world inter-personal distribution of per-capita income. Bandourian et al (2002) provide evidence that the Dagum distribution provides the best fit to real income distributions in the family of three parameter distributions. As Jenkins and Cox (1999) note, the Dagum distribution provides a good fit to empirical income data relative to other parametric functional forms in large part because of its appropriateness for fitting skewed empirical distributions. The multimodal distribution that we use is the 2004 population-weighted world distribution of income, in which the individuals in each country are assigned the per capita PPP-adjusted GDP of that country. The two higher peaks of the distribution (occurring at lower income levels) correspond to population mass concentrated at the per capita incomes of China and India, while the lower peak (occuring at a higher income level) corresponds to the population mass of the rich nations (Figure 1).
From each hypothesized density, we draw 100 random samples of 1000 observations each.14 Quintile, decile and ventile means are then computed from each sample and entered into POVCAL. We do not consider cases beyond ventiles since in practice at most twenty datapoints are typically available to researchers (see, for example, the UNU-WIDER World Income Inequality Database V.2.0a, 2005). Furthemore, we use POVCAL to estimate poverty for multiple poverty lines in order to determine the accuracy of the two interpolation techniques at different points along the support of the Lorenz curve.15
1. Fitting the Lorenz Curve
We first assess the accuracy of POVCAL-based output by comparing estimates of the Lorenz curve from grouped data with those obtained from the hypothesized true distribution from which the samples are drawn. We assess the goodness of fit of the estimates along the entire curve (and up to a poverty headcount ratio of 20 percent) by computing the sum of squared errors (SSE) and the sum of absolute errors (SAE), as well as a measure of the average extent
13 The Dagum distribution has the following parameter values: a = 2.742, b = 100,000 and c = 0.337. These are the median parameter values from the reported best-fitting Dagum parameters for a series of 27 countries’ income distribution in recent years (Bandourian, McDonald and Turley, 2002). The parameter values are closest to those fit by the authors for Russia’s 1992 income distribution. 14 In the case of the multimodal distribution, we draw 100 random samples from a universe of almost 600,000 observations representing a model of the world’s population in which each individual has been assigned the 2004 per capita income of the country in which they live. In the case of the Dagum distribution, we draw 100 random samples from a universe of one million observations. We restrict the number of draws to 100 due to the high volume of manual work involved in running POVCAL on these samples. 15 For the Dagum distribution, the poverty lines are set at the median times the following multiplicative factors: 1.33, 0.5, 0.33, and 0.25. For the multimodal distribution, the poverty lines are the $1.08/day and $2.15/day money-metric international poverty lines, 0.75 times the median (falling between the two modes of the log-income distribution) and 1.33 times the median of the distribution (falling to the right of the third mode of the log-income distribution).
I
7
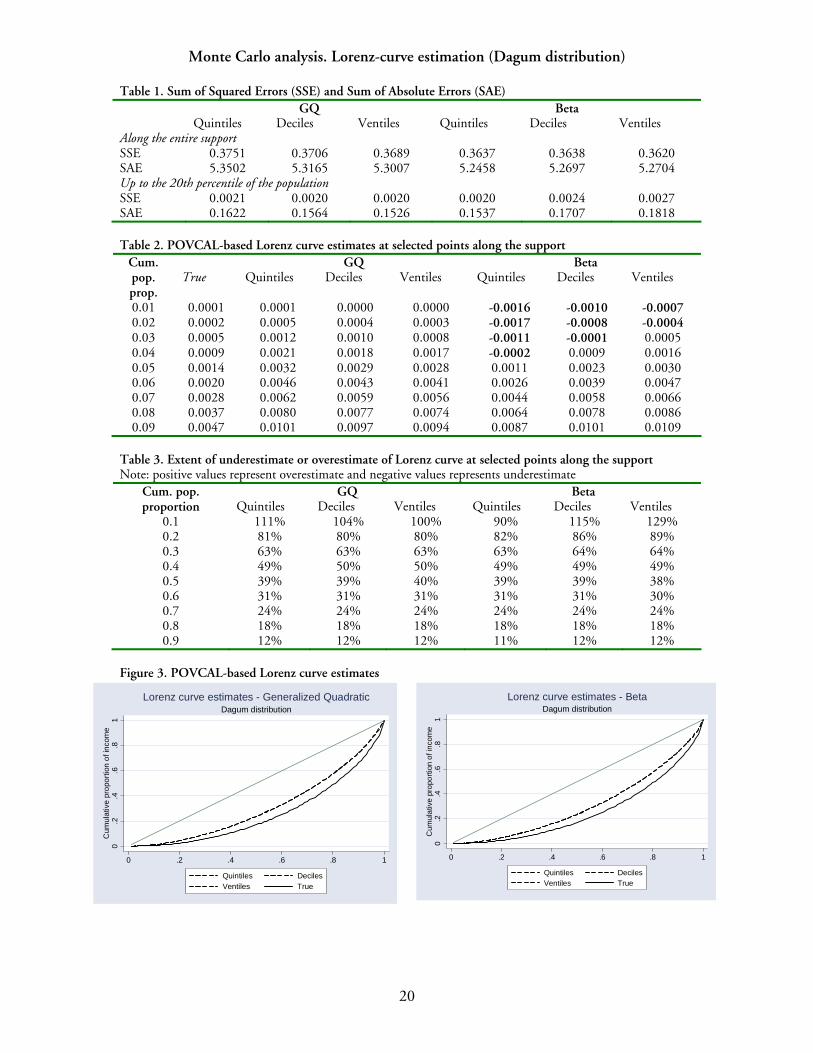
to which POVCAL under- or overestimates the Lorenz curve at different points along the curve (expressed in percentage points). The results are reported in Tables 1-3. Based on the goodness of fit statistics (Table 1), we note that a higher number of quantiles used in the analysis implies a lower SSE and SAE (for the GQ parameterization) but (surprisingly) the reverse is the case for the Beta parameterization. If the SSE and SAE are computed up to a headcount ratio of 20 percent (i.e. for the Lorenz curve truncated after the twenty percent of the population with lowest incomes), the Beta parameterization performs worse than the GQ method, except in the case of quintile data.
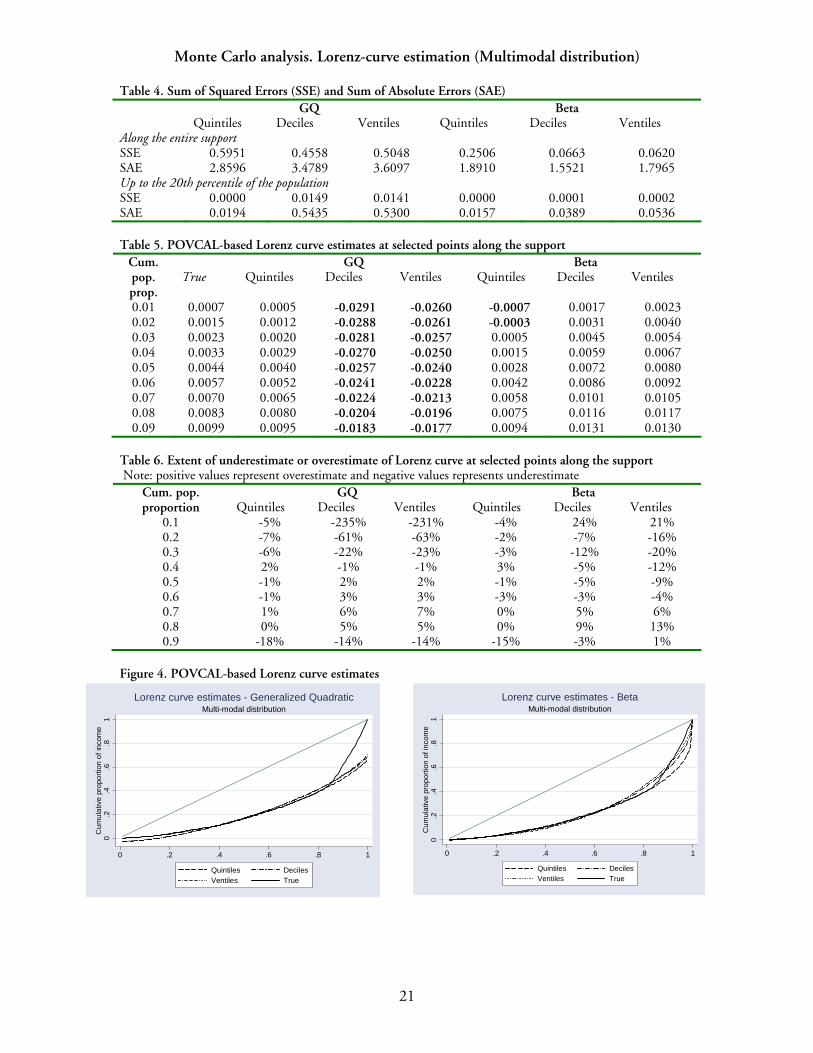
Average Lorenz curve estimates for population proportions up to 10 percent are reported in Table 2. These give a more fine-grained indication of the performance of POVCAL in the left tail of the income distribution. A series of interesting patterns arise: first, the GQ method leads to overestimation of the income share accuring to each population proportion toward the left side of the support. In contrast, the Beta parameterization yields negative average Lorenz curve estimates for the bottom population centiles, which renders the estimated Lorenz curve invalid. The software correctly reports on the invalidity of the Lorenz curve when negative income shares are predicted. To see how the parameterizations perform across the entire support, we report the average Lorenz curves estimates for each cumulative population decile (Table 3). It is apparent that the proportion of cumulative income possessed by a given cumulative proportion of the population is consistently overestimated. As a result, the actual Lorenz curve is dominated by the estimated Lorenz curve, which implies that distortions in the Lorenz curve arise along the entire support (Figure 3). It follows that any Lorenz-consistent measure of inequality would therefore register lower estimated than actual inequality. The magnitude of the biases is very similar regardless of the number of quantile means and the estimation method (GQ or Beta). We repeated the exercise of estimating the Lorenz curve using grouped data from the notional multimodal distribution (Tables 4-6). Using the SAE criterion, the GQ functional form provides a worse fit when more quantile means are used, while with the Beta functional form.the SAE does not vary monotonically with the number of quantile means. Furthermore, both parameterizations give rise to negative estimated income shares for all (or some) population shares (Table 5). Table 6 indicates that both parameterizations lead to some degree of underestimation of the Lorenz curve (as opposed to results from the Dagum distribution). Figure 4 offers a visual representation of these findings by superimposing average Lorenz curve estimates for quintiles, deciles and ventiles, against their true counterparts. Since there is underestimation of cumualtive income shares at some cumulative population shares, and overestimation at other shares, the estimated and actual Lorenz curves cross. It follows that whether the use of the estimated Lorenz curve will lead to a lower or higher value of a Lorenz-consistent inequality index than for the actual Lorenz curve is in principle dependent on the specific features of the index. From this analysis, we conclude the following: (a) For the Dagum distribution, regardless of the number of quantile means used in the analysis, the GQ interpolation method provides a better overall fit of the Lorenz curve than the Beta interpolation method based on the SSE and SAE. For the multimodal distribution, the goodness-of-fit statistics sometimes vary non-monotonically with the number of datapoints and no one interpolation method is consistently superior. (b) For the Dagum distribution, unlike the GQ interpolation method,
8
the Beta interpolation method yields negative Lorenz curve estimates for population proportions below four percent. In contrast, for the multimodal distribution, the GQ interpolation method generate negative income shares up to the bottom 10 percent of the population, while the Beta interpolation method in general yields positive income shares. In both cases, POVCAL correctly reports the instances when the estimated Lorenz curve is invalid. (c) Both parametrizations are associated with an overestimation of income shares that accrue to population proportions along the support in the case of one distribution (Dagum) and often with an underestimation of income shares along the support in the case of the other distribution (multimodal). It is not possible to derive from his exercise any general conclusions concerning which of the approaches used to estimate the Lorenz curve is best. 2. Estimating Poverty and Inequality
In this sub-section, we use data from the Dagum distribution and the notional multimodal distribution to compare POVCAL-based estimates of poverty and inequality with their true counterparts. We report the results for poverty indicators in Table 7 (Dagum distribution) and Table 8 (multimodal distribution) and those for the Gini coefficient in Table 9. In each table, the bias is expressed in (average) percentage points of deviation from the true valeus.
Table 7 shows that for most of the poverty lines considered and for all poverty indicators, the average bias is rarely higher than one percentage point. However, when the data are generated by the the Dagum distribution, the interpolation is performed with the Beta method, and the poverty lines are low, then the bias is occasionally higher than one percentage point. For the Dagum distribution, therefore, the two parameterizations perform exceptionally well in estimating poverty. The GQ parameterization appears to slightly outperform the Beta parameterization. As we found previously, a higher number of datapoints is not associated with increased accuracy of poverty estimates. The magnitude of the biases, however, is quite small throughout.
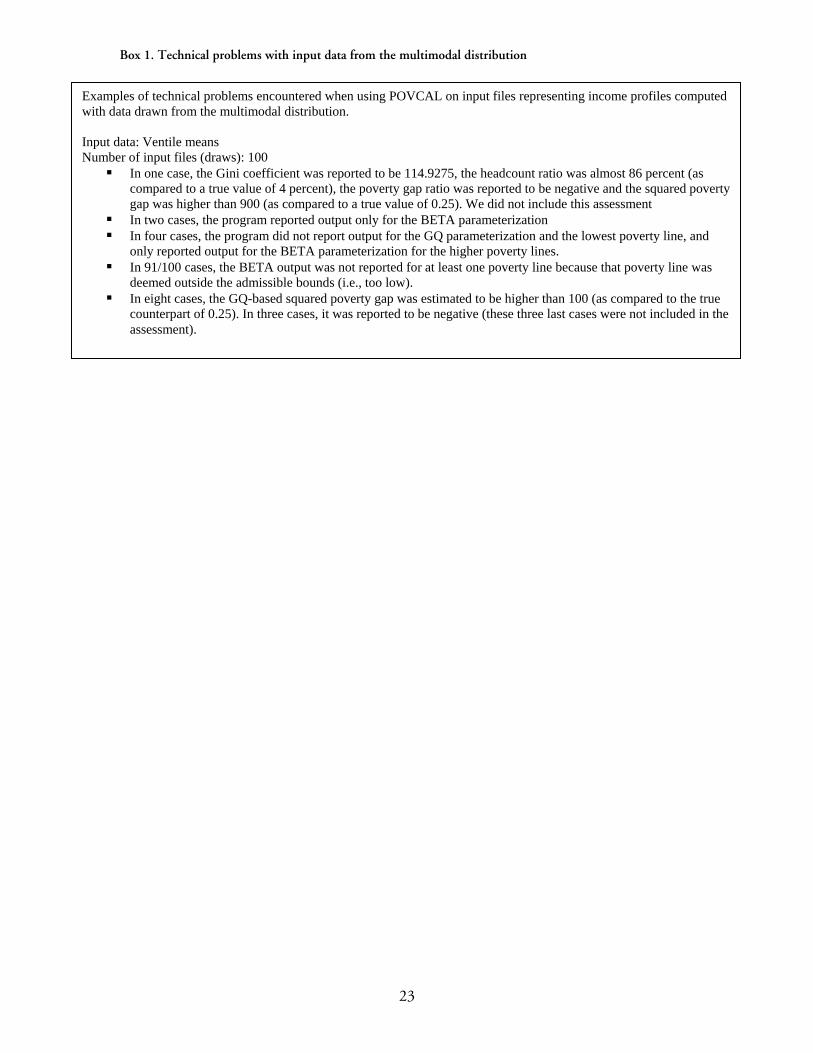
The parameterizations perform less well when data is drawn from the multimodal distribution (Table 8). First, we often cannot report poverty biases for the $2.15/day poverty line due to the frequency with which POVCAL shut down, failed to write to the output files, provided meaningless output (e.g., higher than one poverty headcount ratios) or generated infeasible bounds for the poverty lines. Examples of such technical problems encountered when running POVCAL are described in Box 1. The biases are thus computed across successful program runs. We notice the following patterns: first, the magnitude of the biases is often larger than it was for the Dagum distribution. Frequently, more datapoints are associated with larger biases. Furthemore, the sign of the biases changes from positive (for quintile data) to negative (decile and ventile data) as the number of data points increases and as the poverty line is increased. There are no stark differences in how each of the two parameterizations performs. In contrast, it is clear that the Gini coefficient is more accurately estimated when the Beta parameterization is used, regardless of the distribution to which it is applied (Table 9). Biases are extremely small when data is drawn from the Dagum distribution, but the estimates are off by up to 5 percentage points (Dagum) and 3.7 percentage points (multimodal) when quintile means are used as input data.
9
From these results, it is difficult to identify any regularities in the relationship between the size and sign of biases and the parametrization or the number of datapoints used, other than that the biases are larger when the true distribution is multimodal. As Villasenor and Arnold (1989) note in their assessment of the GQ parameterization (for an elliptical Lorenz curve), the functional form provides a good fit to data from the unimodal family of densities, but less so to data with bimodal histograms.
| 4 | DETERMINISTIC COMPARISONS
n this section we report on the accuracy of POVCAL in replicating features of underlying income distributions using data from actual representative household surveys and from selected theoretical distributions (with parameters chosen according to previous
empirical estimates). We compare POVCAL’s output based on grouped data with the values derived from analysis of unit data. We use surveys for China (1995 Chinese Household Income Project16), Tanzania (2000-01 Tanzanian Household Budget Survey), Nicaragua (1997-98 Nicaraguan Living Standards and Measurement Survey) and Vietnam (1998 Vietnam Living Standards Survey).
To cover a wider range of plausible income distributions, we also use unit data generated from theoretical distributions with parameter values that have been shown to provide a good fit to other countries’ income distributions. For example, the Weibull distribution is the best fitting two parameter distribution for the countries examined (Bandourian et al, 2002). The parameters chosen for the Weibull distribution are those corresponding to United States’ 1997 income distribution. The log-normal distribution has been widely used in income distribution studies (see, for example, the estimation of country income distributions by Babones, 2003). The parameters we use for the Weibull distribution correspond to Russia’s 1995 income distribution (as estimated by Bandourian et al, 2002). The Generalized Beta II distribution is found by the same authors to provide the best fit from within the family of four parameter distributions to empirical income distribution data for a range of countries, and has also been used in other empirical literature on the estimation of income distributions (see e.g. Rao et al, 2004). The parameters we use for the Generalized Beta II distribution are based on the parametric estimation of Mexico’s 1996 income distribution in Bandourian et al (2002).
The Pareto distribution has also been used in empirical studies of income distribution. In particular, it has been argued that it provides good estimates of the right tail of income distributions (see, e.g., Aoyama et al, 2000 for Japan and Clementi and Gallegati, 2005 for Italy). The parameters we use for the Pareto distribution are based on the parametric estimation of Italy’s 2002 income distribution in Bandourian et al (2002). Each ‘hypothetical’ country with unit data drawn from these distributions contains one million (income) observations.
16 The 1995 Chinese Household Income Project, as well as the SAS codes for constructing measures of disposable rural and urban income, are publicly available through the Inter-University Consortium for Political and Social Research, 2000. We pooled the rural and urban surveys to obtain the income variable for the country, which represents per capita household income (with no adjustment for household composition). For a detailed description of this variable, see Appendix 5A in Reddy and Minoiu (2006).
I
10
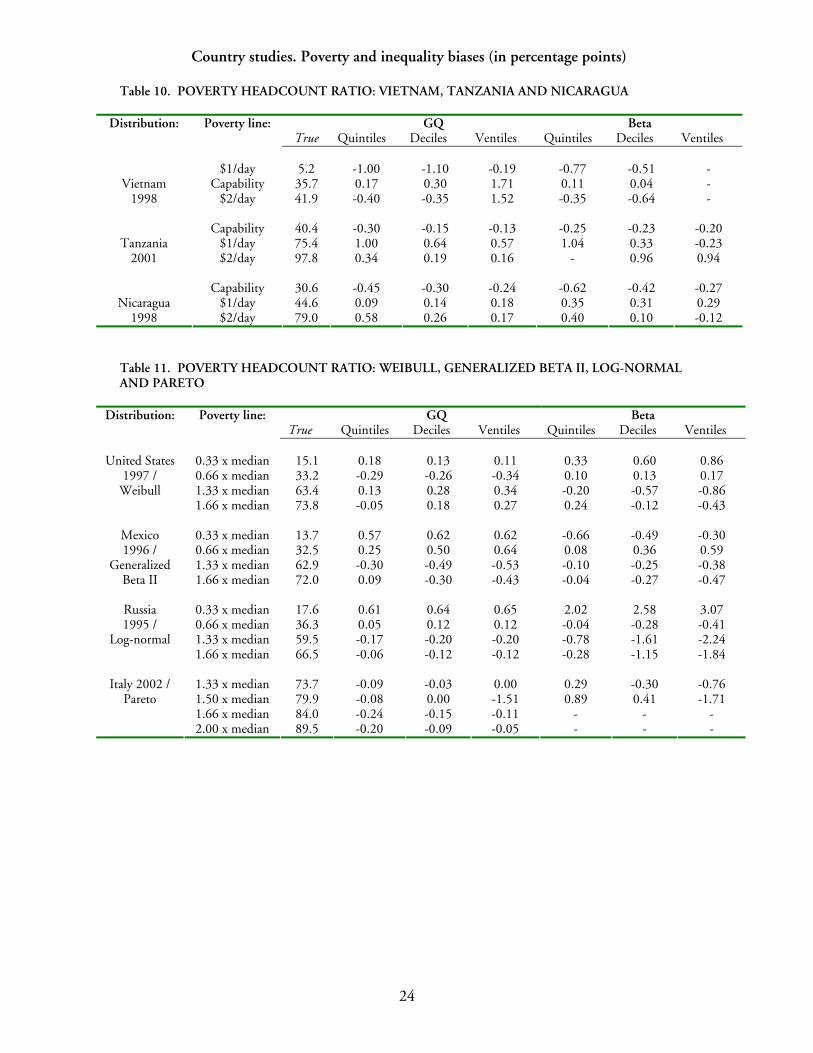
The small-sample biases for selected poverty indicators and inequality are reported in Tables 10-12.17 These results indicate that for many distributions, the biases associated with the poverty indicators are very small: the magnitude of these biases is seldom larger than one percentage point (in either direction).18 Comparison between POVCAL’s output and poverty estimates from the underlying survey data (Table 10) suggests that POVCAL generally performs well in estimating the poverty headcount ratio. For the log-normal distribution, the biases are larger for the Beta parameterization and the lowest poverty line considered (Table 11).
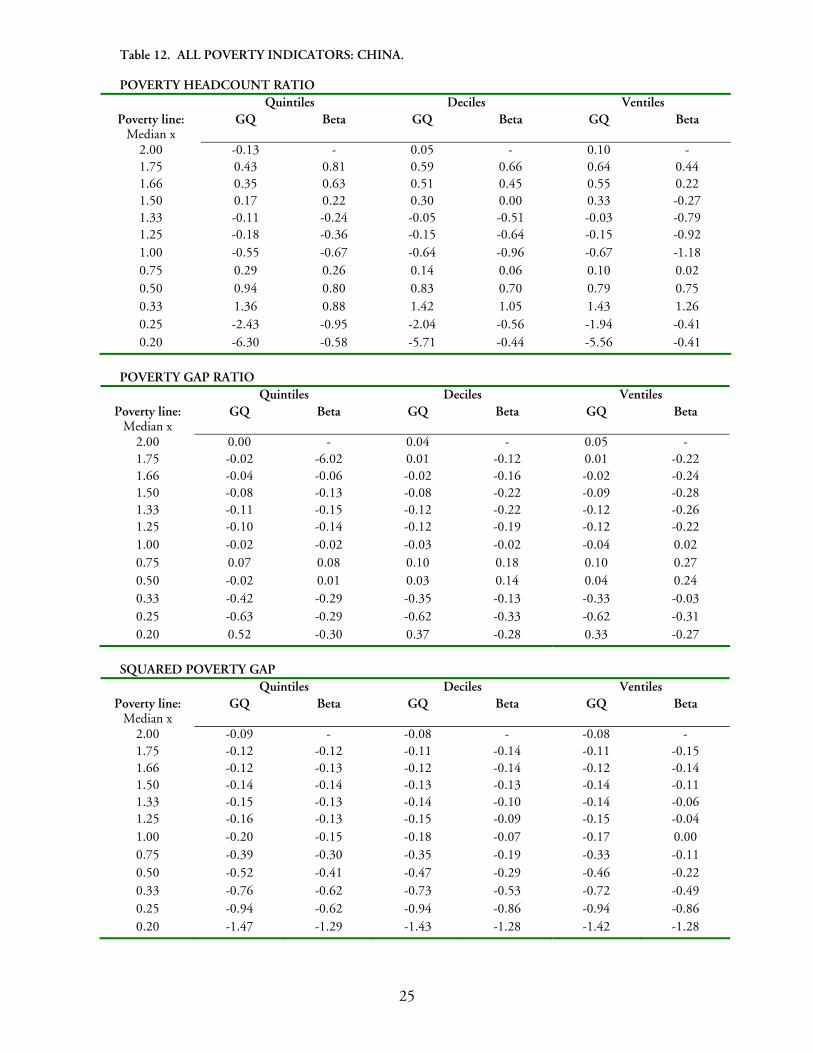
For China (Table 12), we note that the poverty headcount ratio is under-estimated by more than 2 percentage points for poverty lines lower than a quarter of the survey median (using the 1995 income survey from the China Household Income Project). In addition, the squared poverty gap is always underestimated by both parameterizations.
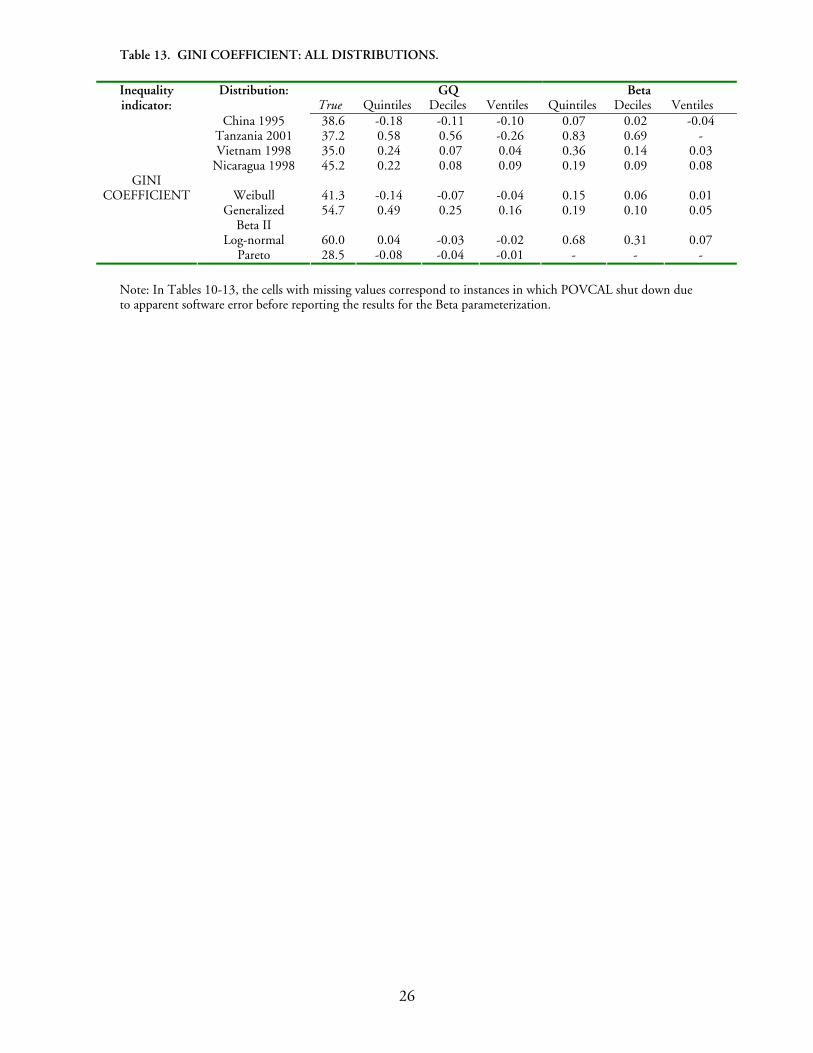
The biases in Gini coefficients are shown in Table 13. The underlying theoretical distributions have Gini coefficients ranging between 28.5 (Pareto) and 60.0 (Log-normal), while the surveys have inequality levels between 35.0 (Vietnam) and 45.2 (Nicaragua). We find that in all cases considered, the Gini coefficients are well estimated by POVCAL. The Beta parameterization consistently over-estimates the Gini index, but by a small margin. Both parameterizations are associated with biases of the inequality measure no larger than one percentage point.
The following conclusions emerge from this section: (a) the size of the biases does not vary monotonically with the poverty line or the number of datapoints analyzed; (b) it is difficult to find regularities in the direction of the biases; (c) neither functional form can be concluded to provide a superior fit over the other across a wide range of distributions; (d) the biases vary across the distributions considered; however, they are generally low for the country studies reported in this section; (e) in general, the Gini coefficient is well estimated.
17 We only employ four poverty lines for data corresponding to the ‘hypothetical’ countries, but a much wider range of poverty lines for China in order to inspect the biases associated with poverty lines situated at multiple points along the support of the income density. For Vietnam, Tanzania and Nicaragua we use the international poverty lines ($1.08/day, $2.15/day) and the nutritionally-anchored poverty lines proposed by Reddy, Visaria and Asali (2006). 18 For the four ‘synthetic’ income distributions analyzed in Table 10, we do not report biases for the poverty headcount ratio and the squared poverty gap because the conclusions are broadly similar.
11
| 5 | DISCUSSION AND CONCLUSIONS
n this paper we have analyzed the sign and magnitude of the biases in estimates of poverty and inequality and of the Lorenz curve that result from parametric estimation of the Lorenz curve from grouped data. In particular, we have examined the accuracy of
estimates produced using two functional forms (proposed by Villasenor and Arnold, 1989 and Kakwani, 1980a) by POVCAL, a computational tool developed by the World Bank that is in widespread use by applied researchers. We have used data drawn from a large number of theoretical distributions as well as unit data from household surveys to compare POVCAL’s estimates of poverty and inequality and the Lorenz curve with values from underlying distributions. We found that the two parameterizations perform relatively well in estimating poverty and inequality for distributions that are unimodal. Larger biases were identified, however, in the case of the multimodal distribution considered. The extent of misestimation of poverty does not vary predictably with , the level of poverty line, the choice of poverty indicator or even the number of datapoints. Inequality (measured by the Gini index) is well estimated.19 In our Monte Carlo study, the two parameterizations often yielded invalid Lorenz curves (e.g. negative estimated income shares). The software accurately recognized and reported these instances. An important question is whether or not the (poverty and inequality) output associated with an invalid Lorenz curve should be discarded by the researcher. We did not discover a straightforward correspondence between the validity of the estimated Lorenz curve and the accuracy of the reported estimates of poverty and inequality. In fact, despite the negative income shares often reported at the left end of the Lorenz support, poverty and inequality were still estimated with tolerable error; admittedly, the errors tend to be larger for smaller poverty lines. A similar finding was that of Kakwani (1980b) which defended the Kakwani and Podder (1976) parameterization that had been shown to give rise to theoretically invalid Lorenz curve. Kakwani (1980b) argued in favor of using invalid Lorenz curve estimates on the grounds of the parameterization’s overall superior empirical performance in fitting a wide of observed income distributions.
Parametric estimation using POVCAL appears to provide a good fit to the Lorenz curve for a wide range of income distributions. Several non-parametric and semi-parametric density estimation techniques (e.g., nonparametric kernel density smoothing and maximum entropy density estimation) have also been recently employed on grouped income-distribution data. Minoiu and Reddy (2006) asssess the accuracy of kernel density estimation in estimating poverty and inequality and compare output from that procedure with POVCAL-based estimates. They conclude that parametric estimation of Lorenz curves using POVCAL often outperforms kernel density estimation methods in the estimation of poverty and inequality. Wu and Perloff (2003) evaluate the goodness-of-fit of the maximum entropy density estimator using information on income intervals computed from underlying survey data on U.S. family income and flexible functional form assumptions. The authors find that maximum entropy density estimation performs well in estimating features of income
19 We encountered a series of technical problems with the software for input files from the multimodal and Pareto distributions (and in isolated cases, with input data from other distributions).
I
12
distributions. More research is necessary to determine whether their proposed maximum entropy method is superior to parametric Lorenz-curve fitting based on least-squares minimization (examined here).
Our results offer qualified support for the use of Lorenz curves based on parametric curve fitting, as implemented by existing software (POVCAL), when conducting applied research on poverty and income distribution.
13
REFERENCES Acharya, S. (2004) “Measuring and Analyzing Poverty (with particular reference to the case of Nepal)”, European Journal of Comparative Economics, Vol. 1(2), pp. 195-215. Ackland, R., Dowrick, S. and Freyens, B. (2004) “Measuring Global Poverty: Why PPP Methods Matter”, Paper presented at the Conference of the International Association for Research in Income and Wealth (August 26), Cork, Ireland. Ali, A.A.G. and Elbadawi, I. (2002) “Explaining Sudan’s Economic Performance”, Country Study, Arab Planning Institute and the World Bank, Washington DC. Anand, S. (1983) Inequality and Poverty in Malaysia. Measurement and Decomposition, Volume 1, International Bank for Reconstruction and Development / World Bank, Oxford University Press, Washington, DC. Anand, S. and Kanbur, S.M.R. (1993a) “Inequality and Development: A Critique”, Journal of Development Economics, Vol. 41, pp. 19-43. Anand, S. and Kanbur, S.M.R. (1993b) “The Kuznets Process and the Inequality-Development Relationship”, Journal of Development Economics, Vol. 40, pp. 25-52. Aoyama, H., Nagahara, Y., Mitsushiro, P.O., Wataru, S., Hideki, T. And T. Misako (2000) “Pareto’s Law for Income of Individuals and Debt of Bankrupt Companies”, Fractals, Vol. 8(3), pp. 293-300. Asra, A. (2000) “Poverty and Inequality in Indonesia”, Journal of the Asia Pacific Economy, Vol. 5, pp. 91-111. Babones, S.J. (2003) “One world or two? A snapshot of the global income distribution”, paper presented at the American Sociological Association 98th Annual Meeting (August 16-19), Atlanta, GA. Basmann, R.L., Hayes, K.J., Slottje, D.J., and J.D. Johnson (1990) “A General Functional Form for Approximating the Lorenz Curve”, Journal of Econometrics, Vol. 43, pp. 77-90. Bandourian, R., McDonald, J.B. and Turley, R.S. (2002) “A comparison of parametric models of income distributions across countries and over time”, Luxembourg Income Study Working Paper No. 305. Banerjee, A.V. and Duflo, E. (2003) “Inequality and growth: what can the data say?, Journal of Economic Growth, Vol. 8, pp. 267-299. Belkacem, L. (2001) “Poverty Dynamics in Algeria”, Arab Planning Institute. Paper presented at the Workshop on the Analysis of Poverty and its Determinants in the MENA Region (July 31- August 1), Sanaa, Yemen.
14
Belkacem, L. and Limam, I. (2004) “Impact of Public Policies on Poverty, Income Distribution and Growth”, Arab Planning Institute, Working Paper No. 0401. Bhalla, S. (2002) Imagine There’s No Country: Poverty, Inequality, and Growth in the Era of Globalization, Institute for International Economics, Washington DC. Bourguignon. F. and C. Morrisson (2002) “Inequality among World Citizens: 1820-1992”, American Economic Review, Vol. 92 No. 4. Chen, S., Datt, G. and Ravallion, M. (2001) POVCAL, A program for calculating poverty measures for grouped data, Poverty and Human Resource Division, World Bank http://www.worldbank.org/research/povmonitor/software.htm Chen, S. and Ravallion, M. (2001) “How Did the World’s Poorest Fare in the 1990s?”, Review of Income and Wealth, Vol. 47(3), pp. 283-300. Chen, S. and Ravallion, M. (2004) “How Have the World’s Poorest Fared Since the Early 1980s?”, World Bank Development Research Group, Working Paper #3341 and World Bank Research Observer, Vol. 19(2), pp. 141-169. Chen, S. and Ravallion, M. (2005) “China’s (Uneven) Progress against Poverty”, forthcoming, Journal of Development Economics. Chen, S. and Wang, Y., (2001) “China’s growth and poverty reduction: recent trends between 1990 and 1999”, World Bank Policy Research Working Paper No. 2651. Cheong, K.S. (2002) “A Comparison of Alternative Functional Forms for Parametric Estimation of the Lorenz Curve”, Applied Economics Letters, Vol. 9, Issue 3, pp. 171-176. Clementi, F. and Gallegati, M. (2005) “Power law tails in the Italian personal income distribution”, paper presented at the International Conference in Memory of Two Eminent Social Scientists: C. Gini and M.O. Lorenz. Their Impact in the XXth Century Development of Probability, Statistics and Economics. (May 23-26), Siena, Italy. Datt, G. (1998) “Computational Tools for Poverty Measurement and Analysis”, International Food Policy Research Institute, Food Consumption and Nutrition Division Discussion Paper No. 50. Deaton, A. (2005), “Measuring Poverty in a Growing World (or Measuring Growth in a Poor World)”, Review of Economics and Statistics, Vol. 87(1), pp. 1-19. Deininger, K. and Squire, L. (1998) “New Ways of Looking at Old Issues: Inequality and Growth”, Journal of Development Economics, Vol. 57(2), pp. 259-287. Deininger, K. and Squire, L. (1996) “A new data set measuring income inequality”, World Bank Economic Review, Vol. 10(3), pp. 565-591. Dhongde, S. (2005) “Spatial Decomposition of Poverty in India”, in Kanbur, R., Venables,
15
A., Wan, G. (eds.), Spatial Disparities in Human Development: Perspectives from Asia, United Nations University Press, 2005. Dhongde, S. (2004) “On the Bias of Estimating Lorenz Curve Parameters”, mimeo, Department of Economics, University of California, Riverside. Easterly, W. (1999) “Life during growth”, Journal of Economic Growth, Vol. 4(3), pp. 239-276 Eele, G., Semboja, J., Likwelile, S., and Ackroyd, S. (2000) “Meeting International Poverty Targets in Tanzania”, Development Policy Review, Vol. 18(1), pp. 63-83. Figini, P. and Santarelli, E. (2006) “Openness, Economic Reforms, and Poverty: Globalization in the Developing Countries”, Journal of Developing Areas, Vol. 39(2), pp. 129-151. Forbes, K.J. (2000) “A reassessment of the relationship between inequality and growth”, American Economic Review, Vol. 90(4), pp. 869-887. Fuentes, R. (2005) “Poverty, Pro-Poor Growth and Simulated Inequality Reduction”, Human Development Report Office Occasional Paper No. 11. Gupta, M.R. (1984) “Functional Form for Estimating the Lorenz Curve”, Econometrica, Vol. 52, Issue 5, pp. 1313-1314. Jenkins, S.P and Cox, N.J. (1999) “DAGUMFIT: Stata module to fit a Dagum distribution to unit record data”, Boston College Department of Economics, Statistical Software Components paper no. S366101. Joekes, S., Ahmed, N., Ercelawn, A. and Zaidi, S. A. (2000) “Poverty Reduction without Human Development in Pakistan: Money Doesn't Buy You Everything”, Development Policy Review, Vol. 18(1), pp. 37-62. Kakwani, N. C. (1980a) “On A Class of Poverty Measures”, Econometrica, Vol. 48, Issue 2, pp 437-446. Kakwani, N. C. (1980b) “Functional Forms for Estimating the Lorenz Curve: A Reply”, Econometrica, Vol. 48, Issue 4, pp 1063-1064. Kakwani, N. C. and Podder, N. (1976) “Efficient Estimation of the Lorenz Curve and Associated Inequality Measures from Grouped Observations”, Econometrica, Vol. 44(1), pp 137-148. Kakwani, N. C. and Podder, N. (1973) “On the Estimation of Lorenz Curves from Grouped Observations”, International Economic Review, Vol. 14, pp. 278-292. Karshenas, M. (2004) “Global Poverty Estimates and the Millennium Goals: Towards a Unified Framework”, International Labor Office Employment Strategy Paper No. 2004/5.
16
Lundberg, M. and Squire, L. (2003) “The simultaneous evolution of growth and inequality”, The Economic Journal, Vol. 113(4), pp. 326-344. Milanovic, B. (2005) Worlds Apart: Measuring International and Global Inequality, Princeton University Press. Milanovic, B. (2002) “True World Income Distribution, 1988 and 1993: First Calculation Based on Household Surveys Alone”, Economic Journal, Vol. 112, pp 51-92. Minoiu, C. and Reddy, S. (2006) “Kernel Density Estimation in Poverty and Inequality Analysis: Validity and Robustness”, mimeo, Department of Economics, Columbia University. Ogwang, T. and U.L.G. Rao (1996) “A New Functional Form for Approximating the Lorenz Curve”, Economics Letters, Vol. 52, pp. 21-29. Ortega, P., Martin, G., Fernandez, A., Ladoux, M. and A. Garcia (1991) “A New Functional Form for Estimating Lorenz Curves”, Review of Income and Wealth, Vol. 37, pp. 447-452. Pakes, A.G. (1981) “On Income Distributions and their Lorenz Curves”, Technical report, Department of Mathematics, University of Western Australia, Nedlands, W.A. Pogge, T. and Reddy, S. (2006) “Unknown: Extent, Distribution and Trend of Global Income Poverty”, Economic and Political Weekly, June 3. Pritchett, L. (2006) “Who Is Not Poor? Dreaming of a World Truly Free of Poverty”, The World Bank Research Observer, Vol. 21(1), pp. 1-23. Rao, D.S. Prasada, Chotikapanich, D. and Griffiths, W.E. (2004) “Estimating and Combining National Income Distributions using Limited Data”, The University of Melbourne, Department of Economics Working Paper No. 926. Rasche, R.H., Gaffney, J., Koo, A.Y.C. and N. Obst (1980) “Functional Forms for Estimating the Lorenz Curve”, Econometrica, Vol. 48, Issue 4, pp. 1061-1062. Ravallion, M. and Huppi, M. (1989) “Poverty and Under-nutrition in Indonesia during the 1980s”, Policy, Planning and Research Working Paper No. 286, Agriculture and Rural Development Department, the World Bank. Reddy, S. and Minoiu, C. (2006) “Chinese Poverty: Assessing the Impact of Alternative Assumptions”, Columbia University Institute for Social and Economic Research and Policy Working Paper No. 06-04 and United Nations Development Program, International Poverty Centre Working Paper No. 25. Reddy, S. and Pogge, T. (2006) "How Not To Count the Poor", forthcoming in Anand, S., P. Segal and J. Stiglitz, eds.: Measuring Global Poverty, Oxford University Press. Available at www.socialanalysis.org
17
Reddy, S., Visaria, S. and M. Assali (2006) “Inter-Country Comparisons of Poverty Based on a Capability Approach: An Empirical Exercise”, United Nations Development Programme International Poverty Center Working Paper No. 27. Sala-i-Martin, X. (2002a) “The world distribution of income (estimated from individual country distributions)”, National Bureau of Economic Research Working Paper No. 8933. Sala-i-Martin, X. (2002b) “The ‘disturbing’ rise of world income inequality”, National Bureau of Economic Research Working Paper No. 8904. Sala-i-Martin, X. (2006) “The World Distribution of Income: Falling Poverty and Convergence, Period”, Quarterly Journal of Economics, Vol. 121(2), pp. 351-397. Son, H.H. and Kakwani, N. (2006) “Global Estimates of Pro-Poor Growth”, United Nations Development Programme International Poverty Center Working Paper No. 31. Villasenor, J.A. and Arnold, B.C. (1989) “Elliptical Lorenz Curves”, Journal of Econometrics, Vol. 40, pp. 327-338. USAID (2004) “Review of Poverty Assessment Tools”, Accelerated Microenterprise Advancement Project, United States Agency for International Development. Paper submitted to IRIS and USAID as part of the Developing Poverty Assessment Tools Project. Available on: http://www.povertytools.org/Project_Documents/Review%20of%20Poverty%20Assessment%20Tools.pdf UNU-WIDER (2005) World Income Inequality Database V. 2.0a, June 2005. Available on: http://www.wider.unu.edu/wiid/wiid.htm Woo, W.T., Shi, Li., Ximing, Y., Xiaoying, H.W., Xingpeng, X. (2004) “The Poverty Challenge for China in the New Millennium”, Report to the Poverty Reduction Taskforce of the Millennium Development Goals of the United Nations. World Bank (2003) “A User’s Guide to Poverty and Social Impact Analysis”, Poverty Reduction Group (PRMPR) and Social Development Department (SDV), Washington, D.C. Available on: http://poverty2.forumone.com/files/12685_PSIA_Users_Guide_-_Complete_-_High_resolution_-_English_-_May_2003.pdf Wu, X. and Perloff, J. (2003) “Calculation of Maximum Entropy Densities with Application to Income Distributions”, Journal of Econometrics, Vol. 115, pp. 347-354.

18
APPENDIX Figure 1. Distributions used in Monte Carlo analysis (Section III).
Dagum distribution Multimodal (notional) distribution
01.
0e-0
62.
0e-0
63.
0e-0
64.
0e-0
6D
ensi
ty
0 200000 400000 600000 800000income
Mean: 289488.1 St Dev 639427.3[right tail clipped at 95th percentile]
Dagum
0
5.0e
-05
1.0e
-04
1.5e
-04
2.0e
-04
2.5e
-04
Den
sity
0 10000 20000 30000 40000per capita GDP
Mean: $8295 St Dev 9571 Min $515.6 Max $64298
Multi-modal
Figure 2. Distributions used for deterministic comparisons (Section IV).
China (1995) Nicaragua (1998)
01.
0e-0
42.
0e-0
43.
0e-0
4D
ensi
ty
0 2000 4000 6000 8000 10000Per capita income
right tail clipped at 95th percentile
China
05.
0e-0
51.
0e-0
41.
5e-0
42.
0e-0
4D
ensi
ty
0.00 5000.00 10000.00 15000.00 20000.00Per capita consumption
right tail clipped at 95th percentilePoverty lines in ascending order: capability-$1/day-$2/day
Nicaragua

19
Tanzania (2001) Vietnam (1998)
02.
0e-0
64.
0e-0
66.
0e-0
68.
0e-0
61.
0e-0
5D
ensi
ty
0 100000 200000 300000Per capita consumption
right tail clipped at 95th percentilePoverty lines in ascending order: capability-$1/day-$2/day
Tanzania
01.
0e-0
42.
0e-0
43.
0e-0
44.
0e-0
45.
0e-0
4D
ensi
ty
0 2000 4000 6000 8000Per capita consumption
right tail clipped at 95th percentilePoverty lines in ascending order: $1/day-capability-$2/day
Vietnam
Log-normal distribution
05.
0e-0
61.
0e-0
51.
5e-0
52.
0e-0
5D
ensi
ty
0 50000 100000 150000 200000income
Mean: 72253.87 St Dev 127140.1[right tail clipped at 90th percentile]
Parameters from fitted 1995 Russian income distributionLog-normal
Weibull distribution
05.
0e-0
61.
0e-0
51.
5e-0
5D
ensi
ty
0 100000 200000 300000 400000income
Mean: 46443.74 St Dev 36026.49
Parameters from fitted 1997 U.S. income distributionWeibull
Pareto distribution
0.2
.4.6
.8D
ensi
ty
3 4 5 6 7 8income
Mean: 4.87 St Dev 5.38[right tail clipped at 90th percentile]
Parameters from fitted 2002 Italian income distributionPareto
Generalized Beta II
01.
0e-0
52.
0e-0
53.
0e-0
54.
0e-0
5D
ensi
ty
0 20000 40000 60000income
Mean: 30054.52 St Dev 91279.17[right tail clipped at 90th percentile]
Parameters from fitted 1996 Mexican income distributionGeneralized Beta II
20
Monte Carlo analysis. Lorenz-curve estimation (Dagum distribution)
Table 1. Sum of Squared Errors (SSE) and Sum of Absolute Errors (SAE) GQ Beta
Quintiles Deciles Ventiles Quintiles Deciles Ventiles Along the entire support SSE 0.3751 0.3706 0.3689 0.3637 0.3638 0.3620 SAE 5.3502 5.3165 5.3007 5.2458 5.2697 5.2704 Up to the 20th percentile of the population SSE 0.0021 0.0020 0.0020 0.0020 0.0024 0.0027 SAE 0.1622 0.1564 0.1526 0.1537 0.1707 0.1818 Table 2. POVCAL-based Lorenz curve estimates at selected points along the support
GQ Beta Cum. pop. prop.
True Quintiles Deciles Ventiles Quintiles Deciles Ventiles
0.01 0.0001 0.0001 0.0000 0.0000 -0.0016 -0.0010 -0.0007 0.02 0.0002 0.0005 0.0004 0.0003 -0.0017 -0.0008 -0.0004 0.03 0.0005 0.0012 0.0010 0.0008 -0.0011 -0.0001 0.0005 0.04 0.0009 0.0021 0.0018 0.0017 -0.0002 0.0009 0.0016 0.05 0.0014 0.0032 0.0029 0.0028 0.0011 0.0023 0.0030 0.06 0.0020 0.0046 0.0043 0.0041 0.0026 0.0039 0.0047 0.07 0.0028 0.0062 0.0059 0.0056 0.0044 0.0058 0.0066 0.08 0.0037 0.0080 0.0077 0.0074 0.0064 0.0078 0.0086 0.09 0.0047 0.0101 0.0097 0.0094 0.0087 0.0101 0.0109
Table 3. Extent of underestimate or overestimate of Lorenz curve at selected points along the support Note: positive values represent overestimate and negative values represents underestimate
GQ Beta Cum. pop. proportion Quintiles Deciles Ventiles Quintiles Deciles Ventiles
0.1 111% 104% 100% 90% 115% 129% 0.2 81% 80% 80% 82% 86% 89% 0.3 63% 63% 63% 63% 64% 64% 0.4 49% 50% 50% 49% 49% 49% 0.5 39% 39% 40% 39% 39% 38% 0.6 31% 31% 31% 31% 31% 30% 0.7 24% 24% 24% 24% 24% 24% 0.8 18% 18% 18% 18% 18% 18% 0.9 12% 12% 12% 11% 12% 12%
Figure 3. POVCAL-based Lorenz curve estimates
0.2
.4.6
.81
Cum
ulat
ive
prop
ortio
n of
inco
me
0 .2 .4 .6 .8 1
Quintiles DecilesVentiles True
Dagum distributionLorenz curve estimates - Generalized Quadratic
0.2
.4.6
.81
Cum
ulat
ive
prop
ortio
n of
inco
me
0 .2 .4 .6 .8 1
Quintiles DecilesVentiles True
Dagum distributionLorenz curve estimates - Beta
21
Monte Carlo analysis. Lorenz-curve estimation (Multimodal distribution) Table 4. Sum of Squared Errors (SSE) and Sum of Absolute Errors (SAE)
GQ Beta Quintiles Deciles Ventiles Quintiles Deciles Ventiles Along the entire support SSE 0.5951 0.4558 0.5048 0.2506 0.0663 0.0620 SAE 2.8596 3.4789 3.6097 1.8910 1.5521 1.7965 Up to the 20th percentile of the population SSE 0.0000 0.0149 0.0141 0.0000 0.0001 0.0002 SAE 0.0194 0.5435 0.5300 0.0157 0.0389 0.0536 Table 5. POVCAL-based Lorenz curve estimates at selected points along the support
GQ Beta Cum. pop. prop.
True Quintiles Deciles Ventiles Quintiles Deciles Ventiles
0.01 0.0007 0.0005 -0.0291 -0.0260 -0.0007 0.0017 0.0023 0.02 0.0015 0.0012 -0.0288 -0.0261 -0.0003 0.0031 0.0040 0.03 0.0023 0.0020 -0.0281 -0.0257 0.0005 0.0045 0.0054 0.04 0.0033 0.0029 -0.0270 -0.0250 0.0015 0.0059 0.0067 0.05 0.0044 0.0040 -0.0257 -0.0240 0.0028 0.0072 0.0080 0.06 0.0057 0.0052 -0.0241 -0.0228 0.0042 0.0086 0.0092 0.07 0.0070 0.0065 -0.0224 -0.0213 0.0058 0.0101 0.0105 0.08 0.0083 0.0080 -0.0204 -0.0196 0.0075 0.0116 0.0117 0.09 0.0099 0.0095 -0.0183 -0.0177 0.0094 0.0131 0.0130
Table 6. Extent of underestimate or overestimate of Lorenz curve at selected points along the support Note: positive values represent overestimate and negative values represents underestimate
GQ Beta Cum. pop. proportion Quintiles Deciles Ventiles Quintiles Deciles Ventiles
0.1 -5% -235% -231% -4% 24% 21% 0.2 -7% -61% -63% -2% -7% -16% 0.3 -6% -22% -23% -3% -12% -20% 0.4 2% -1% -1% 3% -5% -12% 0.5 -1% 2% 2% -1% -5% -9% 0.6 -1% 3% 3% -3% -3% -4% 0.7 1% 6% 7% 0% 5% 6% 0.8 0% 5% 5% 0% 9% 13% 0.9 -18% -14% -14% -15% -3% 1%
Figure 4. POVCAL-based Lorenz curve estimates
0.2
.4.6
.81
Cum
ulat
ive
prop
ortio
n of
inco
me
0 .2 .4 .6 .8 1
Quintiles DecilesVentiles True
Multi-modal distributionLorenz curve estimates - Generalized Quadratic
0.2
.4.6
.81
Cum
ulat
ive
prop
ortio
n of
inco
me
0 .2 .4 .6 .8 1
Quintiles DecilesVentiles True
Multi-modal distributionLorenz curve estimates - Beta

22
Monte Carlo analysis. Poverty and inequality biases (in percentage points)
Table 7. ALL POVERTY INDICATORS: DAGUM DISTRIBUTION
Generalized Quadratic Beta Poverty indicator
Poverty line: True Quintiles Deciles Ventiles Quintiles Deciles Ventiles
1.33 x median 66.9 0.18 0.34 0.53 -0.04 -0.21 -0.21 0.5 x median 21.7 -0.49 -0.67 -0.76 -0.83 -0.48 -0.21
0.33 x median 13.0 -0.10 -0.25 -0.27 -1.07 -1.07 -0.98
POVERTY HEADCOUNT
RATIO 0.25 x median 9.1 0.01 0.03 0.05 -1.07 -1.13 -1.18 1.33 x median 31.7 0.09 0.05 0.10 0.08 0.09 0.19 0.5 x median 9.6 0.03 0.06 0.45 -0.03 -0.28 -0.30
0.33 x median 5.8 0.27 0.36 0.62 0.52 0.00 -0.22
POVERTY GAP RATIO
0.25 x median 4.0 0.35 0.51 0.67 1.03 0.41 0.04 1.33 x median 19.9 0.07 0.04 0.07 0.19 0.07 0.09 0.5 x median 5.9 0.23 0.35 0.48 1.07 0.37 0.01
0.33 x median 3.5 0.39 0.55 0.68 2.20 1.16 0.54
SQUARED POVERTY
GAP 0.25 x median 2.4 0.47 0.68 0.84 3.36 1.80 1.02
Table 8. ALL POVERTY INDICATORS: MULTIMODAL DISTRIBUTION.20
Generalized Quadratic Beta Poverty indicator
Poverty line: True Quintiles Deciles Ventiles Quintiles Deciles Ventiles
1.33 x median 71.3 1.95 -1.72 -1.79 0.38 -7.04 -9.74 0.75 x median 43.5 -2.55 -6.90 -7.83 -0.43 -1.05 -1.38
$2.15/day 4.2 0.26 - - -0.60 - -
POVERTY HEADCOUN
T RATIO $1.08/day 0.0 - - - - - -
1.33 x median 34.90 0.34 -1.20 -1.40 0.65 -0.51 -0.44 0.75 x median 18.17 -0.92 0.26 0.32 -1.00 0.81 2.30
$2.15/day 0.97 0.38 - - 1.65 - -
POVERTY GAP RATIO
$1.08/day 0.0 - - - - - -1.33 x median 21.33 0.41 1.47 1.15 0.61 1.00 1.97 0.75 x median 9.80 0.16 4.78 4.07 0.00 0.85 2.33
$2.15/day 0.25 0.35 - - 3.78 - -
SQUARED POVERTY
GAP $1.08/day 0.0 - - - - - -
Table 9. GINI COEFFICIENT: DAGUM AND MULTIMODAL DISTRIBUTIONS.
Generalized Quadratic Beta Inequality indicator:
Distribution: True Quintiles Deciles Ventiles Quintiles Deciles Ventiles
Dagum 38.17 -0.22 -0.15 -0.12 0.03 -0.04 -0.04 GINI COEFFICIENT Multimodal 52.43 5.10 3.59 4.53 3.73 0.64 -0.12
20 Interestingly, the international $1.08/day poverty line (at 1993 international US$) produces zero poverty estimates since the lowest per capita GDP in 2004 was $515 (Sierra Leone) while the yearly equivalent of the $1.08/day poverty line is $448. This latter finding suggests that, if we take the estimates of per-capita real incomes and the lower money-metric international poverty line as given, the vast majority of world poverty must be inferred to arise from uneven intra-national income distributions.
23
Box 1. Technical problems with input data from the multimodal distribution
Examples of technical problems encountered when using POVCAL on input files representing income profiles computed with data drawn from the multimodal distribution. Input data: Ventile means Number of input files (draws): 100
In one case, the Gini coefficient was reported to be 114.9275, the headcount ratio was almost 86 percent (as compared to a true value of 4 percent), the poverty gap ratio was reported to be negative and the squared poverty gap was higher than 900 (as compared to a true value of 0.25). We did not include this assessment
In two cases, the program reported output only for the BETA parameterization In four cases, the program did not report output for the GQ parameterization and the lowest poverty line, and
only reported output for the BETA parameterization for the higher poverty lines. In 91/100 cases, the BETA output was not reported for at least one poverty line because that poverty line was
deemed outside the admissible bounds (i.e., too low). In eight cases, the GQ-based squared poverty gap was estimated to be higher than 100 (as compared to the true
counterpart of 0.25). In three cases, it was reported to be negative (these three last cases were not included in the assessment).
24
Country studies. Poverty and inequality biases (in percentage points)
Table 10. POVERTY HEADCOUNT RATIO: VIETNAM, TANZANIA AND NICARAGUA
Poverty line: GQ Beta Distribution:
True Quintiles Deciles Ventiles Quintiles Deciles Ventiles
$1/day 5.2 -1.00 -1.10 -0.19 -0.77 -0.51 -
Capability 35.7 0.17 0.30 1.71 0.11 0.04 -
Vietnam 1998 $2/day 41.9 -0.40 -0.35 1.52 -0.35 -0.64 -
Capability 40.4 -0.30 -0.15 -0.13 -0.25 -0.23 -0.20
$1/day 75.4 1.00 0.64 0.57 1.04 0.33 -0.23
Tanzania 2001 $2/day 97.8 0.34 0.19 0.16 - 0.96 0.94
Capability 30.6 -0.45 -0.30 -0.24 -0.62 -0.42 -0.27
$1/day 44.6 0.09 0.14 0.18 0.35 0.31 0.29
Nicaragua 1998 $2/day 79.0 0.58 0.26 0.17 0.40 0.10 -0.12
Table 11. POVERTY HEADCOUNT RATIO: WEIBULL, GENERALIZED BETA II, LOG-NORMAL AND PARETO
GQ Beta Distribution: Poverty line: True Quintiles Deciles Ventiles Quintiles Deciles Ventiles
0.33 x median 15.1 0.18 0.13 0.11 0.33 0.60 0.86 0.66 x median 33.2 -0.29 -0.26 -0.34 0.10 0.13 0.17 1.33 x median 63.4 0.13 0.28 0.34 -0.20 -0.57 -0.86
United States 1997 /
Weibull 1.66 x median 73.8 -0.05 0.18 0.27 0.24 -0.12 -0.43
0.33 x median 13.7 0.57 0.62 0.62 -0.66 -0.49 -0.30 0.66 x median 32.5 0.25 0.50 0.64 0.08 0.36 0.59 1.33 x median 62.9 -0.30 -0.49 -0.53 -0.10 -0.25 -0.38
Mexico 1996 /
Generalized Beta II 1.66 x median 72.0 0.09 -0.30 -0.43 -0.04 -0.27 -0.47
0.33 x median 17.6 0.61 0.64 0.65 2.02 2.58 3.07 0.66 x median 36.3 0.05 0.12 0.12 -0.04 -0.28 -0.41 1.33 x median 59.5 -0.17 -0.20 -0.20 -0.78 -1.61 -2.24
Russia 1995 /
Log-normal 1.66 x median 66.5 -0.06 -0.12 -0.12 -0.28 -1.15 -1.84
1.33 x median 73.7 -0.09 -0.03 0.00 0.29 -0.30 -0.76 1.50 x median 79.9 -0.08 0.00 -1.51 0.89 0.41 -1.71 1.66 x median 84.0 -0.24 -0.15 -0.11 - - -
Italy 2002 / Pareto
2.00 x median 89.5 -0.20 -0.09 -0.05 - - -
25
Table 12. ALL POVERTY INDICATORS: CHINA. POVERTY HEADCOUNT RATIO
POVERTY GAP RATIO
SQUARED POVERTY GAP
Quintiles Deciles Ventiles Poverty line:
Median x GQ Beta GQ Beta GQ Beta
2.00 -0.13 - 0.05 - 0.10 - 1.75 0.43 0.81 0.59 0.66 0.64 0.44 1.66 0.35 0.63 0.51 0.45 0.55 0.22 1.50 0.17 0.22 0.30 0.00 0.33 -0.27 1.33 -0.11 -0.24 -0.05 -0.51 -0.03 -0.79 1.25 -0.18 -0.36 -0.15 -0.64 -0.15 -0.92 1.00 -0.55 -0.67 -0.64 -0.96 -0.67 -1.18 0.75 0.29 0.26 0.14 0.06 0.10 0.02 0.50 0.94 0.80 0.83 0.70 0.79 0.75 0.33 1.36 0.88 1.42 1.05 1.43 1.26 0.25 -2.43 -0.95 -2.04 -0.56 -1.94 -0.41 0.20 -6.30 -0.58 -5.71 -0.44 -5.56 -0.41
Quintiles Deciles Ventiles Poverty line:
Median x GQ Beta GQ Beta GQ Beta
2.00 0.00 - 0.04 - 0.05 - 1.75 -0.02 -6.02 0.01 -0.12 0.01 -0.22 1.66 -0.04 -0.06 -0.02 -0.16 -0.02 -0.24 1.50 -0.08 -0.13 -0.08 -0.22 -0.09 -0.28 1.33 -0.11 -0.15 -0.12 -0.22 -0.12 -0.26 1.25 -0.10 -0.14 -0.12 -0.19 -0.12 -0.22 1.00 -0.02 -0.02 -0.03 -0.02 -0.04 0.02 0.75 0.07 0.08 0.10 0.18 0.10 0.27 0.50 -0.02 0.01 0.03 0.14 0.04 0.24 0.33 -0.42 -0.29 -0.35 -0.13 -0.33 -0.03 0.25 -0.63 -0.29 -0.62 -0.33 -0.62 -0.31 0.20 0.52 -0.30 0.37 -0.28 0.33 -0.27
Quintiles Deciles Ventiles Poverty line:
Median x GQ Beta GQ Beta GQ Beta
2.00 -0.09 - -0.08 - -0.08 - 1.75 -0.12 -0.12 -0.11 -0.14 -0.11 -0.15 1.66 -0.12 -0.13 -0.12 -0.14 -0.12 -0.14 1.50 -0.14 -0.14 -0.13 -0.13 -0.14 -0.11 1.33 -0.15 -0.13 -0.14 -0.10 -0.14 -0.06 1.25 -0.16 -0.13 -0.15 -0.09 -0.15 -0.04 1.00 -0.20 -0.15 -0.18 -0.07 -0.17 0.00 0.75 -0.39 -0.30 -0.35 -0.19 -0.33 -0.11 0.50 -0.52 -0.41 -0.47 -0.29 -0.46 -0.22 0.33 -0.76 -0.62 -0.73 -0.53 -0.72 -0.49 0.25 -0.94 -0.62 -0.94 -0.86 -0.94 -0.86 0.20 -1.47 -1.29 -1.43 -1.28 -1.42 -1.28
26
Table 13. GINI COEFFICIENT: ALL DISTRIBUTIONS.
GQ Beta Inequality indicator:
Distribution: True Quintiles Deciles Ventiles Quintiles Deciles Ventiles
China 1995 38.6 -0.18 -0.11 -0.10 0.07 0.02 -0.04 Tanzania 2001 37.2 0.58 0.56 -0.26 0.83 0.69 - Vietnam 1998 35.0 0.24 0.07 0.04 0.36 0.14 0.03
Nicaragua 1998 45.2 0.22 0.08 0.09 0.19 0.09 0.08
Weibull 41.3 -0.14 -0.07 -0.04 0.15 0.06 0.01 Generalized
Beta II 54.7 0.49 0.25 0.16 0.19 0.10 0.05
Log-normal 60.0 0.04 -0.03 -0.02 0.68 0.31 0.07
GINI COEFFICIENT
Pareto 28.5 -0.08 -0.04 -0.01 - - -
Note: In Tables 10-13, the cells with missing values correspond to instances in which POVCAL shut down due to apparent software error before reporting the results for the Beta parameterization.

About the Authors
Camelia Minoiu is a Ph.D. candidate in the Department of Economics at Columbia University. Her current research interests are in the area of nonparametric density estimation methods used in assessing income poverty and inequality. Previous work includes a sensitivity analysis of the extent and trend of Chinese poverty to underlying assumptions, an analysis of the vulnerability of rural households in transition economies to negative income shocks (with an application to Romania), as well as an identification and explanation of real income growth patterns in a cross section of countries over the past four decades.
Sanjay G. Reddy is an Assistant Professor of Economics at Barnard College at Columbia University. He also instructs courses on world poverty and development economics at Columbia University’s School of International and Public Affairs. His areas of work include development economics, international economics, and economics and philosophy. He possesses a Ph.D. in Economics from Harvard University, an M.Phil. in Social Anthropology from the University of Cambridge, and an A.B. in Applied Mathematics with Physics from Harvard University. He has held fellowships from the Center for Ethics and the Professions and the Center for Population and Development Studies at Harvard University and the Center for Human Values at Princeton University. Reddy is presently working extensively on global poverty and inequality estimates, capability-based inter-country poverty comparisons, and the theory of economic and social measurement generally (including index number analysis).
ISERP Working Papers 2007 07-01: “Implementing Second-Best Environmental Policy under Adverse Selection,” Glenn Sheriff, School of International and Public Affairs, Columbia University 2006 06-01: “The Impact of Parental Marital Disruption on Children’s Performance in School,” Christopher Weiss, ISERP, Columbia University, Kathleen Foley, University of Pennsylvania
06-02: “The Choice of Index Number: Part I, Valuation and Evaluation,” Sanjay Reddy, Barnard Economics, Benjamin Plener, Yale University
06-03: “Real Income Stagnation of Countries, 1960-2001,” Sanjay Reddy, Barnard Economics, Camelia Minoiu, Economics, Columbia University
06-04: “Chinese Poverty: Assessing the Impact of Alternative Assumptions,” Sanjay Reddy, Barnard Economics, Camelia Minoiu, Economics, Columbia University
06-05: “Spaghetti Politics,” Paolo Parigi, Sociology, Columbia University, Peter Bearman, Sociology, Columbia University
06-06: “Attention Felons: Evaluating Project Safe Neighborhoods in Chicago,” Andrew Papachristos, University of Chicago, Tracey Meares, University of Chicago, Jeffrey Fagan, Law, Columbia University 06-07: “Dynamics of Political Polarization,” Delia Baladassarri, Columbia University, Peter Bearman, Columbia University
06-08: “Why do Some Countries Produce So Much More Output per Worker than Others?” Emmanuel Pikoulakis, University of Hull Business School, Camelia Minoiu, Economics, Columbia University 06-09: “Trivers-Willard at Birth and One Year: Evidence from U.S. Natality Data 1983-2001,” Douglas Almond, Economics, Columbia University, Lena Edlund, Economics, Columbia University 06-10: “Forecasting House Seats from General Congressional Polls,” Robert Erikson, Political Science, Columbia University 06-11: “From Drafts to Checks: The Evolution of Correspondent Banking Networks and the Formation of the Modern U.S. Payments System, 1850-1914,” John James, Economics, University of Virginia, David Weiman, Economics, Barnard College, and History, Columbia University 2005
05-01: “Social Construction of Flows: Price Profiles Across Producers Gear to Market Context Upstream, Downstream and Cross-Stream,” Harrison White, Sociology, Columbia University
05-02: “Temporality and Intervention Effects: Trajectory Analysis of a Homeless Mental Health Program,” Mary Clare Lennon, Public Health, Columbia University, William McAllister, ISERP, Li Kuang, Public Health, Columbia University, Daniel Herman, Public Health, Columbia University
05-03: “Do Parents Help More Their Less Well-off Children?: Evidence from a Sample of Migrants to France,” François-Charles Wolff, Université de Nantés, Seymour Spilerman, Sociology, Columbia University, and Claudine Attias-Donfut, Caisse Nationale d’Assurance Vieillesse
05-04: “Politics, Public Bads, and Private Information,” Glenn Sheriff, International and Public Affairs, Columbia University
05-05: “Determinants of Justification and Indulgence,” Ran Kivetz, School of Business, Columbia University, Yuhuang Zheng, School of Business, Columbia University
05-06: “Political Competition and Policy Adoption: Market Reforms in Latin American Public Utilities,” Victoria Murillo, International and Public Affairs, Columbia University, Cecilia Martinez-Gallardo, Centro de Investigación y Docéncia Económica
05-07: “In Search of Lost Memories: Domestic Spheres and Identities in Roman Amheida, Egypt,” Anna Lucille Boozer, Anthropology, ISERP Graduate Fellow, Columbia University
05-08: “Global Links, Local Roots: Varieties of Transnationalization and Forms of Civic Integration,” David Stark, Sociology, Columbia University, Balazs Vedres, Central European University, Laszlo Bruszt, European University Institute
05-09: “Socio-Technologies of Assembly: Sense-Making and Demonstration in Rebuilding Lower Manhattan,” Monique Girard, ISERP, Columbia University, David Stark, Sociology, Columbia University
2004
04-01: “Reducing Bias in Treatment Effect Estimation in Observational Studies Suffering from Missing Data,” Jennifer Hill, International and Public Affairs, Columbia University
04-02: “Production Markets Broker Upstream to Downstream, balancing their volume and quality sensitivities to firms through an oriented market profile of signals,” Harrison C. White, Sociology, Columbia University
04-03: “Measuring Economic Disadvantage During Childhood: A Group-Based Modeling Approach,” Robert L. Wagmiller, Jr., SUNY Buffalo, Mary Clare Lennon, Public Health, Columbia University, Philip M. Alberti, Public Health, Columbia University, and J. Lawrence Aber, New York University
04-04: “Policymaking and Caseload Dynamics: Homeless Shelters,” William McAllister, ISERP, and Gordon Berlin, Columbia University
04-05: “Fresh Starts: School Form and Student Outcomes,” Christopher Weiss, ISERP, Columbia University and Peter S. Bearman, Sociology, ISERP, Columbia University
04-06: “Parental Wealth Effects On Living Standards and Asset Holdings: Results From Chile,” Florencia Torche, Sociology, Queens College, Center for the Study of Wealth and Inequality, Columbia
University and Seymour Spilerman, Sociology, Center for the Study of Wealth and Inequality, Columbia University
04-07: “Routes into Networks: The Structure of English Trade in the East Indies, 1601-1833,” Emily Erikson, Sociology, ISERP, Columbia University and Peter Bearman, Sociology, ISERP, Columbia University
2003
03-01: “The Plasticity of Participation: Evidence From a Participatory Governance Experiment,” Shubham Chaudhuri, Economics, Columbia University, and Patrick Heller, Sociology, Brown University
03-02: “Factional Politics and Credit Networks in Revolutionary Vermont,” Henning Hillmann, Sociology, Columbia University
03-03: “ ‘Active Patients’ in Rural African Health Care: Implications for Welfare, Policy and Privatization,” Kenneth L. Leonard, Economics, Columbia University
03-04: “Living at the Edge: America’s Low-Income Children and Families,” Hsien-Hen Lu, Public Health, Columbia University, Julian Palmer, Younghwan Song, Economics, Union College, Mary Clare Lennon, Public Health, Columbia University, Lawrence Aber, Public Health, Columbia University
2002
02-01: “Alternative Models of Dynamics in Binary Time-Series-Cross-Section Models: The Example of State Failure,” Nathaniel Beck, Political Science, UC San Diego, David Epstein, Political Science, Columbia, Simon Jackman, Political Science, Stanford and Sharyn O’Halloran, Political Science, Columbia
02-03: “Link, Search, Interact: The Co-Evolution of NGOs and Interactive Technology,” Jonathan Bach, Center on Organizational Innovation, Columbia University and David Stark, Center on Organizational Innovation, Columbia University
02-04: “Chains of Affection: The Structure of Adolescent Romantic and Sexual Networks,” Peter Bearman, Institute for Social and Economic Research and Policy, Columbia University, James Moody, Sociology, Ohio State, Katherine Stovel, Sociology, University of Washington
02-05: “Permanently Beta: Responsive Organization in the Internet Era,” Gina Neff, Center on Organizational Innovation (COI), Columbia University, and David Stark, Center on Organizational Innovation (COI), Columbia University
02-06: “Negotiating the End of Transition: A Network Approach to Political Discourse Dynamics, Hungary 1997,” Balázs Vedres, Columbia University, Péter Csigó, Ecole des Hautes Etudes en Sciences Sociales
02-07: “The Influence of Women and Racial Minorities Under Panel Decision-Making in the U.S. Court of Appeals,” Sean Farhang, Political Science, Columbia University, Gregory Wawro, Political Science, Columbia University
02-08: “The Role of Effort Advantage in Consumer Response to Loyalty Programs: The Idiosyncratic Fit Heuristic” Ran Kivetz, Business, Columbia University, Itamar Simonson, Business, Stanford University
2001
01-01: “Pathways of Property Transformation: Enterprise Network Careers in Hungary, 1988-2000 Outline of an Analytic Strategy,” David Stark, Sociology, Columbia and Balázs Vedres, Sociology, Columbia
01-02: “Policy Space and Voting Coalitions in Congress: the Bearing of Policy on Politics, 1930-1954,” Ira Katznelson, John Lapinski, and Rose Razaghian, Political Science, Columbia
01-03: “Doing Fractions: An Analysis of Partisan ship in Post-Socialist Russia,” Andrew D. Buck, Sociology, Columbia
01-04: “Opposite-Sex Twins and Adolescent Same-Sex Attraction,” Peter Bearman, Sociology/ISERP and Hannah Brückner, Sociology, Yale
01-05: “On the Uneven Evolution of Human Know-How,” Richard R. Nelson, Business/SIPA, Columbia
01-06: “Self-Control for the Righteous: Toward a Theory of Luxury Pre-Commitment,” Ran Kivetz, Business, Columbia and Itamar Simonson, Business, Stanford
01-07: “Distributing Intelligence and Organizing Diversity in New Media Projects,” Monique Girard, ISERP, Columbia and David Stark, Sociology, Columbia
01-08: “Agricultural Biotechnology’s Complementary Intellectual Assets,” Gregory D. Graff, Agricultural and Resource Economics, Berkeley, Gordon C. Rausser, Agricultural Economics, Berkeley and Arthur A. Small, SIPA/Earth Institute, Columbia
For copies of ISERP Working Papers
Visit http://www.iserp.columbia.edu/research/working_papers/ write to [email protected] or call 212-854-3081

Institute for Social and Economic Research and PolicyColumbia University in the City of New York420 West 118th Street8th Floor, Mail Code 3355New York, NY 10027Tel: 212-854-3081Fax: 212-854-8925Email: [email protected]
JANUARY 2007
EDITORIAL BOARD
Karen Barkey, SociologyPeter Bearman, Sociology/ISERPAlan Brinkley, HistoryAlessandra Casella, EconomicsEster Fuchs, Political Science/SIPAJohn Huber, Political ScienceIra Katznelson, Political Science/HistoryHerbert Klein, HistoryMary Clare Lennon, Sociomedical SciencesMahmood Mamdani, Anthropology/SIPAMarianthi Markatou, BiostatisticsWilliam McAllister, ISERPKathryn Neckerman, ISERPRichard Nelson, Business/SIPAElliott Sclar, Urban Planning/SIPASeymour Spilerman, SociologyCharles Tilly, SociologyHarrison White, Sociology
ADMINISTRATION
Peter Bearman, DirectorKathryn Neckerman, Associate Director
Leah Lubin, Assistant Director


![Does the Lorenz Curve Really Measure Inequality? Another ... 26 may/PAPER_Chateauneuf... · Does the Lorenz Curve Really Measure Inequality? Another Look at Inequality Measurement]](https://img.pdfslide.us/doc/110x75/5a9da3a67f8b9a42488bca02/does-the-lorenz-curve-really-measure-inequality-another-26-maypaperchateauneufdoes.jpg)