Embed Size (px)
Citation preview

THE ASKOV LONG-TERM EXPERIMENTS: 1894-2019- A UNIQUE RESEARCH PLATFORM TURNS 125 YEARS
BENT T. CHRISTENSEN, INGRID K. THOMSEN AND JØRGEN ERIKSEN
DCA REPORT NO. 151· MARCH 2019
AARHUS UNIVERSITY AU
DCA - DANISH CENTRE FOR FOOD AND AGRICULTURE

AARHUS UNIVERSITY
Bent T. Christensen, Ingrid K. Thomsen and Jørgen Eriksen
Aarhus UniversityDepartment of AgroecologyBlichers Allé 20DK-8830 Tjele
THE ASKOV LONG-TERM EXPERIMENTS: 1894-2019- A UNIQUE RESEARCH PLATFORM TURNS 125 YEARSDCA REPORT NO. 151 · MARCH 2019
AARHUS UNIVERSITY AU
DCA - DANISH CENTRE FOR FOOD AND AGRICULTURE
Series: DCA report
No.: 151
Authors: Bent T. Christensen, Ingrid K. Thomsen and Jørgen Eriksen
Publisher: DCA - Danish Centre for Food and Agriculture, Blichers Allé 20, PO box 50, DK-8830 Tjele. Tel. 8715 1248, e-mail: [email protected], web: www.dca.au.dk
Photo: Front page: Top: Niels Peter Pedersen, bottom: Kristine Riis Hansen, both AU Askov, Department of Agroecology, Aarhus University
Print: www.digisource.dk
Year of issue: 2019
Copying permitted with proper citing of source
ISBN: Printed version 978-87-93787-43-8. Electronic version 978-87-93787-44-5
ISSN: 2245-1684
Reports can be freely downloaded from www.dca.au.dk
Scientific reportThe reports contain mainly the final reportings of research projects, scientific reviews, knowledge syntheses, commissioned work for authorities, technical assessments,guidelines, etc.
AARHUS UNIVERSITY
THE ASKOV LONG-TERM EXPERIMENTS: 1894-2019- A UNIQUE RESEARCH PLATFORM TURNS 125 YEARS


3
Preface
Established in 1894, The Askov Long-Term Experiments on Animal Manure and Mineral Fertilizers
(Askov-LTE) are among the very few agricultural experiments with treatments continued beyond 125
years. The Askov-LTE remains the only known experiment maintained for more than a century that
allows a direct comparison of incremental and corresponding rates of N, P, and K in animal manure and
mineral fertilizers. Another unique feature is the field layout. In contrast to other experiments of similar
age, the Askov-LTE includes four replicate blocks (fields) with abundant treatment replicates within
each block. This allows the significance of treatment effects be tested thoroughly by statistical analyses.
Records of crop yields stretch back to the start of the experiments in 1894, while systematic sampling
and archiving of soil at 4 years intervals began in 1923. Archiving of crop samples began in 1949.
Encompassing results from routine soil and plant analyses, archived soil and plant samples, a detailed
documentation of changes in treatments and general field management, recordings of climate
parameters, and an extensive backlog of results obtained in specific projects, the Askov-LTE provides a
unique research platform for studies in very diverse scientific disciplines.
The long-term effects of nutrient management on soil and plant properties remain crucial not just for
improving crop productivity, but also for research addressing environmental quality, climate change
mitigation, changes in soil quality, aspects of prehistoric agriculture, and fate of antibiotics. The
significance of the Askov-LTE expands beyond the national scene and provides a truly global research
facility. In terms of cost-benefit, the wide-ranging international cooperation, pooling of diverse
analytical capabilities and the frequent exchange of research achievements through publications in
recognized scientific journals conveys the Askov-LTE an unprecedented high cost effectiveness.
Long-term experiments call for lengthy sections on acknowledgements. For the previous and current
staff at Askov Experimental Station, the longevity of the Askov-LTE represents a most rewarding
acknowledgement. The professional skills and everyday commitment of the technical staff provide the
trustful backbone of any research activity based on the Askov-LTE. Also gratefully acknowledged are
those who have contributed to the topicality of the experiments, e.g. by demonstrating their potential in
research. It remains a privilege and a commitment to maintain and develop the research potential of the
experiments without compromising 125 years of treatment continuity.
Bent T. Christensen
AU-Foulum, March 2019

4
5
Contents
Introduction ................................................................................................................................................... 7
The Lermarken site ....................................................................................................................................... 11
The experimental design ............................................................................................................................. 14
The crop rotation ......................................................................................................................................... 16
Manure and fertilizer treatments ................................................................................................................20
Changes implemented in the B4-field since 1997 ...................................................................................... 26
General field management .......................................................................................................................... 30
Sampling and data ....................................................................................................................................... 34
Current crop yields (2006-2018) ................................................................................................................ 35
Changes in soil C content (1924-2016) ....................................................................................................... 41
Development in crop yields (1894-2017) .................................................................................................... 44
Reflections and outlook ............................................................................................................................... 49
References .................................................................................................................................................... 51
Appendix A: Historical changes in treatments on Lermarken: 1894-1956 .............................................. 53
Appendix B: The Askov-LTE on Sandmarken: 1894-1997 ........................................................................ 62
Appendix C: Publications based on the Askov-LTE and appearing 1994 - 2019 ..................................... 68

6

7
Introduction
The first Danish field experiments with a long-term perspective and financially supported by
government funding were established in 1863 at the Royal Veterinary and Agricultural University in
Copenhagen. The purpose was to evaluate the nutritive value of mineral fertilizers to crops (Maar, 1888).
The inspiration was the field experiments initiated during 1843-1856 by J. B. Lawes and J. H. Gilbert at
Rothamsted, England (Johnston, 1994). The experiments at the agricultural university occupied 11 ha
and continued until 1896. However, only results from the early years reached a wider audience and these
experiments most likely had a limited impact on the progress in crop production in Danish agriculture
(Larsen, 1923).
Government Advisor Fredrik Hansen initiated in 1894 a suite of field experiments on animal manure
and mineral fertilizers at Askov Experimental Station. Established in 1885, as one of the first two
agricultural experimental stations in Denmark, the purpose of Askov Experimental Station was to
improve crop production on Danish farms. This involved testing effects of green manures and various
crop rotations, and enhancing the nutritive value to crops of farmyard manure. At that time, a general
change in agricultural production towards animal husbandry increased the volume of animal manure
available on many farms, and an increasing number of pigs and cattle required a larger and more reliable
production of forage and grain. From this development emerged a need to establish more precisely the
potential value of animal manure applied in crop rotations. At the same time, there was a growing
interest in the use of mineral salts (“artificial manures”) as a source of plant nutrients. Scientists had
long recognized the value of mineral fertilizers but their use in crop production was insignificant and
many practical issues remained unsolved. One major concern was the consequences for soil fertility
when inorganic salts replaced animal manure. In contrast to mineral fertilizers, the traditional farmyard
manure rich in bedding material contributed organic matter to the soil. At that time, most farmers,
agricultural advisors and scientists still considered that soil organic matter (humus) was the most
essential contributor to crop vitality.
For the experiments established at Askov Experimental Station, one key objective was to compare the
effect of nutrients added in manure with that of N, P, and K added in mineral fertilizers. Unmanured
plots served as reference treatments. Additional plots tested the effect of N, P, and K containing salts
added individually, in combinations of two or three, or in combination with animal manure. As years
went by, these experiments came to be The Askov Long-Term Experiments on Animal Manure and
Mineral Fertilizers (Askov-LTE). In the early years, emphasis was on harvest yields and economic
returns, and on demonstrating to farmers and advisors the beneficial effects of proper nutrient
management in crop production. Although it soon became clear that crops grew well following adequate
and balanced additions of nutrients in mineral fertilizers, their longer-term effects on soil fertility
remained of great concern. This spawned a greater focus on the chemical properties of manures and soil,
and laboratory facilities for chemical analyses emerged in 1904 at Askov Experimental Station. Soil

8
sampling at 4 years intervals began in 1923. Soil samples were subject to chemical analyses and the
remaining soil archived. Systematic analyses and archiving of crop samples began in 1949.
The original purpose of the Askov experiments was to serve Danish agriculture but with an international outlook. Above, the Silver medal awarded to F. Hansen at the Paris World Exhibition in 1900. Below a visit to Rothamsted in 1921 with soils forwarded to Denmark for analyses.
9
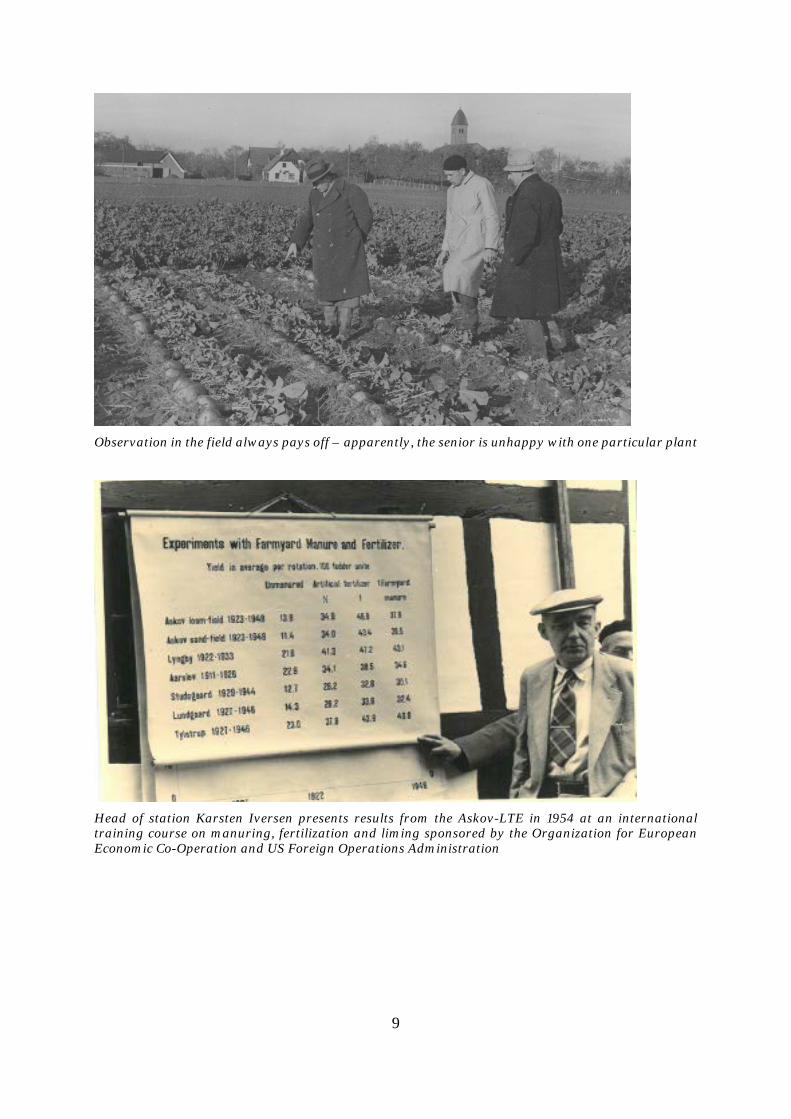
Observation in the field always pays off – apparently, the senior is unhappy with one particular plant
Head of station Karsten Iversen presents results from the Askov-LTE in 1954 at an international training course on manuring, fertilization and liming sponsored by the Organization for European Economic Co-Operation and US Foreign Operations Administration

10
Historically, the experiments have played a key role in establishing basic knowledge regarding the most
efficient use of manure and mineral fertilizers. Although the original purpose was elucidating crop yield
benefits and economic returns, the experiments soon became test-bed for questions related to nutrient
balances, changes in soil organic matter, and accumulation in soil of nutrients. Other aspects
encompassed soil microbiological properties and the development of new protocols for testing
availability of plant nutrients retained in soil. Results of the research based on the experiments typically
appeared in Tidsskrift for Planteavl, a national research journal reporting mainly in Danish. However,
contributions to international meetings and symposia communicated research output in English in
proceedings and book chapters. In this way, results from the Askov-LTE obtained international
awareness. Publications in journals targeting the international scientific community were few, as the
political focus of research funding remained on productivity in the Danish agricultural sector. Later the
research activity came to include increased resource use efficiency and a reduced impact of agriculture
on the environment.
Reporting in Danish to farmers, advisors and authorities on issues related to plant production remains
an important priority. During past decades, however, the research associated with the Askov-LTE has
diversified in terms of scientific disciplines, methodological approach and research area. This has led to
increased international cooperation involving the Askov-LTE as research platform and to a substantial
increase in international publication as witnessed by the publication list appended this report (Appendix
C). Today, publication in peer-reviewed scientific journals and thereby participation in the global
research community is prioritized along with knowledge transfer to authorities and the farming
community.
The 100-year Anniversary Workshop in 1994 presented several ideas to develop the experimental layout
and the topicality of the Askov-LTE (Christensen & Trentemøller, 1995). Major changes introduced in
1997 concerned the experimental layout of the B4-field at the Lermarken site. This report presents in
detail the changes in the experimental layout of the B4-field after 1996 while Appendix A includes the
pre-1996 treatment history of plots in the B4-field.
Another major change was the conversion of the Askov-LTE at the Sandmarken site into semi-natural
permanent grassland. All nutrient additions stopped in 1997 and grass seeded in March 1998 replaced
the crop rotation. Cutting of the grass occurs two to three times every year with the cut biomass left on
the plots. Soil samples are taken from each of the previous treatments every 4th year. Appendix B
provides details on the pre-1998 treatment history of the Sandmarken site.
This report is an introduction to the Askov-LTE on the Lermarken site. It includes an outline of site
properties, the experimental layout, treatments applied since 1894, and presents selected results on crop
yields and changes in soil organic matter contents. Appendix A accounts for historical changes in plot
treatments on the Lermarken site while Appendix B describes the Askov-LTE at the Sandmarken site.
Appendix C lists publications based on the Askov-LTE and appearing during 1994-2019.
11
The Lermarken site
Askov Experimental Station is located in the South of Jutland (55°28’N, 09°07’E; elevation: 63 meters
above sea level). Figure 1 presents the general climatic conditions, compiled from recordings at the
Askov weather station averaged for the period 1999-2018. Mean annual precipitation and temperature
is 953 mm and 8.8 °C, respectively. The wet deposition of sulphate, nitrate and ammonium at Askov has
been determined periodically since 1921 (Table 1). Results for 2006 and 2016 refer to Vejen Municipality
and include dry and wet deposition as reported by Ellermann et al. (2007, 2018).
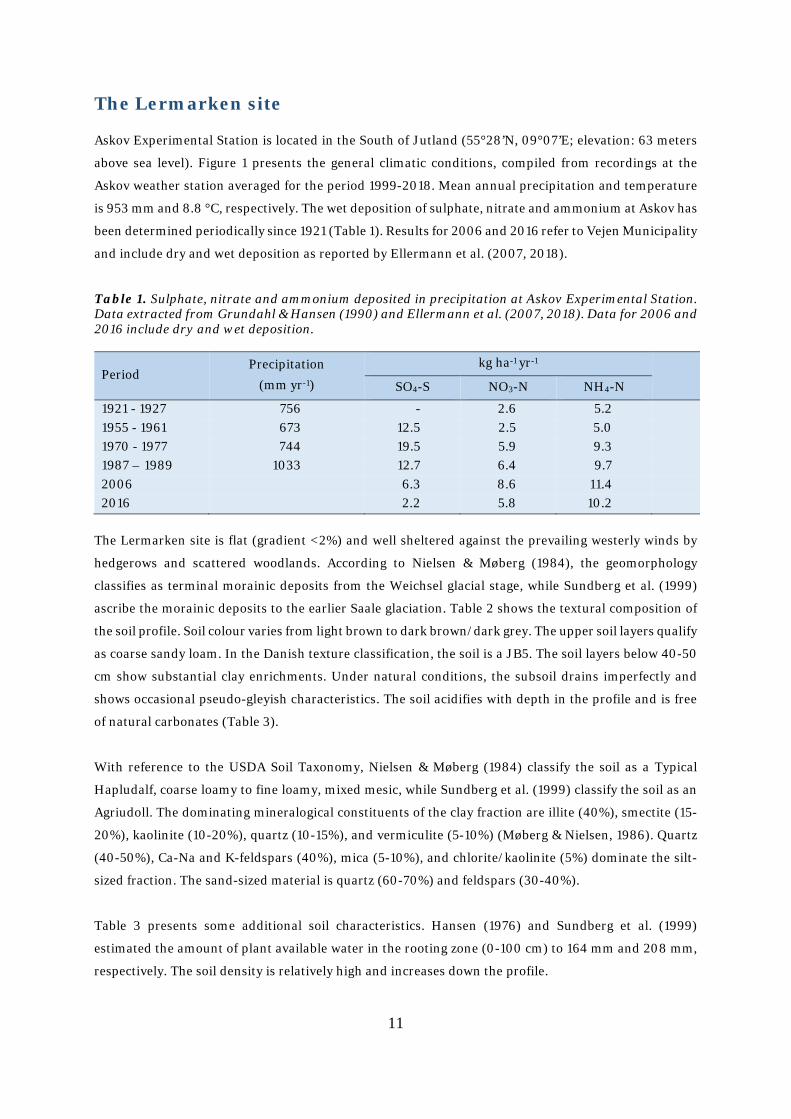
Table 1. Sulphate, nitrate and ammonium deposited in precipitation at Askov Experimental Station. Data extracted from Grundahl & Hansen (1990) and Ellermann et al. (2007, 2018). Data for 2006 and 2016 include dry and wet deposition.
Period Precipitation
(mm yr-1)
kg ha-1 yr-1
SO4-S NO3-N NH4-N
1921 - 1927 756 - 2.6 5.2 1955 - 1961 673 12.5 2.5 5.0 1970 - 1977 744 19.5 5.9 9.3 1987 – 1989 1033 12.7 6.4 9.7 2006 6.3 8.6 11.4 2016 2.2 5.8 10.2
The Lermarken site is flat (gradient <2%) and well sheltered against the prevailing westerly winds by
hedgerows and scattered woodlands. According to Nielsen & Møberg (1984), the geomorphology
classifies as terminal morainic deposits from the Weichsel glacial stage, while Sundberg et al. (1999)
ascribe the morainic deposits to the earlier Saale glaciation. Table 2 shows the textural composition of
the soil profile. Soil colour varies from light brown to dark brown/dark grey. The upper soil layers qualify
as coarse sandy loam. In the Danish texture classification, the soil is a JB5. The soil layers below 40-50
cm show substantial clay enrichments. Under natural conditions, the subsoil drains imperfectly and
shows occasional pseudo-gleyish characteristics. The soil acidifies with depth in the profile and is free
of natural carbonates (Table 3).
With reference to the USDA Soil Taxonomy, Nielsen & Møberg (1984) classify the soil as a Typical
Hapludalf, coarse loamy to fine loamy, mixed mesic, while Sundberg et al. (1999) classify the soil as an
Agriudoll. The dominating mineralogical constituents of the clay fraction are illite (40%), smectite (15-
20%), kaolinite (10-20%), quartz (10-15%), and vermiculite (5-10%) (Møberg & Nielsen, 1986). Quartz
(40-50%), Ca-Na and K-feldspars (40%), mica (5-10%), and chlorite/kaolinite (5%) dominate the silt-
sized fraction. The sand-sized material is quartz (60-70%) and feldspars (30-40%).
Table 3 presents some additional soil characteristics. Hansen (1976) and Sundberg et al. (1999)
estimated the amount of plant available water in the rooting zone (0-100 cm) to 164 mm and 208 mm,
respectively. The soil density is relatively high and increases down the profile.
12
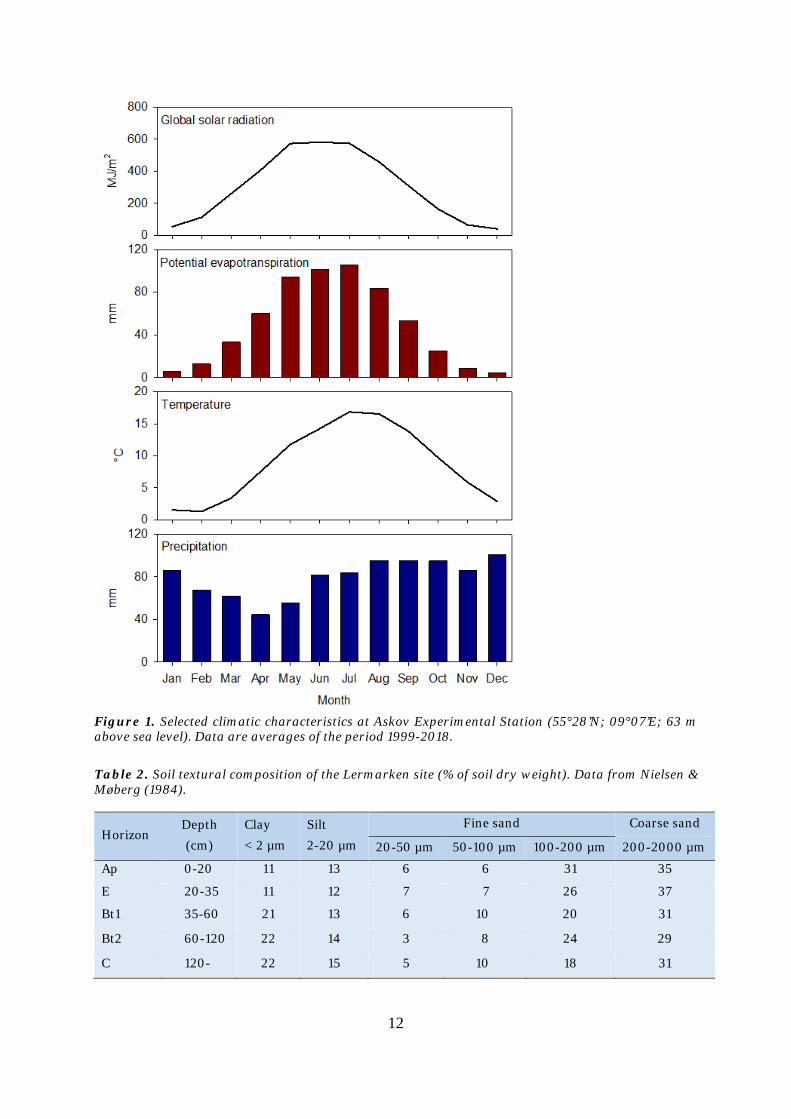
Figure 1. Selected climatic characteristics at Askov Experimental Station (55°28’N; 09°07’E; 63 m above sea level). Data are averages of the period 1999-2018.
Table 2. Soil textural composition of the Lermarken site (% of soil dry weight). Data from Nielsen & Møberg (1984).
Horizon Depth (cm)
Clay < 2 µm
Silt 2-20 µm
Fine sand Coarse sand
20-50 µm 50-100 µm 100-200 µm 200-2000 µm
Ap 0-20 11 13 6 6 31 35
E 20-35 11 12 7 7 26 37
Bt1 35-60 21 13 6 10 20 31
Bt2 60-120 22 14 3 8 24 29
C 120- 22 15 5 10 18 31

13
Table 3. General soil properties of the Lermarken site. Data from Hansen (1976), Nielsen & Møberg (1984) and Sundberg et al. (1999).
Soil depth (cm)
pH (CaCl2)
% C Base
saturation (%)
Soil density (g cm-3)
Water-filled soil pore space (%) Plant available
water (mm)
pF 1.0 pF 2.0 pF 3.0 pF 4.2
0-20 5.6 1.3 70 1.50 40 32 25 10 50 20-50 5.7 0.8 55 1.55 40 31 21 10 60 50-100 4.0 0.2 30 1.60 38 30 27 18 80 100- 4.1 0.1 40 1.70 34 25 20 8 -
Cultivation of the Lermarken site began around year 1800 when the farm “Øster Havgaard” was first
established. According to Land Register maps, dated 1793, the site was at that time still covered in open,
mixed heath- and grassland with scattered deciduous scrubs and most likely used for free-range grazing
of sheep, cattle and pigs. Lermarken was first tile-drained in the 1860’ies and with occasional addition
of marl. Re-draining at greater depth took place following 1885, when F. Hansen acquired the farm
“Øster Havgaard” that then became Askov Experimental Station. Today, addition of lime retains soil pH
of the Ap-horizon in the range 5.5 to 6.5.
Subdivision of treatment plots in the
B2w-field to quantify the residual N
effect of animal manure and mineral
fertilizers

14
The experimental design
The Askov-LTE at the Lermarken site encompasses four fields (blocks), designated the B2-, B3-, B4-,
and B5-field (Figure 2). Historically, the B2-field divides into a west (B2w) and an east (B2e) section.
The B4- and B5-fields are next to each other, while the B2- and B3-fields are a few hundred meters to
the West of the B4- and B5-fields. Appendix A provides an account of the history of the experimental
design, including historical changes in treatments for individual plots during the period 1894-1956.
Table 4 shows the size of plots embedded in the four fields. When establishing the plots in 1893, the
metric system was not yet in use, and plots became measured in feet. The net plot is the area within the
treated (gross) plot used for determination of crop yields and analyses. Most of the soil sampling also
occurs within the net plot. The net plot now accounts for about one-third of the treated plot, while the
remaining area serves as buffer strips that alleviate effects of tillage induced transfer of soil and
substances across plot borders. No rigid statistically design applies to the distribution of treatment
replicates within a field. However, when the experiments were established, it was recognized that to
obtain reliable quantifications of treatment effects, a given treatment had to be repeated in different
parts of the field to alleviate effects of spatial heterogeneity in soil properties (Larsen, 1923). Not all
treatments are present in all four fields, and the number of replicates varies among fields (see Table 9).
Figure 2. The position of fields on the Lermarken site.
15
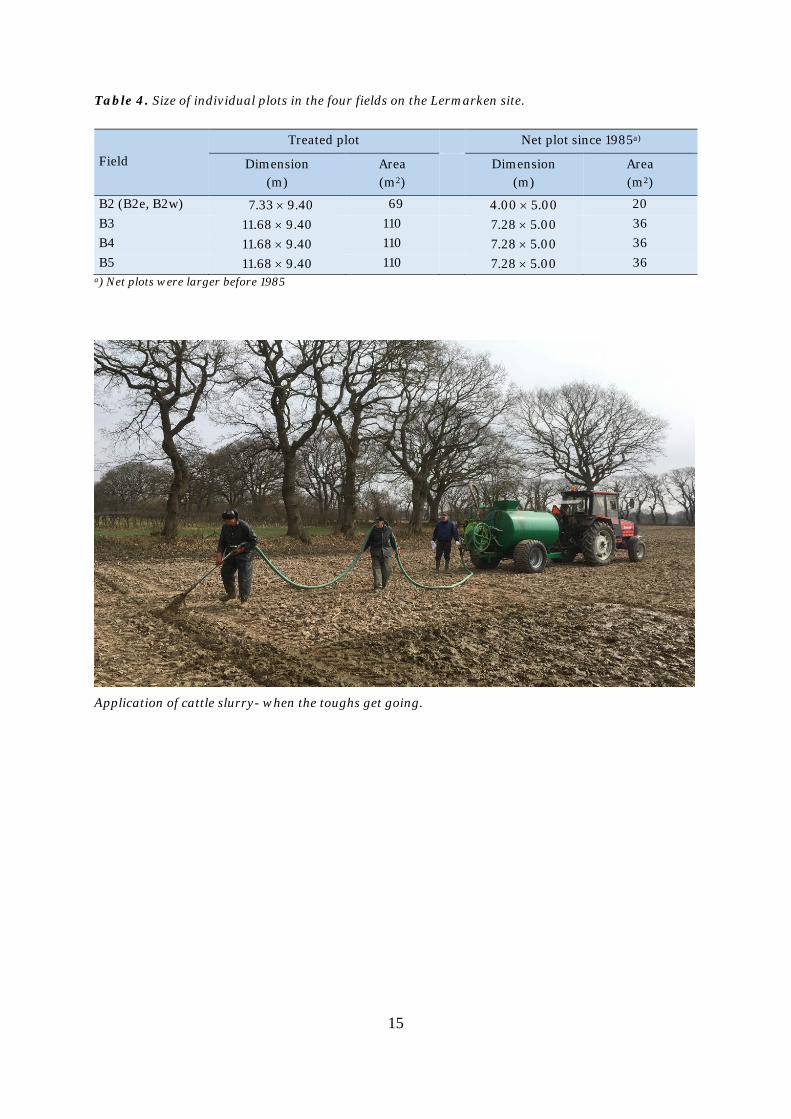
Table 4. Size of individual plots in the four fields on the Lermarken site.
Field
Treated plot Net plot since 1985a)
Dimension (m)
Area (m2)
Dimension (m)
Area (m2)
B2 (B2e, B2w) 7.33 × 9.40 69 4.00 × 5.00 20 B3 11.68 × 9.40 110 7.28 × 5.00 36 B4 11.68 × 9.40 110 7.28 × 5.00 36 B5 11.68 × 9.40 110 7.28 × 5.00 36
a) Net plots were larger before 1985
Application of cattle slurry- when the toughs get going.
16
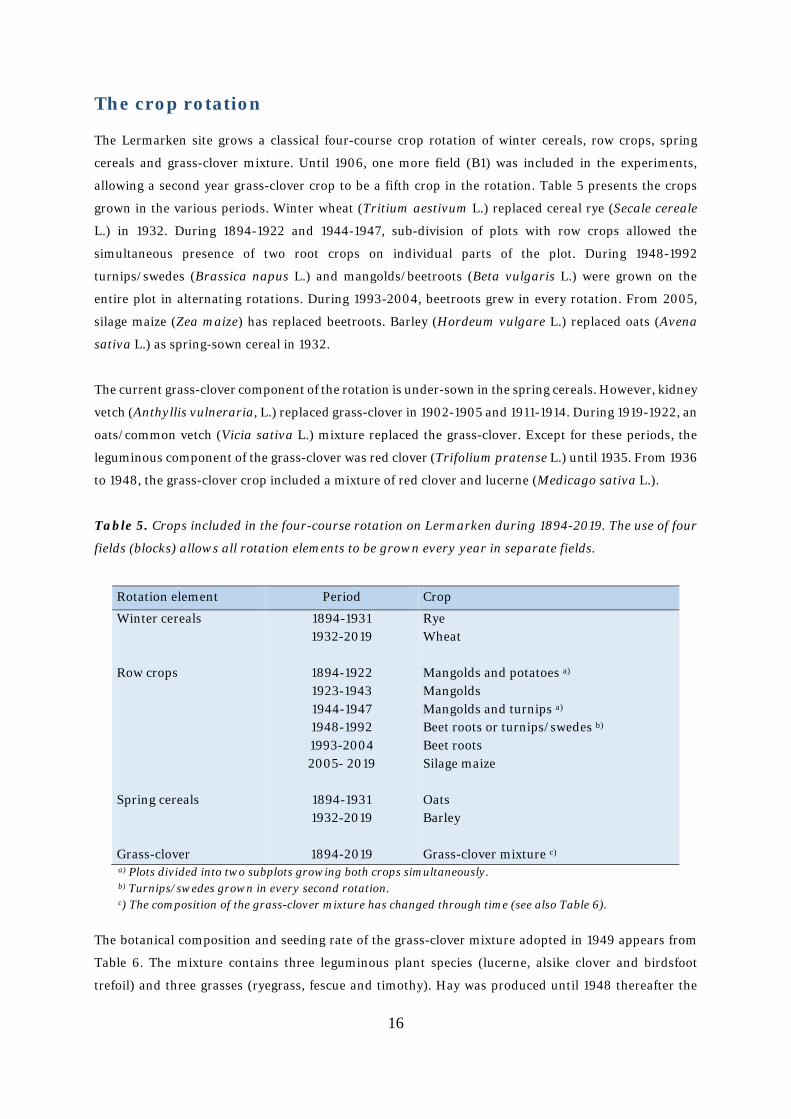
The crop rotation
The Lermarken site grows a classical four-course crop rotation of winter cereals, row crops, spring
cereals and grass-clover mixture. Until 1906, one more field (B1) was included in the experiments,
allowing a second year grass-clover crop to be a fifth crop in the rotation. Table 5 presents the crops
grown in the various periods. Winter wheat (Tritium aestivum L.) replaced cereal rye (Secale cereale
L.) in 1932. During 1894-1922 and 1944-1947, sub-division of plots with row crops allowed the
simultaneous presence of two root crops on individual parts of the plot. During 1948-1992
turnips/swedes (Brassica napus L.) and mangolds/beetroots (Beta vulgaris L.) were grown on the
entire plot in alternating rotations. During 1993-2004, beetroots grew in every rotation. From 2005,
silage maize (Zea maize) has replaced beetroots. Barley (Hordeum vulgare L.) replaced oats (Avena
sativa L.) as spring-sown cereal in 1932.
The current grass-clover component of the rotation is under-sown in the spring cereals. However, kidney
vetch (Anthyllis vulneraria, L.) replaced grass-clover in 1902-1905 and 1911-1914. During 1919-1922, an
oats/common vetch (Vicia sativa L.) mixture replaced the grass-clover. Except for these periods, the
leguminous component of the grass-clover was red clover (Trifolium pratense L.) until 1935. From 1936
to 1948, the grass-clover crop included a mixture of red clover and lucerne (Medicago sativa L.).
Table 5. Crops included in the four-course rotation on Lermarken during 1894-2019. The use of four
fields (blocks) allows all rotation elements to be grown every year in separate fields.
Rotation element Period Crop
Winter cereals 1894-1931 Rye 1932-2019 Wheat Row crops 1894-1922 Mangolds and potatoes a) 1923-1943 Mangolds 1944-1947 Mangolds and turnips a) 1948-1992 Beet roots or turnips/swedes b) 1993-2004 Beet roots 2005- 2019 Silage maize Spring cereals 1894-1931 Oats 1932-2019 Barley Grass-clover 1894-2019 Grass-clover mixture c) a) Plots divided into two subplots growing both crops simultaneously. b) Turnips/swedes grown in every second rotation. c) The composition of the grass-clover mixture has changed through time (see also Table 6).
The botanical composition and seeding rate of the grass-clover mixture adopted in 1949 appears from
Table 6. The mixture contains three leguminous plant species (lucerne, alsike clover and birdsfoot
trefoil) and three grasses (ryegrass, fescue and timothy). Hay was produced until 1948 thereafter the
17
grass-clover has been removed from the plots as green forage. The emerging grass-clover sward is
without cuts in the year of establishment but mown in the autumn period with the biomass left on the
plot. In the production year, the grass-clover is cut twice and the harvested biomass removed after each
cut.
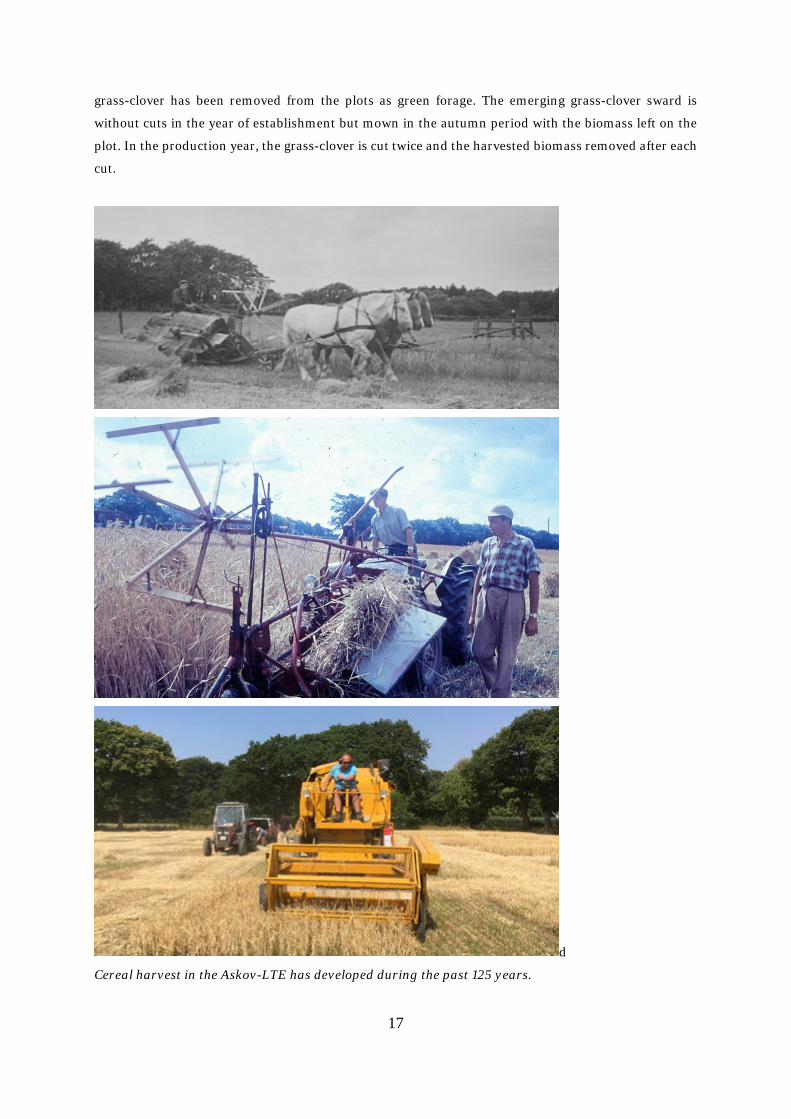
d
Cereal harvest in the Askov-LTE has developed during the past 125 years.

18
- And so has harvest of the grass-clover crop

19
Table 6. The botanical components and seeding rates of the grass-clover mixture used on Lermarken since 1949.
Botanical component Latin name Seeding rate
(kg ha-1)
Lucerne (alfalfa) Medicago sativa L. 10 Alsike clover Trifolium hybridum L. 3 Birdsfoot trefoil Lotus corniculatus L. 3 Perennial ryegrass Lolium perenne L. 5 Meadow fescue Festuca pratensis Huds. 5 Timothy Phleum pratense L. 2
Different nutrient preferences of different legume species.

20
Manure and fertilizer treatments
Various levels (0, ½, 1, 1½, 2) of nitrogen, phosphorus and potassium applied in animal manure (AM,
mainly from cattle) or in mineral fertilizer (NPK) constitute the core treatments of the Askov-LTE. Table
7 shows the amounts of nitrogen, phosphorus and potassium given in the 1 AM and 1 NPK treatments
and the distribution of these nutrients among individual crops in the rotation. The rates and distribution
of nutrients have been adjusted in 1907, 1923, 1949, 1973 and 2006, but within each period almost
similar amounts of nitrogen, phosphorus and potassium have been applied to the rotation in
corresponding AM and NPK treatments. The period 1949-1972 deviates from this pattern in that cereals
grown with the AM treatments received N in calcium nitrate.
Until 1973, the distribution of the animal manure between crops differed from that of mineral fertilizers.
During 1894-1906, all crops received equal amounts of N, P and K in mineral fertilizers, while
application of animal manure was with 2/5 to winter rye and 3/5 to root crops. In the following period
(1907-1922), all crops received equal amounts of P and K in mineral fertilizer while the distribution of
N favoured root crops. Only root crops and spring-sown oats received animal manure while winter rye
and grass-clover were without direct inputs of manure. From 1923, addition of mineral fertilizer N to
the grass-clover crop ceased, while P was added until 1949 and K until 1973. Since then, grass-clover has
remained without direct inputs of manure and mineral fertilizers.
The rates of nitrogen, phosphorus and potassium given in AM increased in 1923 when liquid manure
came to supplement farmyard manure. Additions of NPK increased to keep comparability between
rotations given animal manure and mineral fertilizers. The rates and the distribution of NPK
implemented in 1923 were maintained until 1972, while for the AM, all animal manure was given to the
root crops and the cereals received N in mineral fertilizer during 1949-1972. Since 1973, the annual
average rates of nitrogen, phosphorus and potassium added in the rotation have been similar for
corresponding AM and NPK treatments. The distribution of nutrients between individual crops in the
rotation was adjusted in 2006 (in 1997 for the B4-field, see separate text section).

21
Table 7. Amounts (kg ha-1) of nutrients added in 1 NPK (mineral fertilizer) and 1 AM (animal manure).
Rates and distributions were adjusted in 1907, 1923, 1949, 1973 and 2006.
Period Rotation element 1 AM 1 NPK
Total-N P K N P K
1894-1906 a) Rye 81.0 25.2 58.3 38.8 12.4 28.1 Root crop 121.5 37.7 87.4 38.8 12.4 28.1 Oats 0 0 0 38.8 12.4 28.1 1st year grass-clover 0 0 0 38.8 12.4 28.1 2nd year grass-clover 0 0 0 38.8 12.4 28.1
Annual mean 40.5 12.6 29.1 38.8 12.4 28.1
1907-1922 a) Rye 0 0 0 37.2 13.3 31.9 Root crop 126.9 37.7 98.6 67.6 13.3 31.9 Oats 42.3 12.6 32.9 40.6 13.3 31.9 Grass-clover 0 0 0 20.4 13.3 31.9
Annual mean 42.3 12.6 32.9 41.4 13.3 31.9
1923-1948 b) Winter cereals 0 0 0 68.2 14.4 57.4 Root crops 213.2 42.2 207.3 160.3 25.3 108.1 Spring cereals 74.0 21.6 52.6 50.2 14.5 57.8 Grass-clover 0 0 0 0 14.5 57.8
Annual mean 71.8 15.9 65.0 69.7 17.0 69.8
1949-1972 b) Winter wheat 60.0 c) 0 0 70.0 16.0 66.0 Root crops 280.0 76.9 231.4 160.0 38.0 100.0 Spring barley 30.0 c) 0 0 50.0 16.0 33.0 Grass-clover 0 0 0 0 0 66.0
Annual mean 92.5 19.2 57.9 70.0 17.5 66.3
1973-2005 d) e) Winter wheat 95.8 19.7 91.7 100.0 19.0 87.6 Root crops f) 211.3 44.9 201.3 225.0 44.2 195.6 Spring barley 72.2 14.5 65.3 75.0 14.2 64.5 Grass-clover 0 0 0 0 0 0
Annual mean 95.0 19.7 89.6 100.0 19.3 86.9
2006-2018 Winter wheat Silage maize Spring barley Grass-clover
152.7 153.0 101.9
0
26.1 26.6 17.6
0
137.8 142.4 93.2
0
150 150 100
0
30 30 20
0
120 120 80
0
Annual mean 101.9 17.6 93.4 100 20 80 a) Animal manure was farmyard manure (FYM) b) Animal manure was FYM supplemented with liquid manure (LM) to root crops c) Nitrogen to cereals given in calcium nitrate d) Since 1973, AM is cattle slurry (SLU) with 60-65% of the total-N in ammoniacal form e) See separate section Changes implemented in the B4-field since 1997 f) Beetroots replaced by silage maize in 2005.

22
Table 8 presents the average annual amounts of animal manure given to the 1 AM treatment during each
period. Pre-application analysis of the nitrogen content in the manure defines the actual rate of manure
application. Animal manure was farmyard manure (FYM) during 1894-1972. During 1923-1972, liquid
manure (LM) supplemented the FYM additions. In 1973, cattle slurry (SLU) replaced the FYM + LM.
On average, 60-65% of the total-N in the SLU is ammoniacal N. Before 1923, mineral fertilizer K was
kainite (9-11% K) or similar low K containing fertilizer. Since then potassium chloride (KCl) has been
used. Mineral fertilizer P has been super-phosphate (c. 8% P and 12% S) until 2006 when replaced by
triple-superphosphate (c. 20% P and 2% S). During 1894-1939, fertilizer N was Chilean nitrate (NaNO3,
c. 16% N). Calcium nitrate (Ca(NO3)2; c. 16% N) was adopted subsequently (1940-1972) followed by
calcium ammonium nitrate (NH4NO3 + CaCO3; c. 26% N) in 1973. During 1973-1988, the cattle slurry
was surface applied and the soil ploughed in the autumn before sowing of winter wheat. Since 1989,
application of cattle slurry is in the spring by surface application in the growing winter wheat. For row
crops and spring-sown cereals, the time of application and incorporation of cattle slurry moved in 1989
from late autumn (November/December) to early spring (March/April).
Table 9 lists the current 16 treatments at the Lermarken site. Of these, nine date back to 1894 (1893 for
unmanured) and five were established in 1923. Treatments and replicates established after 1894 have
replaced previous treatments (see Appendix A). Table 9 also shows that the number of replicate plots
varies for treatments and fields. The B2-field includes the largest number of treatments and replicates.
This field appears with an east and a west section (B2e and B2w), the historical changes in treatments
and replicates in this field being somewhat complicated (see Appendix A).
Table 8. The approximate wet weight of animal manure applied in 1 AM. Annual mean of periods.
Period
Farmyard manure (FYM)
Liquid manure (LM)
Cattle slurry (SLU)
(kg wet weight ha-1 yr-1)
1894-1906 9000 1907-1922 9000 1923-1948 10000 4000 1949-1972 10000 4000 1973-2018 25000
There appears to be no systematic distribution of the treatments and replicates within a field. However,
one set of 1 N, 1 P and 1 K treatments, together with one replicate of the unmanured (0) and 1 NPK
treatments, can be found adjacent to each other in all fields, generally as a row arrangement with the
same plot sequence. Figures 3, 4, 5, 6 and 7 show the position of treatment plots in each field with the
notation AM being replaced by SLU to emphasize that animal manure is in the form of cattle slurry
(since 1973).

23
Table 9. The current treatments and the number of replicates in each field (see Table below Figure 7 for treatments in the B4-field from 1997 and onwards). Letters in parentheses are historical treatment codes.
Code in field plan
Treatment and year of establishment
Field All fields
B2e B2w B3 B4*) B5
1 (a) 0 (Unmanured) 1893 4 4 5 3 5 21 2 (b) ½ AM 1894 2 4 2 3 11 3 (c) 1 AM 1894 6 4 5 2 4 21 4 (d) 1½ AM 1894 5 4 3 2 3 17 5 (s) 2 AM 1923 3 3 8 (p) ½ NPK 1923 5 4 2 4 15 9 (k) 1 NPK 1894 5 4 4 3 4 20 10 (r) 1½ NPK 1923 5 3 3 2 13 11 (u) 2 NPK 1923 4 4 12 (r1) 1½ N + 3 PK 1923 3 1 4 13 (l) 1 NP 1894 2 2 2 2 2 10 7 (f) 1 NK 1935 2 3 3 2 10 6 (e) 1 PK 1935 1 4 3 2 3 13 14 (m) 1 N 1894 1 1 1 1 4 15 (n) 1 P 1894 1 1 1 1 4 16 (o) 1 K 1894 1 1 1 1 4
In total 48 28 35 28 35 174 *) Valid for B4-field until 1997.
Figure 3. The distribution of treatment replicates in the B2w-field. Row and column numbers identify individual plots (SLU=AM).
24
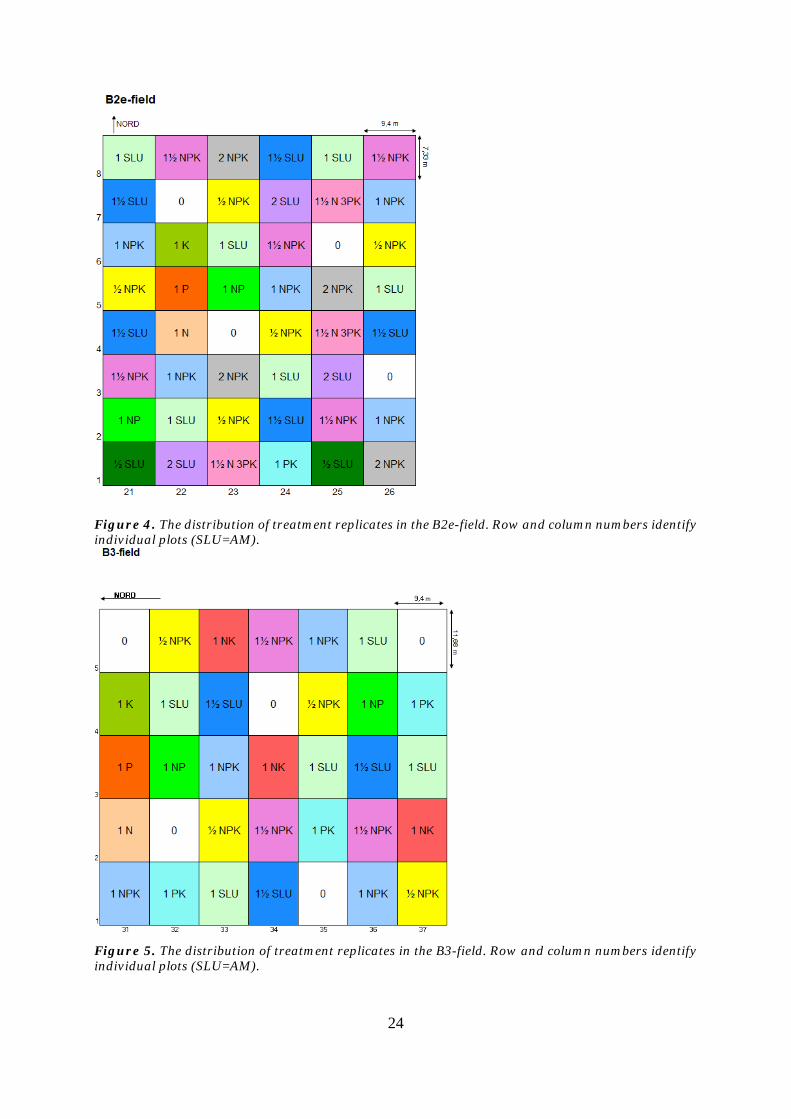
Figure 4. The distribution of treatment replicates in the B2e-field. Row and column numbers identify individual plots (SLU=AM).
Figure 5. The distribution of treatment replicates in the B3-field. Row and column numbers identify individual plots (SLU=AM).
25
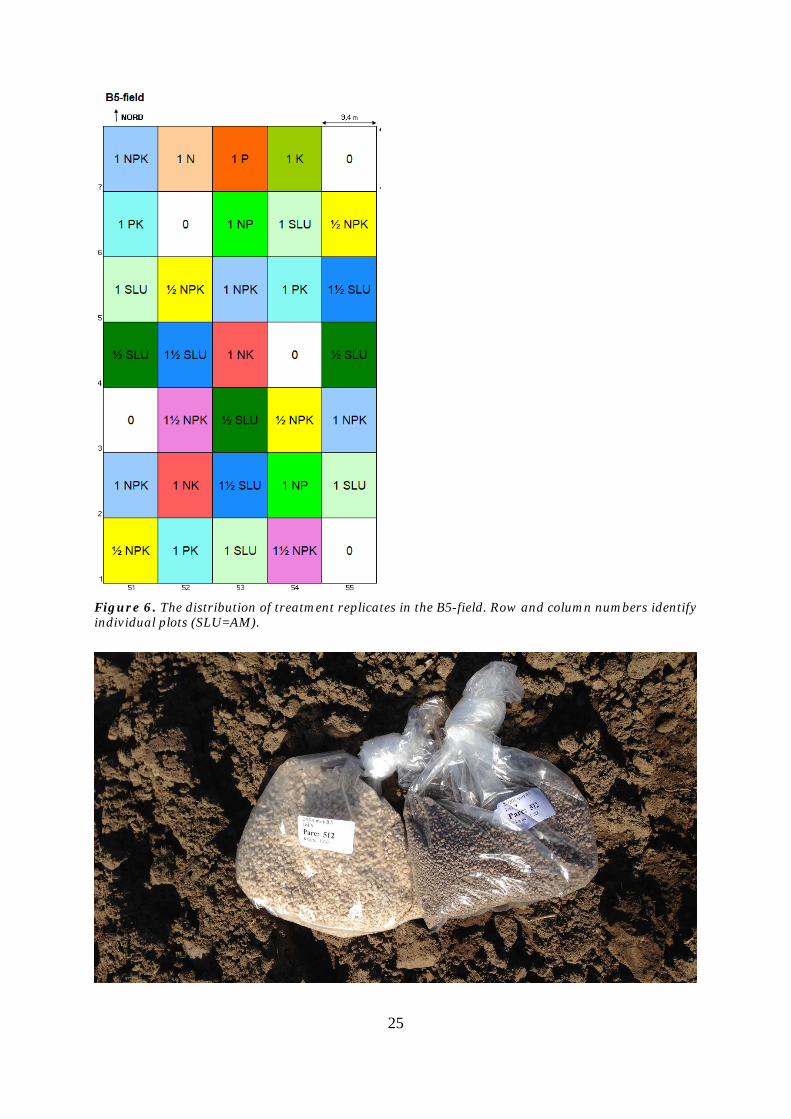
Figure 6. The distribution of treatment replicates in the B5-field. Row and column numbers identify individual plots (SLU=AM).
26
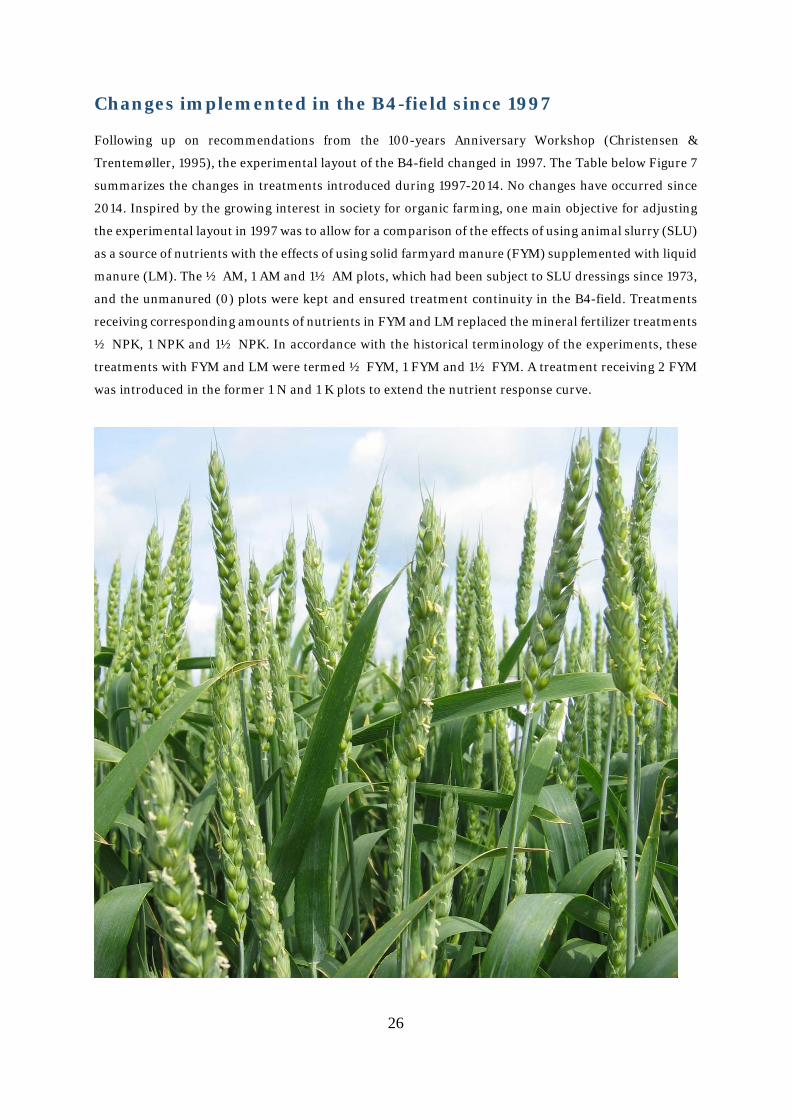
Changes implemented in the B4-field since 1997
Following up on recommendations from the 100-years Anniversary Workshop (Christensen &
Trentemøller, 1995), the experimental layout of the B4-field changed in 1997. The Table below Figure 7
summarizes the changes in treatments introduced during 1997-2014. No changes have occurred since
2014. Inspired by the growing interest in society for organic farming, one main objective for adjusting
the experimental layout in 1997 was to allow for a comparison of the effects of using animal slurry (SLU)
as a source of nutrients with the effects of using solid farmyard manure (FYM) supplemented with liquid
manure (LM). The ½ AM, 1 AM and 1½ AM plots, which had been subject to SLU dressings since 1973,
and the unmanured (0) plots were kept and ensured treatment continuity in the B4-field. Treatments
receiving corresponding amounts of nutrients in FYM and LM replaced the mineral fertilizer treatments
½ NPK, 1 NPK and 1½ NPK. In accordance with the historical terminology of the experiments, these
treatments with FYM and LM were termed ½ FYM, 1 FYM and 1½ FYM. A treatment receiving 2 FYM
was introduced in the former 1 N and 1 K plots to extend the nutrient response curve.
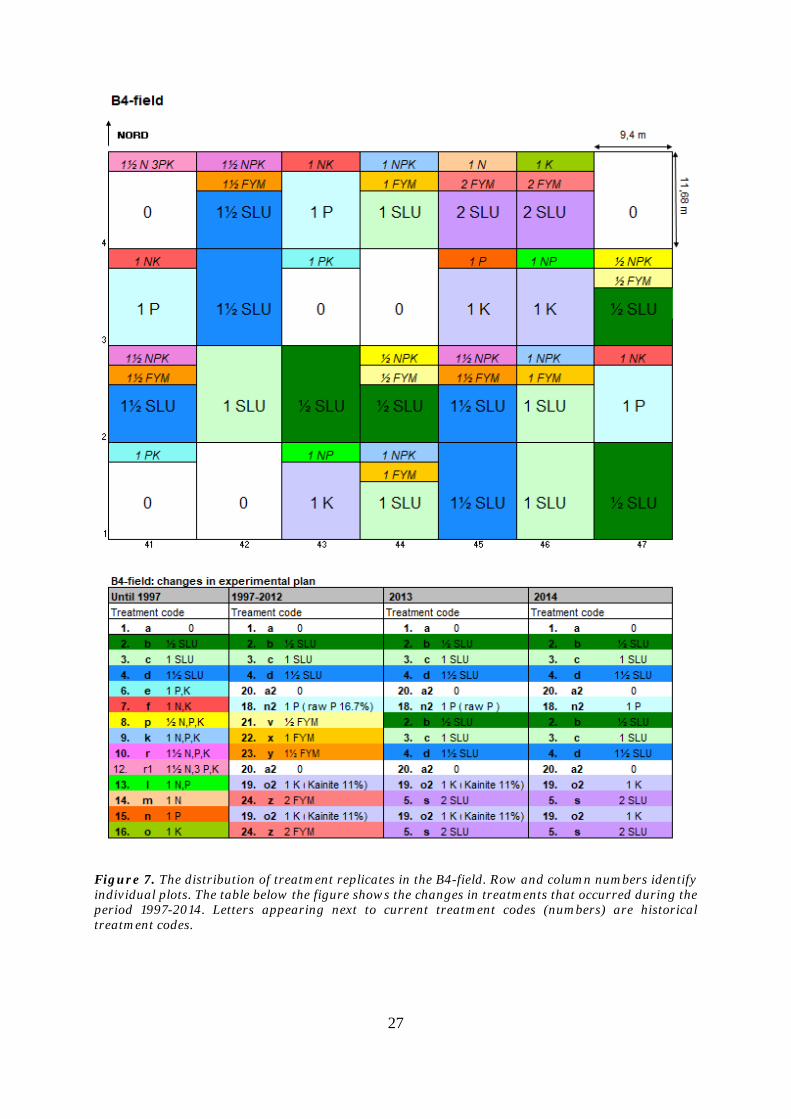
27
Figure 7. The distribution of treatment replicates in the B4-field. Row and column numbers identify individual plots. The table below the figure shows the changes in treatments that occurred during the period 1997-2014. Letters appearing next to current treatment codes (numbers) are historical treatment codes.

28
The previous 1 NK treatment was replaced by a new treatment in which 1 P is applied in soft rock
phosphate. This P source originates by grinding soft phosphate-ore and contains mainly tri-calcium-
phosphate and calcium carbonate. The acid-soluble P content is ca. 11% w/w. While mineral fertilizer P
added in super-phosphate contains sulphur, rock phosphate is devoid of sulphur. The plots previously
treated with either 1 NP or 1 P were replaced by plots receiving 1 K in kainite. Kainite is derived from
mined potassium-salts and contains about 11% water-soluble K and 3% water-soluble Mg (w/w). Finally,
the 1 PK and 1½ N + 3 PK treatments were transformed into unmanured (0) plots. The main objective
of these changes was to revert the effects of the previous treatments. This would allow for studies on
changes in soil and crop parameters that occur when soils rich in P or K are subject to gradual depletion,
and when soils severely depleted in P or K are subject to fresh additions of these elements.
The crops included in the rotation in the B4-field remained the same. All nutrients in SLU and FYM
were applied in the spring. For spring-sown crops, incorporation of slurry and solid farmyard manure
was before seedbed preparation. For the autumn-sown winter wheat, the SLU and LM were surface-
applied in the spring beneath the growing crop. The total amounts of nutrients applied to the rotation
remained as before, but the distribution of nutrients between individual crops in the rotation were
changed (Table 10). Root crops received a reduced amount of N (and associated P and K) whereas N
(and P and K) given to spring- and autumn-sown cereals increased. The grass-clover crop continued not
to receive nutrient additions directly. In 2006, this distribution of nutrients was implemented also in
the B2w-, B2e-, B3- and B5-fields.
Table 10. The distribution (kg ha-1) of nitrogen (N), phosphorus (P) and potassium (K) in the crop rotation for the 1 SLU and 1 FYM treatments introduced in the B4-field in 1997. Treatment Rotation element Total-N P K Manure type
1 SLU Winter cereals 150 30 119 Slurry
Root crops 150 30 119 Slurry
Spring cereals 100 20 79 Slurry
Grass-clover 0 0 0
Annual means 100 20 80
1 FYM Winter cereals 150 7 160 Liquid manure
Root crops 150 44 95 Solid manure
Spring cereals 100 29 62 Solid manure
Grass-clover 0 0 0
Annual means 100 20 80
The introduction of semi-permanent grass strips between plots occurred in the B4-field in 1997 to test
the practical implications for fieldwork (Figure 8). The intention behind grass strips was to reduce the
effect of tillage-mediated transfer of soil and substances across plot borders. The establishment of the
grass strips were in the autumn following the drilling of winter wheat. The tillage applied after harvest
of winter-cereals was confined to the central part of the plots leaving 1.7 m (east - west) and 1.9 m (north-

29
south) wide grass strips intact. The strips remained intact during the next crops of the rotation and
terminated in the early autumn by ploughing before the next winter wheat crop was established. The
tillage system left the grass strips intact in years when spring-sown cereals and root crops were grown.
The use of grass strips ceased in 2018. In practice, the tillage system implemented within the grass
borders was difficult to align with the tillage applied in the other fields.
Figure 8. Outline of a single plot showing the position and dimension of grass strips introduced in the B4-field in 1997. The use of grass strips ceased in 2018.
1.90 m
1.68 m 7.50 m
PLOT 10.00 m
GRASS STRIP
1.90 m
1.68 m 7.50 m
PLOT 10.00 m
GRASS STRIP

30
General field management
Tillage and drilling implements and operations, weed control and crop protection measures against
fungi and insects, choice of crop cultivars and liming practice follow the general trends in agriculture.
Thus, the agronomy of the Askov-LTE align with that of mainstream Danish agriculture. One notable
exception is the composition of the grass-clover mixture kept unchanged since 1949. Other changes in
the general management rely on scientifically well-documented crop management and have been
implemented only after a given agronomic practice is thoroughly tested and adopted in general
agriculture. Therefore, the history of field operations adopted in the experiments reflects the general
development in agriculture and accordingly field operations have experienced a continuous change in
time. This section is, however, limited to a brief outline of the current field operations.
Tillage: All tillage operations are parallel to plot borders. In the B2w-, B2e-, B4- and B5-fields, the
direction of ploughing alternates north - south and south - north, starting on the east or on the west side
of a field, respectively. The B3-field follows a similar design but with the ploughing direction alternating
between east - west and west - east. Ploughing occurs with a standard, tractor pulled mouldboard plough
in March/April for spring-sown crops, and in September for autumn sown crops. Ploughing depth is
adapted to the depth of the Ap-horizon which typically 18 - 20 cm.
Crop planting: Planting of cereals is with 12.5 cm inter-row distance. Winter wheat is sown medio
September while spring sown cereals is sown in March/April. Planting of maize occurs early May when
soil temperatures have reached ~10 oC. For silage maize, the row-distance is 75 cm with a target plant
density of 110,000 plants ha-1.
Crop protection: The use of herbicides, fungicides and insecticides at recommended rates occurs
when observations in the field indicate that significant attacks are expected.
Liming: Application of Mg-enriched lime at a rate of 3 to 5 t ha-1 takes place every four-to-fifth year to
maintain pH (CaCl2) between 5.5 and 6.5 in the plough layer.
Nutrient addition: Application of mineral fertilizers and animal manure (for winter wheat) occurs
when crop growth commences in March/April. Manual slurry application relies on a tractor-driven
pump and a hand-held surface spreader. For winter wheat, the application of slurry is by surface
spreading beneath the growing crop canopy. For spring-sown crops, surface spreading of slurry also
occurs in March/April and the soil ploughed immediately after to minimize ammonia volatilization.
Nitrogen, P and K in mineral fertilizers are added individually. The source of N is calcium ammonium
nitrate (NH4NO3 + CaCO3; c. 26% N) while the sources of P and K are triple-superphosphate (20% P,
~1% S) and potassium chloride, respectively. Before 2006, the P fertilizer was superphosphate (8 % P,
~12 % S). To compensate for the reduced S input from the atmosphere (Table 1), the Lermarken site has
during 2004-2011 been fertilized with 20 kg S ha-1 yr-1 by spraying elementary S (80% S) early in the

31
spring onto the winter cereal and the grass-clover crops and onto the soil surface before ploughing for
spring cereals and silage maize. In 2012, the annual S application was reduced to 12.5 kg S ha-1.
Crop harvest: Experimental harvest for yield determination occurs in the net plots (see Table 4). The
grass-clover crop is cut twice in the production year, the first cut in June and last in late August
depending on crop development. The grass-clover is harvested with a plot forage harvester and the
biomass removed from the plots immediately after cutting. Cereals are harvested with an experimental
plot combiner allowing yields of grain and straw to be determined separately, leaving 5-10 cm stubbles.
Removal of cereal straw occurs shortly after harvest. The maize is whole crop harvested in early to mid-
October, when the crop becomes senescent due to adverse climatic conditions. At that stage, the crop
dry matter content typically ranges from 25 to 35% depending on nutrient treatment. The whole-crop
plot harvester leaves approximately 15 cm stubbles.
Following harvest of crops, the field (and stubbles) remains undisturbed until ploughing. The grass-
clover sward left after the second cut in the production year is allowed a short re-growth period before
being sprayed with a full spectra herbicide. After the herbicide effect has been achieved, the field is
ploughed, rolled and the seedbed prepared for winter wheat.
Mini-plots with ancient cereal types
(emmer, spelt and naked barley)
embedded in selected treatments
show how the Askov-LTE add to
archaeological research

32
All methods are available for seeding – the choice depends on purpose.
33
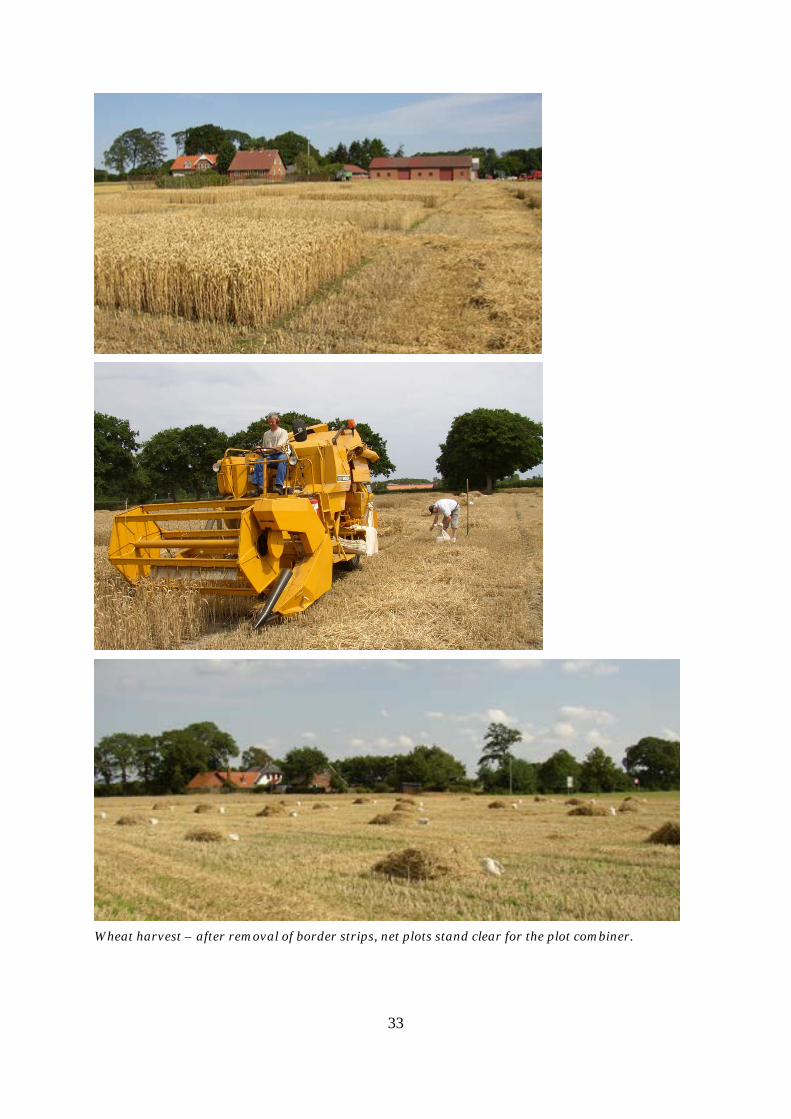
Wheat harvest – after removal of border strips, net plots stand clear for the plot combiner.

34
Sampling and data
Crop samples from each replicate treatment plot are dried at 80 oC, ground, and subsequently pooled in
proportion to the yield obtained on individual plots (Pooled sample I). These samples, representing a
given crop, treatment, and field for a specific year, are stored in the sample archive. With the Pooled
sample I kept in stock, crop material is available for subsequent analyses in specific projects. By the end
of a four-year crop rotation, sub-samples of the four Pooled sample I are now pooled by treatment and
crop in proportion to the annual yields (Pooled sample II). These samples are routinely analysed for
nitrogen. Previously, samples were subject to analyses for a range of other elements. The remaining
material is stored in the archive.
Soil samples retrieved from each individual plot every 4 year are dried at 40 oC, sieved to < 2 mm, and
subject to analysis for C content. Previously a more comprehensive analytical scheme was applied. The
soil archive contains dry soils retrieved since 1923, and for most years, samples from each replicate plot
are available for subsequent studies.
The samples stored in the archive represent one most valuable asset of the Askov-LTE. Archived samples
can be analysed in future projects in contexts and for properties unforeseen at the time when samples
were collected. Until 1989 the recorded data of soil analysis (every fourth year) and crop yields
(annually) represent the treatments by each field, but from the rotation starting in 1989 the recordings
are stored by each replicate plot. Thus, from 1989 it is possible to apply detailed analysis of variance.

35
Current crop yields (2006-2018)
Figures 9, 10 and 11 show crop yields obtained during the period 2006-2018 for spring barley, winter
wheat, silage maize and grass-clover subject to increasing rates of nitrogen, phosphorus and potassium
in cattle slurry (AM) or mineral fertilizers (NPK). For each crop, the figures present yields averaged
across the period and obtained in the B2w-, B2e-, B3- and B5-fields. During this period, the crops
present in the rotation, the type of animal manure, and the rates and distribution of nutrients among
crops have remained unchanged (see Table 7). The rate of nitrogen added with AM relates to the total-
N content in cattle slurry of which only 60-65 % is present as ammoniacal N at the time of application.
The direct effect of N at a given rate of AM is therefore smaller than that of a similar rate of N in mineral
fertilizers. For winter wheat, ammonia volatilization from the surface applied slurry may further reduce
the direct effect of AM on crop yields.
Although annual crop yields are recorded separately for each treatment in each field, the yields for
individual crops are presented in this report as rotational means. Thus, crop yields are averaged over
four year periods, whereby annual variations in growth conditions and variations in soil properties of
individual fields are levelled out. This also reduces fluctuations in yields due to extreme weather
conditions.
Figure 9. Yields of spring barley grain and straw obtained with increasing rates of nutrients added with mineral fertilizers (NPK) or animal manure (AM; cattle slurry). Yields are average of the period 2006-2018 for barley grown on the B2w-, B2e-, B3- and B5-fields.

36
For spring barley (Figure 9), maximum grain yield (5.91 t ha-1) is obtained at the rate 1½ NPK
(corresponding to 150 kg N ha-1) while the grain yield for AM treatments does not reach a maximum
even with 2 AM (corresponding to 200 kg total-N ha-1). The response of straw to increasing rates of
nutrient addition is much smaller than the response obtained in grain yields. Straw yields range from
2.45 to 3.75 t ha-1. For soil kept without manure and fertilizer for > 120 years, the grain and straw yields
are 1.46 and 1.02 t ha-1, respectively. Thus, the addition of relevant rates of NPK gave a four-fold increase
in grain yield.
Figure 10. Yields of winter wheat grain and straw obtained with increasing rates of nutrients added with mineral fertilizers (NPK) or animal manure (AM; cattle slurry). Yields are average of the period 2006-2018 for wheat grown on the B2w-, B2e-, B3- and B5-fields.
Grain yield for winter wheat (Figure 10) is very similar for wheat treated with mineral fertilizers at the
rates 1, 1½ and 2 NPK (range 7.97 to 8.14 t ha-1). These NPK rates correspond to an addition of 150, 225
and 300 kg N ha-1. The grain yield level is three times higher than yields obtained on unmanured plots
(2.62 t ha-1). In the rotation, winter wheat follows ploughing of the grass-clover sward whereby the
wheat, in contrast to spring barley, gains a residual N effect. Wheat grain yields on unmanured plots
probably benefits more from the residual N effect following the termination of the grass-clover crop than
wheat grown on plots receiving adequate levels of NPK. Grain yields for AM treatments were somewhat
smaller (5.98, 6.96 and 7.41 t ha-1 for 1, 1½ and 2 AM, respectively). Generally, straw yields for winter
wheat were higher than yields observed for spring barley.
In contrast to cereal crops, silage maize responded more to AM than to NPK additions (Figure 11). For
NPK yields peaked at 1½ and 2 NPK (corresponding to 225 and 300 kg N ha-1) with similar dry matter
yields (12.1 t ha-1) while 1½ AM and 2 AM provided higher dry matter yields (13.9 and 15.1 t ha-1,
respectively). The yield on 2 AM plots was more than 4 times higher than yields on unmanured plots
(3.5 t ha-1). The more positive response of silage maize to addition of AM may relate to a higher growth
rate and nutrient uptake later in the growth period when more of the N added with manure and released
from the soil N pool has become plant available. Moreover, treatments with AM receive an additional
input of micronutrients. These could provide a larger benefit to maize than to cereals.

37
Figure 11. Dry matter yields of silage maize and grass-clover obtained with increasing rates of nutrients added with mineral fertilizers (NPK) or animal manure (AM; cattle slurry). Yields are average of the period 2006-2018 for crops grown on the B2w-, B2e-, B3- and B5-fields.
Figure 12. Yields of spring barley grain and straw obtained in treatments with mineral fertilizer N, P and K, added individually or in combinations of two or three. Yields are average of the period 2006-2018 for barley grown on the B2w-, B2e-, B3- and B5-fields.
The grass-clover crop receives no direct addition of nutrients in NPK or AM but rely on leguminous N2-
fixation from the atmosphere and on P and K left from nutrients added to the other crops in the rotation.
The grass-clover yields presented in Figure 11 is the summation of the two cuts taken in the production
year. The yield obtained on unmanured plots (3.6 t ha-1) is close to that obtained for similarly treated
silage maize but considerably smaller than yields obtained for treatments with AM and NPK added to
the preceding crops in the rotation. The plots with 1½ AM showed maximum dry matter yields (8.8 t
ha-1) while the 1½ NPK treatment gave considerably lower yields (6.0 t ha-1). In general, however, the
yield of the grass-clover crop responded little to differences in preceding nutrient treatments, not
38
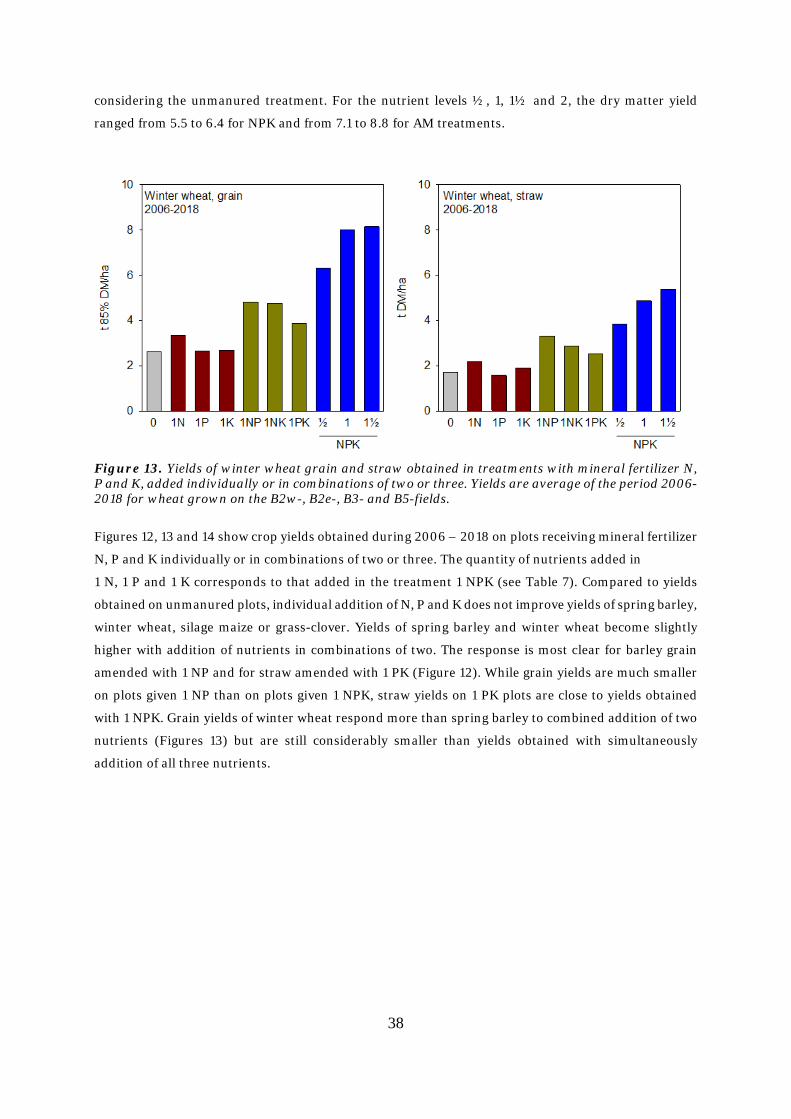
considering the unmanured treatment. For the nutrient levels ½, 1, 1½ and 2, the dry matter yield
ranged from 5.5 to 6.4 for NPK and from 7.1 to 8.8 for AM treatments.
Figure 13. Yields of winter wheat grain and straw obtained in treatments with mineral fertilizer N, P and K, added individually or in combinations of two or three. Yields are average of the period 2006-2018 for wheat grown on the B2w-, B2e-, B3- and B5-fields.
Figures 12, 13 and 14 show crop yields obtained during 2006 – 2018 on plots receiving mineral fertilizer
N, P and K individually or in combinations of two or three. The quantity of nutrients added in
1 N, 1 P and 1 K corresponds to that added in the treatment 1 NPK (see Table 7). Compared to yields
obtained on unmanured plots, individual addition of N, P and K does not improve yields of spring barley,
winter wheat, silage maize or grass-clover. Yields of spring barley and winter wheat become slightly
higher with addition of nutrients in combinations of two. The response is most clear for barley grain
amended with 1 NP and for straw amended with 1 PK (Figure 12). While grain yields are much smaller
on plots given 1 NP than on plots given 1 NPK, straw yields on 1 PK plots are close to yields obtained
with 1 NPK. Grain yields of winter wheat respond more than spring barley to combined addition of two
nutrients (Figures 13) but are still considerably smaller than yields obtained with simultaneously
addition of all three nutrients.

39
Silage maize requires its own line of harvesters.

40
Compared with unmanured treatment, additions of N, P and K alone and in the combination NP or NK
have little effect on yields of silage maize (Figure 14). In contrast, maize yields almost double when
grown with 1 PK and become similar to yields on plots receiving ½ NPK. This suggests that for this
particular crop of sub-trophic origin, the abundance of sufficient levels of plant available P and K is more
important than for the traditional temperate cereals (barley and wheat). However, optimum yields
require a simultaneous and adequate addition of N, P, and K.
Figure 14. Dry matter yields of silage maize and grass-clover obtained in treatments with mineral fertilizer N, P and K, added individually or in combinations of two or three. Yields are average of the period 2006-2018 for crops grown on the B2w-, B2e-, B3- and B5-fields.
The grass-clover crop does not receive direct inputs of nutrients in mineral fertilizers or animal manure,
and the yields presented in Figure 14 reflects the residual effects of previous additions and the ability of
the clover component to fix atmospheric N2. Adding N, P or K alone or the combinations NP or NK does
not affect yields compared to yields achieved on unmanured plots. The largest forage yield was on plots
with the combination PK showing that the supply of P and K allows for leguminous N2-fixation. Since
the lack of N in the PK treatment limits the removal of P and K with the other crops in the rotation, the
PK treatment has accumulated more P and K than treatments dressed with NPK. However, the general
yield level of the grass-clover remains moderate, as this crop receives no direct input of nutrients in
mineral fertilizers or animal manure. The original grass-clover mixture was designed for production of
hay, using two cuts only. Today, grass-clover crops are based on white- and/or red clover dressed with
200-300 kg N ha-1 and harvested in green conditions in 4 to 5 cuts.
41
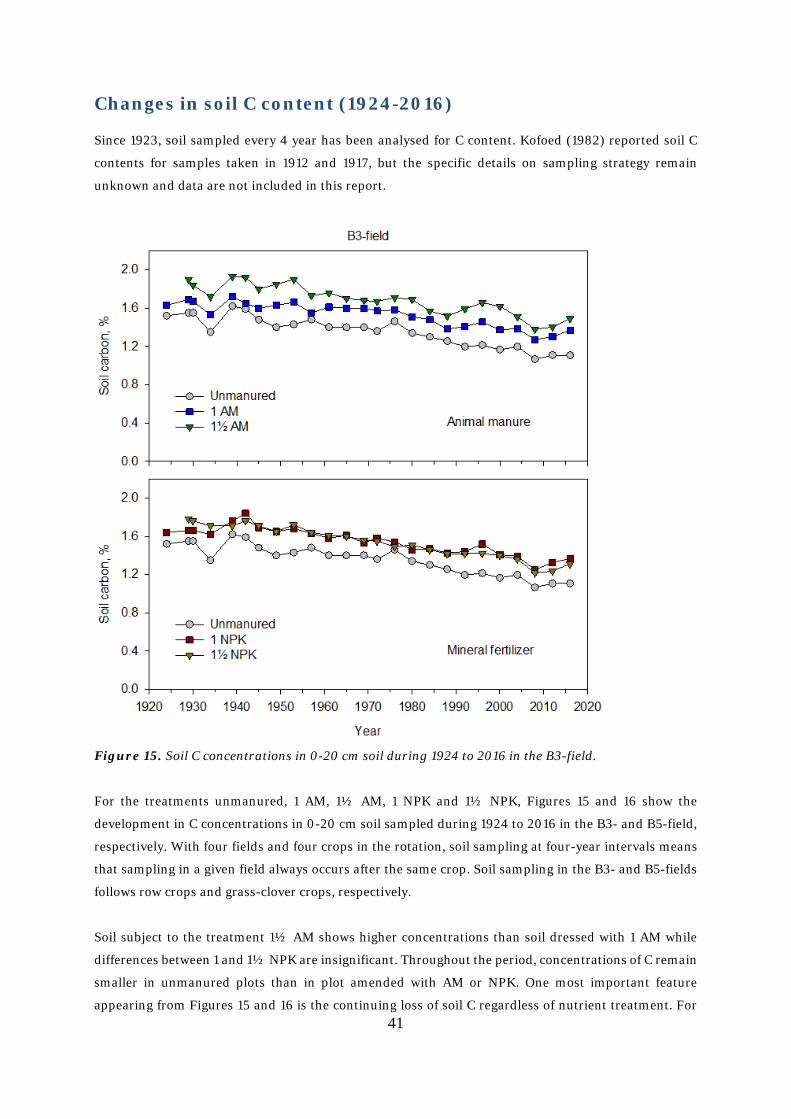
Changes in soil C content (1924-2016)
Since 1923, soil sampled every 4 year has been analysed for C content. Kofoed (1982) reported soil C
contents for samples taken in 1912 and 1917, but the specific details on sampling strategy remain
unknown and data are not included in this report.
Figure 15. Soil C concentrations in 0-20 cm soil during 1924 to 2016 in the B3-field.
For the treatments unmanured, 1 AM, 1½ AM, 1 NPK and 1½ NPK, Figures 15 and 16 show the
development in C concentrations in 0-20 cm soil sampled during 1924 to 2016 in the B3- and B5-field,
respectively. With four fields and four crops in the rotation, soil sampling at four-year intervals means
that sampling in a given field always occurs after the same crop. Soil sampling in the B3- and B5-fields
follows row crops and grass-clover crops, respectively.
Soil subject to the treatment 1½ AM shows higher concentrations than soil dressed with 1 AM while
differences between 1 and 1½ NPK are insignificant. Throughout the period, concentrations of C remain
smaller in unmanured plots than in plot amended with AM or NPK. One most important feature
appearing from Figures 15 and 16 is the continuing loss of soil C regardless of nutrient treatment. For

42
the B3-field, changes in soil C concentrations correspond to an annual loss of 125 to 180 kg C ha-1 while
the treatments in the B5-field show annual losses ranging from 95 to 125 kg C ha-1.
Figure 16. Soil C concentrations in 0-20 cm soil during 1924 to 2016 in the B5-field.
Other long-term experiments show similar slow, but long continuing, losses of C from arable soils of
similar texture and with similar management (Poulton et al., 2017). The Askov-LTE on Sandmarken
shows an annual mean loss of 100 kg C ha-1 during the period 1942 to 2012 when Sandmarken was in
arable rotation (Hu et al., 2019). Obviously, these small annual losses become measurable only in studies
based on long-term data series. In the national square grid-monitoring network, annual loss from the
0-100 cm soil profile of agricultural mineral soils in Denmark averaged 200 kg C ha-1 in the period from
1986 to 2009 (Taghizadeh-Toosi et al., 2014).
It is ventured that the continuous decline in soil C in all fields and treatments ascribes to a continuing
decline in the pool of native soil organic matter, derived from the vegetation that preceded the initial
cultivation of the Lermarken site in 1801. It may be that differences in soil C contents between different
nutrient treatments were established already in 1923, and that those differences have hardly changed
since then. This suggests that equilibrium between inputs of C to the soil organic matter, derived from

43
input of crop residues and animal manure, and outputs of C, related to the ongoing decomposition of
the soil organic matter was reached for each treatment within the 30 years that preceded the first regular
sampling of soil in 1924. While differences between contents of C in soil receiving animal manure relate
to the amount of manure added, levels of C in soils amended with mineral fertilizer do not reflect
different rates of NPK.
The Askov-LTE housed some of the
first experiments with stable and
radioactive isotopes used as tracers
including highly radioactive 32P –
safety regulations probably followed
official 1958 standards

44
Development in crop yields (1894-2017)
Figures 17 and 18 show grain yields for spring and autumn sown cereals averaged across the 4-year
rotation. Yields for the period 1894-1972 rely on the B2- B3- and B5-fields while yields from 1973 to
2017 include results from the B2e-, B3- and B5-fields. To facilitate interpretation of yield results, vertical
lines divide the entire period into periods differing in the quantity of nitrogen (and P and K) added in a
given nutrient treatment (see Table 7).
Figure 17. Grain yield of spring-sown cereals averaged across the B2-, B3- and B5-fields. Boxed numbers in top of each panel show the amount of nitrogen added in 1 AM and 1 NPK in the given period (see Table 7; *) N added in calcium nitrate). Vertical dotted line shows the change in application time for AM (cattle slurry) and ploughing from autumn/winter to March/April implemented in 1989.
Numbers in the top of each panel show the amount of nitrogen given in 1 AM and 1 NPK to the specific
crop in the period. The dotted vertical line indicates that application of AM (cattle slurry) changed from
autumn/winter to spring, providing a higher use efficiency of nitrogen applied in slurry. Before 1989,
the addition of cattle slurry to winter wheat took place in the early autumn before planting, while slurry
addition to spring sown crops (spring cereals and root crops) was in late autumn/early winter before
ploughing. In contrast, applications of mineral fertilizer were in the spring. The pre-1989 strategy for
slurry application left a considerable potential for loss of nitrogen by nitrate leaching from the AM
treatments during the winter period. From 1989, slurry application occurs in March/April.

45
Determination of the effect of soil organic matter on tillage draught requires manpower.
46
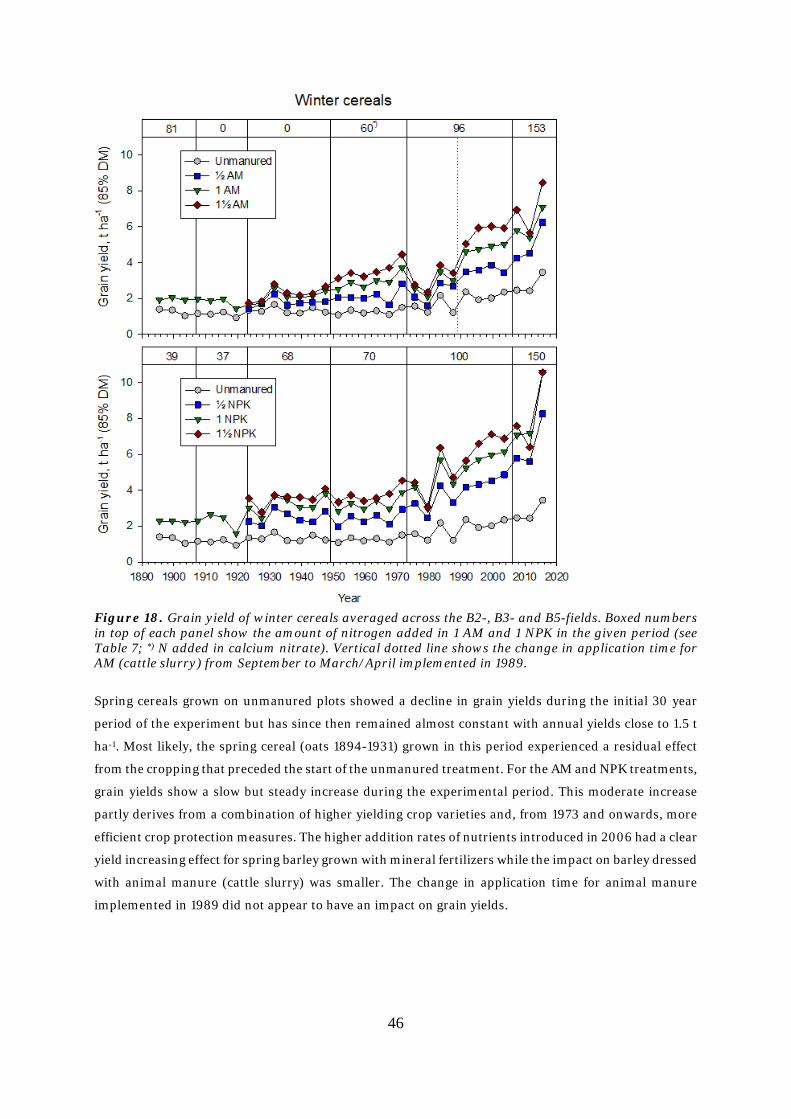
Figure 18. Grain yield of winter cereals averaged across the B2-, B3- and B5-fields. Boxed numbers in top of each panel show the amount of nitrogen added in 1 AM and 1 NPK in the given period (see Table 7; *) N added in calcium nitrate). Vertical dotted line shows the change in application time for AM (cattle slurry) from September to March/April implemented in 1989.
Spring cereals grown on unmanured plots showed a decline in grain yields during the initial 30 year
period of the experiment but has since then remained almost constant with annual yields close to 1.5 t
ha-1. Most likely, the spring cereal (oats 1894-1931) grown in this period experienced a residual effect
from the cropping that preceded the start of the unmanured treatment. For the AM and NPK treatments,
grain yields show a slow but steady increase during the experimental period. This moderate increase
partly derives from a combination of higher yielding crop varieties and, from 1973 and onwards, more
efficient crop protection measures. The higher addition rates of nutrients introduced in 2006 had a clear
yield increasing effect for spring barley grown with mineral fertilizers while the impact on barley dressed
with animal manure (cattle slurry) was smaller. The change in application time for animal manure
implemented in 1989 did not appear to have an impact on grain yields.

47
Figure 19. Forage yield for grass-clover during 1949 to 2017 based on the six-species mixture introduced in 1949 (see Table 6) and averaged across the B2-, B3- and B5-fields. Boxed numbers in top of each panel indicate that the grass-clover crop does not receive direct nutrient inputs in the production year (see Table 7).
During 1894-1980, yields of winter cereal grains remained almost constant around 1.5 t ha-1 on
unmanured plots. Since then grain yields of winter wheat have increased reaching 2.6 t ha-1 (average of
the period 2006-2018). The increase for unmanured treatment reflects better crop varieties and better
general field management including more efficient plant protection measures. For the AM it is recalled
that winter cereals received no direct inputs of nutrient during the period 1907-1972, except for a small
addition of N in calcium nitrate (and no P and K) during 1949-1972. Grain yields in treatments receiving
AM in the form of cattle slurry tend to drop and stagnate from 1973, when autumn applied slurry
replaced autumn applied farmyard manure and the supplement of N in calcium nitrate ceased, until
1989 when slurry became surface applied in the spring before crop growth commenced. The steady
increase seen for wheat grown with mineral fertilizer followed the increase in grain yield initiated in
1989 in the AM amended plots. The effect of increased nutrient addition rates launched in 2006 further
added to grain yield levels, the most marked response seen for wheat grown with mineral fertilizers.
48
Although winter cereals follow termination of the grass-clover crop and benefit from this crop in terms
of residual N effect, the rate of nutrients added in 1 NPK and 1 AM is smaller than recommended for
optimum yields. During the most recent period, wheat subject to 1 NPK and 1 AM receives 150 kg total-
N ha-1. For the period 2006-2018, this N level seem optimal as no further increase in grain yield was
seen for the treatments 1½ and 2 NPK (Figure 10). However, for wheat dressed with AM, yields
increased up to 2 AM (300 kg total-N ha-1), representing 180-195 kg ha-1 in ammoniacal-N of which some
will be subject to volatilization after surface spreading in the spring.
For the grass-clover crop, Figure 19 shows forage yields only for the period 1949-2017 for which the
botanical composition of the grass-clover remained the same. The grass-clover received no direct
nutrient inputs in the production year (Table 7), except for the period 1949-1972 where grass-clover
grown on NPK plots received K also in the production year. Therefore, yield levels are substantially
smaller than obtained under current farming conditions. The botanical composition introduced in 1949
(Table 6) targeted forage harvested as hay, that is the forage being cut and left to dry in the field before
removal. Further, the mix of legume species and grass species theoretically allow favourable growth
conditions for at least one legume and one grass species regardless of soil moisture and nutrient status.
However, the grass-clover crop shows great variability in forage yield most likely ascribed to sensitivity
to weather conditions in the growth period. The 2006-2018 average forage yield for unmanured
treatment is 3.6 t ha (2.2 t ha-1 for the first cut and 1.4 t ha-1 for the second cut). Although the grass-
clover mixture used since 1949 consists of three grasses and three N2-fixing legumes having different
characteristics to ensure establishment and growth under variable climate conditions, the period 1977-
1980 had extremely dry summers. This may at least partly explain the observed yield depressions.

49
Reflections and outlook
The historical information on the Askov-LTE presented in this report relies heavily on previous main
accounts of the experiments. Key publications were Hansen (1900), Hansen & Hansen (1913), Iversen
(1927, 1932), Iversen & Dorph-Petersen (1951), Kofoed & Nemming (1976), and an unpublished
manuscript by O. Nemming accounting for crop yields during 1949-1972. Extracts from field and
laboratory logbooks and annual field plans provided additional information. Some of this information
has previously been reported (Christensen et al., 1994, 2006). The present report adds to this previous
reporting and synthesizes information on historical plot treatments.
Most long-term experiments were not planned to become long-term and were set up to serve purposes
that differ from those that typical apply today. When originally designed, the expectations were for the
experiments to continue for a limited number of years and more or less by chance, they became long-
term as time passed by. This is also true for the field experiments initiated in Askov in 1894. Although
the experiments were to run for a number of years, the initiators did not expect them to continue for
more than 125 years. The official Annual Work plan for 1900-1901 states that the experiments continue
until 1904. Subsequent Annual Work plans postponed the termination several times and for various
reasons. Finally, the plan for 1914 just note that the experiments continue until further notice.
The present use of existing long-term field experiments, set up for a much shorter time perspective than
came to apply, are often met with some restrictions. These may relate to samples and data missing from
the early periods of the experiments, to undocumented changes in treatments and in soil and crop
sampling procedures, to lack of information on overall field management, and to lack of treatment
replications. For the Askov-LTE, lack of soil samples for the period 1894-1923 is an issue, while detailed
information on crops, nutrient additions, and field management is available. The core treatments of the
Askov-LTE relate to plant nutrient additions in mineral fertilizers and animal manure. An adequate
supply of nutrients remains high priority for sustainable agriculture as it relates to crop productivity,
soil quality, and interactions between agriculture, environmental quality and climate change. The
experimental layout with four blocks and treatment replicates within each block remains a most valuable
asset of the Askov-LTE allowing for proper testing the significance of treatment effects.
Threats to long-term field experiments include subdivisions of original plots to accommodate new
treatments or to provide pseudo-replicates of original treatments and changes in experimental plan with
the original treatments overlaid or replaced by other treatments. Subdivisions and additional overlaying
treatments that compromised the original treatments has led to termination of long-term experiments
because plot sizes became too small and/or the cost to maintain the increased number of treatments
became too high. When the Askov-LTE hosts short-term studies based on subdivision of main plots or
on mini-plots with crops not included in the crop rotation, the changes must not compromise the
continuity of the original treatment.

50
Tansley (1935) introduced the ecosystem concept and stressed the importance of interactions between
its living (e.g. plant communities) and non-living components (e.g. soil). The agroecosystem provides a
conceptual framework for studying the behaviour of an ecosystem subject to deliberate and purposeful
manipulations (e.g. additions of plant nutrients). An agricultural field experiment with long-continued
treatments represents an agroecosystem with well-defined boundaries essential to study interactions
between manipulations, soil properties, crop behaviour and the environment. Long-term field
experiments accumulate the history of abiotic-biotic interaction, and it is widely recognized that well-
managed long-term field experiments are invaluable sources of information on soil properties that
change slowly over long periods. One example is the assessment of changes in soil organic matter
content, another is the slow but essentially irreversible accumulation of heavy metals added in mineral
fertilizers and animal manures.
While unplanned circumstances saved the experiments from termination in the early years, the long-
term commitment of project leaders trusted the overall responsibility of the Askov-LTE has most likely
added to their survival in time. Just four project leaders (Frederik Hansen, 1894-1921; Karsten Iversen,
1921-1956; Axel Dam Kofoed, 1956-1987; Bent T. Christensen, 1987-2019) have shared the commitment
during the past 125 years, each being in charge for a period of some 30 years. However, without the
meticulous effort by the former and present technical staff at Askov Experimental Station, arguments
for keeping the experiments would be much less convincing. Combined with the increasing international
awareness of the research potential embedded in the experiments and the increasing scientific output
in diverse disciplines, the Askov-LTE remains a unique research facility. As societal preferences continue
to change, and as theory and analytical potentials continue to develop, there can be little doubt that the
future will see studies in very diverse research areas that explore and benefit from the unique potential
embedded in the Askov-LTE.
51
References
Christensen, B.T. & Trentemøller, U. (Eds.) (1995): The Askov Long-Term Experiments on Animal Manure and Mineral Fertilizers – 100th Anniversary Workshop. SP-Report no. 29. Danish Institute of Plant and Soil Science, Tjele, Denmark. Christensen, B.T., Petersen, J. & Trentemøller, U.M. (2006): The Askov Long-Term Experiments on Animal Manure and Mineral Fertilizers: The Lermarken site 1894-2004. DIAS Report No. 121, Danish Institute of Agricultural Sciences, Tjele, Denmark. Christensen, B.T., Petersen, J., Kjellerup, V. & Trentemøller, U. (1994): The Askov Long-Term Experiments on Animal Manure and Mineral Fertilizers: 1894-1994. SP-report No. 43, Danish Institute of Plant and Soil Science, Lyngby, Denmark. Ellermann, T., Andersen, H.V., Bossi, R., Christensen, J., Frohn, L.M., Geels, C., Kemp, K., Løfstrøm, P., Mogensen, B.B. & Monies, C. (2007): Atmospheric deposition 2006. Scientific Report no. 645 (in Danish). Danmarks Miljøundersøgelser, Aarhus University, Aarhus. Ellermann, T., Bossi, R., Nygaard, J., Christensen, J., Løfstrøm, P., Monies, C., Grundahl, L., Geels, C., Nielsen, I.E. & Poulsen, M.B. (2018): Atmospheric deposition 2016. Scientific Report no. 264 (in Danish). DCE Nationalt Center for Miljø og Energi. Aarhus University, Aarhus. Grundahl, L. & Hansen, J.G. (1990): Atmospheric deposition of nutrients in Denmark (in Danish). NPo-report no. A6, Miljøministeriet, København. Hansen, F. (2000): Beretning fra forsøgsstationen ved Askov. Tidsskrift for Landbrugets Planteavl 6, 82-96. Hansen, F. & Hansen, J. (1913): Gødningsforsøg på forsøgsstationen ved Askov 1894-1910. Tidsskrift for Planteavl 20, 345-539. Hansen, L. (1976): Soil types at the Danish State Experimental Stations (in Danish with English summary). Tidsskrift for Planteavl 80, 742-758. Hu, T., Taghizadeh-Toosi, A., Olesen, J.E., Jensen, M.L., Sørensen, P. & Christensen, B.T. (2019): Converting temperate long-term arable land into semi-natural grassland: decadal-scale changes in topsoil C, N, 13C and 15N contents. European Journal of Soil Science (in press). Iversen, K. (1927): Gødningsforsøg på forsøgsstationerne ved Askov and Lyngby. Tidsskrift for Planteavl 33, 557-752. Iversen, K. (1932): Forsøg med ensidig kunstgødning. Askov 1894-1930. Tidsskrift for Planteavl 38, 537-612. Iversen, K. & Dorph-Petersen, K. (1951): Forsøg med staldgødning og kunstgødning ved Askov 1894-1948. Tidsskrift for Planteavl 54, 369-538. Johnston, A.E. (1994): The Rothamsted Classical Experiments. In Eds. R.A. Leigh and A.E Johnston: Long-Term Experiments in Agricultural and Ecological Sciences, pp. 9-37. CAB International, Wallingford, Oxon, UK. Kofoed, A. D. (1982): Humus in long term experiments in Denmark. In Eds. D. Boels, D.B Davies & A.E. Johnston: Soil Degradation – Proceedings of the Land Use Seminar on Soil Degradation, Wageningen, 13-15 October 1980. Pp. 241-258. A.A. Balkema, Rotterdam, The Netherlands. Kofoed, A.D. & Nemming, O. (1976): Askov 1894 – Fertilizers and manure on sandy and loamy soils. Annales Agronomique 27, 583-610. Larsen, H.C. (1923): The State Research Service in Plant Culture – Its Organization and Administration (in Danish). Gyldendalske Boghandel, Nordisk Forlag, Copenhagen. Maar, V. E. (1888): Report on the research field of The Royal Veterinary and Agricultural University for 1883-1887 (in Danish). Thieles Bogtrykkeri, Boghandler Th. Lind, Copenhagen. Møberg, J.P. & Nielsen, J.D. (1986): The mineralogical composition of soil from Danish experimental stations (in Danish with English summary). Tidsskrift for Planteavls Specialserie, Report no. S 1870. Statens Planteavlsforsøg, Copenhagen. Nielsen, J.D. & Møberg, J.P. (1984): Classification of 5 soil profiles from experimental stations in Denmark (in Danish with English summary). Tidsskrift for Planteavl 88, 155-167. Poulton, P., Johnston, J., Macdonald, A., White, R. & Powlson, D. (2017): Major limitations to achieving “4 per 1000” increases in soil organic carbon stocks in temperate regions: Evidence from long-term experiments at Rothamsted Research, United Kingdom. Global Change Biology 24, 2563-2584. Sundberg, P.S., Callesen, I., Greve, M.H. & Raulund-Rasmussen, K. (1999): Danish soil profiles. Danmarks JordbrugsForskning, Tjele, Denmark. Taghizadeh-Toosi, A., Olesen, J.E., Kristensen, K., Elsgaard, L., Østergaard, H.S., Lægdsmand, M., Greve, M.H. & Christensen, B.T. (2014): Changes in carbon stocks of Danish agricultural mineral soils between 1986 and 2009. European Journal of Soil Science 65, 730-740. Tansley, A.G. (1935): The use and abuse of vegetational concepts and terms. Ecology 16, 284-307.

52
The summer was hot and dry in 2018 in
Denmark – much appreciated by the millet
grown in mini-plots in selected treatments
to serve studies in archaeology
53
Appendix A: Historical changes in treatments on Lermarken:
1894-1956
Today the Lermarken site consists of four separate fields termed B2 (divided into B2w and B2e), B3, B4
and B5. Not all of the treatments and treatment replicates in the Askov long-term experiments were
established in 1894 (1893 for unmanured). The treatments/plot replicates established later replaced
previous treatments and this appendix presents an account of the history of all plots added 1894-1956.
During 1894-1906, one more field (B1) was included in the experiments on Lermarken allowing a 2nd
year grass-clover crop. For reasons unknown the B1-field was excluded in 1907, and since then the two
experimental sites, Lermarken and Sandmarken (see Appendix B), both encompassed four-course crop
rotations. Historical changes in treatments have differed for the different fields on Lermarken therefore,
each B-field is treated separately.
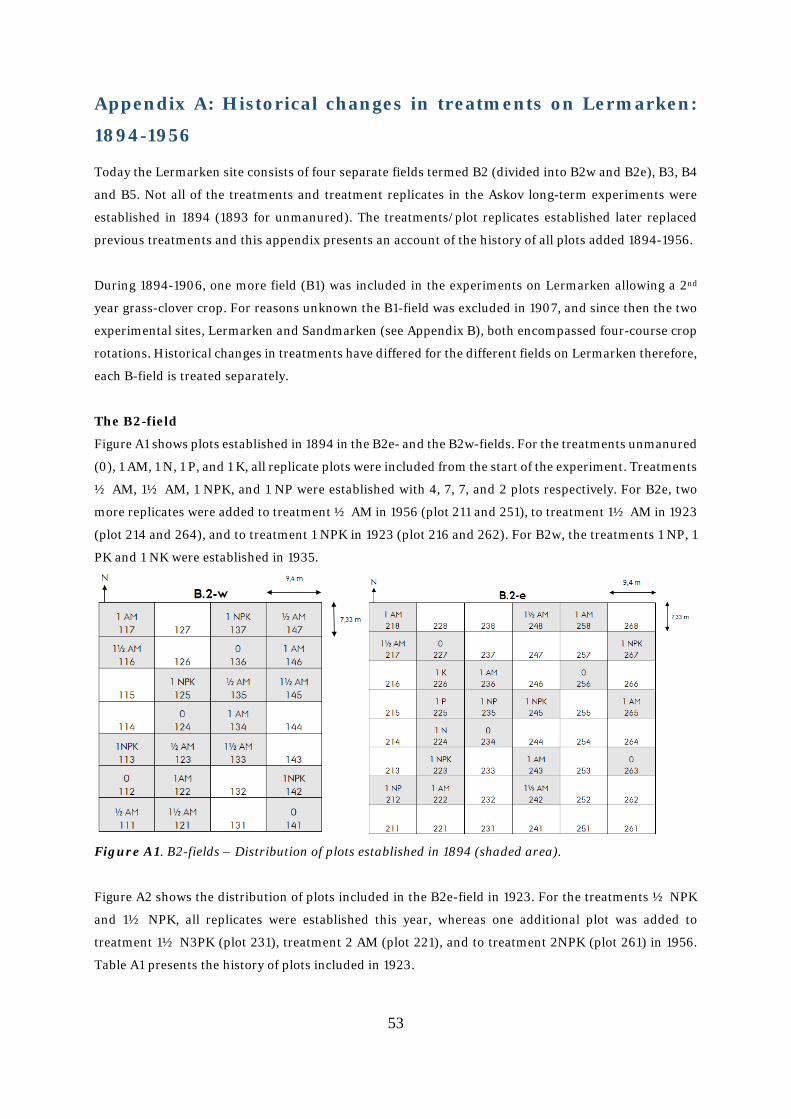
The B2-field
Figure A1 shows plots established in 1894 in the B2e- and the B2w-fields. For the treatments unmanured
(0), 1 AM, 1 N, 1 P, and 1 K, all replicate plots were included from the start of the experiment. Treatments
½ AM, 1½ AM, 1 NPK, and 1 NP were established with 4, 7, 7, and 2 plots respectively. For B2e, two
more replicates were added to treatment ½ AM in 1956 (plot 211 and 251), to treatment 1½ AM in 1923
(plot 214 and 264), and to treatment 1 NPK in 1923 (plot 216 and 262). For B2w, the treatments 1 NP, 1
PK and 1 NK were established in 1935.
Figure A1. B2-fields – Distribution of plots established in 1894 (shaded area).
Figure A2 shows the distribution of plots included in the B2e-field in 1923. For the treatments ½ NPK
and 1½ NPK, all replicates were established this year, whereas one additional plot was added to
treatment 1½ N3PK (plot 231), treatment 2 AM (plot 221), and to treatment 2NPK (plot 261) in 1956.
Table A1 presents the history of plots included in 1923.
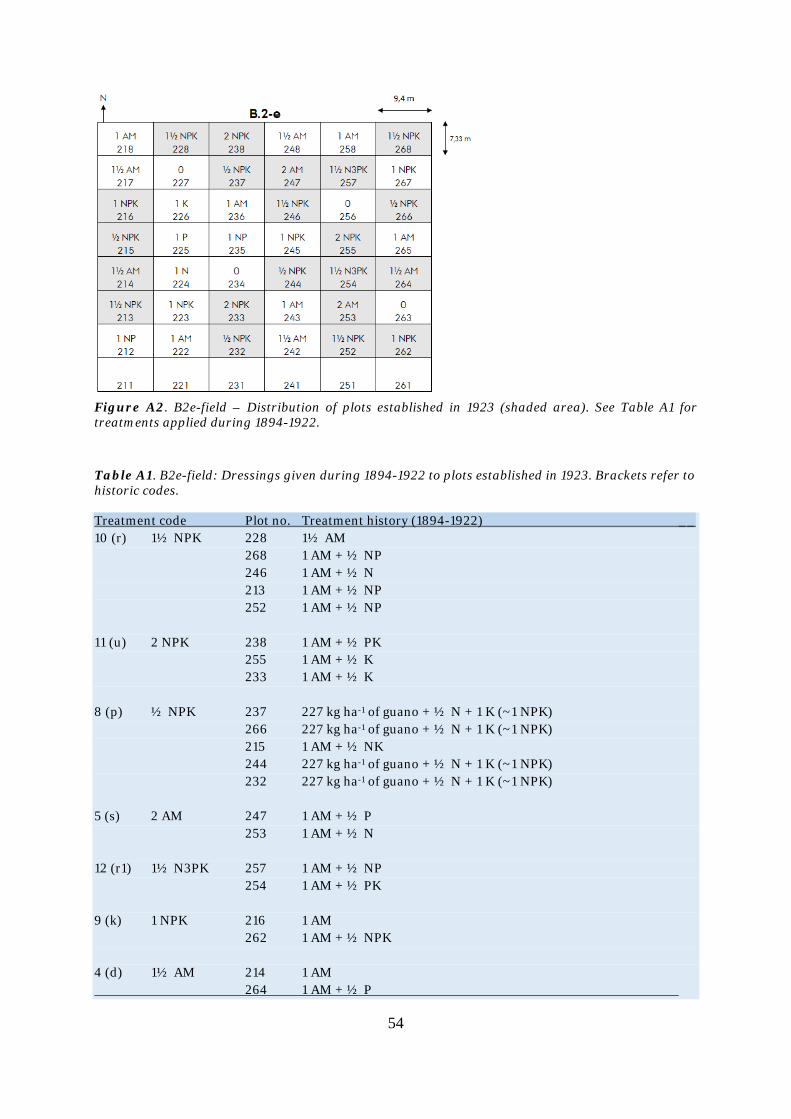
54
Figure A2. B2e-field – Distribution of plots established in 1923 (shaded area). See Table A1 for treatments applied during 1894-1922.
Table A1. B2e-field: Dressings given during 1894-1922 to plots established in 1923. Brackets refer to historic codes. Treatment code Plot no. Treatment history (1894-1922) __ 10 (r) 1½ NPK 228 1½ AM 268 1 AM + ½ NP 246 1 AM + ½ N 213 1 AM + ½ NP 252 1 AM + ½ NP 11 (u) 2 NPK 238 1 AM + ½ PK 255 1 AM + ½ K 233 1 AM + ½ K 8 (p) ½ NPK 237 227 kg ha-1 of guano + ½ N + 1 K (~1 NPK) 266 227 kg ha-1 of guano + ½ N + 1 K (~1 NPK) 215 1 AM + ½ NK 244 227 kg ha-1 of guano + ½ N + 1 K (~1 NPK) 232 227 kg ha-1 of guano + ½ N + 1 K (~1 NPK) 5 (s) 2 AM 247 1 AM + ½ P 253 1 AM + ½ N 12 (r1) 1½ N3PK 257 1 AM + ½ NP 254 1 AM + ½ PK 9 (k) 1 NPK 216 1 AM 262 1 AM + ½ NPK 4 (d) 1½ AM 214 1 AM 264 1 AM + ½ P

55
Figure A3. B2w-field – Distribution of plots established in 1935 (shaded area). See Table A2 for treatments applied during 1894-1934.
Figure A3 presents an outline of the plots established in the B2w-field in 1935. At this stage, treatments
1 PK, 1 NK and 1 NP were included. Table A2 shows the treatment history of plots included in the B2w-
field in 1935.
In 1956, six plots, originally included in other experiments, were added the long-term experiment in the
B2e-field (Figure A4). No new treatments were implemented, the plots being included in order to
increase the number of replicates of treatments introduced at an earlier date. Table A3 presents elements
of the history of plots added in 1956. The crop rotation in these additional plots had followed the rotation
of the long-term experiment in the B2-fields.
Table A2. B2w-field – Dressings given during 1894-1934 to plots included in 1935. Brackets refer to historic codes. Treatment code Plot no. Treatment history (1894-1934) __ 6 (e) 1 PK 127 ½ AM + ½ NPK 115 ½ AM + ½ NPK 144 ½ AM + ½ NPK 132 ½ AM + ½ NPK 7 (f) 1 NK 126 1 AM + ½ NPK 143 1 AM + ½ NPK 13 (l) 1NP 114 1 AM + ½ NPK 131 1 AM + ½ NPK
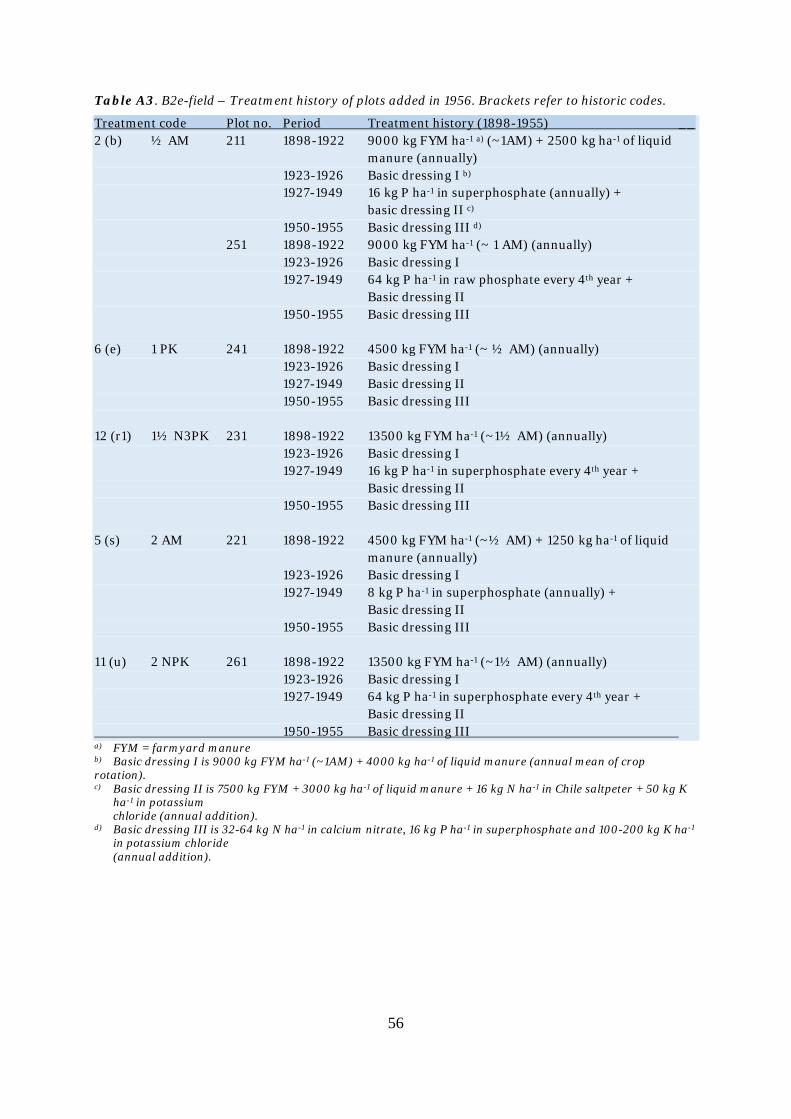
56
Table A3. B2e-field – Treatment history of plots added in 1956. Brackets refer to historic codes.
Treatment code Plot no. Period Treatment history (1898-1955) __ 2 (b) ½ AM 211 1898-1922 9000 kg FYM ha-1 a) (~1AM) + 2500 kg ha-1 of liquid manure (annually) 1923-1926 Basic dressing I b) 1927-1949 16 kg P ha-1 in superphosphate (annually) +
basic dressing II c) 1950-1955 Basic dressing III d) 251 1898-1922 9000 kg FYM ha-1 (~ 1 AM) (annually) 1923-1926 Basic dressing I 1927-1949 64 kg P ha-1 in raw phosphate every 4th year +
Basic dressing II 1950-1955 Basic dressing III 6 (e) 1 PK 241 1898-1922 4500 kg FYM ha-1 (~ ½ AM) (annually) 1923-1926 Basic dressing I 1927-1949 Basic dressing II 1950-1955 Basic dressing III 12 (r1) 1½ N3PK 231 1898-1922 13500 kg FYM ha-1 (~1½ AM) (annually) 1923-1926 Basic dressing I 1927-1949 16 kg P ha-1 in superphosphate every 4th year + Basic dressing II 1950-1955 Basic dressing III 5 (s) 2 AM 221 1898-1922 4500 kg FYM ha-1 (~½ AM) + 1250 kg ha-1 of liquid manure (annually) 1923-1926 Basic dressing I 1927-1949 8 kg P ha-1 in superphosphate (annually) +
Basic dressing II 1950-1955 Basic dressing III 11 (u) 2 NPK 261 1898-1922 13500 kg FYM ha-1 (~1½ AM) (annually) 1923-1926 Basic dressing I 1927-1949 64 kg P ha-1 in superphosphate every 4th year +
Basic dressing II 1950-1955 Basic dressing III a) FYM = farmyard manure b) Basic dressing I is 9000 kg FYM ha-1 (~1AM) + 4000 kg ha-1 of liquid manure (annual mean of crop rotation). c) Basic dressing II is 7500 kg FYM + 3000 kg ha-1 of liquid manure + 16 kg N ha-1 in Chile saltpeter + 50 kg K
ha-1 in potassium chloride (annual addition).
d) Basic dressing III is 32-64 kg N ha-1 in calcium nitrate, 16 kg P ha-1 in superphosphate and 100-200 kg K ha-1 in potassium chloride (annual addition).

57
Figure A4. B2e-field – Distribution of plots included in 1956. See Table A3 for treatments applied
during 1898-1955.
The B3-field
Figure A5 shows the plots laid out in 1894 (1893 for unmanured). For treatment 1½ AM, only one
replicate plot was included (plot 363), the other two plots (no. 334 and 341) were established in 1923
(see Table A4 for previous treatments). For other treatments initiated in 1894, all replicates were present
in 1894.
Figure A5. B3-field – Position of plots established in 1894 (left, shaded area) and in 1923 (right,
shaded area).
The treatments ½ NPK and 1½ NPK were included in 1923 with all replicate plots. Also included in
1923 were two more replicates of treatment 1½ AM (plot 334 and 341). Table A4 shows the treatments
applied to these plots during 1894-1923. Finally, in 1935, the treatments 1 PK and 1 NK were added
(Figure A6), and the experimental layout was complete. Previous treatments on these plots are
documented in Table A5.

58
Table A4. B3-field – Treatment history of plots added in 1923. Bracketed codes refer to a previously
used code system.
Treatment code Plot no. Treatment history (1894-1923) __ 4 (d) 1½ AM 334 1 AM + ½ N 341 1 AM + ½ N 8 (p) ½ NPK 325 227 kg ha-1 of guano + ½ N + 1 K (~1 NPK) 332 227 kg ha-1 of guano + ½ N + 1 K (~1 NPK) 354 227 kg ha-1 of guano + ½ N + 1 K (~1 NPK) 371 227 kg ha-1 of guano + ½ N + 1 K (~1 NPK) 10 (r) 1½ NPK 342 1 AM + ½ PK 345 1 AM + ½ P 362 1 AM + ½ PK __
Figure A6. B3-field – Position of plots added in 1935 (shaded area). Treatment history is shown in Table A5.
Table A5. B3-field – Treatment history of plots established in 1935. Bracketed codes refer to a previously used code system. Treatment code Plot no. Period Treatment history (1894-1934) __ 6 (e) 1 PK 321 1894-1922 1 AM + ½ K 1923-1934 1 AM + ½ NPK 352 1894-1922 1 AM + ½ P 1923-1934 1 AM + ½ NPK 374 1894-1922 1 AM + ½ NP 1923-1934 1 AM + ½ NPK 7 (f) 1 NK 335 1894-1922 1 AM + ½ PK 1923-1934 1 AM + ½ NPK 343 1894-1922 1 AM + ½ K 1923-1934 1 AM + ½ NPK 372 1894-1922 1 AM + ½ NP 1923-1934 1 AM + ½ NPK

59
The B4-field (1894-1996)
The B4-field contains a smaller number of plots than the B3- and the B5-field. Originally, this field
included one more row of plots (7 plots, no. 415-475) in the North end of the present field plan. This row
was abandoned in 1927.
The plots established in 1894 and in 1923 are outlined in figure A7. The treatment history of the various
plots added in 1923 is accounted for in Table A6.
Figure A7. B4-field – Position of plots established in 1894 (left, shaded area) and 1923 (right, shaded area).
Table A6. B4-field – Treatment history of plots established in 1923. Bracketed codes refer to a previously used code system. Treatment code Plot no. Treatment history (1894-1923) __ 8 (p) ½ NPK 473 227 kg ha-1 of guano + ½ N + 1 K (~1 NPK) 442 227 kg ha-1 of guano + ½ N + 1 K (~1 NPK) 10 (r) 1½ NPK 424 West half of the plot: 1 AM + ½ P East half of the plot: 1 AM + ½ PK 412 1 AM + ½ NP 452 1 AM + ½ N 12 (r1) 1½ N3PK 414 1 AM + ½ NP __

60
Figure A8. B4-field – Position of plots introduced in 1935 (shaded area). Historical treatments are listed in Table A7. Further changes were introduced in 1997 and 2013 (see main text).
Table A7. B4-field – Treatment history of plots established in 1935. Bracket codes refer to a previously used code system. Treatment code Plot no. Period Treatment history (1894-1934) __ 6 (e) 1 PK 433 1894-1934 ½ AM + ½ NPK 411 1894-1934 ½ AM + ½ NPK 7 (f) 1 NK 434 1894-1922 1 AM + ½ N 1923-1934 1 AM + ½ NKP 413 1894-1934 1 AM + ½ NPK 472 1894-1922 West half of the plot: 1 AM + ½ P East half of the plot: 1 AM + ½ PK 1923-1934 1 AM + ½ NPK __
Treatments 1 PK and 1 NK were included in 1935 (Figure A8), the previous treatments applied to the
plots being tabulated in table A7. Changes introduced to the B4-field in 1997 and 2013 are reported in
the main text.
The B5-field
Figure A9 outlines the position of plots included from 1894 (left) and added in 1923 (center). In 1923,
the treatments ½ NPK and 1½ NPK were added together with one more replicate plot of treatment 1½
AM (plot 524). Previous treatments are given in Table A8. Treatments added in 1935 are also shown in
Figure A11 (right) with treatment histories detailed in Table A9.

61
Figure A9. B5-field – Position of plots established in 1894 (left, shaded area), in 1923 (center, shaded area) and in 1935 (right, shaded area). Previous treatments are shown in Table A8 and A9.
Table A8. B5-field – Treatment history of plots established in 1923. Bracketed codes refer to a previously used code system. Treatment code Plot no. Treatment history (1894-1922) __ 4 (d) 1½ AM 524 North part of the plot: 1 AM + ½ PK South part of the plot: 1 AM + ½ P 8 (p) ½ NPK 556 227 kg ha-1 of guano + ½ N + 1 K (~1 NPK) 525 227 kg ha-1 of guano + ½ N + 1 K (~1 NPK) 543 227 kg ha-1 of guano + ½ N + 1 K (~1 NPK) 511 227 kg ha-1 of guano + ½ N + 1 K (~1 NPK) 10 (r) 1½ NPK 523 1 AM + ½ NP 541 1 AM + ½ NP __
Table A9. B5-field – Treatment history of plots added in 1935. Bracketed codes refer to a previously used code system. Treatment code Plot no. Period Treatment history (1894-1934) __ 6 (e) 1 PK 516 1894-1934 ½ AM + ½ NPK 545 1894-1934 ½ AM + ½ NPK 521 1894-1934 ½ AM + ½ NPK 7 (f) 1 NK 534 1894-1922 1 AM + ½ N 1823-1934 1 AM + ½ NPK 522 1894-1934 1 AM + ½ NPK

62
Appendix B: The Askov-LTE on Sandmarken: 1894-1997
This appendix presents the crops and nutrient treatments applied on Sandmarken during 1894-1997.
The Askov long-term experiments were initiated in 1894 on two sites (Lermarken and Sandmarken)
differing in soil texture. The Lermarken site is situated close to the Askov Experimental Station (east of
the village Askov), and Sandmarken is situated west of the village, approximately 1 km from the
experimental station. Thus, the two sites experience a similar climate. The experimental sites grew
comparable four-course crop rotations, although the individual crops have differed. The nutrient
treatments were also somewhat different, but both experimental sites included nutrient treatments that
were comparable.
The Sandmarken soil is a coarse sand with a relatively large proportion of fine sand (Table B1). In the
Danish classification, the soil is a JB1 (coarse sand): according to USDA Soil Taxonomy System,
Sandmarken classifies as Inseptisol (Orchrept). The Sandmarken site belongs to the first areas brought
into cultivation around the village of Askov. It is likely that this site had been cultivated for centuries
before the long-term experiment was initiated in 1894 (Iversen & Dorph-Petersen, 1951). Despite the
soil’s sandy nature, crops grown on Sandmarken were not irrigated, and yield levels were small in years
with reduced rainfall.
In 1997, the nutrient treatments were stopped and the rotation replaced by permanent grassland with
perennial ryegrass (Lolium perenne L.) and red fescue (Festuca rubra L.) sown in March 1998. The
position of the former nutrient-treated plots was kept and the grass mown once or twice each year with
the cut biomass left on the plot (biomass yield not determined). Every four years, soil (0-20 cm) samples
from each plot are archived for later analyses. The grass was reseeded directly into the existing sward in
April 2005, and lime applied in 1997 and again in 2005.
Table B1. Textural composition of Sandmarken soil.
% of soil dry weight ________ Clay Silt Fine sand Coarse sand Soil depth (<2 µm) (2-20 µm) (20-200 µm) (200-2000 µm)________ 0-20 cm 4 4 34 57 20-50 cm 5 6 38 51 50-100 cm 3 1 33 63__________________ The crop rotation The Sandmarken experiment grew a four-course crop rotation of winter cereals, root crops, spring
cereals, and clover/grass mixture. Table B2 shows the crops adopted in different periods. The winter
cereal has always been autumn sown cereal rye (Secale cereale L.), and root crops have been mainly
mangold/beet root (Beta vulgaris L.), turnips/swedes (Brassica napus L.) and potatoes (Solanum
tuberosum L.). Until 1948, plots with root crops were subdivided, allowing two or four crops to be grown
simultaneously on individual parts of the plot. Thus, plots carrying root crops were divided into four
parts during 1894-1906. The four sub-plots grew mangolds, turnips, potatoes, and carrots (Daucus

63
carota L.). Since 1948, turnips/swedes alternated with potatoes. From 1894 to 1972, spring-sown cereal
was oats (Avena sativa L.). Thereafter, barley (Hordeum vulgare L.) was employed.
Table B2. Crops included in the four-course rotation until 1997. Sandmarken includes four fields allowing all rotation elements to be present every year. Rotation element Period Crop __ Winter cereals 1894-1997 Rye Root crops 1894-1906 Four sub-plotsa) 1907-1922 Mangolds and potatoes b) 1923-1948 Turnips and potatoes b) 1949-1997 Turnips or potatoes c)
Spring cereals 1894-1972 Oats 1973-1997 Barley Clover/grass/legumes 1894-1943 Clover/grass mixture d) 1944-1967 Lupines, green forage 1968-1997 Peas, green forage_________________ a) Plots divided into four subplots growing mangolds, turnips, potatoes, and carrots simultaneously. b) Plots divided into two subplots growing both crops simultaneously. c) Turnips grown in every second rotation. d) The composition of the clover/grass mixture has changed through time.
A mixture of broad (horse) bean (Vicia faba L.) and peas (Pisum sativum L.) was sown during the
periods 1895-1898 and 1903-1906, while an oats/common vetch (Vicia sativa L.) crop was applied 1911-
1914 and 1918-1922. For other periods until 1943, a clover/grass mixture (usually red clover (Trifolium
pratense L.) and ryegrass) was used. During the periods 1944-1967 and 1968-1994, yellow (sweet) lupine
(Lupinus luteus, L.) and peas, respectively, replaced the grass/clover. Until 1943, clover/grass on was
taken as hay. The other crops were harvested as green forage and the yield expressed in terms of dry
matter, except for broad beans and peas in the periods 1895-1898 and 1903-1906. These crops were
harvested at physiological maturity, and the total yields based on grain and straw that was subsequently
converted to hay equivalents.
Nutrient treatments and experimental layout
The Sandmarken experiment employed four fields situated next to each other. Table B3 shows field
designations, plot dimensions, and area of nutrient treated plot and harvested plot
Table B3. Size of plots in the four fields on Sandmarken.
Nutrient treated plot Harvested net plot Dimension Area Dimension Area Field (m) (m2) (m) (m2)________________ G.1 7.53 x 7.30 55 5.03 x 4.80 24 G.2 7.53 x 7.30 55 5.03 x 4.80 24 G.3 8.78 x 6.25 55 6.18 x 3.75 23 G.4 10.03 x 5.48 55 7.53 x 2.98 22 _______________
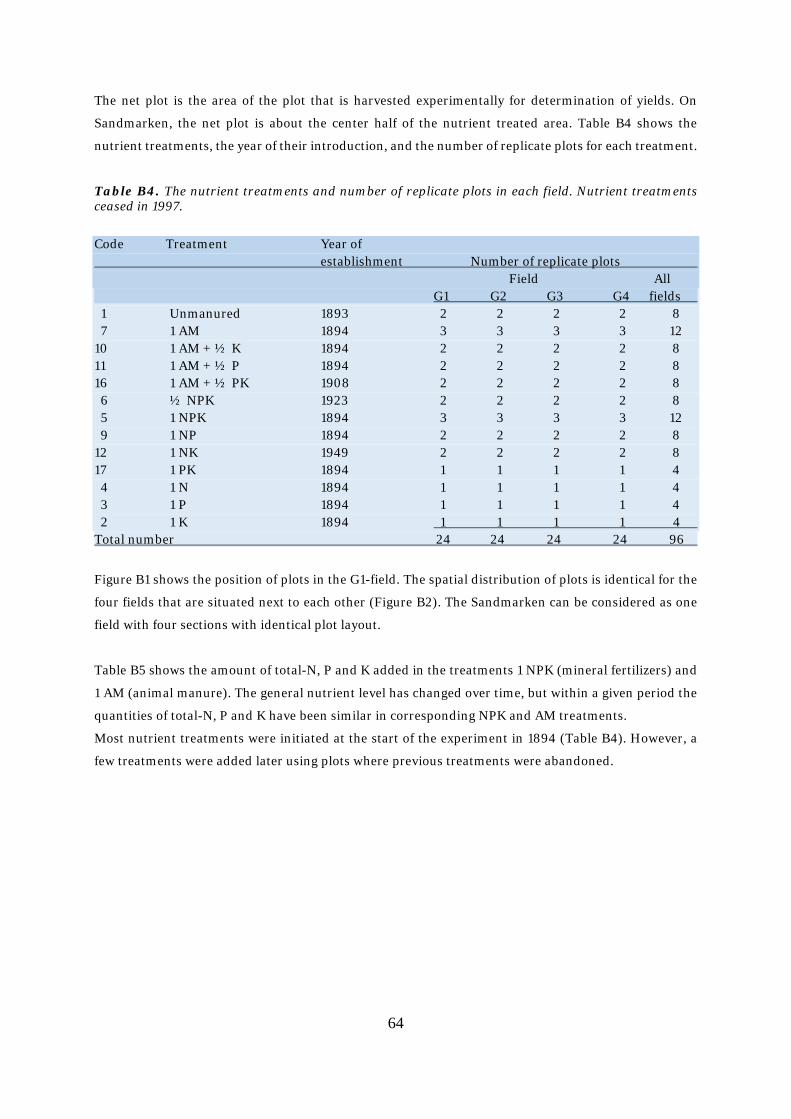
64
The net plot is the area of the plot that is harvested experimentally for determination of yields. On
Sandmarken, the net plot is about the center half of the nutrient treated area. Table B4 shows the
nutrient treatments, the year of their introduction, and the number of replicate plots for each treatment.
Table B4. The nutrient treatments and number of replicate plots in each field. Nutrient treatments ceased in 1997.
Code Treatment Year of establishment Number of replicate plots Field All G1 G2 G3 G4 fields 1 Unmanured 1893 2 2 2 2 8 7 1 AM 1894 3 3 3 3 12 10 1 AM + ½ K 1894 2 2 2 2 8 11 1 AM + ½ P 1894 2 2 2 2 8 16 1 AM + ½ PK 1908 2 2 2 2 8 6 ½ NPK 1923 2 2 2 2 8 5 1 NPK 1894 3 3 3 3 12 9 1 NP 1894 2 2 2 2 8 12 1 NK 1949 2 2 2 2 8 17 1 PK 1894 1 1 1 1 4 4 1 N 1894 1 1 1 1 4 3 1 P 1894 1 1 1 1 4 2 1 K 1894 1 1 1 1 4 Total number 24 24 24 24 96
Figure B1 shows the position of plots in the G1-field. The spatial distribution of plots is identical for the
four fields that are situated next to each other (Figure B2). The Sandmarken can be considered as one
field with four sections with identical plot layout.
Table B5 shows the amount of total-N, P and K added in the treatments 1 NPK (mineral fertilizers) and
1 AM (animal manure). The general nutrient level has changed over time, but within a given period the
quantities of total-N, P and K have been similar in corresponding NPK and AM treatments.
Most nutrient treatments were initiated at the start of the experiment in 1894 (Table B4). However, a
few treatments were added later using plots where previous treatments were abandoned.

65
Figure B1. Position of plots in the G1-field. The G2, G3 and G4 fields have identical plot distributions (see Figure B2). Numbers indicate treatment code (see Table B4).
Figure B2. Distribution of plots on Sandmarken. Numbers refer to treatments codes (see Table B4).
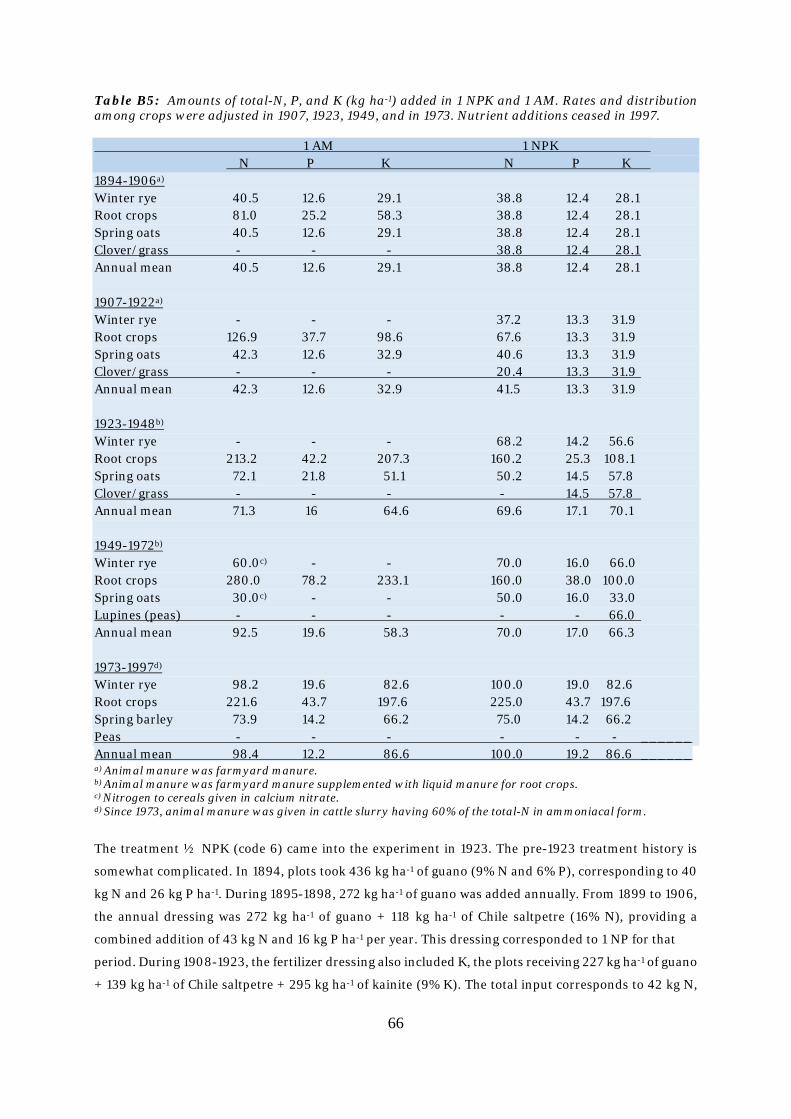
66
Table B5: Amounts of total-N, P, and K (kg ha-1) added in 1 NPK and 1 AM. Rates and distribution among crops were adjusted in 1907, 1923, 1949, and in 1973. Nutrient additions ceased in 1997. 1 AM 1 NPK N P K N P K 1894-1906a) Winter rye 40.5 12.6 29.1 38.8 12.4 28.1 Root crops 81.0 25.2 58.3 38.8 12.4 28.1 Spring oats 40.5 12.6 29.1 38.8 12.4 28.1 Clover/grass - - - 38.8 12.4 28.1 Annual mean 40.5 12.6 29.1 38.8 12.4 28.1 1907-1922a) Winter rye - - - 37.2 13.3 31.9 Root crops 126.9 37.7 98.6 67.6 13.3 31.9 Spring oats 42.3 12.6 32.9 40.6 13.3 31.9 Clover/grass - - - 20.4 13.3 31.9 Annual mean 42.3 12.6 32.9 41.5 13.3 31.9 1923-1948b)
Winter rye - - - 68.2 14.2 56.6 Root crops 213.2 42.2 207.3 160.2 25.3 108.1 Spring oats 72.1 21.8 51.1 50.2 14.5 57.8 Clover/grass - - - - 14.5 57.8 Annual mean 71.3 16 64.6 69.6 17.1 70.1 1949-1972b) Winter rye 60.0c) - - 70.0 16.0 66.0 Root crops 280.0 78.2 233.1 160.0 38.0 100.0 Spring oats 30.0c) - - 50.0 16.0 33.0 Lupines (peas) - - - - - 66.0 Annual mean 92.5 19.6 58.3 70.0 17.0 66.3 1973-1997d)
Winter rye 98.2 19.6 82.6 100.0 19.0 82.6 Root crops 221.6 43.7 197.6 225.0 43.7 197.6 Spring barley 73.9 14.2 66.2 75.0 14.2 66.2 Peas - - - - - - ______ Annual mean 98.4 12.2 86.6 100.0 19.2 86.6 ______ a) Animal manure was farmyard manure. b) Animal manure was farmyard manure supplemented with liquid manure for root crops. c) Nitrogen to cereals given in calcium nitrate. d) Since 1973, animal manure was given in cattle slurry having 60% of the total-N in ammoniacal form.
The treatment ½ NPK (code 6) came into the experiment in 1923. The pre-1923 treatment history is
somewhat complicated. In 1894, plots took 436 kg ha-1 of guano (9% N and 6% P), corresponding to 40
kg N and 26 kg P ha-1. During 1895-1898, 272 kg ha-1 of guano was added annually. From 1899 to 1906,
the annual dressing was 272 kg ha-1 of guano + 118 kg ha-1 of Chile saltpetre (16% N), providing a
combined addition of 43 kg N and 16 kg P ha-1 per year. This dressing corresponded to 1 NP for that
period. During 1908-1923, the fertilizer dressing also included K, the plots receiving 227 kg ha-1 of guano
+ 139 kg ha-1 of Chile saltpetre + 295 kg ha-1 of kainite (9% K). The total input corresponds to 42 kg N,
67
14 kg P and 30 kg K ha-1. The amount of N, P, and K added during this period corresponds to 1 NPK. The
treatment 1 AM +½ PK (code 16) was included in 1908. In the preceding period, the two replicate plots
in each field received 1 AM + 100 kg ha-1 of Thomas (basic) slag phosphate annually (~ 8% P, 8 kg P ha-
1). The treatment 1 NK (code 12) was included in 1949. Before then the plots received dressings of 1 AM
+ ½ N. Contents of N and P content in guano are from Christensen (1914).
References
Christensen, H.R. (1914): Studier over jordbundens beskaffenhedens indflydelse på bakterielivet og
stofomsætningen i jordbunden. Tidsskrift for Planteavl 21, 321-552.
Iversen, K. & Dorph-Petersen, K. (1951): Forsøg med staldgødning og kunstgødning ved Askov 1894-
1948. Tidsskrift for Planteavl 54, 369-538.

68
Appendix C: Publications based on the Askov-LTE and
appearing 1994 - 2019
(1894-1993: 75 publications recorded; see Christensen et al., 2006) 1994 - 2000 Brandt, K., Iversen, C., Pedersen, H.L., Harder, L.H., Christensen, L.P. & Christensen, B.T. 1999. Variation
in levels of phenolic secondary metabolites in commercially important varieties: Potential agronomic effects. Joint Meeting of Nutritional Enhancement of Phenolic Plant Foods in Europe and Bioactive Plant Cell Wall Components in Nutrition and Health. Abstract of Invited Lecture, p. 32.
Christensen, B. T. 1995. Land use and fertilization effects on the chemical nature of soil organic matter in primary organomineral complexes. HUMUS- Nordic Humus Newsletter 2, 7-16.
Christensen, B.T. 1995. Workshop synthesis. I: "The Askov Long-Term Experiments on Animal Manure and Mineral Fertilizers: 100th Anniversary Workshop". Red. B.T. Christensen & U. Trentemøller, SP-report no. 29, 169-172. Danish Institute of Plant and Soil Science, Tjele.
Christensen, B. T. 1996. The Askov long-term experiments on animal manure and mineral fertilizers. In: Evaluation of Soil Organic Matter Models (Eds. D. S. Powlson, P. Smith & J. U. Smith), NATO ASI Series vol. I 38, Springer-Verlag, Berlin, 301-312.
Christensen, B. T. 1996. Carbon in primary and secondary organomineral complexes. In: Advances in Soil Science - Structure and Organic Matter Storage in Agricultural Soils (Eds. M.R. Carter & B.A. Stewart), CRC Lewis Publishers, Boca Raton, Florida, 97-165.
Christensen, B. T. 1996. Luftens CO2 indhold og organisk stof i jord. Naturens Verden nr. 9, 336-346. Christensen, B. T. 1997. The Askov long-term field experiments. Archiv für Acker-, Pflanzenbau und
Bodenkunde 42, 265-278. Christensen, B. T. 1997. Dyrkningens indflydelse på jordens kulstofindhold. Tidsskrift for Landøkonomi
184, 213-221. Christensen, B. T. & Johnston, A. E. 1997. Soil organic matter and soil quality - Lessons learned from
long-term experiments at Askov and Rothamsted. Developments in Soil Science 25, 399-430. Christensen, B.T., Petersen, J., Kjellerup, V & Trentemøller, U. 1994. The Askov Long-Term
Experiments on Animal Manure and Mineral Fertilizers: 1894-1994. Danish Institute of Plant and Soil Science, SP-report no. 43, 1994. 85 pp.
Christensen, B.T. & Trentemøller, U. 1995. The Askov Long-Term Experiment on Animal Manure and Mineral Fertilisers. 100th Anniversary Worhshop, Askov Experimental Station, 8th - 10th September 1994. Danish Institute of Plant and Soil Science, SP-report no. 29, 1995. 188 pp.
Christensen, B. T., Meyer, N. I., Nielsen, V. & Søgaard, C. 1996. Biomasse til energi og økologisk jordbrug. Rapport IBE-R-002, Institut for Bygninger og Energi, Danmarks Tekniske Universitet, København, pp. 57.
Eriksen, J. & Mortensen, J. V. 1999. Soil sulphur status following long-term annual application of animal manure and mineral fertilizers. Biology and Fertility of Soils 28, 416-421.
Glendining, M.J. & Powlson, D.S. 1995. The effects of long continued applications of inorganic nitrogen fertilizer on soil organic nitrogen – A review. In: Soil Management: Experimental Basis for Sustainability and Environmental Quality, Eds. R. Lal & B.A. Stewart, CRC Lewis Publishers, Boca Raton, FL, 385-446.
Guggenberger, G., Christensen, B. T. & Rubæk, G. H. 2000. Isolation and characterization of labile organic phosphorus pools in soils from the Askov long-term field experiments. Journal of Plant Nutrition and Soil Science 163, 151-155.
Guggenberger, G., Christensen, B. T., Rubæk, G. & Zech, W. 1996. Land-use and fertilization effects on P forms in two European soils: resin extraction and 31-P-NMR analysis. European Journal of Soil Science 47, 605-614.
Hansen, S. R. 1997. Fosfors effekt på interaktioner mellem arbuskulære mykorrhiza svampesamfund og hør. Specialerapport, Institut for Kemi og Biologi, Roskilde Universitetscenter, pp. 61.
Hansen, S. R., Thingstrup, I., Schweiger, P. & Jakobsen, I. 1997. Mycorrhizas in the Askov long-term fertilization experiments. Nordic Agricultural Research (Nordisk Jordbrugsforskning, NJF) 79, 54.
69
Harder, L., Christensen, L.P., Christensen, B.T. & Brandt, K. 1998. Contents of flavonoids and other phenolics in winter wheat plants grown with different levels of organic fertilizers. Polyphenols Communications 98, 495-496.
Jensen, B. K, Jensen, E. S. & Magid, J. 1995. Decomposition of 15N-labelled ryegrass in soils from a long-term field experiment with different manuring strategies. In: Nitrogen Leaching in Ecological Agriculture, AB Academic Publishers, UK, 221-228.
Joner, E. J. 2000. The effect of long-term fertilization with organic or inorganic fertilizers on mycorrhiza-mediated phosphorus uptake in subterranean clover. Biology and Fertility of Soils 32, 435-440.
Kätterer, T. & Andren, O. 1999. Long-term agricultural field experiments in Northern Europe: analysis of the influence of management on soil carbon stocks using the ICBM model. Agriculture, Ecosystems and Environment 72, 165-179.
Randall, E. W., Mahieu, N., Powlson, D. S. & Christensen, B. T. 1995. Fertilization effects on organic matter in physically fractionated soils as studied by 13-C-NMR: Results from two long-term field experiments. European Journal of Soil Science 46, 557-565.
Reeves, D. W. 1997. The role of soil organic matter in maintaining soil quality in continuous cropping systems. Soil and Tillage Research 43, 131-167.
Rubæk, G. H. 1999. Soil phosphorus dynamics – Effects of land use, fertilization and liming. Ph.D. Thesis, Chemistry Department, The Royal Veterinary and Agricultural University, Copenhagen.
Rubæk, G. H. & Sibbesen, E. 1994. Resin ekstraction of labile, soil organic phosphorus. In: Danish Soil Organic Matter Research (Eds. B. T. Christensen and O. K. Borggaard), Statens Planteavlsforsøg, SP-report no. 20, 27-30.
Rubæk, G. H. & Sibbesen, E. 1995. Soil phosphorus dynamics in a long-term field experiment at Askov. Biology and Fertility of Soils 20, 86-92.
Rubæk, G. H., Guggenberger, G., Zech, W. & Christensen, B. T. 1999. Organic phosphorus in soil size separates characterized by phosphorus-31 nuclear magnetic resonance and resin extraction. Soil Science Society of America Journal 63, 1123-1132.
Schjønning, P., Christensen, B. T. & Carstensen, B. 1994. Physical and chemical properties of a sandy loam receiving animal manure, mineral fertilizer or no fertilizer for 90 years. European Journal of Soil Science 45, 257-268.
Sibbesen, E., Skjøth, F. & Christensen, B.T. 1995. Soil and substance movement between plots in long-term field experiments. I: "The Askov Long-Term Experiments on Animal Manure and Mineral Fertilizers: 100th Anniversary Workshop". Red. B.T. Christensen & U. Trentemøller, SP-report no. 29, 136-153. Danish Institute of Plant and Soil Science
Smith, P., Powlson, D. S., Glendining, M. J., & Smith, J. U. 1997. Potential for carbon sequestration in European soils: preliminary estimates for five scenarios using results from long-term experiments. Global Change Biology 3, 67-79.
Smith, P., Smith, J. U. & Powlson, D. S. 1996. GCTE Task 3.3.1 - Soil Organic Matter Network (SOMNET): 1996 Model and Experimental Metadata. Global Change and Terrestrial Ecosystems, Report no. 7. GCTE Focus 3 Office, Wallingford, UK.
Steen, I. 1997. Langsigtede gødskningsforsøg. Gødningen 89, nr. 2, september 1997, Kemira Danmark A/S, Fredericia, 12-14.
2001 - 2005 Askegaard, M. 2003. Management of potassium in low input systems - with special emphasis on soil test
methods and potassium balances. Ph.D. Thesis, Chemistry Department and Department of Agricultural Sciences, The Royal Veterinary and Agricultural University, Copenhagen.
Askegaard, M., Hansen, H. C. B. & Schjoerring, J. K. 2005. A cation exchange resin method for measuring long-term potassium release rates from soil. Plant and Soil 271, 63-74.
Bleeg, I.S. 2001. Fenoliske syrer og flavonoider I økologisk dyrket vårbyg (Hordeum vulgare L.) ved forskellige næringstilgængeligheder. Specialerapport, Afdeling for Botanisk Økologi, Aarhus Universitet.
Bol, R, Eriksen, J., Smith, P., Garnett, M. H., Coleman, K. & Christensen, B. T. 2005. The natural abundance of 13C, 15N, 34S and 14C in archived (1923-2000) plant and soil samples from the Askov long-term experiments on animal manure and mineral fertilizer. Rapid Communications in Mass Spectrometry 19, 3216-3226.
Bruun, S., Christensen, B.T., Hansen, E.M. & Jensen, L.S. 2001. Calibrating and validating of the long-term dynamics of the Daisy model. 11th Nitrogen Workshop, Reims, 9-12 September 2001, pp. 259-260.

70
Bruun, S., Jensen, L.S., Hansen, E.M. & Christensen, B.T. 2002. Modellering af kulstofomsætning i jord med Daisy – betydning af halmnedmuldning. I: Biomasseudtag til energiformål – konsekvenser for jordens kulstofbalance i land- og skovbrug, B.T. Christensen (red.). DJF-rapport Nr. 72 Markbrug, maj 2002. Danmarks JordbrugsForskning, Tjele, 48-71
Bruun, S. 2004. Modelling organic matter decomposition in soils at different temporal scales. Ph.D Thesis, Department of Agricultural Sciences, The Royal Veterinary and Agricultural University, Copenhagen.
Bruun, S., Christensen, B. T., Hansen, E. M., Magid, J. & Jensen, L. S. 2003. Calibration and validation of the soil organic matter dynamics of the Daisy model with data from the Askov long-term experiments. Soil Biology and Biochemistry 35, 67-76.
Celis, R., Real, M., Hermosin, M. C. & Cornejo, J. 2005. Sorption and leaching behavior of polar aromatic acids in agricultural soils by batch and column leaching tests. European Journal of Soil Science 56, 287-297.
Christensen, B. T. (red.) 2002. Biomasseudtag til energiformål - konsekvenser for jordens kulstofbalance i land- og skovbrug. DJF-rapport nr. 72, Markbrug, Danmarks JordbrugsForskning, pp. 75.
Christensen, B.T. 2002. Kulstofindhold i dyrket jord. I: Biomasseudtag til energiformål – konsekvenser for jordens kulstofbalance i land- og skovbrug, B.T. Christensen (red.). DJF-rapport Nr. 72 Markbrug, maj 2002. Danmarks JordbrugsForskning, Tjele, 29-40.
Christensen, B. T. 2004. Askov 1894-2004: Gødskningsforsøg igennem 110 år. Kemira Grow-How Magasinet 97, september 2004, Kemira GrowHow A/S Fredericia, 3.
Christensen, B.T. 2005. Kulstof i dyrket jord - vurdering af potentiale for øget lagring. I: Drivhusgasser fra jordbruget - reduktionsmuligheder, J.E. Olesen (red.). DJF-rapport Nr. 113 Markbrug, januar 2005. Danmarks JordbrugsForskning, Tjele, 103-120.
Debosz, K., Vognsen, L. & Labouriau, R. 2002. Carbohydrates in hot water extracts of soil aggregates as influenced by long-term management. Communications in Soil Science and Plant Analyses 33, 623-634.
Edmeades, D. C. 2003. The long-term effects of manures and fertilisers on soil productivity and quality: a review. Nutrient Cycling in Agroecosystems 66, 165-180.
Eriksen, J. 2002. Organic manures as sources of fertiliser sulphur. Proceedings no. 505, The International Fertiliser Society, York, UK, pp. 20.
Foereid, B. & Høgh-Jensen, H. 2004. Carbon sequestration potential of organic agriculture in northern Europe - a modelling approach. Nutrient Cycling in Agroecosystems 68, 13-24.
Munkholm, L. J., Schjønning, P., Debosz, K., Jensen, H. E. & Christensen, B. T. 2002. Aggregate strength and mechanical behaviour of a sandy loam soil under long-term fertilization treatments. European Journal of Soil Science 53, 129-137.
Nørbæk, R., Aaboer, D. B. F., Bleeg, I. S., Christensen, B. T., Kondo, T. & Brandt, K. 2003. Flavone C-glycoside, phenolic acid, and nitrogen contents in leaves of barley subject to organic fertilization treatments. Journal of Agricultural and Food Chemistry 51, 809-813.
Petersen, B. M., Berntsen, J., Hansen, S. & Jensen, L. S. 2005. CN-SIM – a model for the turnover of soil organic matter. I. Long-term carbon and radiocarbon development. Soil Biology and Biochemistry 37, 359-374.
Petersen, J. & Djurhuus, J. 2004. Sammenhæng mellem tilførsel, udvaskning og optagelse af kvælstof i handelsgødede, kornrige sædskifter. DJF-rapport nr. 102, Markbrug. Danmarks JordbrugsForskning, pp. 61.
Schjønning, P., Iversen, B. V., Munkholm, L. J., Labouriau, R. & Jacobsen, O. H. 2005. Pore characteristics and hydraulic properties of a sandy loam supplied for a century with either animal manure or mineral fertilizers. Soil Use & Management 21, 265-275.
Schjønning, P. & Munkholm, L. J. 2004. Organisk stof i jord – hvor meget er nok og hvor lidt er kritisk ?. FØJOenyt nr. 2, april 2004. Nyhedsbrev fra Forskningscenter for Økologisk Jordbrug, Forskningscenter Foulum, Tjele, pp. 4.
Springob, G. & Kirchmann, H. 2002. C-rich sandy Ap horizons of specific historical land-use contain large fractions of refractory organic matter. Soil Biology and Biochemistry 34, 1571-1581.
Thomsen, I.K., Sørensen, P., Djurhuus, J., Stenberg, B., Østergaard, H.S. & Christensen, B.T. 2003. Bestemmelse af plantetilgængeligt kvælstof i jord tilført afgrøderester og husdyrgødning. DJF-rapport nr. 97, Markbrug, december 2003. Danmarks JordbrugsForskning, Tjele, pp. 42.

71
2006 – 2010 Barré, P., Eglin, T., Christensen, B.T., Ciais, P., Houot, S., Kätterer, T. van Oort, F., Peylin, P., Poulton, P.R.,
Romanenkov, V. & Chenu, C. 2010. Quantifying and isolating stable soil organic carbon using long-term bare fallow experiments. Biogeosciences 7, 3839-3850.
Barré, P., Eglin, T., Christensen, B.T., Ciais, P., Houot, S., Kätterer, T. van Oort, F., Peylin, P., Poulton, P.R., Romanenkov, V. & Chenu, C. 2010. Long-term bare fallow experiments open a new window to study stable carbon in soil. International Symposium MOLTER: Organic matter stabilization and ecosystem functions. 19th-23th September 2010, Cote d’Azur, France, abstract.
Christensen, B.T. & Petersen, J. 2007. Langvarige forsøg i Danmark. Plantekongres 2007, Herning Kongrescenter 9.-10. januar 2007, 82-83.
Christensen, B.T., Petersen, J. & Trentemøller, U.M. 2006. The Askov Long-Term Experiments on Animal Manure and Mineral Fertilizers: The Lermarken site 1894-2004. DIAS report no. 121, Plant Production series. Danish Institute of Agricultural Sciences. Tjele, pp. 104.
Christensen, B.T., Petersen, J. & Schacht, M. (eds.) 2008. Long-Term Field Experiments – A Unique Research Platform. Proceedings of NJF Seminar 407. DJF Plant Science No. 137, Aarhus Universitet, Faculty of Agricultural Sciences, Tjele, Denmark, pp.95.
Christensen, B.T., Thomsen, I.K. & Petersen, J. 2008. Long –term experiments at Askov Experimental Station. In: Christensen, B.T., Petersen, J. & Schacht, M. (eds.): Long-Term Field Experiments – A Unique Research Platform. Proceedings of NJF Seminar 407. DJF Plant Science No. 137, Aarhus Universitet, Faculty of Agricultural Science, Tjele, Denmark, 7-10.
Christensen, B.T., Rasmussen, J., Eriksen, J. & Hansen, E.M. 2009. Soil carbon storage and yields of spring barley following grass leys of different age. European Journal of Agronomy 31, 29-35.
Mulvaney, R.L., Khan, S.A. & Ellsworth, T.R. 2009. Synthetic nitrogen fertilizers deplete soil nitrogen: A global dilemma for sustainable cereal production. Journal of Environmental Quality 38, 2295-2314.
Khan, S.A., Mulvaney, R.L., Ellsworth, T.R. & Boast, C.W. 2007. The myth of nitrogen fertilization for soil carbon sequestration. Journal of Environmental Quality 36, 1821-1832.
Pedersen, S.S., Kristensen, E. F., Mejnertsen, P., Pedersen, N.P., Kristensen, H. O. & Petersen, J. 2010. Dansk økologisk dyrkning af sojabønner til fødevare- og foderformål – resultater 2009. Intern Rapport Markbrug nr. 25, Det Jordbrugsvidenskabelige Fakultet, Aarhus Universitet, Tjele, pp.27.
Peltre, C., Christensen, B.T., Dragon, S., Icard, C., Kätterer, T. & Houot, S. 2010. Optimisation of the RothC model pools to simulate C dynamics after application of exogenous organic matters in soils. 14th Ramiran International Conference, Lisboa, 13th – 15th September 2010, abstract.
Petersen, J., Thomsen, I.K., Mattsson, L., Hansen, E.M. & Christensen, B.T. 2010. Grain yield and crop N offtake in response to residual fertilizer N in long-term field experiments. Soil Use and Management 26, 455-464.
Petersen, J., Thomsen, I.K., Mattsson, L., Hansen, E.M. & Christensen, B.T. 2008. Er der en langtidseffekt af reduceret kvælstofgødskning? Plantekongres 2008, Herning Kongrescenter 8.-9. januar 2008, 244-245.
Petersen, J., Thomsen, I.K., Mattsson, L., Hansen, E.M., & Christensen, B.T. 2008. Crop response to sustained reductions in annual nitrogen fertilizer rates using long-term experiments as research platform. In: Christensen, B.T., Petersen, J. & Schacht, M. (eds.): Long-Term Field Experiments – A Unique Research Platform. Proceedings of NJF Seminar 407. DJF Plant Science No. 137, Aarhus Universitet, Faculty of Agricultural Science, Tjele, Denmark, 36-39.
Petersen, J., Mattsson, L., Riley, H., Salo, T., Thorvaldsson, G. & Christensen, B.T. 2008. Long Continued Agricultural Soil Experiments: A Nordic Research Platform – An Overview. DJF Plant Science No. 136, Aarhus Universitet, Faculty of Agricultural Sciences, Tjele, Denmark, pp. 20.
Petersen, J., Mattsson, L., Riley, H., Salo, T., Thorvaldsson, G. & Christensen, B.T. 2008. Long Continued Agricultural Soil Experiments: A Nordic Research Platform – A Catalogue. Internal Report DJF Plant Science No. 16, Aarhus Universitet, Faculty of Agricultural Sciences, Tjele, Denmark, pp. 95.
Petersen, J., Mattsson, L., Riley, H., Salo, T., Thorvaldsson, G. & Christensen, B.T. 2008. An inventory of Nordic long continued agricultural soil experiments. In: Christensen, B.T., Petersen, J. & Schacht, M. (eds.): Long-Term Field Experiments – A Unique Research Platform. Proceedings of NJF Seminar 407. DJF Plant Science No. 137, Aarhus Universitet, Faculty of Agricultural Science, Tjele, Denmark, 76-79.
Petersen, J., Thomsen, I.K., Mattsson, L., Hansen, E.M. & Christensen, B.T. 2009. Residual effect of mineral nitrogen fertilizer. Proceeding of the 16th Nitrogen Workshop, 28th June- 1st July 2009, Torino (eds. C. Grignani et al.), 19-20.
Schjønning, P., Heckrath, G. & Christensen, B.T. 2009. Threats to Soil Quality in Denmark – A Review of Existing Knowledge in the Context of the EU Soil Thematic Strategy. DJF Report Plant Science No. 143, Aarhus University, Faculty of Agricultural Sciences, Tjele, Denmark, pp. 121.

72
Thomsen, I.K., Pedersen, L. & Jørgensen, J.R. 2008. Yield and flour quality of spring wheat as affected by soil tillage and animal manure. Journal of the Science of Food and Agriculture 88, 2117-2124.
Thomsen, I.K., Bruun, S., Jensen, L.S. & Christensen, B.T. 2009. Assessing soil carbon lability by near infrared spectroscopy and NaOCl oxidation. Soil Biology and Biochemistry 41, 2170-2177.
Thomsen, I.K., Petersen, B.M., Bruun, S., Jensen, L.S. & Christensen, B.T. 2008. Estimating soil C loss potentials from the C to N ratio. Soil Biology and Biochemistry 40, 849-852.
2011-2015 Askegaard, M. 2014. Askov Forsøgsstation viser, hvordan seriøs P- og K-mangel ser ud.
Landbrugsinfo.dk/Oekologi/Planteavl/goedskning/Sider/Askov_Forsoegsstation. Videnscentret for Landbrug, Skejby, pp. 4.
Barré, P., Eglin, T., Christensen, B.T., Ciais, P., Houot, S., Kätterer, T., Kogut, B.,van Oort, F., Peylin, P., Poulton, P.R., Romanenkov, V. & Chenu, C. 2011. Long-term bare fallow experiments: new opportunities for studying stable soil carbon. Agrokhimia 12, 28-36 (in Russian with English summary).
Christensen, B.T. & Elsgaard, L. 2013. Handelsgødnings indflydelse på afgrøders indhold af arsen, bly, cadmium, krom, kviksølv og nikkel. DCA Rapport nr. 024, juni 2013, 1-40. Aarhus Universitet- DCA-Nationalt Center for Fødevarer og Jordbrug, Tjele.
Christensen, B.T. & Elsgaard, L. 2014. Comparing heavy metal contents in crops receiving mineral fertilisers and animal manure. Proceedings International Fertiliser Society 761, 1-18.
Christensen, B.T. & Elsgaard, L. 2015. Gødskning og afgrødens indhold af tungmetaller. Plantekongres 2015, Herning Kongrescenter 14.-15- Januar 2015, 146-148.
Christensen, B.T. & Thomsen, I.K. 2013. Lovende forsøg med tidlig såning af hvede. Agrologisk, juni 2013, 36-37.
Christensen, B.T. & Thomsen, I.K. 2014. Gødskning gennem 120 år – De langvarige gødningsforsøg ved Askov Forsøgsstation: 1894-2014. DCA Rapport nr. 043, maj 2014, DCA-Nationalt Center for Fødevarer og Jordbrug, Tjele, pp. 46.
Christensen, B.T., Olesen, J.E., Hansen, E.M. & Thomsen, I.K. 2011. Annual variations in 13C values of maize and wheat: Effect on estimates of decadal scale soil carbon turnover. Soil Biology & Biochemistry 43, 1961-1967.
Fraser, R.A., Bogaard, A., Heaton, T., Charles, M., Jones, G., Christensen, B.T., Halstead, P., Merbach, I., Poulton, P.R., Sparkes, D. & Styring, A.K. 2011. Manuring and stable nitrogen isotope ratios in cereals and pulses: towards a new archaeobotanical approach to the inference of land use and dietary practices. Journal of Archaeological Science 38, 2790-2804.
Hemkemeyer, M., Christensen, B.T., Martens, R. & Tebbe, C.C. 2015. Soil particle size fractions harbour distinct microbial communities and differ in potential for microbial mineralisation of organic pollutants. Soil Biology & Biochemistry 90, 255-265.
Kanstrup, M., Thomsen, I.K., Andersen, A.J., Bogaard, A. & Christensen, B.T. 2011. Abundance of 13C and 15N in emmer, spelt and naked barley grown on differently manured soils: towards a method for identifying past manuring practice. Rapid Communications in Mass Spectrometry 25, 2879-2887.
Kanstrup, M., Thomsen, I.K., Mikkelsen, P.H. & Christensen, B.T. 2012. Impact of charring on cereal grain characteristics: linking prehistoric manuring practice to d15N signatures in archaeobotanical material. Journal of Archaeological Science 39, 2533-2540.
Knudsen, L. 2013. Konsekvens af langsigtet reduktion i kvælstoftilførslen. Planteavlsorientering nr. 153. Videncentret for Planteavl, Skejby, pp. 7.
Lefèvre, R., Barré, P., Moyano, F.E., Christensen, B.T., Bardoux, G., Eglin, T., Girardin, C., Houot, S., Kätterer, T., van Oort, F. & Chenu, C. 2014. Higher temperature sensitivity for stable than for labile organic carbon – Evidence from incubations of long-term bare fallow soils. Global Change Biology 20, 633-640.
Menichetti, L., Houot, S., van Oort, F., Kätterer, T., Christensen, B.T., Chenu, C., Barré, P., Vasilyeva, N.A. & Ekblad, A. 2015. Increase in soil stable carbon isotope ratio relates to loss of organic carbon: results from five long-term bare fallow experiments. Oecologia 177, 811-821.
Nielsen, L.K., Jensen, J.D., Nielsen, G.C., Jensen, J.E., Spliid, N.H., Thomsen, I.K., Justesen, A.F., Collinge, D.B. & Jørgensen, L.N. 2011. Fusarium head blight of cereals in Denmark: Species complex and related mycotoxins. Phytopatology 101, 960-969.
Peltre, C., Christensen, B.T., Dragon, S., Icard, C., Kätterer, T. & Houot, S. 2012. RothC simulation of carbon accumulation in soil after repeated application of widely different organic amendments. Soil Biology and Biochemistry 52, 49-60.

73
Petersen, J., Thomsen, I.K., Mattsson, L., Hansen, E.M. & Christensen, B.T. 2012. Estimating the crop response to fertilizer nitrogen residues in long-continued field experiments. Nutrient Cycling in Agroecosystems 93, 1-12.
Smolders, E., Oorts, K., Lombi, E., Schoeters, I., Ma, Y., Zrna, S. & McLaughlin, M.J. 2012. The availability of copper in soils historically amended with sewage sludge, manure, and compost. Journal of Environmental Quality 41, 506-514.
Taghizadeh-Toosi, A., Christensen, B.T., Hutchings, N.J., Vejlin, J., Kätterer, T., Glendining, M. & Olesen, J. E. 2014. C-TOOL: A simple model for simulating whole-profile carbon storage in temperate agricultural soils. Ecological Modeling 292, 11-25.
Thomsen, I.K., Olesen, J.E., Hansen, E.M. & Christensen, B.T. 2011. Changes in d13C and decadal scale carbon sequestration in soil with inputs of maize residues and manure. Book of Abstracts of the 24th NJF Congress, Uppsala 14th-16th June 2011, 216.
2016- Barré, P., Plante, A.F., Cécillon, L., Lutfalla, S., Baudin, F., Bernard, S., Christensen, B.T., Eglin, T.,
Fernandez, J.M., Houot, S., Kätterer, T., Le Guillou, C., MacDonald, A.J., van Oort, F. & Chenu, C. 2016. The energetic and chemical signatures of persistent soil organic matter. Biogeochemistry 130, 1-12.
Barré, P., Quénéa, K., Vidal, A., Cécillon, L., Christensen, B.T., Kätterer, T., MacDonald, A.J., Petit, L., Plante, A.F., van Oort, F. & Chenu, C. 2018. Microbial and plant-derived compounds both contribute to persistent soil organic carbon in temperate soils. Biogeochemistry 140, 81-92.
Christensen, B.T., Jensen, J.L. & Thomsen, I.K. 2017. Impact of early sowing on winter wheat receiving manure or mineral fertilizer. Agronomy Journal 109, 1312-1322.
Cong, W.-F., Christensen, B.T. & Eriksen, J. 2019. Soil nutrient levels define herbage yields but not root biomass in a multispecies grass-legume ley. Agriculture, Ecosystems and Environment 276, 47-54.
Ghaley, B.B., Wösten, H., Olesen, J.E., Schelde, K., Baby, S., Karki, Y.K., Børgesen, C.D., Smith, P., Yeluripati, J., Ferrise, R., Bindi, M., Kuikman, P., Lesschen, J.-P. & Porter, J.R. 2018. Simulation of soil organic carbon effects on long-term winter wheat (Triticum aestivum) production under varying fertilizer inputs. Frontiers in Plant Science 9, Article 1158, p.1-9.
Graham, D.W., Knapp, C.W., Christensen, B.T., McCluskey, S. & Dolfing, J. 2016. Appearance of beta-lactam resistance genes in agricultural soils and clinical isolates over the 20th century. Nature Scientific Reports 6, 21550.
Hemkemeyer, M., Dohrmann, A.B., Christensen, B.T. & Tebbe, C.C. 2018. Bacterial preferences for specific soil particle size fractions revealed by community analyses. Frontiers in Microbiology 9, Article 149, p. 1-13.
Hu, T., Taghizadeh-Toosi, A., Olesen, J.E., Jensen, M.L., Sørensen, P. & Christensen, B.T. 2019. Converting temperate long-term arable land into semi-natural grassland: decadal-scale changes in topsoil C, N, 13C and 15N contents. European Journal of Soil Science (accepted).
Jensen, J.L., Schjønning, P., Christensen, B.T. & Munkholm, L.J. 2017. Suboptimal fertilization compromises soil physical properties of a hard-setting sandy loam. Soil Research 55, 332-340.
Jensen, J.L., Schjønning, P., Watts, C.W., Christensen, B.T. & Munkholm, L.J. 2017. Soil texture analysis revisited: Removal of organic matter matters more than ever. PLoS ONE 12(5), e0178039, p. 1-10.
Jensen, J.L., Christensen, B.T., Schjønning, P., Watts, C.W. & Munkholm, L.J. 2018. Converting loss-on-ignition to organic carbon content in arable topsoil: pitfalls and proposed procedure. European Journal of Soil Science 69, 604-612.
Jing, J., Christensen, J.T., Sørensen, P., Christensen, B.T. & Rubæk, G.H. 2019. Long-term effects of animal manure and mineral fertilizers on phosphorus availability and silage maize growth. Soil Use and Management (accepted).
Lutfalla, S., Abiven, S., Barré, P., Wiedemeier, D.B., Christensen, B.T., Houot, S., Kätterer, T., Macdonald, A.J., van Oort, F. & Chenu, C. 2017. Pyrogenic carbon lacks long-term persistence in temperate arable soils. Frontiers in Earth Science 5: Article 96, p.1-10.
Obour, P.B., Jensen, J.L., Lamandé, M., Watts, C.W. & Munkholm, L.J. 2018. Soil organic matter widens the range of water contents for tillage. Soil & Tillage Research 182, 57-65.
Peltre, C., Nyord, T., Christensen, B.T., Jensen, J.L., Thomsen, I.K. & Munkholm, L.J. 2016. Seasonal differences in tillage draught on a sandy loam soil with long-term additions of animal manure and mineral fertilizers. Soil Use and Management 32, 583-593.
Suarez-Tapia, A., Kucheryavskiy, S.V., Christensen, B.T., Thomsen, I.K. & Rasmussen, J. 2017. Limitation of multi-elemental fingerprinting of wheat grains: Effects of cultivar, sowing date, and nutrient management. Journal of Cereal Science 76, 76-84.

74
Suarez-Tapia, A., Thomsen, I.K., Rasmussen, J. & Christensen, B.T. 2018. Residual N effect of long-term applications of cattle slurry using winter wheat as test crop. Field Crops Research 221, 257-264.
Suarez-Tapia, A., Rasmussen, J., Thomsen, I.K. & Christensen, B.T. 2018. Early sowing increases nitrogen uptake and yields of winter wheat grown with cattle slurry or mineral fertilizers. The Journal of Agricultural Science 156, 177-187.
Tamez-Hidalgo, P., Christensen, B.T., Lever, M.A., Elsgaard, L. & Lomstein, B.Aa. 2016. Endospores, prokaryotes and microbial indicators in arable soils from three long-term experiments. Biology and Fertility of Soils 52, 101-112.
Williams, E.K. & Plante A.F. 2018. A bioenergetics framework for assessing soil organic matter persistence. Frontiers in Earth Science 6, Article 143, p. 1-12.
DCA - National Centre for Food and Agriculture is the entrance to research in food and agriculture at Aarhus University (AU). The main tasks of the centre are knowledge exchange, advisory service and interaction with authorities, organisations and businesses.
The centre coordinates knowledge exchange and advice with regard to the departments that are heavily involved in food and agricultural science. They are:
Department of Animal ScienceDepartment of Food ScienceDepartment of AgroecologyDepartment of EngineeringDepartment of Molecular Biology and Genetics
DCA can also involve other units at AU that carry out research in the relevant areas.
AARHUS UNIVERSITY
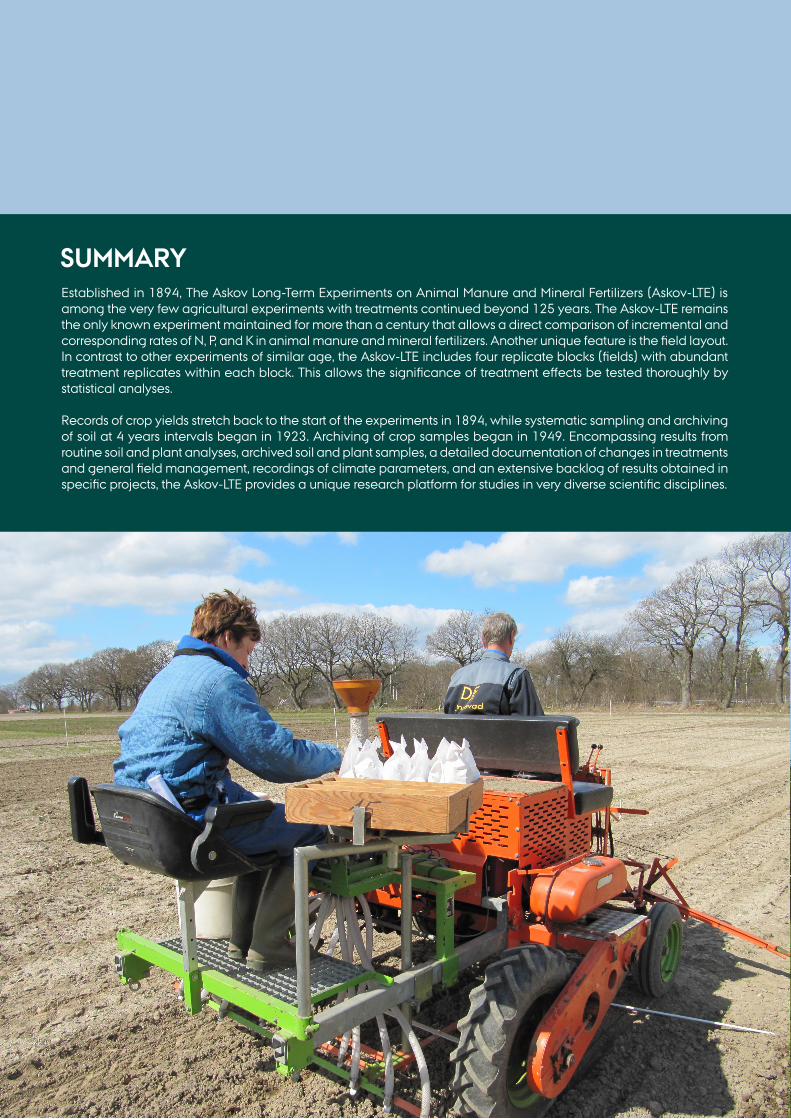
Established in 1894, The Askov Long-Term Experiments on Animal Manure and Mineral Fertilizers (Askov-LTE) is among the very few agricultural experiments with treatments continued beyond 125 years. The Askov-LTE remains the only known experiment maintained for more than a century that allows a direct comparison of incremental and corresponding rates of N, P, and K in animal manure and mineral fertilizers. Another unique feature is the field layout. In contrast to other experiments of similar age, the Askov-LTE includes four replicate blocks (fields) with abundant treatment replicates within each block. This allows the significance of treatment effects be tested thoroughly by statistical analyses.
Records of crop yields stretch back to the start of the experiments in 1894, while systematic sampling and archiving of soil at 4 years intervals began in 1923. Archiving of crop samples began in 1949. Encompassing results from routine soil and plant analyses, archived soil and plant samples, a detailed documentation of changes in treatments and general field management, recordings of climate parameters, and an extensive backlog of results obtained in specific projects, the Askov-LTE provides a unique research platform for studies in very diverse scientific disciplines.
SUMMARY


![Daisy 1894 Manual[1]](https://img.pdfslide.us/doc/110x75/5571f82749795991698cc2ee/daisy-1894-manual1.jpg)