Embed Size (px)
Citation preview

An Analysis of the Geography of EntrepreneurshipU n d e r s t a n d i n g t h e g e o g r a p h i c t r e n d s o f I n c . 5 0 0 c o m p a n i e s o v e r t h i r t y y e a r s a t t h e s t a t e a n d m e t r o p o l i t a n l e v e l s
T h E A s c E n T o f A m E r i c A ’ s
h i G h - G r o w T h c o m pA n i E s
Yasuyuki Motoyama and Brian DanleySeptember 2012

The ascenT of america’s high-growTh companies: insighTs from examining ThirTy years of inc. 500 firm daTa
The authors would like to thank dane stangler, Jared Konczal, and Kate maxwell for their valuable input, and Inc. magazine for their collaboration with this study.
©2012 by the ewing marion Kauffman foundation. all rights reserved.

The ascenT of america’s high-growTh companies: an analysis of The geography of enTrepreneurship 3
The Ascent of America’s high-Growth companies Insights from examining thirty years of Inc. 500 firm data
The Ascent of America’s high-Growth companies: An Analysis of the Geography of Entrepreneurship
Understanding the geographic trends of Inc. 500 companies over thirty years at the state and metropolitan levels
Yasuyuki Motoyama Senior Scholar, Kauffman Foundation
Brian Danley Research Assistant, Kauffman Foundation

The ascenT of america’s high-growTh companies: insighTs from examining ThirTY Years of inc. 500 firm daTa 4
Executive summaryThis report offers the first-ever deep dive into the geographic trends of America’s fastest-
growing private companies—the Inc. 500. Inc. magazine’s annual ranking, which began in 1982,
has become an important point of pride for high-achieving companies and a source of research for
economists. Not until now, however, has anyone dissected the past thirty years of comprehensive
data from these high-growth companies. Through a partnership with Inc. magazine, the Ewing
Marion Kauffman Foundation has done just that.
In this, one of a set of studies examining Inc. 500 data over time, we offer a geographic analysis
of how regional characteristics are associated with fast-growing companies and innovations.
Tracing hundreds of Inc. firms per year and thousands per decade, we have captured a range of
innovations and analyzed the regions that continuously produce fast-growing companies.
Knowing that very little is understood about the geography of high-growth companies,
we approached this analysis with a range of questions: where are the fast-growing Inc. firms
located at the state and metropolitan levels? How have they shifted over time? Do we find greater
geographic concentration of Inc. firms over time? How is the geography of Inc. firms different
from commonly associated growth factors, such as high-tech industries, venture capital firms, and
research universities?
As you review the findings of this report, keep in mind that the creation of another ranking
is not our primary objective. It is more important to demonstrate different regions with different
sectors and strengths, in contrast to previously identified areas that have been highlighted as strong
producers of high-tech companies. Thus, our objective is to shed light on formerly understudied
areas of economic development.
We hypothesized that a geographic analysis of the Inc. data would highlight surprising regional
and industrial sectors with high numbers of Inc. companies. Analysis of the Inc. 500 geographic
and industrial information led to the following major findings:
• So-calledhigh-techsectorsconstituteonlyaboutaquarteroffast-growingInc.
firms: IT (19.4 percent) and Health and Drugs (6.5 percent). Other major sectors
includeBusinessServices(10.2percent),AdvertisingandMarketing(8.5percent),
andGovernmentServices(7.3percent).Thus,innovationsandgrowthoffirms
come from a wide range of industries.
• Amonglargemetropolitanareas,Washington,D.C.,hasthehighestconcentration
of Inc. firms in terms of the number and normalized score, with more than
46 percent of them in Government Services. This rise of D.C. high-growth
companies is persistent in the last two decades, regardless of party administration,

The ascenT of america’s high-growTh companies: an analysis of The geography of enTrepreneurship 5
and demonstrates that, ironically, outsourcing federal government services plays a large role in the
growth of private firms.
• Thereareinnovative,high-growthcompaniesoutsideoftheusualsuspectsoftechnologyplaces,
likeSiliconValley.SuchsurpriseregionsincludeSaltLakeCity(second),Indianapolis(sixth),Buffalo,
N.Y.(eleventh),Baltimore(fifteenth),Nashville(eighteenth),Philadelphia(nineteenth),andLouisville,
Ky. (twentieth). These clusters of Inc. firms, including those in the area’s so-called Rust Belt Region,
suggest that population growth in the region is not necessarily a factor for growth of firms.
• Whileregionaldevelopmentliteraturesuggeststhepresenceofventurecapitalinvestment,high-
qualityresearchuniversities,federalR&Dfunding(suchasSBIR),andpatentsaregoodsourcesfor
growth, Inc. firms had no correlations with these factors. In contrast, we find that the presence of
a highly skilled labor force is important for concentration of Inc. firms.
• Wedonotfindauniform trendof increasingordecreasingconcentrationsof Inc.firmsacross
regions in the last thirty years. This geographic inequality comes in a cycle of twelve to thirteen
years. Most states remained at their relatively similar Inc. score throughout the last thirty years,
whileahandfulofstatesexperiencedradicalmoves:D.C.andUtahbecametherisingstars,New
Hampshire declined steadily, and Delaware had ups and downs.
1. introductionThe following report is an analysis of data from the Inc. 500, a list of fast-growing private firms published every
year since 1982 by Inc. magazine. Over time, many of these firms have further grown, and some of them experienced
impressive Initial Public Offerings (IPOs), while others were acquired at the scale of millions or, occasionally, billions.
SomeInc.firmsarenotunfamiliartousatall.Thisincludeswell-knownhigh-techfirms,suchasOracle,Microsoft,
SAS, and Qualcomm; e-commerce firms with millions of customers, such as Zappos and E*Trade; and everyday
retailers, such as Papa John’s and Jamba Juice, as shown in Figure 1.1 Thus, the economic impact of these specific Inc.
firms is undeniably large.
Nonetheless, surprisingly few studies have examined the economic importance of Inc. firms2 and, to the authors’
knowledge,nostudyhasinvestigatedtheirgeographicaspects.Sincethisisthefirstsuchstudy,wewillanalyzerather
descriptively and organize the report based on the following research questions:
1. Where are the fast-growing Inc. firms located at the state and metropolitan levels? How have they
shifted over time?
2. Do we find greater geographic concentration of Inc. firms over time?
3. HowisthegeographyofInc.firmsdifferentfromcommonlyassociatedgrowthfactors,suchas
high-tech industries, venture capitals, and research universities?

The ascenT of america’s high-growTh companies: insighTs from examining ThirTY Years of inc. 500 firm daTa 6
ZAPPOS•2004 .............134•2011 ..........4,000
UNDER ARMOUR•2003 .............180•2011 ..........3,900
GO DADDY•2004 .............347•2011 ..........3,200
PAPA JOHN’S•1991 ...............40•2011 ........16,000
ORACLE•1984 ...............38•2011 ......104,500
CAPELLA EDUCATION•2000 ...............84•2011 ..........1,278
SAS•1981 ...............70•2011 ........12,000
DOMINOS PIZZA•1983 .............500•2011 ......145,000
MICROSOFT•1984 .............342•2011 ........89,403
PAYCHEX•1982 .............300•2011 ........12,100
CABLEVISION•1984 .............293•2011 ........14,471
STOP & SHOP•1985 .............356•2011 ........80,000
INTUIT•1990 .............110•2011 ..........7,700
QUALCOMM•1991 .............436•2011 ........15,106
E*TRADE•1996 .............300•2011 ..........3,249
JAMBA JUICE•1998 .............750•2011 ........15,000
PRINCETON REVIEW•1988 ...............28•2011 ..........5,826
SUPER 8 MOTELS•1985 .............114•2011 ........24,000
JIFFY LUBE•1985 ...............56•2011 ........20,000
MORNINGSTAR•1990 ...............23•2011 ..........3,225
ANNU
ALIZ
ED EM
PLOY
EE G
ROWT
H
OLDER NEWERAge of Company
60%
50%
40%
30%
20%
10%
•Debut on Inc. 500•In 2011
NUMBER OF EMPLOYEES(volume of sphere)
20 Companies. 30 Years. 575,457 Jobsmost economists agree that fast-growth startups create the bulk of the nation’s new jobs. with that in mind, we thought it would be interesting to look back and see how some of the superstar inc. 500 companies of the past three decades—the ones that have gone on to change their industries and become household names—have performed on that count. The answer, as this chart shows: pretty well. The small dots in the middle of the spheres below represent the size of each company’s work force when it debuted on the list; the large spheres reflect current head counts.
figure 1: selected inc. firms and Their Employment Growth over Years.3

The ascenT of america’s high-growTh companies: an analysis of The geography of enTrepreneurship 7
10 150 50 20
Freq
uenc
y
150
10 150 50 20
Firm Age 2010
Firm Age 2006
Freq
uenc
y
150
0
what makes an inc. firmEvery year, Inc. magazine selects the top 5004 fastest-growing firms based on the following criteria:
1. Thefirmisaprivatecompany,i.e.,itsstocksarenotpubliclytraded;
2. Revenuegrowth,calculatedfromthepreviousthreeyears;forexample,ifthefirmwasselectedfor
the2011list,itsgrowthbetween2007and2010;
3. Theminimumendingrevenueis$2milliondollars.
The scale of revenue growth by these Inc. firms is astounding. For instance, since 2008, firms had to
achievegrowthofatleast10.4timestomakeittothetop500list,andtheaveragegrowthratesare17.4,14.6,and
21.7timesin2008,2009,and2010,respectively.Thus,these
are not companies with marginal growth, but with massive
growth, far more substantial than what David Birch called the
“gazelle firms.”5
How old are these Inc. firms? Due to the calculation
method, firms have to be at least four years old when they
have made it to the Inc. list. Overall, they tend to be relatively
young firms. For instance, the mean age for firms was 8.8 and
7.1yearsin2006and2010,respectively.Themedianagewas
7.0 in2006and6.0 in2010.Moreover,75percentoffirms
were ten years or younger in 2006 and eight years or younger
in2010(SeeFigure2).
While the level of revenue growth and the number of created jobs are impressive, we will make a clear distinction
from the past debate about gazelle firms, which mainly discussed how many new jobs small or young firms create
in the overall economy. Economists6 have had a series of debates on this topic, and many issues are unsolved
methodologically and conceptually. For the scope of this paper, we will not analyze how much impact the Inc. firms
have created to the overall economy. Instead, we simply
focus on the geographic context of Inc. firms, i.e., where
those companies are located. Such geographic analysis
and regional variations allow us to understand whether
certain regional characteristics promote the environment
for fast-growing companies and innovations.
Advantages of Using inc. DataFor geographic analysis, these Inc. data come with
two advantages. First, the data have a methodological
strength. Since Inc. magazine has collected data since
1982, we have almost thirty years of time-series data,
which allows us to understand changes over time. The
data have good locational information, down to the
Table 1: summary Descriptive of revenue Growth by inc. firms, 2008–2010
2008 2009 2010
minimum 6.3 5.3 7.0
maximum 315.3 198.1 204.7
average 17.4 14.6 21.7
median 10.4 8.8 13.4
figure 2: firm Age

The ascenT of america’s high-growTh companies: insighTs from examining ThirTY Years of inc. 500 firm daTa 8
street-level address, and we can easily and systemically aggregate to metropolitan or state level.
The data further have industry information, and our regional analysis can be decomposed into
industry analysis.
Secondandmore importantly, theuseof Inc.datacomeswithaconceptualadvantageof
measuring innovations. This measurement of innovations is not an easy task because, by definition,
innovation is something new and often does not fit into the existing framework, including
standardized data collection methods. Past academic studies of innovations and economic
development used some proxies with major limitations. We could classify those innovation proxies
into two categories: innovation inputs and outputs.
First, input-oriented methods measured research and development expenditures by the private
and public sectors, how many scientists and engineers were mobilized, and how many people
were employed in the so-called high-tech sectors, such as information technology, and medical
and pharmaceutical technology. Other measures included how much venture capital was invested
and how much in federal government-sponsored Small Business Innovation Research (SBIR)
awards has been disbursed. The major limitation of these input indicators was that they ignore the
efficiency between inputs and outputs, and simply assumed that larger inputs would produce more
innovations. This was a risky assumption because there was plenty of evidence that highly research-
intensive firms went bankrupt as they produced unpopular products or products that similarly
competed with other companies but produced no profits. Being high-tech or having large research
capacity does not necessarily mean that the firm will innovate, lead the market, or produce profits.
Types measure Literatureinputs r&d expenditure feldman and Lichtenberg (1998);
adams (2002)
r&d personnel porter and stern (1999); Zucker, darby, Brewer (1994)
r&d employment fingleton, igliori, moore (2003);malecki (1985); maggioni (2002)
Venture capital Zook (2002); Kenney and patton (2005)
sBir awards wallsten (2001)
outputs patents guerrero and sero (1997); co (2002);o hUallachain and Leslie (2005);sonn and park (2010)
innovation counts feldman (1994); audretsch and feldman (1996); acs et al. (2002)
Table 2: Types of innovation measures and Literature7

The ascenT of america’s high-growTh companies: an analysis of The geography of enTrepreneurship 9
We alternatively could measure innovations by output-oriented indicators, such as patents, which dozens of
academic studies have examined in the last few decades. A patent grants an inventor the right to exclude anyone
elsefromproducingorusingaspecificnewdevice,apparatus,orprocessforseventeenyearsintheUnitedStates,
and could be a powerful tool to obtain a competitive edge in the market. However, a patent addresses an invention.
It does not measure the economic value of technologies,8 and it does not necessarily produce commercial values
(cf. an innovation, by definition, is something that has a commercial value). In fact, the majority of patents have no
commercial value at all.9Criticsnotethat“patentsareaflawedmeasure[asinnovationoutput],particularlysincenot
all new innovations are patented and since patents differ greatly in their economic impact.”10 At best, there are high
correlations of patents and R&D-related activities,11 the indicators we discussed previously about innovation inputs,
but one still would have to make a large assumption that patents lead to some form of innovations.
Thesecondmeasureofinnovationoutputisinnovationcounts.TheU.S.SmallBusinessAdministrationcompiled
these data by collecting new product announcements by more than 100 technology, engineering, and trade journals.12
This good list focused on new products—only a segment of innovations—and, because it was compiled just once, in
1982, it clearly is outdated now.
Thus, measuring innovations is a challenging task, and past studies have major limitations. Particularly, only
limited methods have been available to measure innovation outputs. This is where the Inc. data can contribute.
We have to go back almost a century to the original concept of innovation pioneered by Joseph Schumpeter:
somethingnewandproducingcommercialvalue.Schumpeterfurtherprovidedexamples intypesof innovations:
new product, new markets, new production methods, and new systems. This is not even an exclusive list. Innovations
can have innumberable forms, as long as they produce commercial value. Nonetheless, the current economic studies
of innovations almost exclusively have focused on the technology side of innovations, or perhaps on product-oriented
aspects.
On the other hand, the Inc. firms’ revenue growth is a straightforward measure of the original concept of
innovations. With their high-growth achievement, it is reasonable to assume that these firms have competitive
advantages based on some kind of innovations, because companies cannot grow more than 500 times within three
years for no reason. Here, we do not argue that the growth of Inc. firms came from cutting-edge technology or
knowledge-based innovations, or that Inc. firms are “innovative” in the same sense. Yet, the bottom line is that,
by definition, Inc. firms have achieved successful commercialization, i.e., values of innovations expressed in the
economy: someone obviously values what they provide!
At the same time, we do not know how innovative they are or on what their business strengths are based.
However, it does not matter as long as we can capture the end-of-innovation measures—the commercialized value
of corporate activities. Those innovations are forces of “creative destruction” and sources of economic development.
Tracing hundreds of Inc. firms per year and thousands per decade allows us to capture the wide scope of innovations
and to analyze where certain regions are able to produce such fast-growing firms continuously. And we need
to remember that this scope of Inc. firms captures well-known, dynamic companies, such as Microsoft, Oracle,
andZappos.

The ascenT of america’s high-growTh companies: insighTs from examining ThirTY Years of inc. 500 firm daTa 10
other ranking studiesThis unique and wide scope of innovations by the Inc. data brings us a specific hypothesis
in terms of geographic analysis compared to other innovation ranking studies and geographic
analyses. There have been a number of state and metropolitan rankings with regard to innovations,
competitiveness, and creativity, to name a few. There is no way to discuss all those rankings, but it
isworthmentioningtwofrequentlycitedones:theTechPoleIndexandtheCreativityIndex.
TheMilkenInstitute’sTechPoleIndexisbasedonacalculationoflocationquotient(LQ)and
employment size in defining high-tech sectors.13 The Institute selected nineteen sub-sectors in
the manufacturing and service economy, with 3–4 digit NAICS codes. Those sub-sectors were
essentially IT, bio-tech, precision machinery, and aerospace industries. The top ten metro areas are
listedintheleftcolumnofTable3.
Richard Florida’sCreativity Index14 is based on four indicators: 1) the ratio of the so-called
“creativeclass” in the region,2)Milken’sTechPole Index,3) innovations,measuredaspatents
per capita, and 4) the Gay Index as a reasonable proxy for an area’s openness to different kinds of
peopleandideas.ThetoptenmetrosalsoarelistedintherightcolumnofTable3.
Not surprisingly, the two indices are correlated because one of the four components of Florida’s
index came from Milken’s Tech Poles. We do find some differences, partly coming from a different
classification of cities and metro areas. However, it is evident that the two lists are highly similar for
the top ten metros.
Table 3: Top Ten metropolitan Areas by milken’s and florida’s rankings
rank milken Tech poles florida’s creative regions
1 san Jose-sunnyvale-santa clara, ca san francisco, ca
2 seattle-Bellevue-everett, wa austin, Tx
3 cambridge-newton-framingham, ma san diego, ca
4 washington-arlington-alexandria, dc-Va-md-wV Boston, ma
5 Los angeles-Long Beach-glendale, ca seattle, wa
6 dallas-plano-irving, Tx chapel hill, nc
7 san diego-carlsbad-san marcos, ca houston, Tx
8 santa ana-anaheim-irvine, ca washington, d.c.
9 new york-white plains-wayne, ny-nJ new york, ny
10 san francisco-san mateo-redwood city, ca dallas, Tx
minneapolis, mn
The ascenT of america’s high-growTh companies: an analysis of The geography of enTrepreneurship 11
The scope of Florida’s index was more than high-tech industries, and included patents per capita and the
ratio of the creative-class workers. As we discussed, patents per capita are an output measure of innovations. The
creative-class workers consisted of a number of occupations, such as 1) engineers and software programmers,
which were input indicators of innovations, and 2) lawyers and management consultants, who would have high
correlations with high-tech industries. Thus, Florida’s index mixed the input and output measures of innovations. We
should approach this type of mixture with caution because of potentially high correlations between input and output
measures, particularly in high tech, and because mixing many different dimensions can mitigate explanatory power.15
As these two rankings demonstrate, a number of rankings about innovations and competitiveness tend
tomeasuresimilaraspectsoftheeconomyandgivethecrowntotheusualsuspects:SiliconValleyandBostonare
favoriteexamples,oftenfollowedbyAustin,Seattle,SanDiego,NewYork,andResearchTriangleinNorthCarolina.
What happens if we broaden our scope of innovations by going beyond high-tech industries? Are we going to find
the same regions for innovations based on Inc.-type fast-growing companies? We hypothesize that the geographic
analysis based on the Inc. data can highlight areas other than the usual suspects and industrial sectors beyond the
conventionally defined ‘high-tech’ sectors. There can be a number of fast-growing companies in so-called Rust Belt
regions, such as the Northeast and Midwest, and equally a number of fast-growing companies outside high-tech
sectors. Developing the regional ranking is only one of the objectives in this report. We further extend our analysis by
examining whether regions with many Inc. firms have correlations with other rankings or high-tech industries.
At the same time, we emphasize that the creation of another ranking is not our primary objective in this
report. It will be more important to demonstrate different regions with different sectors and strengths, in contrast
to areas previously highlighted as strong producers of high-tech companies. Thus, our objective is to shed light on
formerly understudied areas of economic development.
2. AnalysisWe start the analysis by following the main research questions: where are the fast-growing Inc. firms located
at the state and metropolitan levels? How have they shifted over time? We aggregate the number of Inc. firms by
statesandanalyzebydecades.ThereisnomysterythatCaliforniaandTexasrankhighinthetotalcountofInc.firms
becausetheyarethemostpopulatedstates.Somewhatanomalousastopopulationsize,Virginiaranksthird,though
itspopulationwastwelfthlargestintheUnitedStatesin2010,andMassachusettsrankssixth,thoughitspopulation
was fourteenth largest.
If we normalize this by population (the Inc. score, hereafter), a different picture comes up. In the 2000s,
Washington,D.C.,ranksatthetop,followedbyUtah,Virginia,Massachusetts,andMaryland.Severalstates,including
Virginia,Maryland,andMassachusetts,haveremainedinthetoptenthroughthethreedecades,whileWashington,
D.C.,andUtaharerisingstars.NewHampshirefacedasteadydeclineineachdecade.Interestingly,Californiaand
Arizona,whichbothexperiencedhighpopulationgrowth,continuouslyfellinthenormalizedscore.Figure3presents
the maps of those normalized scores in the 1990s and 2000s. For interactive animation of states, please find a graph
on our website: http://www.kauffman.org/inc500.

The ascenT of america’s high-growTh companies: insighTs from examining ThirTY Years of inc. 500 firm daTa 12
number of inc. firms inc./pop (mil)
rank state 1980s 1990s 2000s state 1980s 1990s 2000s
1 ca 770 795 717 dc 31.5 24.5 54.6
2 Tx 293 384 383 UT 16.2 30.3 42.1
3 Va 229 278 322 Va 36.9 39.1 40.1
4 ny 246 209 285 ma 36.7 42.0 33.1
5 fL 226 294 282 md 29.8 31.3 29.2
6 ma 221 267 217 co 20.9 30.3 26.9
7 ga 120 170 198 de 20.9 34.3 23.3
8 iL 170 203 194 nh 43.2 32.2 22.0
9 nJ 168 180 172 wa 17.3 20.0 20.5
10 pa 197 169 172 ga 18.4 20.7 20.4
11 md 143 166 169 nJ 21.7 21.3 19.5
12 oh 197 159 153 ca 25.7 23.4 19.2
13 wa 85 118 138 mn 13.9 22.1 18.8
14 co 69 131 136 or 11.9 17.2 17.5
15 UT 28 68 117 Tx 17.2 18.3 15.2
16 mi 146 137 107 iL 14.9 16.3 15.1
17 mn 61 109 100 fL 17.4 18.3 15.0
18 aZ 77 91 95 aZ 20.9 17.6 14.8
19 nc 108 106 91 ny 13.7 11.0 14.7
20 in 90 76 89 Tn 15.1 12.1 14.0
Table 4: Top Twenty states with the count and score of inc. firms by Decades, sorted by the score in the 2000s
Inc-State-Pop
0.0–10.010.1–20.020.1–30.030.1–40.040.1–50.7
figure 3: states with normalized scores of inc. firms by Decade
inc./mil pop 1990s inc./mil pop 2000s

The ascenT of america’s high-growTh companies: an analysis of The geography of enTrepreneurship 13
We now shift to the metropolitan scale. Unfortunately, unlike states, the boundaries of metropolitan areas
have shifted over time, usually expanding, and even the same metropolitan area has a substantially different set of
counties after two decades.16 This makes time-series analysis irrelevant, and so we focus only on the 2000s.
Westartwith largemetropolitanareaswithpopulationsofonemillionormore. ItwasnotSiliconValleyor
Boston,buttheWashington,D.C.,areathatrankednumberonebothwiththecountofInc.firmsandwiththescore,
thoughtheD.C.areaisoneoftheusualsuspectsbyotherrankings:fourthbyMilken’sandeighthbyFlorida’s.Other
usualsuspects includedAustin(third),SanFrancisco(fourth),Boston(fifth),SanJose(seventh),andRaleigh-Cary,
N.C.(eighth).SurprisingplacesareSaltLakeCity(second),butmoreparticularlyIndianapolis(sixth)andBuffalo,N.Y.
(eleventh). The latter two metropolitan areas often are referred to as icons of Rust Belt cities, where old industries
predominate with no innovations. Other Rust Belt areas include Baltimore (fifteenth), Philadelphia (nineteenth), and
Louisville,Ky.(twentieth).Thus,fiveofthetoptwentyaresurpriseplayers.Asareference,theNewYorkCityandLos
AngelesmetroareasdidhostalargenumberofInc.firms—337and251firms,respectively—buttheyrankedlow
withthenormalizedscore,onlythirtiethandtwenty-fifth,respectively.SeeAppendixAforthefulllistoffifty-two
metropolitan areas that fit into this category. Additionally, we see little correlation between population growth (since
2000) and the Inc. score in these metropolitan areas, only 0.14. Therefore, there are regions that experience little or
no population growth but enjoy a cadre of Inc. firms.
rank msA inc. firms pop (mil) inc./pop
1 washington-arlington, dc-Va-md-wV 385 5.5 70.3
2 salt Lake city, UT 57 1.1 50.4
3 austin-round rock, Tx 83 1.7 48.7
4 san francisco-oakland-fremont, ca 198 4.3 45.9
5 Boston-cambridge-Quincy, ma-nh 208 4.6 45.3
6 indianapolis-carmel, in 66 1.7 37.9
7 san Jose-sunnyvale-santa clara, ca 69 1.8 37.5
8 raleigh-cary, nc 42 1.1 37.3
9 denver-aurora-Broomfield, co 89 2.6 34.9
10 atlanta-sandy springs-marietta, ga 187 5.5 34.2
11 Buffalo-niagara falls, ny 38 1.1 33.8
12 seattle-Tacoma-Bellevue, wa 115 3.4 33.7
13 portland-Vancouver-Beaverton, or-wa 67 2.2 29.9
14 san diego-carlsbad-san marcos, ca 89 3.1 29.1
15 Baltimore-Towson, md 68 2.7 25.3
16 dallas-fort worth-arlington, Tx 158 6.4 24.5
17 minneapolis-st. paul-Bloomington, mn-wi 79 3.3 24.2
18 nashville-davidson, Tn 38 1.6 24.0
19 philadelphia-camden-wilmington, pa-nJ-de-md 140 6.0 23.5
20 Louisville/Jefferson county, Ky-in 29 1.3 23.0
Table 5: Top Twenty Large metropolitan Areas by inc. firms in the 2000s

The ascenT of america’s high-growTh companies: insighTs from examining ThirTY Years of inc. 500 firm daTa 14
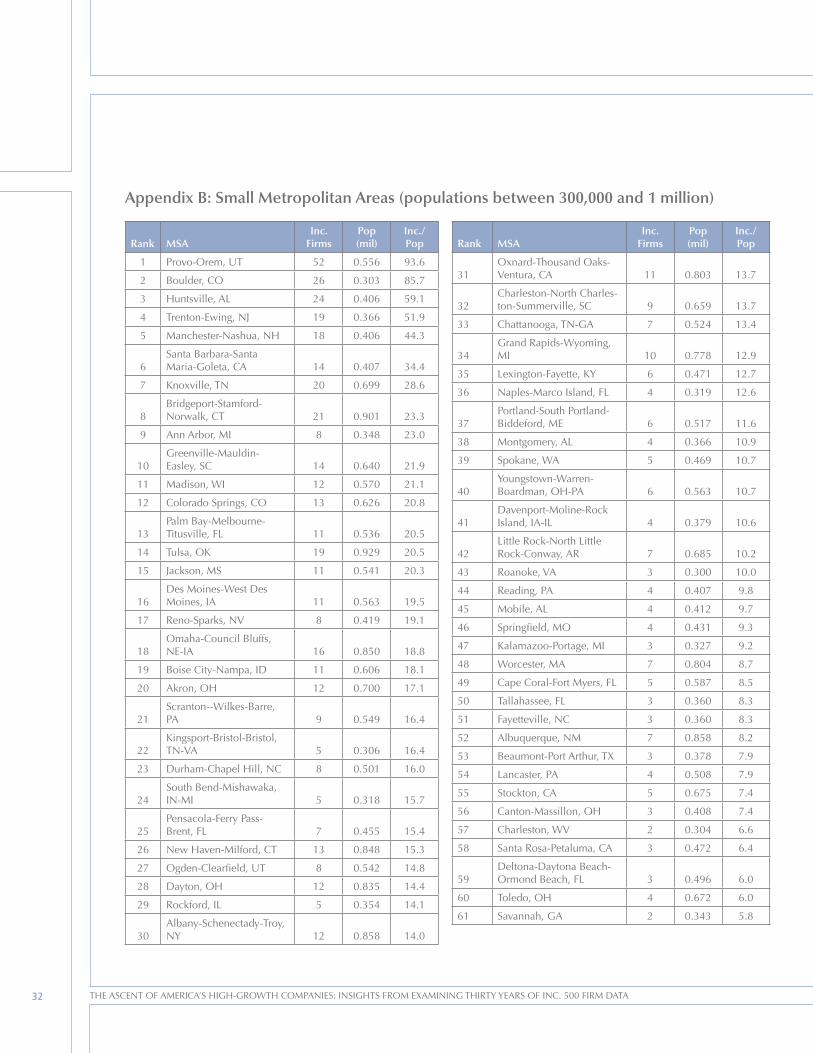
We then present metropolitan areas with populations between 300,000 and one million.
Provo-Orem,Utah,anareasouthofSaltLakeCity,rankedatthetop,andBoulder,Colo.,ranked
second. Huntsville, Ala., ranking third, may be a less-known area, but has an economic base of
NASA’sflightcenterandtheArmy’saviationandmissileresearchcenter.Twoothermetropolitan
areas sharing the top five are located in the outskirts of larger metropolitan areas with high Inc.
scores: Trenton, N.J., is east of Philadelphia (nineteeth), and Manchester, N.H., is north of Boston
(fifth).SeealsoAppendixBforthefulllistof103metropolitanareasinthiscategory.
Integrating both large and mid-size metropolitan area rankings causes certain states to be
ranked high. For example, D.C. (first), Virginia (third), and Maryland (fifth) are located in the
Washington,D.C.,metroarea,andSaltLakeCity(secondinlargecities)andProvo(firstinmedium
cities)pushUtah’srankhigh(second).
rank msA inc. firms pop (mil) inc./pop
1 provo-orem, UT 52 0.556 93.6
2 Boulder, co 26 0.303 85.7
3 huntsville, aL 24 0.406 59.1
4 Trenton-ewing, nJ 19 0.366 51.9
5 manchester-nashua, nh 18 0.406 44.3
6 santa Barbara-santa maria-goleta, ca 14 0.407 34.4
7 Knoxville, Tn 20 0.699 28.6
8 Bridgeport-stamford-norwalk, cT 21 0.901 23.3
9 ann arbor, mi 8 0.348 23.0
10 greenville-mauldin-easley, sc 14 0.640 21.9
11 madison, wi 12 0.570 21.1
12 colorado springs, co 13 0.626 20.8
13 palm Bay-melbourne-Titusville, fL 11 0.536 20.5
14 Tulsa, oK 19 0.929 20.5
15 Jackson, ms 11 0.541 20.3
16 des moines-west des moines, ia 11 0.563 19.5
17 reno-sparks, nV 8 0.419 19.1
18 omaha-council Bluffs, ne-ia 16 0.850 18.8
19 Boise city-nampa, id 11 0.606 18.1
20 akron, oh 12 0.700 17.1
Table 6: Top Twenty mid-size metropolitan Areas by inc. firms in the 2000s

The ascenT of america’s high-growTh companies: an analysis of The geography of enTrepreneurship 15
industry and regional AnalysisEarlier,weobservedthatWashington,D.C.,andHuntsville,Ala.,rankedhigh,andbothindicateconcentrations
of specific industrial sectors: government-related services for the former, and military and aeronautics for the latter.
It is critical to analyze which industrial sectors compose Inc. firms. We focus on 2005 and after, when Inc. started to
use a more systemic category of industries.
At the nationwide level, two sectors typically associated as high tech have a relatively large share: 19.4 percent
for Information Technology (IT) and 6.5 percent for the Health and Drug sector. However, we have to note that
they only constitute a quarter of sectors. The distribution of
industrial sectors is wide, and several sectors that usually do
not correspond with high-tech sectors share good portions:
AdvertisingandMarketing(8.6percent),GovernmentServices
(7.3percent),andConstruction(3.8percent).Itispossiblethat
government service firms provide their products and services
by employing high-level technologies, but this is hard for us
to conclude at this level of industrial classification. However,
we still can reasonably guess that the nation’s top-level fast-
growing firms do not necessarily come from commonly
associated high-technology-oriented sectors.
At the regional level, the most striking (albeit unsurprising)
feature is the concentration of Government Services
(46.8percent) inWashington,D.C.Wehave limitedcapacity
to analyze metropolitan areas in time-series, but have to note
thatWashington,D.C.,asacityandasametropolitanareahas
been home to a number of Inc. firms since the 1990s. Thus,
this high concentration of fast-growing companies has been a
consistent pattern since the big- vs. small-government debate
during the Clinton and George W. Bush administrations.
Furthermore,ourpreliminaryanalysisof2011dataalsoshowsthatWashington,D.C.,isthelargestareawiththe
total count and score of Inc. firms, so the pattern of concentration has not changed at all during the years of the
Obama administration.
rank sector ratio
1 iT 19.4%
2 Business services 10.2%
3 advertising & marketing 8.6%
4 government services 7.3%
5 health & drug 6.5%
6 financial services 5.6%
7 consumer products 5.0%
8 Telecom 4.0%
9 construction 3.8%
10 other manufacturing 2.6%
Table 7: Top Ten industrial sectors by inc. firms in 2005–2010

The ascenT of america’s high-growTh companies: insighTs from examining ThirTY Years of inc. 500 firm daTa 16
Ratio
Consumer Products
Health & Drugs
Adv. & Marketing
Financial
Human Resources
Business Services
IT
Govt. Services
Los Angeles New York San Francisco
Boston Chicago Washington, D.C.
Consumer Products
Health & Drugs
Adv. & Marketing
Financial
Human Resources
Business Services
IT
Govt. Services
0.1 0.2 0.3 0.4 0.1 0.2 0.3 0.40.1 0.2 0.3 0.4
0.1 0.2 0.3 0.4 0.1 0.2 0.3 0.40.1 0.2 0.3 0.4
There are further findings in the regional and industrial analysis. Reflecting the regional
industrial cluster,17 San Francisco had a higher ratio of IT firms (23.2 percent), and New York
CityandLosAngeleshadhigherportionsofAdvertisingandMarketingfirms(18.8percentand
23.9percent, respectively).Additionally,Atlanta (17.3percent)andChicago (12.9percent)had
higherconcentrationsofBusinessServices,andDallashadahighconcentrationofHealthandDrug
firms (12.0 percent).
Among the “surprise metros,” each metro comes out with a different industrial
concentration.Louisville ishigh inBusinessServices(23.1percent),Buffalo inHumanResources
(23.5percent)andEnergy(17.6percent)withrepeatcompanies,andSaltLakeCitywithConsumer
Products (15.6 percent) and Advertising and Marketing (also 15.6 percent). Indianapolis and
Philadelphia contain a relatively well-rounded mix of industries, similar to the nationwide distribution.
ProximitytoD.C.seemstoprovideanadvantageforBaltimore,withhigherGovernmentServices
(16.3percent)thantheaverage.
figure 4: industrial sectors by six selected metro Areas, 2005–2010.

The ascenT of america’s high-growTh companies: an analysis of The geography of enTrepreneurship 17
Ratio
Consumer Products
Health & Drugs
Adv. & Marketing
Financial
Human Resources
Business Services
IT
Govt. Services
Louisville Philadelphia Salt Lake City
Baltimore Buffalo Indianapolis
Consumer Products
Health & Drugs
Adv. & Marketing
Financial
Human Resources
Business Services
IT
Govt. Services
0.1 0.2 0.3 0.4 0.1 0.2 0.3 0.40.1 0.2 0.3 0.4
0.1 0.2 0.3 0.4 0.1 0.2 0.3 0.40.1 0.2 0.3 0.4
figure 5: industrial sectors by six selected “surprise” cities, 2005–2010.

The ascenT of america’s high-growTh companies: insighTs from examining ThirTY Years of inc. 500 firm daTa 18
Ratio
Consumer Products
Health & Drugs
Adv. & Marketing
Financial
Human Resources
Business Services
IT
Govt. Services
Maryland Utah Virginia
Colorado Washington, D.C. Massachusetts
Consumer Products
Health & Drugs
Adv. & Marketing
Financial
Human Resources
Business Services
IT
Govt. Services
0.1 0.2 0.3 0.4 0.1 0.2 0.3 0.40.1 0.2 0.3 0.4
0.1 0.2 0.3 0.4 0.1 0.2 0.3 0.40.1 0.2 0.3 0.4
figure 6: industrial sectors by six selected states, 2005–2010.
Atthestatelevel,wereconfirmhighratiosofGovernmentServicesinVirginia(45.3percent),
D.C.(25.0percent),andMaryland(23.2percent).Interestingly,Utah(32.2percent)hasahigher
concentrationof IT, aheadofColorado (26.2percent),Maryland (25.6percent),Massachusetts
(24.7percent),andCalifornia(21.1percent).
shift in Geographic concentration?With the basic descriptive analysis of where Inc. firms are located, we analyze the next
question: do we find more or less geographic concentration of Inc. firms over time? Answering this
question is important for policy implications. More geographic concentration over time means a
higher concentration of innovations in limited areas. Thus, it could enlarge geographic inequality in
wealth and job creation. There are two contrasting theories and empirical evidence in this matter.
We avoid an extensive literature review, but in a nutshell, the regional convergence theory18 based
on neo-classical economics suggests that innovations spill over, and innovations will be more

The ascenT of america’s high-growTh companies: an analysis of The geography of enTrepreneurship 19
equally distributed geographically over time. In contrast, the
regional divergence theory19 based on evolutionary economics
argues that certain economic and geographic endowments
bring positive and increasing feedbacks to agglomeration and
concentration. It is critical to examine empirically with specific
case, time, and location.
WeemploytheLorenzcurveandGinicoefficienttoanalyze
this pattern. Simply put, the lower the distribution curve is
located, the more unequal it is. The Gini coefficient measures
the inequality among values of a frequency distribution and
ranges from zero (perfect equality) to one (perfect inequality).
We analyze at the state level for several methodological
reasons. First, the state level is the most consistent unit over
time,asmentionedbefore.Second,wecomparetheinequalitytrendwithotherindicators,suchaspopulationand
venturecapitalinvestment(VC),andthelatterisunavailableatthesub-statelevel.
TheLorenzcurve indicatesthatthegeographicdistributionof Inc.firms issomewhatunequal,asthecurves
are way below the 45o line. More solid black lines on the lower side of the curves further demonstrate that the
distribution became more uneven throughout the 2000s.
Next, we plot the level of Gini coefficients between 1982
and 2010. Among the three variables we analyze, population
has the least unequal distribution by floating slightly above
0.5. VC investment is known to be highly unequal because
of the extremely high concentration in California and
Massachusetts,20 and the Gini coefficient confirms as much,
at around 0.8. The distribution of Inc. firms is somewhere
betweenpopulationandVCinvestment,rangingfrom0.573
to 0.678. Additionally, its geographic concentration comes
in waves: increasing inequality toward 1985, followed by a
modestdecline,withanotherpeakin1997.Then,itstartedto
increase again in 2006. In sum, the geography of Inc. firms is
notasconcentratedasVCinvestmentis,butismoreunequally
distributed than the general population. Such geographic
concentration of Inc. firms does not have a uniform pattern of
convergence or divergence over time, but comes in a cycle of
abouttwelvetothirteenyears.Currently,weareexperiencing
the most unequal distribution since this data collection started.
At this level of descriptive analysis, it is hard to know what
contributes to the inequality, and further research is needed.
Figure 7: Lorenz Curve of Inc. Firm Distribution with Fifty States and D.C., 2001–2010.
0.00.0
0.2 0.4
2001200320052007
0.6 0.8 1.0
0.2
0.4
0.6
0.8
1.0
2010
0.4
0.5
0.6
0.7
0.8
0.9
Figure 8: Graph of Gini Coefficients at the State Level, 1982–2010.
1985 1990
(Mo
re E
qua
l)(M
ore
Une
qua
l)G
ini R
atio
VC Inc. Firms
1995 2000 2005 2010
Pop

The ascenT of america’s high-growTh companies: insighTs from examining ThirTY Years of inc. 500 firm daTa 20
regression AnalysisIt is more difficult to analyze what factors are associated with enlarging regional inequality, but it is
relatively easier to analyze what factors are associated with the Inc. score by regions. More importantly,
our previous analysis has demonstrated that the location of Inc. firms does not necessarily associate with
prototypicalhigh-techorVCindicators,butthiswasonlyadescriptiveanalysis.Itisimportanttoinvestigate
in a multivariate analysis.
In this section, our dependent variable is the Inc. score at the state level between 2006 and 2010
because,asstatedearlier,theVCdataareavailableonlyatthestatelevel.SincetheInc.scoreisanormalized
indicator, we likewise employ normalized indicators for our independent variables. Our focus is whether
theInc.scoreiscorrelatedwithindicatorsofhigh-techindustries,VCinvestment,university,andpatents.
We generate the high-tech indicator21 by reconstructing Milken’s Tech Pole Index because the original
indexwasgeneratedonlyatthemetropolitanlevel.OtherindicatorsrelatedtoVCanduniversitypresence
comefromtheNationalScienceFoundation’sScienceandEngineeringIndicators.Wefurtherincludetax-
related variables, derived from the Tax Foundation’s report, and physical weather-related variables from
BestPlaces.net.
The correlational matrix (in Figure 9) demonstrates that the Inc. score is moderately correlated
with VC investment (0.46), the ratio of high-tech employment (0.65), and the ratio of science and
engineeringgraduatesperpopulation(0.55).Moreover,VCinvestmenthasdecentcorrelationswiththe
SBIRdisbursementvariable(0.71)andthehigh-techemploymentvariable(0.57).Wekeepinmindthese
correlations for concerns of multicollinearity in the multivariate analysis.
figure 9: pearson correlations of Variables
Inc.score
0 10 20 2 4 6 8 6 10 14 −0.4 0.0 0.4 20 60 3 5 7 9 20 50 80
015
015 0.33* Milken.emp
0.46*** 0.67*** VC.GDP
04
8
26 0.10 0.00006 0.29* Acad.GDP
0.0091 0.22 0.30* 0.059 Pat.cap
030
612 0.65*** 0.45*** 0.57*** 0.16 0.23 HiTechEmpl
0.34* 0.23 0.71*** 0.55*** 0.18 0.46*** SBIR
030
0
−0.4
0.4
0.36* 0.049 0.029 0.049 0.13 0.012 0.03 NewEst
0.39** 0.32* 0.41** 0.071 0.026 0.48*** 0.27.
0.0024 Income
030
2080
0.55*** 0.0012 0.15 0.13 0.15 0.27.
0.071 0.29* 0.39** SEGrad.pop
0.13 0.28.
0.22 0.26.
0.21 0.32* 0.11 0.17 0.045 0.20 TF.score
46
36
9
0.12 0.16 0.19 0.25.
0.22 0.38** 0.19 0.42** 0.057 0.13 0.58*** TF.corp
0.0094 0.23 0.085 0.042 0.12 0.18 0.088 0.17 0.098 0.029 0.051 0.26.
SunnyDays
100
250
0 10 20
2060 0.044 0.068
0 4 8
0.15 0.068
0 20 40
0.32* 0.015
0 200 500
0.27.
0.150 20 40
0.20 0.029
4 5 6 7
0.26.
0.17100 200 300
0.19 ComfortIndex

The ascenT of america’s high-growTh companies: an analysis of The geography of enTrepreneurship 21
Table 8: regression result
WestartwithabaseofModel1,which includedMilken’sTechPole Index,VC investmentoverGrossState
Product(GSP),AcademicR&DoverGSPtocontrolfortheuniversityfactor,andpatentspercapita.OnlytheVCfactor
issignificantatthe95percentlevel.NotethelowadjustedR-sq,only0.172.
In Model 2, the ratio of high-tech employment over total employment, the ratio of new establishments over
allestablishments,andtheratioofscienceandengineeringgraduatesperpopulationaresignificant,whiletheVC
factorisnowinsignificant.AnalysisofVIF(variableinflationfactor)resultsinahighfactorforVCinvestment,5.11.
WewillbeconservativetoavoidanymulticollinearityandexcludeSBIRinthenextmodel.
InModel3,wecontrolfortaxesandweather.Noneofthesetaxandweatherfactorsissignificant,whilehigh-
tech employment and science and engineering graduates remain significant. The ratio of new establishments is only
significantatthe90percentlevel,andVCinvestmentisagainnotsignificant.
ANOVAbetweenmodels indicatesthatModel2 issubstantiallybetterthanModel1,butModel3doesnot
improve Model 2. We consider that Model 2 sufficiently explains the dependent variable, but find little difference in
significancelevelofvariablesbetweenModel2andModel3.
Variables
model 1 model 2 model 3
coeff. coeff. coeff.
(intercept) 7.273 -5.654 -11.815
milken score 0.026 0.045 0.004
Vc invt / gsp 1.741** 0.386 0.578
academic r&d / gsp -0.236 -0.536 -0.309
patent / cap -0.097 -0.056 -0.049
ratio of high-tech empl 1.070*** 1.181***
sBir fund / gsp 0.006
new estab / all estab 10.076** 9.030*
per-capita income -0.022 -0.025
sci. & eng. graduates / pop 0.162*** 0.165***
overall score by Tax foundt’n 0.550
corp tax rate by Tax foundt’n -0.130
# of sunny days 0.010
comfort index 0.009
n 51.000 51.000 51.000
degrees of freedom 46.000 41.000 38.000
f-statistics 3.590 8.835 6.259
adj. r-sq 0.172 0.585 0.558
note: significance level: *** - pr(>|t|) > 0.01, ** - pr(>|t|) > 0.05, and * - pr(>|t|) > 0.1.

The ascenT of america’s high-growTh companies: insighTs from examining ThirTY Years of inc. 500 firm daTa 22
Table 9: AnoVA Table
Summary of regression findings is as follows: We conclude that VC does not statistically
contribute topredicting the Inc. score, given the low level of significanceofVC investment in
Model1andinsignificanceinModels2and3.Thehigh-techscoreofMilken’s Index,university
R&D level, and patents per capita do not contribute, either. Therefore, the geography of Inc. firms
is statistically different from those conventional factors in the regional development model.
Note that Milken’s Tech Pole Index measured the high-tech-ness with the location quotient, as
wellasthesizefactorwiththeratioofemploymenttowardtheoverallemploymentintheUnited
States.Asaresult,Californiaisatotaloutlierbyscoring24.5.Thisscore’smedianforallstatesis
0.94,while75percentofstatesrank2.64orlower.OurInc.scoredoesnothaveasizeelementin
its measure, as we normalized by the population, and is most appropriate to be regressed with a
ratio factor. That is why we introduced the ratio of high-tech employment, which turns out to be
significant in the models. Therefore, we can conclude that the Inc. score does not correlate with the
size factor (the Milken score), but does with the ratio of high-tech employment.
UniversityR&Dorpatentfactorsallareinsignificant.Atthesametime,wefurtherintroduced
an additional measure in the university role, namely, how many science and engineering graduates
reside in the population. This factor is significant, so the Inc. score is not associated with university
R&D, but with how many high-skill workers the university has produced or attracted. Therefore,
while the literature in economic development has called attention to the importance of research
universities, we find that the university’s teaching and training role is more important.
Last,whileanumberoforganizations22 claim that lower taxes are better for new firm creation
and innovation, we do not see any connections between Inc. firms and scores provided by the Tax
Foundation.
Df rss sq f-statistic pr(.|t|)
Test 1 model 1 46 1207.57
model 2 41 539.07 668.5 10.169 0.000
Test 2 model 2 41 539.07
model 3 38 532.32 6.8 0.161 0.922

The ascenT of america’s high-growTh companies: an analysis of The geography of enTrepreneurship 23
conclusion and implicationsTo sum up our findings, we go back to our original three research questions.
1. Where are the fast-growing Inc. firms located? How have they shifted over time?
First,wedidfind theusual suspectsofhigh-tech regions, suchasAustin (third),SanFrancisco (fourth),San
Jose(seventh),Boston(fifth),andSeattle(twelfth).However,themetropolitanrankingcamewithafewsurprises.
Washington,D.C.,toppedthelistastoboththenumberandscore,andSaltLakeCitywassecond.Moreover,we
found high scores in regions little known as being innovative, such as Indianapolis, Buffalo, Baltimore, Nashville,
Philadelphia,andLouisville.ScholarsandrankingproducershavediscussedlittleabouttheseRustBeltcitiesasplaces
of innovation. Yet, the results from the Inc. data suggest that we should avoid a simple classification of growing,
innovative regions vs. declining, un-innovative regions.
Second,wecananswerthisquestionmorecohesivelybyaddingtheindustryanalysis.Infact,twostorieslead
to one concluding story. At the nationwide level, only a quarter of Inc. firms are in conventional high-tech sectors,
suchasITandHealthandDrugs,andtheindustrialsectordistributionisextremelywide,includingBusinessServices
(10.2 percent), Advertising and Marketing (8.6 percent), Government Services (7.3 percent), Construction
(3.8percent),andtherest.Atthemetropolitanlevel,weobservedregionalvariationsandspecializations.Government
ServicesinWashington,D.C.,wasthebestexample;othercasesincludeAdvertisingandMarketinginNewYorkCity
andLosAngeles,BusinessServicesinChicagoandAtlanta,andHealthandDrugfirmsinDallas.
These two findings lead to the same conclusion. Innovations can come from a wide range of sectors and regions.
It highlights the vitality of formerly understudied and underappreciated regions and opens up new research questions:
what are the sources of growth for those Inc. firms in the surprise regions? What are the connections between those
Inc. firms within each region? Do we find different models of regional development in those regions? These questions
clearly are beyond the scope of this descriptive report, and we need more in-depth research in the future.
2. Do we find more geographic concentration of Inc. firms over time?
Our analysis with the Gini coefficient has shown that, while we are experiencing the heaviest geographic
concentration in the past decade, the concentration or inequality of Inc. states comes by cycles of about twelve to
thirteen years. Therefore, we do not find a uniform trend of increasing or decreasing concentration of Inc. regions.
This time-series analysis is clearer in the graphic animation. Most states remained at their relatively similar Inc. score
throughoutthelastthirtyyears,whileahandfulofstatesexperiencedradicalmoves:D.C.andUtahbecametherising
stars, New Hampshire declined steadily, and Delaware had ups and downs. We suspect that the cycle of inequality
comes from changes in these large ups and downs by a small number of states.
3. HowisthegeographyofInc.firmsdifferentfromcommonlyassociatedgrowthfactors,suchas
high-tech industries, venture capitals, and research universities?
As we suspected by highlighting understudied regions, we found almost no correlations between the Inc. score
and commonly associated growth factors. Our regression analysis has pointed out further that VC investment,
Milken’sTechPoleIndex,academicR&Dlevel,SBIRfundratio,andpatentspercapitadonotcorrelatewiththeInc.
score at the state level. However, we find correlations with the ratio of high-tech employment, and science and

The ascenT of america’s high-growTh companies: insighTs from examining ThirTY Years of inc. 500 firm daTa 24
engineering graduates, which both are workforce indicators and not research dollar indicators.
These findings indicate that the conventional regional development factors are not important for
Inc. firms. Furthermore, innovations and high growth can come from sources other than high tech,
science,orcutting-edgetechnologydescendingfromuniversities.Relatedly,thepresenceofVCor
research funds from the federal government is not the sole source of growth.
Our regression analysis further indicated that we have to be cautious with the role of universities.
We do not find evidence that research activity at universities is important, but universities’ teaching
and training element is highly relevant. A high concentration of high-tech industries do not
contribute to the higher Inc. score, since Milken’s Index was insignificant, but the presence of a
high-skill labor force is important for the concentration of Inc. firms.
We have to draw findings into a policy implication. Many state and local governments have
tried to promote economic development through high-tech-oriented programs, such as science
parks, incubation centers, and state venture funds. There is enough empirical evaluation research
to conclude that those programs do not function as desired, which this report will not spare.23
Additionally, the analysis through Inc. firms demonstrates that high-growth Inc. firms are not
related to those high-tech-oriented programs, because there was no correlation with high-tech-
ness,SBIRfunds,andVCs.Wehavetofundamentallyrevisittheeffectivenessofstateeconomic
programs. Moreover, state programs should not target high-tech firms, but high-growth firms,
which create more revenue and employment.
The rise and dominance of the Washington, D.C., metro area requires further discussion.
The federal government, whose bulk functions are concentrated in Washington, D.C., and
surrounding areas in Maryland and Virginia, has increased its spending, adjusted to inflation,
but itsemploymentandtheshareofGDPhavefluctuated inthemeantime. Inanutshell,high
spendingandemploymentwereshedduring theClintonyears in the1990s.Employmentheld
steady during the George W. Bush administration, but spending per GDP increased during the
2000s. The Obama administration has increased both employment and spending since 2008 (see
Table10).Inanycase,thecontinuousriseofInc.firmsintheD.C.metroareadoesnotcoincide
with the employment trend, but does coincide with the spending element, with roughly one-
third of that spending growth driven by defense spending. Thus, it is reasonable to conclude that
outsourcing of government services, regardless of Democrat or Republican regimes, has fed the
hugecomplexoffast-growingcompaniesintheD.C.area.Thisistotallyironic,butmanynations’
fastest-growing companies have persistently had deep connections with their federal governments.
TheUnitedStatesgovernmentisnotconventionallyknownasagovernmentwithindustrialpolicy;24
however, we find de facto industrial policy through outsourcing. Table 11 further confirms that
D.C.,Maryland,andVirginiaarethetopstateswiththehighestratioofgovernmentemployment
among the continental forty-eight states.
This opens up new debates about the function and location of federal government. The
Washington,D.C.,areawasamongthecountry’sfastest-growingmetropolitanareasinthepast
two decades, and it was the first major metro area to recover from the housing bubble in early

The ascenT of america’s high-growTh companies: an analysis of The geography of enTrepreneurship 25
2009,aheadofNewYork,andcomparabletoSanFranciscoandLosAngeles.25Inshort,D.C.’srapidandsustainable
growth has depended on the federal government. Then, though we may not have two federal capitals, can we
decentralizesomefunctionsofthefederalgovernmenttootherareastoavoidthehighD.C.concentration,assuming
that the locational division would not cause friction?26 The Inc. data suggest that we need to revisit the role of
government and its spillover effect.
Yearfed Empl (thous)
Total spending (bil, 1990)
Defense spending (bil, 1990)
Dhs spending (bil, 1990)
GDp (bil) spending/GDp
1990 2,250 1,253.0 342.1 5,800.5 21.6%
1991 2,243 1,270.8 307.5 5,750.1 22.1%
1992 2,225 1,287.0 324.6 5,908.3 21.8%
1993 2,157 1,274.8 311.1 6,030.7 21.1%
1994 2,085 1,289.1 296.6 6,248.6 20.6%
1995 2,012 1,299.9 279.9 6,358.9 20.4%
1996 1,934 1,299.9 263.4 6,529.6 19.9%
1997 1,872 1,303.8 264.6 6,785.3 19.2%
1998 1,856 1,325.0 259.0 7,051.0 18.8%
1999 1,820 1,335.1 261.4 7,337.9 18.2%
2000 1,778 1,357.8 272.2 7,553.2 18.0%
2001 1,792 1,374.8 270.2 7,591.2 18.1%
2002 1,818 1,460.9 306.4 7,731.8 18.9%
2003 1,867 1,534.2 343.0 22.2 7,914.6 19.4%
2004 1,882 1,586.4 375.3 25.3 8,201.3 19.3%
2005 1,872 1,654.3 401.5 26.9 8,447.7 19.6%
2006 1,880 1,721.3 402.7 26.2 8,672.6 19.8%
2007 1,888 1,720.1 411.4 27.1 8,843.1 19.5%
2008 1,960 1,810.6 442.9 28.5 8,722.8 20.8%
2009 2,094 2,143.0 483.7 26.0 8,491.9 25.2%
2010 2,133 2,071.6 507.8 33.2 8,707.0 23.8%
Table 10: federal Employment, spending since 199027
states percentage
d.c. 38
alaska 31
Virginia 27
maryland 26
hawaii 24
Table 11: Top five states with federal, state, and Local Government Employment ratio28

The ascenT of america’s high-growTh companies: insighTs from examining ThirTY Years of inc. 500 firm daTa 26
Last,wehavetoreconsiderwhatthestateormetropolitanrankingsmeanordonotmean.The
world can have as many rankings as proposed with different data and methodology. However, that
is not the end of story. People, media, and politicians are not only keen to rankings, but also driven
by rankings.29 Policymakers initiate or justify their economic development programs based on some
selection of rankings. While those rankings by states vary substantially,30 many of them highlight
the usual suspects, which we have referred to as conventional high-tech regions. Indeed, some
analysis in this report contains rankings of states and metropolitan areas. However, we cannot
emphasize enough that the objective in our rankings was not to celebrate the winners, but to
highlight formerly understudied regions and industries, as well as to discuss alternative models of
regionaldevelopment.Sincethescopeofthisreportwasdescriptiveanalysis,wehaveachieved
only a beginning piece. We hope that further analysis of Inc. and other regional data will bring new
debates in policy and economic development.

The ascenT of america’s high-growTh companies: an analysis of The geography of enTrepreneurship 27
Endnotes1. Inc. magazine (2011) calculated that the top ten largest job-creating firms generated net growth of 370,592 jobs.
accessed on march 10, 2012. http://images.inc.com/inc5000/2011/inc5000-job-creators.gif. in our calculation, 478 of the top 500 firms in 2011 generated 28,365 jobs, an average of 59.3 employment increase per firm over three years.
2. a few exceptions we found are Bhide (2000), and markmand and gartner (2002).
3. Inc. magazine. 2012. 20 companies. 30 years. 2011 [cited march 15, 2012]. available from http://images.inc.com/inc5000/2011/employee-growth-chart-lg.jpg.
4. since 2007, inc. has expanded the list from 500 to 5,000. Because the primary objective of this report is the geo-graphic distribution over time since the 1980s, we will focus on the top 500 firms of every year.
5. The precise definition of “gazelle firms” by Birch (1982) was private businesses having at least $100,000 in annual revenues and sustaining annual revenue growth of more than 20 percent over a four-year period. he focused on those firms because they produced disproportionately large—more than 70 percent—of net new jobs.
6. see, for example, Birch (1981, 1987), acs and audretsch (1989), Brown et al. (1990), davis et al. (1996a, 1996b), haltiwanger and Krizan (1999), acs (2008), acs and mueller (2008), and henrekson and Johansson (2010).
7. modified from ratanawaraha and polenske (2003, 32–34) and acs et al. (2002, 1069).
8. hall et al. (2001).
9. griliches (1990, 1679) found that the median value of patents is close to zero or below. mowery (2010) stated that more than 90 percent of patents filed in the United states had no commercial value.
10. pakes and griliches (1980, 378).
11. feldman and florida (1994); audretsch and feldman (1996).
12. for details of this database, see acs and audretsch (1988, 1990).
13. see devol et al. (2009, 53–54) for details.
14. see florida (2004) or florida (2002): http://www.washingtonmonthly.com/features/2001/0205.florida.html.
15. as a reference, milken’s and florida’s rankings have a relatively low correlation of 0.377, out of 261 compatible metro areas.
16. for example, the Kansas city metropolitan area had eleven counties in its boundary in the 1990s, but added four more counties in the 2000s.
17. see porter (1998, 82) as an example for the description of regional clusters.
18. see mcLuhan (1964), pascal (1987), co (2002), and Johnson and Brown (2004).
19. see romer (1994), arrow (2000), o hUallachain (1999), and Bettencourt et al. (2007).
20. nsf (2011, 8–122, 8–124).
21. By following their methodology (milken, 2009, 53).
22. for example, Tax foundation (2012), small Business and entrepreneurship council (2011), and Beacon hill insti-tute (2010).
23. see, for example, Lerner (2009) for state venture funds and amezcua (2010) for incubation centers.
24. see motoyama et al. (2011) for this debate.
25. standard and poor’s. 2012. case-shiller index. http://www.standardandpoors.com/indices/sp-case-shiller-home-price-indices/en/us/?indexid=spusa-cashpidff--p-us----, downloaded June 6, 2012.

The ascenT of america’s high-growTh companies: insighTs from examining ThirTY Years of inc. 500 firm daTa 28
26. for instance, schramm (2006) proposed moving the department of Labor to detroit. we do not necessarily argue which department should be relocated to which city, as this is totally an open subject. http://www.inc.com/magazine/20060601/views-opinion.html, downloaded June 13, 2012.
27. employment figure from U.s. office of personnel management. 2012. http://www.opm.gov/feddata/historicalTables/executiveBranchsince1940.asp, downloaded June 6, 2012; spending and gdp figures from Usgovernmentspending.com. 2012. http://www.usgovernmentspending.com/download_multi_year_1990_2010Usb_13s1li101mcn_f0f, downloaded June 6, 2012; consumer price index from Bureau of Labor statistics. 2012. http://data.bls.gov/pdq/surveyoutputservlet, down-loaded June 6, 2012; department of homeland security. Budget in Brief. http://www.dhs.gov/xabout/budget/dhs-budget.shtm, downloaded June 13, 2012.
28. gallup economy. 2012. http://www.gallup.com/poll/141785/gov-employment-ranges-ohio.aspx, downloaded June 6, 2012.
29. erickson (1987).
30. fisher (2005) and Kolko et al. (2011).
Bibliographyacs, Zoltan. 2008. high-impact firms: gazelles revisited. in Small Business Research Summary.
washington, d.c.: small Business administration office of advocacy.
acs, Zoltan, Luc anselin, and attila Varga. 2002. “patents and innovation counts as measures of regional production of new knowledge.” Research Policy no. 31 (7):1069–1086.
acs, Zoltan, and david B. audretsch. 1988. “innovation in large and small firms: an empirical analysis.” American Economic Review no. 78 (4):678–90.
acs, Zoltan, and david B. audretsch. 1989. “Birth and firm size.” Southern Economic Journal no. 56 (2):467–475.
acs, Zoltan, and david B. audretsch. 1990. Innovation and small firms. cambridge, ma: miT press.
acs, Zoltan, and pamela mueller. 2008. “employment effects of business dynamics: mice, gazelles, and elephants.” Small Business Economics no. 30 (1):85–100.
amezcua, alejandro s. 2010. Boon or Boondoggle?: Business Incubation as Entrepreneurship Policy, doctoral dissertation in public administration, syracuse University, syracuse, n.y.
arrow, Kenneth J. 2000. “increasing returns: historiographic issues and path dependence.” European Journal History of Economic Thought no. 7 (2):171–180.
audretsch, david B., and maryann p. feldman. 1996. “r&d spillovers and the geography of innovation and production.” American Economic Review no. 86 (3):630–640.
Beacon hill institute. 2010. state competitiveness report. Boston: suffolk University.
Bettencourt, Luis m.a., Jose Lobo, and deborah strumsky. 2007. “invention in the city: increasing returns to patenting as a scaling function of metropolitan size.” Research Policy no. 36:107–120.
Birch, david L. 1981. “who creates jobs?” The Public Interest no. 65:3–14.

The ascenT of america’s high-growTh companies: an analysis of The geography of enTrepreneurship 29
Birch, david L. 1987. Job creation in America: How our smallest companies put the most people to work. new york: free press.
Bhide, amar. 2000. The origin and evolution of new businesses. oxford: oxford University press.
Brown, c., J. hamilton, and J. medoff. 1990. Employers large and small. cambridge, ma: harvard University press.
co, catherine. 2002. “evolution of the geography of innovation: evidence from patent data.” Growth and Change no. 33 (4):393–423.
davis, s.J., John haltiwanger, and s. schuh. 1996. Job creation and destruction. cambridge, ma: miT press.
davis, s.J., John haltiwanger, and s. schuh. 1996. “small business and job creation: dissecting the myth and reassessing the facts.” Small Business Economics no. 8 (4):297–315.
deVol, ross c., Kevin Klowden, armen Bedroussian, and Benjamin yeo. 2009. north america’s high-tech economy: The geography of knowledge-based industries. santa monica, ca: milken institute.
feldman, maryann p., and richard florida. 1994. “The geographic sources of innovation: technological infrastructure and product innovation in the U.s.” Annals of the Association of American Geographers no. 84:210–229.
fisher, peter. 2005. grading places: what do the business climate rankings really tell us? washington, d.c: economic policy institute.
florida, richard. 2002. The rise of the creative class: why cities without gays and rock bands are losing the economic development race. Washington Monthly, may.
florida, richard L. 2004. The rise of the creative class. new york, n.y.: Basic Books.
griliches, Zvi. 1990. “patent statistics as economic indicators: a survey.” Journal of Economic Literature no. 28 (4):1661–1707.
hall, Bronwyn h., adam B. Jaffe, and manuel Trajtenberg. 2001. The nBer patent citations data file: Lessons, insights and methodological tools. in NBER Working Paper. cambridge, ma: national Bureau of economic research.
haltiwanger, John, and c.J. Krizan. 1999. “small business and job creation in the United states: The role of new and young businesses.” in Are small firms important? Their role and impact, edited by Zoltan acs, 79–97. Boston: Kluwer academic.
henrekson, magnus, and dan Johansson. 2010. “gazelles as job creators: a survey and interpretation of the evidence.” Small Business Economics no. 35 (2):227–244.
Johnson, daniel K., and amy s. Brown. 2004. “how the west has won: regional and industrial inversion in U.s. patent activity.” Economic Geography no. 80 (3):241–260.
Kolko, Jed, david newmark, and marisol cuellar mejia. 2011. public policy, state business climates, and economic growth. in NBER Working Paper. cambridge, ma: national Bureau of economic research.
Lerner, Joshua. 2009. Boulevard of broken dreams: Why public efforts to boost entrepreneurship and venture capital have failed and what to do about it. princeton: princeton University press.
markman, gideon d., and william B. gartner. 2002. “is extraordinary growth profitable? a study of inc. 500 high-growth companies.” Entrepreneurship Theory and Practice no. 27 (1):65–75.
mcLuhan, marshall. 1964. Understanding media: the extensions of man. 1st ed. new york: mcgraw-hill.
motoyama, yasuyuki, richard p. appelbaum, and rachel parker. 2011. “The national nanotechnology initiative: federal support for science and technology, or hidden industrial policy?” Technology in Society no. 33 (1-2):109–118.
mowery, david. 2009. “nanotechnology: a new wave of the U.s. national innovation system?” in Society for the Study of Nanoscience and Emerging Technologies (s.net). seattle, wa.
national science foundation. 2011. science and engineering indicators. washington, d.c.: national science foundation.

The ascenT of america’s high-growTh companies: insighTs from examining ThirTY Years of inc. 500 firm daTa 30
o hUallachain, Breandan. 1999. “patent places: size matters.” Journal of Regional Science no. 39 (4):613-636.
o hUallachain, Breandan, and Timothy f. Leslie. 2007. “rethinking the regional knowledge production function.” Journal of Economic Geography no. 7:737–752.
pascal, anthony. 1987. “The vanishing city.” Urban Studies no. 24:597–603.
porter, michael e. 1998. “clusters and the new economics of competition.” Harvard Business Review no. 76 (6):77–90.
ratanawaraha, apiwat, and Karen r. polenske. 2007. “measuring the geography of innovation: a Literature review.” in Economic Geography of Innovation, edited by Karen r. polenske, 30–59. cambridge: cambridge University press.
romer, paul m. 1994. “origins of endogenous growth.” Journal of Economic Perspectives no. 8 (1):3–22.
schumpeter, Joseph alois. 1912. Theorie der wirtschaftlichen entwicklung (Theory of Economic Development). Leipzig: duncker and humblot.
schumpeter, Joseph alois. 1926. The Theory of Economic Development: An Inquiry into Profits, Capital, Credit, Interest, and the Business Cycle, Social science classics series. new Brunswick, n.J.: Transaction Books.
small Business and entrepreneurship council. 2011. small Business survival index: ranking the policy environment for entrepreneurship across the nation. edited by raymond J. Keating. washington, d.c.: sBec.
Tax foundation. 2012. state Business Tax climate index. In collaboration with KPMG LLP. washington, d.c.: Tax foundation.

rank msainc.
firmspop (mil) inc./pop
1 washington-arlington, dc-Va-md-wV
385 5.5 70.3
2 salt Lake city, UT 57 1.1 50.4
3 austin-round rock, Tx 83 1.7 48.7
4 san francisco-oakland-fre-mont, ca
198 4.3 45.9
5 Boston-cambridge-Quincy, ma-nh
208 4.6 45.3
6 indianapolis-carmel, in 66 1.7 37.9
7 san Jose-sunnyvale-santa clara, ca
69 1.8 37.5
8 raleigh-cary, nc 42 1.1 37.3
9 denver-aurora-Broomfield, co 89 2.6 34.9
10 atlanta-sandy springs-marietta, ga
187 5.5 34.2
11 Buffalo-niagara falls, ny 38 1.1 33.8
12 seattle-Tacoma-Bellevue, wa 115 3.4 33.7
13 portland-Vancouver-Beaverton, or-wa
67 2.2 29.9
14 san diego-carlsbad-san mar-cos, ca
89 3.1 29.1
15 Baltimore-Towson, md 68 2.7 25.3
16 dallas-fort worth-arlington, Tx 158 6.4 24.5
17 minneapolis-st. paul-Blooming-ton, mn-wi
79 3.3 24.2
18 nashville-davidson, Tn 38 1.6 24.0
19 philadelphia-camden-wilming-ton, pa-nJ-de-md
140 6.0 23.5
20 Louisville/Jefferson county, Ky-in
29 1.3 23.0
21 columbus, oh 40 1.8 22.2
22 miami-fort Lauderdale-pompa-no Beach, fL
122 5.5 22.0
23 phoenix-mesa-scottsdale, aZ 86 4.4 19.7
24 orlando-Kissimmee, fL 41 2.1 19.7
25 Los angeles-Long Beach-santa ana, ca
251 12.9 19.5
26 rochester, ny 19 1.0 18.3
rank msainc.
firmspop (mil) inc./pop
27 chicago-naperville-Joliet, iL-in-wi
175 9.6 18.3
28 milwaukee-waukesha-west allis, wi
28 1.6 18.0
29 oklahoma city, oK 22 1.2 17.9
30 new york-northern new Jersey, ny-nJ-pa
337 19.1 17.7
31 Birmingham-hoover, aL 19 1.1 16.8
32 cleveland-elyria-mentor, oh 35 2.1 16.7
33 houston-sugar Land-Baytown, Tx
97 5.9 16.5
34 detroit-warren-Livonia, mi 68 4.4 15.4
35 Tampa-st. petersburg-clearwa-ter, fL
41 2.7 14.9
36 charlotte-gastonia-concord, nc-sc
26 1.7 14.9
37 sacramento--arden-arcade--roseville, ca
31 2.1 14.6
38 st. Louis, mo-iL 41 2.8 14.5
39 cincinnati-middletown, oh-Ky-in
31 2.2 14.3
40 richmond, Va 17 1.2 13.7
41 Las Vegas-paradise, nV 26 1.9 13.7
42 pittsburgh, pa 31 2.4 13.2
43 Kansas city, mo-Ks 27 2.1 13.1
44 san antonio, Tx 26 2.1 12.5
45 Virginia Beach-norfolk-new-port news, Va-nc
21 1.7 12.5
46 providence-new Bedford-fall river, ri-ma
18 1.6 11.2
47 Jacksonville, fL 14 1.3 10.5
48 hartford-west hartford-east hartford, cT
11 1.2 9.2
49 memphis, Tn-ms-ar 12 1.3 9.2
50 Tucson, aZ 7 1.0 6.9
51 riverside-san Bernardino-ontario, ca
20 4.1 4.8
52 new orleans-metairie-Kenner, La
0 1.2 0.0
Appendix A: Large metropolitan Areas (populations of 1 million +)
The ascenT of america’s high-growTh companies: insighTs from examining ThirTY Years of inc. 500 firm daTa 32
rank msAinc.
firmspop (mil)
inc./pop
1 provo-orem, UT 52 0.556 93.6
2 Boulder, co 26 0.303 85.7
3 huntsville, aL 24 0.406 59.1
4 Trenton-ewing, nJ 19 0.366 51.9
5 manchester-nashua, nh 18 0.406 44.3
6santa Barbara-santa maria-goleta, ca 14 0.407 34.4
7 Knoxville, Tn 20 0.699 28.6
8Bridgeport-stamford-norwalk, cT 21 0.901 23.3
9 ann arbor, mi 8 0.348 23.0
10greenville-mauldin-easley, sc 14 0.640 21.9
11 madison, wi 12 0.570 21.1
12 colorado springs, co 13 0.626 20.8
13palm Bay-melbourne-Titusville, fL 11 0.536 20.5
14 Tulsa, oK 19 0.929 20.5
15 Jackson, ms 11 0.541 20.3
16des moines-west des moines, ia 11 0.563 19.5
17 reno-sparks, nV 8 0.419 19.1
18omaha-council Bluffs, ne-ia 16 0.850 18.8
19 Boise city-nampa, id 11 0.606 18.1
20 akron, oh 12 0.700 17.1
21scranton--wilkes-Barre, pa 9 0.549 16.4
22Kingsport-Bristol-Bristol, Tn-Va 5 0.306 16.4
23 durham-chapel hill, nc 8 0.501 16.0
24south Bend-mishawaka, in-mi 5 0.318 15.7
25pensacola-ferry pass-Brent, fL 7 0.455 15.4
26 new haven-milford, cT 13 0.848 15.3
27 ogden-clearfield, UT 8 0.542 14.8
28 dayton, oh 12 0.835 14.4
29 rockford, iL 5 0.354 14.1
30albany-schenectady-Troy, ny 12 0.858 14.0
rank msAinc.
firmspop (mil)
inc./pop
31oxnard-Thousand oaks-Ventura, ca 11 0.803 13.7
32charleston-north charles-ton-summerville, sc 9 0.659 13.7
33 chattanooga, Tn-ga 7 0.524 13.4
34grand rapids-wyoming, mi 10 0.778 12.9
35 Lexington-fayette, Ky 6 0.471 12.7
36 naples-marco island, fL 4 0.319 12.6
37portland-south portland-Biddeford, me 6 0.517 11.6
38 montgomery, aL 4 0.366 10.9
39 spokane, wa 5 0.469 10.7
40youngstown-warren-Boardman, oh-pa 6 0.563 10.7
41davenport-moline-rock island, ia-iL 4 0.379 10.6
42Little rock-north Little rock-conway, ar 7 0.685 10.2
43 roanoke, Va 3 0.300 10.0
44 reading, pa 4 0.407 9.8
45 mobile, aL 4 0.412 9.7
46 springfield, mo 4 0.431 9.3
47 Kalamazoo-portage, mi 3 0.327 9.2
48 worcester, ma 7 0.804 8.7
49 cape coral-fort myers, fL 5 0.587 8.5
50 Tallahassee, fL 3 0.360 8.3
51 fayetteville, nc 3 0.360 8.3
52 albuquerque, nm 7 0.858 8.2
53 Beaumont-port arthur, Tx 3 0.378 7.9
54 Lancaster, pa 4 0.508 7.9
55 stockton, ca 5 0.675 7.4
56 canton-massillon, oh 3 0.408 7.4
57 charleston, wV 2 0.304 6.6
58 santa rosa-petaluma, ca 3 0.472 6.4
59deltona-daytona Beach-ormond Beach, fL 3 0.496 6.0
60 Toledo, oh 4 0.672 6.0
61 savannah, ga 2 0.343 5.8
Appendix B: small metropolitan Areas (populations between 300,000 and 1 million)

The ascenT of america’s high-growTh companies: an analysis of The geography of enTrepreneurship 33
rank msAinc.
firmspop (mil)
inc./pop
62greensboro-high point, nc 4 0.715 5.6
63 harrisburg-carlisle, pa 3 0.537 5.6
64Killeen-Temple-fort hood, Tx 2 0.379 5.3
65 port st. Lucie, fL 2 0.406 4.9
66 Vallejo-fairfield, ca 2 0.407 4.9
67 wichita, Ks 3 0.613 4.9
68 syracuse, ny 3 0.646 4.6
69 fresno, ca 4 0.915 4.4
70 Bakersfield, ca 3 0.807 3.7
71 springfield, ma 2 0.699 2.9
72 eugene-springfield, or 1 0.351 2.8
73 evansville, in-Ky 1 0.352 2.8
74 wilmington, nc 1 0.355 2.8
75 columbia, sc 2 0.745 2.7
76 anchorage, aK 1 0.375 2.7
77 el paso, Tx 2 0.751 2.7
78 salem, or 1 0.396 2.5
79allentown-Bethlehem-easton, pa-nJ 2 0.816 2.5
80 fort wayne, in 1 0.414 2.4
81 corpus christi, Tx 1 0.416 2.4
82 flint, mi 1 0.424 2.4
83 honolulu, hi 2 0.908 2.2
84fayetteville-springdale-rogers, ar-mo 1 0.465 2.2
85 winston-salem, nc 1 0.485 2.1
86 modesto, ca 1 0.510 2.0
87 Baton rouge, La 0 0.787 0.0
88mcallen-edinburg-mis-sion, Tx 0 0.741 0.0
89Bradenton-sarasota-Venice, fL 0 0.688 0.0
90poughkeepsie-newburgh-middletown, ny 0 0.677 0.0
91Lakeland-winter haven, fL 0 0.583 0.0
rank msAinc.
firmspop (mil)
inc./pop
92augusta-richmond county, ga-sc 0 0.539 0.0
93 Lansing-east Lansing, mi 0 0.454 0.0
94 Visalia-porterville, ca 0 0.430 0.0
95 york-hanover, pa 0 0.429 0.0
96 asheville, nc 0 0.413 0.0
97 salinas, ca 0 0.410 0.0
98 Brownsville-harlingen, Tx 0 0.396 0.0
99 shreveport-Bossier city, La 0 0.392 0.0
100 peoria, iL 0 0.376 0.0
101hickory-Lenoir-morgan-ton, nc 0 0.365 0.0
102 ocala, fL 0 0.329 0.0
103 green Bay, wi 0 0.305 0.0
Appendix B: small metropolitan Areas (populations between 300,000 and 1 million)

The ascenT of america’s high-growTh companies: insighTs from examining ThirTY Years of inc. 500 firm daTa 34
State 1980s 1990s 2000s 1980s 1990s 2000s
aK 15 5 3 27.1 8.0 4.2
aL 42 55 57 10.4 12.4 11.9
ar 16 4 10 6.8 1.5 3.4
aZ 77 91 95 20.9 17.6 14.8
ca 770 795 717 25.7 23.4 19.2
co 69 131 136 20.9 30.3 26.9
cT 76 62 47 23.1 18.2 13.1
dc 19 14 33 31.5 24.5 54.6
de 14 27 21 20.9 34.3 23.3
fL 226 294 282 17.4 18.3 15.0
ga 120 170 198 18.4 20.7 20.4
hi 15 0 4 13.5 0.0 2.9
ia 34 24 28 12.2 8.2 9.2
id 15 16 19 14.8 12.3 12.1
iL 170 203 194 14.9 16.3 15.1
in 90 76 89 16.2 12.5 13.7
Ks 40 53 23 16.1 19.7 8.0
Ky 30 52 35 8.1 12.8 8.1
La 25 24 15 5.9 5.4 3.3
ma 221 267 217 36.7 42.0 33.1
md 143 166 169 29.8 31.3 29.2
me 6 13 11 4.9 10.2 8.3
mi 146 137 107 15.7 13.8 10.8
mn 61 109 100 13.9 22.1 18.8
mo 62 76 57 12.1 13.6 9.5
ms 7 14 20 2.7 4.9 6.7
state 1980s 1990s 2000s 1980s 1990s 2000s
mT 2 3 10 2.5 3.3 10.1
nc 108 106 91 16.2 13.1 9.5
nd 2 2 5 3.1 3.1 7.4
ne 25 18 23 15.8 10.5 12.6
nh 48 40 29 43.2 32.2 22.0
nJ 168 180 172 21.7 21.3 19.5
nm 24 31 11 15.8 17.0 5.3
nV 5 18 33 4.1 8.9 12.2
ny 246 209 285 13.7 11.0 14.7
oh 197 159 153 18.1 14.0 13.3
oK 30 51 41 9.5 14.8 10.9
or 34 59 67 11.9 17.2 17.5
pa 197 169 172 16.6 13.8 13.5
ri 23 19 14 22.9 18.1 13.3
sc 33 27 35 9.4 6.7 7.5
sd 5 4 0 7.2 5.3 0.0
Tn 74 69 89 15.1 12.1 14.0
Tx 293 384 383 17.2 18.3 15.2
UT 28 68 117 16.2 30.3 42.1
Va 229 278 322 36.9 39.1 40.1
VT 9 10 2 15.9 16.4 3.2
wa 85 118 138 17.3 20.0 20.5
wi 77 84 51 15.7 15.6 9.0
wV 5 7 8 2.8 3.9 4.3
wy 6 3 2 13.2 6.1 3.5
Appendix c

The ascenT of america’s high-growTh companies: an anaLysis of The geography of enTrepreneUrship
Appendix c

4801 rocKhiLL roadKansas ciTy, missoUri 64110
816-932-1000 www.kauffman.org