Embed Size (px)
Citation preview
The Art & Science of Managing Command File
Errors
Leila Meshkat, Ph.D.
Jet Propulsion Laboratory
California Institute of Technology
Collaborators: Bruce Waggoner, Larry Bryant, Grant Faris

Outline Problem Statement
Approach
Summary of Tools & techniques
Sigma Tool
Empirical Analysis
Bayesian Belief Networks Models
Use Cases
Conclusions
2
Problem Statement
Develop and infuse techniques to reduce the rate of operations errors at JPL and NASA. A command file is a piece of software sent to the spacecraft for
command & control purposes. Therefore, along with flight software and avionics modules, commands contribute to the command and control functions of a spacecraft.
Command File Errors(CFEs) account for an alarming fraction of spacecraft anomalies and near misses.
3
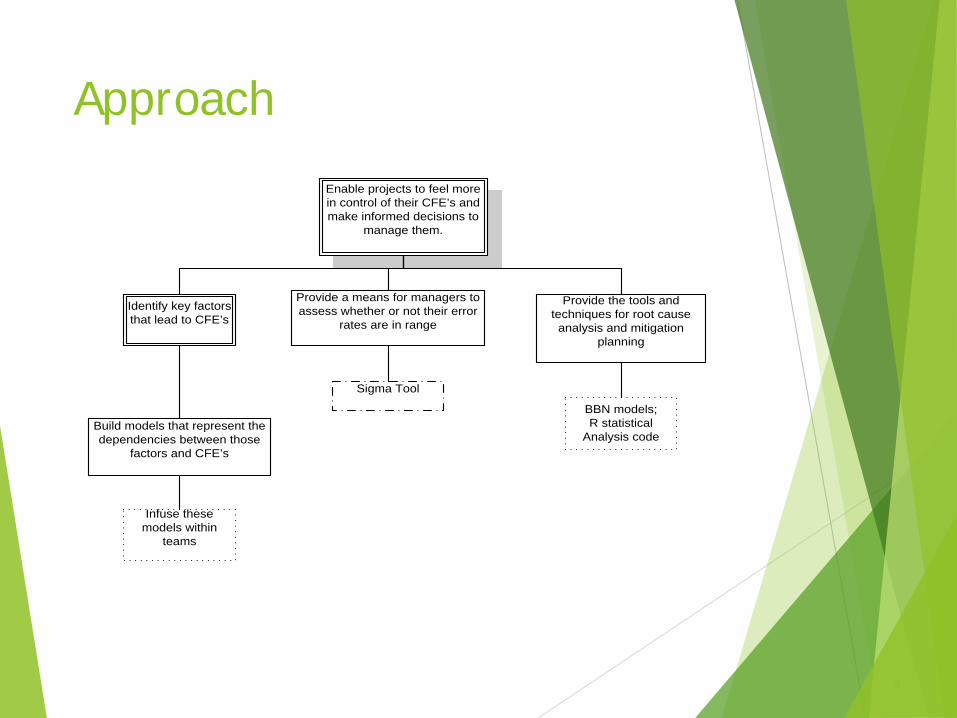
Approach
4
Enable projects to feel more in control of their CFE’s and make informed decisions to
manage them.
Identify key factors that lead to CFE’s
Build models that represent the dependencies between those
factors and CFE’s
Provide a means for managers to assess whether or not their error
rates are in range
Provide the tools and techniques for root cause
analysis and mitigation planning
Infuse these models within
teams
Sigma Tool BBN models;
R statistical Analysis code
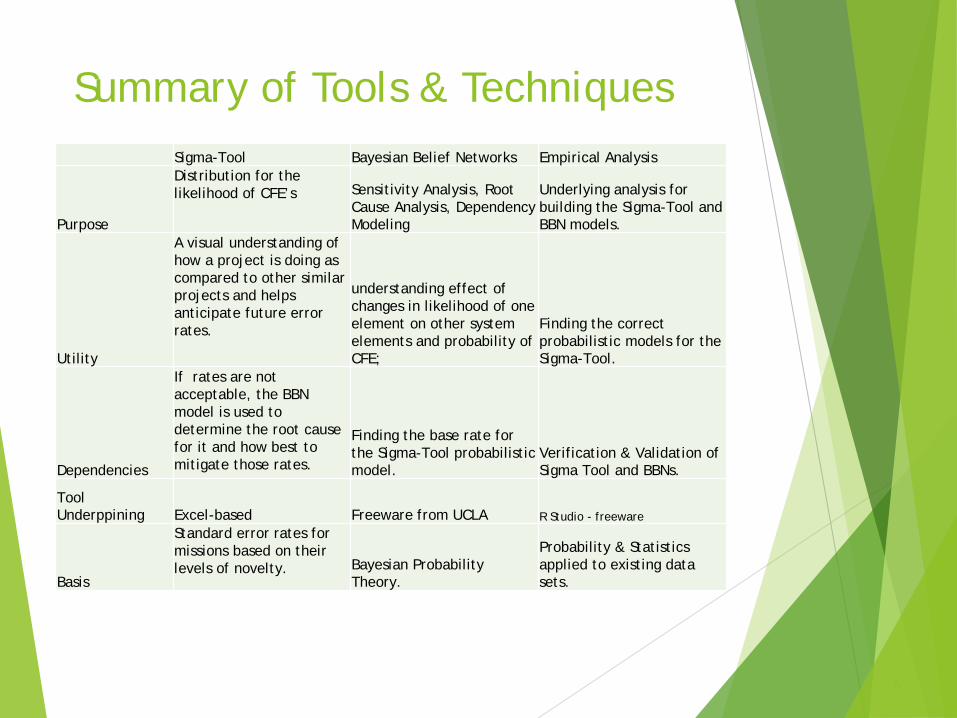
Summary of Tools & Techniques
5
Sigma-Tool Bayesian Belief Networks Empirical Analysis
Purpose
Distribution for the likelihood of CFE’s Sensitivity Analysis, Root
Cause Analysis, Dependency Modeling
Underlying analysis for building the Sigma-Tool and BBN models.
Utility
A visual understanding of how a project is doing as compared to other similar projects and helps anticipate future error rates.
understanding effect of changes in likelihood of one element on other system elements and probability of CFE;
Finding the correct probabilistic models for the Sigma-Tool.
Dependencies
If rates are not acceptable, the BBN model is used to determine the root cause for it and how best to mitigate those rates.
Finding the base rate for the Sigma-Tool probabilistic model.
Verification & Validation of Sigma Tool and BBNs.
Tool Underppining Excel-based Freeware from UCLA R Studio - freeware
Basis
Standard error rates for missions based on their levels of novelty. Bayesian Probability
Theory.
Probability & Statistics applied to existing data sets.

Sigma Tool
Uses Excel to enable cheap, multi-platform deployment
Limits input parameters
Project duration built into spreadsheet
Number of Files sent per month
High or low novelty to be applied to any given month
High novelty raises the risk of an error by 50% for any given ‘trial’ for that month
Uses a binomial distribution to model each SCMF radiated as a trial which might result in a commanding error
Calculates the mean expected number of errors in a given month
Calculates the one, two and three sigma levels associated with the mean expected number of errors
Captures the data in a spreadsheet and in a graphical output
6
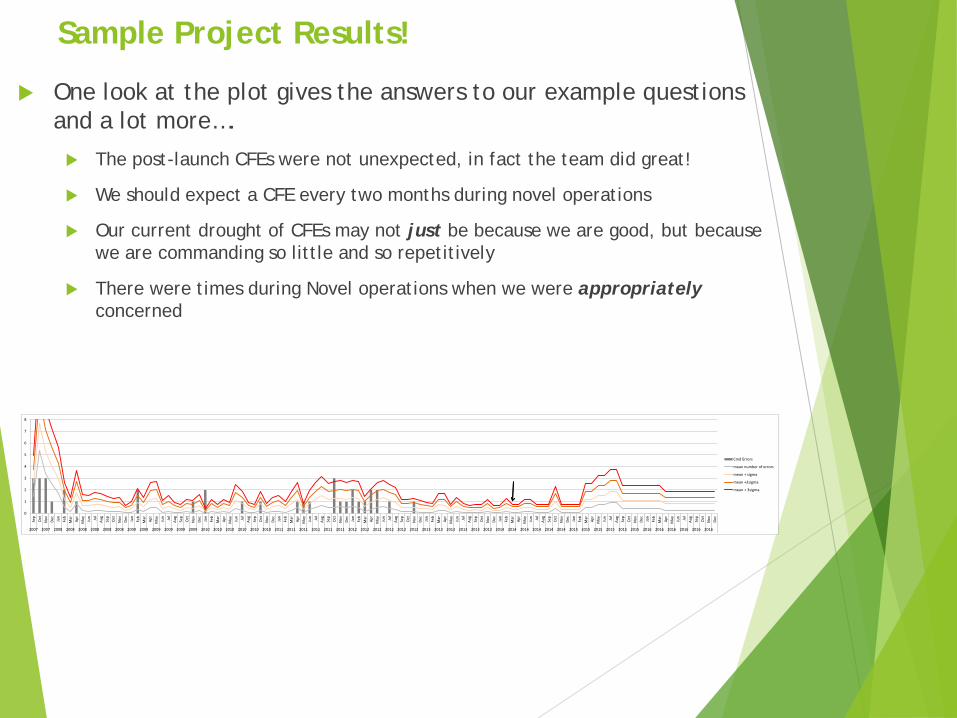
Sample Project Results!
One look at the plot gives the answers to our example questions and a lot more….
The post-launch CFEs were not unexpected, in fact the team did great!
We should expect a CFE every two months during novel operations
Our current drought of CFEs may not just be because we are good, but because we are commanding so little and so repetitively
There were times during Novel operations when we were appropriately concerned
0
1
2
3
4
5
6
7
8
Sep
Oct
Nov De
cJa
nFe
bM
ar Apr
May Jun Jul
Aug
Sep
Oct
Nov De
cJa
nFe
bM
ar Apr
May Jun Jul
Aug
Sep
Oct
Nov De
cJa
nFe
bM
ar Apr
May Jun Jul
Aug
Sep
Oct
Nov De
cJa
nFe
bM
ar Apr
May Jun Jul
Aug
Sep
Oct
Nov De
cJa
nFe
bM
ar Apr
May Jun Jul
Aug
Sep
Oct
Nov De
cJa
nFe
bM
ar Apr
May Jun Jul
Aug
Sep
Oct
Nov De
cJa
nFe
bM
ar Apr
May Jun Jul
Aug
Sep
Oct
Nov De
cJa
nFe
bM
ar Apr
May Jun Jul
Aug
Sep
Oct
Nov De
cJa
nFe
bM
ar Apr
May Jun Jul
Aug
Sep
Oct
Nov De
c
2007 2007 2008 2008 2008 2008 2008 2008 2009 2009 2009 2009 2009 2009 2010 2010 2010 2010 2010 2010 2011 2011 2011 2011 2011 2011 2012 2012 2012 2012 2012 2012 2013 2013 2013 2013 2013 2013 2014 2014 2014 2014 2014 2014 2015 2015 2015 2015 2015 2015 2016 2016 2016 2016 2016 2016
Cmd Errors
mean number of errors
mean + sigma
mean +2sigma
mean + 3sigma
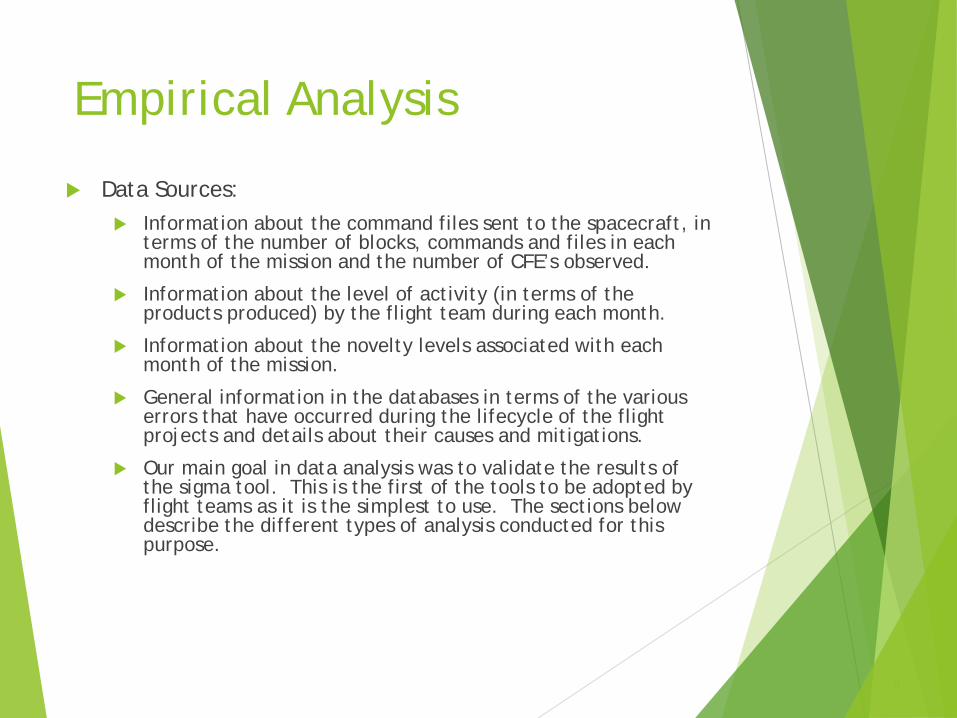
Empirical Analysis
Data Sources: Information about the command files sent to the spacecraft, in
terms of the number of blocks, commands and files in each month of the mission and the number of CFE’s observed.
Information about the level of activity (in terms of the products produced) by the flight team during each month.
Information about the novelty levels associated with each month of the mission.
General information in the databases in terms of the various errors that have occurred during the lifecycle of the flight projects and details about their causes and mitigations.
Our main goal in data analysis was to validate the results of the sigma tool. This is the first of the tools to be adopted by flight teams as it is the simplest to use. The sections below describe the different types of analysis conducted for this purpose.
8
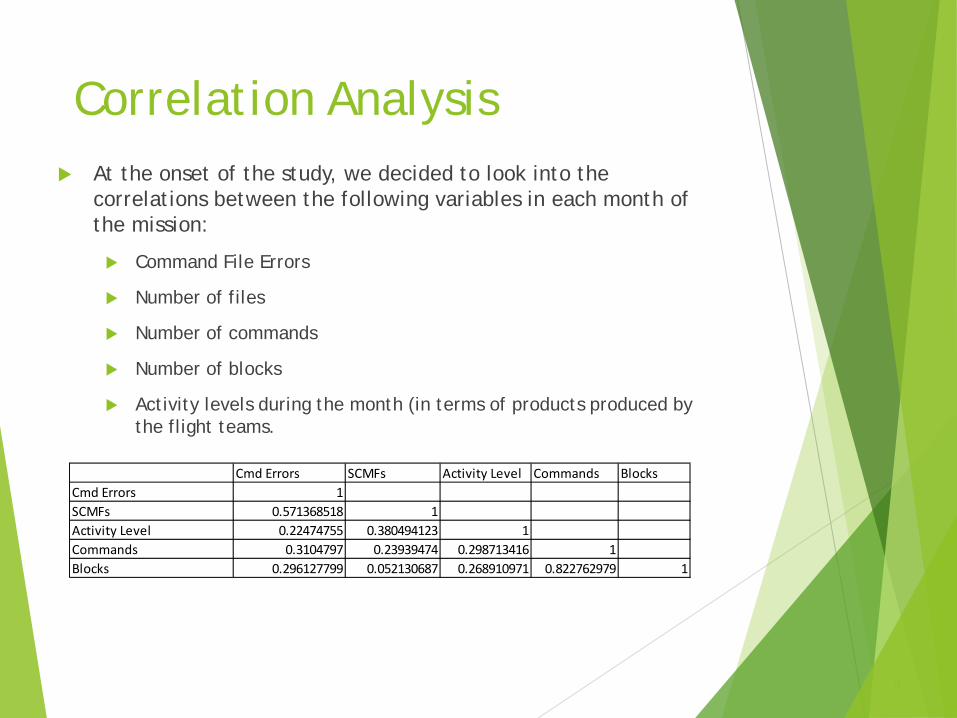
Correlation Analysis At the onset of the study, we decided to look into the
correlations between the following variables in each month of the mission:
Command File Errors
Number of files
Number of commands
Number of blocks
Activity levels during the month (in terms of products produced by the flight teams.
9
Cmd Errors SCMFs Activity Level Commands BlocksCmd Errors 1SCMFs 0.571368518 1Activity Level 0.22474755 0.380494123 1Commands 0.3104797 0.23939474 0.298713416 1Blocks 0.296127799 0.052130687 0.268910971 0.822762979 1
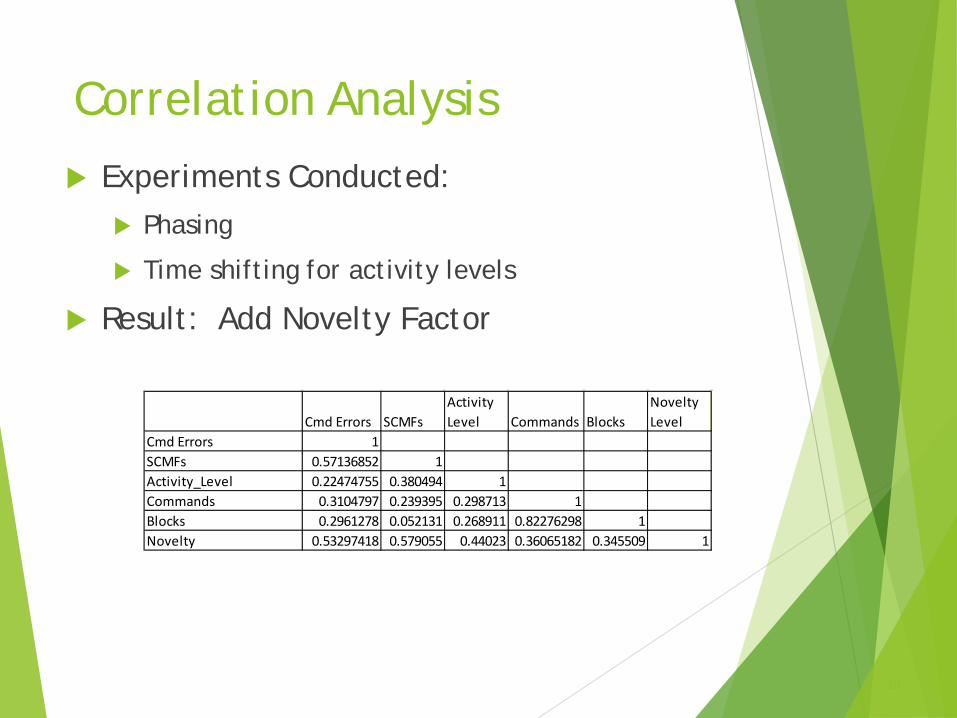
Correlation Analysis
Experiments Conducted: Phasing
Time shifting for activity levels
Result: Add Novelty Factor
10
Cmd Errors SCMFsActivity Level Commands Blocks
Novelty Level
Cmd Errors 1SCMFs 0.57136852 1Activity_Level 0.22474755 0.380494 1Commands 0.3104797 0.239395 0.298713 1Blocks 0.2961278 0.052131 0.268911 0.82276298 1Novelty 0.53297418 0.579055 0.44023 0.36065182 0.345509 1

Correlation Analysis for Sample Project
11

Regression Analysis
The goal of this analysis was to determine how much of the variability in the Command File Errors can be explained with a nonlinear function of the variables in question.
Of course the caveats of this study are that
(1) the CFE’s are not continuous variables and therefore they can’t be predicted as a continuous function of the variables and
(2) we know that the behavior of the system is probabilistic rather than quadratic, so a quadratic equation does not completely capture the variability of the CFE’s.
For the flight projects analyzed, the R-squared value was approximately 50% based on all the variables.
When we conducted a regression analysis only on the Novelty factors and the number of files, the R-squared value was reduced to about 40%.
Given the caveats listed above, we conclude that the variables in question, especially the novelty levels and the number of files are very significant factors.
12
Chi-Squared Goodness of Fit Test
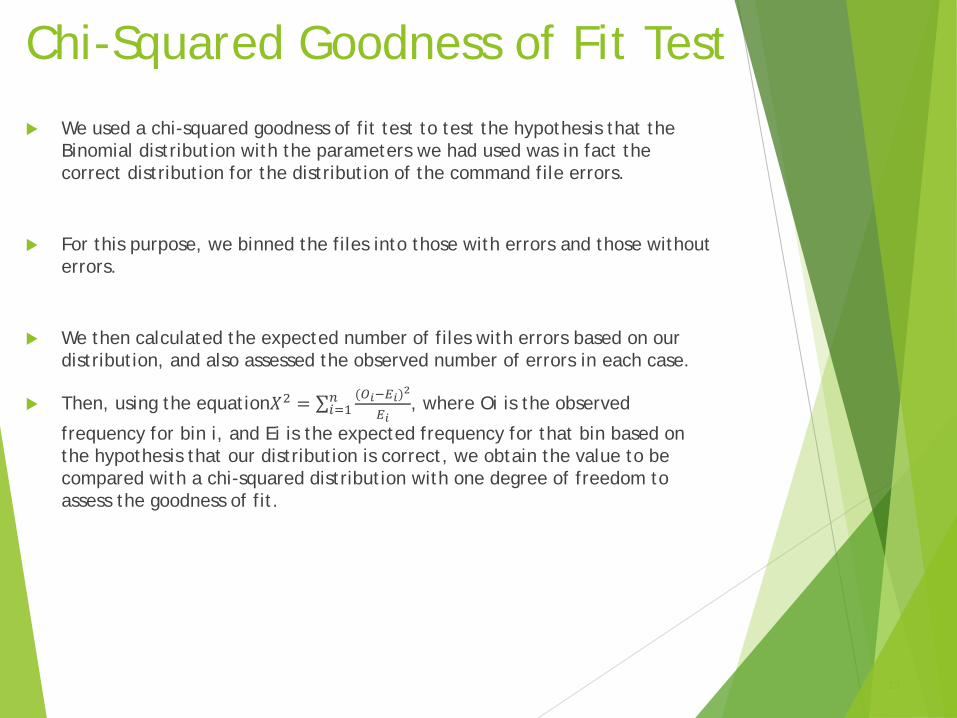
We used a chi-squared goodness of fit test to test the hypothesis that the Binomial distribution with the parameters we had used was in fact the correct distribution for the distribution of the command file errors.
For this purpose, we binned the files into those with errors and those without errors.
We then calculated the expected number of files with errors based on our distribution, and also assessed the observed number of errors in each case.
Then, using the equation𝑋2 = ∑ (𝑂𝑖−𝐸𝑖)2
𝐸𝑖𝑛𝑖=1 , where Oi is the observed
frequency for bin i, and Ei is the expected frequency for that bin based on the hypothesis that our distribution is correct, we obtain the value to be compared with a chi-squared distribution with one degree of freedom to assess the goodness of fit.
13
Principal Component Analysis
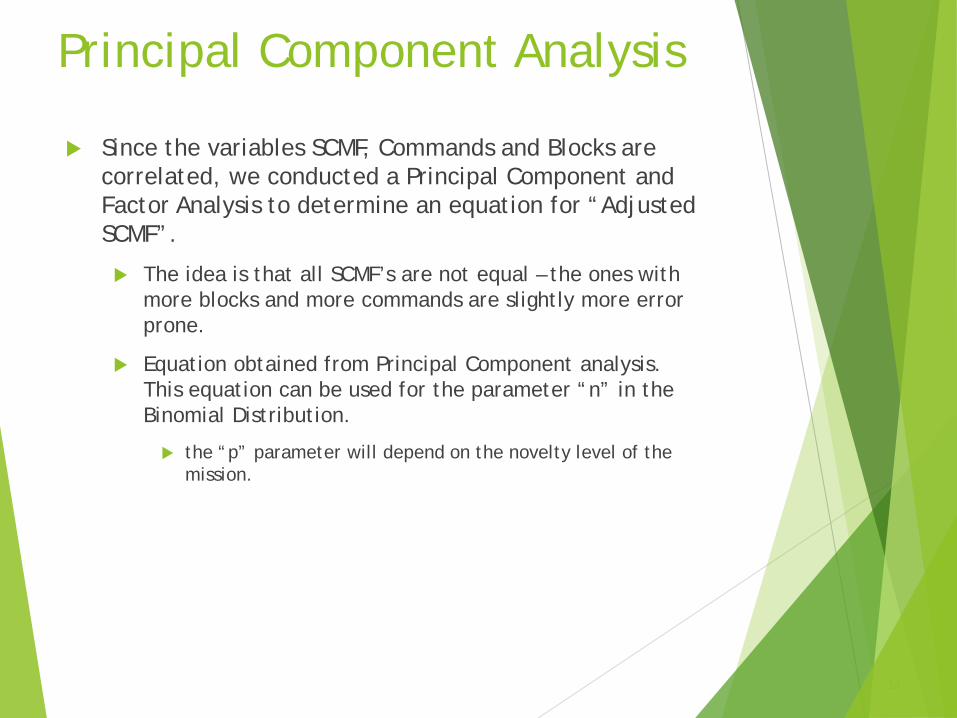
Since the variables SCMF, Commands and Blocks are correlated, we conducted a Principal Component and Factor Analysis to determine an equation for “Adjusted SCMF”.
The idea is that all SCMF’s are not equal – the ones with more blocks and more commands are slightly more error prone.
Equation obtained from Principal Component analysis. This equation can be used for the parameter “n” in the Binomial Distribution.
the “p” parameter will depend on the novelty level of the mission.
14
Bayesian Belief Networks
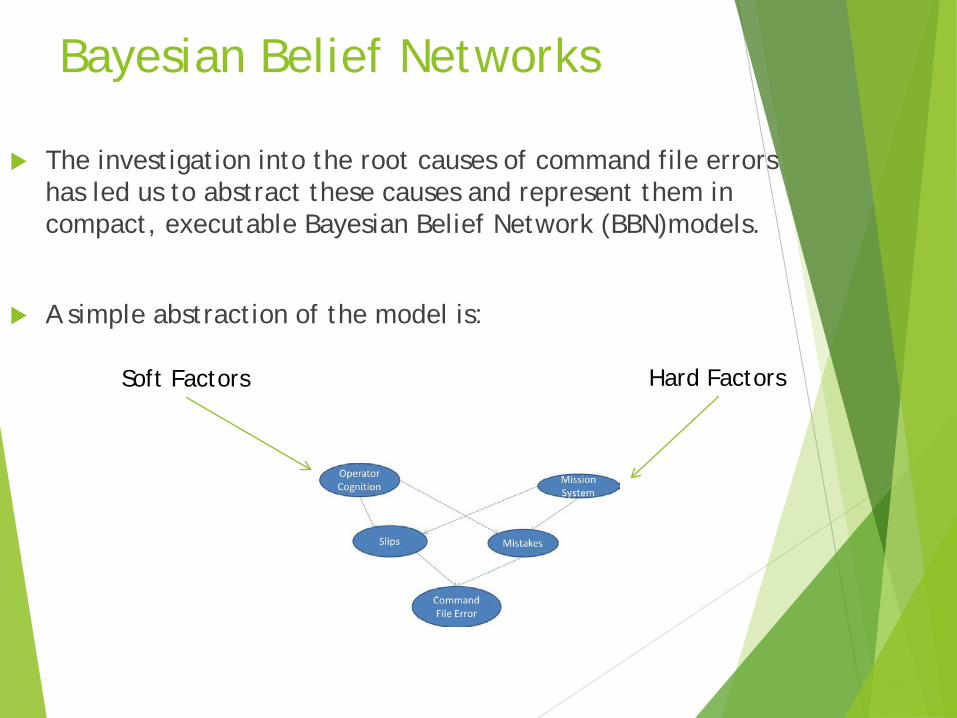
The investigation into the root causes of command file errors has led us to abstract these causes and represent them in compact, executable Bayesian Belief Network (BBN)models.
A simple abstraction of the model is:
15
Soft Factors Hard Factors
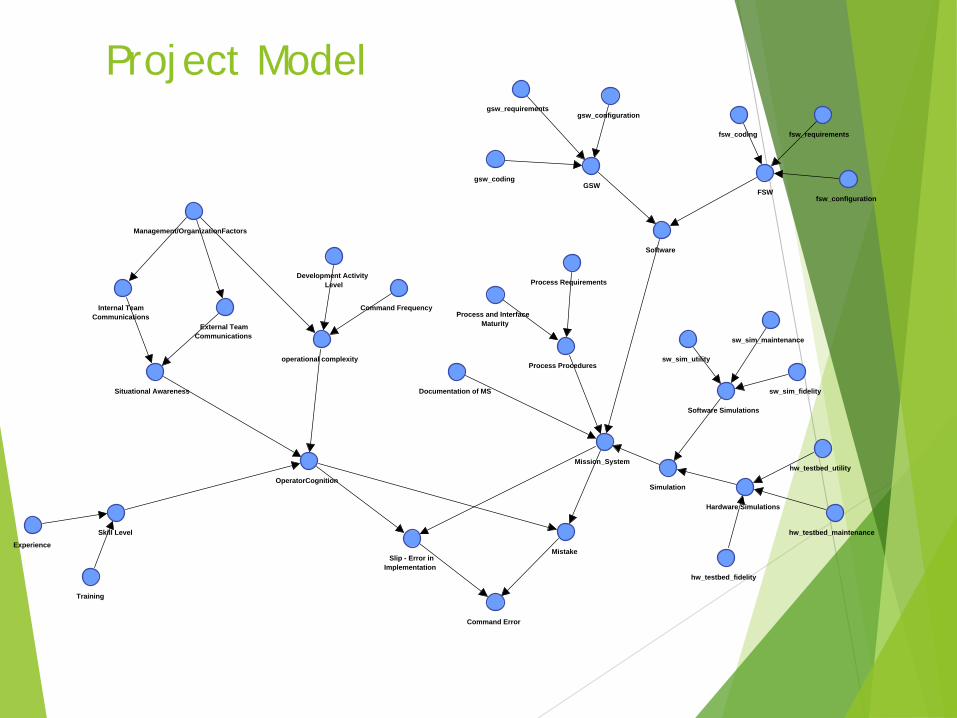
Project Model
Mistake
Command Error
Slip - Error inImplementation
Mission_System
Training
External TeamCommunications
Internal TeamCommunications
operational complexity
Software
Process Procedures
Simulation
FSW
Process and InterfaceMaturity
Process Requirements
fsw_requirements
fsw_configuration
Hardware Simulations
Software Simulations
hw_testbed_fidelity
hw_testbed_utility
sw_sim_fidelity
sw_sim_utility
Documentation of MS
hw_testbed_maintenance
sw_sim_maintenance
fsw_coding
GSW
gsw_requirementsgsw_configuration
gsw_coding
Situational Awareness
Management/OrganizationFactors
OperatorCognition
Skill Level
Experience
Development ActivityLevel
Command Frequency
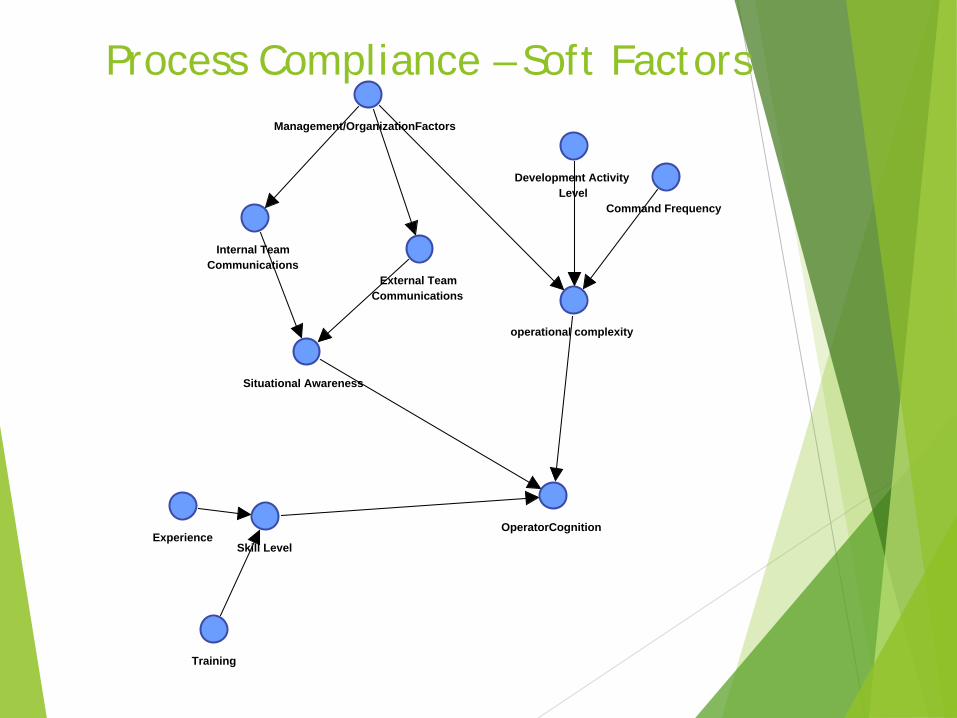
Process Compliance – Soft Factors
Training
External TeamCommunications
Internal TeamCommunications
operational complexity
Situational Awareness
Management/OrganizationFactors
OperatorCognition
Skill LevelExperience
Development ActivityLevel
Command Frequency
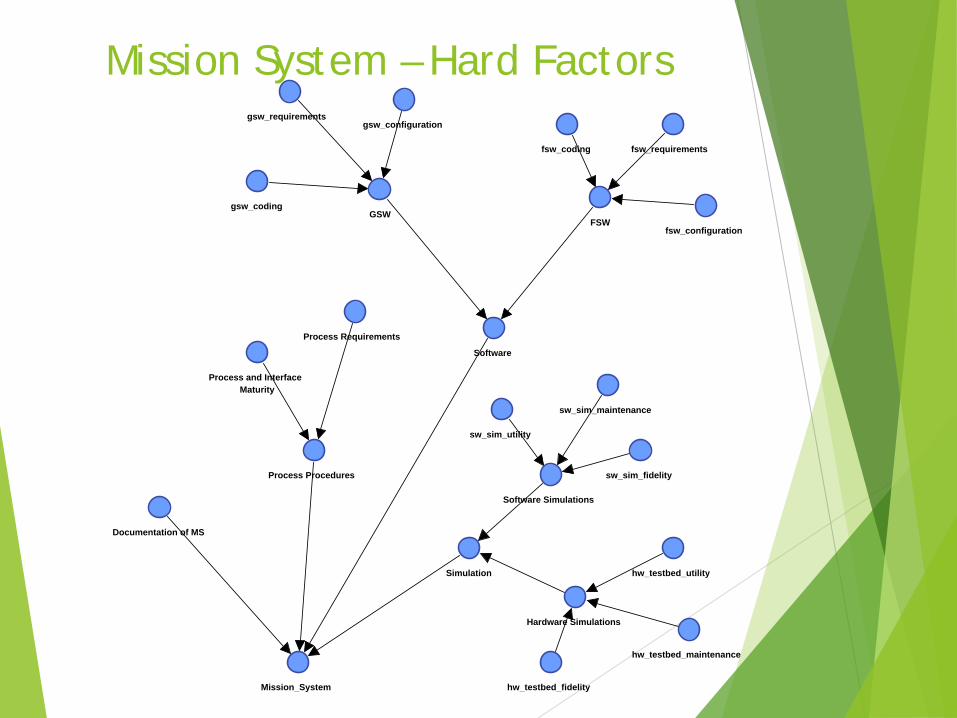
Mission System – Hard Factors
Mission_System
Software
Process Procedures
Simulation
FSW
Process and InterfaceMaturity
Process Requirements
fsw_requirements
fsw_configuration
Hardware Simulations
Software Simulations
hw_testbed_fidelity
hw_testbed_utility
sw_sim_fidelity
sw_sim_utility
Documentation of MS
hw_testbed_maintenance
sw_sim_maintenance
fsw_coding
GSW
gsw_requirementsgsw_configuration
gsw_coding
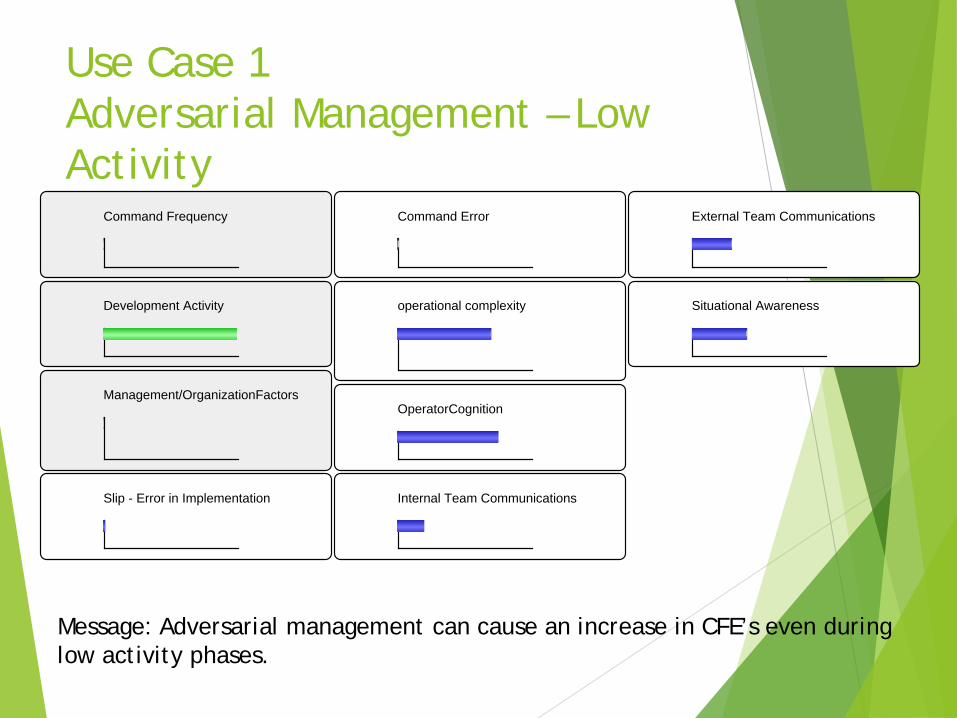
Use Case 1 Adversarial Management – Low Activity
Message: Adversarial management can cause an increase in CFE’s even during low activity phases.
Command Frequency
Development Activity
Management/OrganizationFactors
Slip - Error in Implementation
Command Error
operational complexity
OperatorCognition
Internal Team Communications
External Team Communications
Situational Awareness
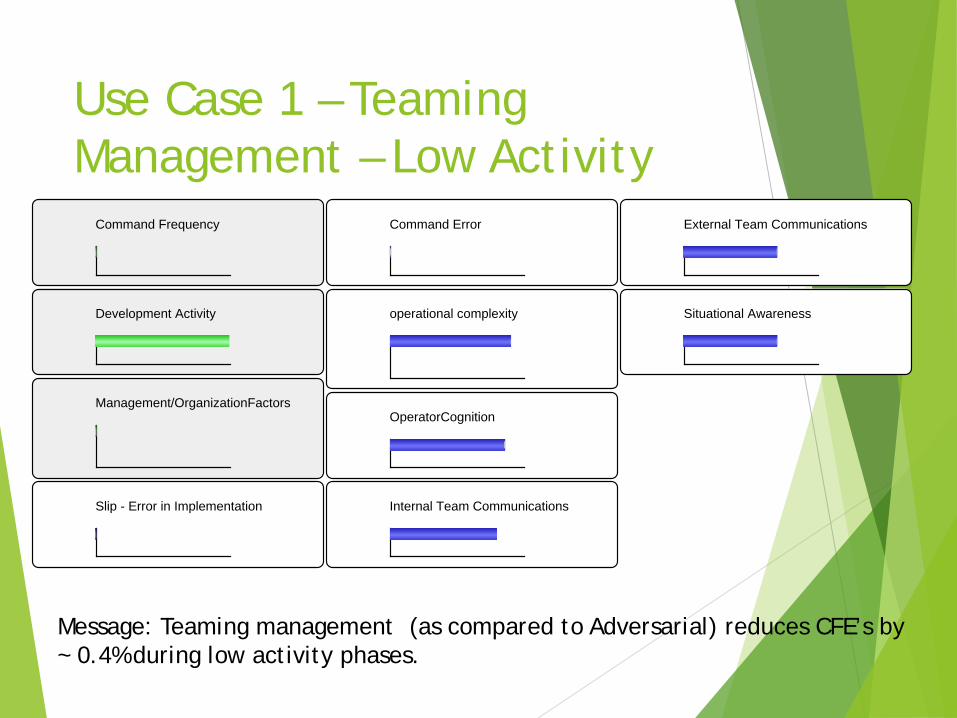
Use Case 1 – Teaming Management – Low Activity
Message: Teaming management (as compared to Adversarial) reduces CFE’s by ~ 0.4% during low activity phases.
Command Frequency
Development Activity
Management/OrganizationFactors
Slip - Error in Implementation
Command Error
operational complexity
OperatorCognition
Internal Team Communications
External Team Communications
Situational Awareness
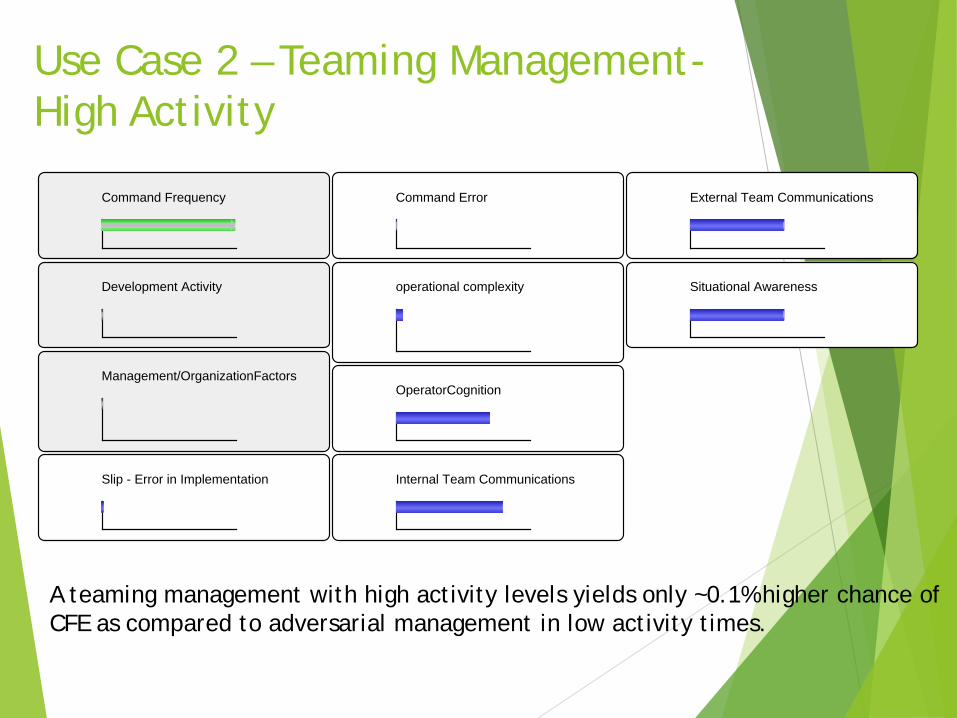
Use Case 2 – Teaming Management- High Activity
A teaming management with high activity levels yields only ~0.1% higher chance of CFE as compared to adversarial management in low activity times.
Command Frequency
Development Activity
Management/OrganizationFactors
Slip - Error in Implementation
Command Error
operational complexity
OperatorCognition
Internal Team Communications
External Team Communications
Situational Awareness
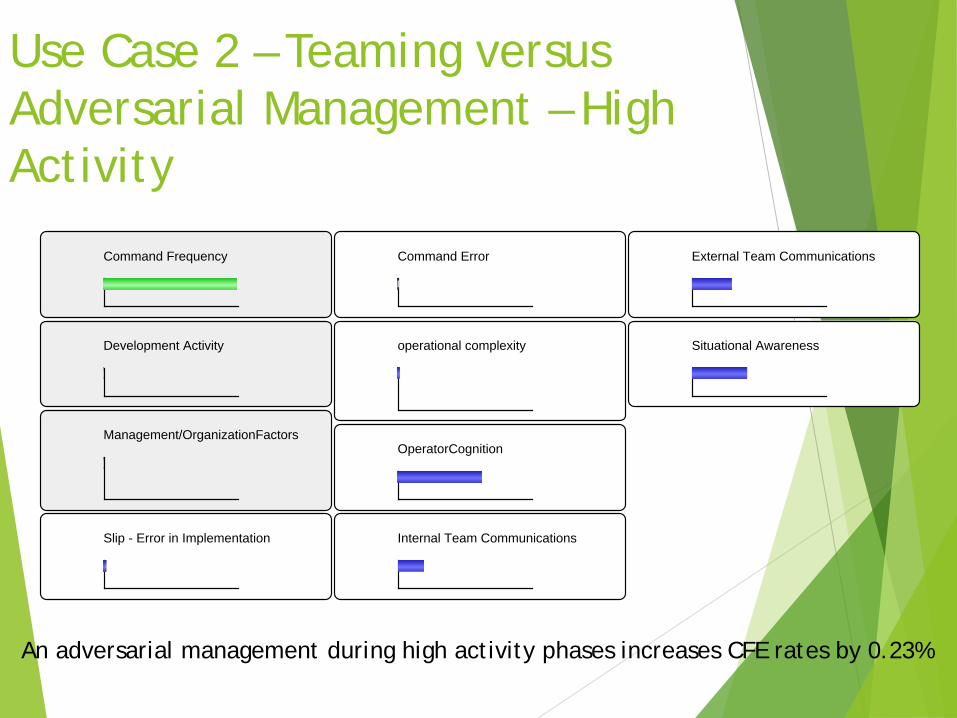
Use Case 2 – Teaming versus Adversarial Management – High Activity
An adversarial management during high activity phases increases CFE rates by 0.23%
Command Frequency
Development Activity
Management/OrganizationFactors
Slip - Error in Implementation
Command Error
operational complexity
OperatorCognition
Internal Team Communications
External Team Communications
Situational Awareness
Use Case 3: Analyzing the effect of evidence on dependent nodes
Now let’s assume that we have evidence that a node has occurred.
We can use this information to find the updated likelihood of other nodes in the mode.
Below are sample root cause analyses and scenarios based on this concept.
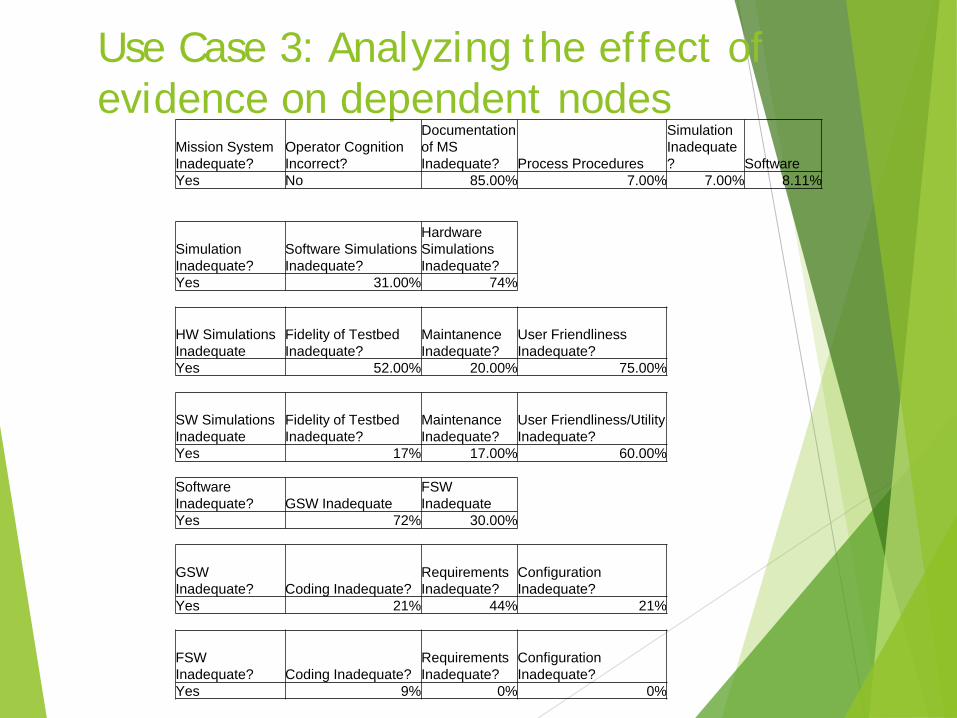
Use Case 3: Analyzing the effect of evidence on dependent nodes
Mission System Inadequate?
Operator Cognition Incorrect?
Documentation of MS Inadequate? Process Procedures
Simulation Inadequate? Software
Yes No 85.00% 7.00% 7.00% 8.11%
Simulation Inadequate?
Software Simulations Inadequate?
Hardware Simulations Inadequate?
Yes 31.00% 74%
HW Simulations Inadequate
Fidelity of Testbed Inadequate?
Maintanence Inadequate?
User Friendliness Inadequate?
Yes 52.00% 20.00% 75.00%
SW Simulations Inadequate
Fidelity of Testbed Inadequate?
Maintenance Inadequate?
User Friendliness/Utility Inadequate?
Yes 17% 17.00% 60.00%
Software Inadequate? GSW Inadequate
FSW Inadequate
Yes 72% 30.00%
GSW Inadequate? Coding Inadequate?
Requirements Inadequate?
Configuration Inadequate?
Yes 21% 44% 21%
FSW Inadequate? Coding Inadequate?
Requirements Inadequate?
Configuration Inadequate?
Yes 9% 0% 0%
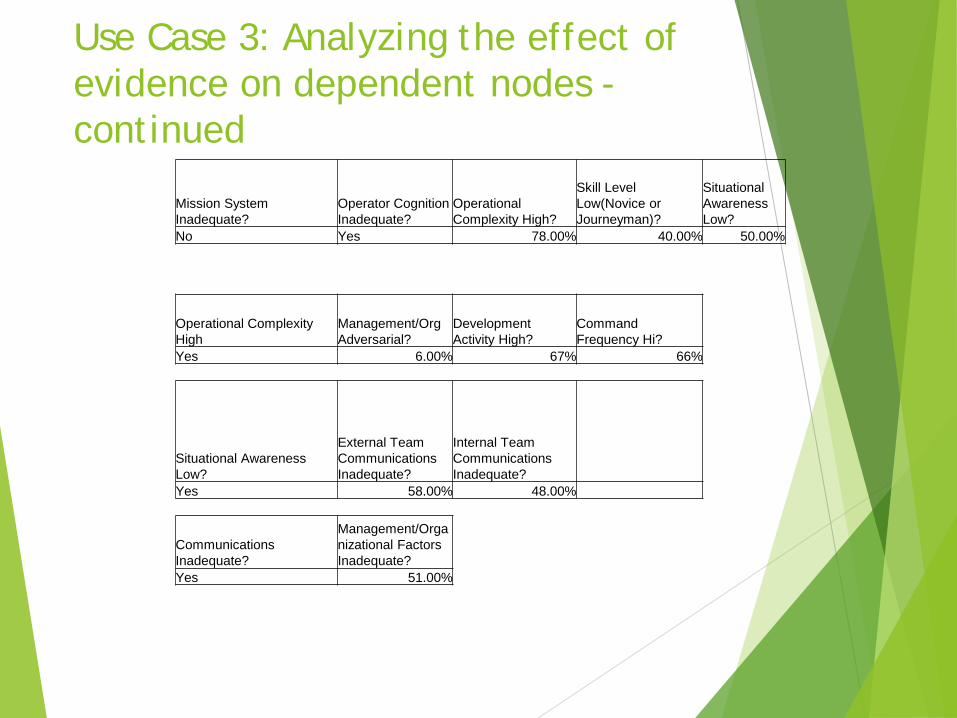
Use Case 3: Analyzing the effect of evidence on dependent nodes - continued
Mission System Inadequate?
Operator Cognition Inadequate?
Operational Complexity High?
Skill Level Low(Novice or Journeyman)?
Situational Awareness Low?
No Yes 78.00% 40.00% 50.00%
Operational Complexity High
Management/Org Adversarial?
Development Activity High?
Command Frequency Hi?
Yes 6.00% 67% 66%
Situational Awareness Low?
External Team Communications Inadequate?
Internal Team Communications Inadequate?
Yes 58.00% 48.00%
Communications Inadequate?
Management/Organizational Factors Inadequate?
Yes 51.00%
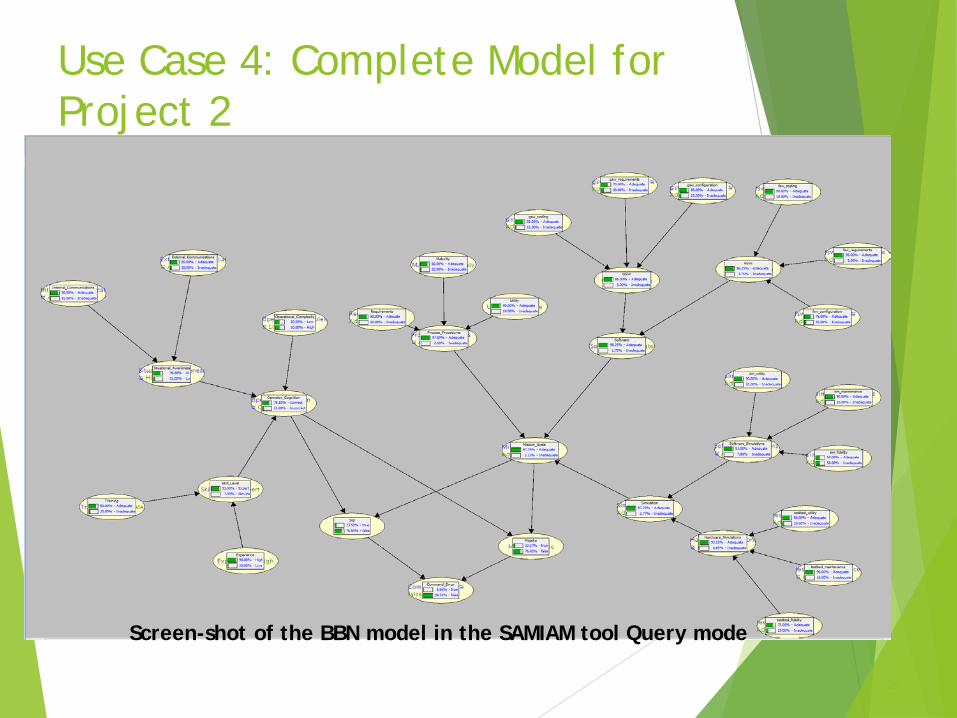
Use Case 4: Complete Model for Project 2
26
Screen-shot of the BBN model in the SAMIAM tool Query mode
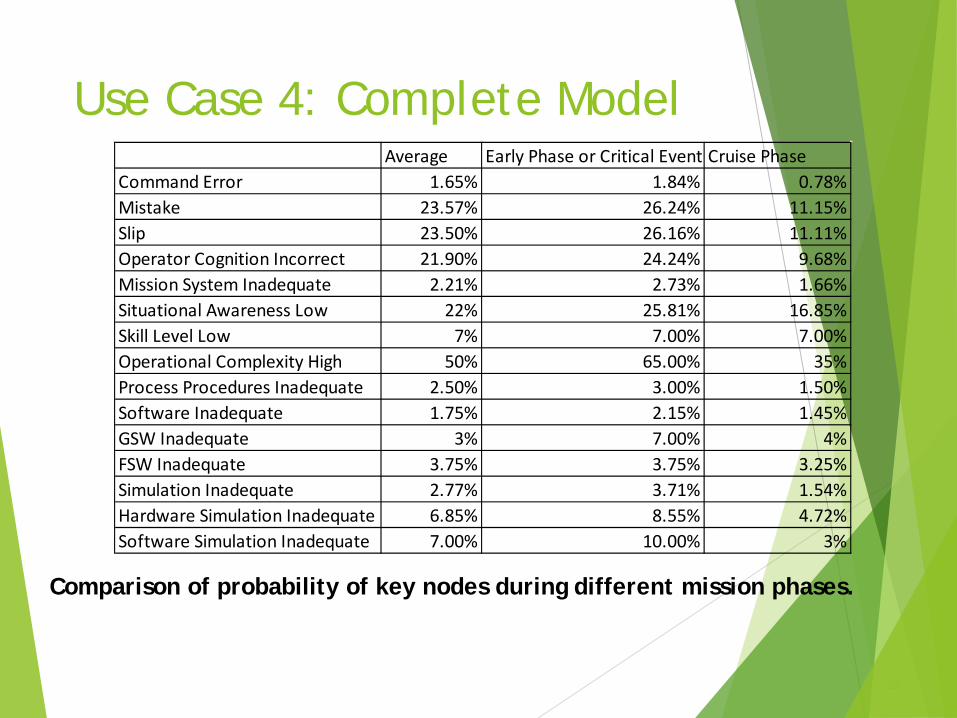
Use Case 4: Complete Model
27
Average Early Phase or Critical EventsCruise PhaseCommand Error 1.65% 1.84% 0.78%Mistake 23.57% 26.24% 11.15%Slip 23.50% 26.16% 11.11%Operator Cognition Incorrect 21.90% 24.24% 9.68%Mission System Inadequate 2.21% 2.73% 1.66%Situational Awareness Low 22% 25.81% 16.85%Skill Level Low 7% 7.00% 7.00%Operational Complexity High 50% 65.00% 35%Process Procedures Inadequate 2.50% 3.00% 1.50%Software Inadequate 1.75% 2.15% 1.45%GSW Inadequate 3% 7.00% 4%FSW Inadequate 3.75% 3.75% 3.25%Simulation Inadequate 2.77% 3.71% 1.54%Hardware Simulation Inadequate 6.85% 8.55% 4.72%Software Simulation Inadequate 7.00% 10.00% 3%
Comparison of probability of key nodes during different mission phases.
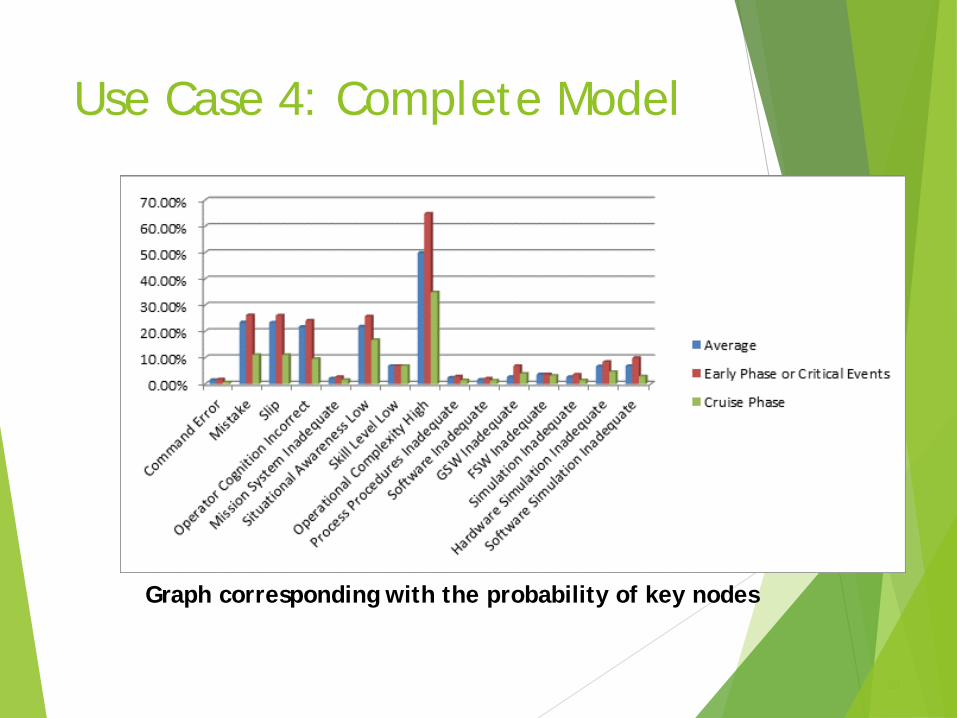
Use Case 4: Complete Model
28
Graph corresponding with the probability of key nodes
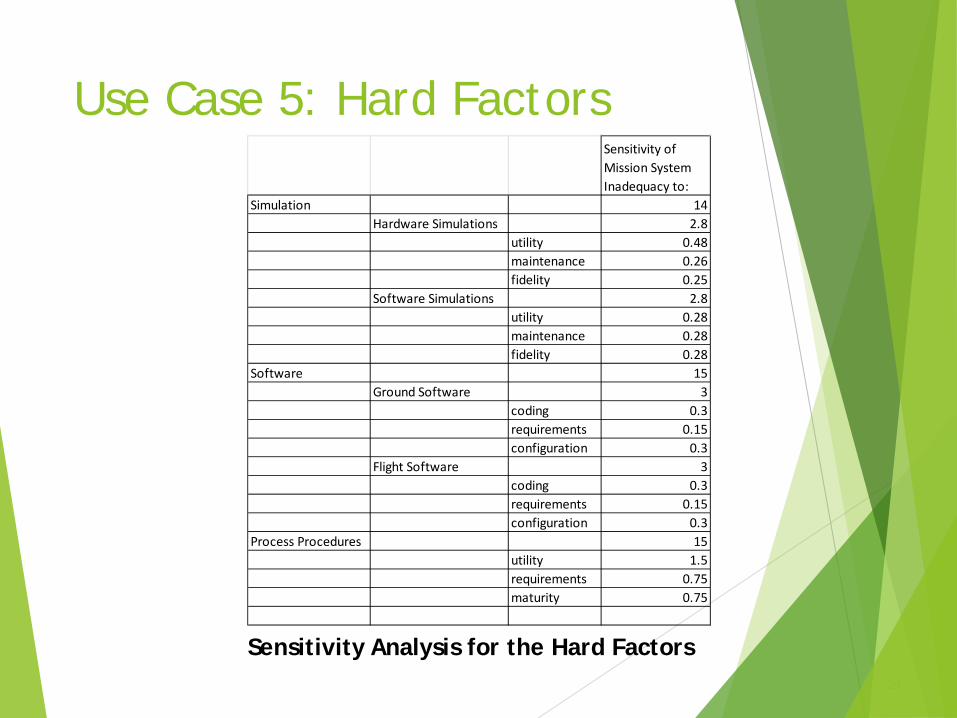
Use Case 5: Hard Factors
29
Sensitivity of Mission System Inadequacy to:
Simulation 14Hardware Simulations 2.8
utility 0.48maintenance 0.26fidelity 0.25
Software Simulations 2.8utility 0.28maintenance 0.28fidelity 0.28
Software 15Ground Software 3
coding 0.3requirements 0.15configuration 0.3
Flight Software 3coding 0.3requirements 0.15configuration 0.3
Process Procedures 15utility 1.5requirements 0.75maturity 0.75
Sensitivity Analysis for the Hard Factors
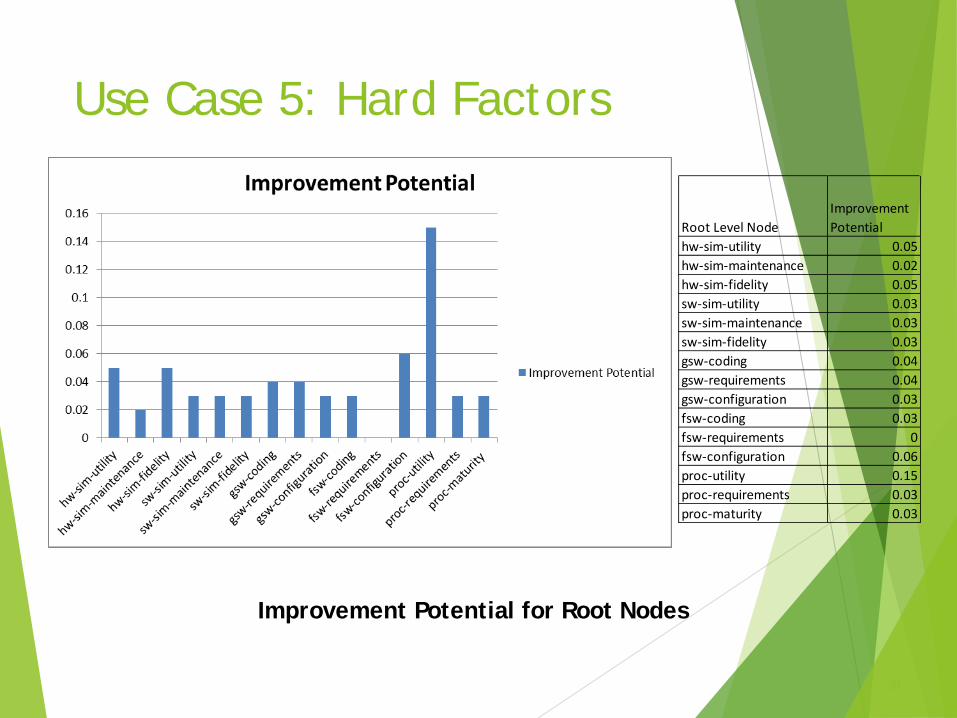
Use Case 5: Hard Factors
30
Root Level NodeImprovement Potential
hw-sim-utility 0.05hw-sim-maintenance 0.02hw-sim-fidelity 0.05sw-sim-utility 0.03sw-sim-maintenance 0.03sw-sim-fidelity 0.03gsw-coding 0.04gsw-requirements 0.04gsw-configuration 0.03fsw-coding 0.03fsw-requirements 0fsw-configuration 0.06proc-utility 0.15proc-requirements 0.03proc-maturity 0.03
Improvement Potential for Root Nodes
Conclusions
There two main elements associated with Command File Errors (CFEs)
The base rate which is dependent on the underlying infrastructure.
Variations to this base rate which are driven by characteristics of flight project in question.
Managing CFE’s requires the development and combination of custom tool base and methodologies.
31