Embed Size (px)
Citation preview
The ArosDyn Project: Robust Analysis of Dynamic Scenes
Igor E. Paromtchik∗, Christian Laugier∗, Mathias Perrollaz∗,Mao Yong∗, Amaury Negre∗, Christopher Tay†
∗INRIA Grenoble Rhone-Alpes, 38334 Saint Ismier, France†ProBayes, 38334 Saint Ismier, France
Abstract—The ArosDyn project aims to develop embeddedsoftware for robust analysis of dynamic scenes in urban trafficenvironments, in order to estimate and predict collision risksduring car driving. The on-board telemetric sensors (lidars)and visual sensors (stereo camera) are used to monitor theenvironment around the car. The algorithms make use of Bayesianfusion of heterogenous sensor data. The key objective is to processsensor data for robust detection and tracking of multiple movingobjects for estimating and predicting collision risks in real time,in order to help avoid potentially dangerous situations.
Index Terms—Mobile robot, sensor fusion, Bayesian filter,stereo vision, lidar, collision risk, traffic environment
I. INTRODUCTION
The urban traffic environment with multiple participantscontains risks of potential collision and damage. The carsafety technologies (e.g. seat belts, airbags, safety glass,energy-absorbing frames) mitigate the effects of accidents.The advanced technologies will be capable of monitoring theenvironment to estimate and predict collision risks during cardriving, in order to help reduce the likelihood of accidentsoccuring. The risk management by traffic participants is anefficient way to improve traffic safety toward zero-collisiondriving. The key problem is to correctly interpret the trafficscene by means of processing information from a variety ofsensors. In this context, robust continuous analysis of dynamictraffic scenes by means of data processing from on-boardsensors is the objective of our ArosDyn project.
The relevant sensors include stereo vision, lidars, an inertialmeasurement unit (IMU) combined with a global positioningsystem (GPS), and odometry. The local environment is repre-sented by a grid. The fusion of sensor data is accomplishedby means of the Bayesian Occupancy Filter (BOF) [1], [2],that provides to assign probabilities of cell occupancy and cellvelocity for each cell in the grid. The collision risks are con-sidered as stochastic variables. Hidden Markov Model (HMM)and Gaussian process (GP) are used to estimate and predictcollision risks and the likely behaviours of multiple dynamicagents in road scenes.
Various approaches have been proposed to represent theenvironment and interpret traffic scenes. They use such sensorsas: a telemeter like radar [3], a laser scanner [4], coopera-tive detection systems [5], or monocular vision for detectingspecific features like edges, symmetry [6], colour [7], ormovement [8]. Most monocular approaches are capable ofrecognizing vehicles and pedestrians. Stereo vision providesa three-dimensional scene representation and it is particularlysuitable for generic obstacle detection [9], [10], [11].
The long-term solution for improving traffic safety may beautomated cars. The promising accomplishments range fromsuch early projects as PATH [12] to more recent ones asCityCars [13] and the DARPA Urban Challenge [14]. In theshort- to medium-term, traffic accidents can be reduced byrecognizing high-risk situations, which can be evaluated bymeans of sensor data processing about the local environment,i.e. obstacle detection and alerting the driver (passive safety),or modifying the driving parameters (active safety) if a colli-sion becomes imminent.
We represent the environment by a grid [15] and usethe BOF for sensor fusion, as explained in section II. Inorder to identify objects, our Fast Clustering-Tracking (FCT)algorithm takes the BOF result as input, and it outputs theposition and velocity of the detected objects and the associateduncertainties [16]. The subsequent risk assessment producesestimates of the possible behaviours (continue straight, turnright, turn left, or stop) in our probabilistic model of thefuture [17]. This model contains HMMs and GPs for predictingthe likelihood of drivers’ actions and combines informationabout the car position and velocity with the observations ofother cars.
II. BAYESIAN OCCUPANCY FILTER (BOF)
The BOF serves for data fusion from stereo vision andlidars. It operates with a two-dimensional grid representingthe environment. Each cell of the grid contains a probabilityof the cell occupancy and a probability of the cell velocity.The probabilistic models of a lidar and a stereo camera aredeveloped, in order to use the BOF.
The lidar model is beam-based [15]. It includes four layersof beams and assumes each beam to be independent. Webuild a probabilistic model for each beam layer independently.Knowing the position and orientation of the lidar, we filter outthose beams which produce impacts with the ground.
The stereo camera is assumed in a “rectified” geometricalconfiguration, that allows us to compute a disparity map, whichis equivalent to a partial three-dimensional representation ofthe scene, as shown in Fig. 1. The disparity map computationis based on the double correlation method [18], which has twomajor advantages: a better matching over the road surface andan instant separation between “road” and “obstacle” pixels,without using any arbitrary threshold. The computation of theoccupancy grid is directly performed in the disparity spaceassociated with the disparity map, thus, preserving the intrinsicprecision of the stereo camera.
978-1-4244-7815-6/10/$26.00 c©2010 IEEE ICARCV 2010

The partially occluded areas of the scene are monitored bymeans of our visibility estimation approach. Consider a pixelU in the u-disparity plane. The occupancy of U is expressedby a combination of the visibility of U and the occupancyconfidence of U , as estimated from the disparity map. LetP(CU = 1) denote the confidence of U being occupied, andP(VU = 1) be the probability of U being visible. Then, theoccupancy probability of U is
P(OU) = P(VU = 1) ·P(CU = 1) · (1−PFP)+P(VU = 1) · (1−P(CU = 1)) ·PFN
+(1−P(VU = 1)) ·0.5,
where PFP and PFN are the false positive and false negativeprobabilities of the stereo camera. Then, the u-disparity occu-pancy grid is transformed into a metric grid for its use in theBOF. This probabilistic model of the stereo camera is describedin detail in [19].
a
b
Figure 1: Left-side image from a stereo camera (a) and acorresponding disparity map (b)
At each time step, the probabilities of cell occupancy andcell velocity are estimated by means of Bayesian inferencewith our models of the sensors. The inference leads to aBayesian filtering process, as shown in Fig. 2. Given a setof observations, the BOF algorithm updates the probabilityestimates for each cell in the grid [1], [2].
In this context, the prediction step propagates the celloccupancy and antecedent (velocity) probability distributionsof each cell and obtains the prediction P(Ot
c Atc), where P(Ot
c)is the occupancy probability and P(At
c) is the antecedent(velocity) probability of a cell c at time t. In the estima-tion step, P(Ot
c Atc) is updated by taking into account the
Figure 2: Bayesian filtering for estimation of the probabilitydistribution of the cell occupancy and the cell velocity
observations yielded by the sensors ∏Si=1 P(Zt
i | Otc At
c) toobtain the a posteriori state estimate P(Ot
c Atc | [Zt
1 · · ·ZtS]),
where Zti denotes the observation of a sensor i at time t. This
allows us to compute by marginalization P(Otc | [Zt
1 · · ·ZtS]) and
P(Atc | [Zt
1 · · ·ZtS]), which are used for prediction in the next
iteration.Our FCT algorithm serves to track the objects’ trajecto-
ries [16]. It operates at an object representation level andcontains three modules: a clustering module, a data associationmodule, and a tracking and tracks management module.
The clustering module combines the probabilities of the celloccupancy/velocity estimated by the BOF with the predictionfor each object being tracked by the tracker, i.e. a region ofinterest (ROI). We then try to extract a cluster in each ROIand associate it with the corresponding object. There could bea variety of cluster extracting algorithms, however, we havefound that a simple neighbourhood-based algorithm providessatisfactory results. The output of this module leads to threepossible cases, as shown in Fig. 3: (i) no object is observedin the ROI, (ii) unambiguous observation with one and onlyone cluster extracted and implicitly associated with the givenobject, and (iii) ambiguous observation, where the extractedcluster is associated with multiple objects.
Figure 3: The possible cases of clustering result: no objectobserved, unambiguos observation, and ambiguous observation
The data association module aims to solve the problem ofambiguous observation (multiple tracked objects, overlappedROIs) in the clustering module. Assuming N objects associatedwith a single cluster with a number N known exactly, the
cause of the ambiguity is twofold: (i) numerous objects arevery close to each other and the observed cluster is theunion of observations generated by N different objects, and(ii) N different objects correspond to a single real object andthe observations must be merged into one. We employ a re-clustering strategy to deal with the first situation and a clustermerging strategy for the second one. The re-clustering aims todivide the cluster into N sub-clusters and associate them withthe N objects, respectively. Because the number N is known,a K-means algorithm can be applied [20].
The cluster merging is based on a probabilistic approach.Whenever an ambiguous association Fi j between two tracks Ti
and Tj is observed, a random variable Si j is updated to indicatethe probability of Ti and Tj being parts of a single object.The probability values P(Fi j | Si j) and P(Fi j | ¬Si j) are thealgorithm parameters which are constant with regard to i and j.Similarly, the probability Pt(Si j |¬Fi j) is updated when noambiguity between Ti and Tj is observed. Then, by thresholdingthe probability Pt (Si j), the decision of merging the tracks Ti
and Tj can be made by calculating the Mahalanobis distancebetween them. Now we arrive at a set of reports which areassociated with the objects being tracked without ambiguity.Then, the tracking and tracks management module uses ageneral tracks management algorithm to create and delete thetracks, and use a Kalman filter to update their states.
III. RISK ESTIMATION
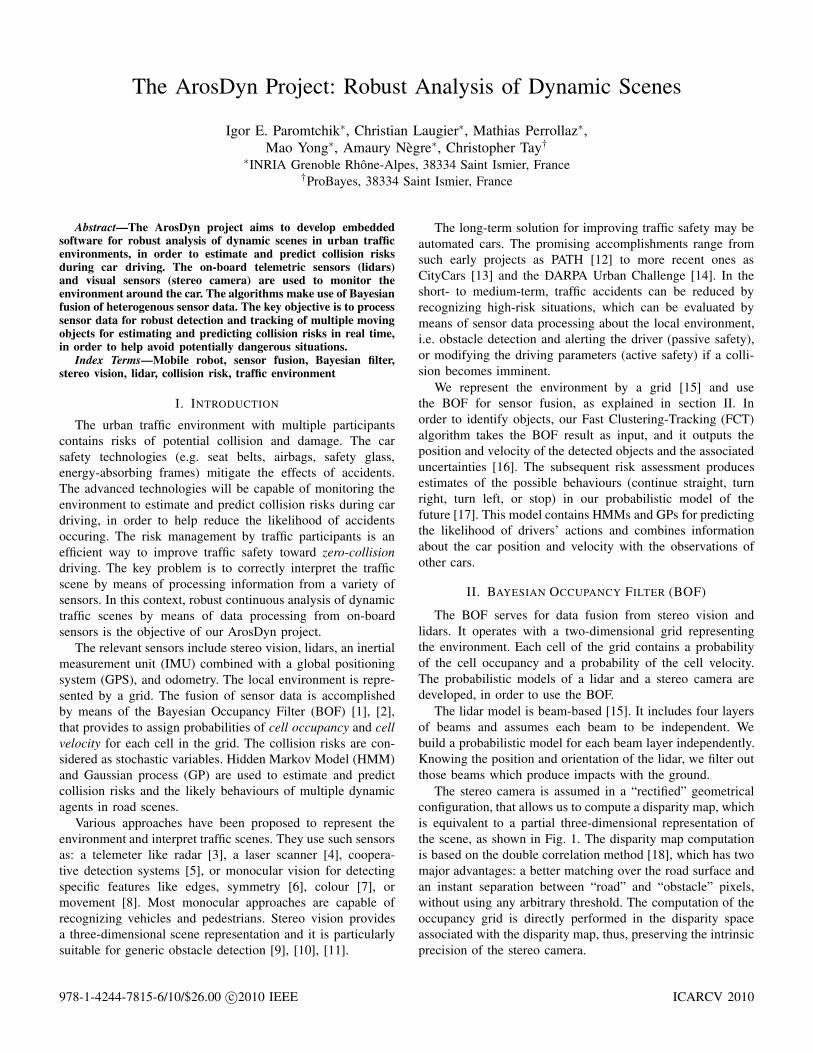
An overall architecture of our risk estimation module issketched in Fig. 4.1 The problem that we are interested in isassociated with the following sub-modules.
Figure 4: Architecture of the risk estimation module
Driving behaviour recognition. The behaviour recognitionaims at estimating the probability distribution of the feasi-ble behaviours, e.g. P(turn le f t) represents the probabilityof turning left by the car. The behaviours give implicitly
1This risk estimation method has been awarded a European Patent toINRIA - Probayes - Toyota Motor Europe.
high-level representations of a road structure, which containsemantics. The probability distribution over behaviours isobtained by HMM.
Driving behaviour realization. The collision risk evalua-tion requires the motion geometry. Driving behaviour realiza-tion takes the form of GPs, i.e. a probabilistic representationof a possible evolution of the car motion for a given behaviour.The adaptation of GP according to the behaviour is based onthe geometrical transformation known as the Least SquaresConformal Map (LSCM) [21].
Collision risk estimation. A complete probabilistic modelof the possible future motion of the car is given by theprobability distribution over behaviours from driving behaviourrecognition and driving behaviour realization. The collisionrisk can be calculated from this model. Intuitively, the resultof our risk estimation module can be summarized under anotion of “collision risk for a few seconds ahead”. However, itsprecise mathematical definition depends on the meaning andinterpretation of estimated risks, as discussed in [17].
Behaviour recognition and modelling
The aim of behaviour recognition is to assign a label anda probability measure to sequential data. In this context, thesequential data are the observations received from the sensors.Examples of sensor values are: distance to lane borders,signaling lights, or a proximity to an intersection. However,the output we wish to obtain are the probability values overbehaviours, i.e. the behaviours are hidden variables.
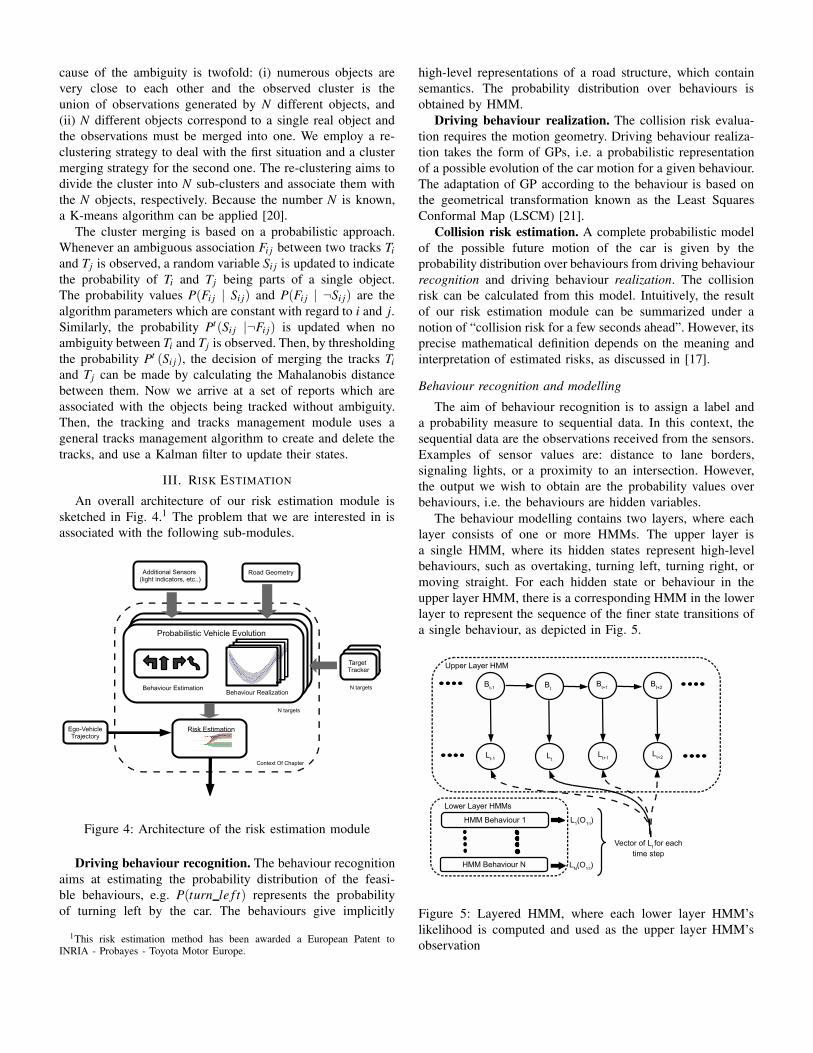
The behaviour modelling contains two layers, where eachlayer consists of one or more HMMs. The upper layer isa single HMM, where its hidden states represent high-levelbehaviours, such as overtaking, turning left, turning right, ormoving straight. For each hidden state or behaviour in theupper layer HMM, there is a corresponding HMM in the lowerlayer to represent the sequence of the finer state transitions ofa single behaviour, as depicted in Fig. 5.
Figure 5: Layered HMM, where each lower layer HMM’slikelihood is computed and used as the upper layer HMM’sobservation
Let us define the following hidden state semantics in thelower layer HMMs for each of the following behaviours ofthe higher layer HMM:
• Move straight (1 hidden state): move forward.• Overtake (4 hidden states): lane change, accelerate (while
overtaking a car), lane change to return to the originallane, resume a cruise speed.
• Turn left or right (3 hidden states): Decelerate before aturn, execute a turn, resume a cruise speed.
In order to infer the behaviours in our context, we wishto maintain a probability distribution over the behavioursrepresented by the hidden states of the upper layer HMM.Sensor-based observations of cars interact with the HMM inthe lower layer and the information is then propagated to theupper layer.
Driving behaviour realization
A behaviour is an abstract representation of the car motion.For a given behaviour, a probability distribution over thephysical realization of the car motion is indispensable forrisk estimation. The GP allows us to obtain this probabilitydistribution by assuming that usual driving is represented bythe GP, i.e. lane following without drifting too far off to thelane sides. On a straight road, this would be a canonical GPwith the mean corresponding to the lane median.
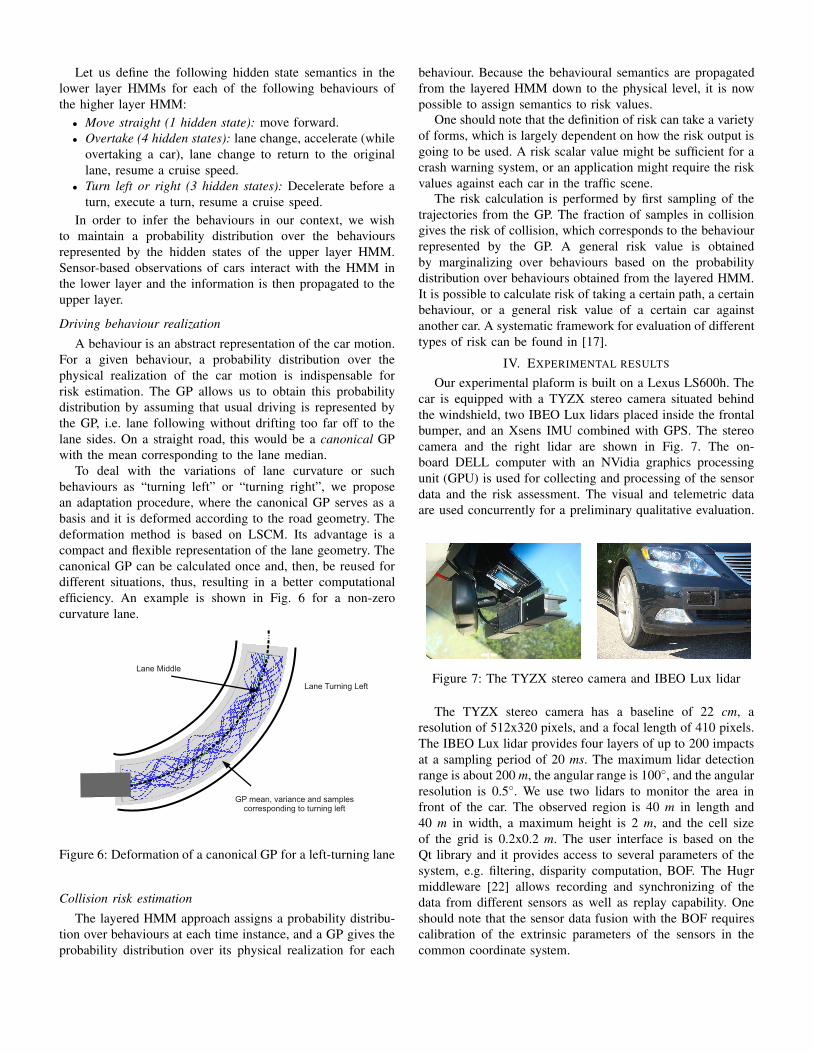
To deal with the variations of lane curvature or suchbehaviours as “turning left” or “turning right”, we proposean adaptation procedure, where the canonical GP serves as abasis and it is deformed according to the road geometry. Thedeformation method is based on LSCM. Its advantage is acompact and flexible representation of the lane geometry. Thecanonical GP can be calculated once and, then, be reused fordifferent situations, thus, resulting in a better computationalefficiency. An example is shown in Fig. 6 for a non-zerocurvature lane.
Figure 6: Deformation of a canonical GP for a left-turning lane
Collision risk estimation
The layered HMM approach assigns a probability distribu-tion over behaviours at each time instance, and a GP gives theprobability distribution over its physical realization for each
behaviour. Because the behavioural semantics are propagatedfrom the layered HMM down to the physical level, it is nowpossible to assign semantics to risk values.
One should note that the definition of risk can take a varietyof forms, which is largely dependent on how the risk output isgoing to be used. A risk scalar value might be sufficient for acrash warning system, or an application might require the riskvalues against each car in the traffic scene.
The risk calculation is performed by first sampling of thetrajectories from the GP. The fraction of samples in collisiongives the risk of collision, which corresponds to the behaviourrepresented by the GP. A general risk value is obtainedby marginalizing over behaviours based on the probabilitydistribution over behaviours obtained from the layered HMM.It is possible to calculate risk of taking a certain path, a certainbehaviour, or a general risk value of a certain car againstanother car. A systematic framework for evaluation of differenttypes of risk can be found in [17].
IV. EXPERIMENTAL RESULTS
Our experimental plaform is built on a Lexus LS600h. Thecar is equipped with a TYZX stereo camera situated behindthe windshield, two IBEO Lux lidars placed inside the frontalbumper, and an Xsens IMU combined with GPS. The stereocamera and the right lidar are shown in Fig. 7. The on-board DELL computer with an NVidia graphics processingunit (GPU) is used for collecting and processing of the sensordata and the risk assessment. The visual and telemetric dataare used concurrently for a preliminary qualitative evaluation.
Figure 7: The TYZX stereo camera and IBEO Lux lidar
The TYZX stereo camera has a baseline of 22 cm, aresolution of 512x320 pixels, and a focal length of 410 pixels.The IBEO Lux lidar provides four layers of up to 200 impactsat a sampling period of 20 ms. The maximum lidar detectionrange is about 200 m, the angular range is 100◦, and the angularresolution is 0.5◦. We use two lidars to monitor the area infront of the car. The observed region is 40 m in length and40 m in width, a maximum height is 2 m, and the cell sizeof the grid is 0.2x0.2 m. The user interface is based on theQt library and it provides access to several parameters of thesystem, e.g. filtering, disparity computation, BOF. The Hugrmiddleware [22] allows recording and synchronizing of thedata from different sensors as well as replay capability. Oneshould note that the sensor data fusion with the BOF requirescalibration of the extrinsic parameters of the sensors in thecommon coordinate system.
a
b
c
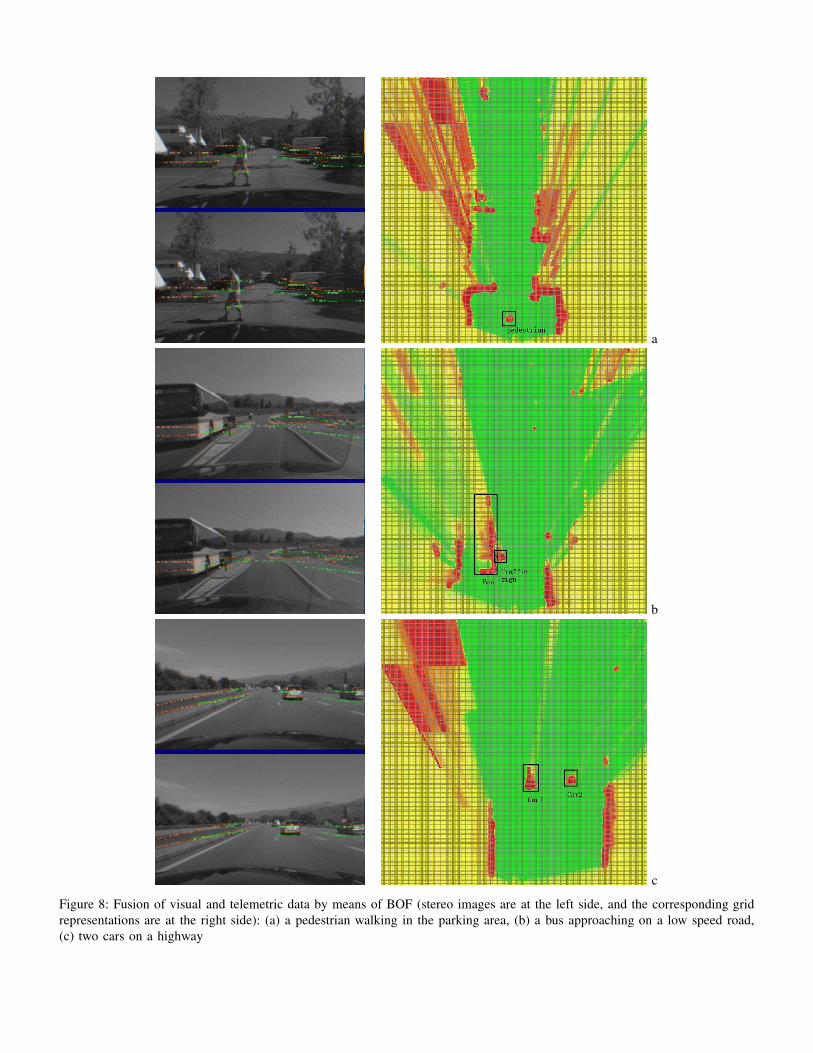
Figure 8: Fusion of visual and telemetric data by means of BOF (stereo images are at the left side, and the corresponding gridrepresentations are at the right side): (a) a pedestrian walking in the parking area, (b) a bus approaching on a low speed road,(c) two cars on a highway
Occupancy grid and data fusion
We selected three typical road scenes (with a pedestrian, abus, and two cars) from our large dataset, as shown in Fig. 8.The stereo images are displayed at the left-hand side (upperimage is from the left camera). The laser impacts are plottedonto the images (coloured dots). The occupancy grid is esti-mated by the BOF and is shown at the right-hand side in Fig. 8,where the occupancy probability is represented by red colourcells (high probability) or green colour cells (low probability),and the yellow-coloured cells correspond to the areas wherethe occupancy probability is unknown.
The scene with a pedestrian walking in a parking area isshown in Fig. 8a. The corresponding occupancy grid correctlydiscriminates the pedestrian and the surrounding cars fromthe unoccupied area. This example illustrates an advantage ofstereo vision over lidars because of its capability of perceivingpartially occluded objects, such as the white car at the right-hand side in Fig. 8a. Yet the accuracy of stereo vision decreaseswith the distance and becomes weak at long range, while thehigh accuracy of lidars remains constant over the distance. Theroad scene with a bus approaching the car is shown in Fig. 8b.The bus is correctly detected by visual and telemetric sensors.The accuracy appears to be sufficient for distinguishing theroad sign and the bus at a short distance range. The highwayexample is shown in Fig. 8c. Both cars are correctly detected.It appears that almost all road surface in the front is estimatedas unoccupied, including the areas occluded by the cars. Thefusion of data from the two lidars, and the time filteringcapability of the BOF allow us to attain this performance.When analyzing the image sequences, the objects are trackedcorrectly, in general. The estimation of velocities of cells inthe BOF results in distinguishing between two adjacent objectsmoving at different speeds.
Processing time
In comparison to the high computational cost of the BOF,the cost of the FCT algorithm can be neglected [2], [16].Our efforts to improve the computational efficiency focus onthe BOF implementation. This grid-based algorithm providesa way to parallelize the computation on the GPU. We im-plemented the BOF in C++ language without optimizationon a GPU with 30 processors (NVidia GeForce GTX 280).The complete processing chain for a lidar (including the BOFand the FCT algorithm) is capable of running at 20 Hz. Theimplementation of our stereo image processing on the GPUallows us to run both the matching stage and the occupancygrid computation in real time at up to 30 fps.
Validation of risk estimation
We tested our risk estimation approach on a driving simu-lator in a virtual environment, where a human drives a virtualcar by using a normal steering wheel. The virtual environmentallows us to deal with various collision situations, which aredifficult to reproduce in real world. The estimated risk valuesare recorded for a period of several seconds ahead of eachcollision. The experiments were jointly conducted with Toyota
Motor Europe (TME) to evaluate the reliability of generatedtrajectories by the GP and the estimated behaviours.
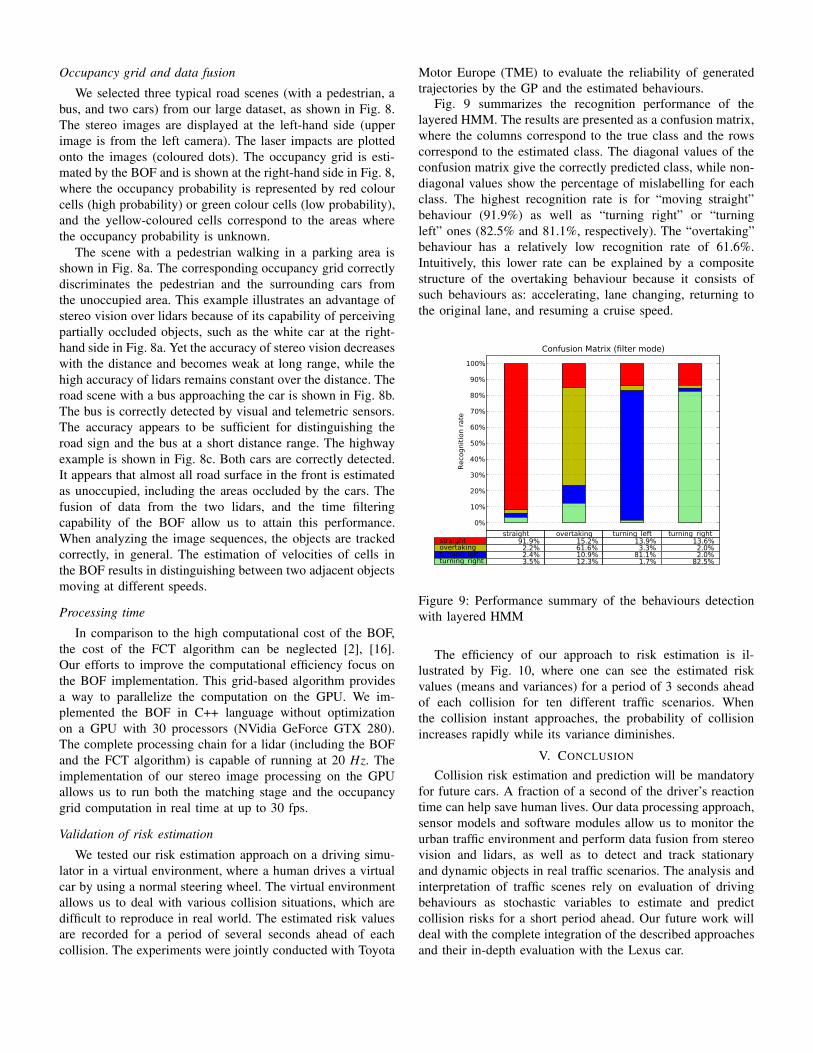
Fig. 9 summarizes the recognition performance of thelayered HMM. The results are presented as a confusion matrix,where the columns correspond to the true class and the rowscorrespond to the estimated class. The diagonal values of theconfusion matrix give the correctly predicted class, while non-diagonal values show the percentage of mislabelling for eachclass. The highest recognition rate is for “moving straight”behaviour (91.9%) as well as “turning right” or “turningleft” ones (82.5% and 81.1%, respectively). The “overtaking”behaviour has a relatively low recognition rate of 61.6%.Intuitively, this lower rate can be explained by a compositestructure of the overtaking behaviour because it consists ofsuch behaviours as: accelerating, lane changing, returning tothe original lane, and resuming a cruise speed.
straight overtaking turning_left turning_rightstraight 91.9% 15.2% 13.9% 13.6%overtaking 2.2% 61.6% 3.3% 2.0%turning_left 2.4% 10.9% 81.1% 2.0%turning_right 3.5% 12.3% 1.7% 82.5%
0%
10%
20%
30%
40%
50%
60%
70%
80%
90%
100%
Recognitionrate
Confusion Matrix (filter mode)
Figure 9: Performance summary of the behaviours detectionwith layered HMM
The efficiency of our approach to risk estimation is il-lustrated by Fig. 10, where one can see the estimated riskvalues (means and variances) for a period of 3 seconds aheadof each collision for ten different traffic scenarios. Whenthe collision instant approaches, the probability of collisionincreases rapidly while its variance diminishes.
V. CONCLUSION
Collision risk estimation and prediction will be mandatoryfor future cars. A fraction of a second of the driver’s reactiontime can help save human lives. Our data processing approach,sensor models and software modules allow us to monitor theurban traffic environment and perform data fusion from stereovision and lidars, as well as to detect and track stationaryand dynamic objects in real traffic scenarios. The analysis andinterpretation of traffic scenes rely on evaluation of drivingbehaviours as stochastic variables to estimate and predictcollision risks for a short period ahead. Our future work willdeal with the complete integration of the described approachesand their in-depth evaluation with the Lexus car.
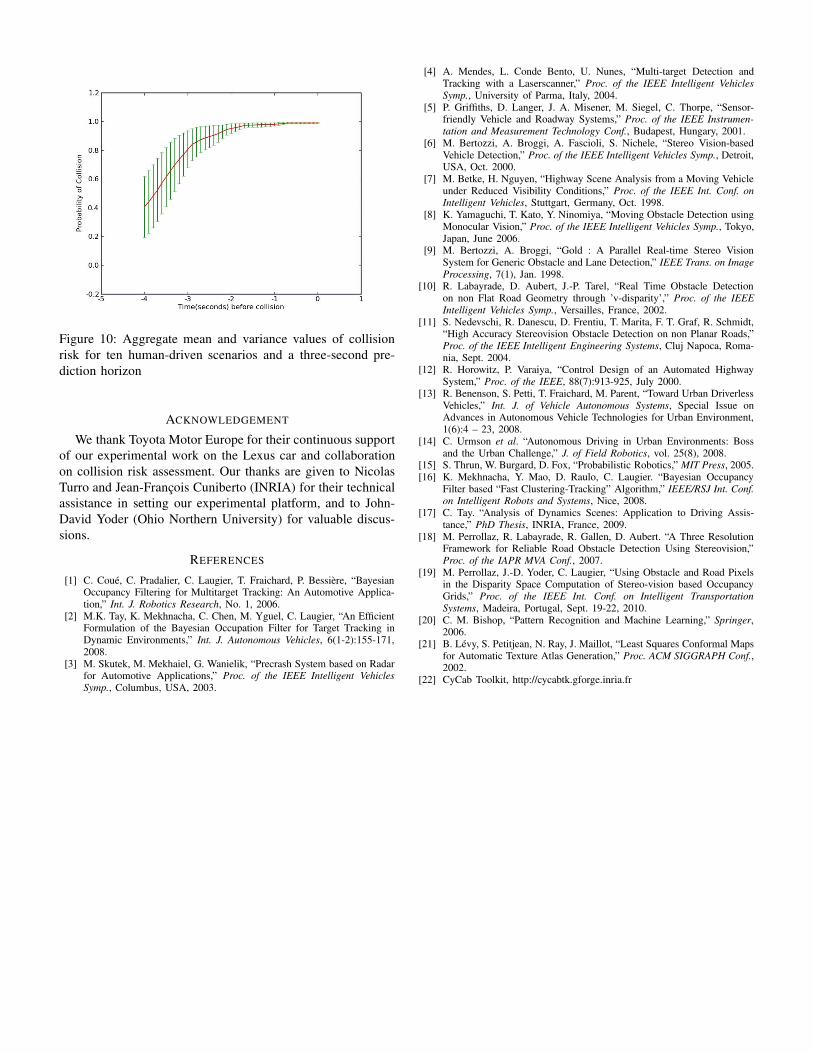
Figure 10: Aggregate mean and variance values of collisionrisk for ten human-driven scenarios and a three-second pre-diction horizon
ACKNOWLEDGEMENT
We thank Toyota Motor Europe for their continuous supportof our experimental work on the Lexus car and collaborationon collision risk assessment. Our thanks are given to NicolasTurro and Jean-Francois Cuniberto (INRIA) for their technicalassistance in setting our experimental platform, and to John-David Yoder (Ohio Northern University) for valuable discus-sions.
REFERENCES
[1] C. Coue, C. Pradalier, C. Laugier, T. Fraichard, P. Bessiere, “BayesianOccupancy Filtering for Multitarget Tracking: An Automotive Applica-tion,” Int. J. Robotics Research, No. 1, 2006.
[2] M.K. Tay, K. Mekhnacha, C. Chen, M. Yguel, C. Laugier, “An EfficientFormulation of the Bayesian Occupation Filter for Target Tracking inDynamic Environments,” Int. J. Autonomous Vehicles, 6(1-2):155-171,2008.
[3] M. Skutek, M. Mekhaiel, G. Wanielik, “Precrash System based on Radarfor Automotive Applications,” Proc. of the IEEE Intelligent VehiclesSymp., Columbus, USA, 2003.
[4] A. Mendes, L. Conde Bento, U. Nunes, “Multi-target Detection andTracking with a Laserscanner,” Proc. of the IEEE Intelligent VehiclesSymp., University of Parma, Italy, 2004.
[5] P. Griffiths, D. Langer, J. A. Misener, M. Siegel, C. Thorpe, “Sensor-friendly Vehicle and Roadway Systems,” Proc. of the IEEE Instrumen-tation and Measurement Technology Conf., Budapest, Hungary, 2001.
[6] M. Bertozzi, A. Broggi, A. Fascioli, S. Nichele, “Stereo Vision-basedVehicle Detection,” Proc. of the IEEE Intelligent Vehicles Symp., Detroit,USA, Oct. 2000.
[7] M. Betke, H. Nguyen, “Highway Scene Analysis from a Moving Vehicleunder Reduced Visibility Conditions,” Proc. of the IEEE Int. Conf. onIntelligent Vehicles, Stuttgart, Germany, Oct. 1998.
[8] K. Yamaguchi, T. Kato, Y. Ninomiya, “Moving Obstacle Detection usingMonocular Vision,” Proc. of the IEEE Intelligent Vehicles Symp., Tokyo,Japan, June 2006.
[9] M. Bertozzi, A. Broggi, “Gold : A Parallel Real-time Stereo VisionSystem for Generic Obstacle and Lane Detection,” IEEE Trans. on ImageProcessing, 7(1), Jan. 1998.
[10] R. Labayrade, D. Aubert, J.-P. Tarel, “Real Time Obstacle Detectionon non Flat Road Geometry through ’v-disparity’,” Proc. of the IEEEIntelligent Vehicles Symp., Versailles, France, 2002.
[11] S. Nedevschi, R. Danescu, D. Frentiu, T. Marita, F. T. Graf, R. Schmidt,“High Accuracy Stereovision Obstacle Detection on non Planar Roads,”Proc. of the IEEE Intelligent Engineering Systems, Cluj Napoca, Roma-nia, Sept. 2004.
[12] R. Horowitz, P. Varaiya, “Control Design of an Automated HighwaySystem,” Proc. of the IEEE, 88(7):913-925, July 2000.
[13] R. Benenson, S. Petti, T. Fraichard, M. Parent, “Toward Urban DriverlessVehicles,” Int. J. of Vehicle Autonomous Systems, Special Issue onAdvances in Autonomous Vehicle Technologies for Urban Environment,1(6):4 – 23, 2008.
[14] C. Urmson et al. “Autonomous Driving in Urban Environments: Bossand the Urban Challenge,” J. of Field Robotics, vol. 25(8), 2008.
[15] S. Thrun, W. Burgard, D. Fox, “Probabilistic Robotics,” MIT Press, 2005.[16] K. Mekhnacha, Y. Mao, D. Raulo, C. Laugier. “Bayesian Occupancy
Filter based “Fast Clustering-Tracking” Algorithm,” IEEE/RSJ Int. Conf.on Intelligent Robots and Systems, Nice, 2008.
[17] C. Tay. “Analysis of Dynamics Scenes: Application to Driving Assis-tance,” PhD Thesis, INRIA, France, 2009.
[18] M. Perrollaz, R. Labayrade, R. Gallen, D. Aubert. “A Three ResolutionFramework for Reliable Road Obstacle Detection Using Stereovision,”Proc. of the IAPR MVA Conf., 2007.
[19] M. Perrollaz, J.-D. Yoder, C. Laugier, “Using Obstacle and Road Pixelsin the Disparity Space Computation of Stereo-vision based OccupancyGrids,” Proc. of the IEEE Int. Conf. on Intelligent TransportationSystems, Madeira, Portugal, Sept. 19-22, 2010.
[20] C. M. Bishop, “Pattern Recognition and Machine Learning,” Springer,2006.
[21] B. Levy, S. Petitjean, N. Ray, J. Maillot, “Least Squares Conformal Mapsfor Automatic Texture Atlas Generation,” Proc. ACM SIGGRAPH Conf.,2002.
[22] CyCab Toolkit, http://cycabtk.gforge.inria.fr

![Fast online 3D reconstruction of dynamic scenes from ... · raster scanning systems [11], [20]–[22], enabling acquisitions with video frame rates. Yet, robust, automated and scalable](https://img.pdfslide.us/doc/110x75/60224b2ecfe6ed46c04aee0b/fast-online-3d-reconstruction-of-dynamic-scenes-from-raster-scanning-systems.jpg)
![Ray Tracing Dynamic Scenes using Selective Restructuringgamma.cs.unc.edu/SR/Selective.pdf · Ray Tracing Dynamic Scenes using Selective Restructuring ... [LM03, TKH 05]. A BVH is](https://img.pdfslide.us/doc/110x75/5c8d871f09d3f219388cac81/ray-tracing-dynamic-scenes-using-selective-ray-tracing-dynamic-scenes-using.jpg)


![Robust Radiometric Calibration for Dynamic Scenes in the Wild...et al. [15]. This algorithm avoids overfitting and presents a principled approach for radiometric calibration. However,](https://img.pdfslide.us/doc/110x75/60c91ce37964f87791615c73/robust-radiometric-calibration-for-dynamic-scenes-in-the-wild-et-al-15-this.jpg)