Embed Size (px)
Citation preview
The AQUILA Network
& Quality Assurance /Quality Control Programmes in Europe
Annette BorowiakJoint Research Centre
Institute for Environment and Sustainability
Air & Climate Unit
with contributions from Michel Gerboles,
Pascual Perez Ballesta, Claudio Belis and Fritz Lagler

Structure of presentation
JRC/ERLAP & AQUILA QA/QC programmes• JRC – ERLAP• gaseous air pollutants• particulate air pollutants
AQUILA & recent activities
372
373
374
375
376
377
10:52:19 10:53:46 10:55:12 10:56:38 10:58:05
CO
2, p
pm
0
2
4
6
8
10
12
14
10:52:19 10:53:46 10:55:12 10:56:38 10:58:05
SO2,
ppb
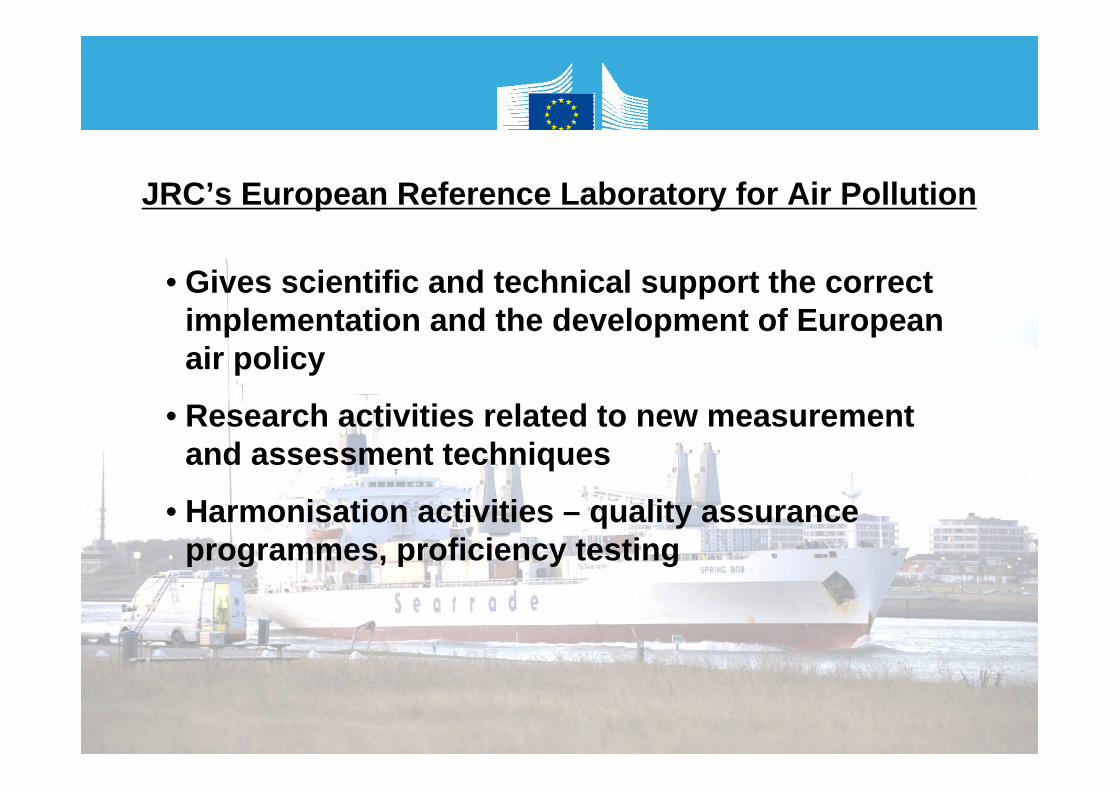
• Gives scientific and technical support the correct implementation and the development of European air policy
• Research activities related to new measurement and assessment techniques
• Harmonisation activities – quality assurance programmes, proficiency testing
JRC’s European Reference Laboratory for Air Pollution

Diffusive sampling technique.Sensor validation for monitoring.Innovative system for sample preparation. Development of methods for analysis and quantification.
AQ Measurements & Method Development at JRC-ERLAP
Method development and improvement (sampling and analysis)
Field assessments
Remote measurements of ship emissions.Air quality assessment.Source apportionment studies.Exposure to air pollutants.

Testing & validation of micro-sensors for air pollution assessment
Laboratory testing at controlled wind/temperature/humidity conditions with varying air pollutant and interfering substances
27/10 - 07/11
y = 0.9999x + 1E-04R2 = 0.9871
-5
0
5
10
15
20
25
30
35
40
-5 0 5 10 15 20 25 30 35 40
Ozone in ppb, UV Photometry, half-an-hour averages
Ozo
ne in
ppb
, mod
elis
ed O
MC2
3A1
26
Field validation studies: obtaining results through modelling sensor response according to influencing parameters
With “special treatment” some sensors can measure air quality (O3, NO2) within data quality requirements of EU Directives.

67 March 2013
Sensors
Ship exhaust plume measurement fromunmanned flying platform: verification of “ship fuel” directive on sulphur in marine fuel:
0
500
1000
1500
2000
2500
3000
17:36 17:38 17:39 17:41 17:42 17:44 17:45
Time
CO2,
ppm
-2
0
2
4
6
8
10
12
SO2,
ppm
CO2SO2
- Measurement of SO2 and CO2 concentrations: Calculation of S-content in fuel
- Validation of sensor results with canister sample & classical reference gas analyzers
- Difference < 8%.

JRC - AQUILA harmonisation activities
- Intercomparison exercises for NO2 since early 90s
- Regular intercomparison exercises for NOx, O3, SO2, CO
- VOC round robin tests (gas cylinder)
- BTX intercomparisons
- AQUILA (EUSAAR/ACTRIS) EC/OC intercomparison
- 1st metal intercomparison
- 1st PAH intercomparison
- Unique PM10 & PM2.5 QA/QC programme

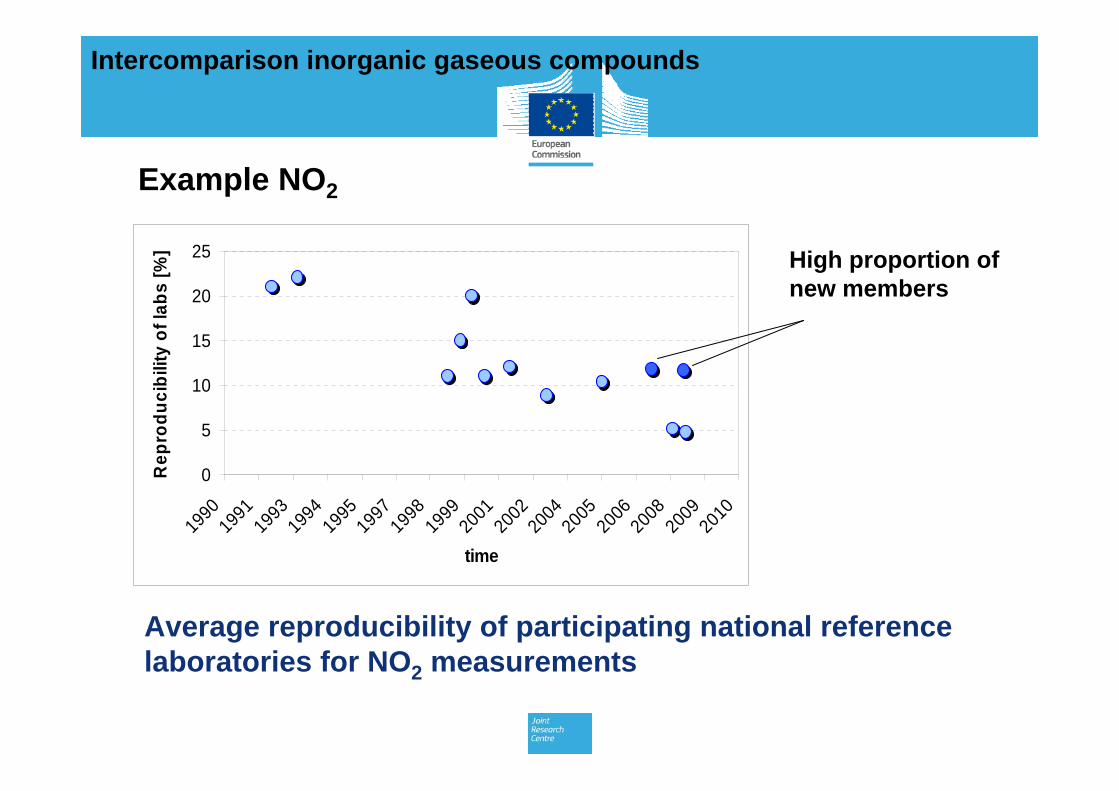
Intercomparison inorganic gaseous compounds
Generation of gas mixtures SO2/CO
0
50
100
150
200
250
300
11:00
12:00
13:00
14:00
15:00
16:00
17:00
18:00
19:00
20:00
21:00
22:00
23:00
00:00
01:00
02:00
03:00
Time
Con
cent
ratio
n SO
2 [p
pb]
0
5
1015
20
25
30
3540
45
50
Con
cent
ratio
n CO
[ppm
]
SO2 (ppb)CO (ppm)
Tuesday Wednesday
Sulphur Dioxide concentration level 1
125
130
135
140
145
150
A B C D E F G H I
Laboratory
SO2 (
nmol
/mol
)
In collaboration with WHO CC at UBA (D)
E.g. SO2
0
5
10
15
20
25
1990
1991
1993
1994
1995
1997
1998
1999
2001
2002
2004
2005
2006
2008
2009
2010
time
Rep
rodu
cibi
lity
of la
bs [%
] High proportion of new members
Average reproducibility of participating national reference laboratories for NO2 measurements
Intercomparison inorganic gaseous compounds
Example NO2

Benzene
0
0.5
1
1.5
2
2.5
3
A B C D E F G H I J
K - V
alue
s
0
0.5
1
1.5
2
2.5
3
1st2nd3rd4th5th
Intercomparison exercisesorganic gaseous compounds
AEAT
EAR
S
UBA
(A)-
1
UBA
(A)-
2
AOL-
UU
W
CN
R
CN
R-M
S
CN
R-M
STTI
ISSe
P
EMD
IVL
NPL
ERLA
P
VMM
VMM
-S1
VMM
-S2
EMPA
EPA
FMI
FMI-M
S
ISC
III
ethane
ethene
propane
propene
iso-butane
n-butane
acetylene
trans-2-butene
1-butene
cis-2-butene
2-methyl butane
n-pentane
1,3-butadiene
trans-2pentene
1-pentene
2-methyl pentane
n-hexane
isoprene
n-heptane
benzene
2,2,4-trimethyl pentane
n-octane
toluene
ethyl-benzene
m+p-xylene
o-xylene
1,3,5-trimethyl benzene
1,2,4-trimethyl benzene
1,2,3-trimethyl benzene
500
250
100
502510505102550
100
250
500
Deviation , %
Example intercomparison BTX - generated on ERLAP
bench
Example VOC round robin test – circulating special gas cylinders

S1, liquid CRM,
Calibration biasRepeatability/ reproducibility
S2, digested dust CRM
S3, dust CRM, 10
mgDigestion (dust
matrix)Calibration bias
S4, digested filter, 117
ng/m³
S5, filter, 55 ng/m³
Digestion(filter matrix),
DQO Repeatability/ reproducibility
JRC JRC
1st metals intercomparison
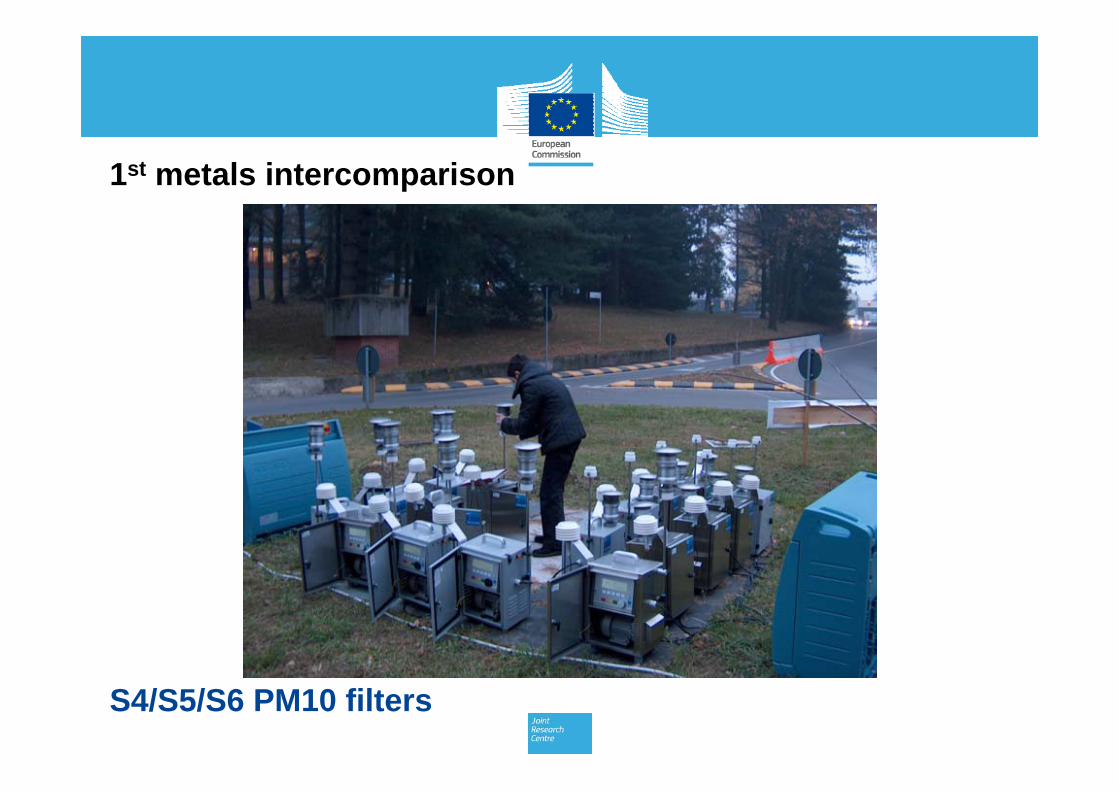
S4/S5/S6 PM10 filters
1st metals intercomparison
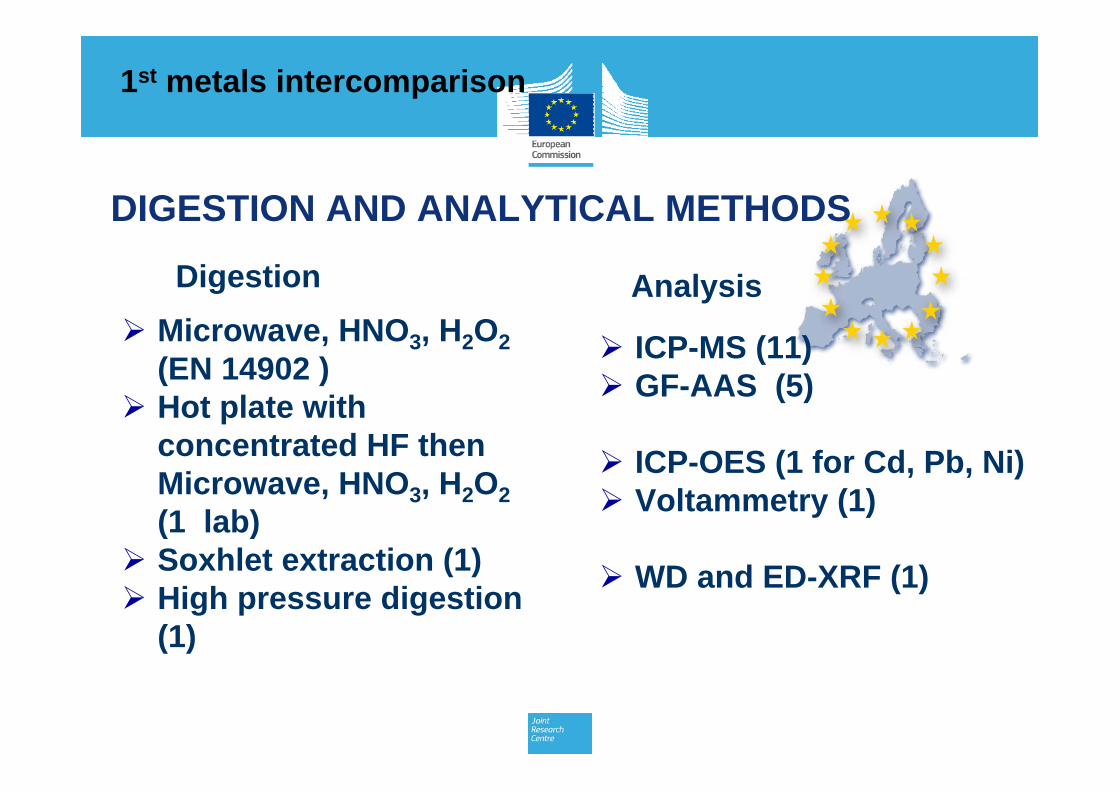
DIGESTION AND ANALYTICAL METHODS
ICP-MS (11) GF-AAS (5)
ICP-OES (1 for Cd, Pb, Ni) Voltammetry (1)
WD and ED-XRF (1)
Microwave, HNO3, H2O2(EN 14902 )
Hot plate with concentrated HF then Microwave, HNO3, H2O2(1 lab)
Soxhlet extraction (1) High pressure digestion
(1)
AnalysisDigestion
1st metals intercomparison
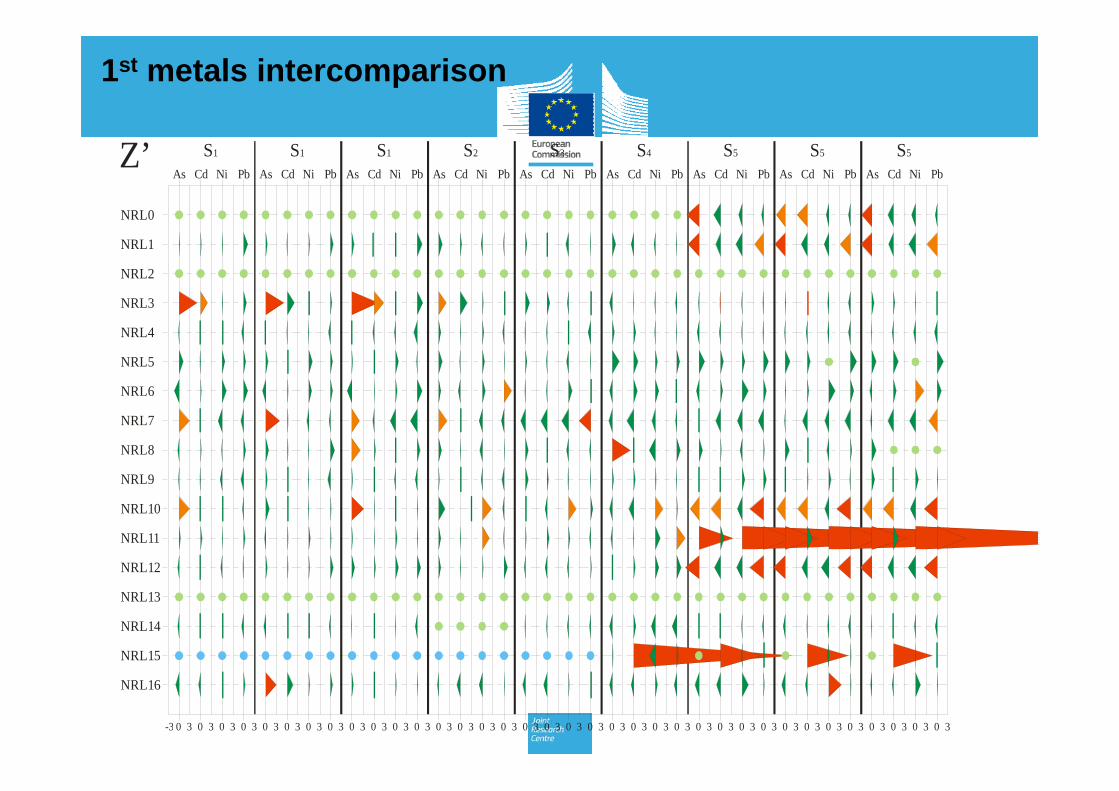
NRL0
NRL1
NRL2
NRL3
NRL4
NRL5
NRL6
NRL7
NRL8
NRL9
NRL10
NRL11
NRL12
NRL14
NRL13
NRL15
NRL16
PbAs Cd Ni Pb As Cd Ni As Cd Ni Pb As Cd Ni Pb As Cd Ni Pb As Cd Ni Pb As Cd Ni Pb As Cd Ni Pb As Cd Ni Pb
S5S4 S5S3S1 S1 S1 S2 S5
0 3 0 3 0 3 0 3 0 3 0 3 0 3 0 3 0 3 0 3 0 3 0 3 0 3 0 30 3 0 3 0 3 0 3 0 3 0 3 0 3 0 3 0 3 0 3 0 3 0 3 0 3 0 3 0 3 0 3 0 30 3-3 0 3 0 3 0 3 0 3
Z’
1st metals intercomparison
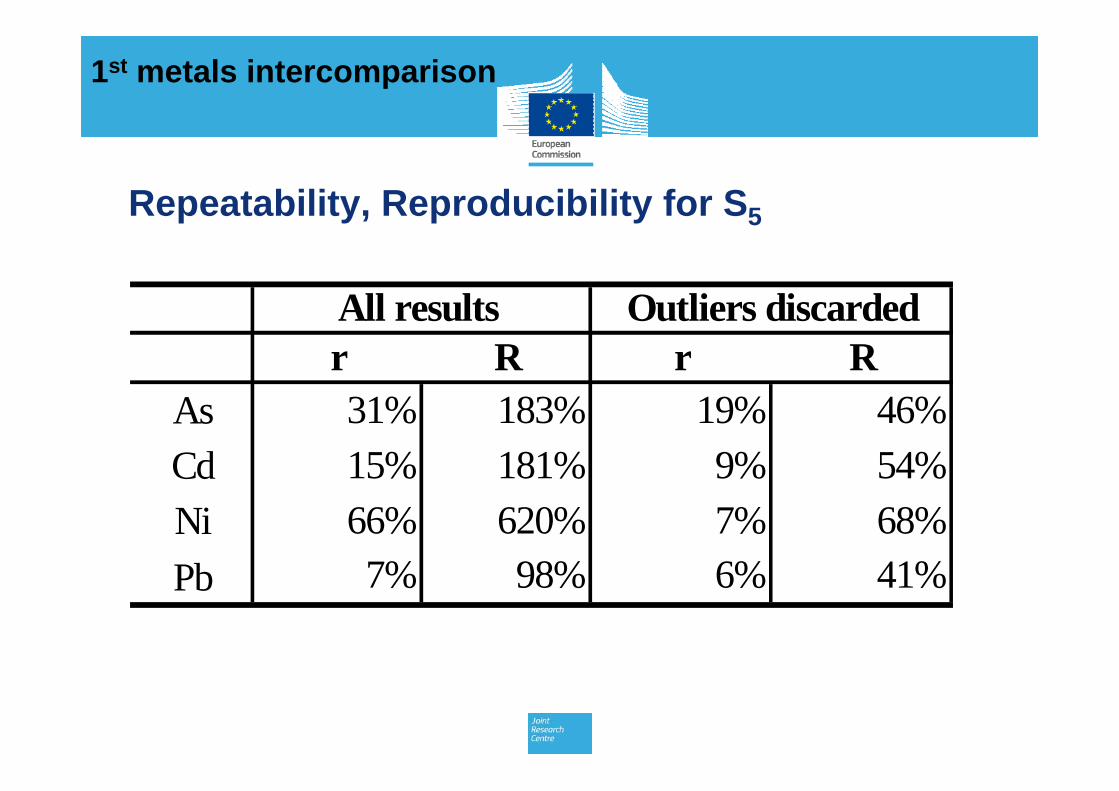
Repeatability, Reproducibility for S5
r R r RAs 31% 183% 19% 46%Cd 15% 181% 9% 54%Ni 66% 620% 7% 68%Pb 7% 98% 6% 41%
All results Outliers discarded
1st metals intercomparison
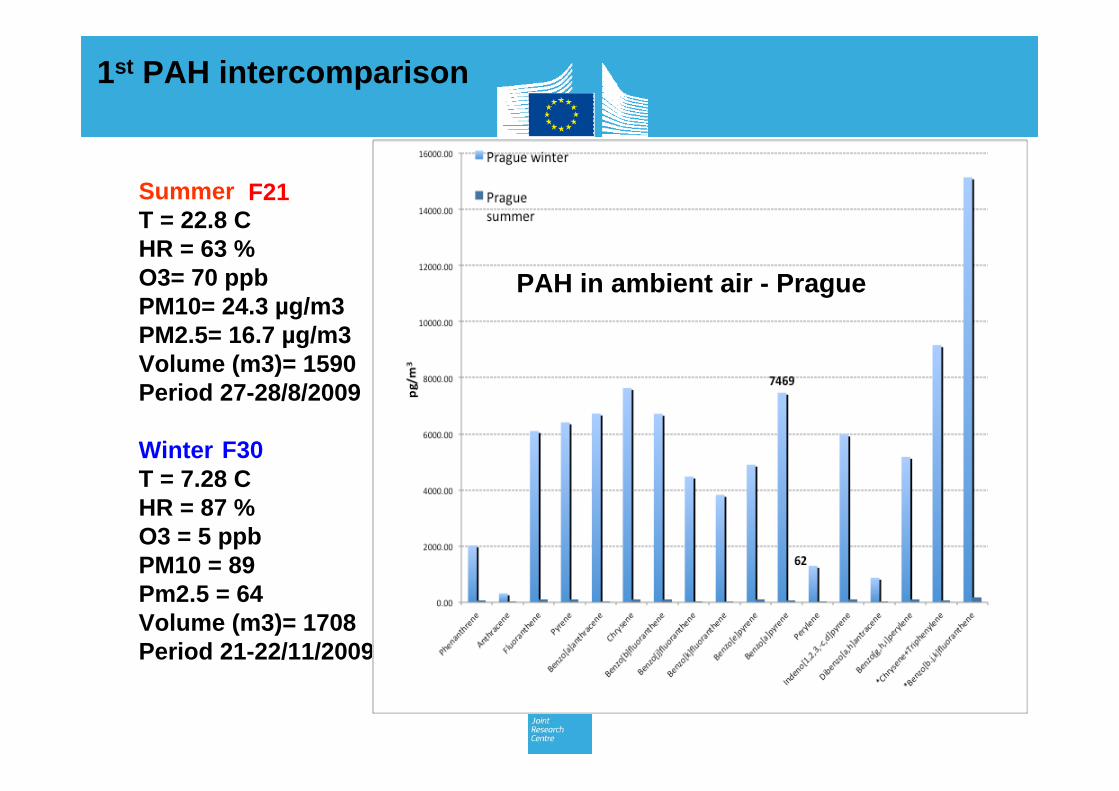
SummerT = 22.8 CHR = 63 %O3= 70 ppbPM10= 24.3 µg/m3PM2.5= 16.7 µg/m3Volume (m3)= 1590Period 27-28/8/2009
WinterT = 7.28 CHR = 87 %O3 = 5 ppbPM10 = 89Pm2.5 = 64Volume (m3)= 1708Period 21-22/11/2009
F21
F30
PAH in ambient air - Prague
1st PAH intercomparison

PRAGUE WINTER 16 PAH=79.14 ng/m3, 7.47 ng/m3 of BaP, Sampled Volume= 49.9 m3PRAGUE WINTER 16 PAH=79.14 ng/m3, 7.47 ng/m3 of BaP, Sampled Volume= 49.9 m3
T= 7.3 °C, HR= 87 %, O3= 5 ppb, PM10 = 89μg/m3, PM2.5 = 64 μg/m3
F30
IVL
EP
A-L
T
AP
A-L
RA
VM
M
LAN
UV
AW
EL
CH
MU
EE
RC
NE
RI
EE
A
ISS
eP
EP
A-ie
AB
UM
KA
L
FMI
AE
AT
ER
LAP
ER
LAP
#T
Laboratory
Dev
iatio
n, %
Phenanthrene
Anthracene
Fluoranthene
Pyrene
Benzo[a]anthracene
Chrysene
Benzo[b]fluoranthene
Benzo[j]fluoranthene
Benzo[k]fluoranthene
Benzo[e]pyrene
Benzo[a]pyrene
Perylene
Indeno[1,2,3,-c,d]pyrene
Dibenzo[a,h]antracene
Benzo[g,h,i]perylene
*Chrysene+Triphenylene
*Benzo[b.j,k]fluoranthene
25
-500
250
100
50
10 010 -25
500
-250
-100
-50
1st PAH intercomparison

PRAGUE SUMMER 16 PAH= 1.15 ng/m3, 62 pg/m3 of BaP , Sampled Volume= 46.5 m3
T= 22.8 °C, HR= 63 %, O3= 63 ppb, PM10 = 24 μg/m3, PM2.5 = 17 μg/m3
1st PAH intercomparison
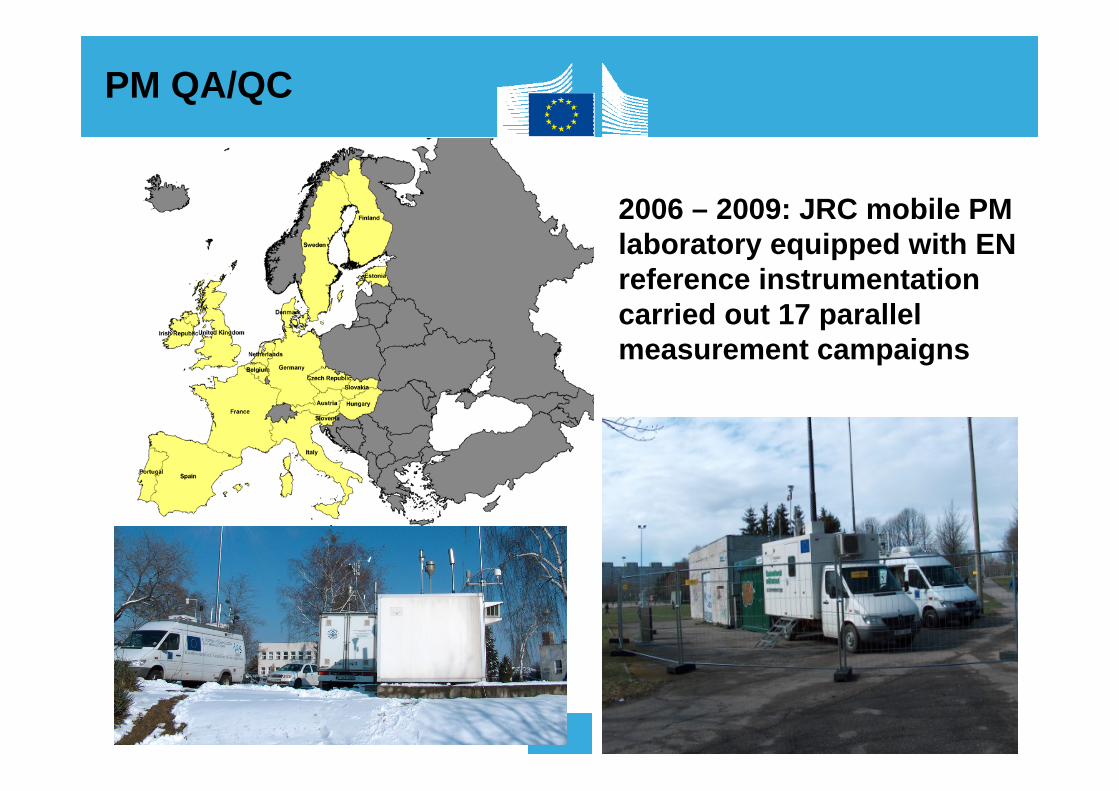
PM QA/QC
2006 – 2009: JRC mobile PM laboratory equipped with EN reference instrumentation carried out 17 parallel measurement campaigns

PM QA/QC
PM 10 all labs(y: LV / p: HV / b: online)
-100
-50
0
50
100
150
24 h average over time
% d
evia
tion
• Provide information on comparability of PM measurements (MS, reference, equivalent)
• Check performance of NRL & routine monitoring network
• Implementation and validity of correction factors
• Performance LV, HV, automatic instruments, info filter material and filter blanks, …

JRC Inter-comparison for Receptor ModelsKick-off Workshop in Ispra (4th-5th November 2010)
Step 1 Survey of receptor models suitable for the purposes of the inter-comparisonIdentification of the pollutants and metrics to test, according to the needs and to the most up-to-date
technical developments. Revision of the methodologies for uncertainty estimation and expression Definition of criteria for the assessment of model performance Discussion about the feasibility of a Common Protocol for source apportionment (including quality
assurance procedures, validation criteria and quality standards)
Step 2Carry out an Inter-comparison between the involved research groups by applying the Harmonized
Protocol and other widely accepted techniques to one or more common databases. Evaluate the outputs according to quality criteria and assess the influence of critical variablesCheck the influence of different scientific backgrounds/ approaches in source identification.Use the results of this exercise to set up common standards for the interpretation of receptor model
outputs and to draft a common protocol to be used for obligations under AQD.
Under AQUILA-FAIRMODE: Source Apportionment
Results of the European Intercomparison exercise for Receptor Models 2011‐2012. Part I. Report EUR 25727 EN3rd Workshop in Ispra (27th-28th February 2013)

Network Members: 37 National Reference Laboratories from the 27 Member States & EFTA
Observers: Turkey, Croatia, Macedonia, Serbia
http://ies.jrc.ec.europa.eu/aquila-homepage.html
AQUILA
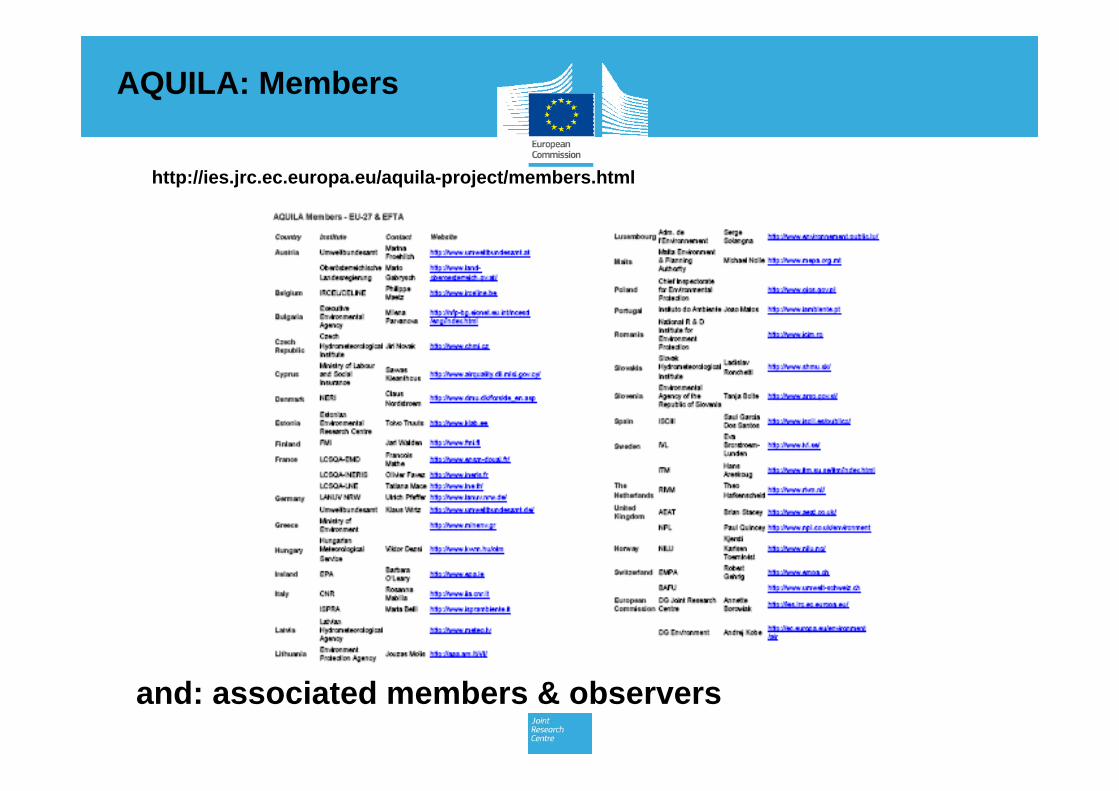
AQUILA: Members
http://ies.jrc.ec.europa.eu/aquila-project/members.html
and: associated members & observers
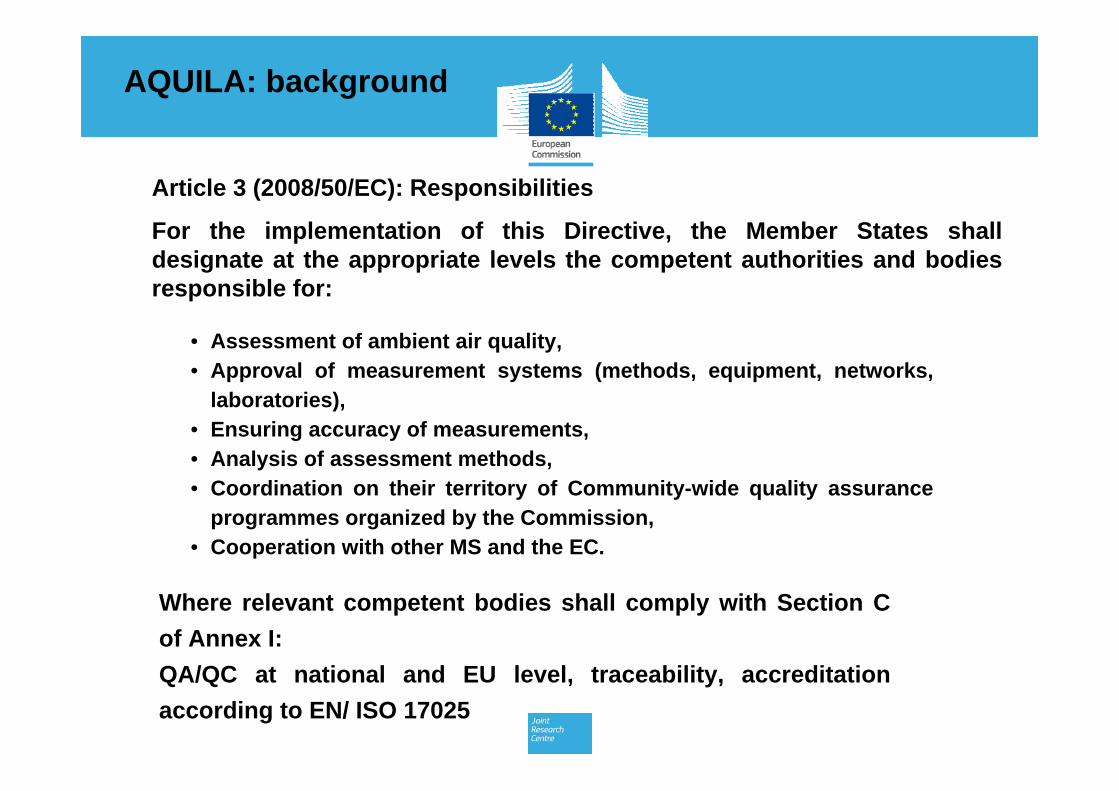
• Assessment of ambient air quality,• Approval of measurement systems (methods, equipment, networks,
laboratories),• Ensuring accuracy of measurements, • Analysis of assessment methods,• Coordination on their territory of Community-wide quality assurance
programmes organized by the Commission,• Cooperation with other MS and the EC.
Article 3 (2008/50/EC): Responsibilities
For the implementation of this Directive, the Member States shall designate at the appropriate levels the competent authorities and bodies responsible for:
AQUILA: background
Where relevant competent bodies shall comply with Section C of Annex I:QA/QC at national and EU level, traceability, accreditation according to EN/ ISO 17025
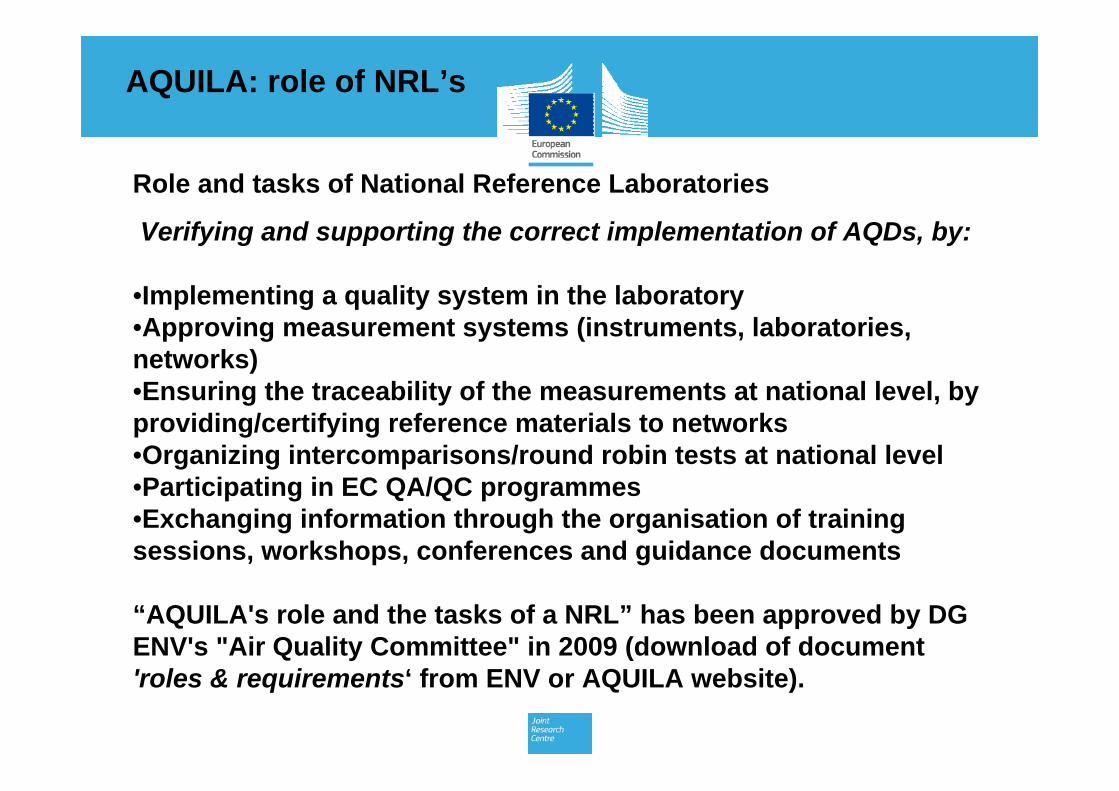
AQUILA: role of NRL’s
Role and tasks of National Reference Laboratories
Verifying and supporting the correct implementation of AQDs, by:
•Implementing a quality system in the laboratory •Approving measurement systems (instruments, laboratories, networks) •Ensuring the traceability of the measurements at national level, by providing/certifying reference materials to networks •Organizing intercomparisons/round robin tests at national level •Participating in EC QA/QC programmes •Exchanging information through the organisation of training sessions, workshops, conferences and guidance documents
“AQUILA's role and the tasks of a NRL” has been approved by DG ENV's "Air Quality Committee" in 2009 (download of document 'roles & requirements‘ from ENV or AQUILA website).
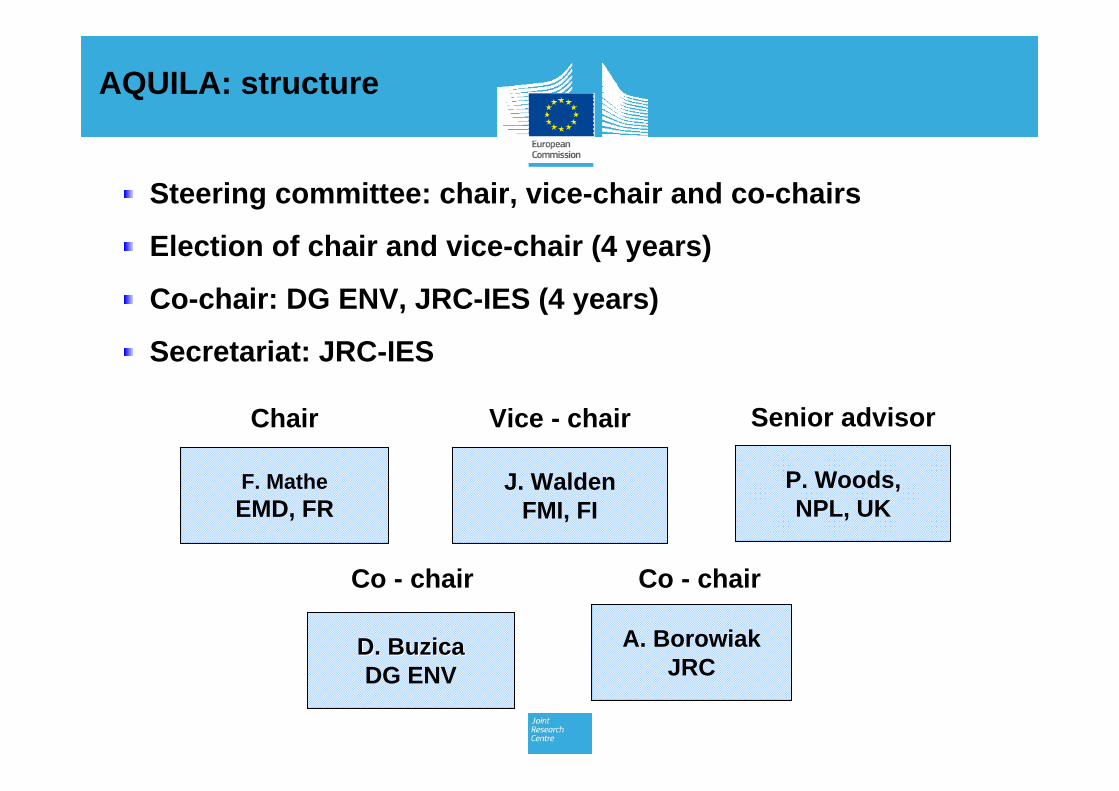
Steering committee: chair, vice-chair and co-chairs
Election of chair and vice-chair (4 years)
Co-chair: DG ENV, JRC-IES (4 years)
Secretariat: JRC-IES
F. MatheEMD, FR
J. WaldenFMI, FI
D. BuzicaD. BuzicaDG ENV
A. BorowiakJRC
P. Woods,NPL, UK
Co - chair Co - chair
Chair Vice - chair Senior advisor
AQUILA: structure

1st meeting: December 2001
20th meeting: 22/23 April 2013
focussing on, e.g.:
- Accreditation of NRL’s
- Common PM equivalence tests
- Development of CRM
- Training on measurement uncertainty
- PM2.5 measurement uncertainties
- Review of EU policy
AQUILA: meetings
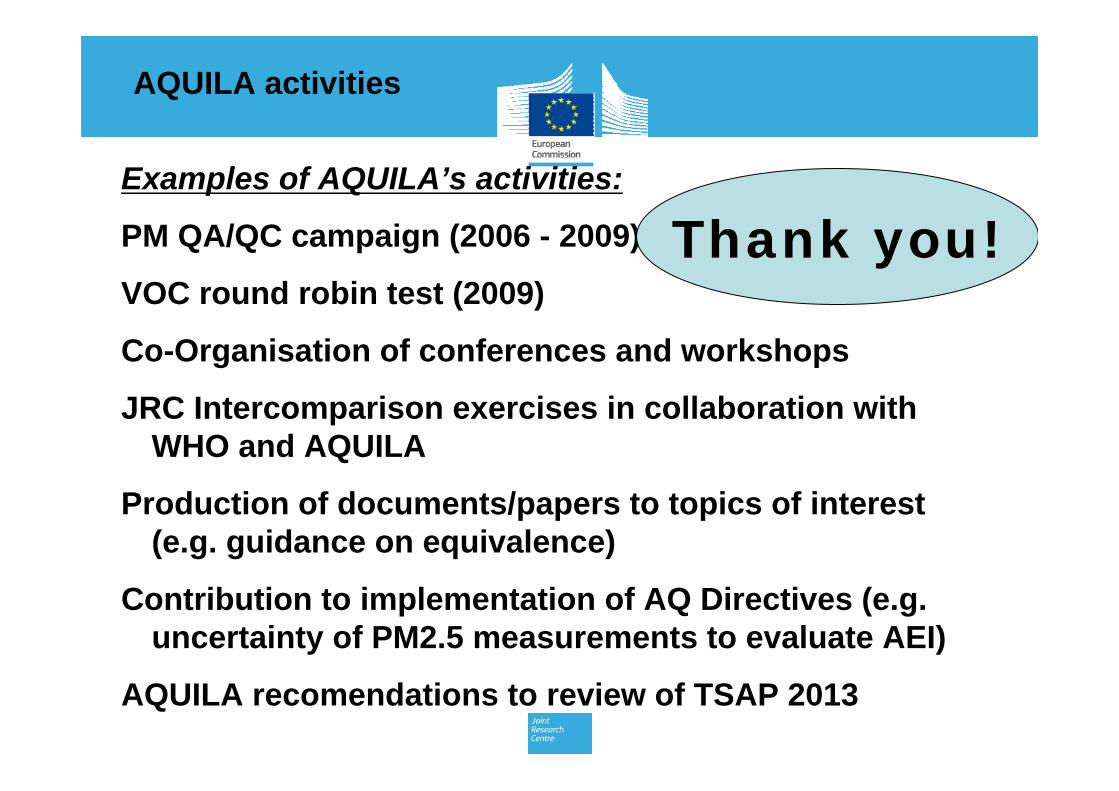
Examples of AQUILA’s activities:
PM QA/QC campaign (2006 - 2009)
VOC round robin test (2009)
Co-Organisation of conferences and workshops
JRC Intercomparison exercises in collaboration with WHO and AQUILA
Production of documents/papers to topics of interest (e.g. guidance on equivalence)
Contribution to implementation of AQ Directives (e.g. uncertainty of PM2.5 measurements to evaluate AEI)
AQUILA recomendations to review of TSAP 2013
AQUILA activities
Thank you!