Embed Size (px)
Citation preview
Page 1
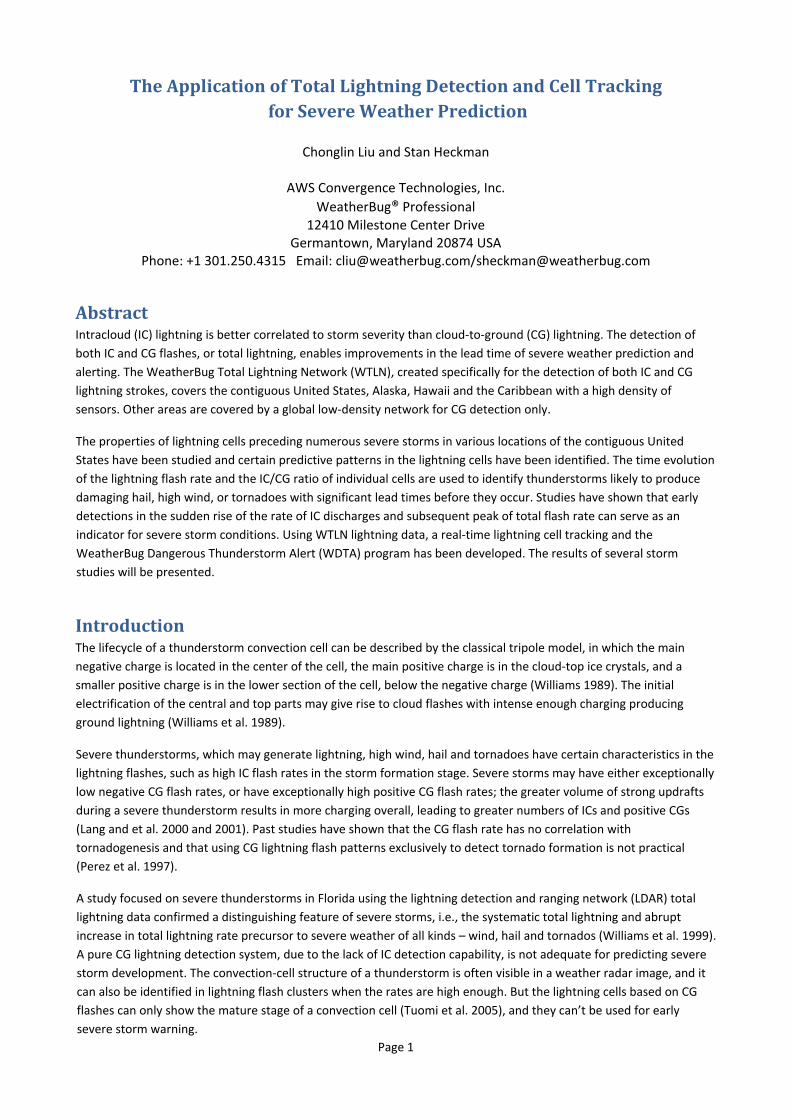
The Application of Total Lightning Detection and Cell Tracking for Severe Weather Prediction
Chonglin Liu and Stan Heckman
AWS Convergence Technologies, Inc.
WeatherBug® Professional 12410 Milestone Center Drive
Germantown, Maryland 20874 USA Phone: +1 301.250.4315 Email: [email protected]/[email protected]
Abstract Intracloud (IC) lightning is better correlated to storm severity than cloud‐to‐ground (CG) lightning. The detection of both IC and CG flashes, or total lightning, enables improvements in the lead time of severe weather prediction and alerting. The WeatherBug Total Lightning Network (WTLN), created specifically for the detection of both IC and CG lightning strokes, covers the contiguous United States, Alaska, Hawaii and the Caribbean with a high density of sensors. Other areas are covered by a global low‐density network for CG detection only.
The properties of lightning cells preceding numerous severe storms in various locations of the contiguous United States have been studied and certain predictive patterns in the lightning cells have been identified. The time evolution of the lightning flash rate and the IC/CG ratio of individual cells are used to identify thunderstorms likely to produce damaging hail, high wind, or tornadoes with significant lead times before they occur. Studies have shown that early detections in the sudden rise of the rate of IC discharges and subsequent peak of total flash rate can serve as an indicator for severe storm conditions. Using WTLN lightning data, a real‐time lightning cell tracking and the WeatherBug Dangerous Thunderstorm Alert (WDTA) program has been developed. The results of several storm studies will be presented.
Introduction The lifecycle of a thunderstorm convection cell can be described by the classical tripole model, in which the main negative charge is located in the center of the cell, the main positive charge is in the cloud‐top ice crystals, and a smaller positive charge is in the lower section of the cell, below the negative charge (Williams 1989). The initial electrification of the central and top parts may give rise to cloud flashes with intense enough charging producing ground lightning (Williams et al. 1989).
Severe thunderstorms, which may generate lightning, high wind, hail and tornadoes have certain characteristics in the lightning flashes, such as high IC flash rates in the storm formation stage. Severe storms may have either exceptionally low negative CG flash rates, or have exceptionally high positive CG flash rates; the greater volume of strong updrafts during a severe thunderstorm results in more charging overall, leading to greater numbers of ICs and positive CGs (Lang and et al. 2000 and 2001). Past studies have shown that the CG flash rate has no correlation with tornadogenesis and that using CG lightning flash patterns exclusively to detect tornado formation is not practical (Perez et al. 1997).
A study focused on severe thunderstorms in Florida using the lightning detection and ranging network (LDAR) total lightning data confirmed a distinguishing feature of severe storms, i.e., the systematic total lightning and abrupt increase in total lightning rate precursor to severe weather of all kinds – wind, hail and tornados (Williams et al. 1999). A pure CG lightning detection system, due to the lack of IC detection capability, is not adequate for predicting severe storm development. The convection‐cell structure of a thunderstorm is often visible in a weather radar image, and it can also be identified in lightning flash clusters when the rates are high enough. But the lightning cells based on CG flashes can only show the mature stage of a convection cell (Tuomi et al. 2005), and they can’t be used for early severe storm warning.
The Huntsville, Alabama, National Weather Service office utilizes total lightning information from the North Alabama Lightning Mapping Array (NALMA) to diagnose convective trends; this lightning data has led to greater confidence and lead time in issuing severe thunderstorm and tornado warnings (Darden et al. 2010). In one study, the IC lightning precursor provided a valuable short‐term warning for microburst hazard at ground level (Williams et al. 1989). The lightning cells identified from the total lightning data would be able to track the whole lifecycle of a storm. A study based on data from the Lightning Detection Network in Europe (LINET) achieved an important step in tracking lightning cells using total lightning data (Betz et al. 2008).
The WeatherBug Total Lightning Network (WTLN) is a total lightning detection network—its wideband sensors detect both IC and CG flash signals. The deployment of this high density sensor network and the improvement in the detection efficiency on the server side, especially in IC flash detection, made it practical to track and predict severe weather in real‐time. Studies have shown that the severe weather often occurs minutes after the total lightning rate reaches the peak and tracking the rise of total lightning flash rate provides severe weather prediction lead time. By using the WTLN total lightning data, a real‐time lightning cell tracking system and subsequent dangerous thunderstorm alert system have been developed. This study will provide insight into the WTLN development and show features such as the IC and CG waveforms and the IC detection efficiency. The concept of alert issuing and some examples are also presented.
WeatherBug Total Lightning Network (WTLN) The WeatherBug Lightning Detection Network (WTLN) is the fruit from a decade of research and development efforts. By combining advanced lightning detection technologies with modern electronics, a WeatherBug Lightning Sensor (WLS) can acquire detailed signals emitted from both IC and CG flashes and continuously sends information to a central server. A WLS is composed of an antenna, a global positioning system (GPS) receiver, a GPS‐based timing circuit, a digital signal processor (DSP), and onboard storage and internet communication equipment.
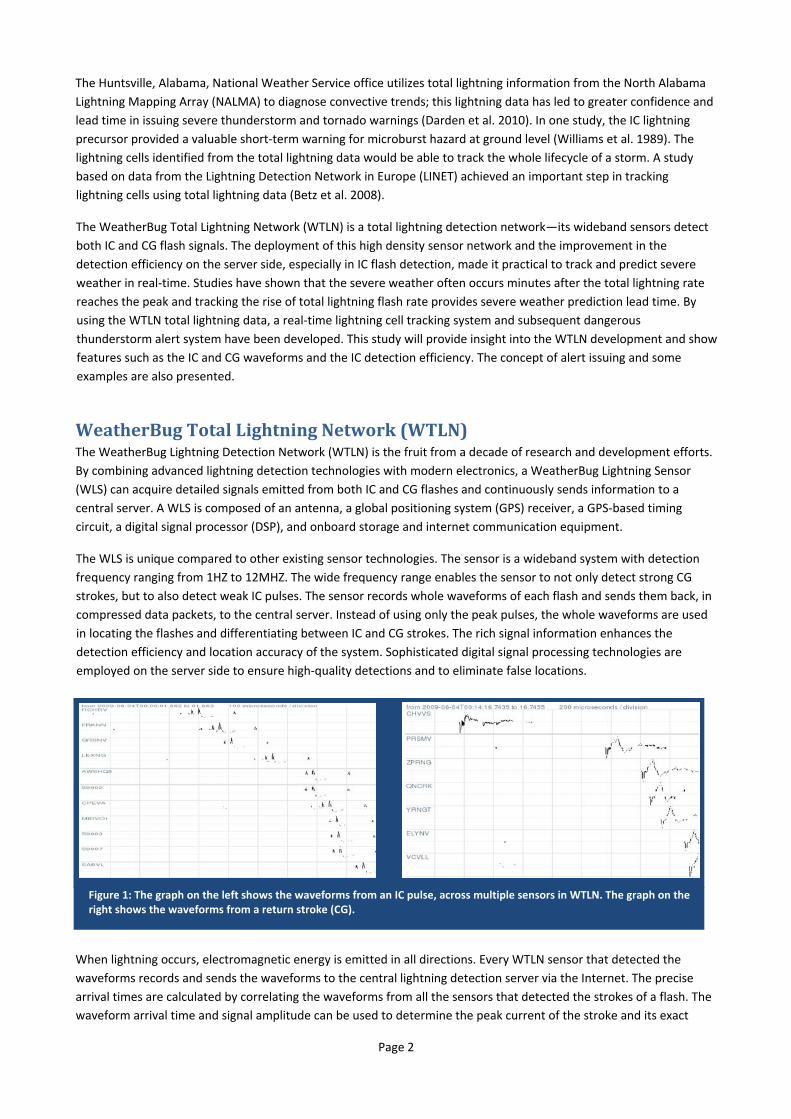
The WLS is unique compared to other existing sensor technologies. The sensor is a wideband system with detection frequency ranging from 1HZ to 12MHZ. The wide frequency range enables the sensor to not only detect strong CG strokes, but to also detect weak IC pulses. The sensor records whole waveforms of each flash and sends them back, in compressed data packets, to the central server. Instead of using only the peak pulses, the whole waveforms are used in locating the flashes and differentiating between IC and CG strokes. The rich signal information enhances the detection efficiency and location accuracy of the system. Sophisticated digital signal processing technologies are employed on the server side to ensure high‐quality detections and to eliminate false locations.
Figure 1: The graph on the left shows the waveforms from an IC pulse, across multiple sensors in WTLN. The graph on the right shows the waveforms from a return stroke (CG).
When lightning occurs, electromagnetic energy is emitted in all directions. Every WTLN sensor that detected the waveforms records and sends the waveforms to the central lightning detection server via the Internet. The precise arrival times are calculated by correlating the waveforms from all the sensors that detected the strokes of a flash. The waveform arrival time and signal amplitude can be used to determine the peak current of the stroke and its exact
Page 2
location including latitude, longitude and altitude. Strokes are then clustered into a flash if they are within 700 milliseconds and 10 kilometers. A flash that contains at least one return stroke is classified as a CG flash, otherwise it is classified as an IC flash. In the lightning cell tracking and alert generation, only flashes are used.
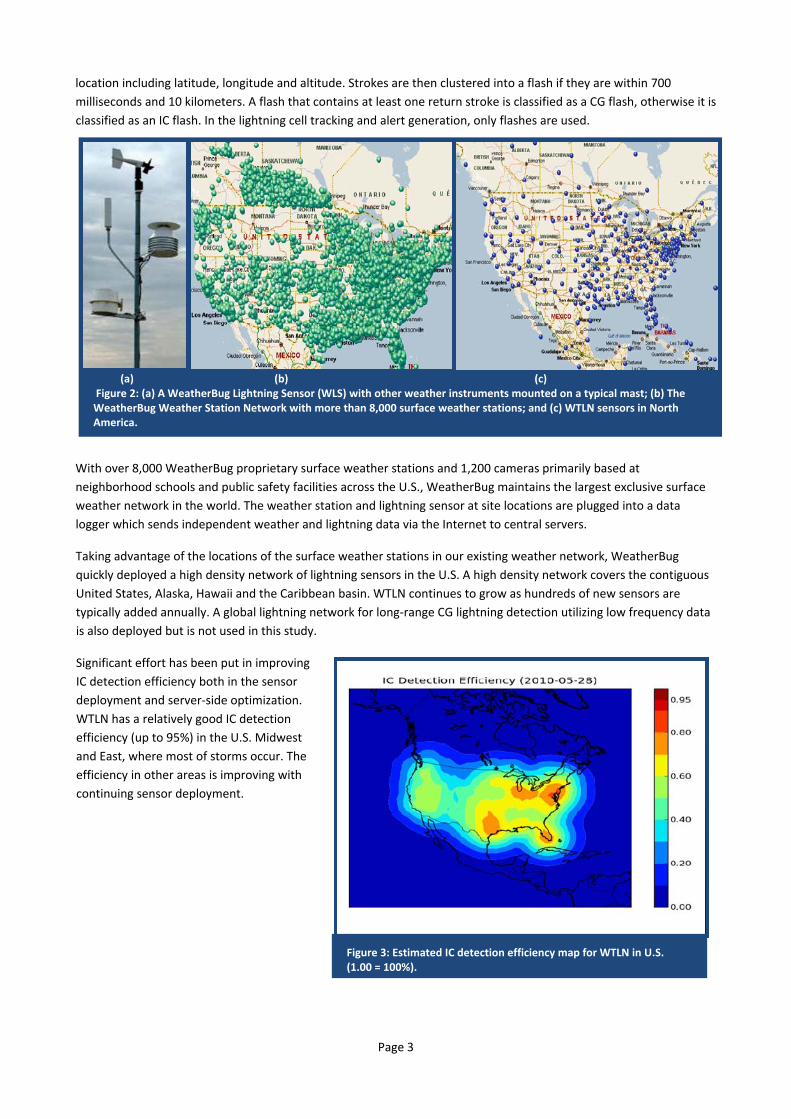
(a) (b) (c) Figure 2: (a) A WeatherBug Lightning Sensor (WLS) with other weather instruments mounted on a typical mast; (b) The WeatherBug Weather Station Network with more than 8,000 surface weather stations; and (c) WTLN sensors in North America.
With over 8,000 WeatherBug proprietary surface weather stations and 1,200 cameras primarily based at neighborhood schools and public safety facilities across the U.S., WeatherBug maintains the largest exclusive surface weather network in the world. The weather station and lightning sensor at site locations are plugged into a data logger which sends independent weather and lightning data via the Internet to central servers.
Taking advantage of the locations of the surface weather stations in our existing weather network, WeatherBug quickly deployed a high density network of lightning sensors in the U.S. A high density network covers the contiguous United States, Alaska, Hawaii and the Caribbean basin. WTLN continues to grow as hundreds of new sensors are typically added annually. A global lightning network for long‐range CG lightning detection utilizing low frequency data is also deployed but is not used in this study.
Significant effort has been put in improving IC detection efficiency both in the sensor deployment and server‐side optimization. WTLN has a relatively good IC detection efficiency (up to 95%) in the U.S. Midwest and East, where most of storms occur. The efficiency in other areas is improving with continuing sensor deployment.
Figure 3: Estimated IC detection efficiency map for WTLN in U.S. (1.00 = 100%).
Page 3
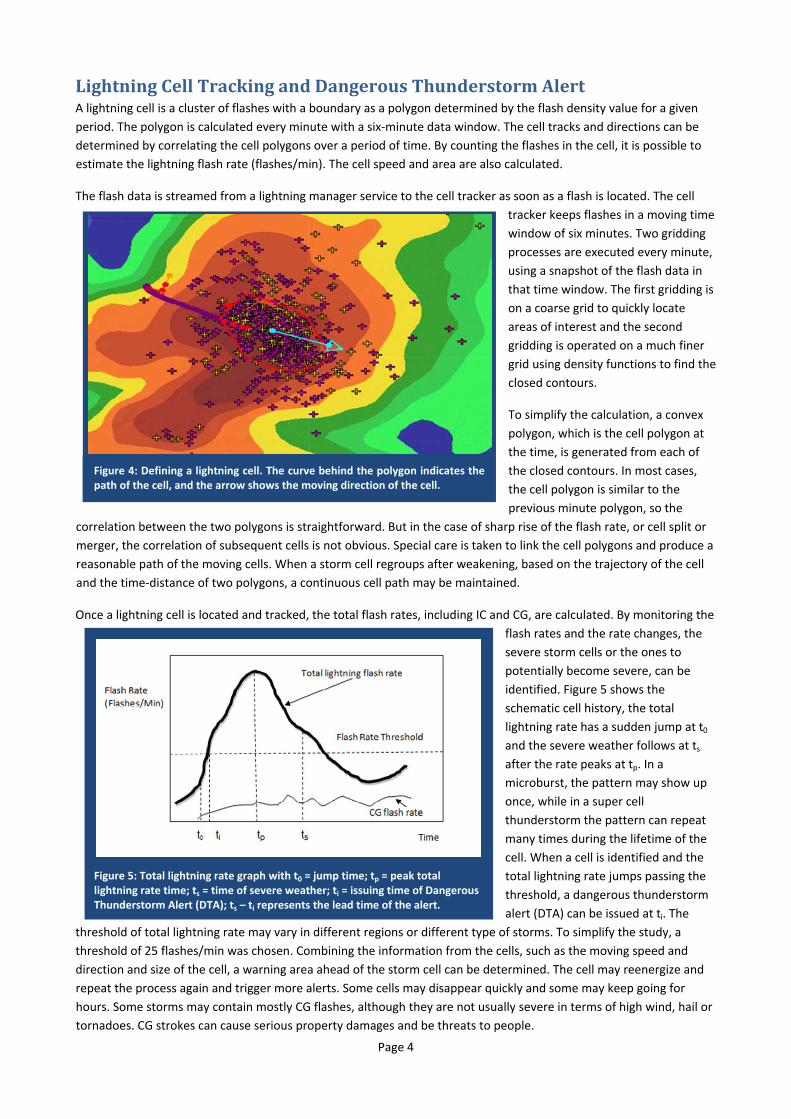
Lightning Cell Tracking and Dangerous Thunderstorm Alert A lightning cell is a cluster of flashes with a boundary as a polygon determined by the flash density value for a given period. The polygon is calculated every minute with a six‐minute data window. The cell tracks and directions can be determined by correlating the cell polygons over a period of time. By counting the flashes in the cell, it is possible to estimate the lightning flash rate (flashes/min). The cell speed and area are also calculated.
Page 4
Figure 4: Defining a lightning cell. The curve behind the polygon indicates the path of the cell, and the arrow shows the moving direction of the cell.
The flash data is streamed from a lightning manager service to the cell tracker as soon as a flash is located. The cell tracker keeps flashes in a moving time window of six minutes. Two gridding processes are executed every minute, using a snapshot of the flash data in that time window. The first gridding is on a coarse grid to quickly locate areas of interest and the second gridding is operated on a much finer grid using density functions to find the closed contours.
To simplify the calculation, a convex polygon, which is the cell polygon at the time, is generated from each of the closed contours. In most cases, the cell polygon is similar to the previous minute polygon, so the
correlation between the two polygons is straightforward. But in the case of sharp rise of the flash rate, or cell split or merger, the correlation of subsequent cells is not obvious. Special care is taken to link the cell polygons and produce a reasonable path of the moving cells. When a storm cell regroups after weakening, based on the trajectory of the cell and the time‐distance of two polygons, a continuous cell path may be maintained.
Figure 5: Total lightning rate graph with t0 = jump time; tp = peak total lightning rate time; ts = time of severe weather; ti = issuing time of Dangerous Thunderstorm Alert (DTA); ts – ti represents the lead time of the alert.
Once a lightning cell is located and tracked, the total flash rates, including IC and CG, are calculated. By monitoring the flash rates and the rate changes, the severe storm cells or the ones to potentially become severe, can be identified. Figure 5 shows the schematic cell history, the total lightning rate has a sudden jump at t0 and the severe weather follows at ts after the rate peaks at tp. In a microburst, the pattern may show up once, while in a super cell thunderstorm the pattern can repeat many times during the lifetime of the cell. When a cell is identified and the total lightning rate jumps passing the threshold, a dangerous thunderstorm alert (DTA) can be issued at ti. The
threshold of total lightning rate may vary in different regions or different type of storms. To simplify the study, a threshold of 25 flashes/min was chosen. Combining the information from the cells, such as the moving speed and direction and size of the cell, a warning area ahead of the storm cell can be determined. The cell may reenergize and repeat the process again and trigger more alerts. Some cells may disappear quickly and some may keep going for hours. Some storms may contain mostly CG flashes, although they are not usually severe in terms of high wind, hail or tornadoes. CG strokes can cause serious property damages and be threats to people.
The alert polygon covers the distance that a cell will travel in 45 minutes with the speed demonstrated at the moment when the alert is generated. The alert polygon is updated every 15 minutes to reflect the updated path of the cell. The density of our 8,000 station surface weather network is sufficient to provide wind gust and rain rate data in real‐time along the storm cell path; the real‐time weather data provides additional information for the dangerous thunderstorm alerts.
be conducted in this area.
One concern in previous studies (Darden et al. 2010) is the issue when artificial trends in lightning data are strictly related to efficiency or range issues. For such reason, flash data instead of stroke data are used in the cell tracking; the latter may be affected more by the detection efficiency. The thresholds can be adjusted when the detection efficiency becomes known for different regions. Further study will
be. Figure 6: An alert polygon can be created for the area 45 minutes ahead of the moving cell.
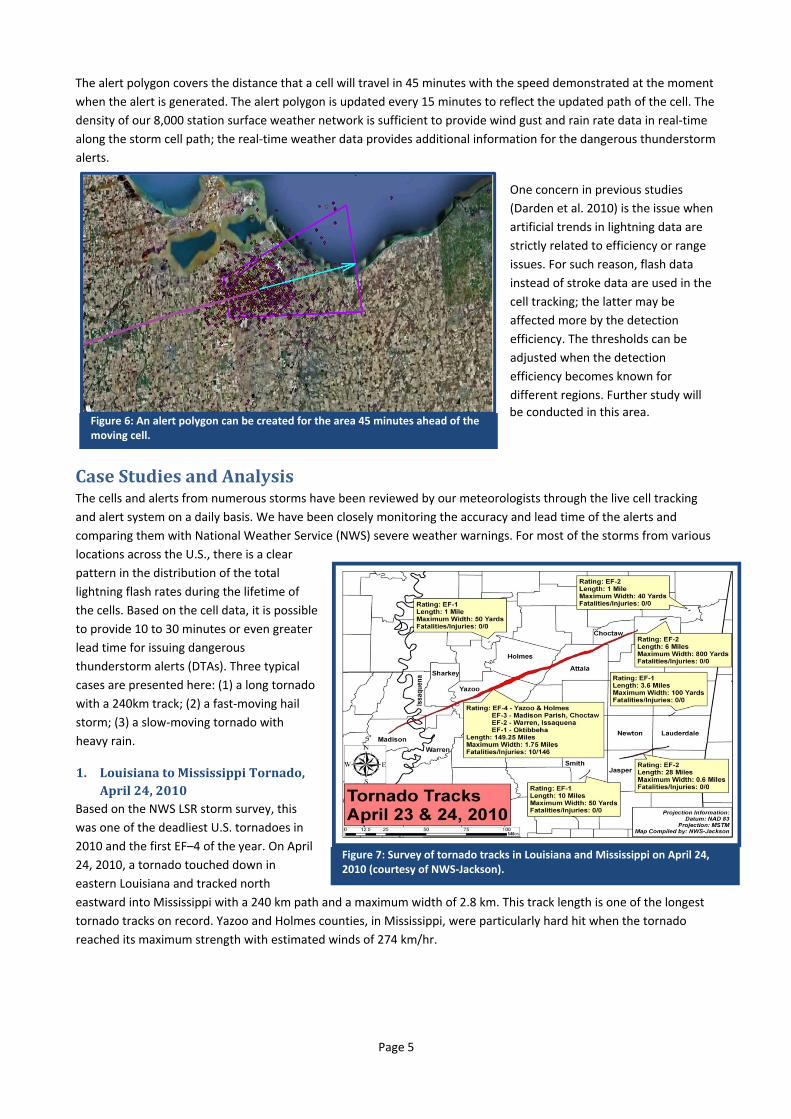
Case Studies and Analysis The cells and alerts from numerous storms have been reviewed by our meteorologists through the live cell tracking and alert system on a daily basis. We have been closely monitoring the accuracy and lead time of the alerts and comparing them with National Weather Service (NWS) severe weather warnings. For most of the storms from various locations across the U.S., there is a clear pattern in the distribution of the total lightning flash rates during the lifetime of the cells. Based on the cell data, it is possible to provide 10 to 30 minutes or even greater lead time for issuing dangerous thunderstorm alerts (DTAs). Three typical cases are presented here: (1) a long tornado with a 240km track; (2) a fast‐moving hail storm; (3) a slow‐moving tornado with heavy rain.
1. Louisiana to Mississippi Tornado, April 24, 2010
Figure 7: Survey of tornado tracks in Louisiana and Mississippi on April 24, 2010 (courtesy of NWS‐Jackson).
Based on the NWS LSR storm survey, this was one of the deadliest U.S. tornadoes in 2010 and the first EF–4 of the year. On April 24, 2010, a tornado touched down in eastern Louisiana and tracked north eastward into Mississippi with a 240 km path and a maximum width of 2.8 km. This track length is one of the longest tornado tracks on record. Yazoo and Holmes counties, in Mississippi, were particularly hard hit when the tornado reached its maximum strength with estimated winds of 274 km/hr.
Page 5
Fig
Figure covered
gure 8:
Figure 8:Purple d
Figure 9
Figure(s)area cove
Figure 9
9: (a) Lightnind by the lightni
: Lightning flashots represent I
(a)
9: (a) Lightningered by the ligh
9 (b)
ng cell tracks ing cells.
hes detected bIC flashes and y
g cell tracks dehtning cells.
detected from
y WTLN (April yellow dots rep
etected from W
Page 6
m WTLN for th
24, 2010 1600 present CG flas
WTLN for the tor
he tornado (b)
UTC – 1840 UThes.
rnado and (b)
tornad
area
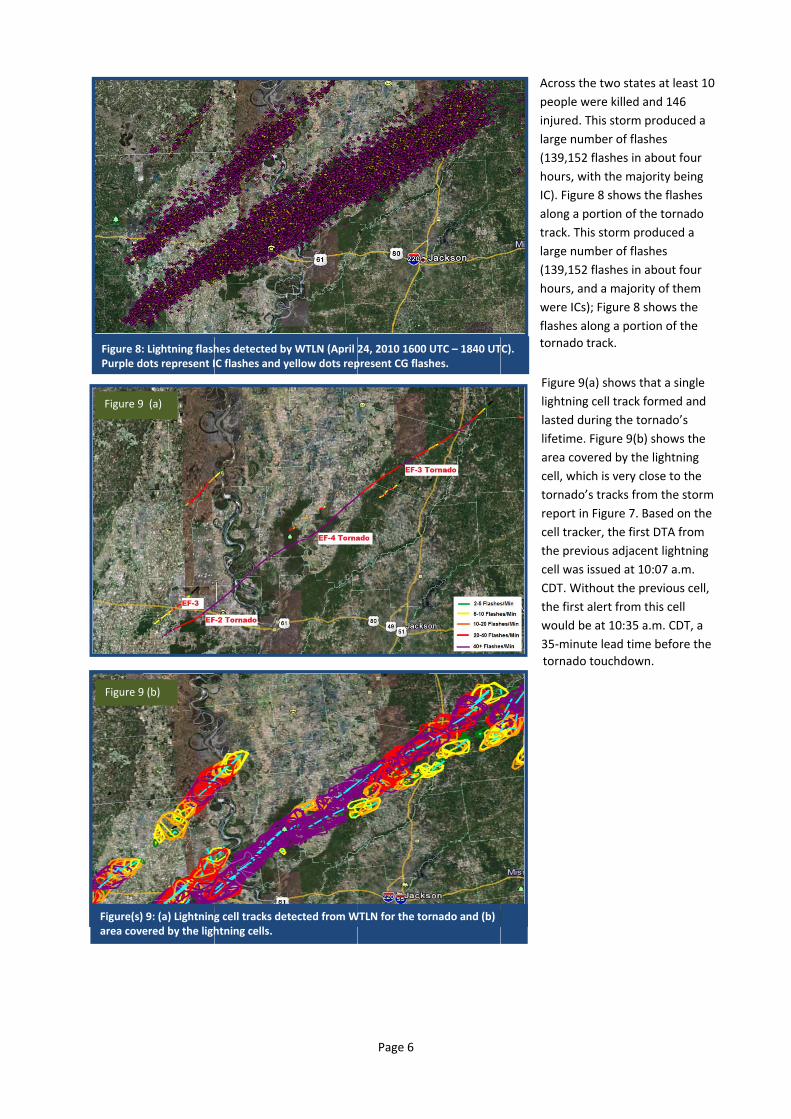
Acrosspeopleinjurelarge n(139,1hours,IC). Figalong track. large n(139,1hours,were Iflashe
Figurelightnlastedlifetimarea ccell, wtornadreportcell trthe prcell wCDT. Wthe firwould35‐mitorna
TC). do track.
s the two state were killed ad. This storm number of fla152 flashes in , with the majgure 8 shows a portion of tThis storm prnumber of fla152 flashes in , and a majoriICs); Figure 8 s along a port
e 9(a) shows ting cell track fd during the tome. Figure 9(bcovered by thewhich is very cdo’s tracks frot in Figure 7. Backer, the firsrevious adjaceas issued at 1Without the prst alert from d be at 10:35 anute lead timdo touchdowwn.
es at least 10 and 146 produced a shes about four jority being the flashes he tornado roduced a shes about four ity of them shows the tion of the
hat a single formed and ornado’s ) shows the e lightning close to the om the storm Based on the st DTA from ent lightning 10:07 a.m. previous cell, this cell a.m. CDT, a
me before the
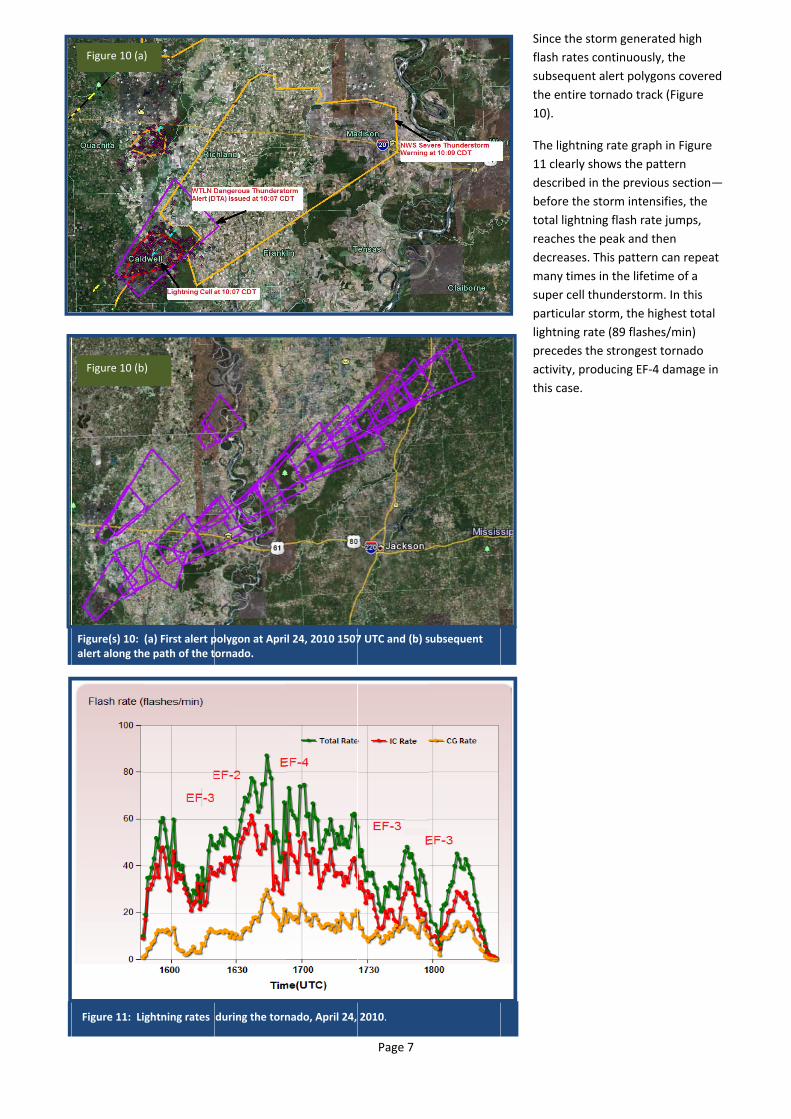
Since thflash rasubsequthe ent10).
he storm genetes continuouuent alert polire tornado tr
erated high usly, the ygons covererack (Figure
Figure 10 (a)
10Figure 10: along the path
(b)
Figure(s) 10: alert along th
Figure 11: Li
Figure 10 (b
(a) First alert ph of the tornad
(a) First alert phe path of the t
ightning rates
b)
polygon at Aprido.
polygon at Apritornado.
during the torn
il 24, 2010 1507
il 24, 2010 1507
nado, April 24,
Page 7
7 UTC and (b) s
7 UTC and (b) s
2010.
subsequent ale
subsequent
The ligh11 cleadescribbefore total ligreachesdecreasmany tisuper cparticulightninprecedeactivitythis cas
ert
d
htning rate grarly shows the ed in the prevthe storm integhtning flash rs the peak andses. This patteimes in the lifell thunderstolar storm, theng rate (89 flases the stronge, producing EFse.
aph in Figure pattern vious section—ensifies, the rate jumps, d then ern can repeatetime of a orm. In this e highest totalshes/min) est tornado F‐4 damage in
—
t
n
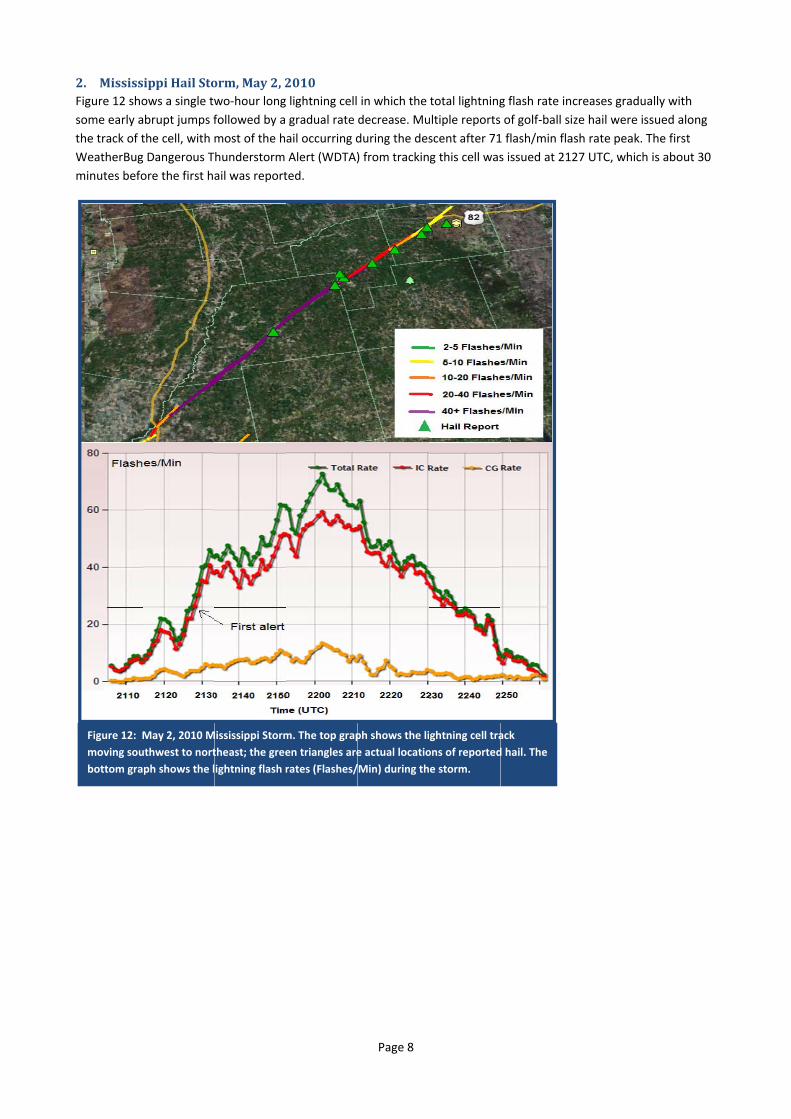
2. Mississippi Hail Stoorm, May 2, 22010 Figure 12 shosome early athe track of tWeatherBugminutes befo
FiguFigure 12: Mmoving soubottom gra
ows a single twabrupt jumps fthe cell, with g Dangerous Tore the first ha
wo‐hour longfollowed by a most of the hhunderstorm ail was report
lightning cellgradual rate ail occurring dAlert (WDTA)ted.
in which the decrease. Muduring the des) from trackin
total lightningultiple reportsscent after 71g this cell was
g flash rate in of golf‐ball si1 flash/min flas issued at 21
creases graduize hail were iash rate peak. 27 UTC, which
ually with ssued along The first h is about 30
May 2, 2010 Muthwest to nortph shows the l
Mississippi Stormtheast; the greeightning flash r
m. The top grapen triangles arerates (Flashes/
Page 8
ph shows the lie actual locatio/Min) during th
ightning cell traons of reportede storm.
ack d hail. The
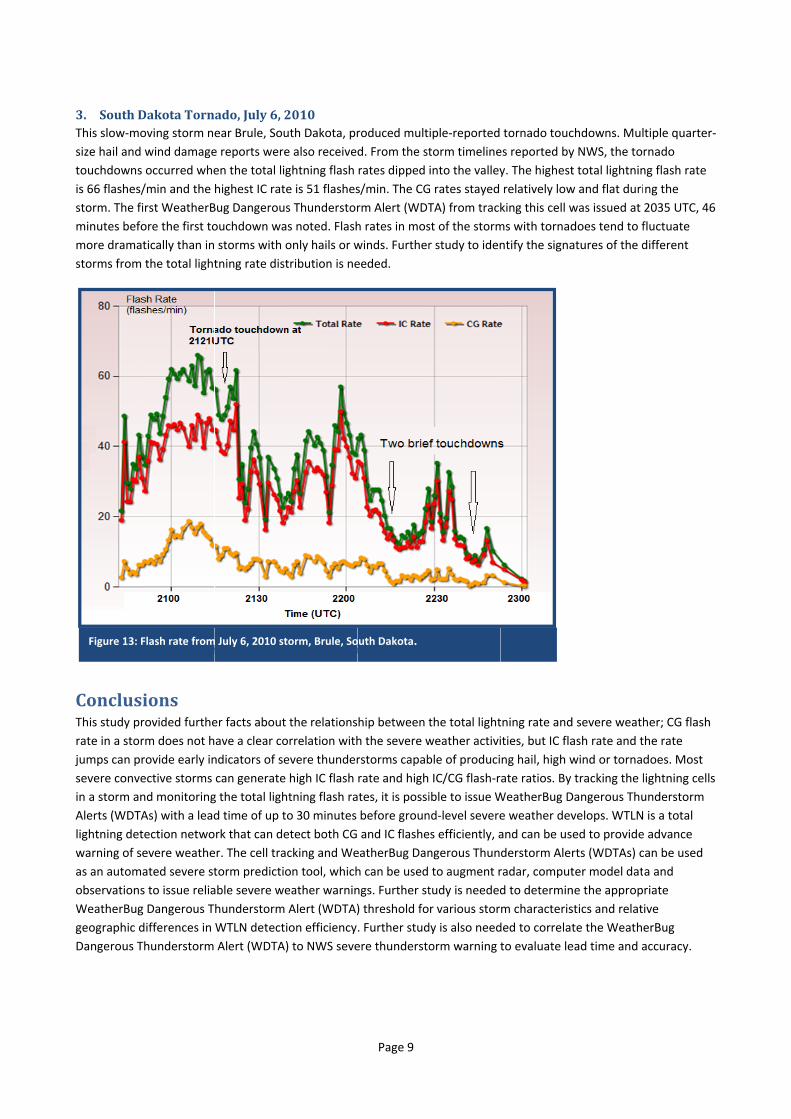
3. South DDakota Tornado, July 6, 22010 This slow‐mosize hail and touchdowns is 66 flashes/storm. The fiminutes befomore dramatstorms from
Figure 11: F
ConclusiThis study prrate in a storjumps can prsevere convein a storm anAlerts (WDTAlightning detwarning of seas an automaobservationsWeatherBuggeographic dDangerous T
Figure 13: F
oving storm nwind damageoccurred whe/min and the irst WeatherBore the first totically than inthe total light
Flash rate from
ions rovided furtherm does not hrovide early inective storms nd monitoringAs) with a leadtection netwoevere weatheated severe sts to issue reliag Dangerous Tdifferences in Thunderstorm
Flash rate from
ear Brule, Soue reports wereen the total lighighest IC ratBug Dangerousouchdown wa storms with otning rate dist
m July 6, 2010 st
er facts aboutave a clear condicators of secan generate g the total lighd time of up tork that can deer. The cell tratorm predictioable severe wehunderstorm WTLN detectAlert (WDTA)
m July 6, 2010 st
uth Dakota, pre also receiveghtning flash e is 51 flashess Thunderstoras noted. Flashonly hails or wtribution is ne
roduced multd. From the strates dipped s/min. The CGrm Alert (WDTh rates in moswinds. Furthereeded.
iple‐reported torm timelineinto the valleyG rates stayed TA) from trackst of the stormr study to iden
tornado touces reported byy. The highestrelatively lowking this cell wms with tornadntify the signa
chdowns. Muly NWS, the tot total lightninw and flat duriwas issued at does tend to fatures of the d
tiple quarter‐rnado ng flash rate ng the 2035 UTC, 46fluctuate different
‐
6
torm, Brule, So
the relationsorrelation withevere thunderhigh IC flash
htning flash rao 30 minutes etect both CGcking and Weon tool, whicheather warninAlert (WDTA)ion efficiency) to NWS seve
torm, Brule, So
Page 9
outh Dakota.
hip between th the severe wrstorms capabrate and highates, it is possibefore groun and IC flasheeatherBug Danh can be used ngs. Further st) threshold fo. Further studere thundersto
outh Dakota.
the total lightweather activible of produci IC/CG flash‐rible to issue Wnd‐level severees efficiently, angerous Thunto augment rtudy is neededr various stordy is also needorm warning t
tning rate andities, but IC flang hail, high wate ratios. By WeatherBug De weather devand can be usderstorm Alerradar, computd to determinm characterisded to correlatto evaluate le
d severe weathash rate and twind or tornadtracking the l
Dangerous Thuvelops. WTLNed to providerts (WDTAs) cter model datne the appropstics and relatte the Weathead time and a
her; CG flash the rate does. Most lightning cellsunderstorm is a total e advance can be used a and riate ive erBug accuracy.
Page 10
Acknowledgements The authors would like to thank members of the AWS/WeatherBug management team, Robert S. Marshall and Christopher D. Sloop, for initiating the lightning cell tracking project and providing key inputs. We would also like to thank additional members of the WeatherBug team, Benjamin Beroukhim, Mark Hoekzema, Steve Prinzivalli and James West for using the cell tracking system and providing valuable feedback.
References Betz, H. D., and Schmidt, K., Oettinger, W. P., and Montag, B., 2008: Cell‐tracking with lightning data from LINET. Adv. Geosci., 17: 55–61.
Darden, Christopher B., and Nadler, David J., Carcione, Brian C., Blakeslee, Richard J., Stano, Geoffrey T., and Buechler, Dennis E., 2010: Utilizing total lightning information to diagnose convective trends. Bulletin of the American Meteorological Society, 91: 167–175.
Lang, T. J., and Rutledge, S. A., 2002: Relationships between convective storm kinematics, precipitation, and lightning. Mon. Wea. Rev., 130: 2492–2506.
Lang, T. J., and Rutledge, S.A., Dye, J. E., Venticinque, M., Laroche, P., and Defer, E., 2000: Anomalously low negative cloud‐to‐ground lightning flash rates in intense convective storms observed during STERAO‐A. Mon. Wea. Rev., 128: 160–173.
Perez, A. H., and Wicker, Louis J., and Orville, Richard E., 1997: Characteristics of Cloud‐to‐Ground lightning associated with violent tornadoes. Weather and Forecasting, 12: 428–437.
Tuomi, T. J., and Larjavaara, M., 2005: Identification and analysis of lightning in thunderstorms. Meteorol. Soc., 131: 1191–1214.
Williams, E. R., 1989: The tripole structure of thunderstorms, J. Geophys. Res., 94(D11), 13: 151–13,167.
Williams, E. R., and Weber, M.E., and Orville, R.E., 1989: The relationship between lightning type and convective state of thunderclouds. J. Geophys. Res., 94(D11), 13213–13220.
Williams, E.R., and Boldi, B., Matlin, A., Weber M., Hodanish, S., Sharp, D., Goodman, S., Raghavan, R., and Buechler, D., 1999: The behavior of total lightning activity in severe Florida thunderstorms. Atmospheric Research, 51: 245–265.