Embed Size (px)
Citation preview
The Application of the Getis Statistic to High Resolution Imagery to
Detect Change in Tropical Corals
Ellsworth F. LeDrew, Alan Lim
Faculty of Environmental Studies
University of Waterloo
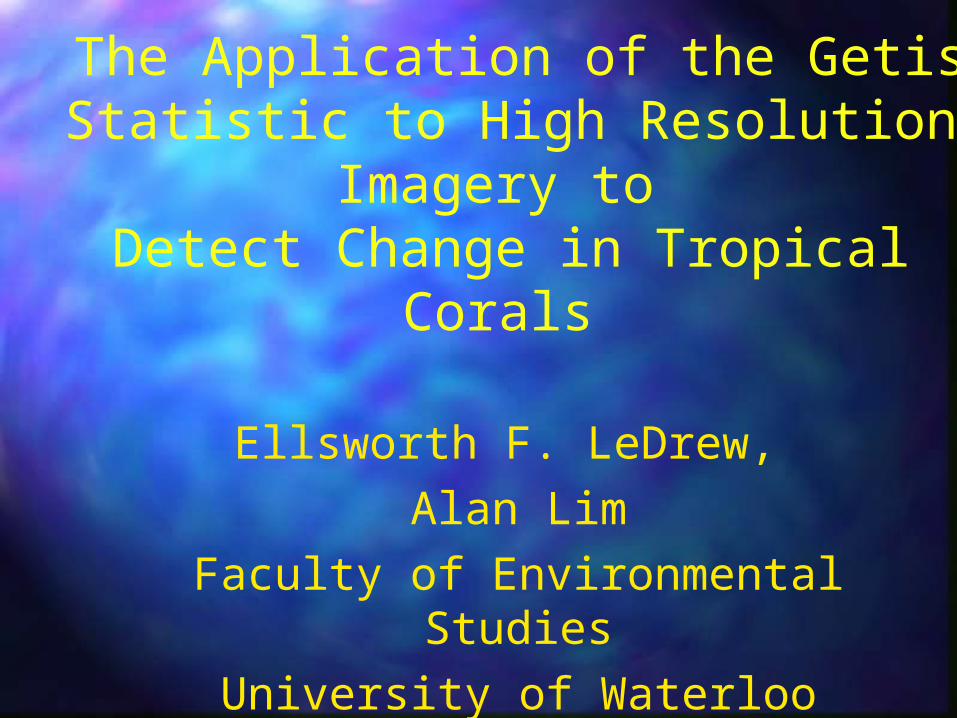
Healthy Coral and Sun Healthy Coral and Sun AnemonesAnemones
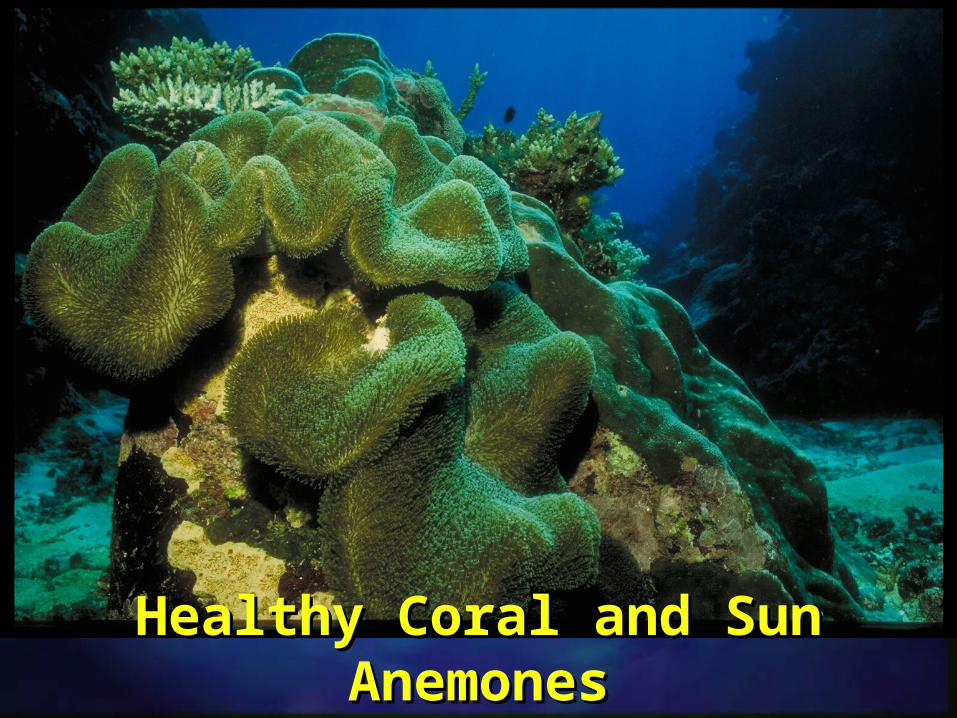
Coral Reefs = Rainforests of the Coral Reefs = Rainforests of the SeaSea
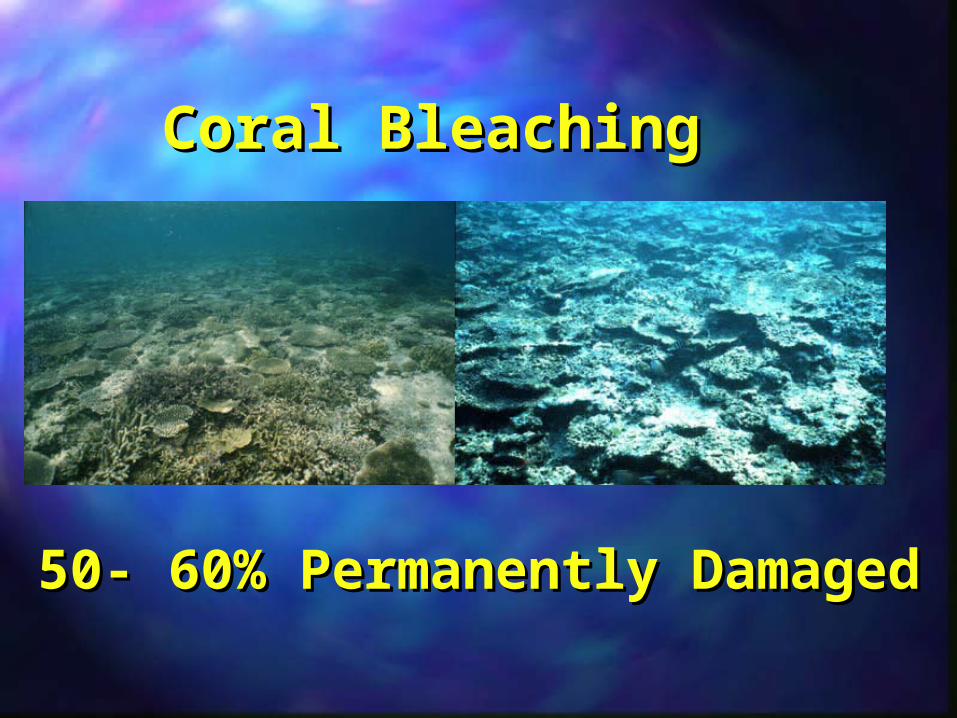
Coral BleachingCoral Bleaching
50- 60% Permanently 50- 60% Permanently DamagedDamaged
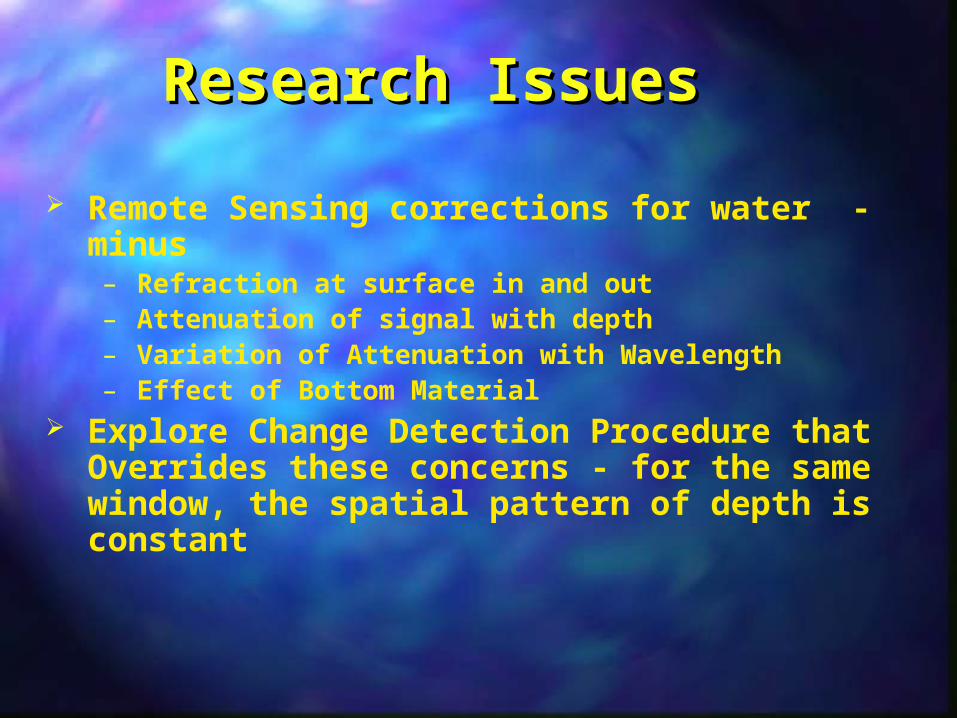
Research IssuesResearch Issues
Remote Sensing corrections for water - minus– Refraction at surface in and out– Attenuation of signal with depth– Variation of Attenuation with Wavelength– Effect of Bottom Material
Explore Change Detection Procedure that Overrides these concerns - for the same window, the spatial pattern of depth is constant
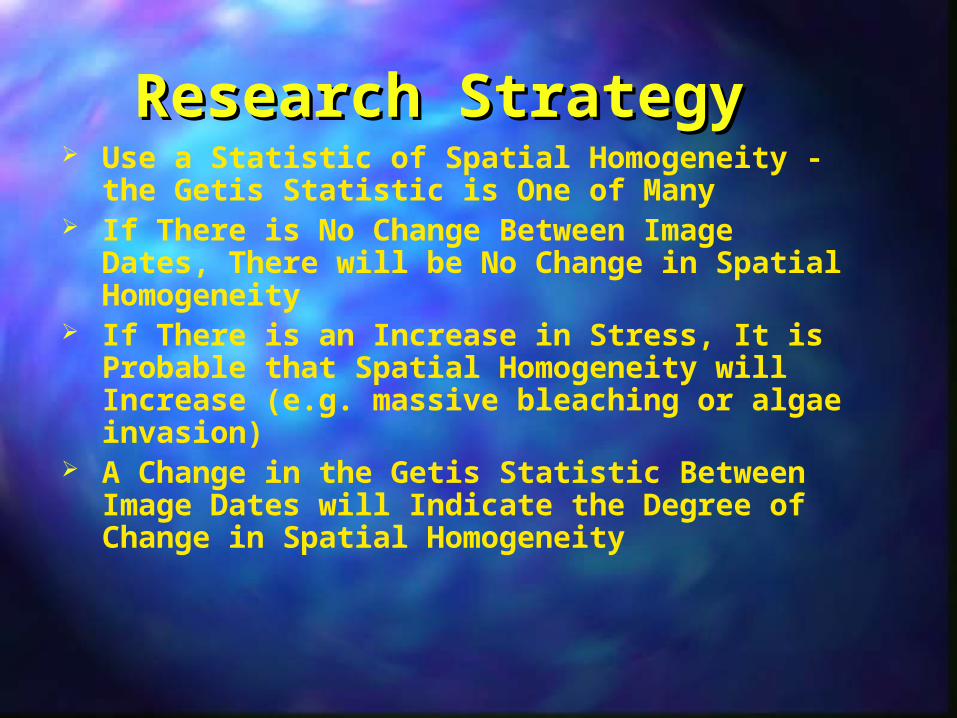
Research StrategyResearch Strategy Use a Statistic of Spatial Homogeneity -
the Getis Statistic is One of Many If There is No Change Between Image
Dates, There will be No Change in Spatial Homogeneity
If There is an Increase in Stress, It is Probable that Spatial Homogeneity will Increase (e.g. massive bleaching or algae invasion)
A Change in the Getis Statistic Between Image Dates will Indicate the Degree of Change in Spatial Homogeneity
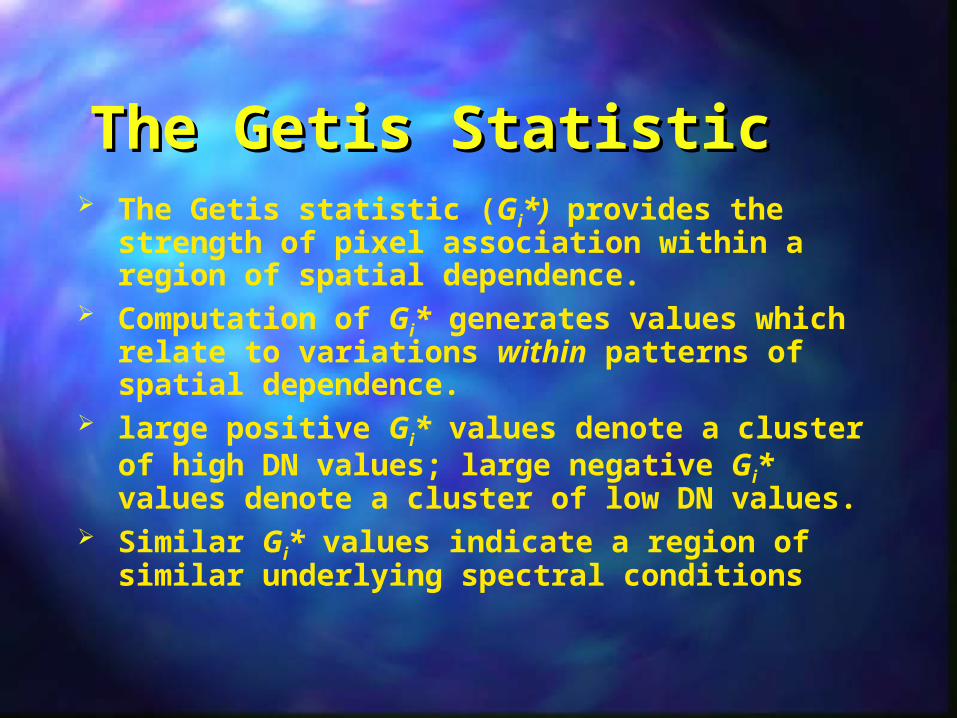
The Getis StatisticThe Getis Statistic The Getis statistic (Gi*) provides the
strength of pixel association within a region of spatial dependence.
Computation of Gi* generates values which relate to variations within patterns of spatial dependence.
large positive Gi* values denote a cluster of high DN values; large negative Gi* values denote a cluster of low DN values.
Similar Gi* values indicate a region of similar underlying spectral conditions
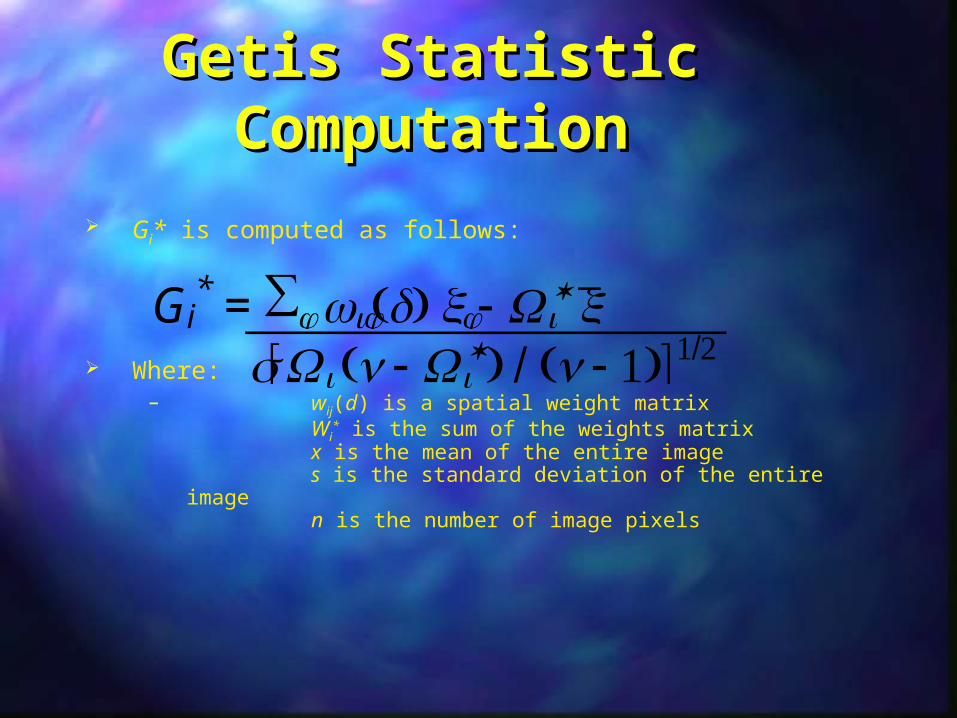
Getis Statistic Getis Statistic ComputationComputation
Gi* is computed as follows:
Where:– wij(d) is a spatial weight matrix
Wi* is the sum of the weights matrix
x is the mean of the entire images is the standard deviation of the entire imagen is the number of image pixels
Gi* = ∑j wij(d) xj - Wi
* xs[Wi (n - Wi
*) / (n - 1)]1/2
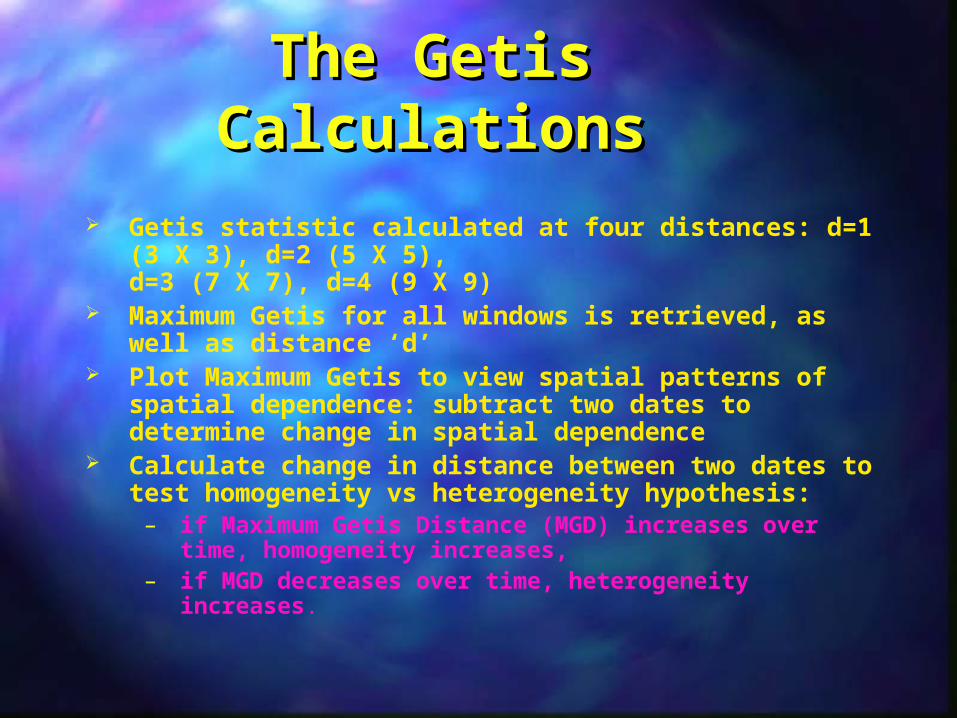
The Getis CalculationsThe Getis Calculations Getis statistic calculated at four distances: d=1
(3 X 3), d=2 (5 X 5), d=3 (7 X 7), d=4 (9 X 9)
Maximum Getis for all windows is retrieved, as well as distance ‘d’
Plot Maximum Getis to view spatial patterns of spatial dependence: subtract two dates to determine change in spatial dependence
Calculate change in distance between two dates to test homogeneity vs heterogeneity hypothesis:
– if Maximum Getis Distance (MGD) increases over time, homogeneity increases,
– if MGD decreases over time, heterogeneity increases.
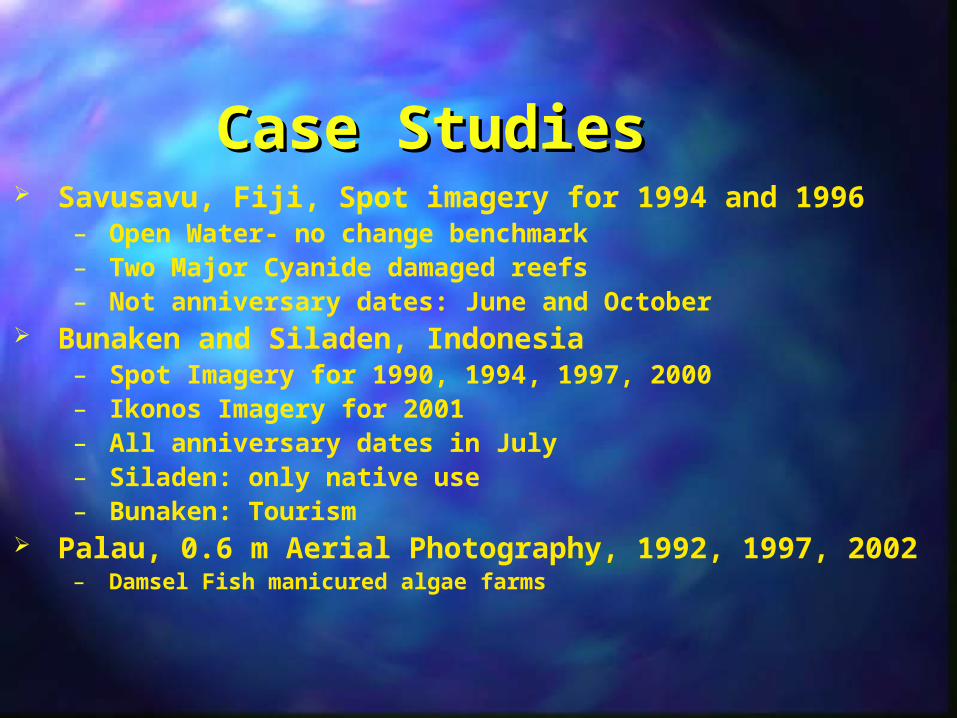
Case StudiesCase Studies Savusavu, Fiji, Spot imagery for 1994 and 1996
– Open Water- no change benchmark– Two Major Cyanide damaged reefs– Not anniversary dates: June and October
Bunaken and Siladen, Indonesia– Spot Imagery for 1990, 1994, 1997, 2000– Ikonos Imagery for 2001– All anniversary dates in July– Siladen: only native use– Bunaken: Tourism
Palau, 0.6 m Aerial Photography, 1992, 1997, 2002– Damsel Fish manicured algae farms
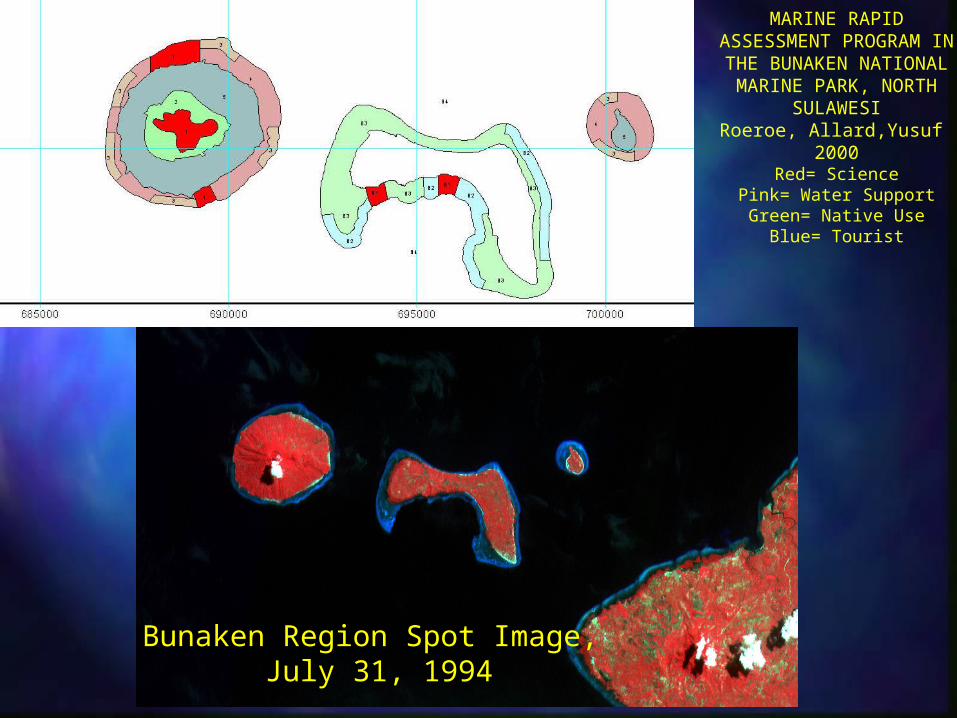
Bunaken Region Spot Image, July 31, 1994
MARINE RAPID ASSESSMENT PROGRAM
IN THE BUNAKEN NATIONAL
MARINE PARK, NORTH SULAWESI
Roeroe, Allard,Yusuf 2000
Red= SciencePink= Water SupportGreen= Native Use
Blue= Tourist
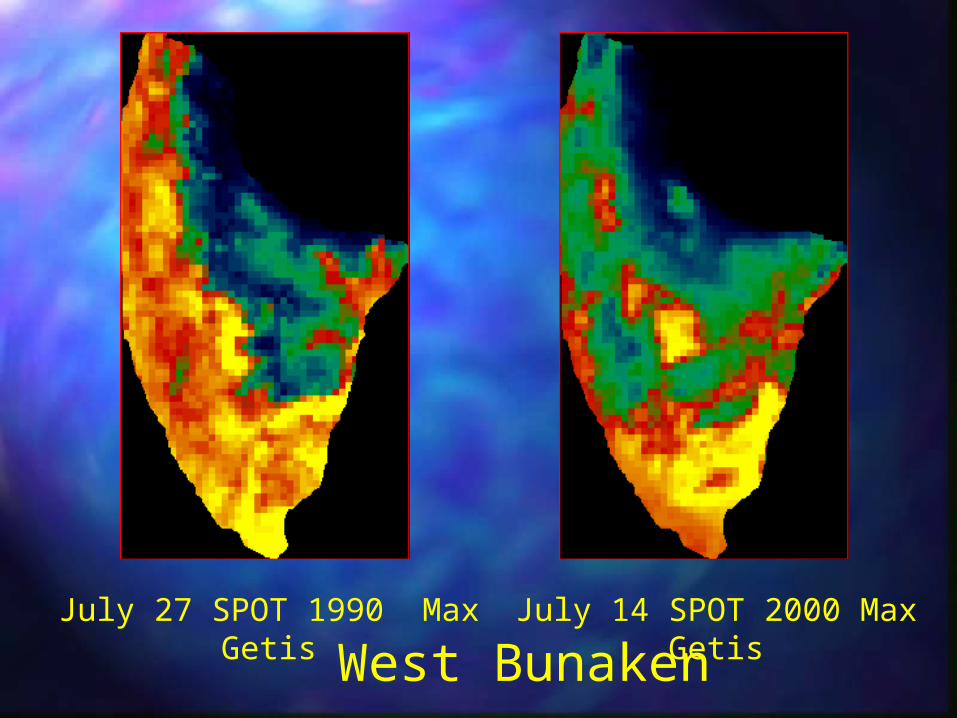
July 14 SPOT 2000 Max Getis
July 27 SPOT 1990 Max Getis
West Bunaken
-60 -10 40 90 140 190 2400
0.1
0.2
0.3
0.4
0.5
0.6
0.7
0.8
0.9
1
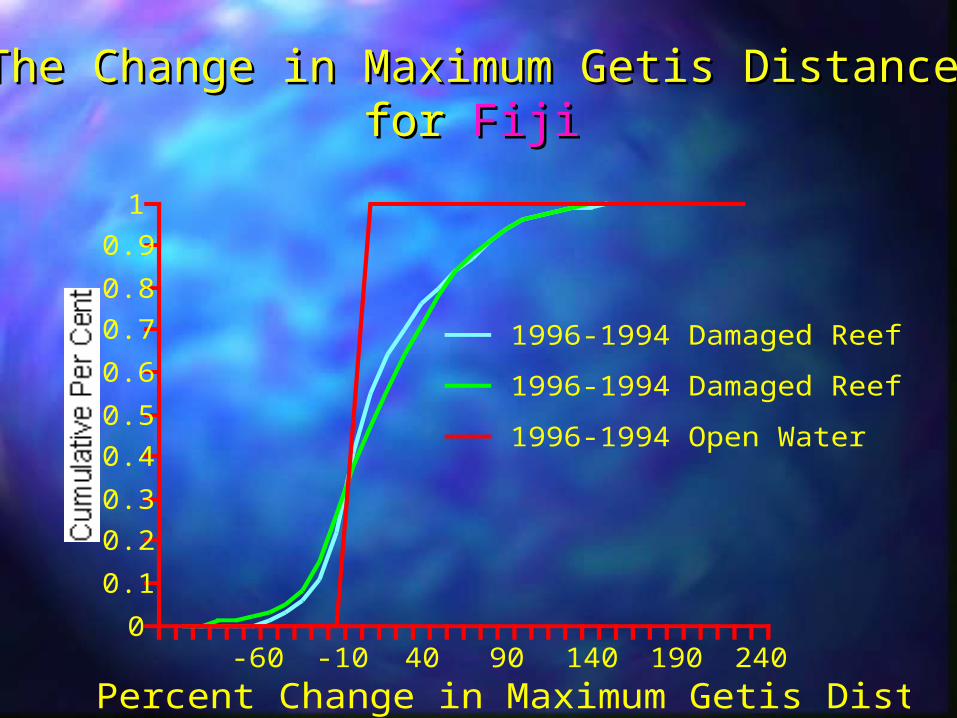
Percent Change in Maximum Getis Distance
1996-1994 Damaged Reef B
1996-1994 Damaged Reef A
1996-1994 Open Water
The Change in Maximum Getis Distance The Change in Maximum Getis Distance for for FijiFiji
-60 -10 40 90 140 190 2400
0.1
0.2
0.3
0.4
0.5
0.6
0.7
0.8
0.9
1
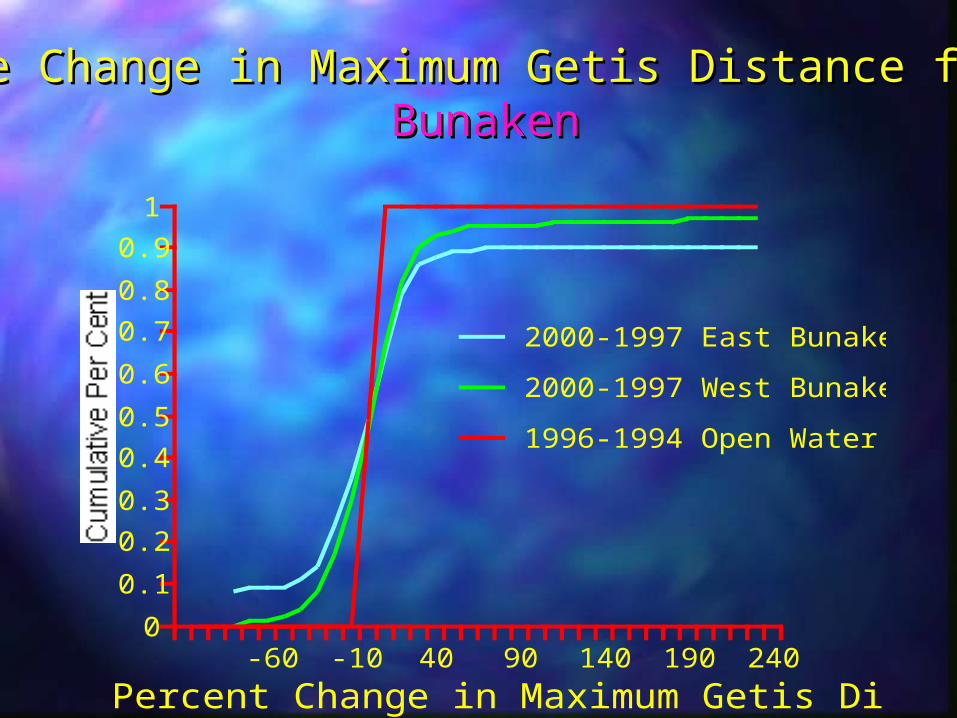
Percent Change in Maximum Getis Distance
2000-1997 East Bunaken
2000-1997 West Bunaken
1996-1994 Open Water
The Change in Maximum Getis Distance for The Change in Maximum Getis Distance for BunakenBunaken
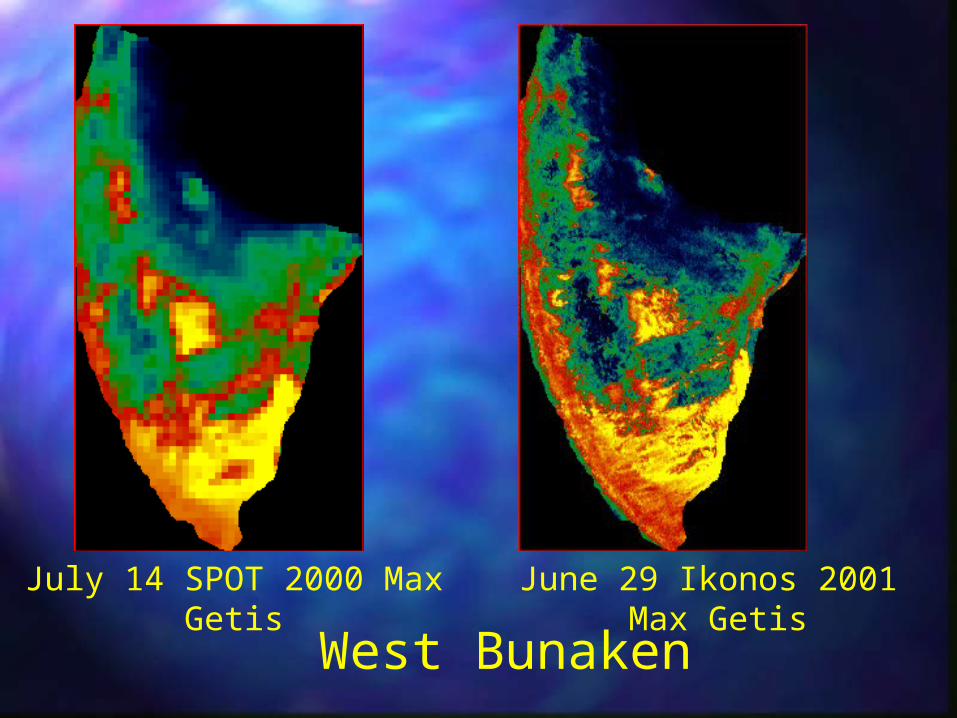
July 14 SPOT 2000 Max Getis
June 29 Ikonos 2001 Max Getis
West Bunaken
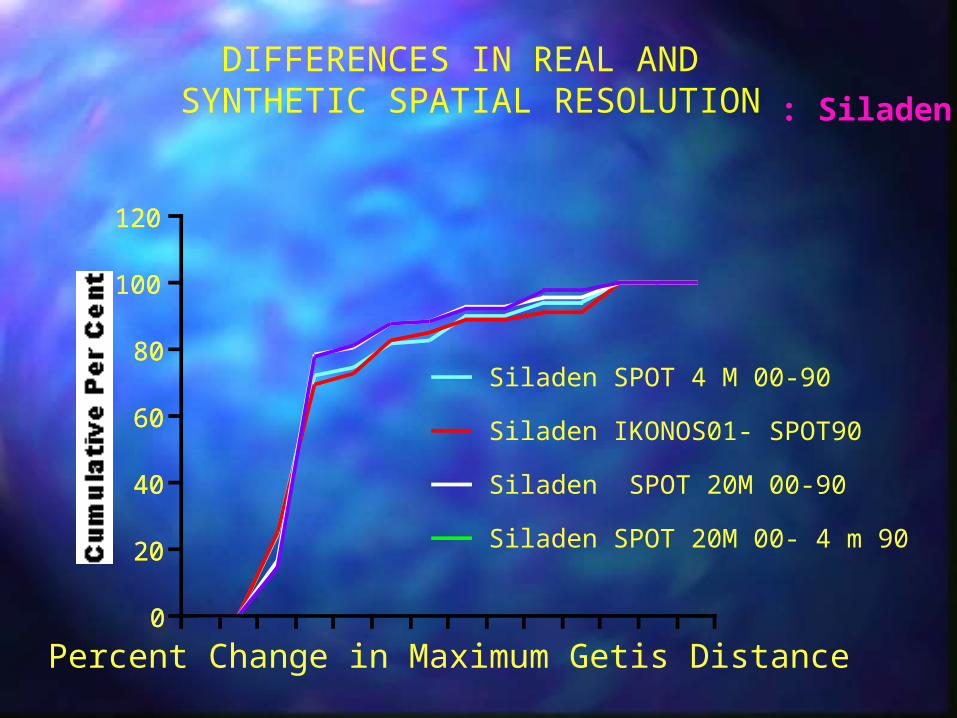
DIFFERENCES IN REAL AND SYNTHETIC SPATIAL RESOLUTION
0
20
40
60
80
100
120
0
20
40
60
80
100
120
Percent Change in Maximum Getis Distance
Siladen SPOT 4 M 00-90
Siladen IKONOS01- SPOT90
Siladen SPOT 20M 00-90
Siladen SPOT 20M 00- 4 m 90
: Siladen
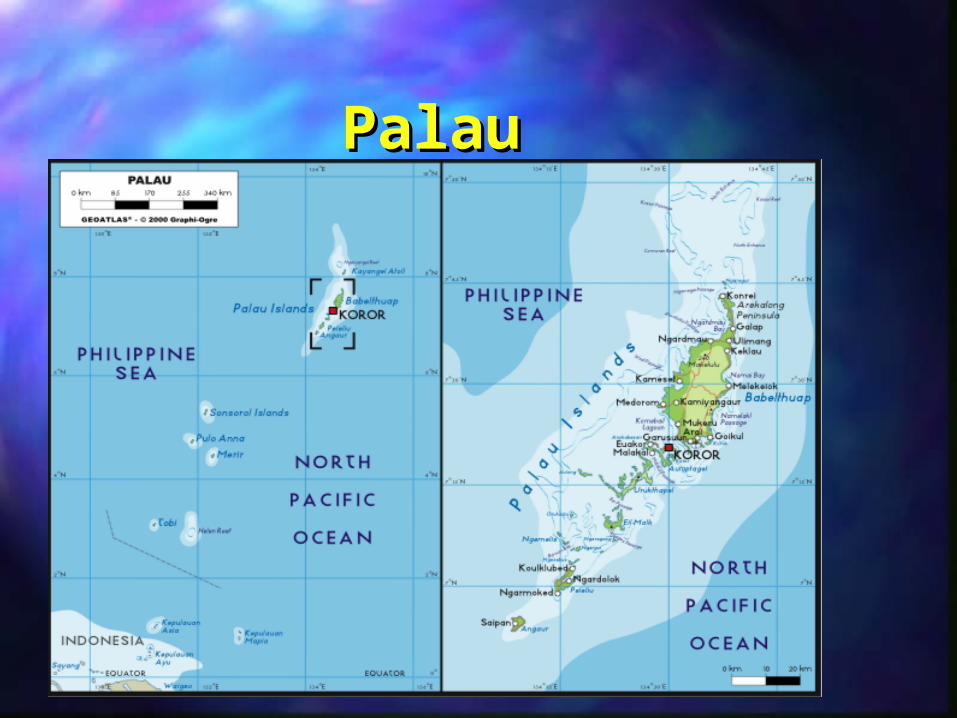
PalauPalau
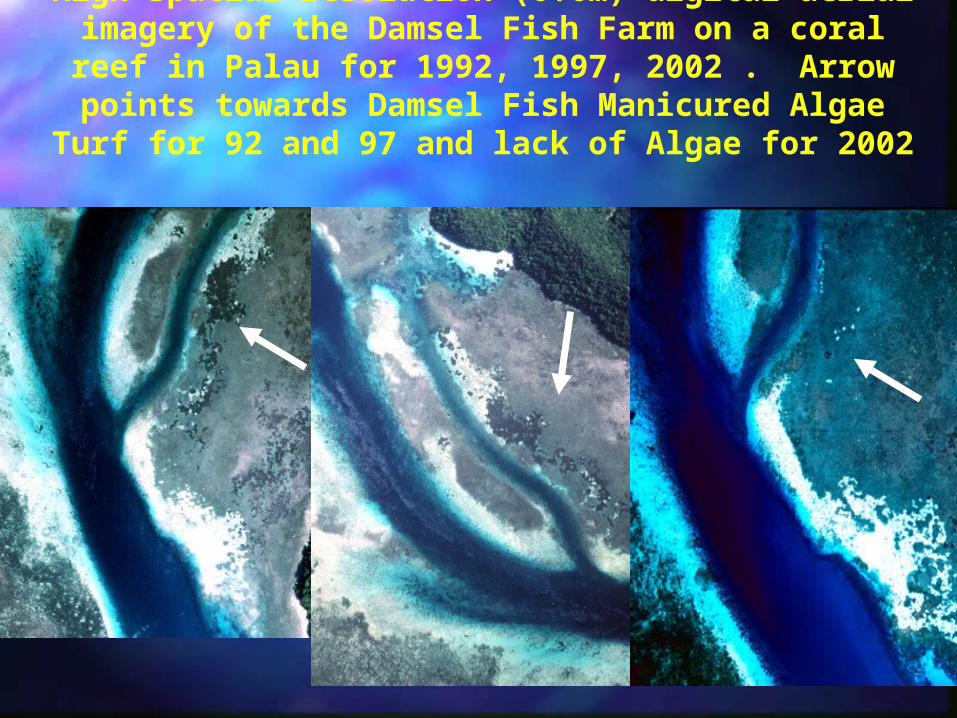
High spatial resolution (0.6m) digital aerial imagery of the Damsel Fish Farm on a coral reef in Palau for 1992, 1997,
2002 . Arrow points towards Damsel Fish Manicured Algae Turf for 92 and 97 and lack of Algae for 2002

-60 -10 40 90 140 190 2400
0.1
0.2
0.3
0.4
0.5
0.6
0.7
0.8
0.9
1
Percent Change in Maximum Getis Distance
1996-1994 Open Water
2003-1997 Palau Damsel Site
2003-1992 Palau Damsel Site
1997-1992 Palau Damsel Site
The Change in Maximum Getis Distance for The Change in Maximum Getis Distance for PalauPalau Damsel Fish Site Damsel Fish Site
1996-1994 Open Water
1996-1994 Damaged Reef
A
2000-1997 East Bunaken
2003-1997 Palau Damsel
Site
2003-1992 Palau Damsel
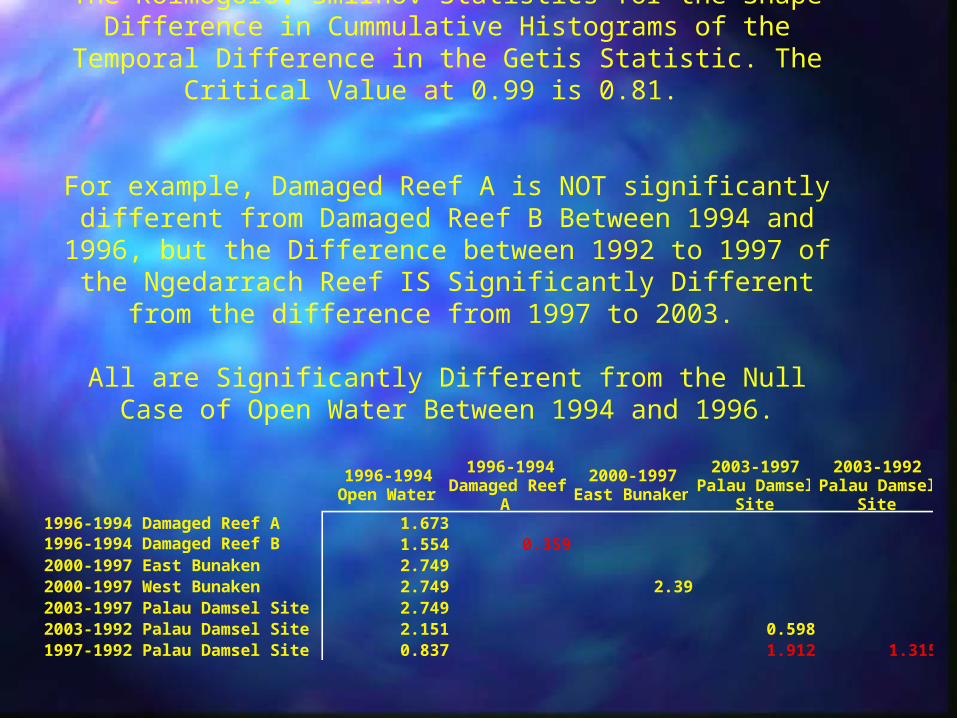
Site1996-1994 Damaged Reef A 1.6731996-1994 Damaged Reef B 1.554 0.3592000-1997 East Bunaken 2.7492000-1997 West Bunaken 2.749 2.392003-1997 Palau Damsel Site 2.7492003-1992 Palau Damsel Site 2.151 0.5981997-1992 Palau Damsel Site 0.837 1.912 1.315
The Kolmogorov-Smirnov Statistics for the Shape Difference in Cummulative Histograms of the Temporal Difference in the Getis
Statistic. The Critical Value at 0.99 is 0.81.
For example, Damaged Reef A is NOT significantly different from Damaged Reef B Between 1994 and 1996, but the Difference between 1992 to 1997 of the Ngedarrach Reef IS Significantly
Different from the difference from 1997 to 2003.
All are Significantly Different from the Null Case of Open Water Between 1994 and 1996.
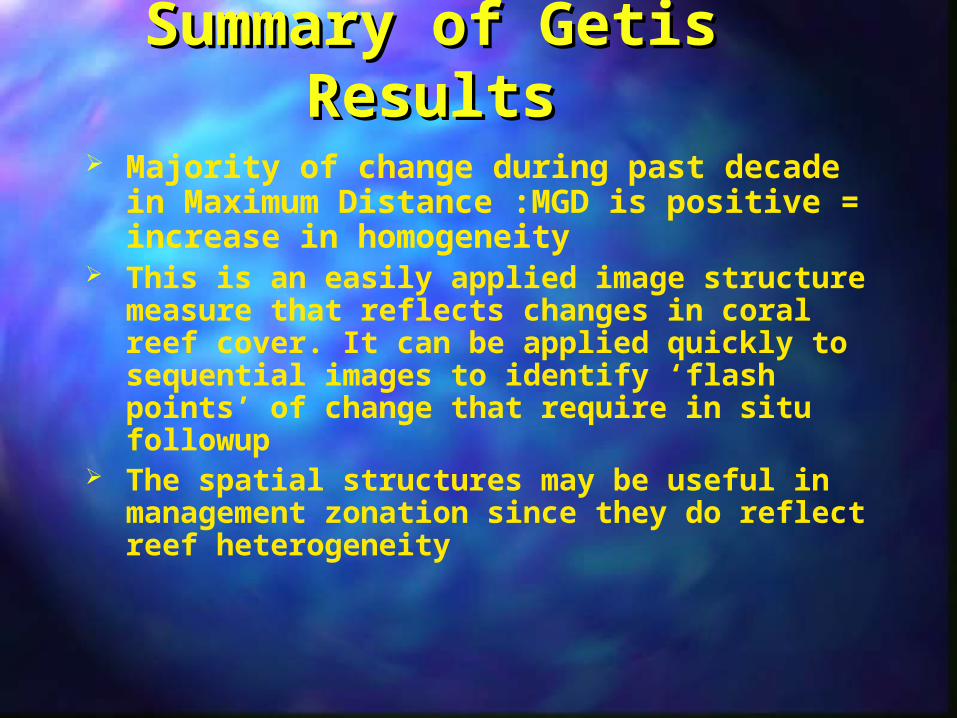
Summary of Getis Summary of Getis ResultsResults
Majority of change during past decade in Maximum Distance :MGD is positive = increase in homogeneity
This is an easily applied image structure measure that reflects changes in coral reef cover. It can be applied quickly to sequential images to identify ‘flash points’ of change that require in situ followup
The spatial structures may be useful in management zonation since they do reflect reef heterogeneity
Summary of Getis Summary of Getis ResultsResults
Ikonos data provides richer spatial detail than resampled SPOT, as expected, but aggregated statistics are consistent for the two image sets.
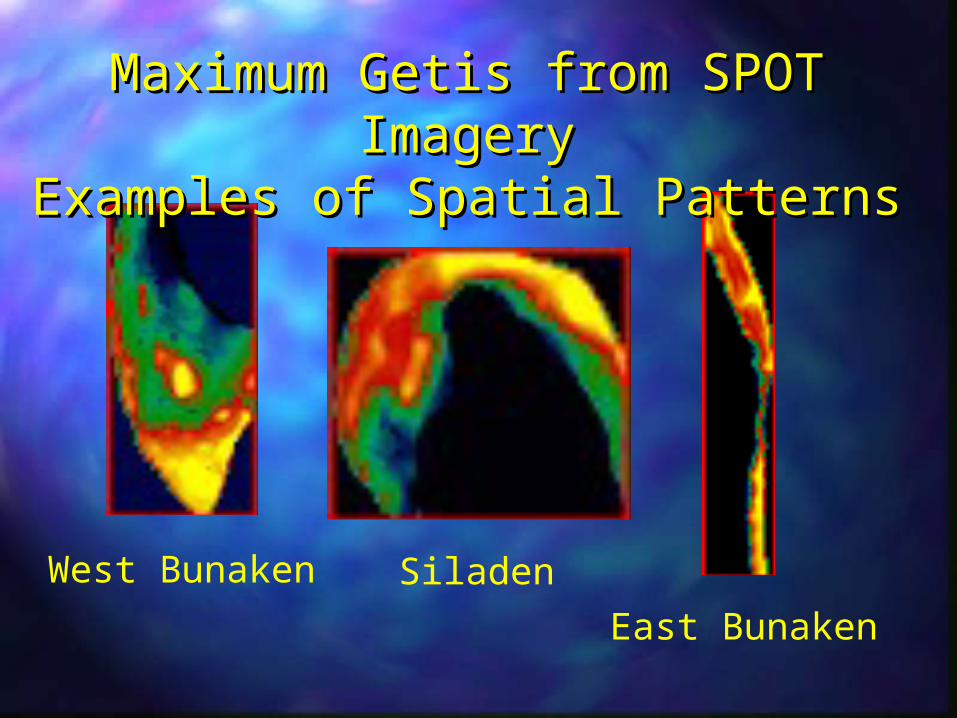
West Bunaken Siladen
East Bunaken
Maximum Getis from SPOT Maximum Getis from SPOT ImageryImagery
Examples of Spatial PatternsExamples of Spatial Patterns
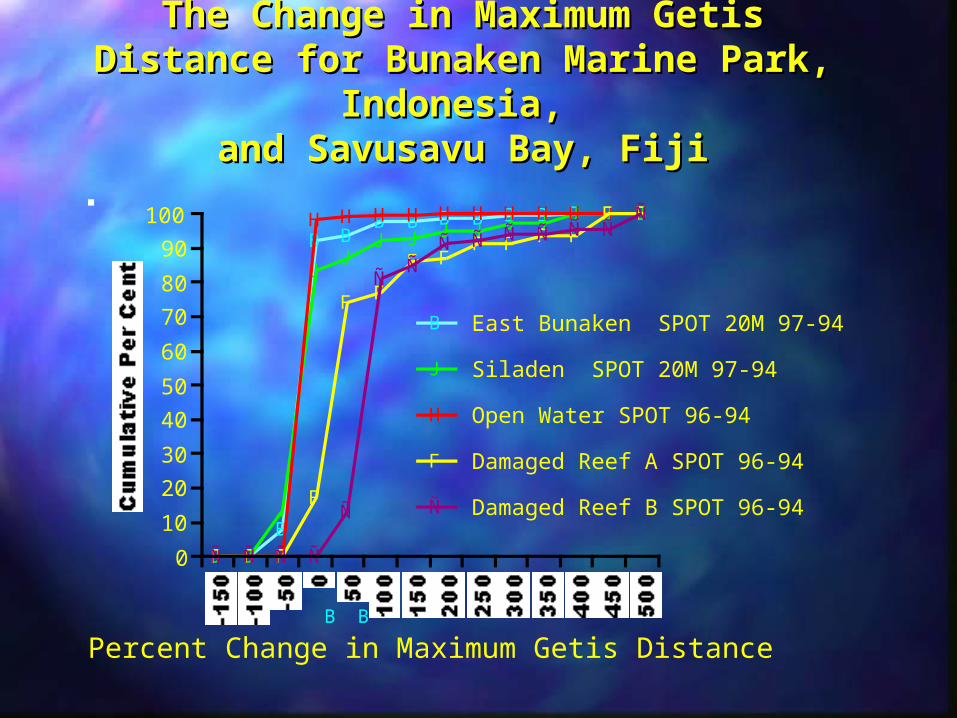
The Change in Maximum Getis The Change in Maximum Getis Distance for Bunaken Marine Park, Distance for Bunaken Marine Park,
Indonesia, Indonesia, and Savusavu Bay, Fijiand Savusavu Bay, FijiQuickTime™ and aGraphics decompressorare needed to see this picture.
B B
B
B BB B B B B B B B B
J J
J
JJ
J J J J J J J J J
H H H
H H H H H H H H H H H
F F F
F
F F
F FF F F F
F F
Ñ Ñ Ñ Ñ
Ñ
ÑÑ
Ñ Ñ Ñ Ñ Ñ ÑÑ
0
10
20
30
40
50
60
70
80
90
100
Percent Change in Maximum Getis Distance
B East Bunaken SPOT 20M 97-94
J Siladen SPOT 20M 97-94
H Open Water SPOT 96-94
F Damaged Reef A SPOT 96-94
Ñ Damaged Reef B SPOT 96-94
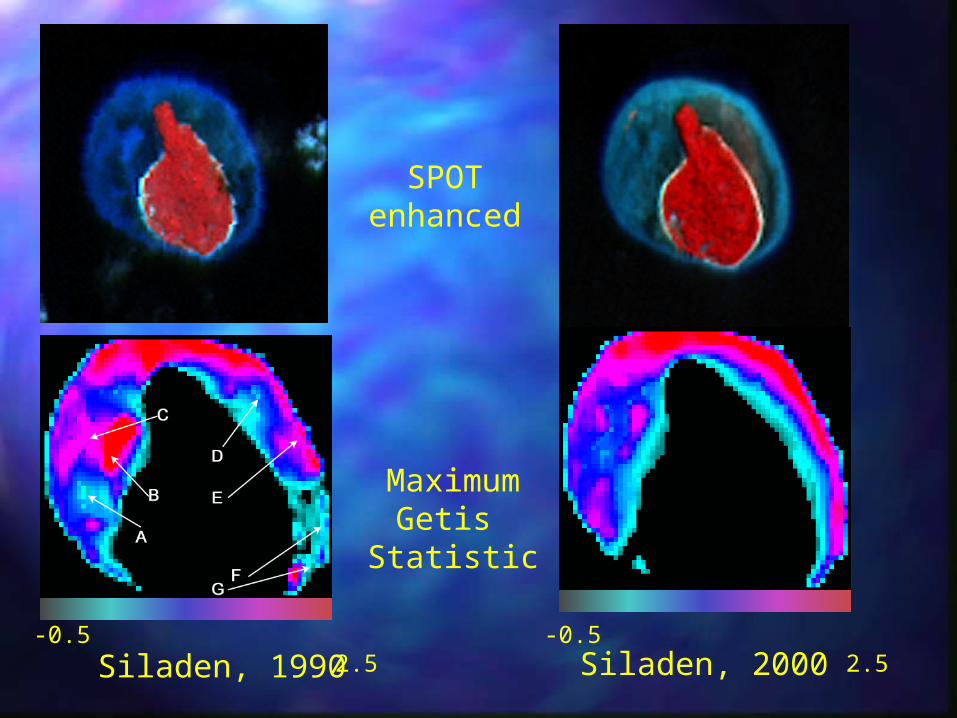
Siladen, 1990 Siladen, 2000
SPOTenhanced
MaximumGetis
Statistic
-0.5 2.5 -0.5 2.5
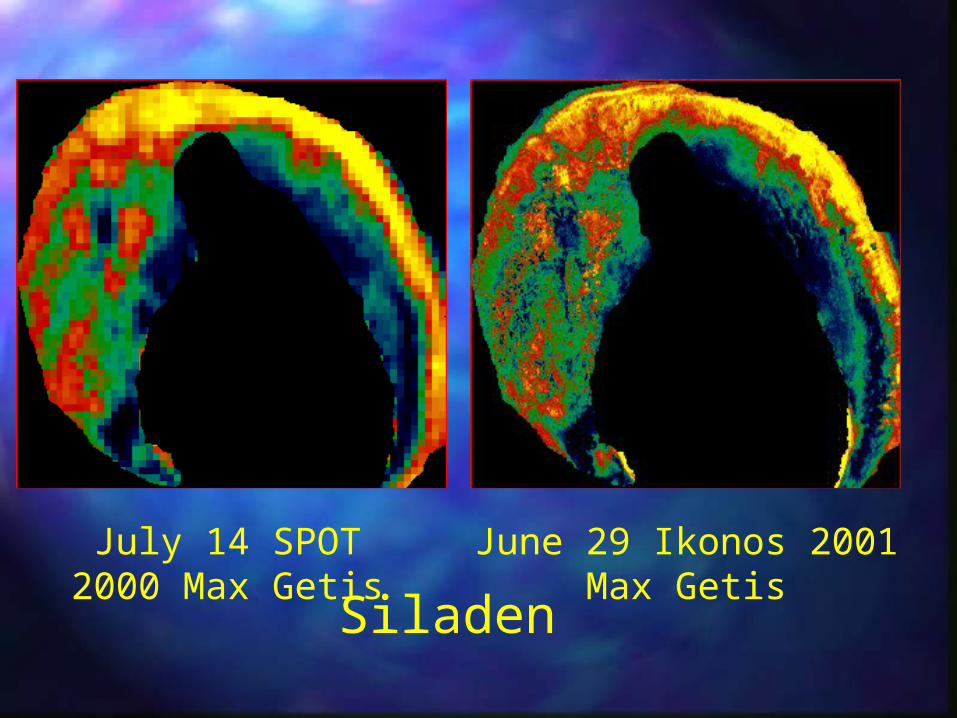
July 14 SPOT 2000 Max Getis
June 29 Ikonos 2001 Max Getis
Siladen
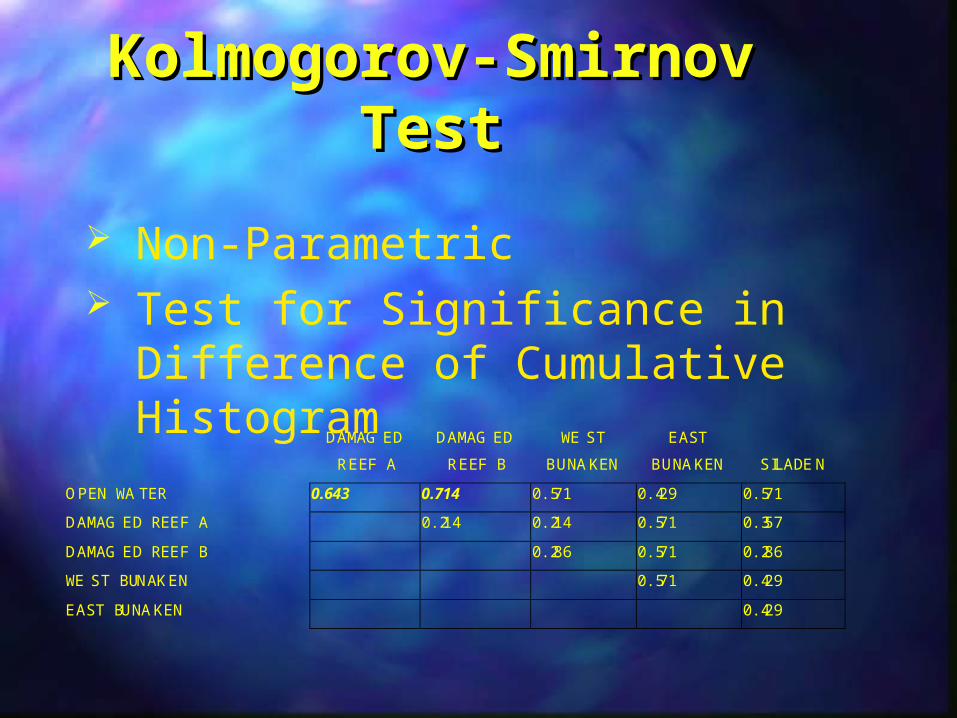
Kolmogorov-Smirnov Kolmogorov-Smirnov TestTest
Non-Parametric Test for Significance in
Difference of Cumulative Histogram
DAMAGED
REEF A
DAMAGED
REEF B
WEST
BUNAKEN
EAST
BUNAKEN SILADEN
OPEN WATER 0.643 0.714 0.571 0.429 0.571
DAMAGED REEF A 0.214 0.214 0.571 0.357
DAMAGED REEF B 0.286 0.571 0.286
WEST BUNAKEN 0.571 0.429
EAST BUNAKEN 0.429
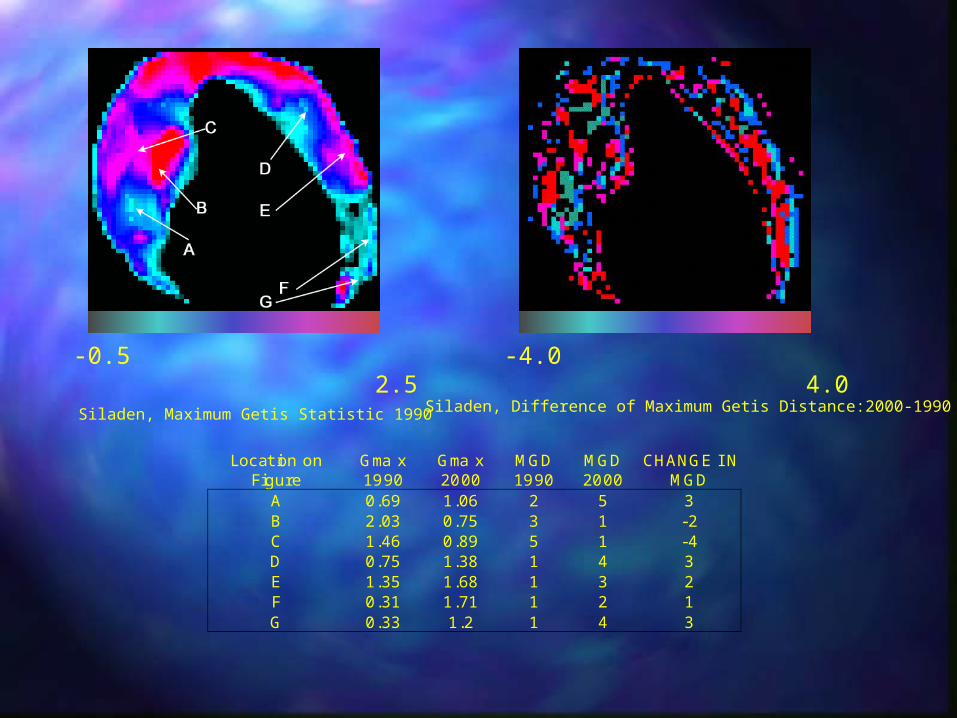
Location onFigure
Gmax1990
Gmax2000
MGD1990
MGD2000
CHANGE INMGD
A 0.69 1.06 2 5 3B 2.03 0.75 3 1 -2C 1.46 0.89 5 1 -4D 0.75 1.38 1 4 3E 1.35 1.68 1 3 2F 0.31 1.71 1 2 1G 0.33 1.2 1 4 3
Siladen, Maximum Getis Statistic 1990
-4.0 4.0
Siladen, Difference of Maximum Getis Distance:2000-1990
-0.5 2.5