Embed Size (px)
Citation preview
European Journal of Operational Research 168 (2006) 475–491
www.elsevier.com/locate/ejor
Production, Manufacturing and Logistics
The application of prediction capability and adaptivetarget control to the newspaper business
Michael Pearson *
Centre for Mathematics and Statistics, School of Management Studies, Napier University, Edinburgh EH11 4BN, UK
Received 5 August 2003; accepted 6 May 2004Available online 7 August 2004
Abstract
A newspaper wholesaler determines the optimal supply of newspapers, which minimises costs or maximises profitwhen demand is uncertain. Targets concerning the mean number of unsold newspapers and the probability of not stock-ing out are commonly used in the absence of known costs. These targets help to strike a balance between excessive wast-age (overage) and increased stock-outs (underage). Wholesalers also use various methods of predicting demand, someof which achieve one of the targets while others achieve both. We investigate the relationship between these targets andthe prediction method. We say that a prediction method is �capable� if both targets can be achieved when using thatmethod. We introduce a technique for adapting targets, which renders the prediction method capable. We showhow optimality is achieved while preserving prediction capability. We use a case study drawn from the newspaperbusiness to illustrate the automatic allocation of newspapers.� 2004 Elsevier B.V. All rights reserved.
Keywords: Inventory; Newsvendor; Automatic allocation; Forecasting; Time series
1. Introduction
The newsvendor problem attempts to determine the optimal supply of newspapers that minimises costsor maximises profit in the face of uncertain demand. Management scientists traditionally solve this prob-lem by predicting demand and deciding supply in one model. In this paper we develop, in the context ofthe newspaper business, the concept of prediction capability, which distinguishes between the tasks of
0377-2217/$ - see front matter � 2004 Elsevier B.V. All rights reserved.doi:10.1016/j.ejor.2004.05.013
* Tel.: +44 131 455 3348; fax: +44 131 455 3485.E-mail address: [email protected]
476 M. Pearson / European Journal of Operational Research 168 (2006) 475–491
demand prediction and finding an optimal order quantity. We say that a predictor or prediction methodis �capable� of achieving performance measures, such as the targets of availability and wastage, if bothmeasures can be achieved by the predictor or prediction method. We study the relationship betweencapable prediction and the optimal order quantity, and show that for optimality the performance meas-ures are uniquely defined. This enables us to adopt a new and rewarding approach to the newsvendorproblem, which incorporates the common use of a range of targets, as well as varying predictionmethods. The subsequent analysis is simple and yet far-reaching. We observe, for instance, that if a pre-dictor foresees changes in demand, such as the occurrence of outliers, then a more efficient ordering pol-icy can be achieved. We conclude that the real problem of efficient ordering is not demand variability buthigh variability in prediction errors. This is the case whether the predictor has employed stochastic de-mand functions, such as the normal or Poisson distribution, or made use of generating processes (Mak-ridakis et al., 1983), such as time series analysis (Box and Jenkins, 1976; Chatfield, 1989). The predictormay have made many (or few) assumptions concerning the demand distribution. The person who is en-gaged in allocating inventory does not need to make any such assumptions. He assumes that the predic-tor is doing a good job. We therefore adopt a model in which the prediction errors are normallydistributed.
We are concerned with efficient allocation as well as the determination of optimal order quantity. Effi-cient inventory allocation to numerous outlets is frequently achieved by the use of a range of performancemeasures, which may have been set locally within the organisation or imposed by a producer of goods. Thenewspaper business provides a good example. Determining the economic order quantity (EOQ) of newspa-pers to order from the publisher is only part of the wholesaler�s task. The decision about how many papersto allocate to each retail outlet is frequently determined by adherence to specific targets set for certain out-lets. Some outlets (such as an international airport) may be identified as key outlets where some publica-tions should not stock out. For these outlets and publications higher target availabilities will be set andhigher wastage levels endured. The question of optimising profits or minimising costs can become cloudedby such practice. In this paper we seek to clarify the relationship between allocating goods to numerousoutlets by the setting of targets, and the achievement of the optimal ordering of inventory. We do thisby establishing a comparative cost of underage (measured, for example, by frequency of stock-outs) interms of overage (measured by wastage or unsold items).
In the literature the newsvendor problem has been formulated under many objectives, with little com-parative work (Khouja, 1999) carried out. The classical approach to the problem has been a trade offbetween the risk of over-stocking, forcing dispersal below the unit purchasing cost, and the risk ofunder-stocking and losing the opportunity of making a profit. The solution is to allocate stock based onmaximizing expected profit levels or minimizing expected costs (Lau, 1980; Khouja, 1995; Lau and Lau,1995; Eeckhoudt et al., 1995). Such solutions are invariably tied to some knowledge of the demand distri-bution, often assumed to be normal. An important refinement has been to formulate a distribution-freesolution (Scarf, 1958; Moon and Choi, 1995; Gallego and Moon, 1993). The approach does not assumeany specific form of the distribution, and it requires only the mean and variance of the demand. If the dis-tribution appears to be very different from a known form, one should consider the distribution-freeapproach (Silver et al., 1998). We observe the way in which the predictor copes with demand variabilityby measuring changes in the prediction errors. We argue that knowledge of the variance of the demandmay be superfluous if a predictor can predict accurately when demand variability increases. In these circum-stances we think that knowledge of the variance of the prediction errors could be more relevant to alloca-tion decisions than knowledge of the demand variability.
In a related work, Lin and Kroll (1997) advocate the use of dual performance measures, and expectedprofit is maximised subject to a constraint on the probability of achieving a target profit level. It is rec-ognised elsewhere (Bertsimas and Paschalidis, 2001) that it is difficult to obtain data to quantify customersatisfaction via backorder costs, and the authors recommend using constraints that ensure that probabil-
M. Pearson / European Journal of Operational Research 168 (2006) 475–491 477
ities of stock-out stay bounded below given desirable levels. Pearson (2000) incorporated target perform-ance measures, which take account of the forecasting methodology, into the newsvendor problem. He alsostressed the importance of current practice targets for underage (stock-outs) and overage (wastage) levels.Pearson (2003) introduced the concept of prediction capability as related to the two performance meas-ures of percentage target overage and underage. We extend prediction capability to include a range ofperformance measures, as well as �adaptive target control� and a target gain/capability function for usein the automatic allocation of inventory. The ideas are developed in the context of an illustrative casestudy.
The remainder of the paper is organised as follows. In Section 2 we state the assumptions and make apreliminary statement of the problem. In Section 3 we introduce the concept of prediction capability where-by a prediction method is capable of achieving the targets defined in Section 2. In Section 4 adaptive targetcontrol is outlined as a method by which current (or prescribed) targets can be adapted to achieve predic-tion capability. In Section 5 the target gain function is introduced, which enables an improved optimal solu-tion to be investigated on the basis of knowledge of existing time series data. Section 6 introduces our casestudy, which investigates the automatic application of the methods to the newspaper business. The paperends with a conclusion in Section 7.
2. The model
We begin by introducing the assumptions underlying the model.
2.1. Assumptions
A1 A demand fitting or forecasting technique is applied, which provides an unbiased method of predictingdemand even when there are stock-outs.
A2 The prediction errors are normally distributed.A3 We apply the single period inventory model when investigating supply.
Assumption A1 enables us to estimate the demand even when there are stock-outs.Assumption A2 is used to formulate the theory of prediction capability based on sound prediction
practice.
2.2. Statement of the problem
We begin by stating the problem.
Problem 2.1. A newspaper wholesaler wants to find the order quantity of newspapers that minimises thetotal overage (wastage) and underage (stock-out) costs in the face of uncertain demand, when explicitknowledge of overage and underage costs is replaced by embedded or imposed target performancemeasures.
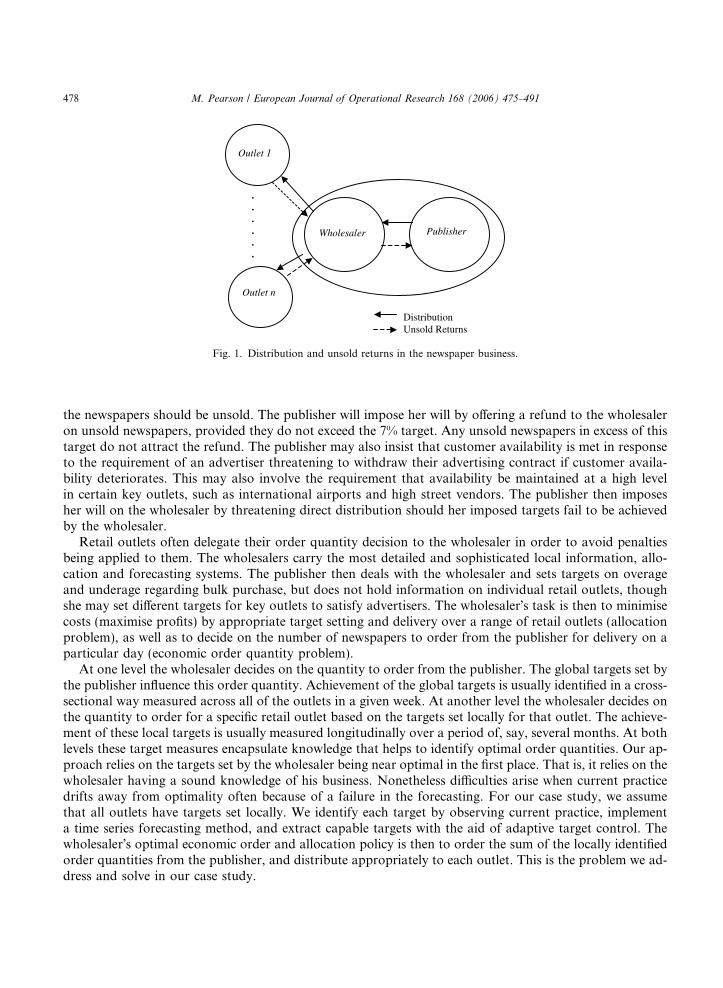
Fig. 1 illustrates the problem. Each outlet is a retailer who may order a quantity of newspapers from thewholesaler based on the retailer�s estimate of future customer demand. The wholesaler may encourage theretailer to accept a larger (or smaller) order by offering a refund for unsold copies that do not exceed a spec-ified target overage. For her part the publisher may be keen that an overall target of availability and over-age (measured over all outlets handled by the wholesaler) should be achieved. For example, the publishermay insist that no less than 84% of outlets should not stock out on a given day, while no more than 7% of
Wholesaler
Publisher
Outlet 1
Outlet n
.
.
.
.
.
.
Distribution Unsold Returns
Fig. 1. Distribution and unsold returns in the newspaper business.
478 M. Pearson / European Journal of Operational Research 168 (2006) 475–491
the newspapers should be unsold. The publisher will impose her will by offering a refund to the wholesaleron unsold newspapers, provided they do not exceed the 7% target. Any unsold newspapers in excess of thistarget do not attract the refund. The publisher may also insist that customer availability is met in responseto the requirement of an advertiser threatening to withdraw their advertising contract if customer availa-bility deteriorates. This may also involve the requirement that availability be maintained at a high levelin certain key outlets, such as international airports and high street vendors. The publisher then imposesher will on the wholesaler by threatening direct distribution should her imposed targets fail to be achievedby the wholesaler.
Retail outlets often delegate their order quantity decision to the wholesaler in order to avoid penaltiesbeing applied to them. The wholesalers carry the most detailed and sophisticated local information, allo-cation and forecasting systems. The publisher then deals with the wholesaler and sets targets on overageand underage regarding bulk purchase, but does not hold information on individual retail outlets, thoughshe may set different targets for key outlets to satisfy advertisers. The wholesaler�s task is then to minimisecosts (maximise profits) by appropriate target setting and delivery over a range of retail outlets (allocationproblem), as well as to decide on the number of newspapers to order from the publisher for delivery on aparticular day (economic order quantity problem).
At one level the wholesaler decides on the quantity to order from the publisher. The global targets set bythe publisher influence this order quantity. Achievement of the global targets is usually identified in a cross-sectional way measured across all of the outlets in a given week. At another level the wholesaler decides onthe quantity to order for a specific retail outlet based on the targets set locally for that outlet. The achieve-ment of these local targets is usually measured longitudinally over a period of, say, several months. At bothlevels these target measures encapsulate knowledge that helps to identify optimal order quantities. Our ap-proach relies on the targets set by the wholesaler being near optimal in the first place. That is, it relies on thewholesaler having a sound knowledge of his business. Nonetheless difficulties arise when current practicedrifts away from optimality often because of a failure in the forecasting. For our case study, we assumethat all outlets have targets set locally. We identify each target by observing current practice, implementa time series forecasting method, and extract capable targets with the aid of adaptive target control. Thewholesaler�s optimal economic order and allocation policy is then to order the sum of the locally identifiedorder quantities from the publisher, and distribute appropriately to each outlet. This is the problem we ad-dress and solve in our case study.
M. Pearson / European Journal of Operational Research 168 (2006) 475–491 479
2.3. Problem formulation
We define the terms used in Problem 2.1
D and bD are the uncertain and predicted demand, respectively, during the next supply interval.Q is the supply of newspapers to a specific outlet at the next order point.co and cu are the unknown per unit overage and underage costs, respectively./(Æ), U(Æ) are the standard normal density and cumulative distribution functions, respectively.
We make use of Brown�s (1963) allocation equation
Q ¼ bD þ kre; ð1Þ
where k is a decision variable called the safety factor, and re is the standard deviation of the predictionerrors, D� bD, calculated over some range of previous observations. For simplicity, and without loss of gen-erality, we have assumed one period ahead forecasting if time series analysis has been used. We formulatethe targets in terms of the overage/underage variable, Y, whose value is positive for overage and negativefor underage. We define Y, making use of Eq. (1), asY ¼ Supply�Demand ¼ Q� D ¼ bD � Dþ kre:
Wewill extend some of the results derived in Pearson (2000, 2003), using the alternative, andmore natural,definition of target overage, expressed as a percentage of the demand rather than the supply. Under Assump-tion A2 we see that ðbD � DÞ � Nð0; r2
eÞ and hence Y � Nðkre; r2eÞ. The target performance measures are:
Definition 2.1
sa ¼ Target % availability ¼ P ðY > 0Þ � 100: ð2aÞ
Definition 2.2
ov ¼ EðOverageÞ ¼ E½ðQ� DÞþ ¼ EðY jY > 0ÞPðY > 0Þ: ð2bÞ
Definition 2.3
so ¼ Target % overage ¼ EðOverageÞEðDemandÞ � 100 ¼ E½ðQ� DÞþ
EðDÞ � 100
¼ EðY jY > 0ÞPðY > 0ÞEðDÞ � 100: ð2cÞ
Definition 2.4
un ¼ EðUnderageÞ ¼ E½ðD� QÞþ ¼ EðY jY 6 0ÞPðY 6 0Þ: ð2dÞ
Definition 2.5
su ¼ Target % underage ¼ EðUnderageÞEðDemandÞ � 100 ¼ E½ðD� QÞþ
EðDÞ � 100
¼ EðY jY 6 0ÞP ðY 6 0ÞEðDÞ � 100: ð2eÞ
480 M. Pearson / European Journal of Operational Research 168 (2006) 475–491
The target % availability is the probability (expressed as a percentage) of not getting a stock-out. If theavailability target is exactly met then
k ¼ invsa100
� �where invð Þ is the inverse standard normal cdf ; ð3Þ
where + indicates the value of the variable when it is positive and zero otherwise.Problem 2.1, with known costs, is to minimize TC=E[(Q�D)+]co+E[(D�Q)+]cu. Under the Assump-
tions A1–A3 we show (Theorem 4.2) that the solution is given by the value of k that satisfies the familiarnewsvendor formula, U(k)=cu/(co+cu). We concentrate our attention on the cost minimisation problemand note that the profit maximisation problem can also be addressed by replacing the term cu by (cu+cp),where cp is the contribution to profit (Silver et al. pp. 385–387). In this paper we assume that costs, cu andco, are unknown and reformulate the problem in terms of established targets. Problem 2.1 is then to minimize
TC ¼ E½ðQ� DÞþEðDÞ EðDÞco þ
E½ðD� QÞþEðDÞ EðDÞcu ¼ ðsoco þ sucuÞEðDÞ=100: ð4Þ
Initially we assume that the prediction method can meet both targets, so and su, exactly. This is what wemean when we say that the prediction method is �capable� with respect to these targets. We use the safetyfactor k defined in Eq. (3) as our key decision variable. Once k is identified then (the costs cu and co beingunknown) the ratio cu/co=U(k)/(1�U(k)), measured during a period of near optimal system performance,acts as a reference point for subsequent adjustments to targets when variability changes. This ratio is alsocentral to adaptive target control, which is a technique for adapting targets so that the (non-capable) pre-diction method becomes capable of meeting the new targets.
We will sometimes refer to the percentage definitions as target percentages (as in Definitions 2.3 and 2.5).We also refer to the overage and underage definitions as absolute targets (as in Definitions 2.2 and 2.4.). Wehave chosen two sets of percentage targets for our study, (sa,so) and (su,so), because they are commonlyused in areas such as newspaper sales, from which the newsvendor problem derives its name, and banking.For example, a publisher may set targets of 84% availability (sa=84%) and 7% overage (so=7%) for globalsales of a particular newspaper in a geographic area, or measured locally at one key outlet over successivedeliveries. Other businesses, however, may use a service level or underage, rather than an availability, tar-get. For example, a bank may want to satisfy 99% of demand (su=1%) for cash at its automatic tellingmachines. There are advantages to both methods of setting targets. The target underage, for instance, isdirectly comparable with the target overage and therefore more amenable to newsvendor analysis. How-ever, it measures unfulfilled demand, which can be difficult to evaluate when stock-outs are frequent.The target availability, on the other hand, is based on frequency of stock-outs and is easily measured.We show that, under the assumptions stated, both sets of targets are equivalent. That is, given an overagetarget and a capable prediction method (as defined below), then there will be a one-to-one mapping betweenthe availability target and the underage target, so that identifying the availability target determines uniquelythe underage target and vice versa.
3. Prediction capability
In this section we state and develop the theory associated with the concept of prediction capability. Someof the definitions and theorems have been stated elsewhere in a reduced form (Pearson, 2003). We now gen-eralise the concept of prediction capability to apply over the range of performance measures defined in Def-initions 2.1–2.5. We begin by defining the error coefficient of variation. This provides a valuable indicatorof the quality of the prediction method, high values indicating poor quality prediction. We also state theOverage theorem, which formulates the target overage when predicting demand.
M. Pearson / European Journal of Operational Research 168 (2006) 475–491 481
Definition 3.1 (Error coefficient of variation). The error coefficient of variation, b ¼ re
l , is the ratio of thestandard deviation of the prediction errors (re) to the mean of the demand distribution (l=E(D)).
Theorem 3.1 (Overage theorem). If the target overage, so, is exactly met in prediction then
so ¼ 100bð/ðkÞ þ kUðkÞÞ: ð5Þ
The proof is in Appendix A.
Definition 3.2 (Prediction capability). A prediction method is capable, with respect to two performancemeasures, if both measures are exactly achieved when employing the prediction method. We now providean example of two performance measures and define the term CPR in the context of these measures. Theperformance measures are target availability (sa) and target overage (so). If we let PSTAT=so/(100(kU(k)+/(k))) then the ratio CPR, with respect to the targets (sa,so), is defined as PSTAT/b wherek=inv(sa/100). The ratio CPR is a significant one and determines whether or not the target figures can beachieved when using a prediction method. If CPR=1 we say that the prediction method is capable of thetargets (sa,so).
Theorem 3.2 (Availability/underage theorem). For a prediction method which is capable with respect to
(sa,so), there is a one-to-one correspondence between the target availability, sa, and the target underage, su,
for a given value of the error coefficient of variation. Furthermore the percentage underage, su, is the percent-
age of demand which is not captured by the allocation method and is given by
su ¼ 100bð/ðkÞ � kð1� UðkÞÞÞ: ð6aÞ
The proof is in Appendix B.
Multiplying Eq. (6a) by l/100 gives the underage, un, in terms of the error standard deviation, re, and kas
un ¼ reð/ðkÞ � kð1� UðkÞÞÞ: ð6bÞ
CPR can be expressed in terms of the measures (sa,su), (sa,un), (sa,ov), (su,so) and (un,ov) as follows:CPR ¼ su100bð/ðkÞ � kð1� UðkÞÞÞ ; where k ¼ invðsa=100Þ: ð7aÞ
CPR ¼ unreð/ðkÞ � kð1� UðkÞÞÞ ; where k ¼ invðsa=100Þ: ð7bÞ
CPR ¼ ovreðkUðkÞ þ /ðkÞÞ ; where k ¼ invðsa=100Þ: ð7cÞ
CPR ¼ so100bðkUðkÞ þ /ðkÞÞ ; where k is found by substituting su in Eq: (6a): ð7dÞ
CPR ¼ ovreðkUðkÞ þ /ðkÞÞ ; where k is found by substituting un in Eq: (6b): ð7eÞ
Corollary 3.1. If the prediction method (6b) is capable with respect to (sa,so), then it is also capable with
respect to (sa,su), (sa, un), (sa, ov), (su,so) and (un, ov), where su=100b(/(k)�k(1�U(k))), un=re(/(k)�k(1�U(k)), ov=re (kU(k)+/(k)) and k= inv(sa/100).
482 M. Pearson / European Journal of Operational Research 168 (2006) 475–491
Proof. The proofs follow from Theorem 3.2 and the identities (7a)–(7e). h
Theorem 3.3 (Prediction capability theorem). If CPR > 1, then both targets can be met comfortably and the
prediction method is super-capable. If CPR=1, then both targets can be exactly met and the prediction method
is (exactly) capable. If CPR < 1, then not both targets can be met and the prediction method is sub-capable.
Proof. The proof, for the targets (sa,so), is given in Appendix C.1 and C.2. The other cases have similarproofs.
Theorem 3.4 (Allocation theorem). If CPR=1, the allocation policy which meets the requisite targets is given
by Q, defined in Eqs. (1) and (3).
Proof. The proof follows from Theorems 3.1 and 3.2. h
4. Adaptive target control
In this section we consider what policy an automatic system should adopt if the prediction method is notcapable of achieving the specified targets, often due to a temporary failure in the forecasting. It is not pos-sible to ask the wholesaler for an opinion each time this occurs, since the targets are guidelines. Theorem 3.4would not apply, and so we develop a technique called Adaptive Target Control (ATC), which identifiessuitable capable targets that have been adapted from the established ones. We state and prove a theoremthat shows that, if a prediction method is super or sub-capable when using the current targets, then capableadapted targets can be found. We favour two-sided adaptive target control because an equal change is madeto each target measured in cost terms (so a 1% change in overage may be equivalent to a 5% change in avail-ability). This means that adaptive target control can be applied, either as a one-off correction (globally overmultiple outlets) or gradually over a period of time (locally for one outlet), as information on the achieve-ment of targets is updated. The method also encapsulates the decision maker�s intention by maintaining thebalance set between the two targets.
Theorem 4.1 (Adaptive target control). If CPR 6¼ 1, with respect to the current targets ((sa1, so1
) or (su1,so1
)),
there exists an adapted solution, (sa2,so2
) or (su2,so2
), for the target availability/underage and overage levels
such that CPR=1 and
100
Z ka1
ka2
bUðkÞdk ¼Z su1
su2
UðkÞUðkÞ � 1
dsu ¼ so2 � so1 ðwhere ka1 ¼ invðsa1Þ; ka2 ¼ invðsa2ÞÞ: ð8Þ
If the allocation method in Theorem 3:4 is optimal within an appropriate search neighbourhood of the cur-
rent targets ((sa1,so1
) or (su1,so1
)) then
(4.1.1) 100R ka1ka2
bUðkÞdk is the cost of changing the percentage availability targets from sa1to sa2
.
(4.1.2)R su1
su2
UðkÞUðkÞ�1
dsu is the cost of changing the percentage underage targets from su1to su2
.
(4.1.3) so2�so1
is the cost of changing the percentage overage targets from so1to so2
.
The costs in (4.1.1), (4.1.2) and (4.1.3) are measured in percentage overage units. If we multiply the
expressions in (4.1.1), (4.1.2) and (4.1.3) by co/cu the costs are transformed to percentage underage units.
M. Pearson / European Journal of Operational Research 168 (2006) 475–491 483
The proof is in Appendices C.1 and C.2. Theorem 4.1 extends readily to all the targets in Eqs. (7a)–(7e).In the theorem both targets are adjusted using ATC. We therefore call this two-sided adaptive target con-trol. An alternative approach is for an operator to prioritise one of the targets and hold it fixed while adjust-ing the other target, making use of Eqs. (5) and (6a), to achieve capability for the adjusted target. We callthis one-sided adaptive target control. In the remainder of this paper we will use ATC to mean two-sidedadaptive target control.
The above theorems continue to hold for values of l close to zero. b is then undefined, liml!0{lsu/100}=re{/(k)�k(1�U(k))} and liml!0 {lso/100}=re{/(k)+kU(k)}.
Definition 4.1. An allocation method is uniquely capable if the overage/underage targets are uniquelydefined.
Theorem 4.2 (Classical newsvendor theorem). The allocation method in Theorem 3:4 will be optimal if, and
only if,
UðkÞ ¼ cuco þ cu
; ð9Þ
where the decision variable is k. If the allocation method is optimal, then it is uniquely capable with respect to
the targets (sa,so).
Proof. The objective function to be minimised is the expected total cost of overage and underage.
TC ¼ EðTotal costÞ ¼ fCost of overageþ Cost of underageg¼ fðkUðkÞ þ /ðkÞÞco þ ð/ðkÞ � kð1� UðkÞÞÞcugre:
We differentiate partially with respect to k and seek a stationary point.
oTC=ok ¼ fðk/ðkÞ þ UðkÞ � k/ðkÞÞco þ ð�k/ðkÞ � 1þ k/ðkÞ þ UðkÞÞcugre ¼ 0;
so that {U(k)co+(U(k)�1)cu}=0, and the result follows. The solution is a minimum.The proof of capability follows from our allocation policy in Theorem 3.4, so that sa/100=U(k)=cu/
(co+cu), which is fixed. The target overage is therefore given by so=100b(/(k)+ kU(k)), which is also fixedif we assume that b is fixed. The capability for the targets sa and so is therefore given by
CPR ¼ PSTAT
b¼ so
100ðkUðkÞ þ /ðkÞÞ1
b¼ 1;
and the theorem follows, since the chosen targets are the only possible choice for optimality. The theoremextends readily to the targets in Eqs. (7a)–(7e). h
5. The target gain function
This section addresses the problem, faced by wholesale managers, of accurately identifying uncertaintyin the measurement of the standard deviation of the errors. So far we have used a point estimate. We nowintroduce an interval estimate and make use of a target gain function to identify improved solutions to thenewsvendor problem.
484 M. Pearson / European Journal of Operational Research 168 (2006) 475–491
5.1. Targets for overage and underage
The usual point estimate for the error standard deviation, re, is the sample error standard deviation, s.Pearson (2000) introduces the chi-squared factor (fv2), which is applied to s to reflect the range of a suitableconfidence interval. We identify a confidence interval, [s1, s2], for re using the point estimate, s. For instance,if s is calculated from a forecasting method based on 11 historical demand figures, then, from v2 tables with10 degrees of freedom, a 95% confidence interval for re is [0.7s,1.75s]. We calculate this by forming a v2
random variable v2 ¼ ð11� 1Þs2=r2e , and note that
P ð3:25 < 10s2=r2e < 20:48Þ ¼ P ð10s2=20:48 < r2
e < 10s2=3:25Þ ¼ 0:95:
In this case our values of fv2 would range from 0.7 to 1.75. Suppose capable current practice targets are(so,su). We search for neighbouring capable targets, sO and sU, within the neighbourhoods [sos1/s,sos2/s]and [sus1/s,su s2/s] required by Theorem 4.1. We then identify a lower cost optimal solution with the aidof a target gain function.
Definition 5.1. The target gain function F(sO,sU) is defined as
F ðsO; sUÞ ¼ ðso � sOÞ þ RUðsu � sUÞ; ð10aÞ
where sO ¼ 100bð/ðkÞ þ kUðkÞÞ; ð10bÞ
and sU ¼ 100bð/ðkÞ � kð1� UðkÞÞÞ; ð10cÞ
for some value of k. The target gain function quantifies the cost gain (in units of percentage overage) whenusing the neighbouring targets (sO,sU) instead of the established targets (so,su). RU is the overage/underagecost ratio at the optimal solution.
Theorem 5.1 identifies the value of RU which maximises the target gain function.
Theorem 5.1. The target gain function in Eq. (10a) is maximised when RU = U(k)/(1�U(k)).
Proof. We wish to maximise
F ðsO; sUÞ ¼ F ðfv2Þ ¼ ðso � sOÞ þ RUðsu � sUÞ;
subject to the constraints
g1ðsO; sU; kÞ ¼ 100bð/ðkÞ þ kUðkÞÞ � sO ¼ 0;
g2ðsO; sU; kÞ ¼ 100bð/ðkÞ � kð1� UðkÞÞÞ � sU ¼ 0;
We use a Lagrange multiplier, L.So L=F�k1g1�k2g2.
AndoLosO
¼ �1þ k1 ¼ 0 giving k1 ¼ 1:
oLosU
¼ �RU þ k2 ¼ 0 giving k2 ¼ RU:
oLok
¼ �k1f100bUðkÞg � k2f100bðUðkÞ � 1Þg ¼ 0 giving RU ¼ UðkÞ=ð1� UðkÞÞ: � ð11Þ
M. Pearson / European Journal of Operational Research 168 (2006) 475–491 485
Corollary 5.1. If (so,su) are the targets at the optimal solution to the newsvendor problem in Theorem 4.2,
then the maximum value of the target gain function in Eq. (10a) is zero, and RU=cu/co.
Proof. The proof follows from Theorems 4.2 and 5.1. The optimal solution kopt is given by U(kopt)=cu/(co+cu), so that U (kopt)/(1�U(kopt))=cu/co, and therefore the underage/overage cost ratio RU=cu/co.Furthermore, our target gain function is
F ðsO; sUÞ ¼ ðso � sOÞ þcuco
ðsu � sUÞ ¼1
cofðso � sOÞco þ ðsu � sUÞcug; ð12Þ
which must have a maximum value of zero, since any value greater than this would uncover a solution(sO,sU), which has lower cost than the optimal one. h
We must exercise caution if we do not know the overage/underage costs, co and cu. This is because move-ment away from current practice policy, due to overall lower overage and underage, is only justified if theoverage/underage ratio RU is close to cu/co. In practice we set RU=U(k)/(1�U(k)), with k calculated at thecurrent practice targets (so,su). Corollary 5.1 ensures that, if this is the optimal solution, the target gainfunction will not identify a lower cost one. We identify the neighbourhood for the capable targets (sO,sU),using the confidence interval for re. Equivalent targets for overage and availability can also be used, ratherthan those for overage and underage discussed in this section. In this case our target gain function uses aratio RA defined in Appendix D.
6. Case study
In this section we introduce our case study taken from the newspaper business, which provides an appro-priate way of illustrating the newsvendor problem. The example chosen is typical of the disaggregatedweekly supply allocated to a retail outlet on a particular day of the week by a wholesaler.
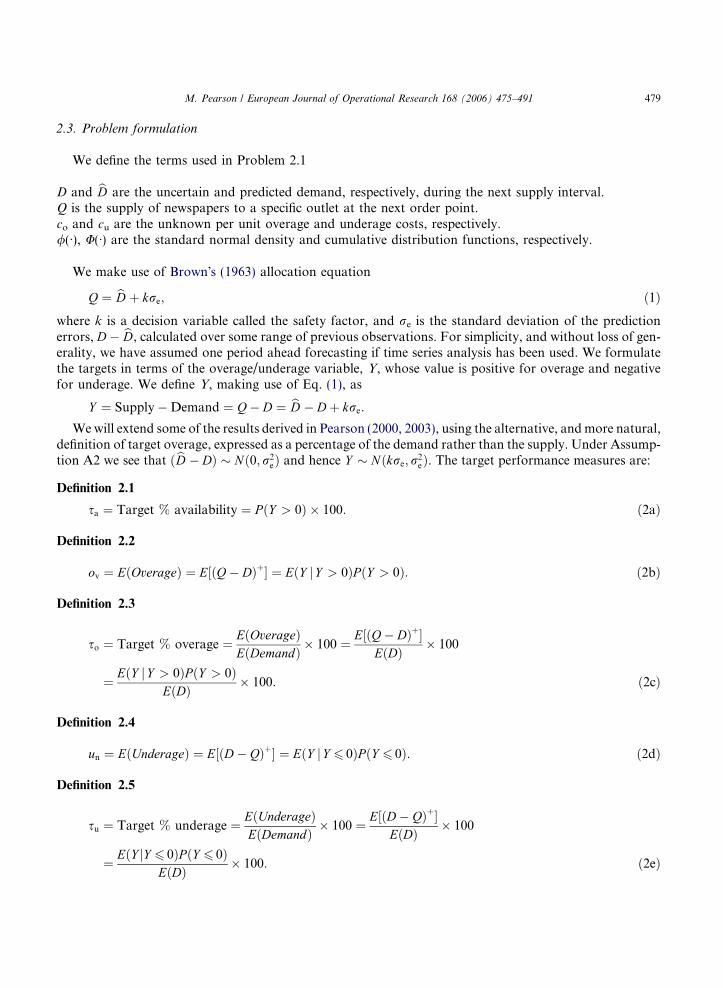
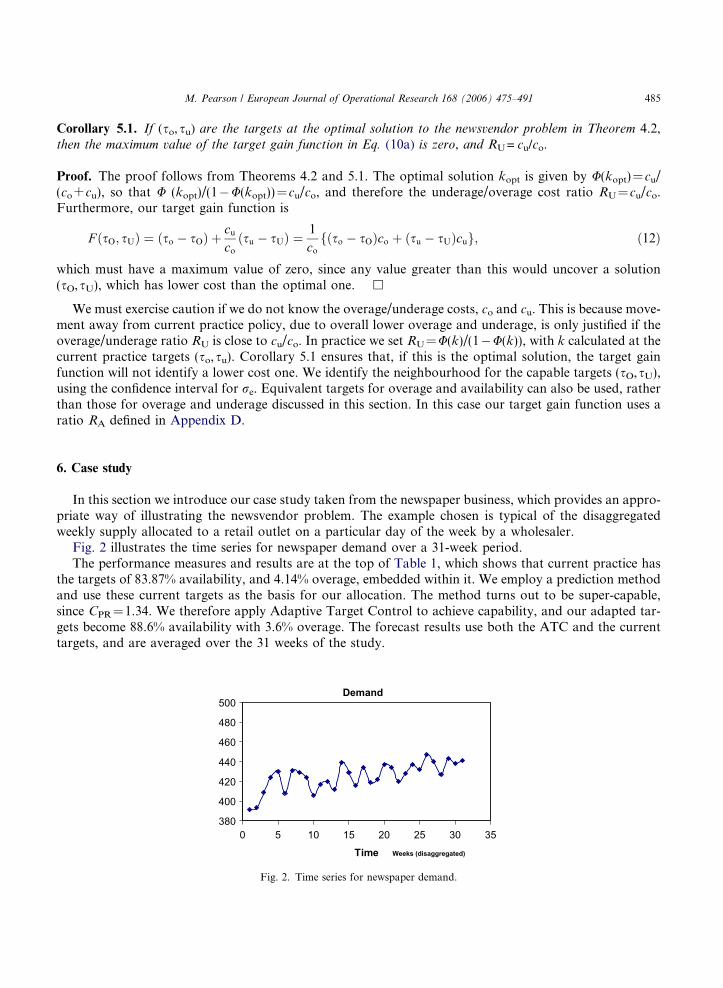
Fig. 2 illustrates the time series for newspaper demand over a 31-week period.The performance measures and results are at the top of Table 1, which shows that current practice has
the targets of 83.87% availability, and 4.14% overage, embedded within it. We employ a prediction methodand use these current targets as the basis for our allocation. The method turns out to be super-capable,since CPR=1.34. We therefore apply Adaptive Target Control to achieve capability, and our adapted tar-gets become 88.6% availability with 3.6% overage. The forecast results use both the ATC and the currenttargets, and are averaged over the 31 weeks of the study.
Demand
380
400
420
440
460
480
500
0 5 10 15 20 25 30 35
Time Weeks (disaggregated)
Fig. 2. Time series for newspaper demand.
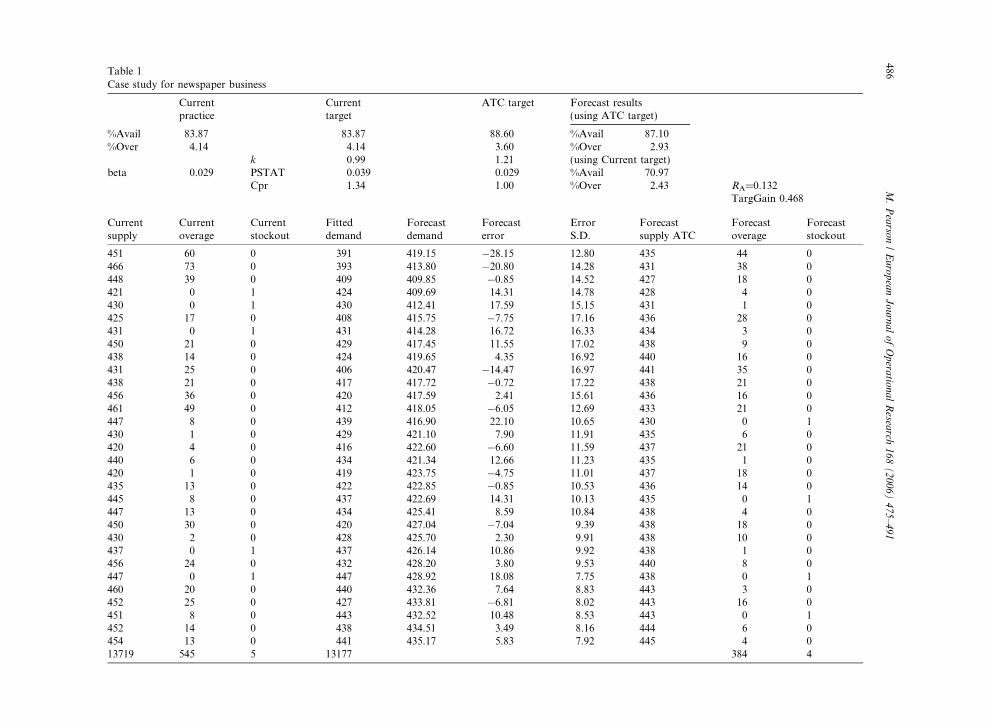
Table 1Case study for newspaper business
Currentpractice
Currenttarget
ATC target Forecast results(using ATC target)
%Avail 83.87 83.87 88.60 %Avail 87.10%Over 4.14 4.14 3.60 %Over 2.93
k 0.99 1.21 (using Current target)beta 0.029 PSTAT 0.039 0.029 %Avail 70.97
Cpr 1.34 1.00 %Over 2.43 RA=0.132TargGain 0.468
Currentsupply
Currentoverage
Currentstockout
Fitteddemand
Forecastdemand
Forecasterror
ErrorS.D.
Forecastsupply ATC
Forecastoverage
Forecaststockout
451 60 0 391 419.15 �28.15 12.80 435 44 0466 73 0 393 413.80 �20.80 14.28 431 38 0448 39 0 409 409.85 �0.85 14.52 427 18 0421 0 1 424 409.69 14.31 14.78 428 4 0430 0 1 430 412.41 17.59 15.15 431 1 0425 17 0 408 415.75 �7.75 17.16 436 28 0431 0 1 431 414.28 16.72 16.33 434 3 0450 21 0 429 417.45 11.55 17.02 438 9 0438 14 0 424 419.65 4.35 16.92 440 16 0431 25 0 406 420.47 �14.47 16.97 441 35 0438 21 0 417 417.72 �0.72 17.22 438 21 0456 36 0 420 417.59 2.41 15.61 436 16 0461 49 0 412 418.05 �6.05 12.69 433 21 0447 8 0 439 416.90 22.10 10.65 430 0 1430 1 0 429 421.10 7.90 11.91 435 6 0420 4 0 416 422.60 �6.60 11.59 437 21 0440 6 0 434 421.34 12.66 11.23 435 1 0420 1 0 419 423.75 �4.75 11.01 437 18 0435 13 0 422 422.85 �0.85 10.53 436 14 0445 8 0 437 422.69 14.31 10.13 435 0 1447 13 0 434 425.41 8.59 10.84 438 4 0450 30 0 420 427.04 �7.04 9.39 438 18 0430 2 0 428 425.70 2.30 9.91 438 10 0437 0 1 437 426.14 10.86 9.92 438 1 0456 24 0 432 428.20 3.80 9.53 440 8 0447 0 1 447 428.92 18.08 7.75 438 0 1460 20 0 440 432.36 7.64 8.83 443 3 0452 25 0 427 433.81 �6.81 8.02 443 16 0451 8 0 443 432.52 10.48 8.53 443 0 1452 14 0 438 434.51 3.49 8.16 444 6 0454 13 0 441 435.17 5.83 7.92 445 4 013719 545 5 13177 384 4
486M.Pearson/EuropeanJournalofOperationalResea
rch168(2006)475–491
M. Pearson / European Journal of Operational Research 168 (2006) 475–491 487
They are shown at the top right-hand side of Table 1. The first three columns of the table (�Currentsupply�, �Current overage� and �Current stock-out�) contain information on the current practice employedby the wholesale distributor. In the �Current stock-out� column, �1� represents a stock-out, while �0� meansthat there is overage. The remainder of the table illustrates the results of using exponential smoothing asa prediction method. We have calculated the current targets and the error coefficient of variation usingthe data in the table. Normally we would calculate these using historical data taken from earlier timeperiods.
The first recorded �Current supply� is shown in column 1 of Table 1 as 451, with �Current overage� of 60.Data from the first 11 weeks is used for forecasting purposes and is not shown in the table. The �Fitted de-mand� equals the �Current supply� minus the �Current overage�, unless the �Current overage� is zero. In thelatter case, an addition is estimated to make up for the shortage. The table shows that current practice hasembedded in it the target availability of 83.87% ð¼ 100� ð31�
P‘Current stock-out’Þ=31Þ, and the target
overage of 4.14% ð¼ 100� ðP
‘Current overage’Þ=ðP
‘Fitted demand’ÞÞ.It is not appropriate to describe the current method as being capable (even though the publisher has
imposed target measures of availability and overage), since it is a supply allocation method, and does notattempt to predict demand. Consequently we do not have any record of current prediction errors.However, we use the �Fitted Demand� and apply simple exponential smoothing, with smoothing con-stant set at 0.19 (optimal Mean Absolute Percentage Error), to get the �Forecast Demand�, and hence the�Forecast Error�. The error standard deviation (�Error S.D.�) is calculated from the previous 11 forecasterrors in the �Forecast Error� column.With these we are able to assess the capability of the predictionmethod.
The capability of the exponential smoothing is assessed by first calculating the error coefficient of vari-ation (b=0.029). We then calculate PSTAT (=0.039) where so=4.14 and k=inv(83.87/100)=0.99. Fromthis we conclude that our exponential smoothing is super-capable since CPR=0.039/0.029=1.34>1, for thecurrent practice targets of 83.7% availability and 4.14% overage. We apply two-sided Adaptive Target Con-trol and find that capable targets for this prediction method are 88.6% availability and 3.6% overage. Weuse these targets to calculate the �Forecast supply (ATC)� in column 8 (Theorem 3.4), and hence measure theperformance by monitoring the �Forecast overage� (=�Forecast supply (ATC)�� �Fitted Demand�) and�Forecast Stockout� in columns 9 and 10. We see the prediction method using ATC gives 87.1% availabilitywith 2.93% overage, compared with 70.97% availability and 2.43% overage using the embedded targetsgleaned from current practice. Adaptive target control provides a balanced improvement to current prac-tice, rather than concentrating all the improvement into just one of the targets. An Anderson Darling testfor normality of the errors gives little cause for concern (p-value=0.219).
We attempt to gain further improvement by using a target gain function. We calculate the availabilityform of the ratio, RA=0.029·0.886/0.195=0.132, described in Appendix D. The value of the target gainfunction is 0.468 using the ATC targets and the results gained from the prediction method. We repeat thecalculation of the target gain function for values of fv2 ranging from 0.7 to 1.75 and find that it has a max-imum of 0.587 at fv2=1.09. At this value of fv2 the forecasting method achieves 90.32% availability at 3.24%overage. We calculate the implicit overage and underage costs from the ATC targets as cu/co=0.886/(1�0.886)=7.77. Underage is 7.77 times more costly than overage for this outlet and we conclude thatproduct availability and customer service are deemed to be very important. We have acquired this knowl-edge by observing current practice allocation policy without recourse to actual overage and underage costs,which are frequently unavailable.
7. Summary and conclusion
We have taken the radical step of shifting the emphasis from the traditional observation of, and assump-tions about, a demand distribution to a predictor�s ability to employ capable prediction methods. In doing
488 M. Pearson / European Journal of Operational Research 168 (2006) 475–491
so we have used a range of compatible performance measures or �targets� aimed at providing a solution toallocation problems that simultaneously achieve low overage and low underage. We have achieved a moreefficient, waste free distribution of goods while improving customer service and reducing stock-outs.
We have harmonised the allocation and prediction methods through Adaptive Target Control. We havealso extended our distribution-free approach by identifying an interval estimate of the variability of the pre-diction errors, and used constrained optimisation of a target gain/capability function applied over thatinterval to improve both capability and optimality. The method achieves tangible improvements especiallyin an automatic allocation procedure, and acts as a tracking device focused on capable targets.
There is scope for further research. The methodology can be incorporated into automatic inventory allo-cation control systems to improve overall performance. Prediction capability theory can be introduced intothe continuous review ordering policy as well as for promotional activity.
Acknowledgement
I wish to thank Dr. Peter King for his assistance with the layout of the paper. Ad majoram Dei gloriam.
Appendix A. Proof of Theorem 3.1
We begin by showing that EðY jY > 0Þ ¼ r2e/Y ð0ÞþkreUðkÞUðkÞ ¼ r2e/Y ð0Þ
UðkÞ þ kre.
Let X � N(l,r2). We require E(X jX P 0). Let /X ðxÞ ¼ 1ffiffiffiffi2p
pre�ð1=2Þðx�l=rÞ2 , so that /0
X ðxÞ ¼�ðx� lÞ/X ðxÞ=r2 ¼ f�x/X ðxÞ þ l/X ðxÞg=r2, and x/X ðxÞ ¼ �r2/0
X ðxÞ þ l/X ðxÞ.
Introducing the normalising condition /X ðx jxP 0Þ ¼ /X ðxÞ=R10
/X ðxÞdx, we calculate the expectedvalue of X conditional on its being positive as
EðX jX P 0Þ ¼Z 1
0
x/X ðxÞdx�Z 1
0
/X ðxÞdx ¼Z 1
0
�r2/0X ðxÞ þ l/X ðxÞdx
�Z 1
0
/X ðxÞdx
¼ r2/X ð0Þ þ lZ 1
0
/X ðxÞdx� ��Z 1
0
/X ðxÞdx:
If we now let Y=X where Y � Nðkre; r2eÞ, then
Z 10
/Y ðxÞdx ¼ P ðY > 0Þ ¼ UðkÞ;
and so EðY jY > 0Þ ¼ ðr2e/Y ð0Þ þ kreUðkÞÞ=UðkÞ ¼ r2
e/Y ð0Þ=UðkÞ þ kre, as required.
Now Y � Nðkre; r2eÞ and so /Y ð0Þ ¼ 1ffiffiffiffi
2pp
reexp � k2re2
2r2e
h i¼ 1ffiffiffiffi
2pp
ree�k2=2.
From the definition of target overage
so ¼EðY jY > 0ÞP ðY > 0Þ
EðDÞ � 100 ¼ 100r2e/Y ð0Þ
lþ kUðkÞ re
l
� �¼ 100
re
lð/ðkÞ þ kUðkÞÞ
and Theorem 3.1 follows. h
Appendix B. Proof of Theorem 3.2
At a stock-out, supply is less than or equal to demand. Recall that Y � Nðkre; r2eÞ, and
E(Y)=E(Y jY>0) P(Y>0)+E(Y jY6 0)P(Y6 0),
M. Pearson / European Journal of Operational Research 168 (2006) 475–491 489
So that E(Y jY 6 0)P(Y 6 0)=E(Y)�E(Y j Y>0)P(Y>0)
¼ kre �r2e/Y ð0ÞUðkÞ þ kre
� �UðkÞ ¼ kreð1� UðkÞÞ � re
1ffiffiffiffiffiffi2p
p e�ðk2=2Þ;
where k ¼ inv sa100
� �. Hence the expected value of lost demand due to stock-outs, expressed positively, is
re1ffiffiffiffi2p
p e�ðk2=2Þ � k 100�sa100
� �� �, and the result follows. h
Appendix C
C.1. Adaptive Target Control
From Appendix C.2, oCPR/osa < 0 and oCPR/oso > 0. Suppose, initially, that CPR < 1 with respect to(sa1,so1
). Then decreasing sa and increasing so has the effect of increasing CPR for constant b. If we continueto do so in small increments then the continuity of the functions involved means we arrive at adapted valuesof the targets such that CPR=1. To formalise this we let dsa be a small increment in sa. Then the corre-sponding increment in so is dso, where dso ¼ oso
osadsa. If we let (sa2,so2
) be adapted values of the targets, then
so2 ¼ so1 þ limdso!0
Pdso ¼ so1 þ
R so2so1
dso ¼ so1 þR sa1
sa2
osoosa
dsa.
SoR sa1
sa2
osoosa
dsa ¼ so2 � so1 , such that CPR=1 with respect to (sa2,so2).
We use Eq. (5) and the results of Appendices C.1 and C.2 and conclude that
100
Z ka1
ka2
bUðkÞdk ¼ so2 � so1 ; where ka1 ¼ invðsa1Þ; ka2 ¼ invðsa2Þ:
Suppose now that CPR > 1 with respect to (sa1, so1). The adapted targets will now be more stringent (that
is, sa2 > sa1 and so2< so1
) and can be found by the application of a similar methodology. The RHS of Eq. (8)represents the increase in the percentage overage forfeited as a result of adapting the targets from (sa1,so1
) to(sa2,so2
) if CPR < 1, and vice-versa if CPR>1.The LHS of Eq. (8) represents the decrease in the percentage availability forfeited as a result of adapting
the targets from (sa1,so1) to (sa2,so2
) if CPR < 1, and vice-versa if CPR>1. The same result is obtained if we
use su1 and so1instead of sa1 and so1
, as in that case osoosu
¼ UðkÞUðkÞ�1
which, from Eq. (9), equals �cucoat the optimal
solution. In the neighbourhood of the optimal solution (see Section 5.1), an equal cost trade-off betweenoverage and underage takes place with adaptive target control. h
C.2. oCPR/osa < 0 and oCPR/oso>0
Let db be a small change in b, and let dso and dsa be corresponding small changes in the target overageand availability figures that preserve equality in Eq. (5).
Then db ¼ oboso
� dso þobosa
� dsa:
We show that a small decrease in the value of b leads to a small increase in the availability, and a smalldecrease in the overage. Hence both targets can be comfortably met, so that CPR>1. Correspondingly, asmall increase in the value of b will mean that CPR < 1. We require ob/oso>0, ob/osa < 0 and oso/osa>0.
490 M. Pearson / European Journal of Operational Research 168 (2006) 475–491
Now b=so/(100(kU(k)+/(k))), and so ob/oso=1/(100(kU(k)+/(k))).
If we let gðkÞ ¼ k þ /ðkÞUðkÞ ¼ k þ e�k2=2ffiffiffiffi
2pp
UðkÞ, then g(k) > 0 since by an application of L�Hopital�s rule we have
Limk!�1
e�ðk2Þ=2ffiffiffiffi2p
pUðkÞ ¼
�ke�k2=2
e�k2=2¼ �k, and therefore ob
oso¼ 1=ð100UðkÞgðkÞÞ > 0.
Second, if obosa
< 0, then obok ¼
�100soUðkÞf100ðkUðkÞþ/ðkÞÞg2 < 0. Since the numerator is positive and the denominator is
strictly positive, then ob/osa < 0, since k is a strictly increasing function of sa. Thirdly, consider the require-ment oso/osa>0, so that
oso=osa ¼ffiffiffiffiffiffi2p
pek
2=2bUðkÞ > 0: �
Appendix D. Overage/availability gain function
We examine the overage/availability gain function. Suppose capable current practice (after the applica-tion of appropriate ATC) makes use of the percentage overage and availability targets (so,sa). Then im-proved targets (sO,sA) can be found by maximising
F ðsO; sAÞ ¼ ðso � sOÞ þ RAðsA � saÞ;
subject to the constraints
g1ðsO; sA; kÞ ¼ 100bð/ðkÞ þ kUðkÞÞ � sO ¼ 0 and g2ðsO; sA; kÞ ¼ 100UðkÞ � sA ¼ 0;
where RA is the ratio of proportion between the amount gained on the overage target, (so�sO), and theamount gained on the availability target, (sA�sa). We implement a Lagrange multiplier,L=F�k1g1�k2g2, so that oL/osO=�1+k1=0, giving k1=1. oL/osA=RA+k2=0 gives k2=�RA.
Also oL/ok=�k1{100bU(k)}�k2{100/(k)}=0 gives RA=bU(k)//(k).
References
Bertsimas, D., Paschalidis, I., 2001. Probabilistic service level guarantees in make-to-stock manufacturing systems. OperationsResearch 49 (1), 119–133.
Box, G., Jenkins, G., 1976. Time Series Analysis: Forecasting and Control. Holden-Day, San Francisco.Brown, R.G., 1963. Smoothing, Forecasting and Prediction of Discrete Time Series. Prentice-Hall, Englewood Cliffs, NJ.Chatfield, C., 1989. The Analysis of Time Series: An Introduction, fourth ed. Chapman and Hall, London.Eeckhoudt, L., Gollier, C., Schlesinger, H., 1995. The risk-averse (and prudent) Newsboy. Management Science 41 (5), 786–794.Gallego, G., Moon, I., 1993. The distribution free newsboy problem: Review and extensions. Journal of the Operational Research
Society 44, 825–834.Khouja, M., 1995. The newsboy problem under progressive multiple discounts. European Journal of Operational Research 84 (2), 458–
466.Khouja, M., 1999. The single-period (newsvendor) problem: Literature review and suggestions for future research. Omega 27 (5), 537–
553.Lau, H.S., Lau, A.H., 1995. The multi-product newsboy problem: Applications, formulation and solution. Journal of the Operational
Research Society 13 (2), 153–162.Lau, H.S., 1980. The newsboy problem under alternative optimization objectives. Journal of the Operational Research Society 31, 525–
535.Lin, C., Kroll, D., 1997. The single-item newsboy problem with dual performance measures and quantity discounts. European Journal
of Operational Research 100 (3), 562–565(4).Makridakis, S., Wheelwright, S., McGee, V., 1983. Forecasting: Methods and Applications. John Wiley and Sons Inc., New York.

M. Pearson / European Journal of Operational Research 168 (2006) 475–491 491
Moon, I., Choi, S., 1995. The distribution free newsboy problem with balking. Journal of the Operational Research Society 46 (4), 537–542.
Pearson, M.A., 2000. The incorporation of target performance measures and constrained optimisation in the newsboy problem.Journal of the Operational Research Society 51 (6), 744–754 (Reprinted January 2001).
Pearson, M.A., 2003. An equilibrium solution to supply chain synchronisation. IMA Journal of Management Mathematics 14 (3),165–185.
Scarf, H., 1958. A min–max solution of an inventory problem. In: Arrow, K., Karlin, S., Scarf, H. (Eds.), Studies in the MathematicalTheory of Inventory and Production. Stanford University Press, Ca, pp. 201–209.
Silver, E.A., Pyke, D.F., Peterson, R., 1998. Inventory Management and Production Planning and Scheduling. John Wiley and SonsInc., New York.