Embed Size (px)
Citation preview

The application of electrical resistance measurements to water
transport in lime-masonry systems
R J Ball1,2*
, G C Allen2, M A Carter
3, M A Wilson
3, C Ince
3, A El-Turki
2
1 Currently: Department of Architecture and Civil Engineering, University of Bath,
Bath, BA2 7AY, UK
2 Interface Analysis Centre, University of Bristol, Bristol, BS2 8BS, UK
3 School of Mechanical, Aerospace and Civil Engineering, University of Manchester, PO Box 88,
Manchester M60 1QD, UK
*Corresponding author
Abstract
The paper describes an experimental determination of impedance spectroscopy derived
resistance measurements to record water transport in lime-masonry systems. It strongly
supports the use of Sharp Front theory and Boltzmann’s distribution law of statistical
thermodynamics to corroborate the data obtained. A novel approach is presented for the
application of impedance measurements to the water transport between freshly mixed
mortars and clay brick substrates. Once placed, fresh mortar is dewatered by brick and
during this time the volume fraction water content of the mortar is reduced. An equation
is derived relating this change in water content to the bulk resistance of the mortar.
Experimental measurements on hydraulic lime mortars placed in contact with brick
prisms confirm the theoretical predictions. Further, the results indicate the time at which
dewatering of a mortar bed of given depth is completed. The technique has then potential
to be applied for in situ monitoring of dewatering as a means of giving insight into the
associated changes in mechanical and chemical properties.
Key words: Impedance spectroscopy, Boltzmann’s distribution law, water transport
1

1. Introduction
When a freshly mixed mortar in the form of render or jointing mortar is applied to an
absorbent substrate such as clay brick, water is abstracted from the wet mix by the
capillary suction of the substrate. This process has important implications for the
subsequent strength development and engineering properties of the material [1,2]. The
extent to which water is removed from the wet mix depends on both the sorptivity of the
substrate and the water retaining ability (desorptivity) of the mortar [3,4]. This initial
dewatering prior to setting is likely to have a significant influence on the long term
durability of the mortar in terms of its mechanical strength and its resistance to
environmental degradation and frost damage. The ability to monitor dewatering non-
destructively is therefore of great importance in providing an insight to the long term
performance of these materials.
The application of NHL mortars in the conservation, restoration, renovation and new
build sectors of construction is growing rapidly. As their name implies NHLs set by
reacting with water in a similar manner to cements. Compared with Portland cement
NHL's have lower strength but provide for greater movement [5]. This and a number of
other desirable properties make them better suited in many applications [6-8]. In the
present study natural hydraulic lime (NHL) mortars in the freshly mixed state were
investigated after placing on initially dry clay common facing brick.
This paper reports the use of impedance spectroscopy to monitor the dewatering of
mortars prior to the early stages of the setting process. Phase angle measurements were
taken over a range of frequencies and complex plane plots of imaginary versus real
impedance were interpreted in terms of equivalent circuit parameters.
The application of impedance spectroscopy to cementitious materials has been developed
by McCarter, among others [9-13]. Previous work in this area has concentrated on the
use of impedance spectroscopy to study hydraulic or pozzolanic reactions during setting.
2

Recent work by Ball et. al. investigating physio-chemical processes in lime-based
composites demonstrated that impedance spectroscopy can track a carbonation front in
natural hydraulic lime mortar using an electrode array [14].
These studies have allowed a number of fundamental properties to be linked to the
impedance response of a cementitious material in the set and hardened state. Such
properties include pore water content, pore water ionic concentration, and porosity and
tortuosity of the pore network. The following can be deduced from the literature on
resistivity measurments in hardened cement mortars [13]:
• Resistivity decreases with the amount of evaporable water in the cement paste.
• Resistivity decreases with the concentration of mobile ions in the pore fluid.
• Resistivity is influenced by the connectivity (or tortuosity) of the pore network.
The impedance behaviour of hydraulic lime mortars in the freshly mixed state however
has not as yet been investigated although alkali activated slag binders (from 15 minutes
after mixing) and cement has not as yet been studied [11]. Results from these studies
attribute changes in conductance during the first hour after mixing to an increase in ionic
concentration following dissolution of soluble species from the binder into the mix water.
Portland cement based binders showed changes in conductivity during the first hour
followed by a dormant period lasting approximately 9 hours. A large change following
this dormant period signified intense chemical activity due to hydration reactions [13]
There are few reports in the literature addressing the application of impedance
measurements to monitor changes occurring in freshly mixed wet mortars following
placement in contact with absorbent substrates. This may be a reflection of the
experimental difficulties involved in the measurement of relatively thin layers of mortar,
or that this early dewatering has been completely overlooked. It has been found [15] that
between 40 and 60 % by volume of the mix water is abstracted from freshly mixed lime
under the capillary pressure of dry clay brick. On site, bricks and other masonry units
3

will not be oven dry and so will abstract less. Nevertheless this dewatering has a
significant effect on mortar strength [1] and probably on durability.
The relationship between saturation and electrical conductivity in porous media has been
investigated by Hunt, for unsaturated systems, using an Archie’s law approach [16]. He
applied a continuum percolation theory to previously published data representing the full
range of saturation. This included data obtained from sandstone, fine sandy loam, soil
(consisting various ratios of sand and clay), and various types of sand. The analysis
demonstrated the ability to provide good predictions and was robust in respect to
secondary effects such as residual salinity and contact resistance. The correlation
between electrical resistivity and soil-water content using artificial intelligence
techniques has been investigated by Ozcep and co-workers [17, 18]
Water content estimation by electrical measurement of soils offers new opportunities in
geotechnical and agricultural studies. Techniques including time domain reflectometry
[19, 20], high-frequency capacitance sensing [21] and resistivity cone penetration testing
[22] have been applied. A useful theoretical approach to the dewatering of mortars, and
slurries in general, is offered by a Sharp Front model which has its origins in soil science
[3]. In this model it is assumed that a wetting front of uniform water content moves into
the absorbent substrate from the wet mix and that there is a sharp boundary between the
wetted and the dry regions. As dewatering proceeds, a filter cake of higher volume
fraction solids content than the original mortar mix forms at the interface with the
substrate. This interface progresses through the slurry until all the mortar has been
converted to filter cake. This model is shown diagrammatically in Figure 2(b), discussed
later.
2. Theory
The Sharp Front model developed by Hall and Hoff [3] describes the relationship
between the sorptivity, S, of the substrate, the desorptivity, R, of the wet mix (in this case
4

freshly-mixed mortar) and the transfer sorptivity, A, between the wet mix and substrate
by
1 1 1 = + 1
A2
R2
S 2
This relationship has recently been experimentally validated [23]. The withdrawal of
water from a wet mix by an initially dry substrate occurs by capillary action. As the wet
mix is dewatered a filter cake forms at the boundary between the wet mix and substrate.
As dewatering proceeds the filter cake increases in depth until all the wet mix has been
converted to cake. The application of Darcy’s law to the filter cake yields
di Ψ i αΨ i = −K = −K 2 c c dt L β c i
where i is the cumulative volume of water desorbed per unit area of wet mix in contact
with the substrate, t the elapsed time, Kc the saturated permeability of the filter cake, Ψi
the capillary potential of the substrate, Lc the depth of the filter cake and α and β are
constants defined by the volume fraction water and solids contents of the wet mix and
filter cake respectively [16]. Integration of equation 2 with respect to time gives
1
2 Rt
1 12K Ψ αi 2
c 2i 3t= = β
where R is the desorptivity of the wet mix.
If the initial volume fraction of mix water is θ0, then the volume fraction,θ, at any time t
is given by
θ = θ − i A . 40 sub
5

where Asub is the area of wet mix in contact with substrate.
When a solid of charged surface is in contact with a liquid containing ions a double layer
is formed at the surface. This layer is comprised of a tightly bound layer of fairly
immobile ions adjacent to the solid and an oppositely charged ionic atmosphere [24]. The
potential energy of ion species dissolved in the mix water may be related to the number
of ions by Boltzmann’s distribution law of statistical thermodynamics [25] giving
−(Ei −E j )kT
N
i 5= exp
N j
where Ni and Nj are the numbers of constituent ions in states i and j and Ei and Ej are the
respective potential energies; k is Boltzmann’s constant and T the absolute temperature.
We suggest that when the mix water comes into contact with un-dissolved lime or sand
particles a double layer is formed at the solid surface. In practice this layer will be very
complex consisting of different ions, both positively and negatively charged. Tschapek
reports that in the presence of water quartz sands undergo hydroxylation and charging
instantaneously [26]. In the presence of water Si-O-Si bonds at the sand surface will
react to form 2Si-O -H
+ resulting in a negatively charged surface. Chemical compounds
originating from the lime will introduce ions such as Ca2+
, OH -
in addition to a range of
metal ions. For the purpose of this analysis we assume a simple system where state i
corresponds to ions within the double layer, and state j to ions in the mix water bulk. The
development of a more complex analysis is beyond the scope of the current study.
Nielsen applies a similar approach to soil and expresses the difference in energy between
the two states by
Ei − E j = ze (ϕ i −ϕ j ) 6
where ϕi and ϕ j are the electrical potentials of states i and j, e the charge on the electron
and z the summary valence of the ions [27]. Combining equations 5 and 6 gives
6
N i − ze (ϕ i −ϕ j ) N j
= exp kT . 7
If the volume fraction water content of the wet mix is changed by dewatering and the
total surface area of solids is assumed to stay the same, then the total number of ions in
the water bulk will decrease while those in the double layer will remain constant.
Therefore the ratio Ni/Nj will be proportional to the volume fraction water content of the
mortar, θ. The electrical potential difference, (φi - φj), can be related to resistance, Rb by
ohm's law therefore allowing the general expression
θ = a exp (− bR b ) 8
to be derived where a and b are empirical constants. Constant b is a function of z, T,
electrical current and sample geometry. Values of a and b are discussed in the results and
discussion section. Equation 8 shows that the volume fraction water content is directly
proportional to the function exp(-bRb) and that bulk resistance should increase as the
water content of the mix decreases. Substitution of equations 3 and 8 into equation 4
gives
1
a exp (− bR b ) = θ 0 − Rt 2 Asub 9
which can be rearranged to give
1A R θ
exp (− bRb ) = − sub t 2 + 0 10 a a
Equation 10 can be used to produce a plot of the function exp (− bR b ) versus t1/2
. Figure
1 shows such a plot over 49 min, together with experimentally determined values of Rb
also plotted against t1/2
, from which can be seen that Rb is a curve increasing with
7

increase in t1/2
and that exp (− bR b ) decreases linearly with increase in t1/2
. The values
typically found in practice are taken as Asub = 6.25x10⁻⁴
m2
and R = 4.82 mm.min -1/2
[15]. The value of θ0 used to generate the exponential function was 0.036. The
-3 -3 numerical values used for constants a and b were 44.6x10 and 2.5x10 respectively.
Sharp Front theory predicts that the water abstracted from the wet mix by the absorbent
substrate is linear with t1/2
. The theory described above predicts that the function
exp (− bR b ) should also be linear with t1/2
during dewatering.
3. Experimental Method
3.1 Mortar preparation
Natural hydraulic limes of classification 2, 3.5 and 5 supplied by Hanson Cement Ltd,
Clitheroe, UK were used. Mortars were prepared with pre-dried concreting sand
consisting of a single source (Croxden) sand having 98.9% of particles < 1.18 mm. The
masses of lime and sand needed to produce the required mix proportions by volume were
calculated from values of density. To ensure consistency, a standard mixing regime was
followed. The lime and sand were mixed by hand for several minutes. The required
quantity of water was then added and mixing was continued by hand for a further ten
minutes until the constituents were intimately combined. A constant proportion of 1:2
lime:sand by volume was used. Mortar mixes were prepared with water:lime 0.78:1,
0.89:1 and 1:1 by volume.
3.2 Sorptivity
The absorbent substrate material used to dewater the mortars was pressed clay facing
brick. The method used to measure the sorptivity S is fully described by Hall and Tse
[28]. Individual bricks from the same batch showed considerable variation in sorbtivity.
8

Samples cut from the same brick exhibited the similar variation. For this reason prisms
of square cross section 25 mm were cut parallel to the stretcher face. The prisms were
dried to constant weight at 105 oC. The sorptivity of each prism was measured by
placing the end face in contact with a shallow layer of water and removing and weighing
at intervals. Sorptivity was determined from the gradient of a graph of the cumulative
absorbed volume of water per unit area versus t1/2
. The sections were then re-dried for
mortar placement and impedance measurement. The depth of bed used in the
experimental work for each brick prism was sufficient to completely dewater the 45 mm
deep mortar.
3.3 Determination of bulk resistance
A test cell consisting of a rectangular plastic container of identical cross sectional area to
the brick prism was attached to one end of the prism with adhesive tape. The test cell
contained two stainless steel rectangular electrodes each 25 mm in width and 30 mm in
height a distance 25 mm apart, as shown in figure 2(a). This gave an electrode area of
2625 mm . These electrodes were arranged to be 15 mm above the prism face. Mortar
was then placed immediately after mixing into the container to a total depth of 45 mm in
several stages, tamping after each addition. Figure 2(b) shows a schematic of the test
cell arrangement and illustrates the Sharp Front analysis already described.
The impedance of the mortar was monitored using a Solartron 1260 impedance analyser,
in stand-alone mode, over the frequency range 10 MHz to 100 Hz at a potential of 100
mV. The time taken for the analyser to complete each sweep was approximately 70
seconds. Sweeps were repeated continuously for 200 minutes. The nulling procedure
described in [13] was used to reduce the electrical contributions from the leads and
sample holder.
4. Results and Discussion
9

Typical complex plane impedance data (corrected using the nulling procedure) of NHL5
mortar of composition 1:2:0.78 lime:sand:water at 10, 20, 30 and 60 minutes after placing
on the brick prism are given in Figure 3(a). Such plots are interpreted as two arcs the
intersection of which on the real impedance axis gives the bulk resistance, Rb, here 170,
233, 270 and 310 Ω respectively. Figure 3(b) shows a plot over an idealised frequency
range. The associated equivalent circuit inset shows the model of a resistor and capacitor
in parallel associated with each arc. The lower frequency arc on the right hand side is
due to the electrode response and the higher frequency arc on left hand side is due to the
mortar. For the measurements reported here this intersection occurred at a frequency of
251 kHz and did not change significantly with time. Hence a value for the bulk
resistance of the mortar between the electrodes was taken as the real impedance at 251
kHz. Despite the nulling procedure the left hand side semicircles (associated with the
mortar) are extremely depressed probably due to some electrical response of the leads.
Figure 4 compares the variation in bulk resistance with the square root of time from
placing freshly mixed NHL5 mortar of composition 1:2:0.78 lime:sand:water both on
absorbent brick substrate and on non-absorbent polymer sheet over 2.8 hours (13 min1/2
).
No significant change in bulk resistance for the mortar on the polymer sheet is seen over
this time. Bulk resistance was constant at 118 +/- 4 Ω. In contrast mortar placed on
absorbent brick shows a distinct change in bulk resistance with time. After
approximately 30 minutes the rate of increase in bulk resistance decreases. Within this
time the absorbent substrate has abstracted some of the mix water and we suggest here
that the change in ion concentrations of the remaining solution is reflected in the value of
the bulk resistance.
The previously derived function exp (− bR b ) is plotted against the square root of time
from placing freshly mixed mortar on brick prisms. The value 0.1 was taken for constant
b in order to give values of the function exp (− bR b ) between zero and one. Figure 5 is a
plot of exp (− bR b ) versus square root of time since placing NHL2 mortars of water:lime
proportions 0.78:1, 0.89:1 and 1:1 and shows the effect of increasing the volume of mix
water. Figure 6 shows the same function plotted against the square root of time for the
10
range of hydrolocity mortars examined, all of mix proportion 0.78:1:2 water:lime:sand.
Small variations in sorptivity were found between prisms cut from the same brick and the
sorptivity values are given in the figure captions. These variations are likely to have
some small influence, which is illustrated by comparing the experimental results for
NHL2 mortar (of mix proportion 0.78:1:2) in Figure 5 with that in Figure 7 (lower line)
where substrate sorptivity differs by 0.04 mm.min1/2
. Larger variations in sorptivity do
significantly alter dewatering and this effect is shown in Figure 7, which presents a
similar plot to those of figures 5 and 6, for NHL2 mortar of 0.78:1:2 water:lime:sand mix
proportion on brick prisms of widely different sorptivity.
Each of the figure 5 - 7 shows a smooth curve between two linear regions. For each
linear portion the correlation coefficient was at least 0.99. We suggest that the initial
linear portion corresponds to dewatering and the second linear portion, the gradient of
which is very much smaller, corresponds to the time over which the mortar is no longer
losing water to the substrate but during which the concentrations of ion species are
changing due to hydration reactions. Hence this gradient is smaller but not zero.
Boltzmann’s law has previously been applied to mortars to derive a relationship between
water content and measured resistivity [29]. Here the constant a is used to represent the
influence of water retention on the electrical properties and may be dependent on
physical properties which alter this water retention, such as specific surface area, porosity
and tortuosity. The constant b is related to the chemical properties of pore water solution,
such as ionic concentration and the charge on ions in solution. Since the nature and
magnitude of the forces influencing water retention vary considerably for different water
contents, values of a and b may well change with volume fraction of water. It is assumed
here that a and b are constant within a certain volume fraction water content but may vary
between thin films and bulk solution. In the context of a lime mortar dewatering on a
brick substrate the fresh mix is of high volume fraction water content, in this work
between 0.2 and 0.25. The dewatered mortar is of lower volume fraction water (and
hence higher volume fraction solids) content and may contain a proportion of air. As the
11

mortar is changing from freshly placed to fully dewatered, changes in a or b may
influence the gradient when exp (− bR b ) is plotted versus t ½
as in Figures 5, 6 and 7.
For the purpose of this study the point at which the extrapolated portions of the two linear
sections intersect has been taken as the time at which dewatering is complete i.e. when all
fresh mix has been converted to filter cake (in the terminology of Figure 2b). It is
proposed that the time at which the change in gradient occurs indicates the end of
dewatering for the 45 mm depth of mortar. In support of this Table 1 gives the values of
desorptivity determined from pressure cell measurements, where these are available, for
the identical NHL mortar [15]. Values of the brick sorptivity measured in this study and
values of transfer sorptivity between the mortar and the brick prism were calculated using
equation 1. Minor variations in sorptivity have a small effect on the transfer sorptivity.
Values of time to dewater the 45 mm mortar bed can be calculated from Sharp Front
theory using these values of transfer sorptivity and the approach described in [30] and are
also given in Table 1 with the time to dewater obtained from the extrapolated linear
regions of Figures 5, 6 and 7. The purpose of this table is not to demonstrate exact
correspondence between the calculated and measured times to dewater but to present
support for the proposal that the impedance method is indeed detecting the end of the
dewatering process. Both calculated and measured times to dewater are of similar
magnitude and the trend is the same when the hydraulicity of the lime increases, giving
confidence that the measurements of bulk resistance do detect the time at which
dewatering is complete.
The results presented here showing the effects of proportion of mix water, hydraulicity of
lime and sorptivity of substrate on the time to dewater 45 mm bed of mortar correspond
with those obtained from transfer sorptivity measurements made by experimental
determination of mass and volume on 20 mm depth of mortar [30]. In summary the time
to dewater, decreases with increasing hydraulicity of lime, decreases with increased
proportion of mix water and decreases when increase in substrate sorptivity is large.
12

Using the experimental technique described here, and the exponential function derived in
the theory section, it is therefore possible to determine the time to dewater a freshly
mixed and placed mortar in situ, provided there is adequate depth of absorbing substrate.
5. Conclusions
The results demonstrate the use of bulk resistance as a non destructive tool for monitoring
changes in freshly mixed hydraulic lime materials placed on absorbent substrates. The
results presented show a linear relationship between an exponential function of resistivity
and the square root of elapsed time since placing. Predictions based on Sharp Front
theory have been experimentally validated. It is suggested that the two linear regions
observed in plots of this exponential function correspond to a transition between
dewatering of the fresh mix under the influence of the capillary pressure of the substrate
and water consumption by hydration reactions. It is also suggested that the time between
the two linear regions represents the end of dewatering. The results demonstrate the
capability of impedance to determine bulk resistance and to relate this directly to changes
in volume fraction water content of mortars, and potentially to the dewatering of slurries
in general.
During dewatering of mortars in the freshly mixed state significant changes in both
volume fraction water content and particle packing of binder and sand occur within a
relatively short time period. We suggest that this dewatering process and subsequent
consolidation of the dewatered mortar are crucial to the development of both short and
long term properties.
Acknowledgements
The authors acknowledge financial support from EPSRC and Hanson Cement Ltd,
Clitheroe, UK, for the supply of materials.
Glossary of terms
13

i
S sorptivity
R desorptivity
A transfer sorptivity
cumulative volume of water desorbed per unit area of wet mix
t time
Kc saturated permeability
Ψi capillary potential
Lc depth of filter cake
Asub. area of fresh mix in contact with absorbent substrate
θ 0 initial volume fraction water in the mix
θ volume fraction of water in the filter cake at time t
Ni and Nj numbers of constituent ions i and j
Ei and Ej energies of states i and j.
-23 -1k Boltzmann’s constant (1.38041 x 10 JK )
T absolute temperature.
ϕ electrical potential
e the electronic charge
z summary valence of the mobile ions in solution
ρ electrical resistivity
a and b empirical constants
Rb resistance
9. References
[1] A. El-Turki, R. J. Ball, M. A. Carter, M. A. Wilson, C. Ince and G. C. Allen, Effect of
dewatering on the strength of lime and Cement Mortars, J. Am. Ceram. Soc. 93 7 20-74
2081 (2010)
[2] R. J. Ball, A. El-Turki and G. C. Allen, Influence of carbonation on the load
dependent deformation of hydraulic lime mortars. Materials Science and Engineering A,
528 (7-8), 3193-3199 (2011)
14
[3] C. Hall and W. D. Hoff, Water Transport in Brick and Concrete, Spon Press, 29-56,
2002.
[4] C. Ince, M. A. Carter, M. A. Wilson, N. C. Collier, A. El-Turki, R. J. Ball and G. C.
Allen, Factors affecting the water retaining characteristics of lime and cement mortars in
the freshly-mixed state, Materials and Structures, 44 2 509-516 (2011)
[5] R. J. Ball, A. El-Turki, G. C. Allen,. Influence of carbonation on the load dependent
deformation of hydraulic lime mortars, Materials Science and Engineering A, 528 7-8
3193-3199 (2011)
[6] G. C. Allen, J. Allen, N. Elton, M. Farey, S. Holmes, P. Livesey and M. Radonjic,
Hydraulic Lime Mortar for Stone, Brick and Block Masonry, Donhead, 2003.
[7] R. J. Ball, A. El-Turki, J. Allen, G. C. Allen, The stress cycling of hydraulic lime
mortars, Const. Mat. Proc. Inst. Civil Eng., 2, 67-53 (2007).
[8] A. El-Turki, R. J. Ball, G. C. Allen, The influence of relative humidity on structural
and chemical changes during carbonation of hydraulic lime, Cem. Con. Res. 37, 1233
1240 (2007).
[9] W. J. McCarter, S. Garvin and N. Bouzid, Impedance measurements on cement
pastes. J. Mat. Sci. Lett., 7, 1056-7 (1988).
[10] W. J. McCarter and R. Brousseau, The AC response of a hardened cement paste.
Cem. Concr. Res., 20, [6] 891-900 (1990).
[11] W. J. McCarter, T. M. Chrisp and G. Starrs, The early hydration of alkali activated
slag: developments in monitoring techniques, Cem. Concr. Comp., 21, 277-283 (1999).
15
[12] W. J. McCarter, G. Starrs, G. and T. M. Chrisp, Electrical monitoring methods in
cement science. Structure and Performance of Cements, J. Benstead and P. Barnes (Eds),
SPON, London, 2002.
[13] B. J. Christensen, R. T. Coverdale, R. A. Olson, S. J. Ford, E. J. Garboczi, H. M.
Jennings and T. Mason, Impedance Spectroscopy of Hydrating Cement-Based Materials:
Measurement, Interpretation, and Application, J. Am. Ceram. Soc., 77, [11] 2789-804
(1994)
[14] R. J. Ball, G. C. Allen, G. Starrs and W. J. McCarter, Forthcoming. Impedance
spectroscopy measurements to study physio-chemical processes in lime-based
composites. Applied Physics A Materials Science & Processing (2011) DOI:
10.1007/s00339-011-6509-7
[15] C. Ince, Water transport kinetics in mortar-masonry systems, PhD Thesis, 2009,
University of Manchester.
[16] R. P. Ewing, A. G. Hunt, Dependence of the Electrical Conductivity on Saturation in
Real Porous Media, Vados Zone Journal, Soil Science Society of America, 5, 731-741
(2006)
[17] F.Ozcep, O. Tezel, M. Asci, Correlation between Electrical Resistivity and Soil-
Water Content: Istanbul and Golcuk, International Journal of Physical Sciences, 4 (6)
362-365 (2009)
[18] F.Ozcep, E. Yıldırım, O. Tezel, M. Asci, S. Karabulut, , Correlation between
Electrical Resistivity and Soil-Water Content based Artificial Intelligent Techniques,
International Journal of Physical Sciences, Vol. 5 (1), pp. 047 – 056 (2010)
[19] S.I. Siddiqui and V.P. Drnevich, A new method of measuring density and
16

moisture content of soil using the technique of time domain reflectometry: Final report.
West Lafayette, In: Purdue University (1995).
[20] X. Yu, and V.P. Drnevich,. Soil water content and dry density by time domain
reflectometry. Journal of Geotechnical and Geoenvironmental Engineering, 130 (9) 922
934 (2004)
[21] C. M. K. Gardaner, T. J. Dean and J. D. Cooper, Soil water content measurement
with a high-frequency capacitance sensor. Journal of Agricultural Engineering Research.
71 (4), 395-403 (1998)
[22] G.J. Cai S.Y. Liu, L.Y. Tong, G.Y. Du. Resistivity cone penetration test technique
and data interpretation, Chinese Journal of Rock Mechanics and Engineering, 26 (supp1)
3127-3133 (2007)
[23] N. C. Collier, M. A. Wilson, M. A. Carter, W. D. Hoff, C. Hall, R. J. Ball, A. El-
Turki and G. C. Allen, Theoretical development and validation of a Sharp Front model of
the dewatering of a slurry by an absorbent substrate, J. Phys. D: Appl. Phys., 40, 4049
4054 (2007).
[24] S. S. Dukhin and B. V. Derjaguin, Electrokinetic Phenomena, J. Wiley and Sons,
1974.
[25] R. M. Besanson, (Ed.). The Encyclopedia of Physics. Van Norstrand Reinhold
Comp. NY, 1974.
[26] M. Tschapek and S. Falasca, Water retention by disperse hydrophilic materials as
affected by surface tension, Powder Technology, 48, [3] 1986, 223-226.
[27] D. R. Nielsen, J. W. Jackson, J.W. Cary, and D.D. Evans (Ed.). Soil water. ASA
(American Society of Agronomy), SSSA (Soil Science Society of America), 677 South
17
Segoe Road, Madison, Wisconsin, 53711, Chapter 6. Isothermal flow of aqueous
solutions, p135, 1972.
[28] C. Hall, T. T. Kam-Ming, Water movement in porous building materials—VII. The
sorptivity of mortars, Build. and Environ., 21, [2] 1986, 113-118.
[29] R. J. Ball and G. C. Allen, The measurement of water transport in porous materials
using impedance spectroscopy, J. Phys. D: Appl. Phys., 43, (2010), 105503,
doi:10.1088/0022-3727/43/10/105503.
[30] C. Ince, M. A. Carter, M. A. Wilson , A. El-Turki, R. J. Ball, G. C. Allen and N. C.
Collier Analysis of the abstraction of water from freshly mixed jointing mortars in
masonry construction, Mater. and Struct. (2009) DOI 10.1617/s11527-009-9560-5.
18

Table 1. Measured and calculated water transport parameters.
Lime
Mix proportions
by volume
(water:lime:sand)
Desorptivity
(mm.min1/2
) at
0.05 MPa from
[15]
Sorptivity of
brick
(mm.min1/2
)
Transfer
sorptivity
(mm.min1/2
)
Time to
dewater 45
mm (min)
[Calculated]
Intercept of
linear region
(min1/2
)
Time to
dewater 45
mm (min)
[Measured]
NHL2 0.78:1:2 1.33 2.27 1.15 55.3 6.66 (Fig 5) 44.3
NHL2 0.89:1:2 - 2.35 - 6.81 (Fig 5) 46.4
NHL2 1:1:2 - 2.38 - 6.96 (Fig 5) 48.5
NHL2 0.78:1:2 1.33 2.27 1.15 55.3 6.66 (Fig 5,6) 44.3
NHL3.5 0.78:1:2 - 2.21 - 6.44 (Fig 6) 42.0
NHL5 0.78:1:2 1.65 2.63 1.40 37.3 5.88 (Fig 6) 35.0
NHL2 0.78:1:2 1.33 1.64 1.03 65.0 7.31 (Fig 7) 53
NHL2 0.78:1:2 1.33 2.31 1.15 55.3 6.78 (Fig 7) 45.9
19

Figure 1. The function exp (-b Rb) from equation 10 (solid line) versus t1/2
time and bulk
resistance Rb (dashed line) versus t1/2
.
20

Figure 2. (a) Schematic diagram showing test cell, electrodes and brick prism. (b) Sharp
front model of dewatering of mortar. Taken from R. J. Ball and G. C. Allen, J. Phys. D:
(2010) [17].
21

Figure 3. (a) Complex plane plots obtained at 10, 20, 30 and 60 minutes after placing
NHL5 mortar on brick prisms. (b) Idealised plot. Frequency range 2.5 MHz to 0.1 kHz.
(Real impedance, Z’, imaginary impedance Z’’)
22

Figure 4. Variation in bulk resistance with t1/2
for NHL5 mortar placed on a clay brick
substrate (upper line) and a non-absorbent substrate (lower line).
23

Figure 5. Exp(-b Rb) versus t1/2
for NHL2 mortars prepared with water:lime proportions
0.78:1, 0.89:1 and 1:1, dewatered on clay brick prisms of sorptivity of 2.27, 2.35 and 2.38
0.5 mm.min respectively. (0.78:1 data are also presented in Figure 6)
24

Figure 6. Exp (-b Rb) versus t1/2
for NHL2, NHL3.5 and NHL5 mortars of composition
1:2:0.78 lime:sand:water dewatered on clay brick prisms. Brick sorptivity 2.27, 2.21, and
0.5 2.63 mm.min respectively.
25
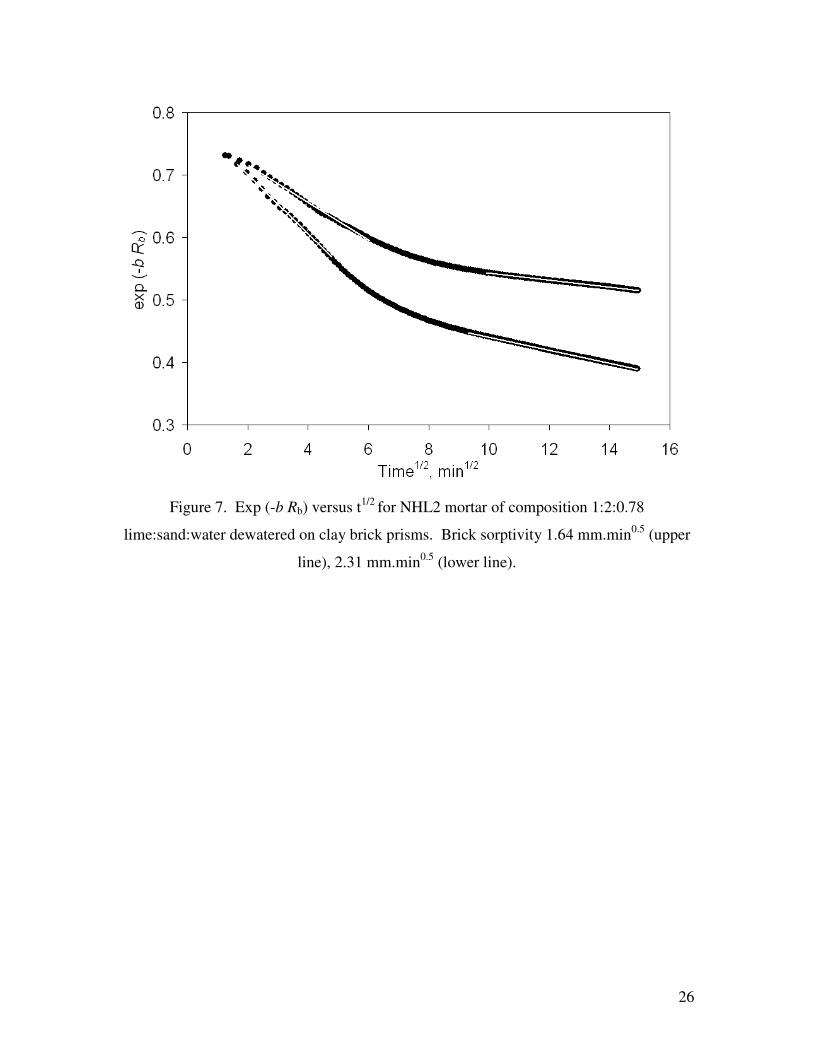
Figure 7. Exp (-b Rb) versus t1/2
for NHL2 mortar of composition 1:2:0.78
0.5 lime:sand:water dewatered on clay brick prisms. Brick sorptivity 1.64 mm.min (upper
0.5 line), 2.31 mm.min (lower line).
26