Embed Size (px)
Citation preview
Solar & Wind 7k,~hm,loqi Vol. 7. No. 4, pp. 47~ 480. 1990 0741 98tX,90 $300+.00 Printed in Great Britain. Pergamon Press plc
D A T A B A N K
The applicability of hourly solar radiation models to Amman, Jordan
M . A . ALSAAD
Department of Mcchanical Engineering, Faculty of Engineering and Technology, University of Jordan, Amman, Jordan
( Reeeit'ed 8 June 1989 : accepted 5 Septemher 1989 )
Abs t rae t~Hour ly and daily global and diffuse solar radiation data measured on a horizontal surface during the period 1983 1987 for Amman, Jordan are studied and analyzed. The observed ratios between monthly mean hourly to daily global and diffuse radiation are determined. The applicability of various radiation models for the estimation of hourly global and diffuse radiation from daily values of global and diffuse radiation, respectively, for A m m a n is tested against measured data. The normal distribution curve suggested by Jain [Solar Wind Teehnol. 5, 7 ( 1988)] is found suitable for predicting hourly global radiation for A m m a n and it has shown excellent agreement with the observed values amongst all other models used. The classical equation of Liu and Jordan [Solar Energy 4, 1 (1960)] produced satisfactory results of hourly diffuse radiation which are much closer to the observed values as compared to that obtained using other suggested models. Comparison between results obtained using various radiation models is made by calculating the root mean squared error, RMSE, for each model used.
I. I N T R O D U C T I O N
Hourly global and difl'usc solar radiation incident on a hori- zontal surthce are needed in many applications of solar energy and are considered important parameters l\~r per- formance calculations of any solar thermal system. There- fore, a complete study of the hourly solar radiation incident on any given locality such as Amman, Jordan (latitude : 32 N ; longitude : 36 E ; altitude : 980 m) is of great importance, The long term measured values of hourly global and diffuse radiation are available a! only one location in Jordan. In locations where hourly radiation measurements are not avail- able, theoretical estimates of the available solar energy have to be utilized. The problem of estimating hourly solar radi- ation incident on a horizontal surface has been studied by several authors [1 7]. Hourly global and diffuse radiation can be estimated from various models which have been developed by using the measured values at some locations.
Liu and Jordan [1] derived the following theoretical expression for evaluating the ratio of monthly mean hourly diffuse radiation to daily diffuse radialion on a horizontal surface at a given latitude :
COS CO--COS (0 , , , ) i1)
\Sin (o. --o), cos (o,/
where r: is the ratio between hourly to daily diffuse radiation. .) is the hour angle and m, is the sunset hour angle, in radians, given by the relation :
~,J~=cos i[ tan ~b tan c$] (2)
where q$ and 6 are the latitude and declination angles, respec- tively. Liu and Jordan tested the theoretical ratio given by eq. ( 1 ) for two widely separaled stations and found an excellent
agreement between observed ratios and those computed using cq. (I). Collares-Pereira and Rabl [3] have developed the following analytical expression for calculating the ratio of monthly mean hourly global radiation to daily global radiation, r,, :
COS (/)-- COS (t3~ ) r,, = (n :24)(a+h cos m) sin to,-t))i cos io, (3)
where :
a 0.4090+0.5016 sin (~,)~- 1.047) (4)
and:
h 0 .6609-0.4767 sin (e~,- 1.047). (5)
Equation (3) has been tested by lqbal [2] and he reported good agreemcnt. Garg and Garg [6] modified the classical equation of Liu and Jordan and suggested the following two formulas to calculate hourly diffuse and global radiation from daily sums of diffuse and global radiation, respectively, for four Indian stations :
Q COS tO -- COS fOI)/) r: = 1,t:24) sini;;, ~,:,C0S~; +0.01 sin3(~, ,-0.65) (6)
and
( cos ~o-cos ,,J, ~ r, = (n/24) : 7 ~,~ -0 .008 sin 3 ( ~ - 0 . 6 5 ) .
\ s in ~J,-(9, cos (J , /
(7)
Jain [7, 8] suggested the tk~llowing normal distribution curve for estimating the monthly mean values of the hourly to daily ratio of the global radiation as well as the diffuse
473
474 [) t l ta f lank
rad iat ion on a hor izonta l surface :
1 ( (i 12): ' I P(I) = , exp (S)
n x 2 n 2n ~ I"
The mean of the no rma l d is t r ibut ion curve is taken at solar noon and the unknown values of the pa ramete r o- arc obta ined for each m o n t h by equa t ing lhc observed r, and r, ratios with the co r re spond ing theoret ical values tit I 12. Once the a values for each m o n t h are known, eq. (8) is employed to yield lhe theoret ical xalues of r, and r / f o r any hotlr centered at the solar l ime I. Jain [8] also I'ound that the
c, ~.ahles can bc related to Ih¢ da), length. 5. . Ih iou~h ~l i inc:u cor re la lhm o f tile l'orm :
o o f /~ . '~ ' , i ~J i
where a and h arc constants . Equa t ion (9) can hc uncd Io obta in lhe values o f n for places v, here no lne~lsured ",,aIUcs o f tile hour ly i r rad ia t ion are avai lable.
The purpose o f the present work is to stud}, and ana]),/c the hourI',, measured solar rad ia t ion data m A m m a n I'or the period 1983 1987 and lo tcsi lhc appl icabi l i ty of the var ious models oiled above for est imat ing tile hour ly x alties o f global and diffuse radiat ion agah-IM nleasijred dclU.i.
1000
900
800
700
,=
6OO
o
500
o ~- 400
300
200
100
g l o b a l
. . . . . diffuse
O Jan.
• Feb. A Narch A A p r i l
[] Hay
I June
"-.~.
6 7 8 9 10 11 12 13 14 15 16 17
f o c a l Standard l ime
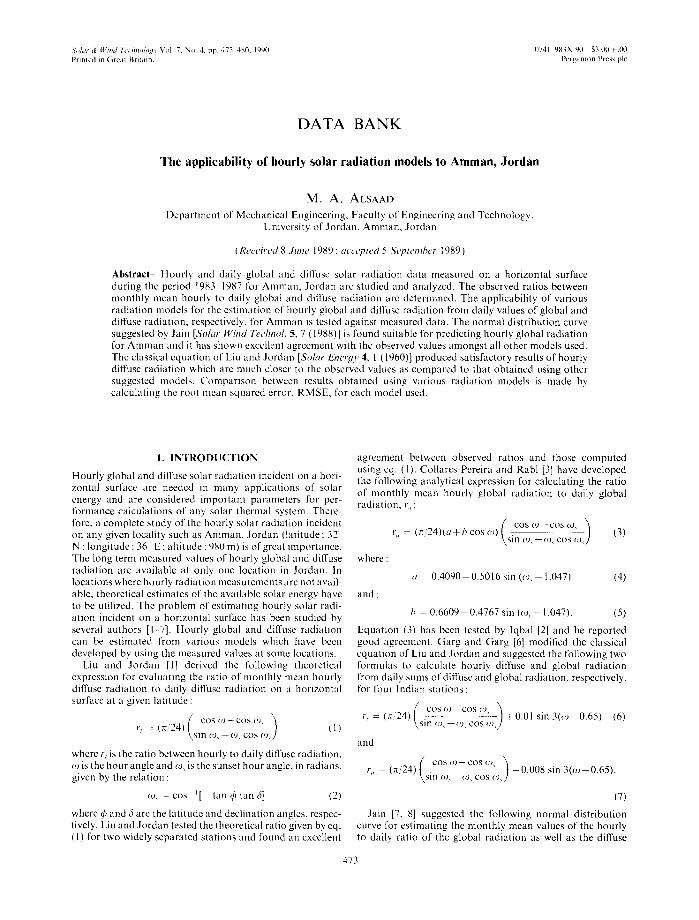
Fig. 1. Var ia t ion o f h o u r l y g l o b a l a n d diffuse rad ia t ion f o r t h e m o n t h s o f J a n u a r y June.
Data Bank 475
2. ANALYSIS
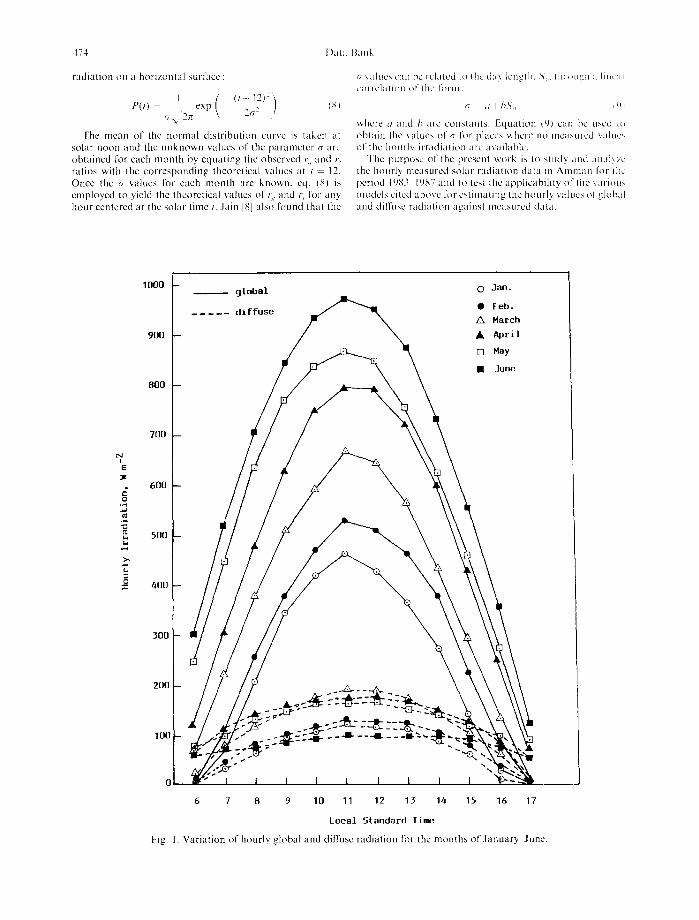
Hourly solar radiation data used to produce the results of the present work were obtained from the Solar Energy Center, Royal Scientific Society in Amman. The data obtained were recorded during the period 1983 1987. Hourly measured values of the global and diffuse radiation for the same hour of the day were added for each month. The sum was then divided by the number of the days in the month to yield the monthly average value for each hour of the day. The values thus obtained arc plotted in Figs 1 and 2 for all months of the year. Similarly, the monthly average daily
global and diffuse radiation were obtained lor each month of the year. The monthly mean values of hourly to daily global and diffuse radiation ratios, r,~ and r~, respectively were calculated for each hour from 5 a.na. to 6 p.m. It was observed that the values of each of the ratios r,, and r~ for the same number of hours before and after solar noon were nearly equal. The experimental data were further processed by find- ing the average ratios for the same hours from solar noon. The observed hourly to daily global and diffuse ratios are tabulated as shown in the first line of Tables 1 and 2, respec- tively. The observed ratios t), and r /arc plotted against the hours from sunrise to sunset and are shown by marked points
I !
1000 ~ ~ g l o b a l / I d i f f u s e
9 0 0
800
700
E
=. 6oo
500
o =:: 400
300
200
100
® Ju ly • Aug.
Sep.
• Oct .
Nov.
• Dec.
~ k
6 7 8 9 10 11 12 13 14 15 16 17
L o c a l S t a n d a r d l i m e
Fig. 2. Variation of hourly global and diffuse radiation for the months of July December.
476 l)ata Bank
"Fable 1. Comparison between observed (lirst line) and calculated ratio of houri 3 Io daily global radiation using (klrg alld Garg equation (second line). Colhu-es-Pereira equation (third line) and Jain model (Ik~urth line), respectively
Hours fronl solar noon Jan. Feb. Mar. Apr.
2~
3~
4'
5~
May .lane .hil~ Aug. Sept. Oct. Nov. l)cc. RMSE
0.155 0.147 0.14[ 0.132 0.120 0.119 0.121 0.126 0.13l 0.135 0. I52 0.150 0. I59 0.150 0.140 0.13I 0.124 I).121 0.123 0.128 0.136 0.150 0.156 0.162 0.006 0.162 0.153 0.142 0.133 0.126 0.123 0.125 0.130 0.138 I).153 (I.159 0.165 0.008 0.158 0.149 0.141 0.129 0.120 0.119 0.119 (I.125 0.131 0.138 0.155 (t.162 0.004
0.134 0.134 0.123 0.120 0.109 0.110 0.111 0.114 0.118 0.12{} (1. I30 0.132 0.143 0.136 0.128 0.123 0. l l 6 0. l l3 0.114 0.119 0.[26 0.136 0.14I 0.145 0.008 0.142 0.135 ().128 0. I21 0.117 0.114 0.115 0.120 0.126 0.135 0.140 0.144 0.008 0.134 0.129 0.124 0. I17 0.110 0,[09 0.109 0.113 0.117 0.122 0.132 0.137 0.002
0.100 0.109 0.095 0.[00 0.090 0.09I 0.093 0.094 0,093 (1.093 0.102 0.089 O. I l l 0.108 0.105 0.1(10 (I.t)97 0.(t95 0.096 (I.(199 0.1(13 0.108 0.110 0.112 0.010 t1. I07 0. I06 0.104 0.10[ 0.099 0.097 0.098 0.100 0.103 (I.1(16 0.107 0.108 0.009 0.097 0.097 0.096 0.094 0.091 0.091 0.091 0.093 0.094 0.095 t/.097 0.097 (I.005
0.051 0.063 0.065 0.072 0.066 I).069 0.071 0.067 0.062 0.053 0.040 0.037 0.068 0.071 0.074 0.074 0.073 0.073 0.073 0.074 0.074 0.071 0.069 0.067 0.015 0.064 0.068 0.073 0.(t75 0.075 0.076 0.076 0.(t75 0.074 0.068 0.066 0.063 0.014 0.060 0.072 0.066 0.(168 0.069 0.069 0.069 0.069 0.068 0.066 0.061 0.058 0.010
0.008 0.023 0.030 0.042 0.030 0.045 0.044 (}.040 0.028 0.021 0.003 0.004 0.020 0.032 0.041 0.046 0.049 0.050 0.050 0.048 0.043 0.032 0.024 0.017 0.012 0.021 0.031 0.040 0.046 0.050 0,052 0.051 0.048 0.042 0.031 0.024 0.018 0.012 0.021 0.034 0.040 0.044 0.047 0.048 0.048 0.046 0.041 0.036 0.031 0.019 0.013
0.004 0.012 0.(113 0.016 ().01~ 0.013 0.004 0.008 0.020 0.027 0.030 0.029 0.023 0.130 0.01 I 0,010 0.020 0.026 0.029 0.028 0.022 0.014 0.011 0.021 0.026 0.030 0.031 0.031 0.028 0.025 0.016
0.001 0.004 0.003 0.001 0.008 0.012 0,010 0.002 0.006 0.006 (t.()(19 0.007 0.001 0.004 0.014 0.017 0.018 0.018 0.015
6~
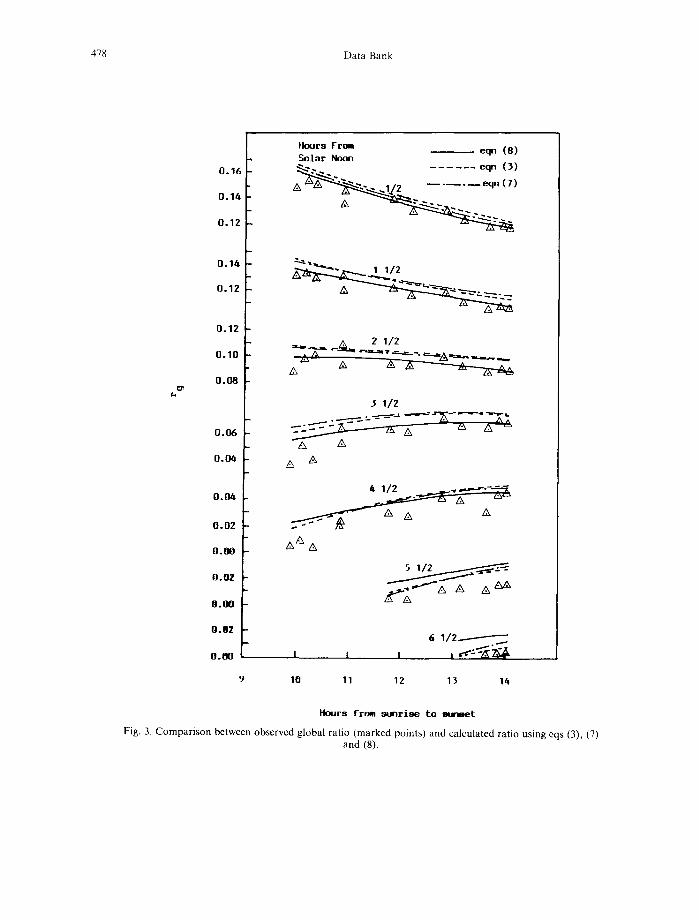
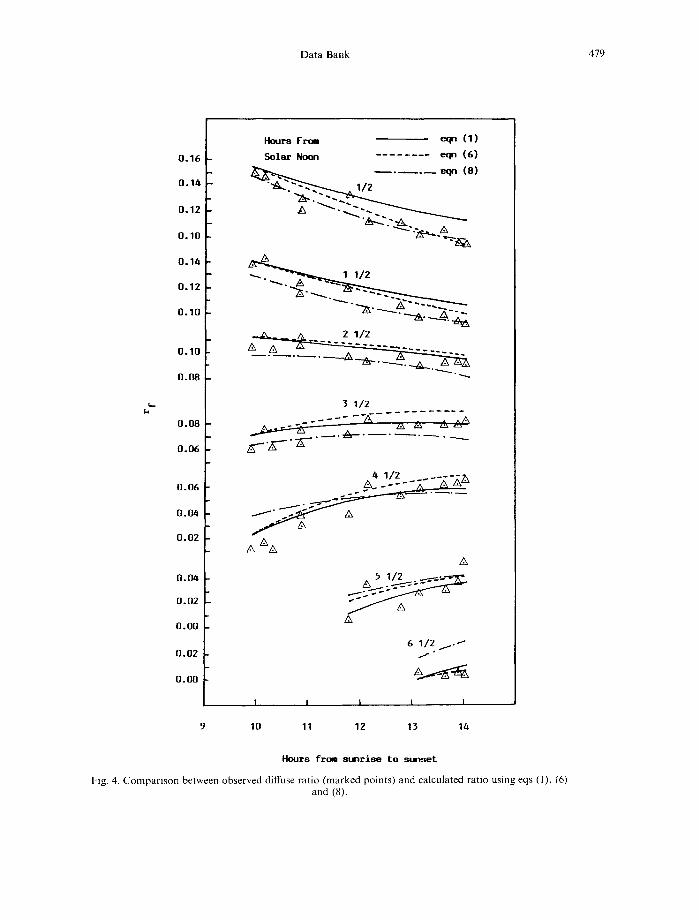
in Figs 3 and 4. respectively, with hours fronl solar noon as parameter.
Theoretical values of the ratio r,, arc calculated using eqs (3), (7) and (8), respectively while those of re are obtained by employing eqs (1), (6) and (8), respectively. The restlhs obtained are shown in Tables I and 2. The accuracy o[" the estimates was tested with respect to the observed ratios. The root mean squared error, RMSE. was computed for each hour from solar noon and the values obtained were used as a statistical method of comparison between the wlrious radiation models suggested in the above-cited equations.
3. RESULTS AND DISCUSSION
The hourly measured global and diffuse radiation for Amman were averaged over the period 1983 1987 and tire plotted against the local solar time, LST, for each of the 12 months as shown in Figs 1 and 2. The results presented in Figs 1 and 2 indicate that the pattern of variations of monthly mean hourly global radiation is similar for all months of the year. The maximum monthly mean hourly global radiation ranges between 970 W m -~ in the month of June and 450 W m 3 in December. These maximum and minimum values occur between I1:00 and 12:00 hours LST. On the other
hand, the maximun3 monthly mean hourly dill'use radiation ranges fron3 190 W m • in the month of March (and not in June or July) to 90 W in e in July (and not in December or Januar,,). It appears that special types of clouds in March have contributed to the diffuse radiation as some types of clouds are more scattering than others. Figures 1 and 2 also indicate that the relative decrease of the diffuse radiation away li-om solar noon is lower as compared to that of the global radiation. The absolute amounts of diffuse radiation for the middle six hours during the day do not change sig- nilicantly l'or most months of the year. The l\tct that the diffuse radiation remains approximately the same during inost months of the year while global radiation in summer months is about twice that in the winter season indicates the importance of clouds in converting the direct component of solar radiation into diffuse radiation.
"I'o evaluate the accuracy of the different radiation models cited in section I. the observed and the calculated values of the hourly global and diffuse ratios, r<; and ri, have been compared and are tabulated in Tables I and 2 and are pre- sented graphically in Figs 3 and 4. Table I shows that the observed global ratio for Amman varies between 0.001 and 0.155 throughout the year while Table 2 indicates thai the annual variation l~r the diffuse ratio is from 0.001 to 0.149.
Data Bank 477
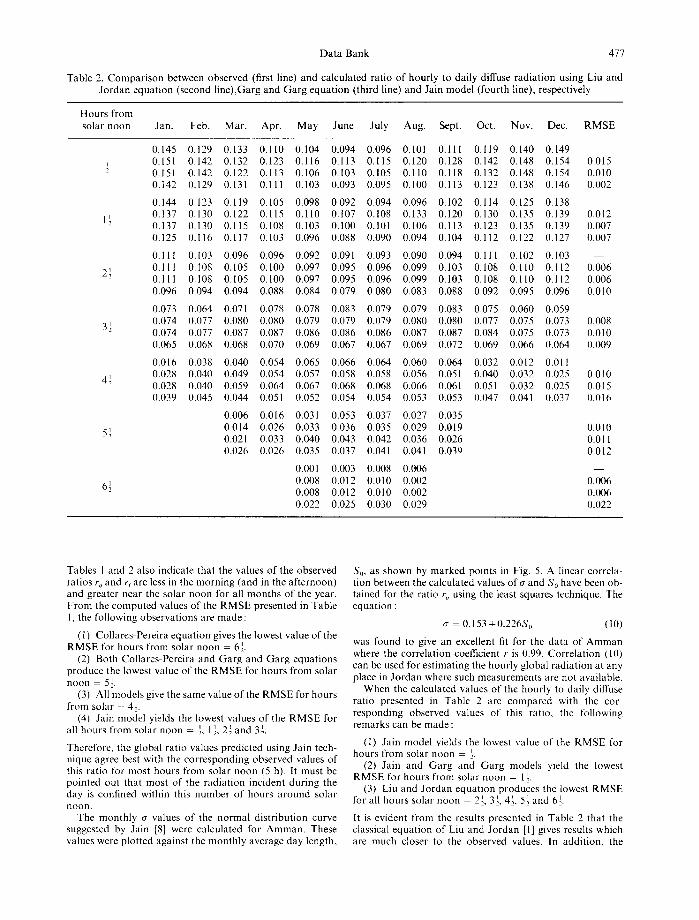
Table 2. Comparison between observed (first line) and calculated ratio of hourly to daily diffuse radiation using Liu and Jordan equation (second line),Garg and Garg equation (third line) and Jain model (fourth line), respectively
Hours from solar noon Jan. Feb. Mar. Apr. May June July Aug. Sept. Oct. Nov. Dec. RMSE
0.145 0.129 0.133 0.110 0.104 0.094 0.096 0.101 0.111 0.119 0.140 0.149 { 0.151 0.142 0.132 0.123 0.116 0.113 0.115 0.120 0.128 0.142 0.148 0.154 0.015 - 0.151 0.142 0.122 0.113 0.106 0.103 0.105 0.110 0.118 0.132 0.148 0.154 0.010
0.142 0.129 0.131 0.111 0.103 0.093 0.095 0.100 0.113 0.123 0.138 0.146 0.002
0.144 0.123 0.119 0.105 0.098 0.092 0.094 0.096 0.102 0.114 0.125 0.138 1{ 0.137 0.130 0.122 0.115 0.110 0.107 0.108 0.133 0.120 0.130 0.135 0.139 0.012
- 0.137 0.130 0.115 0.108 0.103 0.100 0.101 0.106 0.113 0.123 0.135 0.[39 0.007 0.125 0.116 0.117 0.103 0.096 0.088 0.090 0.094 0.104 0.112 0.122 0.127 0.007
0.111 0.103 0.096 0.096 0.092 0.091 0.093 0.090 0.094 0.111 0.102 0. I03 - - 2{ 0.111 0.108 0.105 0.100 0.097 0.095 0.096 0.099 0.103 0.108 0.110 0.112 0.006
0.111 0.108 0.105 0.100 0.097 0.095 0.096 0.099 0.103 0.108 0.110 0.112 0.006 0.096 0.094 0.094 0.088 0.084 0.079 0.080 0.083 0.088 0.092 0.095 0.096 0.010
0.073 0.064 0.071 0.078 0.078 0.083 0.079 0.079 0.083 0.075 0.060 0.059 3{ 0.074 0.077 0.080 0.080 0.079 0.079 0.079 0.080 0.080 0.077 0.075 0.073 0.008
- 0.074 0.077 0.087 0.087 0.086 0.086 0.086 0.087 0.087 0.084 0.075 0.073 0.010 0.065 0.068 0.068 0.070 0.069 0.067 0.067 0.069 0.072 0.069 0.066 0.064 0.009
0.016 0.038 0.040 0.054 0.065 0.066 0.064 0.060 0.064 0.032 0.012 0.011 4{ 0.028 0.040 0.049 0.054 0.057 0.058 0.058 0.056 0.051 0.040 0.032 0.025 0.010
- 0.028 0.040 0.059 0.064 0.067 0.068 0.068 0.066 0.061 0.051 0.032 0.025 0.015 0.039 0.045 0.044 0.051 0.052 0.054 0.054 0.053 0.053 0.047 0.041 0.037 0.016
0.006 0.016 0.031 0.053 0.037 0.027 0.035 5{ 0.014 0.026 0.033 0.036 0.035 0.029 0.019 0.010
- 0.021 0.033 0.040 0.043 0.042 0.036 0.026 0.011 0.026 0.026 0.035 0.037 0.041 0.041 0.039 0.012
0.001 0.003 0.008 0.006 6{ 0.008 0.012 0.010 0.002 0.006
- 0.008 0.012 0.010 0.002 0.006 0.022 0.025 0.030 0.029 0.022
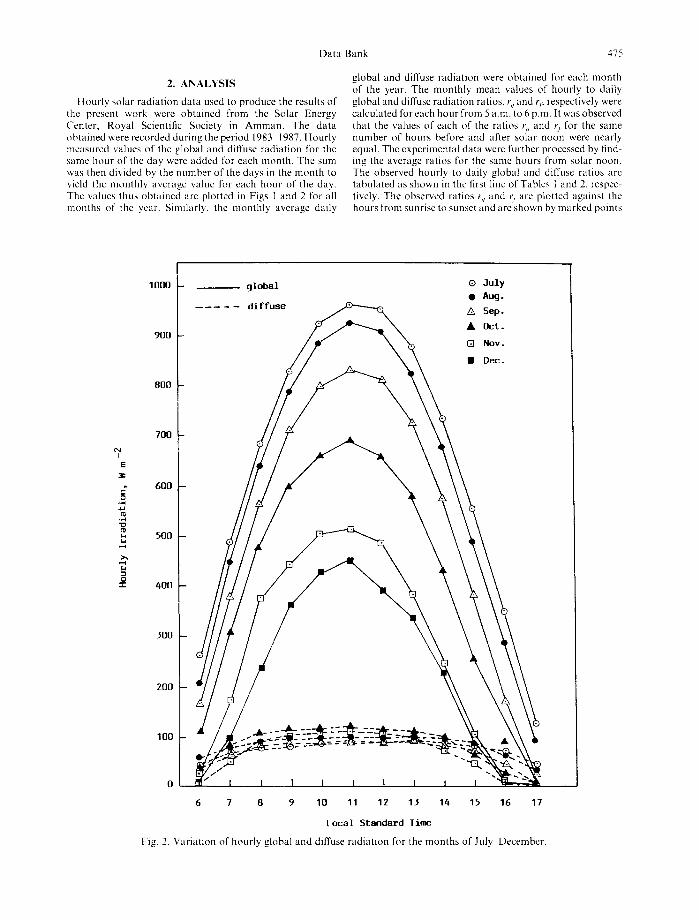
Tables I and 2 also indicate that the values of the observed ratios r, and r~ are less in the morning (and in the afternoon) and greater near the solar noon for all months of the year. From the computed values of the RMSE presented in Table 1, the following observations are made :
(l) Collares-Pereira equation gives the lowest value of the RMSE for hours from solar noon = 6~.
(2) Both Collares-Pereira and Garg and Garg equations produce the lowest value of the RMSE for hours from solar noon - 5;.
(3) All models give the same value of the RMSE for hours from solar - 4~.
(4) Jain model yields the lowest values of the RMSE for all hours from solar noon = ~, 1~, 2~ and 3~.
Therefore, the global ratio values predicted using Jain tech- nique agree best with the corresponding observed values of this ratio for most hours from solar noon (5 h). tt must be pointed out that most of the radiation incident during the day is confined within this number of hours around solar noon.
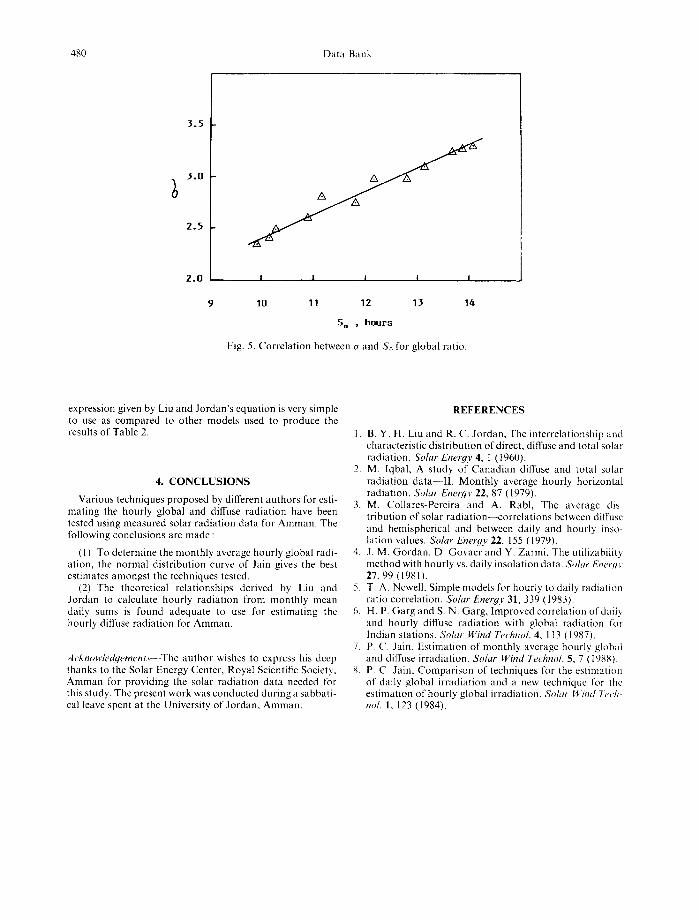
The monthly t~ values of the normal distribution curve suggested by Jain [8] were calculated for Amman. These values were plotted against the monthly average day length,
So, as shown by marked points in Fig. 5. A linear correla- tion between the calculated values ofc~ and So have been ob- tained for the ratio r~ using the least squares technique. The equation :
0.153 +0.226S0 (10)
was found to give an excellent fit for the data of Amman where the correlation coefficient r is 0.99. Correlation (10) can be used for estimating the hourly global radiation at any place in Jordan where such measurements are not available.
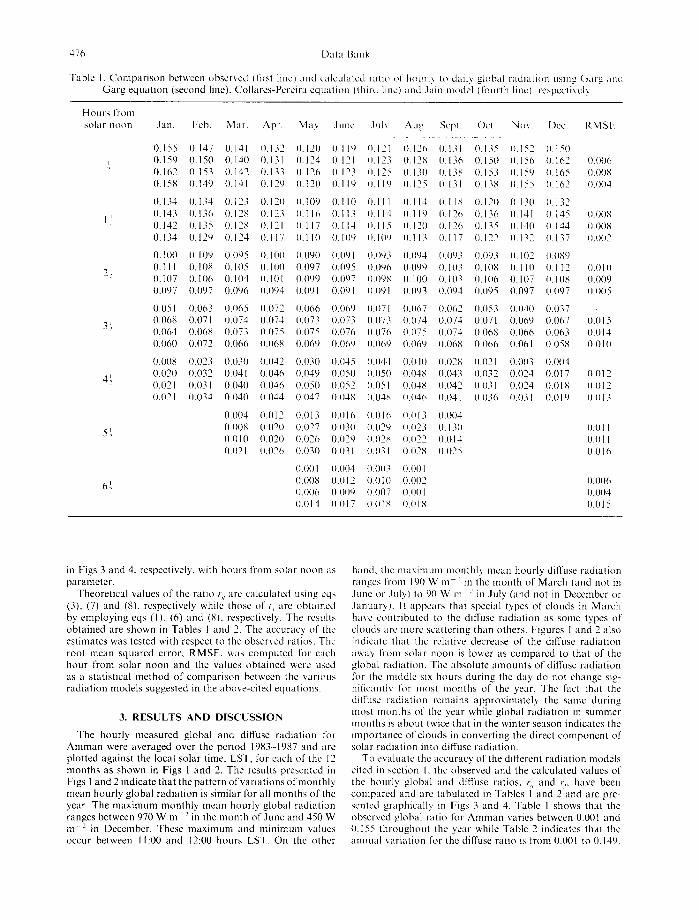
When the calculated values of the hourly to daily diffuse ratio presented in Table 2 are compared with the cor- responding observed values of this ratio, the following remarks can be made :
(I) Jain model yields the lowest value of the RMSE for hours from solar noon - ~.
(2) Jain and Garg and Garg models yield the lowest RMSE for hours from solar noon = 1 ~.
(3) Liu and Jordan equation produces the lowest RMSE for all hours solar noon = 2~, 3~, 4~, 5~ and 6~.
It is evident from the results presented in Table 2 that the classical equation of Liu and Jordan [1] gives results which are much closer to the observed values. In addition, the
478 Data Bank
0.16
0.14
0.12
0.1~
0.12
0.12
0.10
0.08
0.06
0.04
0.04
0.02
0.00
O.OZ
0.00
O.OZ
0.00
Hours From eqn (8) So la r Noon ~ . . ~ - . . . . . eqn (3)
A ~ ~ . . . . . eqn (7)
1/2
A 2 1/2 = ' ~ - " ~ " ~ - ~ " " = = ~ = - - , , A , , , , , , - _ _
A ~ - A
3 1/2
A A
4 1 / 2 = ~ = = ~ r . ~ _ _ _ ~ ~
A ~
5 i l ~
1 1 I
6 1 / 2 1 -
? 10 11 12 13 14
Hours f rom s u n r i s e t o a u . e e t
Fig. 3. Comparison between observed global ratio (marked points) and calculated ratio using eqs (3}, (7) and (8).
Data Bank 479
0 . 1 ( ;
0.1~
0.12
0.10
0.1z=
0.12
0.10
0.10
0.08
0 . 0 8
0.06
0.06
0.04
0.02
0.04
0.02
0.00
0.02
0.00
H o u r s From eqn (1)
Solar Noon . . . . . . . . ~ n (6)
eqn (8)
""~,.." ~ . 1/2 ~ - - . • " ~ A
1 1/2
" "~.. . . . . . . . .~. . .~
A /~ ~
" , . . . , ~ .
3 1/2
4 1/2 . . . . - ~
A A A
A
5 1/2 _ ~ _ _ _ ~
A
6 1 / 2 . 1 . . ~" J
I I I ! I
9 10 11 12 13 14
Hours f rom s u n r i s e t o s u n s e t
Fig. 4, Comparison between observed diffuse ratio (marked points) and calculated ratio using eqs ([), (6) and (8).
480 l)ata Bank
3 . 5
3 . 0
2 . 5
2 .0
A
I I I ! I
10 11 12 13 1~
S 0 , h o u r s
Fig. 5. Correlation between a and So ~ r global ratio.
expression given by Liu and Jordan 's equation is very simple to use as compared to other models used to produce the results of Table 2.
4. C O N C L U S I O N S
Various techniques proposed by different authors for esti- mating the hourly global and diffuse radiation have been tested using measured solar radiation data for Amman. The following conclusions are made :
(I) To determine the monthly average hourly global radi- ation, the normal distribution curve of Jain gives the best estimates amongst the techniques tested.
(2) The theoretical relationships derived by Liu and Jordan to calculate hourly radiation from monthly mean daily sums is found adequate to use for estimating the hourly diffuse radiation for Amman.
Acknowledgements--.The author wishes to express his deep thanks to the Solar Energy Center, Royal Scientific Society, Amman for providing the solar radiation data needed for this study. The present work was conducted during a sabbati- cal leave spent at the University of Jordan, Amman.
R E F E R E N C E S
I. B. Y. H. Liu and R. C. Jordan, The interrelationship and characteristic distribution of direct, diffuse and total solar radiation. Solar Energy 4, I (1960).
2. M. Iqbal, A study of Canadian diffuse and total solar radiation data---II. Monthly average hourly horizontal radiation. Solar Energy 22, 87 (1979).
3. M. Collares-Pereira and A. Rabl, The average dis- tribution of solar radiation---correlations between diffuse and hemispherical and between daily and hourly inso- lation values. Solar Energy 22, 155 (1979).
4. J. M. Gordan, D. Govaer and Y. Zarmi, The utilizability method with hourly vs. daily insolation data. So&r Enerqv 27, 99 (1981).
5. T. A. Newell, Simple models for hourly to daily radiation ratio correlation. Solar Energy 31,339 (1983).
6. H. P. Garg and S. N. Garg, Improved correlation of daily and hourly diffuse radiation with global radiation for Indian stations. Solar Wind Technol. 4, 113 (1987).
7. P. ('. Jain, Estimation of monthly average hourly global and diffuse irradiation. Solar Wind Technol. 5, 7 (1988).
8. P. C. Jain, Comparison of techniques for the estimation of daily global irradiation and a new technique tk~r thc estimation of hourly global irradiation. Solar Wind 7~'ch- no/. I, 123 (1984).