Embed Size (px)
Citation preview

Aus dem
Veterinärwissenschaftlichen Department
der Tierärztlichen Fakultät der Ludwig-Maximilians-Universität München
Lehrstuhl für Anatomie, Histologie und Embryologie
Vorstand: Prof. Dr. Dr. Fred Sinowatz
Arbeit angefertigt unter der Leitung von Dr. Renate Weller, PhD, MRCVS
The Anatomy and Function of the equine thoracolumbar Longissimus dorsi muscle
Inaugural-Dissertation
zur Erlangung der tiermedizinischen Doktorwürde
der Tierärztlichen Fakultät der Ludwig-Maximilians-Universität München
Vorgelegt von
Christina Carla Annette von Scheven
aus
Düsseldorf
München 2010

2
Gedruckt mit der Genehmigung der Tierärztlichen Fakultät der Ludwig-Maximilians-Universität München
Dekan: Univ.-Prof. Dr. Joachim Braun Berichterstatter: Priv.-Doz. Dr. Johann Maierl Korreferentin: Priv.-Doz. Dr. Bettina Wollanke Tag der Promotion: 24. Juli 2010

3
Für meine Familie

4
Table of Contents I. Introduction................................................................................................................ 8 II. Literature review...................................................................................................... 10
II.1 Macroscopic anatomy ............................................................................................. 10 II.1.1 Comparative evolution of the body axis ............................................................ 10 II.1.2 Axis of the equine body ..................................................................................... 12
II.1.2.1 Vertebral column of the horse..................................................................... 12 II.1.2.2 Axial musculature ....................................................................................... 16 II.1.2.3 Spinal ligaments.......................................................................................... 17 II.1.2.4 Function of the body axis of the horse........................................................ 18
II.2 Microscopic anatomy .............................................................................................. 28 II.2.1 Skeletal muscle morphology .............................................................................. 29
II.2.1.1 The Sarcomere ............................................................................................ 29 II.2.1.2 Neuromuscular control................................................................................ 30
II.2.2 Structural arrangement of skeletal muscle ......................................................... 31 II.2.2.1 Muscle architecture..................................................................................... 32 II.2.2.2 Muscle architectural parameter................................................................... 33
II.3 Muscle function and mechanics .............................................................................. 36 II.3.1 Types of muscle contraction .............................................................................. 36 II.3.2 Force-length relationship.................................................................................... 36 II.3.3 Force-velocity relationship................................................................................. 37
II.4 Pathological changes of the equine back................................................................. 37 II.4.1 Aetiopathogenesis and clinical signs.................................................................. 38 II.4.2 Diagnostic methods ............................................................................................ 42
II.4.2.1 Clinical examination ................................................................................... 42 II.4.2.2 Diagnostic imaging ..................................................................................... 43
III. Own investigations: Novel insights into the anatomy and function of the equine thoracolumbar Longissimus dorsi muscle................................................................................ 47
III.1 Gross anatomy of the equine thoracolumbar Longissimus dorsi muscle................ 47 III.1.1 Introduction ........................................................................................................ 47 III.1.2 Material and Methods......................................................................................... 48
III.1.2.1 Subjects ....................................................................................................... 48 III.1.2.2 Experimental protocol................................................................................. 48 III.1.2.3 Statistical analysis....................................................................................... 51
III.1.3 Results ................................................................................................................ 51 III.1.3.1 Descriptive Anatomy .................................................................................. 51

5
III.1.3.2 Architectural measurements........................................................................ 59 III.1.4 Discussion and Conclusion ................................................................................ 76
III.1.4.1 Structure and Function................................................................................ 76 III.1.4.2 Conclusion .................................................................................................. 79
III.2 Muscle activity of the equine thoracolumbar Longissimus dorsi muscle during locomotion .............................................................................................................. 81
III.2.1 Introduction ........................................................................................................ 81 III.2.2 Material and Methods......................................................................................... 85
III.2.2.1 Subjects ....................................................................................................... 85 III.2.2.2 Data collection ............................................................................................ 85 III.2.2.3 Experimental protocol................................................................................. 88 III.2.2.4 Data processing........................................................................................... 88 III.2.2.5 Data analysis ............................................................................................... 90
III.2.3 Results ................................................................................................................ 90 III.2.3.1 Stride parameters ........................................................................................ 90 III.2.3.2 EMG activity pattern................................................................................... 92 III.2.3.3 Intensity of muscle activity......................................................................... 96
III.2.4 Discussion and conclusion ................................................................................. 98 III.2.4.1 Muscle activity of thoracolumbar LD during different conditions ............. 98 III.2.4.2 Muscle activity of LD between different muscle segments...................... 100 III.2.4.3 Conclusion ................................................................................................ 101
III.3 Ultrasonographic anatomy of the equine thoracolumbar Longissimus dorsi muscle............................................................................................................................... 102
III.3.1 Introduction ...................................................................................................... 102 III.3.2 Material and Methods....................................................................................... 105 III.3.3 Results .............................................................................................................. 107 III.3.4 Discussion and Conclusion .............................................................................. 124
III.4 Quantitative Ultrasonography of the equine thoracolumbar Longissimus dorsi muscle: repeatability of muscle thickness and pennation angle measurements ... 128
III.4.1 Introduction ...................................................................................................... 128 III.4.2 Material and Methods....................................................................................... 130
III.4.2.1 Subjects ..................................................................................................... 130 III.4.2.2 Data collection .......................................................................................... 130 III.4.2.3 Data analysis ............................................................................................. 131
III.4.3 Results .............................................................................................................. 132 III.4.3.1 Variation in muscle thickness measurements ........................................... 132 III.4.3.2 Variation in pennation angle..................................................................... 134
III.4.4 Discussion and Conclusion .............................................................................. 136 IV. Discussion and Conclusion .................................................................................... 139

6
V. References.............................................................................................................. 144 VI. Summary ................................................................................................................ 159 VII. Zusammenfassung.................................................................................................. 160 VIII. Acknowledgements................................................................................................ 162

7
ADP adenosinediphosphate
ATP adenosinetriphosphate
C cervical vertebra
CY coccygeal vertebra
EMG electromyography
FL fascicle length
Fmax maximal isometric force
GM middle gluteal muscle
IC iliocostal muscle
L lumbar vertebra
LD Longissumus dorsi muscle
LF left forelimb
LH left hindlimb
LT latissimus muscle
M multifidus muscle
N Newton
PA pennation angle
PCSA physiological cross-section area
R rib
RA rectus abdominal muscle
RF right forelimb
RH right hindlimb
S sacral vertebra
SP spinal muscle
Stdev standard deviation
StE standard error
T thoracic vertebra
Vmax maximal contraction velocity
8
I. Introduction
Musculoskeletal disorders of the back are very common in humans and their
aetiopathogenesis, clinical presentation and treatment are well researched (Demoulin et al.
2007a; Demoulin et al. 2007b; Lu et al. 2002; van Roy et al. 2001). Back problems are also
very common in horses and have been described in the literature as early as 1876 (Lupton
1876), but unlike in humans their aetiopathogenesis, diagnosis and treatment are one of the
least understood disorders of the horse and present a challenge to the veterinary practitioner.
Increasing demands on and expectations of horses as well as the recognition of poor
performance in association with back pain has increased awareness of back problems among
owners, riders and veterinarians. Intensive use of the horse as an athlete and in year-round
intensive competition by riders with various grades of experience may lead to a higher
incidence of predisposition to back injuries (Jeffcott 1979).
Several studies have investigated the anatomy of the equine vertebral column and its adjacent
collagenous structures (ligaments) (Denoix 1999b; Haussler 1999; Jeffcott and Dalin 1980;
Townsend et al. 1986) and the static and dynamic function of the equine back through
kinematic and electromyographic studies (Faber et al. 2001a; Faber et al. 2002; Faber et al.
2000; Gomez Alvarez 2007; Haussler et al. 2001; Jeffcott et al. 1985; Licka et al. 2001a;
Licka et al. 2004; Peham et al. 2001; Peham and Schobesberger 2006; Pourcelot et al. 1998;
Tokuriki et al. 1997). However there is still a paucity of knowledge about the functional
capacity of the back musculature of the horse.
Instability of the spine may play an important role in the development of back pain in humans
(Panjabi, 2003), and it has been shown that spinal stability is related to recruitment and
control of the paraspinal muscle stiffness (Moorhouse 2005). Clinical analysis indicated that
unstable structural behaviour of the spine caused, for example, by sudden loading or
unloading of the spine, may contribute to long-term material damage. Therefore the
paraspinal muscle stiffness is important to prevent damage to the para- and intervertebral
tissue which again can induce pain, further reduced spinal stability and a higher risk of injury
or reinjury (Panjabi 1992a, b).
In humans, muscle strain of the epaxial musculature is the most common reason to develop
back pain (Alexander 1985; Chiou et al. 1994). In horses suffering from back pain, a definite
diagnosis is often only reached once skeletal changes have occurred (Jeffcott and Haussler
2004; Ross and Dyson 2002). The evaluation of back muscle structure and the detection of
insufficient paraspinal muscle stiffness are important at an early stage before instability of the
spine results in more advanced skeletal changes. Hence the development of a diagnostic
9
method which allows an early treatment of muscle problems results in less skeletal changes
and therefore a good prognosis. In humans ultrasonography is used to visualise changes in
back muscle morphology and EMG to evaluate muscle function and in this study I am
adapting these techniques to the horse.
The varying and often controversial opinions with regards to the appropriate diagnostic and
therapeutic methods in investigating and treating back problems in horses suggest that further
evidence must be obtained to evaluate the importance of epaxial muscle function in sound
horses and horses with back problems. Muscle morphology determines muscle function (Gans
1982; Sacks and Roy 1982) and in depth knowledge of the morphology of the epaxial
musculature is a prerequisite in understanding how musculature is adapted to specific
movement patterns during its normal functioning and how this changes with pathology. This
knowledge will contribute to understanding the pathogenesis of back disorders and will
provide the basis for the development of new diagnostic and therapeutic techniques.
The aim of this thesis is to determine the morphology and function of the largest muscle of the
equine back, the Longissimus dorsi (LD).
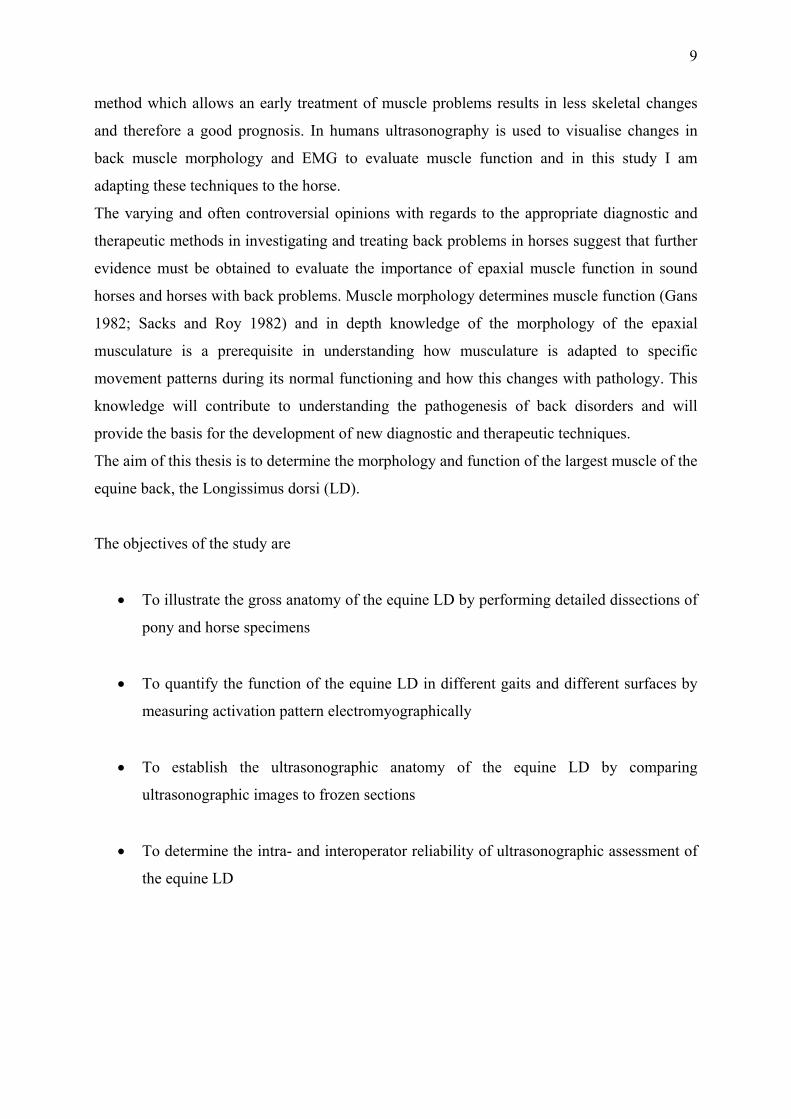
The objectives of the study are
• To illustrate the gross anatomy of the equine LD by performing detailed dissections of
pony and horse specimens
• To quantify the function of the equine LD in different gaits and different surfaces by
measuring activation pattern electromyographically
• To establish the ultrasonographic anatomy of the equine LD by comparing
ultrasonographic images to frozen sections
• To determine the intra- and interoperator reliability of ultrasonographic assessment of
the equine LD

10
II. Literature review
II.1 Macroscopic anatomy
The back as part of the body axis forms the connection between front and hind limbs. As part
of the trunk the back maintains body posture and supports the centre of gravity during
locomotion by maintaining the equilibrium of the body (Boszczyk et al. 2001; Ritter 1995;
Wada et al. 2006a). The function of the body axis is integrated in various locomotion
activities with other body parts such as limbs, head, neck and tail but it is also exposed to the
passive dynamic forces of the internal organs. These internal and external forces are
transmitted onto the axis of the body and cause parts of it to bend, stretch, shorten, twist and
shear (Koob and Long 2000). These movements act to transfer momentum from the body to
the environment resulting in locomotion. During evolution the structure of the body axis
adapted to different environments as different locomotor demands influenced the anatomical
structure.
The following paragraph reflects briefly on the different role of the body axis throughout
evolution and provides an understanding of the adaptation of the back to different locomotor
demands between species.
II.1.1 Comparative evolution of the body axis
The body axis is the part of the musculoskeletal system, which maintains posture and
transmits force between the limbs and the trunk (O´Reilly et al. 2000). It is composed of the
bony vertebral column, the epaxial and hypaxial musculature, ligaments and other soft tissues.
Depending on the primary modes of locomotion and the position of the limbs in relation to the
body axis, the body axis shows specific features to accomplish specific movement patterns.
Length and shape of vertebrae, muscles and soft tissue have been modified to adapt to
specialised motion.
In tetrapods, for example, vertebrae and axial muscles show more specific modifications to
adapt to their specific environment compared to the more simple axial structure of fish. For
the survival on land the vertebrae became adapted to a wider range of motion. In the first
terrestrial animals (amphibians, reptiles) the inherited lateral, undulating flexion of the fish is
still apparent in combination with a symmetrical diagonal sequence of limb movement
(Gambaryan 1974). The movement of these animals is more constricted to a horizontally

11
orientated plane than to a vertically orientated plane due to their limb posture. The limb
posture is characterised by a lateral orientation of the long axis of the limb and a foot
placement well to the side of the body (Rockwell et al. 1938). The myomeric structure of the
epaxial musculature still produces lateral bending (Pabst 2000) whereas activity patterns of
the predominantly myomeric hypaxial musculature shows bilateral and uniphasic activation
pattern which in addition, suggests a stabilising function of this muscle group.
In mammals the vertebral axis supports the head, the neck and the trunk where the head
attaches cranial to the cervical vertebral column and the trunk is suspended between front and
hind limbs. The limbs are characterised by being more quadrupedal erect where the feet are
placed more directly under the body (Rewcastle 1983). This posture allows asymmetrical
movements in sagittal planes and changes the functional properties of the vertebral column
where the trunk undergoes little or no lateral bending during locomotion (Hildebrand 1974).
During evolution the axial musculature progressively abandoned the myomeric muscle
construction as the appendicular musculature became more developed. The epaxial
musculature is organised in three longitudinal tracts, the multifidus, longissimus and
iliocostalis (Walker and Liem 1994). Muscle fascicles retain in a serial arrangement within
each of the three muscle tracts reminiscent of the myomeric muscle morphology of fish and
lower tetrapodes (Pabst 2000). Bilateral and biphasic muscle activity support the postural
function of the epaxial muscle and stabilises the vertebral column against the ground reaction
force (English 1980). The stiffer vertebral column acts also as an attachment site for
surrounding muscles and transmits their forces to other parts of the body.
The construction of the body axis varies between mammals and is adapted to the overall body
shape and to the special locomotor needs of different types of locomotion, such as cursorial
locomotion, high speed locomotion, hopping, jumping and climbing, to mention just a few
specialisations. These locomotor specialisations are revealed in the structure of the vertebrae,
the musculature and the tendinous and ligamentous structures (Gambaryan 1974). The
vertebral axis is not only part of the frame-work which stiffens the body but also protects
internal organs and the spinal cord. In some vertebrae the body axis is stiffer due to a
supportive role of withstanding gravity and external forces. In others mammal higher vertical
and horizontal back mobility leads to an increase in stride length and therefore contributes to
an increase in speed (Hildebrand 1959).

12
II.1.2 Axis of the equine body
The general description of the body axis showed variations of the anatomical structure and
axial function during phylogenetic history. In this thesis I focus on the body axis of one of the
largest terrestrial animals, the horse, specialised in both long distance and speed. In the
following paragraphs the structure and function of the vertebral column, axial musculature
and spinal ligaments of the horse is described in more detail.
II.1.2.1 Vertebral column of the horse
The equine body axis consists of the vertebral column which includes seven cervical, 18
thoracic, six lumbar, and five sacral and 15-21 coccygeal vertebrae, which are connected by
ligaments, joints, the epaxial and hypaxial muscles and their tendons (Fig. 1).
The following paragraph describes the vertebrae in the thoracic, lumbar and sacral region
which are the regions of particular interest to this study.
Fig. 1 Diagram of the equine vertebral column. Cervical vertebrae (C, red); thoracic vertebrae (T, blue), lumbar vertebrae (L, green), sacral vertebrae (S, yellow) and coccygeal vertebrae (CY, orange) (modified from Jeffcott and Dalin, 1980)

13
All vertebrae can be divided into three basic parts: vertebral body, vertebral arch and vertebral
processes. These basic structures are adapted to the function of different body regions and
therefore vary in their shapes.
Each vertebral body has a convex cranial and a concave caudal surface. They are separated
from one another by fibrous intervertebral discs, forming fibrocartilaginous joints. The
intervertebral discs contribute to weight bearing, axial shock absorption, and maintenance of
vertebral flexibility. In the midthoracic region the intervertebral discs are the thinnest. From
there thickness of the intervertebral discs increases in cranial and caudal direction. At the
lumbosacral junction a wider intervertebral disc provides an increased range of dorsoventral
motion in contrast to the thinner intervertebral discs at the thoracic region which have less
mobility (Haussler 1999; Jeffcott and Dalin 1980). The vertebral arch surrounds the spinal
cord which is secured by cerebrospinal fluid, the meninges, fat, and the vascular plexus. From
the vertebral arch the arising spinous processes vary in their length and in their orientation
along the spine. They act as serial levers for the attachments of muscles and ligaments. In the
cranial thoracic vertebral column spinous processes resist forces from the head, neck and
forelimbs transmitted by the nuchal and supraspinous ligament and adjacent muscles and
aponeurosis. In the caudal thoracic and lumbar part of the spine they are exposed to forces
from the hind limbs during locomotion. The attaching epaxial and hypaxial muscles flex,
extend and rotate the spine by contraction while ligaments limit excessive motion
(Gambaryan 1974; Nickel et al. 1984).
Bilateral cranial and caudal articular processes are located dorsally at the vertebral body and
form intervertebral synovial joints (facet joints) between adjacent vertebrae. The orientation
of the articular surfaces changes along the spine. This contributes to a different range of
motion and support of the vertebral column. Due to their orientation they limit dorsoventral
flexion in the thoracic spine whereas in the lumbar and sacrolumbar part lateral flexion and
rotation is restricted.
The transverse processes have different sizes and orientations. They are used as horizontal
levers for the attaching epaxial musculature which maintains posture and implies lateral
flexion and rotation (Haussler 1999). The transverse processes of the last two or three lumbar
vertebrae and the lumbosacral junction have intertransverse synovial joints which are
involved in transferring propulsive forces from the hind limbs to the vertebral column and
limit the lateral flexion and rotation (Haussler 1999).
The thoracic vertebral column (T) of the horse contains 18 vertebrae. The size of the vertebral
body decreases from T1 to T11 and then increases again. Well defined ventral crests arise on

14
the ventral aspect of the vertebral bodies and provide attachment sites for ligaments and the
hypaxial muscles.
The dorsal spinous processes are long and narrow. Their length increases up to T4-T6 (the
highest point at the withers) and then decrease again to T13. Following thoracic dorsal
spinous processes maintain the similar length. Their orientation changes in a characteristic
way. At the thoracic vertebral column the orientation of the dorsal spinous processes incline
in a caudal direction (T1-T15). At T16, which is the anticlinal vertebra, the dorsal spinous
process points in vertical direction. The dorsal spinous processes of the following vertebrae
(T17-T18) angle in a dorsocranial direction (Haussler 1999). The articular processes are
orientated horizontally and create synovial joints between the cranial articular processes of
one vertebra with the caudal articular process of the preceding vertebra. This arrangement of
their articular surface leads to restricted lateral flexion and rotation in the thoracic region. The
thoracic vertebral body has a cranial and caudal fovea costalis cranialis and caudalis where
the heads of the ribs articulate with the vertebrae. The foveae articulares flatten towards the
caudal thoracic spine and hence permit an increased range of motion of the ribs in caudal
direction. Local variations in osteoarticular morphology relate to different ranges of mobility
along the thoracic vertebral column. The height of the dorsal spinous processes as well as the
articulation of the first ribs with the rib cage limits dorsoventral motion at the cranial thoracic
region. In contrast shorter dorsal spinous processes, relatively thick intervertebral discs of the
last thoracic vertebrae and the articulation with the asternal ribs allow relatively large
movements around the thoracolumbar junction.
The five to seven lumbar vertebrae of the horse have larger, more massive vertebral bodies
than those of the thoracic vertebral column. A prominent crest is located ventrally for the
attachment of the hypaxial muscles. Their dorsal spinous processes are thin, wide bony plates
of similar length. They have widened apeces and are orientated in a dorsocranial direction
which results in minimal interspinal distances. The lumbar transversal processes are situated
in a horizontal plane and become wider towards their ends. The orientation of the transverse
processes of L1-L3 is in a lateral direction whereas the last three transverse processes are
more craniolaterally orientated. There is a synovial articulation between the last two processes
called the synovial intertransverse joint, which is a characteristic of the horse. The smaller
lumbar vertebral processes such as the processus articulares craniales and caudales as well as
processus mamillares are located at the base of the vertebral arch. The articular processes lie

15
in a vertical plane where the dorsally concave articular surface of the cranial process
articulates with the ventrally convex surface of the caudal process.
The different anatomical features account partly for the relative stiffness of the lumbar region.
Width and height of the spinous processes combined with narrowness of interspinous
ligaments restrict the range of dorsoventral, lateral and rotational movement. In addition the
size of the vertebral bodies, the prominent ventral crest and the strong ventral longitudinal
ligament also contribute to the specific function of this section. The articular processes
stabilise the vertebral column and also act as supplementary rigid devices against lateral
flexion and axial rotation. In general, the lumbar vertebral column has a progressively
decreasing range of motion in the caudal direction (Denoix 1999b; Haussler 1999; Hildebrand
1974; Nickel et al. 1984).
The lumbar sacral junction between L5-S1 shows anatomical particularities which allow the
greatest range of dorsoventral movement (up to 20°) between the first thoracic and the last
sacral vertebrae. The fact that the vertebral disk is thick and high, the dorsal spinous processes
of L6 and S1 are widely divergent, the interspinous ligament is relatively weak and articular
processes are orientated in a vertical direction contributes to the great amount of flexion and
extension. However, excessive flexion is inhibited by soft tissue structures such as the strong
aponeurosis of the longissimus dorsi muscle, the interosseous sacroiliac ligament and the
ventral intertransverse lumbosacral ligament. Limiting factors for excessive extension are
tension of the ventral intertransverse lumbosacral ligament, the ventral part of the
intervertebral discs and locking of the articular processes.
The sacrum is composed of three to five sacral vertebrae which are joined and ossified into a
single unit. The five vertebrae increase their length in the cranial to caudal direction. At the
age of three to four years all five vertebrae are adhered to each other. The first sacral vertebra
articulates with the last lumbar vertebra by the synovial intertransverse joint, the lumbosacral
joint. The transverse processes are adhered to the lateral part of the sacrum which articulates
with the transverse process of the last lumbar vertebrae in the intertransverse vertebral joint.
The dorsal spinous processes incline in a caudal direction.
The number of coccygeal vertebrae varies between 15 and 21 vertebrae. The vertebrae are
connected by thick intervertebral disks. The size of dorsal spinous processes and transverse

16
and articular processes diminish in caudal direction to little bony bumps or disappear (Nickel
et al. 1984).
II.1.2.2 Axial musculature
The axial muscles are the skeletal muscles of the trunk and the tail. As this study focuses on
the epaxial musculature a more detailed description of their embryonic development is
included to explain how muscle structure and function develop. Due to their embryonic origin
the epaxial muscles are arranged in multiple segments. The muscle segments arise from the
embryonic source of the paraxial mesoderm, a cell layer formed during embryogenesis. The
paraxial mesoderm differentiates into two different types of cell blocks, somites (trunk) and
somitomeres (head). The somites become anatomically separated and arranged segmentally
next to the neural tube, where they differentiate into myotomes, cells which build the
musculature of the body walls. As functional musculature they grow along the vertebral
column, the ribs and the body wall. A horizontal septum divides the myotomes in the dorsal
region of the epaxial musculature and the ventral region of the hypaxial musculature.
II.1.2.2.1 Hypaxial musculature
The hypaxial musculature lies ventral to the transverse processes and is innervated
segmentally by the ventral branches of the spinal nerves. It is classified in three groups. The
first group is the subvertebral group. It is located ventral to the transverse processes of the
vertebrae. The major function of this muscle group is the dorsoventral and lateral flexion of
the spine. The second group, the rectus abdominis group, connects the cranial and caudal part
of the body by running lengthwise along the ventral body wall. It supports the visceral cavity
and also provides ventroflexion of the body. The third group contains the external oblique,
internal oblique, transversus and intercostal muscles. They compose the lateral body wall of
the body and aid lung ventilation.
II.1.2.2.2 Epaxial musculature
The epaxial muscles are located bilateral to the vertebral axis and lie dorsal to the transverse
processes and the ribs. They form four different groups: the longissimus, the spinal, the
iliocostal and the intervertebral muscle group, which consists of the multifidi muscles. Each
segment of the epaxial muscles is innervated by a dorsal branch of the spinal nerves. A more
detailed description of the structure and arrangement of the different epaxial muscles are
given below.

17
The thoracolumbar longissimus dorsi muscle (LD) is the largest epaxial muscle and is
important for back movement and stabilisation. It spans from the ilium all the way to the
seventh and sixth cervical vertebrae. The dimension of the caudal LD at the lumbar region is
massive but it reduces continuously in cranial direction. The original phylogenetic segmented
structure of the muscle is reflected in many tapered muscle bundles which are orientated in
the cranioventral and lateral direction and overlap each other. These muscle bundles originate
from the tuber, the crest and the ventral surface of the ilium, the first three sacral vertebrae as
well as the transverse and mammillary processes of the thoracolumbar spine. The LD is
covered by the strong fascia thoracolumbalis which joins the supraspinous ligament and
connects to the dorsal spinous processes of the thoracolumbar and sacral spine, the tuber
coxae and sacrale of the ilium as well as to the iliac crest (Nickel et al. 1984). In the cranial
part LD is also covered by the spinalis muscle. At the caudal end the cranial extension of the
middle gluteal muscle overlies the LD and inserts onto the aponeurosis of the LD as far
forward as T18.
The iliocostal muscle is relatively small and is located lateroventrally to the longissimus dorsi
muscle. The caudal part of the iliocostal muscle fuses with the longissimus lumborum muscle
in the lumbar region. The numerous muscle bundles of the thoracic and lumbar ilicostal
muscle end cranioventrally in multiple tendons. These tendons bridge two to four intercostal
spaces and insert on the caudal edge of the 1st-15th rib and on the last cervical vertebra. The
iliocostal muscle act as a stabiliser of the spine and contributes to lateral bending (Nickel et
al. 1984).
Each multifidus muscle is composed of five segmental multifidus fascicles with high
tendinous portions. This muscle retains a primitive metameric structure and extends between
vertebrae. The muscle bundles originate from the lateral aspect of the dorsal spinous
processes and the pars lateralis of the sacrum running craniocaudally and insert on the
articular, mamillary and transverse processes of the thoracic and lumbar vertebrae (Haussler
1999; Stubbs et al. 2006). The multifidi muscles produce dorsoventral motion (Stubbs et al.
2006) and support segmental stabilisation, proprioception and posture (Haussler 1999).
II.1.2.3 Spinal ligaments
The interaction of short and long spinal ligaments plays an important role in stabilising the
vertebral column during posture and movement. There are three longitudinal ligaments: the

18
nuchal and supraspinous ligament, the dorsal longitudinal ligament and the ventral
longitudinal ligament. The nuchal ligament originates at the occipital bone and inserts onto
the first dorsal spinous processes of the thoracic vertebrae and the cervical vertebrae. It
continues as the supraspinous ligament along the thoracolumbar spine and inserts on to the
tips of the dorsal spinous processes until it ends at the dorsal spinous processes of the sacrum.
The dorsal longitudinal ligament runs within the vertebral canal and the ventral longitudinal
ligament attaches to the ventral aspect of the vertebral body, connecting the dorsal and ventral
aspect of the vertebral bodies respectively. The short intervertebral ligaments such as the
interspinous and intertransverse ligaments connect respective processes whereas the
ligamenta flava span spaces between the vertebral laminae. The multiple interconnections
between the vertebral structures stabilise the vertebral column and protect the spinal cord.
II.1.2.4 Function of the body axis of the horse
In the last two decades the knowledge of the functional anatomy and biomechanics of the
vertebral column has been enhanced by a series of in vitro and in vivo studies (Audigie et al.
1999; Denoix 1999b; Faber et al. 2001a; Faber et al. 2001b; Faber et al. 2000; Gomez
Alvarez 2007; Haussler 1999; Haussler et al. 2001; Jeffcott and Dalin 1980; Jeffcott et al.
1982; Licka et al. 2008; Licka et al. 2001a; Licka et al. 2004; Townsend et al. 1983). The
knowledge of the fundamental kinematics along the vertebral column and the understanding
of the influence of limb and neck movement on back motion are necessary to evaluate
abnormalities of motion of the vertebral column.
II.1.2.4.1 In vitro kinematic evaluation of the back
A series of in vitro experiments were performed on the isolated equine vertebral column or on
the whole axial skeleton, including rib cage and sternum. Moving the spine with and without
the rib cage showed that the range of movement around different axis (dorsoventral, latero-
lateral and rotational movement) varied between regions along the thoracolumbar vertebral
column (Denoix 1999b; Jeffcott and Dalin 1980; Townsend and Leach 1984).
The greatest overall movement takes place in the lumbosacral joint (Denoix 1999b;
Gambaryan 1974; Jeffcott and Dalin 1980; Townsend et al. 1983) followed by the first
thoracic joint (Townsend et al. 1983). The regional range of dorsoventral motion was greatest
between T9 and T18 compared to lesser movement at the regions T2-T8 and L2-L5. Lateral
bending varied significantly between the different regions of the thoracolumbar vertebral

19
column. In the thoracic spine lateral flexion was always coupled with rotation around the
longitudinal axis of the spine or vice versa. In contrast, in the lumbar spine rotation is rather
limited and not associated with lateral flexion. The greatest lateral flexion and rotation was
found between T9 and T14 (Townsend et al. 1983). However in the cranial part of the
thoracic spine (T2-T9) the presence of the sternal ribs, the height of the dorsal spinous
processes and the strong supraspinous ligament limit these movements. Also functional
particularities of the lumbar spine, such as the shape, size and orientation of articular
processes and frequent fusions of the lateral joints, restrict lateral and rotational movements
between L4-L6 (Denoix 1999b; Schlacher et al. 2004; Townsend and Leach 1984). Due to the
regional stiffness of the lumbar vertebral column it is more likely that different movements
induce higher stresses (especially compressions) on bony structures of this region. In contrast,
soft tissue strains on ligaments and joint capsules may occur predominately in the thoracic
spine where the range of motion is greater.
In order to show detailed dynamic interaction between the anatomical structures precise
measurements of the vertebral movement and the intervertebral mobility were performed
(Denoix 1999b). Forces were applied to the vertebral column which imitated the physiological
action of several trunk muscles via elastic straps. The behaviour of the different vertebral
structures during flexion and extension as well as laterolateral flexion and rotation is
displayed in Fig. 2 and Fig. 3 Table 1 and Table 2.

20
Fig. 2 The range of dorsoventral motion of the equine vertebral column (adapted from Clayton 1999)
Table 1 Mechanical behaviour of different anatomical structures of the equine vertebral column during flexion and extension.
Flexion Extension Shearing of the discs Shearing of discs Shearing and tension of the dorsal longitudinal ligament
Tension of ventral longitudinal ligament
Shearing of the ventral longitudinal ligament
Relaxation of dorsal longitudinal ligament
Cranial slide of the caudal articular process which leads to tension of the joint capsule and decreased pressure on the articular surface
Caudal slide of the caudal articular process leads to relaxation of the joint capsule and increases pressure on the articular surface
Cranioventral sliding of the spinous process which increases tension of the supraspinous ligament and induces shearing and tension in the interspinous ligaments
Caudodorsal slide of the dorsal spinous processes increases interspinous space and leads to relaxation of supraspinous, interspinous and flavum ligaments.
Tension of flavum ligament
21
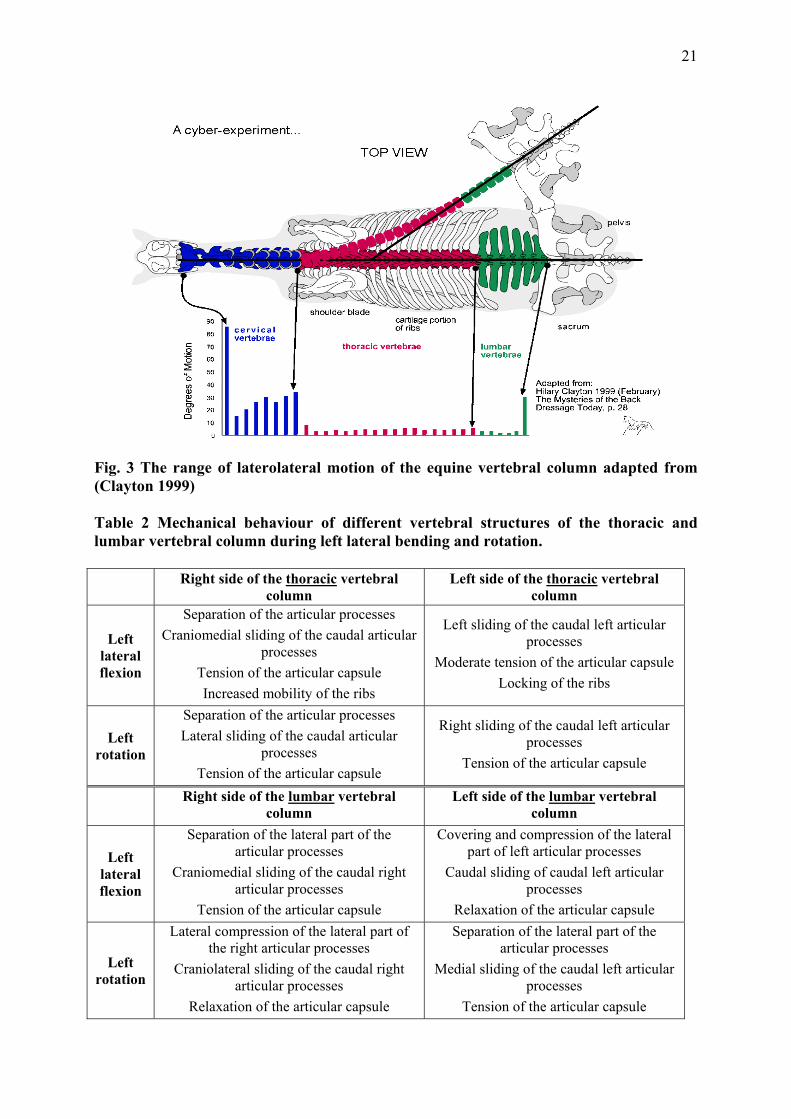
Fig. 3 The range of laterolateral motion of the equine vertebral column adapted from (Clayton 1999) Table 2 Mechanical behaviour of different vertebral structures of the thoracic and lumbar vertebral column during left lateral bending and rotation. Right side of the thoracic vertebral
column Left side of the thoracic vertebral
column
Left lateral flexion
Separation of the articular processes Craniomedial sliding of the caudal articular
processes Tension of the articular capsule Increased mobility of the ribs
Left sliding of the caudal left articular processes
Moderate tension of the articular capsule Locking of the ribs
Left rotation
Separation of the articular processes Lateral sliding of the caudal articular
processes Tension of the articular capsule
Right sliding of the caudal left articular processes
Tension of the articular capsule
Right side of the lumbar vertebral
column Left side of the lumbar vertebral
column
Left lateral flexion
Separation of the lateral part of the articular processes
Craniomedial sliding of the caudal right articular processes
Tension of the articular capsule
Covering and compression of the lateral part of left articular processes
Caudal sliding of caudal left articular processes
Relaxation of the articular capsule
Left rotation
Lateral compression of the lateral part of the right articular processes
Craniolateral sliding of the caudal right articular processes
Relaxation of the articular capsule
Separation of the lateral part of the articular processes
Medial sliding of the caudal left articular processes
Tension of the articular capsule

22
II.1.2.4.2 In vivo kinematic evaluation of the back in different gaits
In vivo kinematic studies focused on quantifying motion of the equine back during normal,
physiological movements and abnormal back movements during different gaits (Audigie et al.
1999; Back and Clayton 2001; Cassiat et al. 2004; Faber et al. 2001a; Faber et al. 2001b;
Faber et al. 2000; Gomez Alvarez 2007; Haussler et al. 2001; Holm et al. 2006; Johnston et
al. 2004; Licka and Peham 1998; Licka et al. 2001a; Licka et al. 2001b; Pourcelot et al. 1998;
Robert et al. 2001a; Robert et al. 2002; Wennerstrand et al. 2004).
To quantify the rather complex and often subtle motion of the vertebral column computerised
motion analysis systems are commonly used. This involves the use of infrared cameras that
register light reflected from markers fixed to bony landmarks of the spine and the pelvis and
identify the position of those markers in three dimensions. Assessment of the spine on live
horses is complicated by skin movement and overlying muscles which restrict the direct
observation of the spine. However, some studies were performed with markers inserted into
the dorsal spinous processes to avoid marker movement with the skin (Faber et al. 2001a;
Faber et al. 2001b; Faber et al. 2000; Haussler et al. 2001). Comparisons of skin markers with
bone pin markers showed skin markers to be a sensitive and accurate tool to measure back
kinematics. The collected kinematic data was processed to angular movement patterns which
describe the time of movement versus the angle of three different axes in relation to foot
placement. This results in specific movement patterns around the three-dimensional axis of
the spine during a stride cycle for each gait. In general, the largest magnitudes of flexion and
extension were detected in the lumbosacral joint (Faber et al. 2001a; Faber et al. 2001b; Faber
et al. 2000; Haussler et al. 2001). Between T14-T16 less flexion and extension occurred
although the magnitude for lateral bending and axial rotation were large in all gaits. The
smallest amount of movement in all gaits appeared between L1-L3 (Haussler et al. 2001).
Walk
During walk back flexion and extension run through two full oscillations per stride cycle.
When the left hind limb contacts the ground, T10 rotates clockwise and S3 counter-clockwise
which leads to the extension of the back. Flexion is produced by counter-clockwise rotation of
the thoracic region and the clockwise rotation of the pelvic region and occurs always
whenever the forelimb contacts the ground and the ipsilateral hind-limb is in early swing
phase (Faber et al. 2000). Peak maximal flexion is obtained slightly earlier at the lumbosacral
junction from where it continues in a cranial direction along the spine (Haussler et al. 2001).
The mean (±stdev) range of dorsoventral motion increases in a craniocaudal direction and
represents 4.2° (±1.6°) at T6, >8° at T10 and T13 and 6.5°-7.0° for the region caudal to T13.

23
The limited range of flexion and extension is due to the construction and orientation of the
dorsal spinous processes. Especially in the thoracic region, tangential facet joints restrict
dorsoventral mobility.
Lateral bending is a single periodic motion during the stride cycle where T10 rotates to the
opposite side of S3. In L1 almost no rotation is detectable. The maximal and minimal bending
angles are more distinct at T6 whereas in the sacral area they are less obvious. The sacral
region bends towards the side of the respective hindlimb, for example left hindlimb, long
before the actual hoof contact with the ground occurs. The thoracic region rotates to the
opposite side (clockwise) which results in bending towards the right side. The range of motion
was less than 3° for the caudal thoracic and cranial lumbar region. There was 6° of
laterolateral motion in the pelvic area.
During axial rotation all vertebrae between T13 and the pelvis act as one segment. The mean
(±stdev) range of axial rotation increases in a cranial 4.3° (±1.2°) to caudal 13.1° (±1.2°)
direction. The thoracic part, being closest to the forelimb, acts as point of rotation (Faber et al.
2000). Maximal axial rotation to the left occurs when the right forelimb is close to hoof
contact. In reverse maximal rotation to the right happens when the left forelimb is close to
hoof contact (Haussler et al. 2001).
In walk the measurable laterolateral and rotational mobility along the vertebral axis
corresponded to the in vitro measurements although the magnitude of the range of motion was
much smaller in vivo (Faber et al. 2000).
Trot
In trot flexion and extension show a bimodal sinusoidal pattern per stride cycle. Thoracic and
sacral vertebrae move out-of-phase by 180° where L1 moves out-of-phase by only 90° in
transition to both ends of the vertebral column. Starting from the foot contact of the left hind
limb T10 rotates in a clockwise and S3 in a counter-clockwise direction resulting in extension
of the back. Extension lasts until mid-stance then T10 starts to move counter clockwise and
S3 to the opposite direction inducing back flexion. When the right hind limb contacts the
ground the movements reverse and the back extends again (Audigie et al. 1999; Faber et al.
2001a; Haussler et al. 2001; Pourcelot et al. 1998). The mean (±stdev) range of dorsoventral
vertebral motion has the lowest angular value at T6 and S3 2.8° (±0.8°) and (±0.9°) and the
highest at T10 4.9° (±1.4°). A slightly different result was reported for a study using skin
markers where the highest dorsoventral motion occurred at T16 (Licka et al. 2001a) and at the
thoracic and lumbosacral angle (3.9°) respectively (Audigie et al. 1999). These differences
may be due to variations in the experimental set up, data processing and analysis. Movement

24
of the head has been reported to influence the rotation of the thoracic vertebrae (Gomez
Alvarez 2007; Rhodin et al. 2005).
Lateral bending is a single periodic movement in trot. As in walk, T10 and L3 rotate out-of-
phase by 180°. At hoof contact of the left hind limb L1 and S3 rotate clockwise while T10
moves in the opposite direction. These rotations induce bending towards the non-supporting
hind limb (clockwise rotation of the horse). At midstance at the moment of maximal
propulsion L1 followed by S3 rotates in a counter clockwise direction while T10 changes to
clockwise rotation after the left hind limb lifts off. Now the vertebral column is pushed
towards the right side of the horse (counter clockwise bending). This sideway force is
absorbed by musculature which promotes a forward movement. The range of motion is 4.6°-
5.8° for all vertebrae except T10 and T13. They have a smaller range of motion 3.1°-3.3°.
During axial rotation T10 rotates counter clockwise when the left hind limb and right fore
limb hit the ground. By the progressive loading of the right forelimb the cranial dorsal part of
the trunk moves towards the unsupported left side. At midstance when the right forelimb
starts to push off and the left hind protracts T10 rotates clockwise and clears the way for the
protracting leg. After maximal propulsion T10 rotates counter clockwise again when the left
hindlimb is about to contact the ground.
The caudal part of the vertebral column (S3) moves counter clockwise during the first part of
the stance phase toward the supporting hindlimb. At the end of the concussion phase axial
rotation changes towards the unsupported side to which side also the pelvis drops. After
midstance the pelvis is rotated towards the supporting side by the push-off forces and hip
extensors. This means counter clockwise rotation and clearance for the opposite hindlimb
during protraction. In the suspension phase S3 moves in clockwise direction while the right
hindlimb reaches forward to contact the ground (Faber et al. 2001a; Haussler et al. 2001;
Licka et al. 2001a).
Canter
Canter is an asymmetric gait and with a rather complex movement pattern. In comparison to
walk and trot a greater amount of segmental vertebral motion occurs during canter (Faber et
al. 2001b; Haussler et al. 2001).
In canter flexion and extension show a unimodal movement pattern of the back during one
stride cycle which is closely related to limb placement. The thoracic region of the vertebral
column moves differently to the sacral region in terms of peak maximal and minimal angles
and timing. Starting from the hoof contact of the trailing hind limb the back is extended and
T10 rotates clockwise (looking at the left side). At the end of the stance phase of the diagonal

25
limbs T10 rotates counter clockwise and the back begins to flex. This rotation reverses again
at the end of the support phase of the leading front limb. The cranial part of the body is
elevated by the upward direction of the impulse of the leading forelimb and the active LD and
the back extends. In contrast flexion and extension of the caudal end of the back coincide with
the foot contact of the trailing hind limb and leading forelimb respectively. When the hoof of
the trailing hind limb hits the ground the leg acts as a pillar and the body rotates forward over
the limb while the sacral area rotates counter clockwise. After the leading fore limb contacts
the ground the equine body rotates over the front limb, the sacrum rotates in a clockwise
direction while the caudal part of the body moves under the horse. The mean (±stdev) range
of motion for flexion and extension is 12.1° (±2.1°) at T6, decreases to 6.4° (±0.8°) towards
the lumbar region and increases again to 15.8° (±1.3°) at the caudal lumbar region (Faber et
al. 2001b).
Only for the cranial part of the thoracolumbar spine lateral bending is a single periodic pattern
for every stride cycle. The clockwise rotation of T10 is initiated by the forward movement of
the body when the trailing forelimb contacts the ground. The reverse rotation is induced by
forward movement of the body when the leading forelimb hits the ground. The counter
clockwise rotation continues throughout the suspension phase and the single support phase of
the trailing hind limb. In contrast, L1 and S3 have a biphasic movement pattern throughout
the stride cycle. The pelvis rotates clockwise when the hoof of the trailing hind limb touches
the ground. The direction of the rotation changes to counter clockwise when the diagonal
limbs contact the ground and maximal forward propulsion exerts an oblique force on the
vertebral column. After the maximal propulsion of the leading hind limb S3 rotates clockwise.
During the suspension phase S3 rotates counter clockwise away from the trailing hind limb.
This assists protraction of the trailing hind limb.
Axial rotation appears in two periods per stride cycle when all vertebrae rotate
simultaneously. The first period starts when the trailing hind limb contacts the ground and the
vertebral column rotates counterclockwise towards the trailing hind limb. At midstance of the
trailing hind limb the rotation reverses towards the unsupported side. This movement is
induced by the forward and upward movement of the body during push off. The second
period begins when the leading forelimb touches the ground and continues until the end of the
stride cycle which corresponds to the push-off phase of the leading front limb and the
suspension phase. In the second period vertebrae move independently from each other.

26
II.1.2.4.3 Factors influencing kinematic studies
Kinematic studies show that the interaction between movements of the limbs and the vertebral
column leads to efficient locomotion (Faber et al. 2001a). Changes in the interaction with
speed, lameness and back pain or factors like age, breed and training status can influence
movement pattern and efficiency of locomotion (Cassiat et al. 2004; Jeffcott et al. 1982;
Johnston et al. 2002; Licka et al. 2001a; Robert et al. 2001a; Robert et al. 2002).
Increasing speed has been shown to alter the sinusoidal movement pattern of the back in
horses trotting on a treadmill. Influenced by higher stride frequency and decreased stance time
within a stride cycle the peak values of vertical displacement of the vertebral column occurred
significantly earlier in the stride cycle when speed increased (Back and Clayton 2001;
Drevemo et al. 1980; McLaughlin et al. 1996). Although the angles of thoracic and
thoracolumbar flexion decreased significantly maximal angles for extension remained
unchanged. This resulted in a decrease in the overall range of back motion. In contrast the
peak vertical displacement for the lumbosacral region did not change (Robert et al. 2001a).
Horses with back pain showed alterations of the angular movement pattern of the spine. A
comparison between horses with back dysfunction and sound horses showed significant
differences in the range of motion predominantly at the thoracolumbar spine. In affected
horses flexion and extension was significantly reduced during walk and trot at the thoracic
and thoracolumbar vertebral column. Other significant findings for horses with back
dysfunction were increased lateral bending at the thoracic spine and reduced axial rotation of
the pelvis. Back pain also affected the stride length which was significantly shorter at walk
although there was no difference in trot. The alterations of the range of motion at the thoracic
spine and the pelvis have been discussed as adjustments through neuromuscular control
mechanisms to avoid pain. This study concluded that horses trying to avoid back pain by
reducing dorsoventral flexion and extension and thus limit the movement between the
segments of the thoracolumbar part (Wennerstrand et al. 2004). In another study increased
back stiffness with a slight convexity towards the pain-free side was demonstrated by induced
unilateral back pain. These horses were unable to maintain their top speed after back pain
induction (Jeffcott et al. 1982).
This result stands in contrast to findings of increased back motion after unilateral pain
induction (Gomez Alvarez 2007). An increase of lateral spinal motion towards the painful
side was observed and explained by reduced muscle function due to muscle pain. The reverse

27
movement pattern towards the non-affected side suggested stiffening of the painful muscle
and abnormal muscle function (Gomez Alvarez 2007). A previous study of induced back pain
demonstrated only a slight convexity of the back but showed increase rigidity and an inability
to perform at high speed (Jeffcott et al. 1982).
Other factors which seemed to have an impact on the mobility of the back are breed and age.
Dressage horses, for example, tend to have longer lumbar backs than show jumping horses
(Cassiat et al. 2004; Johnston et al. 2002). The length of the thoracic back has been shown to
correlate positively with the amount of laterolateral motion of the lumbar spine in walk and
trot. As a consequence these horses may be prone to a higher risk of caudal back injuries
(Johnston et al. 2002). A significant negative correlation was found between age and the
range of flexion and extension. Older horses tended to have stiffer backs and therefore
reduced dorsoventral flexion in the thoracolumbar area caused by degenerative changes of
articular and spinous processes (Johnston et al. 2004).
II.1.2.4.4 Trunk muscle activity
Trunk musculature has already been described as an important body part which contributes to
maintaining stability, balance and locomotion of the equine body. Superficial epaxial muscles,
such as the LD, are dynamic and play a role in regional vertebral motion, whereas deep
epaxial muscles, for example multifidus, have a more static function and are active in
segmental stabilisation, proprioception and posture. The epaxial muscles extend the back
during bilateral activation and produce lateral flexion and rotation when activated unilaterally
(Nickel et al, 1986). Several studies have been performed to evaluate the role of different
trunk muscles by using electromyography (EMG) to record muscle activity during movement
(Licka et al. 2008; Licka et al. 2004; Peham et al. 2001; Robert et al. 1999; Robert et al.
2001b). EMG is a technique which is widely used to measure excitation patterns of muscles.
The electrical activity emitted by active muscle fibres is received by special sensors and
recorded as the electrical activity pattern of local muscle fibres (Lieber 2002).
Two of the major muscles involved in trunk movement are the LD and the Rectus abdominis
muscle (RA). They have antagonistic activity and function. During walk LD showed only
weak activity bursts in the middle of the stance phase of both hind limbs while RA was not
active throughout the stride cycle (Tokuriki et al. 1997). In trot, RA is active during extension
while LD is active during flexion of the back. The activation pattern for both muscles shows
two activity bursts per stride cycle. RA is active during the first part of the diagonal stance
phase when initial forward and downward movement of the body and acceleration of visceral

28
organs continue. These observations lead to the opinion that extension is a passive
phenomenon (Robert et al. 1998; Tokuriki et al. 1997). The function of RA, and also of the
active obliquus externus abdominis muscle, is thought to oppose the forces exerted by the
moving visceral mass and abdomen and therefore limit the passive thoracolumbar extension.
The LD and also the multifidi muscles have a reciprocal activity to RA and oliquus externus
abdominis. During the second half of the diagonal stance phase the LD is activated until the
early swing phase. This is the time when the back is flexed due to trunk acceleration and due
to released energy from the strong thoracolumbar fascia, ligaments and fibrous tissue
(Alexander et al. 1985). The active LD is presumed to stabilise the back and counterbalance
back flexion during that phase (Robert et al. 1998; Tokuriki et al. 1997). During canter the
LD is active on both sides of the back from early or middle stance phase to the end of the
swing phase of the leading hind limb. LD is thought to stabilise the back and to support the
hind limb during the suspension phase (Tokuriki et al. 1997).
Corresponding to vertebral column locomotion, the associated muscle activity of the RA and
LD shows an increase of activity with higher speeds at trot. In compliance with the movement
pattern of the back the activity bursts of RA and LD occur earlier in the stride cycle. The
duration of the first burst of RA activity is decreased while the second burst remains the same.
This can be explained by the shortened stance phase of the ipsilateral hind limb. The required
force counterbalancing the inertial force of the abdomen and visceral mass is reduced and
therefore the activity of RA is shortened. As the velocity of the horse increases the LD exerts
higher forces to stabilise the back by holding the vertebrae together. The two activity bursts
appear during the swing phase. The swing phase duration is not as obviously affected by
speed as the stance phase therefore the LD activity duration remains unchanged (Robert et al.
2001a). The suggestion was made that both muscles act mainly to restrict excessive motion
along the vertebral column and the trunk which would provide a stiffer platform for fast
swinging legs which again transmit propulsion (Rooney 1982).
EMG data from trotting horses on an incline revealed a significant increase of LD activity
duration and the tendency of RA activity to be longer (Robert et al. 2001a). It was suggested
that higher muscle activity is required to stiffen the back and neck during propulsion when
paravertebral muscles work concentrically (Denoix and Pailloux 2001). Increased stability of
the body also facilitates raising the body up an incline against gravity.
II.2 Microscopic anatomy
Skeletal muscles perform dynamic and static work which permits locomotion and maintains
body posture and/or position. To understand the biomechanics of the LD function, it is
29
essential to know the basic microscopic structure of the muscle, the gross anatomical
arrangement and the basic muscle mechanics. This chapter provides a brief description of the
composition and structure of skeletal muscle and gives a short introduction to muscle
mechanics and force production.
II.2.1 Skeletal muscle morphology
Each muscle belly is composed of a multitude of muscle fascicles which are surrounded by a
fibrous fascia, the epimysium. The muscle fascicles are enclosed by a dense connective
sheath, the perimysium. Muscle fascicles are composed of muscle fibres which are again
surrounded by loose connective tissue, the endomysium, as well as nerves, capillary blood
vessels and the sarcolemma, a delicate plasma membrane. Each fascicle contains numerous
contractile elements, the myofibrils, which can again be subdivided in the smallest functional
units of the contractile muscle system, the sarcomeres. Epi-, peri-, endomysium and
sarcolemma act as parallel elastic structures and are continuous with the muscle tendons
which attach to the skeleton. These structures transmit the force produced by muscle
contractions onto the bone. The layers of collagen fibres also provide a structural frame work
for the contractile components of the muscle and facilitate economic force transmission
(Nordin and Hirsch-Frankel 2001).
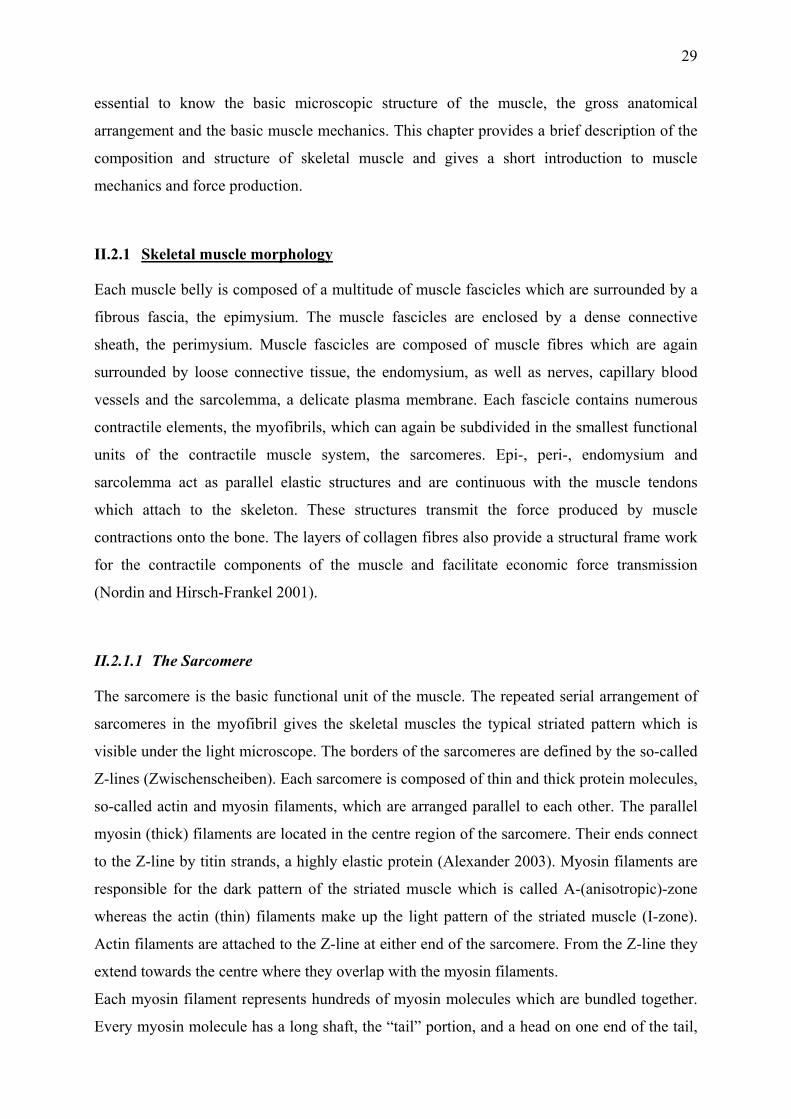
II.2.1.1 The Sarcomere
The sarcomere is the basic functional unit of the muscle. The repeated serial arrangement of
sarcomeres in the myofibril gives the skeletal muscles the typical striated pattern which is
visible under the light microscope. The borders of the sarcomeres are defined by the so-called
Z-lines (Zwischenscheiben). Each sarcomere is composed of thin and thick protein molecules,
so-called actin and myosin filaments, which are arranged parallel to each other. The parallel
myosin (thick) filaments are located in the centre region of the sarcomere. Their ends connect
to the Z-line by titin strands, a highly elastic protein (Alexander 2003). Myosin filaments are
responsible for the dark pattern of the striated muscle which is called A-(anisotropic)-zone
whereas the actin (thin) filaments make up the light pattern of the striated muscle (I-zone).
Actin filaments are attached to the Z-line at either end of the sarcomere. From the Z-line they
extend towards the centre where they overlap with the myosin filaments.
Each myosin filament represents hundreds of myosin molecules which are bundled together.
Every myosin molecule has a long shaft, the “tail” portion, and a head on one end of the tail,

30
called the cross-bridge. The head contains a binding site for actin and an enzymatic site to
catalyse the hydrolysis of ATP (Adenosinetriphosphate) which provides the energy for
muscular contractions. According to the cross-bridge theory (Huxley 1957), the myosin heads
contact with the actin filaments and pivot around their fixed position on the surface of the
myosin filaments. This movement produces the sliding of the actin filaments towards the
centre of the sarcomere until the cross-bridges detach and reattach itself to another site further
along the actin filaments. During continuing muscle shortening this whole circle of cross-
bridge attachment, pull and detachment repeats every 5 nm further along the actin filaments
(Kitamura et al. 1999). The repetitions result in a force transmission along the filaments
which again is transmitted onto the tendon.
The contraction velocity of sarcomeres is determined by the metabolic pathway and the rate at
which energy is made available for these sarcomeres. Enzymatic splitting of
adenosinetriphosphate (ATP) into adenosinediphosphate (ADP) provides the energy to move
myosin cross-bridges during their attachment to actin filaments. Observations have led to the
identification of three distinct metabolic rates of muscle fibres which then were divided into
three major muscle fibre types, Type-I muscle fibres, Type IIa muscle fibres and Type IIb
muscle fibres.
II.2.1.2 Neuromuscular control
The performance of muscle contraction is controlled by the smallest functional unit of the
skeletal muscle, the motor unit.
Skeletal muscles are innervated by somatic motor neurons which propagate electrical signals
(action potentials) from the central nerve system (CNS) to the muscles. At the muscle the
alpha motor neurons divide into multiple branches from which each terminal branch connects
with a single muscle fibre and forms the neuromuscular junction (Prentice and Voight 2001).
The functional connection between a motor neuron and the corresponding muscle fibre is a
chemical synapse, called the end-plate. This neuromuscular synapse contains many vesicles of
a neurotransmitter, acetylcholine. Action potentials travelling along the presynaptic
membrane of the motor neuron release acetylcholine which depolarizes the postsynaptic
membrane of the muscle fibre. Once the postsynaptic membrane is depolarised to its threshold
an action potential propagates along the membrane of the muscle fibre. The acetylcholine is
rapidly hydrolysed by acetylcholinesterase so that the muscle fibre is ready to respond to the
next action potential (Kandel et al. 2000).

31
An alpha motor neuron and all corresponding, innervated muscle fibres form a single motor
unit represent the smallest functional unit of the skeletal muscle. The whole muscle contains
many motor units which can be made to contract independently (Prentice and Voight 2001).
Electrical signals, which stimulate the motor neuron, sufficiently activate all corresponding
muscle fibres in the motor unit. They contract either maximally or not at all as response to
stimulation.
The size of the motor unit depends on the size and the function of the muscle. The motor units
of small muscles which perform a high degree of coordination contain only a small number of
muscle fibres whereas in large muscles the number of muscle fibres per motor unit can be up
to 1000-2000 fibres. This means that motor units which contain more muscle fibres can exert
larger forces per nerval stimulation. The size and functional properties of motor units vary not
only between muscles but also within a muscle. The electrical currents resulting of all
activated muscle fibres of a motor neuron generate an electrical signal. The pattern of this
electrical signal reflects the relative timing and amplitude and can be recorded as an
electromyogram (EMG) (Kandel et al. 2000). EMG studies have demonstrated that some
muscles have discrete compartments which are innervated by different motor nerve branches
and contain different corresponding muscle fibre types. Despite the fact that they are in the
same muscle they can show different muscle activation patterns (Lieber 2002). Nevertheless
there are muscles which are predominately designed for a specific activity and therefore they
are composed of a higher percentage of either slow-twitch or fast-twitch muscle fibres. Such
differences can be found, for example, between the soleus muscle and the medial and lateral
gastrocnemius of the cat. The soleus muscle which comprises mainly of slow-twitch fibres
maintains postural control and is active during walk. In contrast lateral and medial
gastrocnemius muscles consist of fast-twitch fibres and are active during faster gaits to
provide more rapid and forceful ankle extension (Biewener 2003).
II.2.2 Structural arrangement of skeletal muscle
The internal structure of the muscle belly and the muscle fibre arrangement has a huge
influence on muscle function and force generation.

32
II.2.2.1 Muscle architecture
Muscle can be divided into parallel-fibred, fusiform and pennate-fibred muscles (Fig. 4-Fig.
6) depending on the arrangement of the muscle fibres.
In parallel fibred muscles, muscle fibres run from origin to insertion, parallel to the pull of the
tendon and force transmission. These muscles are characterised by relatively long muscle
fibres with little or no tendon. In contrast, pennate muscles have longer tendons and an
additional internal tendon or aponeurosis. The muscle fibres run at an angle to these tendinous
structures that means at an angle to the line of force transmission. Pennate muscles have
generally shorter muscle fibres than parallel fibred muscles. During contraction the change of
muscle fibre length is less than the muscle length change.
Fig. 4 The equine sartorius muscle as an example for a parallel fibred muscle. Muscle fibres extend the full length of the muscle belly. The force transmission to the tendon is parallel to the muscle fibre arrangement. (Courtesy of Dr. R. Payne, The Royal Veterinary Collage).
Fig. 5 The cranial tibialis muscle as an example for a bi-pennate muscle. Muscle fibres are arranged in an angle to the central tendon and therefore are orientated at an angle to the line of pull. (Courtesy of Dr. R. Payne, The Royal Veterinary Collage)
33
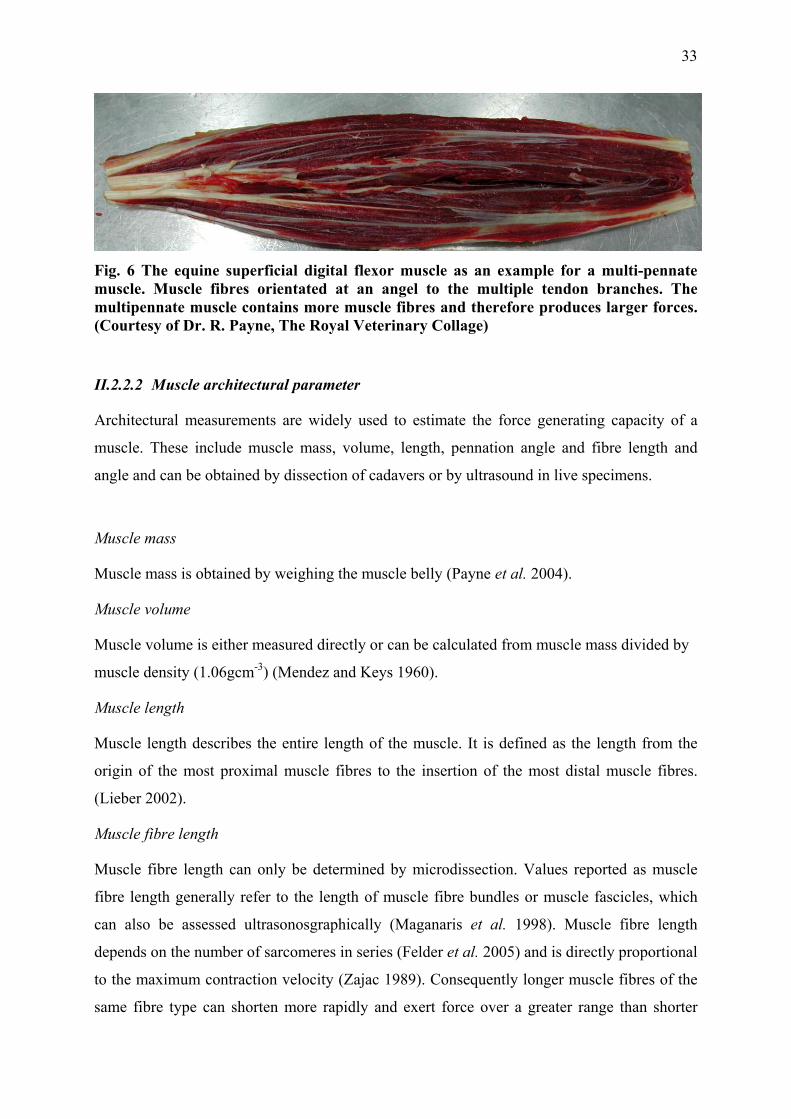
Fig. 6 The equine superficial digital flexor muscle as an example for a multi-pennate muscle. Muscle fibres orientated at an angel to the multiple tendon branches. The multipennate muscle contains more muscle fibres and therefore produces larger forces. (Courtesy of Dr. R. Payne, The Royal Veterinary Collage)
II.2.2.2 Muscle architectural parameter
Architectural measurements are widely used to estimate the force generating capacity of a
muscle. These include muscle mass, volume, length, pennation angle and fibre length and
angle and can be obtained by dissection of cadavers or by ultrasound in live specimens.
Muscle mass
Muscle mass is obtained by weighing the muscle belly (Payne et al. 2004).
Muscle volume
Muscle volume is either measured directly or can be calculated from muscle mass divided by
muscle density (1.06gcm-3) (Mendez and Keys 1960).
Muscle length
Muscle length describes the entire length of the muscle. It is defined as the length from the
origin of the most proximal muscle fibres to the insertion of the most distal muscle fibres.
(Lieber 2002).
Muscle fibre length
Muscle fibre length can only be determined by microdissection. Values reported as muscle
fibre length generally refer to the length of muscle fibre bundles or muscle fascicles, which
can also be assessed ultrasonosgraphically (Maganaris et al. 1998). Muscle fibre length
depends on the number of sarcomeres in series (Felder et al. 2005) and is directly proportional
to the maximum contraction velocity (Zajac 1989). Consequently longer muscle fibres of the
same fibre type can shorten more rapidly and exert force over a greater range than shorter

34
fibres (Wickiewicz et al. 1983). Muscles with shorter fibres are usually stronger due to more
muscle fibres and therefore a higher number of sarcomeres in parallel.
Pennation angle
The pennation angle (α) describes the angle at which the muscle fibre inserts onto the tendon
or aponeurosis. In parallel fibred muscles muscle fibres orientate in the direction of the tendon
hence parallel to the axis of the force transmission. In these muscles the pennation angle is
zero (α=0) (Alexander and Vernon 1975; Gans 1982; Zajac 1989) .
In contrast pennate muscles have generally shorter muscle fibres which insert at an acute
angle (α > 0) onto the tendon (Biewener 2003). Consequently muscle fibre orientation affects
the physiological cross-sectional area of the muscle since more muscle fibres can fit in the
same muscle volume than in parallel muscle fibres and therefore transmit more force to the
tendon. Nevertheless, pennate muscles experience some loss of force transmission due to their
angle of insertion. Muscle fibres inserting, for example, at an angle of 20 degrees transmit
only 95% of their muscle force onto the tendon (i.e. Ft=Fmcos (20) = 0.94 Fm) (Biewener
2003; Wickiewicz et al. 1983).
From measurements of the architectural parameters the following functional parameters can
be calculated: physiological cross-sectional area, muscle volume, maximal isometric force,
maximal contraction velocity and power
Physiological cross-sectional area
The physiological cross-sectional area (PCSA) determines the cross section of a muscle when
all muscle fibres are cut at right angles. The PCSA describes the number of parallel
sarcomeres and is directly related to the amount of force that a muscle can exert.
The PCSA can be calculated with the following equation (Alexander and Vernon 1975; Gans
1982; Narici 1999)
PCSA= (Mmcosθ) / ρ x FL
Mm= muscle mass (g), Cos θ = pennation angle, ρ= muscle density 1.06gcm-3, FL = fibre length (cm) The pennation angle of the muscle fibres influences the force transmission of the muscle to
the tendon. The cosine of pennation angles ≤ 20° are close to one and therefore has little

35
effect on the estimation of PCSA. Furthermore the complex three-dimensional structure of the
muscle and subsequently the pennation angle is known to change during contraction.
Therefore in several anatomical muscle studies the following equation is used to calculate
PCSA (Payne et al. 2006; Payne et al. 2005; Smith et al. 2006).
PCSA= Vm / FL
Vm = muscle volume, FL = fibre length (cm)
A parallel fibred muscle with a given muscle mass has a smaller PCSA and longer muscle
fibres than a pennate muscle of equal mass. A pennate muscle of the same muscle mass has a
larger PCSA and hence transmits more force to its tendon, but has lesser shortening capacity
due to shorter muscle fibres. This is in contrast to the parallel-fibred muscle which has a
smaller cross-sectional area, longer muscle fibres and provides a greater range of motion with
increased contraction velocity (Biewener 2003).
The performance of a muscle can be expressed by maximal isometric force (Fmax) and
maximal contraction velocity (Vmax).
Maximal isometric force
Maximal isometric force (Fmax) is determined by multiplying physiological cross-sectional
area by the maximum isometric stress of vertebrate skeletal muscle (0.3 MPa) which means
that maximal isometric force is proportional to the PCSA hence the number of sarcomeres in
parallel (Medler 2002; Wells 1965; Woledge et al. 1985; Zajac 1989).
Maximal contraction velocity
Maximal contraction velocity (Vmax) depends on the number of sarcomeres and the degree of
overlap between actin and myosin filaments. Muscles with longer muscle fibres have greater
contraction velocity due to a higher number of sarcomeres in series. Contraction velocity is
influenced by the load against the muscle contracts. With decreased load muscle contraction
velocity increases hence maximal contraction velocity is reached when the muscle contracts
against no load.

36
II.3 Muscle function and mechanics
The main muscle function is to provide body posture and locomotion. This is achieved y
different types of muscle contraction.
II.3.1 Types of muscle contraction
There are different forms of muscle contractions depending on whether the muscle fibres
shorten or elongate or keep the same length. According to the length change of the muscle
fibres the contractions are called isometric, concentric and eccentric contractions.
The isometric contraction is characterised by an activated muscle without any muscle length,
muscle fibre length or sarcomere length change (Rassier et al. 1999). The resultant
mechanical work is zero. Isometric contractions are often used to stabilise joints or other
muscles. In contrast, muscle contraction that permits the muscle to shorten is defined as
concentric contraction. Concentric contraction occurs when the muscle exerts enough force to
overcome the resistance of the load which is less than the maximum isometric force. This
results in shortening of the muscle. As the load which the muscle is required to lift decreases,
contraction velocity increases. The muscle does positive work. During eccentric contractions
the muscle can not exert enough force to overcome the resistance of the load. The muscle
lengthens while it is contracting due to the high external load. In eccentric contraction
mechanical work is negative.
The muscle mechanics describe the amount of force a muscle can exert. This is influenced by
several factors such as the type of contraction, the speed of contraction and the length of
contraction. The following relationships show these factors theoretically.
II.3.2 Force-length relationship
Length-tension relationship describes the relationship between muscle length and force
generationFehler! Verweisquelle konnte nicht gefunden werden.. The force developed
during isometric contractions varies with the starting length of the muscle and the actin and
myosin overlap in the sarcomere (Gordon et al. 1966).
If muscle and consequently sarcomeres fibres are highly stretched the overlap between actin
and myosin filaments is missing. The muscle develops no active force. With decreased
sarcomere length force generation increases. Maximal isometric tension is reached when actin
and myosin filaments overlap along their entire length and the number of cross-bridges is

37
maximal. However, if the sarcomere length decreases below a certain length the actin
filaments from one side overlap with the opposite actin and myosin filaments which cause
interference of the cross-bridge formation. This results in a reduction of muscle output.
In contrast to active muscle tension during muscle contraction passive tension occurs when
the muscle is stretched to various lengths without muscle stimulation. At the optimal
sarcomere length passive tension is almost zero. With increased stretching passive tension
increases due to passive tension of elastic components of the myofibrils (Labeit and Kolmerer
1995; Magid and Law 1985). These passive components are giant proteins called titin which
origin from the Z-line and anchor to the thick filament and the M-Line. Titin is thought to
provide the force to re-establish the thick and thin filament-overlap after the sarcomere was
stretched beyond the point cross-bridge attachments become impossible (Herzog 2000).
Therefore passive tension can play a role in providing resistive force also during absent
muscle activity (Labeit and Kolmerer 1995; Magid and Law 1985).
II.3.3 Force-velocity relationship
The force-velocity relationship describes the force generated by a muscle as a function of
velocity under conditions of constant load (Lieber 2002). Muscles were stimulated to contract
against a load which was less than the maximum isometric tension it could generate. The
muscle began to shorten (concentric contraction). If the load decreases contraction velocity
increases and force generation decreases. As the load on the muscle increases and exceeds the
point of maximum isometric tension the external force on the muscle is greater than the force
that the muscle can generate. The muscle is forced to lengthen (eccentric contraction). During
eccentric contraction the absolute muscle tension is high relative to the maximum isometric
tetanic tension and the contraction is independent of the contraction velocity.
II.4 Pathological changes of the equine back
Back problems in horses have been recognised for a long time. In 1876, injuries of the equine
back were already described as common problems (Lupton 1876). Aetiopathogenesis is still
not completely understood today and diagnosis and treatment remains challenging in the
horse.

38
II.4.1 Aetiopathogenesis and clinical signs
Many back problems seem to be associated with chronic and persistent injuries and multiple
lesions are common in horses with back problems (Jeffcott and Haussler 2004). However, in
general, there appears to be a correlation between the conformation of the horse, sex, breed or
type of use and the type of injury which is sustained (Jeffcott 1979, 1980). A whole range of
underlying causes can affect the vertebral column and adjacent structures. They can be
separated into three major categories: primary back problems, which can be subdivided in soft
tissue injuries, osseus injuries, neurologic disorders and tack related problems; secondary
back problems and presumed back problems. The specific lesions and problems associated
with the different categories are displayed in Table 3 (Jeffcott and Haussler 2004).

39
Table 3 Differential diagnoses for horses with back problems (by Jeffcott and Haussler, 2004)
Type of back problem General category Specific lesion or problem Primary back problems Soft tissue injury Longissimus muscle strain Supraspinous ligament sprain or desmitis
Dorsal sacroiliac ligament sprain or desmitis
Exertional rhabdomyolysis Non-specific soft tissue injury
Osseous injury Conformational or developmental abnormality
Over-riding or impinged dorsal spinous processes
Osteoarthritis (e.g. articular processes) Vertebral fracture Spondylosis Diskospondylitis Spinal neoplasia
Neurogenic disorders Equine protozoal myeloenecephalitis (EPM)
Equine degenerative myeloencephalopathy (EDM)
Equine herpesvirus myeloencephalitis (EHV-1)
Equine motor neuron disease (EMND) Tack associated Poor saddle fit or excessive pressure Secondary back problems Hindlimb lameness Forelimb lameness Neck problem Acute sacroiliac injury Chronic sacroiliac disease Pelvic fracture Presumed back problems Bad temperament Lack of ability (rider or horse) Lack of fitness Improper tack fit or use Dental problems

40
The clinical symptoms for these lesions and problems vary widely in their nature and severity.
Depending on the underlying reason horses are presented to the veterinarian because of poor
performance, intolerance of exercise, stiffness of the back and hindlimbs and back pain.
Soft tissue injuries usually occur as a result of slips, falls or poorly performed jumps which
may be caused by fatigue or inadequate fitness of the horse. These incidences can lead to uni-
or bilateral strains of the epaxial muscles and ligaments. Clinical signs of muscle strain may
include an acute onset of poor performance accompanied by changes of the horses
temperament, localised heat and swelling. Gait abnormalities such as stiffness of the hindlimb
and the back, disunited canter and frequent breaking of strides are commonly seen in horses
with back pain. There can be a marked reduction of thoracolumbar flexion and obvious pain
palpating this area. In some acute cases an elevated level of muscle-derived enzymes can be
measured after mild exercise. Metabolic disorders of the back muscles show similar clinical
signs but are usually characterized by high levels of muscle-derived enzymes (CK and AST)
after exercise or characteristic levels of metabolic substances seen in longissimus dorsi
muscle biopsy samples (Quiroz-Rothe et al. 2002). Back muscle tension or strain may also be
diagnosed secondary to lameness. Other soft tissue injuries such as strain of spinal ligaments
are usually caused by the same traumatic reasons as muscle strain. A common site of injury is
the supraspinous ligament which is adherent to the summits of the thoracic and lumbar dorsal
spinous processes. Clinical signs are similar to those caused by back muscle strain. However,
additional signs that may be visible include swelling, pain on palpation, and reduced lateral
flexion. Severe injuries to spinal ligaments are characterised by complete ligamentous
disruption and joint laxity (Jeffcott and Haussler 2004).
Osseous pathology of the vertebral column and the sacroiliac articulation can also be a major
cause of chronic poor performance in horses (Gills 1999; Jeffcott 1980; Jeffcott et al. 1985;
Jeffcott and Haussler 2004). The most common locations for degenerative changes of the
spine are the facet joints and the sacroiliac articulation (Denoix, 1999a; Denoix, 1999b;
Haussler et al, 1999). These synovial joints undergo progressive stages of degeneration:
dysfunction, instability and degeneration. They are characterised by restricted mobility,
localised pain and inflammation which can cause hypertonicity of the paraspinal muscles.
With continuing joint immobilisation bone demineralisation, capsular adhesions and loss of
ligamentous strength take place. Initial musculotendinous contractures are followed by
capsular, periarticular and intra-articular adhesions. The dysfunctional joint is unable to
sustain normal biomechanical stress. Consequently changes of subchondral bone,
cartilagenous, capsular and ligamentous deformation and degeneration result in joint

41
instability which again affects proprioception and the central neuromotor control of
movement and posture. Radiographic findings often include osteophyte formation, spinal
ligament ossification, spinal ankylosis and other signs of advanced osteoarthritis (Jeffcott and
Haussler 2004; Ross and Dyson 2002).
Impinged or over-riding dorsal spinous processes (kissing spines) were reported to be another
frequent cause of back pain in horses and occur commonly between T10 and T18 (Denoix
1999a). However, a high percentage of horses with no clinical signs of back pain also show
radiographic osseous changes of the dorsal spinous processes which complicate precise
diagnostic (Ross and Dyson 2002). A higher prevalence of spinous process impingement was
observed in Thoroughbreds due to narrower interspinous spaces and misshapen dorsal apices
(Jeffcot L 1979, Townsend et al, 1986). Competitive jumping horses also seemed to have a
higher incidence of pathological changes of the spine induced by increased dorsoventral
flexion and demanding spinal manoeuvres (Jeffcott 1979).
Conformational deformities of the spine such as scoliosis, lordosis and kyphosis can be
congenital. Lordosis can also be found in aged horses or brood mares after several foals. The
alterations of the spinal curvature can lead to an extra stress on the vertebral column and
adjacent soft tissue structures which can result in soft tissue strain and alteration of the
vertebral bones (Ross and Dyson 2002).
In humans, the pain element of a back problem is considered to be as important as the original
injury or disease. Primary back pain is caused by the irritation of spinal nerve roots, branches
of the spinal nerves and their communicating receptor system (nociceptive receptors). The
nociceptive receptors are represented as freely ending nerve fibres distributed throughout all
kinds of tissue (skin, muscle, joint and viscera). These nerve endings are activated by
chemical, mechanical and traumatic factors. Unlike in humans the unspecific nature of
clinical signs associated with back problems contribute to the challenge of diagnosing back
pain in horses.
To evaluate the factor pain in horses with back problems, back pain was induced by injections
of concentrated lactic acid into the equine back. This resulted in local pain, stiffness and
noticeable reduction in performance but did not induce lameness (Jeffcott et al. 1982). A
more recent study, however, found an increase in back motion after pain induction on one side
(Gomez Alvarez 2007).

42
II.4.2 Diagnostic methods
The clinical examination remains a challenging task in horses with back pain. The majority of
horses are presented with impaired performance. Locating and quantifying back pain is
difficult especially as some horses perform satisfactorily in spite of low-grade back pain and
some horses appear to be hypersensitive along the back which can falsely be interpreted as a
sign of pain (Jeffcott and Haussler 2004). Collection of the detailed history of onset and
progression of the back problem is important and helpful to isolate the cause of back pain as
well as to discover any related schooling and equestrian problems. A thorough clinical
examination is necessary to rule out any underlying limb lesion which could account for
secondary back pain before proceeding with more advanced diagnostic imaging techniques.
The following paragraphs describe the systematic examination of horses with back problems.
II.4.2.1 Clinical examination
The clinical examination starts in general with a visual inspection of the horse in stance to
assess any abnormalities in behaviour and posture, as well as any swelling or asymmetry of
the spine, epaxial musculature, pelvis or tail. This is followed by palpation to determine pain
along the back. Gentle, superficial and firm deep palpations can detect pain, heat or swelling
along the tips of the dorsal spinous processes, the supraspinous ligament, the epaxial muscles
or the saroiliacal region and help to identify supraspinous desmopathy and deformation or
malalignment of the spinous processes. Focal muscle spasm can point to the presence of
significant lesions (Ross and Dyson 2002). Skin stimulation of the dorsal and lateral aspects
of the neck and the trunk is also used to manipulate the horse and induce dorsoventral
movements of the cervical and thoracolumbar spine and the lumbosacral junction. The
response in form of restriction or intolerance of motion helps to isolate potential sources of
pain (Ross and Dyson 2002). However, different degrees of sensitivity between horse breeds
contribute to the confusion over evaluating sites of pain. For example thin-skinned
thoroughbred-type horses may give the false impression of a painful back by guarding the
back and having protective spasm of the epaxial musculature. In contrast, more stoical cob-
type horses may have a lack of sensitivity and an inherently restricted range of motion.
Examination during motion is performed to assess abnormalities of gaits. The horse is
exercised on a straight line as well as on circles in different gaits. Gait abnormalities,
restricted movement of the back, stiffness and restricted hind limb action can be presented in
horses with back pathology. Examination of the horse being ridden is useful to detect any

43
influence of the rider and tack because some horses show signs of back pain only when they
are ridden. At times alterations of behaviour and temperament of the horse can be observed
when the horse is tacked or mounted. For example, horses with seemingly sensitive backs will
often dip the back when saddled or mounted by the rider, but this is not necessarily a sign of
back pain. After identifying the site of pain local anaesthesia is performed to asses the clinical
significance of this particular area. Infiltration of painful areas of soft tissue, articular or
osseous structures of the back and pelvis with local anaesthesia is supposed to block out the
pain and alter the range of motion and/or gait. The injection of local anaesthesia in narrowed
interspinous spaces can assess the significance of the over-ridden or impinged spinous
processes. Injection of deeper structures along the vertebral column should be performed
under ultrasonographic guidance. Intra-articular injections of the articular processes are
difficult to perform due to the narrow joint space and small joint cavity and therefore deeper
injections are effectively intramuscular injections. The close location to the intervertebral
foramen and hence the neurovascular structures may influence the interpretation of the result
of the local anaesthesia (Jeffcott and Haussler 2004; Ross and Dyson 2002). It was also
demonstrated that local anaesthetic injection in sound horses influenced the range of back
motion and resulted in an increase of flexion and extension as well as lateral bending during
walk. In trot a decreased range of motion was detected at L3 (Holm et al. 2006).
II.4.2.2 Diagnostic imaging
A number of different diagnostic imaging methods are available to identify certain
pathological changes of the equine back. Radiography, nuclear scintigraphy and
ultrasonography are widely used in equine practice. Each of these techniques is suited to
certain conditions of back pathologies and is briefly described in the following paragraphs.
II.4.2.2.1 Radiography
Radiography generally includes laterolateral and oblique projections of the vertebral column
with the horse standing square. Due to the difference in radiographic density of the more
dorsal compared to the more ventral parts of the spine, it is often necessary to acquire two sets
of radiographs with different exposures. High-output x-ray generators are necessary and it is
often difficult to acquire images of diagnostic quality, especially in the lumbar region of
heavy horses. In a slightly dorsoventral oblique view the articular facets of the vertebrae
(between T7-T17) can also be projected. This technique is useful to show overriding dorsal
spinous processes, ventral spondylosis and osteoarthritis of the dorsal articular facets.

44
Interpretation of radiographic appearance of the facet joints is often difficult due to
superimposition and scatter induced noise (Weaver et al. 1999).
II.4.2.2.2 Nuclear scintigraphy
Nuclear scintigraphy with Technetium99m-phosphonates is commonly used in the horse to
assess musculoskeletal structures and reflects vascularisation and bone turnover. It has shown
to be useful in detecting active overriding dorsal spinous processes, ventral spondylosis,
osteoarthritis of the dorsal articular facets, spinal fractures and sacroiliac joint pathology.
However it has also been shown that scintigraphic changes are present in horses with no
clinically apparent back disorders (Erichsen et al. 2004).
II.4.2.2.3 Ultrasonography
In general, ultrasonography is used to determine soft tissue alterations. It is useful for the
examination of ligaments, tendons, musculature, joint surface and joint capsules (Denoix
1999c). Different kinds of tissue vary in their ability to return ultrasound signals of an
ultrasound beam generally described as their echogenicity.
The normal image of back muscles is similar to the image of other muscle groups. Muscle is
less echogenic compared to fat and tendinous structures. The transverse images show
disorganized fine echoes scattered throughout the muscle. In the longitudinal view the muscle
is characterized by homogeneous, multiple, fine, parallel echoes (Fig. 7). This sonographic
appearance is due to multiple muscle bundles (fascicles) surrounded by fibroadipose septa
(perimysium). Connective tissue fascia and fat overlying the muscle appears as a bright
echogenic outer margin (Rantanen and McKinnon 1997).
Although superficial structures such as the supraspinous ligament, the longissimus dorsi
muscle and the dorsal sacroiliac ligament around the equine back are easy to document by
ultrasonography, the interpretation of the images needs a certain degree of experience
(Henson 2005). Pathological alterations like insertional desmopathy, avulsion fractures of the
insertion of the supraspinous ligament, kissing spines, hypoechogenic changes in the
ligaments with lesions or hyperechogenic changes from calcification can be observed with
ultrasonogaphic imaging (Denoix 2006). Muscle injuries such as muscle strain are difficult to
detect but severe cases of muscle fibre tearing can be identified ultrasonographically.
Ultrasound images show increased echogenicity of the muscle tissue with thickening of the
connective tissue septae or haematomas in the back muscles (Jeffcott and Haussler 2004; Reef
1998).

45
Fig. 7 Ultrasound image of the equine LD. Showing the hyperechoic muscle septa (white arrows), the hyperechoic superficial thoracolumbar fascia (red arrows) and the hyperechoic bony surface of the rib. Muscle tissue is displayed as hypoechogenic structure.
II.4.2.2.4 Electromyography
Electromyography (EMG) records the electrical activity of muscle fibres by surface or needle
electrodes (Licka et al. 2001b; Robert et al. 1998, 2001b; Tokuriki et al. 1997; Wijnberg et al.
2004; Wijnberg et al. 2003). Muscle activation is provided by the electrical impulse, so-called
action potential, conducted from a nerve along the muscle into the corresponding muscle
fibres. The summation of the local muscle fibre action potentials is recorded and displayed as
electrical activity pattern. In horses EMG has been mainly used to show the activity pattern of
muscles in combination with kinematic data. Duration and intensity of muscle activity in
relation to body motion under different conditions (gait, speed, incline) demonstrated the
function of muscles during locomotion (Licka et al. 2001b; Robert et al. 1998, 2001b;
Tokuriki et al. 1997). However, in humans it was demonstrated that alterations in muscle
activity pattern can predict myogenic or neurogenic changes (Fuglsang-Frederiksen et al.

46
1976; Kimura 2001; Wijnberg et al. 2003) but systemic quantative EMG analyses have been
performed only on a limited number of horses and needs to be further evaluated (Wijnberg et
al. 2003).

47
III. Own investigations: Novel insights into the anatomy and function of the equine
thoracolumbar Longissimus dorsi muscle
III.1 Gross anatomy of the equine thoracolumbar Longissimus dorsi muscle
III.1.1 Introduction
The back forms the dorsal part of the equine body and joins front and hind limbs. It plays an
important role in supporting the trunk and transmits propulsion from the hindlimbs to the rest
of the horse. The back is composed of the vertebrae, numerous ligaments and strong
musculature covered and incorporated by fascia (see chapter II for a detailed description). The
largest muscle of the epaxial musculature is the thoracolumbar Longissimus dorsi muscle
(LD). The muscle originates at the last cervical and the first thoracic vertebrae. It lies bilateral
to the dorsal spinous processes and dorsal to the ribs and transverse spinous processes and it
inserts onto the ribs, the transverse and mammillary processes of the thoracolumbar spine as
well as to the tuber, the crest and the ventral surface of the ilium and the first three sacral
vertebrae.
The knowledge of normal epaxial muscle architecture provides understanding of back
function as muscle architectural parameters (muscle fibre length, pennation angle, muscle
volume, physiological cross-sectional area) determine functional and mechanical properties of
muscles (Gans 1982; Sacks and Roy 1982). The length of muscle fibres and the arrangement
of muscle fibres between tendons or tendon plates determine the capacity of the muscle for
length change and the ability of the muscle to generate force (Biewener and Roberts 2000).
Several anatomical studies have revealed differences of the architectural arrangement between
muscles. These morphological distinctions influence performance and function of the muscles
(Brown et al. 2003a; Lieber and Blevins 1989; Payne et al. 2004; Payne et al. 2005; Sacks
and Roy 1982; Van Eijden et al. 1997; Wickiewicz et al. 1983). Differences of fibre length
and pennation angle with respect to muscle volume and physiological cross-section area
(PCSA) explain the preference of muscles for either force production or velocity contraction
and excursion. The analysis of architectural features in limb muscles of different species has
revealed several specific skeletal muscle adaptations (Brown et al. 2003a; Brown et al. 2003b;
Lieber and Blevins 1989; Payne et al. 2004; Payne et al. 2005; Wickiewicz et al. 1983). The
epaxial musculature acts as antigravity muscles which contribute to the postural stability of
the trunk by reducing the overall trunk movement during vertical movement in the centre of
mass of the body (Carlson 1978; English 1980; Tokuriki 1973b, 1974; Tokuriki et al. 1997).

48
However, kinematic and electromyelographic studies have shown that the LD has to be
capable of fullfilling different functions, therefore it seems reasonable to assume that this is
reflected in a variation of muscle morphology along its length.
Anatomical studies of the equine back published to date have concentrated on the skeletal and
ligamentous structures only. Knowledge about the morphology and function of the equine
back musculature is limited. The epaxial muscles have been studied mainly functionally
(Licka et al. 2008; Licka et al. 2004; Peham et al. 2001; Robert et al. 2001; Robert et al.
2002; Tokuriki et al. 1997) without detailed data on fibre length, cross-sectional area, moment
arms and hence force generating capacity.
The aim of this study was to describe the muscle morphology of the LD in detail. The
objectives included the quantification of fascicle length, pennation angle, PCSA, muscle mass
and muscle volume. It was hypothesised that the equine LD muscle shows differences in fibre
length, PCSA and pennation angle along the muscle and hence varying capacity of force
production and contraction velocity.
III.1.2 Material and Methods
III.1.2.1 Subjects
Twenty-one LD of seven horse and six pony cadavers were dissected and were examined in
this study. The cadavers were obtained from horses that had been euthanased for reasons
unrelated to this study and came from ten geldings and three mares, of different breeds (two
Shetland ponies, four Welsh section A ponies, four Welsh Cobs and three Warmbloods). The
cadavers were selected to present a range of different ages (six months to 32 years,
mean±stdev 13±13 years). They had no history of musculoskeletal pathology and had been
subjected to euthanasia for reasons unrelated to back pathology.
In three cadavers only one LD was obtainable and measured as the muscles of the
contralateral side were damaged during the routine post mortem examination. In one horse the
LD muscles were dissected to demonstrate the innervations pattern of the LD.
III.1.2.2 Experimental protocol
After removal of the thoracic and abdominal contents, limbs and parts of the rib cage were
removed from the carcass. The skin of the back was separated from the trunk along with

49
connective tissue, cutaneous and superficial muscles (latissimus dorsi, serratus dorsalis and
ventralis, trapezius muscle).
The dorsal spinous processes of T12 - T18 and L 2 were identified and marked with pins (5
star office push pins, 24mm). The pins were used as landmarks to relate LD segments to
corresponding vertebrae and ribs. The relative position of the thoracic and lumbar LD in
relation to the bony landmarks and to the middle gluteal, spinalis and iliocostal muscle was
identified and documented by taking digital photographs (Nikon coolpixel P1, Nikon
Corperation, Tokyo, Japan). In the first three cadavers the lateromedial width of LD was
measured between the 12th rib and 2nd lumbar vertebrae to identify the dimensions of the
muscle in relation to the overlying and surrounding muscles. In the following dissections
measurements of muscle width were discarded to focus on the architectural parameters as the
quality of fibre length and pennation angle measurements were affected by progressing post-
mortem decay.
The LD was separated from the spinalis, middle gluteal, iliocostal and multifidus muscle as
well as surrounding fascia. Finally it was removed from the spine and the ribs. Muscle mass
(g) and muscle length (cm) of the whole muscle were determined. The muscle was weighed
on a single-pan scale to obtain the muscle mass. Muscle length was determined by measuring
the beginning of the most proximal muscle fibres to the end of the most distal fibres with a
flexible tape measure (cm). Muscle fascicle length (cm) and pennation angle (º) were
quantified at different sections. For these measurements the muscles were subdivided in three
sections along the muscle: cranial section T1-T12, middle section T13-T18 and caudal section
T18-L6. These subdivisions were based on kinematic findings showing an increased range of
motion in the cranial thoracic spine and less spinal motion in the caudal vertebral column
(Haussler et al. 2001; Townsend et al. 1983). The respective sections were also subdivided in
dorsal and ventral areas by dividing the corresponding section horizontally in half (Fig. 8).
Muscle fascicle length was obtained by cutting along the length of the muscle belly in a 90°
angle to the internal tendon or by making incisions through the muscle belly until the plane of
the muscle fascicles had been detected. With a clear plastic ruler muscle fascicle length were
measured in mm. The measurements were repeated a minimum of ten times in randomly
selected samples at each location and depth.
The resting pennation angles were determined by measuring the angle between the
aponeurosis or internal fascia and the fascicles with a clear plastic protractor in the same
muscle sections as the muscle fascicle length was measured. These measurements were also
repeated a minimum of ten times.

50
5 inch
cranial
caudal dorsomedial
ventrolateral
Fig. 8 Thoracic and lumbar Longissimus dorsi muscle of a pony illustrating the subdivisions used for muscle fascicle measurements (5 inch = 12.7 cm). Subdivisions were based on the different range of movement along the back and were identified by anatomical landmarks. A1 = craniodorsal section, A2 = cranioventral section, B1 = middle, dorsal section, B2 = middle, ventral section, C1 = caudodorsal section, C2 = caudoventral section.
The overall muscle volume was calculated by dividing muscle mass by muscle density (1.06g
cm-3, Mendez and Key, 1960). Due to the changing shape of the muscle and missing muscle
mass measurements for the individual cranial, middle and caudal section of the subdivided
LD, muscle volume for these areas were calculated using unpublished muscle volume data of
a CT study in three equine thoracic and lumbar longissimus dorsi muscles (personal
conversation with Pattama Ritruechai, 2006). Data of this study showed that the percentage of
muscle volume of the three sections is the same between horses (Coefficient of variations, <
0.01). Therefore the volume was calculated for the cranial part (T1-T11), middle part (T12-
T18) and the caudal part (L1-L6) of the LD.
The physiological cross-section area (PCSA) was calculated for the cranial, middle and caudal
part of the subdivided LD with following equation: muscle volume (cm3) was divided by the
mean of muscle fibre length (cm) for the respective muscle sections. The pennation angle was
not included in this calculation because the pennation angle undergoes substantial changes
through contraction (see below). Therefore architectural measurements can not represent the
changes occurring in the 3D real muscle (Otten 1988, Zajac 1989). The maximum isometric
force (Fmax) is proportional to the physiological cross-sectional area and is estimated by
multiplying physiological cross-section area by maximum isometric stress of the vertebral
skeletal muscle (0.3 MPa) (Medler 2002; Wells 1965; Woledge et al. 1985; Zajac 1989).

51
In two of 21 LD muscles the innervation pattern of the dorsal rami of the spinal nerves were
examined through gross dissection and documented with digital photographs.
III.1.2.3 Statistical analysis
The collected data was calculated and processed in Excel (Microsoft Office 2003, Microsoft
Cooperation, Redmond, USA). For further statistical analysis the data was exported to SPSS
(Version 14.0, SPSS Inc., Chicago, IL, USA). The data was tested for normal distribution
using the Kolmogorow-Smirnov test. A univariate linear model was used to assess the effect
of horses and ponies, right and left LD and different sections of LD on muscle parameters. P
value was set at 0.05 for all tests.
III.1.3 Results
III.1.3.1 Descriptive Anatomy
Fig. 9 Ventral view of the left thoracic and lumbar Longissimus dorsi muscle of a pony (5 inch = 12.7 cm). The diameter of the cranial muscle is smaller than of the caudal muscle.
The LD is located bilaterally to the dorsal spinous processes and dorsally to the ribs and the
transverse processes. The muscle originates at the last cervical (C7) and the first thoracic
vertebrae (T1 and T2) via short, flat tendons. It spans along the thoracolumbar vertebral
column and inserts onto the ilial crest, craniomedial to the ilial wing and the sacrum. Along

52
the vertebral column the LD inserts also to the mammillary, transverse and dorsal spinous
processes as well as to the ribs. The mediolateral dimension of the muscle body is smaller in
the cranial thoracic region and increases its size over the whole length of the thoracolumbar
area up to its broad insertion to the ilial wing
(
Fig. 9). Mean ±stdev muscle width increased between T14 and L2 from 15 ± 3 cm to 18 ± 3
cm. The cranial thoracic LD is covered by the spinalis muscle which extends caudal to T13.
In the lumbar area the cranial extension of the middle gluteal muscle is overlying the LD up to
T 18 (Fig. 10).
middle glut eal muscle t horacolumbar Longissimus d orsi muscle
spinalis muscleT18L2
T16 T14
Fig. 10 The thoracolumbar longisssimus dorsi muscle in relation to the iliocostal muscle (blue), the overlying tongue of middle gluteal muscle (green) and the spinalis muscle (red).

53
Fig. 11 Caudal section of thoracolumbar LD inserting onto the iliac wing and the dorsal spinous processes of the lumbar vertebrae and the sacrum. The strong superficial thoracolumbar fascia (white arrows) is visible in the cranial part of the image covering LD and the internal fascia (blue arrows) is visible as a white line in the musculature. Ventral to the thoracolumbar fascia LD was dissected in cascading pattern to show the orientation of muscle fibres.
Strong fascia and aponeuroses surround and divide the LD. The muscle is covered by the
strong superficial thoracolumbar aponeurosis, which joins the supraspinous ligament in the
midline of the back. In the caudal part of the muscle between T17- L5 an internal fascia is
released from the thoracolumbar aponeurosis into the muscle and divides it in two layers,
medial and lateral (Fig. 11-Fig. 13).

54
ICLD
GM
M
Fig. 12 Shows the internal fascia (white arrows) released by the superficial thoracolumbar fascia which separates the longissimus dorsi (LD) and the middle gluteal muscle (MG) at the level of T18 in an adult horse.
The internal structure of the thoracolumbar LD shows multiple muscle bundles (Fig. 14).
These muscle bundles taper and insert to the bone or with very short aponeurotic sheets which
insert onto the ribs and the mammillary and transverse processes of the thoracic and lumbar
vertebrae. In the caudal part of the thoracolumbar LD the segmental organisation is not clearly
visible due to a strong fascia and a number of very thin fascia running through the muscle. In
this area the muscle fibres attach very tightly to the transverse processes of the lumbar
vertebrae and the deep layer of the thoracolumbar fascia.

55
Fig. 13 Caudal section (T17-L5) of the right LD of a six-month-old pony dissected and cut in five transverse muscle slices. The internal fascia (black arrows) which is released by the superficial thoracolumbar fascia (red arrows) is visible as a white structure.
Fig. 14 Ventral view of LD. The removed aponeurosis and fascia from the bony attachments are visible and indicate the attachment of muscle bundles onto the ribs (red arrows) and mamillary and dorsal spinous processes (black arrows). The yellow arrows indicate the innervation of LD by the dorsal rami of the spinal nerve.

56
Orientation of the muscle fibres in the muscle bundles varies widely along the muscle. In the
cranial thoracic part long muscle fibres (mean ±stdev FL 85 ±27 mm) insert with a relatively
small pennation angle (mean ±stdev PA 35 ±12°) (Fig. 16). They are arranged parallel to the
spinal column (Fig. 15). Towards the caudal part of the thoracic LD and in the lumbar LD
muscle fibres decrease in length and their pennation angle increases (mean ± stdev FL 52 ±11
mm; mean ± stdev PA 48 ±15°) (Fig. 17). Muscle fibres dorsal to the internal fascia are
orientated from caudoventral laterally to craniodorsal medially. The muscle fibres ventral to
the internal tendinous sheet in the caudal part of the lumbar LD run in the opposite direction.
They are orientated from cranioventral to caudodorsal (Fig. 18)
The LD of the equine back is innervated segmentally. These segments are equal to the spaces
between the ribs and the transversal spaces of the lumbar spinal region (Fig. 19).
cranial thoracicLongissimus dorsi muscle
T1T2
T3
cranial
caudal
Fig. 15 Lateral view of the cranial thoracic longissimus dorsi muscle (T2-T5). Muscle fibre orientation is almost horizontal and parallel to the axis of the vertebral column.

57
Fig. 16 The cranial-middle section of the thoracic LD (T10-T14) 15 cm lateral to the midline. LD lies dorsal to the ribs (R) and is covered cranial by the spinal muscle (SP). The muscle fibre orientation is indicated by white arrows.
Fig. 17 In a distance of 10cm lateral to the midline the lumbar LD lies dorsal to the ribs (R) and the lumbar transverse processes (L) and ventral to the middle gluteal muscle (GM). Muscle fibre orientation of the lumbar LD is indicated by white arrows.

58
Fig. 18 Caudal section of LD (T16-Sacrum) demonstrating the insertion of the muscle to the iliac crest (caudal), the dorsal spinous processes of the lumbar vertebrae (dorsomedial) and to the sacrum. The muscle fibre orientation (white arrows) and internal aponeurosis (red arrows) of the lumbar LD (T18-L6). In the thoracic section LD is covered by the superficial thoracolumbar fascia.

59
Fig. 19 Ventral view of LD showing segmental innervation of the equine LD. White arrows indicate rami dorsales of the spinal nerve which innervate the corresponding muscle segment.
III.1.3.2 Architectural measurements
The dissected thoracic and lumbar LDs of the 13 cadavers were grouped according to their
breeds in six ponies and seven horses for the descriptive statistical tests.
Muscle mass, overall muscle length and muscle volume
The muscle mass in the dissected horses ranged from 5260 g to 10400 g with a mean ±stdev
muscle mass of 7088 ±1537g. Muscle length ranged from 92 cm to 130 cm with a mean
±stdev of 112 ±14 cm. Muscle volume ranged from 4157 cm3 to 9801 cm3. The mean ±stdev
volume was 6555 ±1601 cm3.

60
Muscle mass, muscle length and muscle volume of the LD in ponies were significantly lower
than for horses (muscle mass p=0.0001, muscle length p= 0.03 and muscle volume p=0.0001).
The muscle mass of the ponies ranged from 1247 g to 4200g with a mean ±stdev of 2222
±1226g. Muscle length had a minimum value of 53 cm and a maximum of 110 cm. The mean
±stdev was 75 ±20 cm. Muscle volume ranged from 1173 cm3 to 3958 cm3 with a mean
±stdev of 2104 ±1150 cm3. All values are presented in Table 4-Table 6.
Right and left LD showed no significant differences in muscle mass and muscle length
between both sides (muscle mass p= 0.9, muscle length p=0.8 and muscle volume p=0.9)
(Table 7-Table 9)
Table 4 Mean values, standard deviation, minimum and maximum values of LD muscle mass measurements (g) in horses and ponies. Muscle mass (g) N Mean Stdev Minimum Maximum
Horse 12 7088 1537 5260 10400
Pony 9 2222 1226 1247 4200
Table 5 Mean values, standard deviation, minimum and maximum values of LD muscle length measurements (cm) in horses and ponies. Muscle Length (cm) N Mean Stdev Minimum Maximum
Horse 12 112 14 92 130
Pony 9 75 20 53 110
Table 6 Mean values, standard deviation, minimum and maximum values of LD muscle volume measurements (cm3) in horses and ponies. Muscle Volume
(cm3) N Mean Stdev Minimum Maximum
Horse 12 6555 1601 4157 9801
Pony 9 2104 1150 1173 3958

61
Table 7 Right and left muscle mass (g) for horses and ponies showing mean values, standard deviation, minimum and maximum values.
Muscle mass (g) N Mean Stdev Minimum Maximum
Horses right 5 6740 1327 5700 8900
left 5 6652 1229 5260 8500
Ponies right 3 2343 1523 1390 4100
left 3 2360 1598 1304 4200
Table 8 Right and left muscle length (cm) for horses and ponies showing mean values, standard deviation, minimum and maximum values
Muscle length (cm) N Mean Stdev Minimum Maximum
Horses right 5 109 15 95 130
left 5 114 16 92 129
Ponies right 3 79 21 65 104
left 3 79 27 59 110
Table 9 Right and left muscle volume (cm3) for horses and ponies showing mean values, standard deviation, minimum and maximum values
Muscle volume
(cm3) N Mean Stdev Minimum Maximum
Horses right 5 6358 1252 5377 8396
left 5 6275 1159 4962 8019
Ponies right 3 2210 1437 1311 3868
left 3 2227 1508 1230 3962
Muscle fascicle length
In horses the mean ±stdev value of the muscle fascicle length was 7.7 ±2.4 cm. The mean
±stdev value of the muscle fascicle length in ponies was 6.8 ±2.6 cm. There was no
significant difference in fascicle length between horses and ponies (p=0.2).

62
In the subdivided LD the fascicle length varied between the cranial (T1-T12), middle (T13-
T18) and caudal (L1-L6) section. Muscle fascicle length decreased from cranial to caudal in
horses and ponies (Fig. 20).
0
2
4
6
8
10
12
14
1 2 3
Longissimus dorsi muscle
Fasc
icle
leng
th (c
m)
Fascicle length HorsesFascicle length Ponies
Fig. 20 Mean (± stdev) muscle fascicle length (cm). Horses and ponies show the same trend of decreasing muscle fascicle length in cranial to caudal direction (cranial=1, middle=2, caudal=3)
Minimum and maximum fascicle length in horses differed from 4.8 cm and 13.8 cm in the
cranial part to 6.2 cm and 13.3 cm in the middle part and from 3.5 cm and 6.7 cm in the
caudal part. The mean ±stdev fascicle length decreased from 9.0 ±2.6 mm (cranial), to 8.4
±2.0 cm (middle) and to 5.4 ±0.9 cm (caudal) (Table 10, Fig. 21).
In the ponies, minimum and maximum fascicle length ranged from 3.8 cm to 11.3 cm in the
cranial part, 4.9 cm to 9.8 cm in the middle and 3.0 cm to 6.4 cm in the caudal part. The mean
(±stdev) fascicle length decreased in cranial to caudal direction from 7.9 ±2.5 cm (cranial) to
7.5 ±1.7 cm (middle) to 4.6 ±1.1 cm (caudal) (Table 11, Fig. 22).

63
Table 10 Mean values, standard deviation, minimum and maximum values of muscle fascicle length (cm) for the cranial, middle and caudal LD in the horse
Fascicle Length
(cm) N Mean Stdev Minimum Maximum
Cranial 12 9.0 2.6 4.8 13.8
Middle 12 8.4 2.0 6.2 13.3
Caudal 12 5.4 0.9 3.5 6.7
Table 11 Mean values, standard deviation, minimum and maximum values of muscle fascicle length (cm) for the cranial, middle and caudal LD in the pony
Fascicle Length
(cm) N Mean Stdev Minimum Maximum
Cranial 9 7.9 2.5 3.8 11.3
Middle 9 7.5 1.7 4.9 9.8
Caudal 9 4.6 1.1 3.0 6.4
Fig. 21 and Fig. 22 show a consistent trend of muscle fascicles length to decrease between the
middle and the caudal section of LD. The changes of fascicle length between the cranial and
the middle part were not uniform and showed even an increase of fascicle length in some of
the muscles. There was a significant decrease of muscle fascicle length between the middle
and the caudal section in horses (p= 0.0001) and in ponies (p=0.001) and also between the
cranial and the caudal section in the horse (p= 0.0001) and ponies (p= 0.0001). There was no
significant difference in fascicle length between the cranial and middle section in horses (p=
0.7) as well as in ponies (p=0.9). Also no significant difference was found between dorsal and
ventral measurements of fascicle length in both horses and ponies (p= 0.9). The mean ±stdev
value of the dorsal and ventral fascicle length was 7.8 ±1.8 cm and 7.6 ±2.1 cm in the horse
and 6.6 ±1.5 cm and 6.5 ±2.2 cm in the pony.
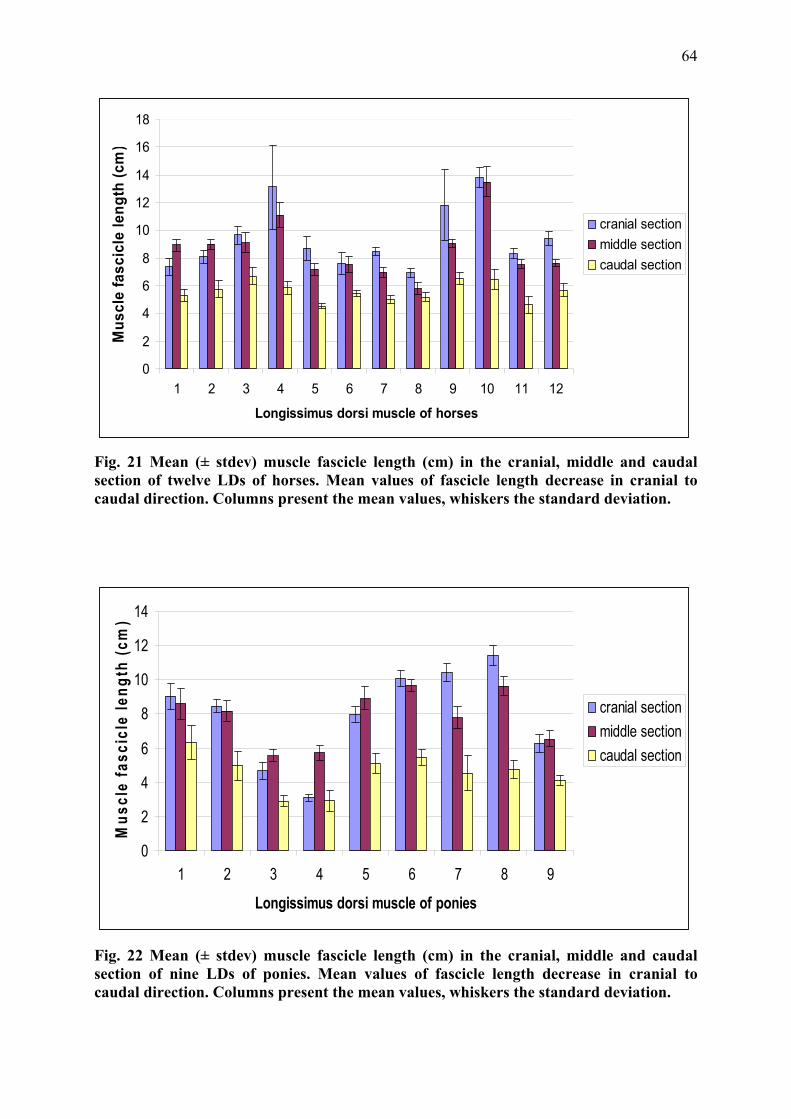
64
0
2
4
6
8
10
12
14
16
18
1 2 3 4 5 6 7 8 9 10 11 12
Longissimus dorsi muscle of horses
Mus
cle
fasc
icle
leng
th (c
m)
cranial sectionmiddle sectioncaudal section
Fig. 21 Mean (± stdev) muscle fascicle length (cm) in the cranial, middle and caudal section of twelve LDs of horses. Mean values of fascicle length decrease in cranial to caudal direction. Columns present the mean values, whiskers the standard deviation.
0
2
4
6
8
10
12
14
1 2 3 4 5 6 7 8 9
Longissimus dorsi muscle of ponies
Mus
cle
fasc
icle
leng
th (c
m)
cranial sectionmiddle sectioncaudal section
Fig. 22 Mean (± stdev) muscle fascicle length (cm) in the cranial, middle and caudal section of nine LDs of ponies. Mean values of fascicle length decrease in cranial to caudal direction. Columns present the mean values, whiskers the standard deviation.

65
Normalised muscle fascicle length
The normalised muscle fascicle length (cm) describing the ratio of muscle fascicle length
(cm) to muscle length (cm) showed a mean (±stdev) value of 0.07 ±0.02 cm in the horse and
0.09 ±0.03 cm in the pony (Table 12). Muscle fibre length normalised for whole muscle
length was significantly longer (p=0.005) in ponies compared to horses.
Table 12 Mean values, standard deviation, minimum and maximum values of the normalised muscle fascicle length (cm) in horses and ponies
Norm. Fascicle
Length (cm) N Mean Stdev Minimum Maximum
Horse 57 0.07 0.02 0.03 0.13
Pony 56 0.09 0.03 0.03 0.17
In the subdivided LD of the horses minimum and maximum fascicle length normalised for
whole muscle length differed from 0.07 cm and 0.09 cm in the cranial part to 0.06 cm and
0.09 cm in the middle part and to 0.03 cm and 0.06 cm in the caudal part. The mean ±stdev
normalised fascicle length decreased from 0.08 ±0.02 mm (cranial), to 0.07 ±0.02 cm
(middle) and to 0.05 ±0.01 cm (caudal) (Table 13, Fig. 24).
In the ponies, minimum and maximum normalised fascicle length ranged from 0.08 cm to
0.11 cm in the cranial part, 0.08 cm to 0.12 cm in the middle part and 0.04 cm to 0.07 cm in
the caudal part. The mean ±stdev values decreased in cranial to caudal direction from
0.1±0.03 cm (cranial) to 0.1 ±0.03 cm (middle) to 0.06 ±0.02 cm (caudal) (Table 14 and Fig.
24).
Table 13 Mean values, standard deviation, minimum and maximum values of the normalised muscle fascicle length (cm) for the cranial, middle and caudal LD in horses
Norm. Fascicle
Length (cm) N Mean Stdev Minimum Maximum
Cranial 12 0.08 0.02 0.07 0.09
Middle 12 0.07 0.02 0.06 0.09
Caudal 12 0.05 0.01 0.03 0.06
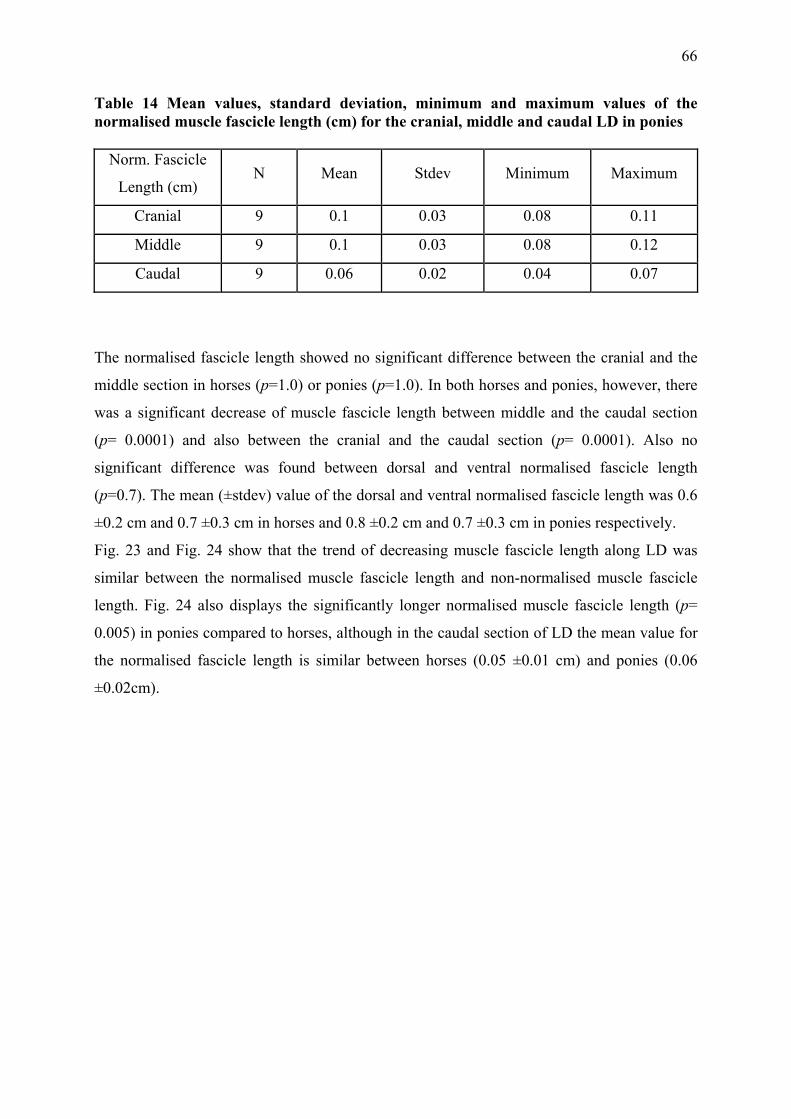
66
Table 14 Mean values, standard deviation, minimum and maximum values of the normalised muscle fascicle length (cm) for the cranial, middle and caudal LD in ponies
Norm. Fascicle
Length (cm) N Mean Stdev Minimum Maximum
Cranial 9 0.1 0.03 0.08 0.11
Middle 9 0.1 0.03 0.08 0.12
Caudal 9 0.06 0.02 0.04 0.07
The normalised fascicle length showed no significant difference between the cranial and the
middle section in horses (p=1.0) or ponies (p=1.0). In both horses and ponies, however, there
was a significant decrease of muscle fascicle length between middle and the caudal section
(p= 0.0001) and also between the cranial and the caudal section (p= 0.0001). Also no
significant difference was found between dorsal and ventral normalised fascicle length
(p=0.7). The mean (±stdev) value of the dorsal and ventral normalised fascicle length was 0.6
±0.2 cm and 0.7 ±0.3 cm in horses and 0.8 ±0.2 cm and 0.7 ±0.3 cm in ponies respectively.
Fig. 23 and Fig. 24 show that the trend of decreasing muscle fascicle length along LD was
similar between the normalised muscle fascicle length and non-normalised muscle fascicle
length. Fig. 24 also displays the significantly longer normalised muscle fascicle length (p=
0.005) in ponies compared to horses, although in the caudal section of LD the mean value for
the normalised fascicle length is similar between horses (0.05 ±0.01 cm) and ponies (0.06
±0.02cm).

67
Fig. 23 Box and whisker plot presenting muscle fascicle lengths in horses (blue) and ponies (green) for the cranial, middle and caudal section. The middle line presents the median, the box the interquartile range, the whiskers the maximum and minimum and the dot an outlier.
Fig. 24 Box and whisker plot presenting muscle fascicle lengths normalised for whole muscle length in horses (blue) and ponies (green) for the cranial, middle and caudal section. The middle line presents the median, the box the interquartile range and the whiskers the maximum and minimum.
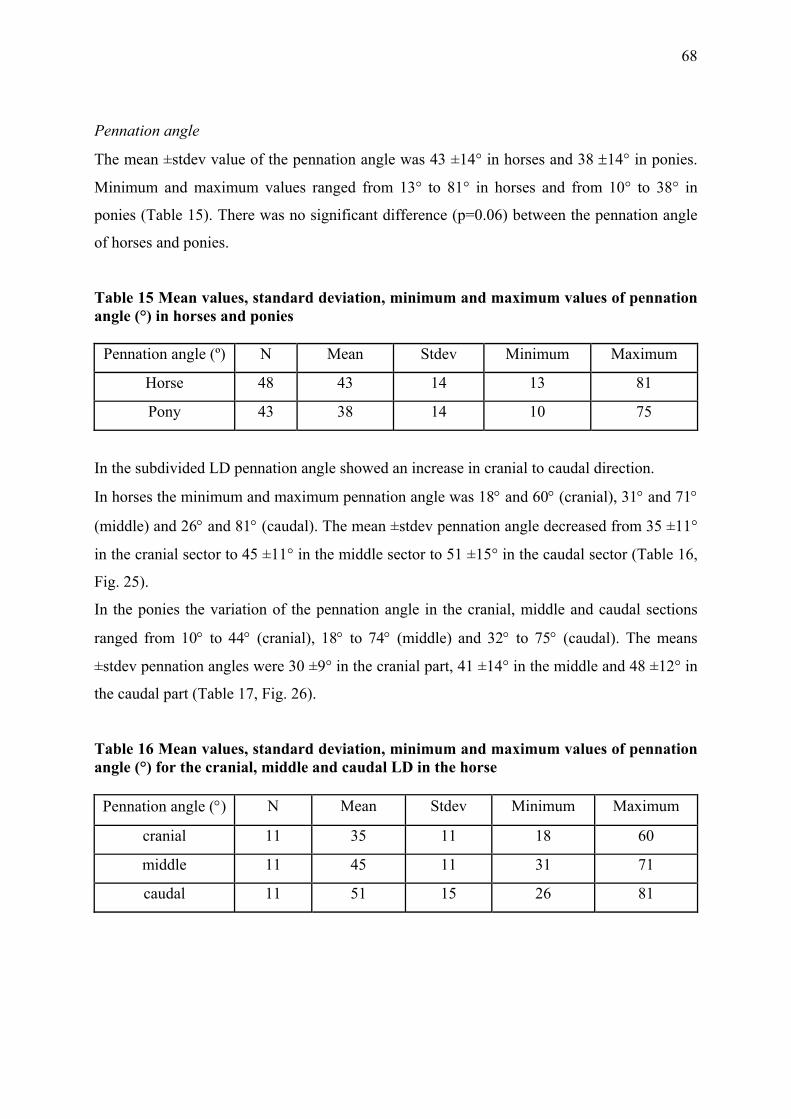
68
Pennation angle
The mean ±stdev value of the pennation angle was 43 ±14° in horses and 38 ±14° in ponies.
Minimum and maximum values ranged from 13° to 81° in horses and from 10° to 38° in
ponies (Table 15). There was no significant difference (p=0.06) between the pennation angle
of horses and ponies.
Table 15 Mean values, standard deviation, minimum and maximum values of pennation angle (°) in horses and ponies
Pennation angle (º) N Mean Stdev Minimum Maximum
Horse 48 43 14 13 81
Pony 43 38 14 10 75
In the subdivided LD pennation angle showed an increase in cranial to caudal direction.
In horses the minimum and maximum pennation angle was 18° and 60° (cranial), 31° and 71°
(middle) and 26° and 81° (caudal). The mean ±stdev pennation angle decreased from 35 ±11°
in the cranial sector to 45 ±11° in the middle sector to 51 ±15° in the caudal sector (Table 16,
Fig. 25).
In the ponies the variation of the pennation angle in the cranial, middle and caudal sections
ranged from 10° to 44° (cranial), 18° to 74° (middle) and 32° to 75° (caudal). The means
±stdev pennation angles were 30 ±9° in the cranial part, 41 ±14° in the middle and 48 ±12° in
the caudal part (Table 17, Fig. 26).
Table 16 Mean values, standard deviation, minimum and maximum values of pennation angle (°) for the cranial, middle and caudal LD in the horse
Pennation angle (°) N Mean Stdev Minimum Maximum
cranial 11 35 11 18 60
middle 11 45 11 31 71
caudal 11 51 15 26 81

69
Table 17 Mean values, standard deviation, minimum and maximum values of pennation angle for the cranial, middle and caudal LD in the pony Pennation angle (°) N Mean Stdev Minimum Maximum
cranial 9 30 9 10 44
middle 9 41 14 18 74
caudal 9 48 12 32 75
0102030405060708090
100
1 2 3 4 5 6 7 8 9 10 11
Longissimus dorsi muscle of horses
Penn
atio
n an
gle
(°)
cranial sectionmiddle sectioncaudal section
Fig. 25 Mean (± stdev) muscle pennation angle in the cranial, middle and caudal section of eleven LDs of horses. Mean values of pennation angle increase in a cranial to caudal direction. Columns present the mean values, whiskers the standard deviation.

70
0102030405060708090
1 2 3 4 5 6 7 8 9
Longissimus dorsi muscle of the ponies
Penn
atio
n an
gle
(°)
cranial sectionmiddle sectioncaudal section
Fig. 26 Mean (± stdev) muscle pennation angle in the cranial, middle and caudal section of nine LDs of ponies. Mean values of pennation angle increase in a cranial to caudal direction. Columns present the mean values, whiskers the standard deviation.
There was a significant difference between the pennation angle of the cranial and middle part
for horses (p=0.05) and ponies (p=0.02) as well as between the cranial and caudal part for
horses (p=0.004) and ponies (p=0.0001). No significant difference was found between the
middle and caudal part for horses (p=0.8) and ponies (p=0.06). No significant difference was
found between dorsal and ventral pennation angle in horses (p=0.2) and ponies (p= 0.9). The
mean ±stdev of the dorsal and ventral pennation angle was respectively 51° ±8 and 41° ±11 in
horses and 41° ±5 and 41° ±12 in ponies.
Physiological cross-section area and maximum isometric force
The physiological cross-sectional area (PCSA) is calculated by dividing muscle volume (cm3)
by muscle fascicle length (cm). The minimum value of PCSA for horses was 642 cm2 and the
maximum value was 1199 cm2. Mean ±stdev PCSA was 869.6 ±189.6 cm2. In ponies the
minimum value of PCSA was 143 cm2 and the maximum value 522 cm2. The mean ±stdev
value was 309.2 ±146.2 cm2 (Table 18). These results show a significantly lower PCSA for
ponies than for horses (p=0.0001).

71
Table 18 Showing mean values, standard deviation, minimum and maximum values of the physiological cross-section area (PCSA) of the whole LD in horses and ponies
PCSA (cm2) N Mean Stdev Minimum Maximum
Horses 12 869.6 189.6 642.0 1199.0
Ponies 9 309.2 146.2 143.0 522.0
The diameter of LD increased in cranial to caudal direction while muscle fascicle length
decreased (Fig. 27). Subsequently PCSA was calculated individually for the cranial, middle
and caudal sections. Muscle volume measurements were obtained from a previous study
(Ritruechai P, 2006). From this study it was emphasised that muscle volume between the
cranial part (T1-T12), middle part (T13-T18) and the caudal part (L1-L6) of the LD had
almost identical percentages of the total muscle volume. The volume for these areas showed
38.7% (cranial), 31.8% (middle) and 29.4% (caudal) of the overall muscle volume with a
coefficient of variation (= standard deviation/ mean) of 0.01. Therefore PCSA of LD was
expected to increase in cranial to caudal direction. Based on muscle fascicle changes the
following results for horses and ponies confirmed the increase of PCSA between cranial and
caudal as well as between middle and caudal sections.
0
50
100
150
200
250
300
350
400
450
Longissimus dorsi muscle
PCSA
(cm
2)
PCSA HorsePCSA Pony
cranial middle caudal
Fig. 27 Mean (± stdev) cranial, middle and caudal PCSA (cm2) of LD are shown for horses and ponies. Columns present the mean values, whiskers the standard deviation.

72
In horses mean ±stdev PCSA was 280.9 ±57.4 cm2 cranial, 256.4 ±68.9 cm2 middle and 355.3
±76.5 cm2 caudal (Table 19, Fig. 28). In ponies the mean values ±stdev of PSCA were 108.5
±48.0 cm2 cranial, 87.2 ±45.1 cm2 middle and 142.0 ±75.8 cm2 in the caudal section (Table
20, Fig. 29).
Table 19 Mean values, standard deviation, minimum and maximum values of physiological cross-section area (cm2) for the cranial, middle and caudal LD in the horses
HORSE N Mean (cm2) Stdev Minimum Maximum
Cranial 12 280.9 57.4 198.0 392.0
Middle 12 256.4 68.9 171.0 354.0
Caudal 12 355.3 76.5 254.0 535.0
Table 20 Mean values, standard deviation, minimum and maximum values of physiological cross-section area (cm2) for the cranial, middle and caudal LD in the ponies
PONY N Mean (cm2) Stdev Minimum Maximum
Cranial 9 108.5 48.0 47.0 180.0
Middle 9 87.2 45.1 40.0 158.0
Caudal 9 142.0 75.8 66.0 251.0
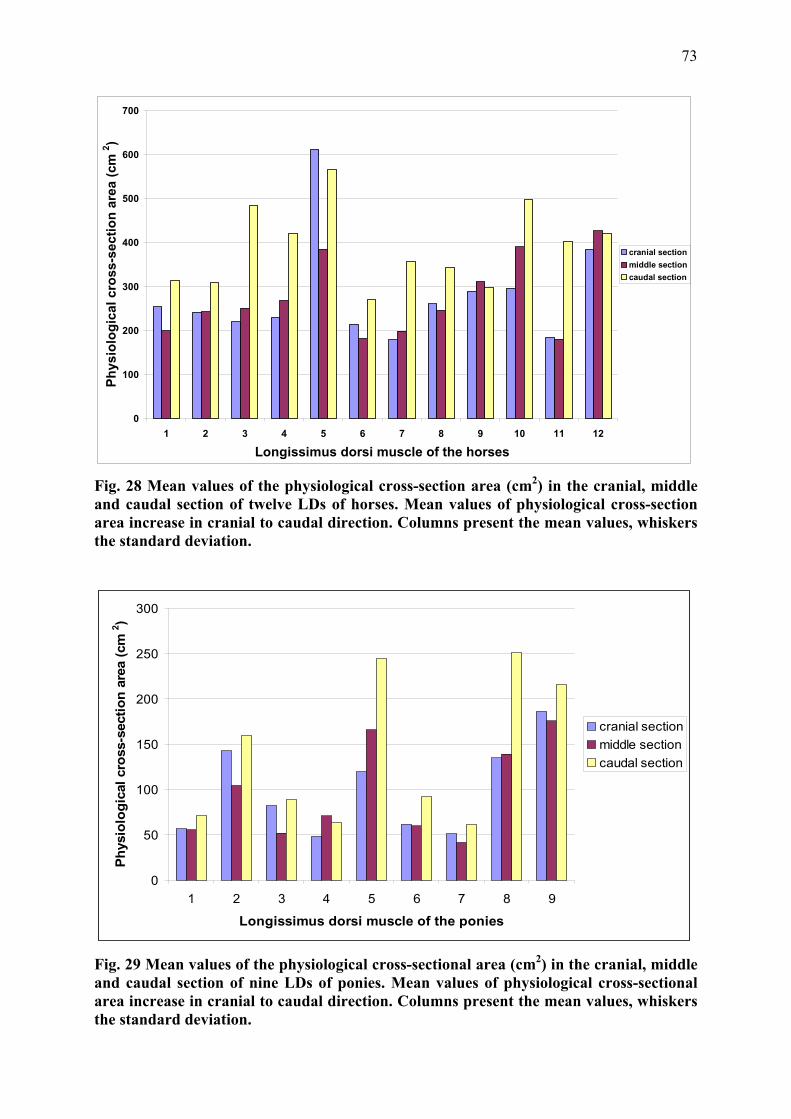
73
0
100
200
300
400
500
600
700
1 2 3 4 5 6 7 8 9 10 11 12
Longissimus dorsi muscle of the horses
Phys
iolo
gica
l cro
ss-s
ectio
n ar
ea (c
m 2 )
cranial sectionmiddle sectioncaudal section
Fig. 28 Mean values of the physiological cross-section area (cm2) in the cranial, middle and caudal section of twelve LDs of horses. Mean values of physiological cross-section area increase in cranial to caudal direction. Columns present the mean values, whiskers the standard deviation.
0
50
100
150
200
250
300
1 2 3 4 5 6 7 8 9
Longissimus dorsi muscle of the ponies
Phys
iolo
gica
l cro
ss-s
ectio
n ar
ea (c
m 2 )
cranial sectionmiddle sectioncaudal section
Fig. 29 Mean values of the physiological cross-sectional area (cm2) in the cranial, middle and caudal section of nine LDs of ponies. Mean values of physiological cross-sectional area increase in cranial to caudal direction. Columns present the mean values, whiskers the standard deviation.

74
In the horses there was a significant difference between the cranial and the caudal section of
LD (p=0.03) as well as between the middle and the caudal section (p=0.03). No significant
difference was detected between the cranial and the middle section of LD (p=1.0)
In contrast, in the ponies there was only a significant difference between the middle and the
caudal section of LD (p=0.05) but no significant difference was shown between the cranial
and the middle section (p=0.3) and between the cranial and the caudal section (p=0.1).
Maximum isometric force (Fmax.)
Maximum isometric force (Fmax) is proportional to PCSA. The mean ±stdev maximum
isometric force for the whole LD was 26088.4 ±5688.6 N/cm2 in the horses and 9278.3
±4386.7 N/cm2 in the ponies (Table 21). The Fmax was significantly larger in horses compared
to ponies (p=0.0001).
Table 21 Mean values, standard deviation, minimum and maximum values of maximum isometric Force (N/ cm2) in horses and ponies
N Mean (N/ cm2) Stdev Minimum Maximum
Horse 12 26088.4 5688.6 19285.0 35983.0
Pony 9 9278.3 4386.7 4291.0 15667.0
Maximum isometric force of the LD changes in a craniocaudal direction in horses. The cranial
region had a mean ±stdev value of 8427.6 ±1721.4 N/cm2, the middle region 7691.9 ±2067.8
N/cm2 and the caudal region 10659.9 ±2296.3 N/cm2 (Table 22). In the ponies the mean value
±stdev of the maximum isometric force was calculated for the cranial region 3253.9 ±1442.5
N/cm2, middle region 2615.1 ±1353.9 N/cm2 and the caudal region 4260.0 ±2275.3 N/cm2
(Table 23).
Table 22 Mean values, standard deviation, minimum and maximum values of maximum isometric Force (N/cm2) for the cranial, middle and caudal LD in the horses
Horse N Mean Stdev Minimum Maximum
Cranial 12 8427.6 1721.4 5936.0 11773.0
Middle 12 7691.9 2067.8 5137.0 10609.0
Caudal 12 10659.9 2296.3 7625.0 16064.0

75
Table 23 Mean values, standard deviation, minimum and maximum values of maximum isometric Force (N/cm2) for the cranial, middle and caudal LD in the ponies
Pony N Mean Stdev Minimum Maximum
Cranial 9 3253.9 1442.5 1420.0 5415.0
Middle 9 2615.1 1353.9 1211.0 4749.0
Caudal 9 4260.0 2275.3 1987.0 7531.0
In the horses there was a significant difference between the cranial and the caudal section of
LD (p=0.03) as well as between the middle and the caudal section (p=0.03). No significant
difference was detected between the cranial and the middle section of LD (p=1.0). In contrast,
in the ponies there was only a significant difference between the middle and the caudal
section of LD (p=0.05) but no significant difference was shown between the cranial and the
middle section (p=0.3) and between the cranial and the caudal section (p=0.1). Fig. 30 shows
the the difference in Fmax between horses and ponies.
Fig. 30 Box and whisker plot showing the maximum isometric force values (N/cm2) for horses (blue) and ponies (green) in the cranial, middle and caudal section of LD. The middle line presents the median value, the box the interquartile range, the whiskers the maximum and minimum and the dot an outlier.
76
III.1.4 Discussion and Conclusion
III.1.4.1 Structure and Function
The knowledge about the functional capacity of the largest muscle of the equine back
contributes to understand the pathogenesis of back problems and hence their diagnosis and
treatment. This study provides architectural measurements of the equine thoracic and lumbar
LD, which contribute to better understanding of the mechanics of the equine back.
The longissimus dorsi muscle as the longest muscle in the horse shows a rather complex
structure. Multiple muscle bundles overlapping one another extend over one or more
intercostal and intertransversal spaces. They attach with rather short tendons or aponeurotic
sheets to the bony structures or insert with muscle fascicles to strong aponeurotic fascia. An
internal aponeurosis which seems to be homologous with the lumbar intermuscular
aponeurosis of man, cat, dog and monkey (Bogduk 1980) divides the muscle in a more
superficial dorsal layer and a deeper ventral layer.
The size and the complexity of LD impact on the calculated values of PCSA, and therefore
the calculation of the force generation capacity of the muscle. To increase the validity of the
architectural data and to reflect the different functional properties of LD the muscle was
subdivided in different sections. The subdivision of muscles with broad attachment sites have
been previously performed in studies of other complex muscles (Dumas et al. 1991; Sharir et
al. 2006; Van der Helm and Veenbaas 1991). In this study the equine LD muscle was divided
based on vertebral landmarks. The thoracic LD was additionally subdivided based on
kinematic findings which were increased range of motion in the cranial thoracic spine and less
spinal motion in the caudal vertebrae.
The analysis of the architectural measurements and calculated parameters suggest differences
in the functional properties within the LD muscle. The variations in the diameter of the
muscle and of the muscle fibre arrangement are reflected in functional variations along the
muscle.
The thoracic LD is characterized by long muscle fibres and relatively small pennation angles.
The rather small diameter in the area of the first few thoracic vertebrae (T1-T4) and slowly
increasing diameter of the thoracic LD from T4-T18 in combination with long muscle fibres
suggest a specialization for velocity contractions and high excursion. Especially in the cranial
part of thoracic LD the pennation angle is relatively small and therefore has limited influence
on the contraction of the muscle. This architectural arrangement of the cranial thoracic LD

77
indicates the prevalence for motion rather than for stabilization as the main task of this muscle
part. This is also supported by the orientation of the muscle fibres. Based on the parallel
arrangement of the muscle fibre to the spine the muscle acts preferentially as lateral flexor
(Bojadsen et al. 2000).
Over the course of the thoracic LD muscle fibre length decreases whereas the pennation angle
and the cross-section area increase towards the caudal part of the thoracic spine. In the caudal
region of LD the large maximum value of the pennation angle in the horse (81°) is more
likely to be an artefact due to post mortem changes of the muscle tissue. However, the larger
dimension of the muscle as well as the relatively shorter muscle fibres suggests a tendency for
more powerful contractions (Payne et al. 2005; Payne et al. 2004).
In comparison to the thoracic LD the lumbar LD shows distinct differences in fibre
arrangement, with smaller muscle fibre lengths and larger pennation angles. Not all muscle
fibres of the lumbar area attach directly to the tendon of insertion. They also attach to the
strong lumbar intermuscular aponeurosis and to multiple intrinsic fascia of the muscle which
divide the muscle in small pennated parts. Hence the architecture of the muscle fibres is more
pennated which results in a rather parallel arrangement of sarcomeres. This design increases
the capacity of the muscle to exert large forces and to experience high tension.
The calculated maximal isometric force for the three different parts of the subdivided muscle
was significantly different between the cranial and caudal and the middle and caudal part. In
the lumbar LD significantly shorter muscle fibres and a significantly larger pennation angle
result in a significantly larger physiological cross-section area. Therefore the arrangement of a
higher number of sarcomeres in parallel leads to the conclusion that this muscle part is
designed to exert larger force (Van Eijden et al. 1997).
These results demonstrate obvious differences in functional capacity between the thoracic and
lumbar LD. The muscle architecture indicates that the whole LD is well suited to a broad
range of tasks. Lateral and dorsoventral flexion in the thoracic LD is made possible by long
muscle fibres. The lumbar and caudal thoracic LD stabilize the vertebral column during
downwards movement of the visceral mass at stance phase due to multipennated short fibred
muscle architecture. Strain energy is stored and utilized in the strong and thick aponeurosis
and the lumbar intermuscular aponeurosis, the elasticity of the aponeurosis acting as energy-
saving mechanism (Ettema and Huijing 1989). In horses the energy saving mechanism of
tendons is well documented. Elastic strain energy is stored when tendinous structure are
stretched and then returned when the strain is released. This optimizes the economy of the
muscle by reducing the required mechanical work (Alexander 1991).

78
The functional arrangement of the muscle fibres of LD corresponds with findings of
kinematic studies of the equine spine. Results of these in vitro and in vivo studies showed a
higher range of motion, in the cranial thoracic vertebral column (up to T14) and at the lumbar
sacral junction (Denoix 1999b; Faber et al. 2001a; Faber et al. 2000; Haussler et al. 2001;
Jeffcott and Dalin 1980). The kinematic results correspond to the architectural findings of the
thoracic and lumbar LD. The prevalence for larger excursion and velocity contraction of LD
in the thoracic area due to the long muscle fibres and small pennation angles reflect the higher
range of motion between T1-T14. The stabilising function of the cranial trunk is provided by
the strong musculature of the neck and the shoulder gridle, the front limbs and the rib cage
contribute to the static support of the cranial trunk and resist against gravity. Although the
largest range of dorsoventral flexion was observed in the lumbosacral joint the decreased
range of motion of the caudal thoracic and lumbar back can be explained by the
characteristics of the LD muscle architecture and the rigidity of the vertebral column. Pennate,
short muscle fibres characterize muscles which generate large forces and exert high tension.
In contrast to the stability provided by the rib cage in the thoracic vertebral column there is a
lack of supporting bony structures at the lumbar spine. Therefore in the lumbar section the
stabilisation of the trunk against gravity relies on the relatively small transverse processes of
the lumbar vertebrae and the non static epaxial and hypaxial musculature including the strong
caudal thoracic and lumbar LD. The lumbar LD may also act as a lever for the overlying
tongue of the middle gluteal muscle. The middle gluteal muscle is one of the major propulsion
muscles of the hindlimb and its tongue reaches from caudal as far as T18. It inserts to the
strong thoracolumbar aponeurosis of LD. Kinematic studies showed a rather rigid lumbar
spine with increased range of dorsoventral flexion in the lumbosacral joint (Haussler et al.
2001; Townsend and Leach 1984). The lack of the supporting rib cage to resist against gravity
and the weight of the visceral organs as well as the role of the lumbar spine in the transition of
propulsion from the hindlimbs to the trunk suggests an important stabilising role of the
lumbar LD muscle in this area.
The clinical relevance of back lesions as cause for poor performance, back pain and lameness
is sometimes difficult to diagnose and the functional relevance of muscle alterations is still
unclear. A radiologic and scintigraphic study in clinically sound horses showed an incidence
of spinal alterations of 26 horses preferentially in the area between T13 and T18 (Erichsen et
al. 2004). Muscle wastage of LD was shown to be a common sign in horses with sacroiliac

79
joint pathology (Ross and Dyson 2002). According to the functional characteristics of LD it
can be considered that different pathological alterations are related to certain areas of the
back. Further research in terms of evaluation of LD muscle function needs to be done to
reveal whether a lack of laterolateral flexibility of the horse is connected to a thoracic LD or
and thoracic vertebral column lesion or a lack of hindlimb (propulsion) support is a result of
lumbar musculature and vertebral column alteration.
Unfortunately some limitations to the study had an influence on the utilisation of the results.
The examined horses and ponies did not reflect the average population because the range of
age was very high (between 6 month and 32 years) and the majority of animals were over the
age of 20. Studies in humans showed that aging musculature undergoes a remarkable amount
of changes. The loss of muscle mass is associated with increasing body fatness (sarcopenia)
showing that muscle structure is significantly altered in old age (Narici et al., 2003). This
could be observed in most of the older horses/ ponies which had visible muscle atrophy and a
fare amount of fat incorporation into the muscle tissue and into adjacent connective tissue.
The additional fat could have influenced both the architectural arrangement of the muscle and
the rate of decay and therefore the accuracy of the measurements.
III.1.4.2 Conclusion
The presented study provides a detailed data of the gross-morphology of the equine LD. The
predicted force generation capacity of the LD in combination with the range of spinal motion
contributes to the understanding of back related pathological conditions and their impact on
the movement and performance of the horse.
Alterations of the cranial part of the thoracic and lumbar LD due to spinal vertebral pathology
or primary muscle injuries can lead to an increase in stiffness of the spine and reluctance to
bend laterally. The changes in the caudal region of the LD might lead to a lack of stability and
weakness which could lead to a restriction of propulsion transformation from the hind limb
musculature to the axis of the horse during jumping and forward movements.
Although the architectural results can give an idea of the performance capacity of the thoracic
and lumbar LD in healthy and in pathological conditions it is necessary to carry out further
tests. Muscle fibre typing and electromyography would complete the functional and
anatomical picture and contribute to understand the back as a complete anatomical and
functional unit. Muscle fibre type composition could reveal functional differences between
LD sections as different fibre types in varying proportions within a muscle represent a certain
specification in function. Electromyography provides information of the intensity of muscle

80
activity and timing in relation to locomotion. Electromyographic activity pattern in the
different segments along LD gives an insight of the whole muscle activity during locomotion
(Chapter III.2.).

81
III.2 Muscle activity of the equine thoracolumbar Longissimus dorsi muscle during locomotion
III.2.1 Introduction
Disorders of the equine back are often made responsible for a whole range of unspecific
clinical signs, such as reluctance to exercise and poor performance and it is often impossible
to reach a definite diagnosis. Radiography of the back and less commonly scintigraphy and
ultrasonography are the imaging modalities of choice, but changes are rarely pathognomonic.
The extent to which pathological changes of the back musculature such as chronic muscle
wastage influences back function and clinical signs is not clear. Hence a thorough knowledge
of normal muscle function of the epaxial musculature is essential for the understanding of
back function as a whole and is a prerequisite to understand the development of back
pathology. The thoracolumbar LD is the largest muscle of the equine back and extends from
its origin at the last cervical vertebrae to its insertion at the iliac wing. Its size and the
anatomical location alone indicate its pivotal role in back movement. Anatomical studies have
(chapter III.1) demonstrated that muscle morphology is not uniform along the muscle. It was
found that muscle fibre length and pennation angle vary significantly along the muscle. These
results presume variations between different segments in their ability to generate force and
hence may indicate different function during locomotion.
The equine vertebral column is a rather inherently rigid structure. In vitro studies showed a
limited range of motion of the vertebral column and adjacent structures by applying different
forces to the vertebral column (Denoix 1999b; Townsend and Leach 1984). These forces
simulated the weight of the abdominal contents as well as dynamic forces which impact on
the vertebral column during locomotion. Results showed that the magnitude of movements
which can take place between vertebrae depends on the direction of the movement and varies
along the vertebral column. The greatest range of flexion and extension is shown in the
lumbosacral joint followed by the caudal part of the thoracic vertebral column (T14-T18).
Lateral bending and axial rotation are present mainly between T9 and T14 whereas at the
more cranial and more caudal spine lateral bending and rotation is limited by the ribcage, the
heights of the dorsal spinous processes and the intertransverse joints (Denoix 1999b;
Schlacher et al. 2004; Townsend and Leach 1984).
In vivo studies similarly showed the maximum flexion and extension movement at the
lumbosacral junction. Apart from the lumbosacral joint the highest range of flexion and

82
extension was found between T10-T13. The range of lateral bending was similar for all
vertebrae in walk, but a higher range of lateral bending occurred in trot. Axial rotation has a
slightly smaller range of motion between T10 and T13. In all orientations the caudal part of
the thoracolumbar spine tends to move more or less as a rigid body during locomotion which
is due to the morphology of the vertebrae (Faber et al. 2001a; Faber et al. 2001b; Faber et al.
2000).
As back locomotion is an interaction between passive and active structures it is equally
important to know the range of spinal motion as well as the influence of epaxial musculature
on back motion.
The epaxial musculature presents the largest muscle group of the back and is located dorsally
bilateral to the thoracic and lumbar vertebral column and the ribs. It comprises the Multifidus,
Iliocostal and Longissimus dorsi muscle (LD) which all receive a multisegmental innervation
(Nickel et al. 1984). The largest of the epaxial group is the thoracic and lumbar LD. It has
been subject of numerous studies in different species due to its size and its anatomical
position which is relatively easy to access. The dimension and the position of the muscle
suggest an important role during back movement. To evaluate LD function several studies
have used electromyography (EMG) to demonstrate muscle activity and relate the EMG
activity pattern to kinematic measurements of the spine and the limbs during stride cycles
(Licka et al. 2008; Licka et al. 2004; Ritter et al. 2001; Robert et al. 1999; Robert et al.
2001b; Tokuriki et al. 1997; Wada et al. 2006a; Wada et al. 2006b).
EMG provides information about the neuronal effects on the muscle and contractile activity of
the muscle by recording interference pattern of motor unit action potentials from active motor
units (MU). Motor units are described as the unit of an alpha motoneuron and the sum of its
corresponding muscle fibres. EMG has been used to collect information about the electrical
activity pattern of motor units in terms of number, duration, onset time and amplitude of
excitations which enables the study of muscle contractions related to movement (Wijnberg et
al. 2004). EMG is widely used in human medicine and sports science to detect myogenic and
neurogenic abnormalities or to monitor muscle changes due to training, fatigue, aging, and
disuse (Aagard et al., 2001; Abe et al. 1997; Caldwell et al. 2003; Kawakami et al. 1995;
Kubo et al. 2003b). It also has been used to determine normal values of activation patterns in
different muscles to investigate functional interaction of the musculoskeletal system and
between synergistic and antagonistic muscle groups.
In animals, especially in horses, EMG was mainly applied to different limb muscles to
characterise limb muscle activity in relation to limb movement during motion cycles (Robert

83
et al. 1999; Tokuriki 1973a; Tokuriki and Aoki 1995; Tokuriki et al. 1989; Tokuriki et al.
1999). Trunk muscle activity has also been measured by EMG to show the recruitment pattern
of the muscles under different conditions such as different gaits, speeds, inclines and jumping
(Licka et al. 2008; Licka et al. 2004; Peham et al. 2001; Robert et al. 2001b; Robert et al.
2002; Tokuriki et al. 1997).
The recorded muscle activity pattern showed that LD is active during dorsal flexion. As a
major extensor muscle this led to the suggestion that LD stabilises the thoracolumbar spine by
restricting excessive dorsal flexion (Robert et al. 2001b; Robert et al. 2002; Tokuriki et al.
1997). To control the impact of decelerating, vertical and accelerating forces on the trunk
during the stance phase and also to coordinate locomotion it is believed that epaxial muscle
function resists these forces and therefore provides postural stability (Carlson 1978; English
1980; Ritter 1995; Thorstensson et al. 1982; Tokuriki 1973a, b). With higher dynamic forces
through increased speed the onset time of LD activity increased in coordination with hind
limb activity in order to oppose the larger inertial forces on the trunk (Rooney 1982; Tokuriki
et al. 1997). These conclusions were obtained by analysing the results of LD, EMG and
kinematic assessment of the spine and limb motion.
In walk the activity pattern of the equine LD showed two small EMG bursts during the middle
of stance phase of both hindlimbs (Tokuriki et al. 1997). A similar pattern with two EMG
bursts per stride cycle was observed in trot. EMG bursts occurred bilaterally and lasted from
the late stance phase to the early swing phase of each hindlimb (Robert et al. 2001b; Robert et
al. 2002; Tokuriki et al. 1997). The amplitude of the first EMG burst during foot-off of the
ipsilateral hind limb was larger than the second EMG burst recorded during foot-off of the
contralateral hind limb (Licka et al. 2004). In canter both sides of LD were active only once
per stride cycle between the early or mid swing phase and the end of the swing phase of the
leading hind limb (Tokuriki et al. 1997).
The influence of speed and incline was reflected by significant changes of the muscle activity
pattern of LD. Compared to slower speed the foot-on time of the hind limbs was earlier in a
stride cycle with increased speed. Consequently the onset time of each EMG burst of LD was
also significantly earlier. In trot speed affected the activity duration of the first EMG burst by
increasing the activity duration while the second burst remained the same. Also muscle
activity showed a significantly higher activity level with increased speed. Changes in incline
did not change the stride and stance phase duration in trot but influenced EMG activity in the
LD. The duration of muscle activity of the LD increased significantly. Onset and offset time
of muscle activity per stride cycle changed with increased incline in terms of later onset time

84
of the first activity burst and a later offset time of both EMG activity bursts. Also the
integrated EMG showed a linear increase of the activity level with increasing incline (Robert
et al. 2001b).
The pattern of muscle activity led to the assumption that LD stabilises the thoracolumbar
spine by restricting lateral and dorsoventral flexion. In coordination with hind limb activity
the onset of LD muscle activity was earlier and muscle activity level increased with higher
dynamic forces of increased speed to oppose larger inertial forces on the abdomen/ trunk
(Rooney 1982; Tokuriki et al. 1997).
Several studies of the equine LD used only one electrode which do not reflect the overall
activity of this large muscle (Robert et al. 2001b; Robert et al. 2002; Tokuriki et al. 1997) but
the previous anatomical study (Chapter III.1) showed that muscle architectural parameters
such as muscle fibre length and pennation angle are not uniform along LD and varies in some
parts of LD significantly. Longer muscle fibres and small pennation angles in the cranial
thoracic part of LD characterise a specialisation for velocity contractions and for high
excursion. Short muscle fibres with large pennation angle at the lumbar part of LD reflect the
specialisation to exert large forces. Differences in architectural structure may influence
muscle activity under different conditions which may lead to distinct muscle recruitment
pattern in certain areas and variation between the intensity of muscle activity. These
variations suggest an influence on the intensity and the pattern of muscle activity. To show
the neuromuscular control of the back along LD an elaborate study in cats was performed
recently (Wada et al., 2006a,b). In this study EMG activities were recorded at the same time
along different levels of the feline LD during walk and walk on incline and decline. Muscle
activity during level walk showed the same activity patterns with two EMG bursts per stride
cycle as reported previously at different LD levels for horses, dogs and cats (English 1980;
Licka et al. 2004; Ritter et al. 2001; Robert et al. 2001b; Robert et al. 2002; Wada et al.
2006a; Wada et al. 2006b). The bilateral activity pattern of LD was suggested to increase the
stiffness of the vertebral column and therefore to decrease the overall spinal movement.
However, on incline the two main bursts of the feline LD often contained two additional
EMG bursts whereas on the down slope EMG bursts could hardly be detected and were only
observed at steeper grade. Not only the amplitude and duration of EMG bursts increased with
increasing upslope but the results of this study also indicated that the timing of EMG onset
was influenced by walking conditions. The EMG bursts synchronised their onset time with
increasing incline (Wada et al. 2006a). The results of this study in cats indicate that muscle
85
activity along the equine LD might vary between conditions of locomotion and between
segments of LD.
Based on anatomical findings in the previous chapter the main hypothesis of this study is that
muscle activity pattern and EMG intensity is different between locations along the equine LD.
It is also hypothesised that different conditions such as walking and trotting at different
speeds and walking on a 5% and 10% incline influence the muscle activity pattern and
intensity of muscle activity at the different muscle segments.
III.2.2 Material and Methods
III.2.2.1 Subjects
Six horses (five geldings and one mare) weighing 482 to 578 kg (mean ±stdev 529.5 ±38.9
kg) were used in this experiment. The horses were of mixed breeds (Lippizan, Angoloarab,
Irish sport horse, Welsh Cob, Welsh Cob Thoroughbred cross and Thoroughbred). The age of
the horses ranged from five years to 17 years (mean 9.8± 4.2 years). All horses were actively
ridden and owned by equine science students of Hartpury College who were informed and
gave written permission for the use of their horses in this project. The horses were trained and
fully habituated to treadmill exercise. Before the experimental procedure all horses were
judged by an experienced clinician to be clinically sound during in–hand gait examination and
to have no clinical signs of back pain.
III.2.2.2 Data collection
EMG data were collected from the largest epaxial muscle of the equine back, the thoracic and
lumbar LD. Surface electrodes were placed at four different sites (T14, T16, T18 and L2)
along the right and left LD. The site of the placements have been chosen based on the results
of chapter III.1 which showed the most assessable areas of the LD without large overlying
musculature between T13 and L3. This electrode placement ensured minimal cross talk of
adjacent and overlying muscles. The dorsal spinous processes of T14, T16, T18 and L2 were
used as bony landmarks and were identified by manual palpation. Eight bipolar silver/ silver-
chloride, self adhesive surface EMG electrodes (10 mm diameter) were placed onto shaved
and cleaned (scrubbed) skin patches. The electrodes were arranged bilaterally to the dorsal
spinous processes at a distance of 12 cm (T14), 8 cm (T16 and T18) and 4-5 cm (L2) lateral to
the midline. A ground electrode was applied to the left tuber coxae. Each EMG signal was

86
preamplified 5000 times (Biovision, Werheim, Germany) and transmitted through a cable to a
multiplexing datalogger unit which was attached to a custom-made harness (Fig. 31).
A uniaxial accelerometer (ADXL 150, Analog Devices, US) was hot-glued to the dorsal hoof
wall of the left hind limb (first three horses) and the right hind limb (last three horses). The
accelerometer was also connected by a cable to the multiplexing unit at the harness. All cables
were secured and taped to the horse to prevent artefacts by cable movements. During data
collection it was detected that kinematic measurements were disturbed by cable movement of
the accelerometer of the left hindlimb as all infra-red cameras were positioned on the left side
of the horses. Therefore the accelerometer was changed to the right hindlimb. During the data
collection all collected data was transmitted from the multiplexing unit via cable to a
stationary notebook computer (16-bit data acquisition card, 6036E, National Instruments,
Austin, Texas) which was set up on a table close by. Data from the EMG electrodes as well as
the accelerometer device were recorded at 2000 Hz and captured in a custom written software
program (LabView 8.0, National Instrument, Austin, Texas).
Simultaneously to the EMG data collection the triggered collection of three-dimensional
kinematic data were collected from the left side of each horse using six cameras from an
infrared kinematic motion analysis system (Qualisys, Motion Capturing System, Qualisys
AB, Gothenburg, Sweden) at the sampling rate of 200 Hz. The horses were marked with
reflective markers. These markers were made from polystyrene hemispheres (Pinflair,
Hertford, UK) covered with reflective tape (Scotchlite 8850, EM safety products, Manchester,
UK). The reflective markers used in the present study were placed on the lateral and medial
hoof wall of the left front and hind limb and using double sided tape (R370, ANCA Industrial
Supplies, Halesowen, West Midlands, UK). The kinematic measurements were used to obtain
footfall patterns of all four feet.

87
Fig. 31 Experimental set-up: Silver/ silver-chloride surface electrodes were located at T14, T16, T18, L2 and Tuber coxae (ground electrode), all cables connected to the multiplex unit which is attached to the custom-made harness. Reflective markers were glued to the left hoof wall of each foot. An uniaxial accelerometer was hot-glued to the hoof of the right hindlimb.

88
III.2.2.3 Experimental protocol
Every horse performed a five minute warm-up in walk on the treadmill. Afterwards data were
collected at two different sequences of walk and two different sequences of trot with a
repetition in reverse order. On a levelled treadmill horses performed a slow walk (1.5 m s-1)
and fast walk (1.8 m s-1) followed by slow trot (2.6 m s-1) and fast trot (3.8 m s-1) for
respectively five minutes. Accelerometer and EMG data were triggered and were recorded as
well as kinematic data for two minutes at the end of each exercise sequence. After the reverse
repetition of the different speed levels the horses walked (1.5 m s-1) on a 5% and 10% incline
on the treadmill each for the duration of five minutes. Again the exercise program was
repeated in reverse order and the last two minutes of each sequence were used for data
collection. In each horse EMG was also sampled in a standing position with the feet in square
position before and after they walked on/ off the treadmill.
III.2.2.4 Data processing
The EMG signals of the mean ±stdev number of 5831±1475 steps per condition were
processed and analysed. EMG signals are often contaminated by the heart muscle electrical
activity (ECG) especially when EMG is collected from the trunk. To limit the contamination
of EMG an average ECG template was formed from the ECG signals of each standing EMG
trace. The ECG template was cross-correlated with the EMG trace of each condition and
subtracted at the time of occurrence (Drake and Callaghan 2006). Subsequently the EMG was
used to calculate the intensity by wavelet analysis (von Tscharner 2000; Wakeling et al.
2002). EMG intensity is a close approximation of the power of the clean EMG trace.
Additionally low frequencies (<24Hz) were filtered out of the EMG traces to remove residual
ECG and movement artefacts of cables and skin. For each step the total intensity was
calculated as the sum of the intensities across wavelet 2-10 (frequency band 24-380 Hz). For
each sensor in all conditions the mean intensity was also calculated and interpolated to 100
points per stride cycle which was defined by the foot contact of the left hind limb. All data
was normalised to the fastest condition in each horse.
To determine the foot contact of the limbs the signal of the accelerometer of the right/ left
hindlimb were visualised on the computer and used to detect initial ground contact for 8835
strides. All data was processed in Mathematica programming environment (Wolfram
Research Ltd, Long Hanborough, UK). Although stance and swing phase could only be
accurately determined by the accelerometer signals for the respective left or right hindlimb,

89
stance phase duration for all legs was calculated from collected motion analysis data. For
further analysis kinematic was matched to the accelerometer data.
Kinematic data was tracked in Qualysis (Qualisys Track Manager, Motion Capturing System,
Qualisys AB, Gothenburg, Sweden) to provide the trajectories of the foot markers. The xyz-
coordinates of each marker were exported into Labview 8.0 (National Instrument, Texas) to
calculate the following stride parameters: stride time and stance time which was reported as
percentage of a 100% stride cycle. For each horse in each condition the four limbs were
synchronised to the interpolated EMG intensity.
On and off set time of EMG bursts during one stride cycle were determined by using 50% of
the highest amplitude of each normalised trace as a threshold (Fig. 32). This was carried out
to avoid the influence of different EMG intensity of each trace.
Fig. 32 Calculation of the mean on and offset time (continuous line) with standard error (dotted line) of EMG bursts for different sensor locations (blue =T14, green = T16, pink = T18, orange = L2) in walk on 10% incline. For each EMG trace 50% of the peak EMG intensity was used as threshold to avoid differences of EMG intensity.

90
III.2.2.5 Data analysis
All data was analysed in SPSS (v.15.0, SPSS Inc., Chicago, Illinois, USA). A univariate
linear model used to determine the influence of different conditions (different gaits, speeds
and incline) and different locations of EMG sensors (at T14, T16, T18, L2) on the intensity of
EMG activity and the number of EMG bursts. For all tests the significant level was set at the
level of p< 0.05.
III.2.3 Results
III.2.3.1 Stride parameters
The analysis of the accelerometer impact data of 8835 strides of the hindlimb indicating the
stride duration in seconds (s) for each condition demonstrated consistent stride durations
between horses. Mean ±std values of the stride duration for slow walk 1.08 s ±0.05, fast walk
0.97 s ±0.03, slow trot 0.79 s ±0.04, fast trot 0.68 s ±0.02, walk on 5% incline 1.12 s ±0.03
and walk on 10% incline 1.11 s ±0.03 (Table 24, Fig. 33) showed that the mean stride
duration decreased between walk and trot. Within the same gait mean stride duration also
decreased with increased speed but on incline stride duration remained unchanged between
5% and 10% of incline.
Table 24 Showing mean values, standard deviation, standard error, minimum and maximum values of stride duration (s) for all horses at all conditions
Mean Std. Deviation StdE Minimum Maximum slow walk 1.08 .05 .014 1.01 1.20
fast walk 0.97 .03 .009 0.93 1.03
slow trot 0.79 .04 .014 0.71 0.89
fast trot 0.68 .02 .008 0.63 0.72
walk 5% incline 1.12 .03 .010 1.08 1.19
walk 10% incline 1.11 .03 .010 1.07 1.20

91
0
0.2
0.4
0.6
0.8
1
1.2
1.4
condition
Strid
e du
ratio
n (s
ec.)
slow walk fast walk slow trot fast trot walk 5% incline walk 10% incline
Fig. 33 Mean values (± s.d.) of stride duration (s) for each condition in all horses
Table 25 Shows mean values and standard deviation of the percentage of stance duration (%) per stride cycle in all conditions for the right (RF) and left (LF) forelimb as well as the right (RH) and left (LH) hindlimb of all horses. There is no significant difference of stance duration between front and hind limbs (p>0.05) but between slow, fast and walk on incline (5%, 10%) and slow and fast trot (p<0.05). Condition LH RH LF RF
Mean (%) Stdev Mean (%) Stdev Mean (%) Stdev Mean (%) StdevSlow walk 65 3.8 64 2.6 61 6.9 62 1.7 Fast walk 63 2.1 60 0.5 64 10.5 60 0.5 Slow trot 50 6.1 51 3.3 50 1.2 51 2.7 Fast trot 45 4.6 49 3.5 46 1.6 47 3.9 Walk incline 5% 67 1.1 65 0.5 65 3.3 62 0.8 Walk incline 10% 67 3.4 64 2.8 69 13.7 61 1.8

92
0
10
20
30
40
50
60
70
80
90
Condition
Stan
ce ti
me
(%) p
er s
trid
e cy
cle
Right forelimbLeft forelimbRight hindlimbLeft hindlimb
fast walkslow walk slow trot fast trot walk 5% incline walk 10% incline
Fig. 34 Mean (± stdev) percentage of stance (%) time per stride cycle in all conditions for the right (blue) and left (red) forelimb and the right (yellow) and left (light blue) hindlimb of all horses.
Table 25 and Fig. 34 showing the mean ±stdev duration of the stance phase of each limb
stated as a ratio of a 100% stride cycle. In this study there was no significant difference
observed between the percentage of stance duration of front and hind limbs during stride
cycles (p=0.8). However between certain conditions a significant difference of the
percentages of stance duration could be detected. The duration of the mean ± stdev stance
phase for the different conditions was 62.2±1.9 % for slow walk, 61.7±2.0 % for fast walk,
50.3±0.8 % for slow trot, 46.6±1.6 % for fast walk and 64.6±2.0 % and 65.1±3.4 % for 5%
and 10% incline in walk. The percentage of stance duration was significantly shorter
(p=0.0001) for slow and fast trot than for slow walk, fast walk and walk on incline (5% and
10%).
III.2.3.2 EMG activity pattern
The analysis of the collected EMG data showed that only the EMG electrodes on the right
side of the horse recorded reliably muscle activity and therefore only these electrodes were
used for further statistical analysis. Due to technical problems such as incomplete signal
recordance and noise the EMG measurements of the left LD was not included in the analysis.
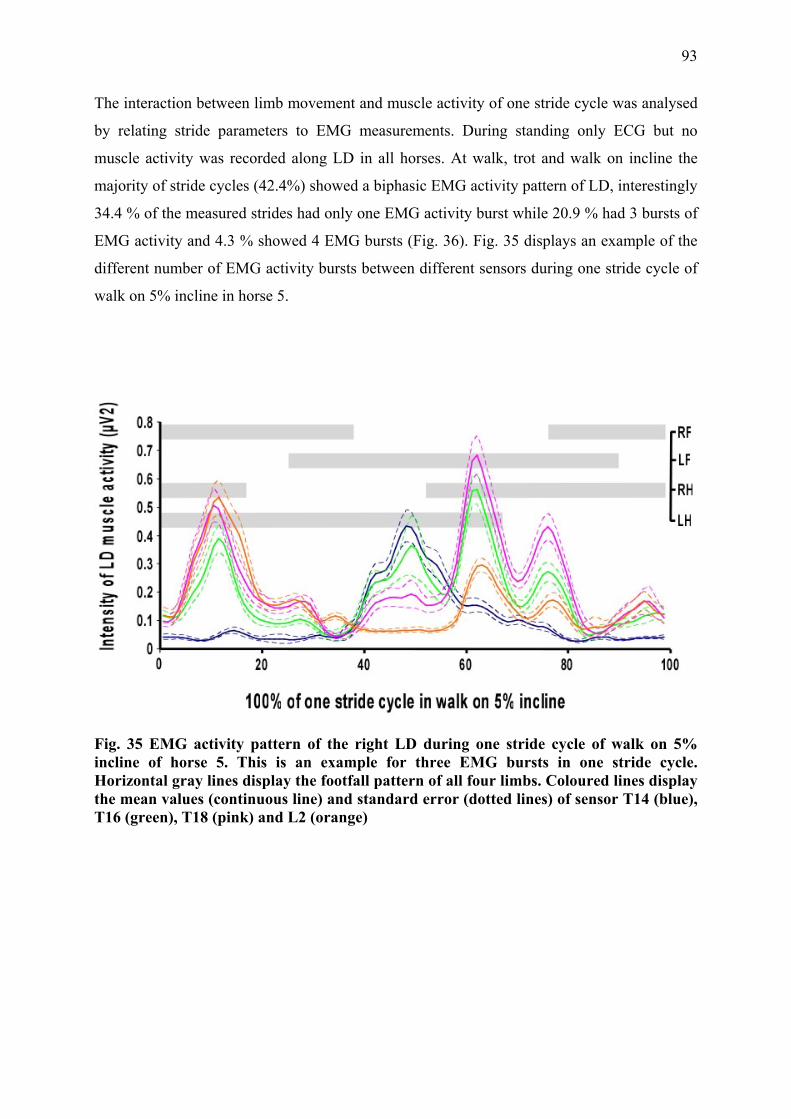
93
The interaction between limb movement and muscle activity of one stride cycle was analysed
by relating stride parameters to EMG measurements. During standing only ECG but no
muscle activity was recorded along LD in all horses. At walk, trot and walk on incline the
majority of stride cycles (42.4%) showed a biphasic EMG activity pattern of LD, interestingly
34.4 % of the measured strides had only one EMG activity burst while 20.9 % had 3 bursts of
EMG activity and 4.3 % showed 4 EMG bursts (Fig. 36). Fig. 35 displays an example of the
different number of EMG activity bursts between different sensors during one stride cycle of
walk on 5% incline in horse 5.
Fig. 35 EMG activity pattern of the right LD during one stride cycle of walk on 5% incline of horse 5. This is an example for three EMG bursts in one stride cycle. Horizontal gray lines display the footfall pattern of all four limbs. Coloured lines display the mean values (continuous line) and standard error (dotted lines) of sensor T14 (blue), T16 (green), T18 (pink) and L2 (orange)
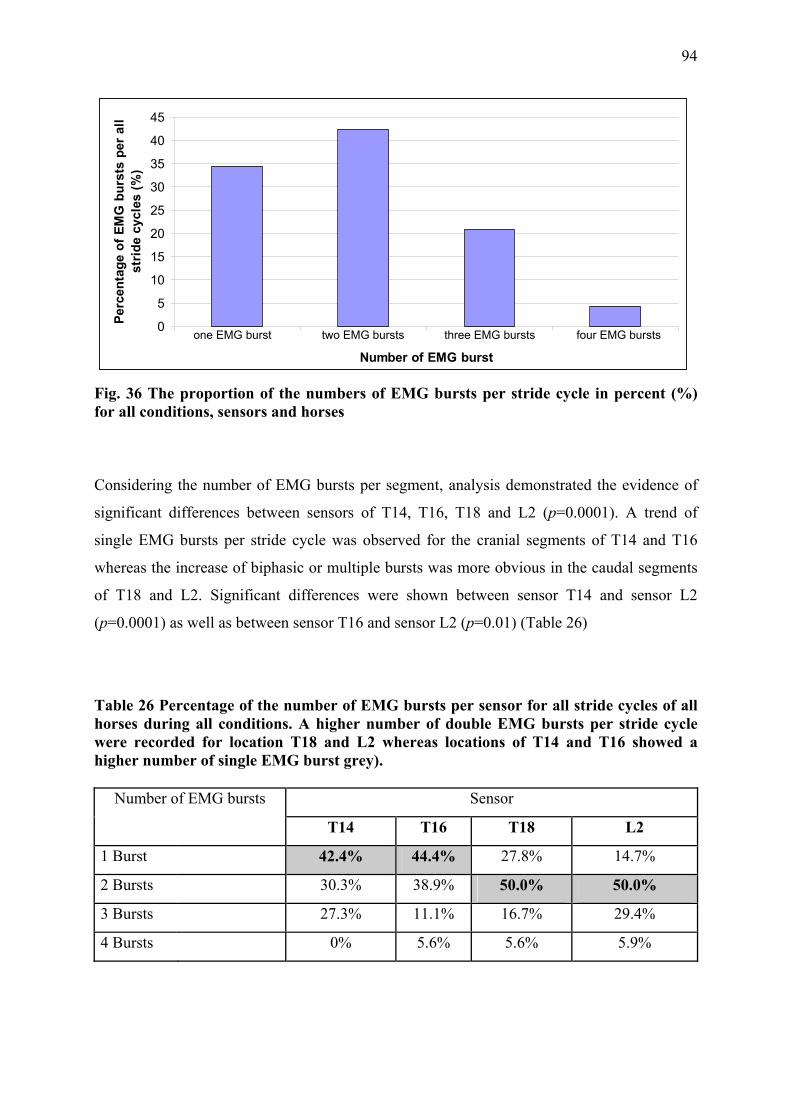
94
0
5
10
15
20
25
30
35
40
45
Number of EMG burst
Perc
enta
ge o
f EM
G b
urst
s pe
r al
l st
ride
cyc
les
(%)
one EMG burst two EMG bursts three EMG bursts four EMG bursts
Fig. 36 The proportion of the numbers of EMG bursts per stride cycle in percent (%) for all conditions, sensors and horses
Considering the number of EMG bursts per segment, analysis demonstrated the evidence of
significant differences between sensors of T14, T16, T18 and L2 (p=0.0001). A trend of
single EMG bursts per stride cycle was observed for the cranial segments of T14 and T16
whereas the increase of biphasic or multiple bursts was more obvious in the caudal segments
of T18 and L2. Significant differences were shown between sensor T14 and sensor L2
(p=0.0001) as well as between sensor T16 and sensor L2 (p=0.01) (Table 26)
Table 26 Percentage of the number of EMG bursts per sensor for all stride cycles of all horses during all conditions. A higher number of double EMG bursts per stride cycle were recorded for location T18 and L2 whereas locations of T14 and T16 showed a higher number of single EMG burst grey).
Number of EMG bursts Sensor
T14 T16 T18 L2
1 Burst 42.4% 44.4% 27.8% 14.7%
2 Bursts 30.3% 38.9% 50.0% 50.0%
3 Bursts 27.3% 11.1% 16.7% 29.4%
4 Bursts 0% 5.6% 5.6% 5.9%

95
A significant difference was observed between conditions. Walk on 10% incline showed a
significant larger number of EMG bursts (p=0.01). In addition, an obvious but not statistically
significant trend of single EMG bursts in slow and fast walk and walk on 5% incline were
shown in contrast to a higher percentage of biphasic EMG activity pattern in slow and fast trot
(Table 27)
Table 27 Percentage of the number of EMG bursts per stride cycle in all conditions for all horses and sensors. A higher number of single EMG bursts per stride cycle was detected in slow, fast walk and walk on 5% incline, two EMG bursts were recorded in slow and fast trot and three EMG bursts mainly for walk on 10% incline (grey).
Number of EMG
bursts
Slow
walk
Fast
walk
Slow
trot
Fast
trot
Walk 5%
incline
Walk 10%
incline
1 Burst 45.5% 45.8% 8.7% 34.8% 37.5% 21.7%
2 Bursts 31.8% 37.5% 87.0% 56.5% 20.8% 21.7%
3 Bursts 22.7% 16.7% 0 8.7% 33.3% 43.5%
4 Bursts 0 0 4.3% .0% 8.3% 13.0%
Table 28 Mean (± stdev) values of on- and offset times of the different numbers of EMG bursts during 100% percentage of a stride cycle. The majority of EMG bursts of the right LD occurs in the first and the last quarter of the stride cycle.
On- and Offset time of EMG bursts in percentage
to stride duration Mean (%) Stdev
Onset of burst 1 23.5 13.9
Offset of burst1 35.8 15.2
Onset of burst 2 41.1 17.1
Offset of burst2 50.2 19.2
Onset of burst3 60.0 10.5
Offset of burst3 71.0 12.7
Onset of burst 4 77.7 13.4
Offset of burst 4 95.0 15.8

96
The number of EMG bursts per stride cycle had an effect on the onset time of EMG bursts
(p=0.01) with the consequence that a higher number of EMG bursts results in an earlier onset
time. As walk and trot are symmetrical gaits the 100% stride cycles were divided in 50% each
in order to relate muscle activity of the right LD to the stride parameters. All stride cycles
started with foot-on of the left hind limb. Table 28 shows the distribution of EMG bursts
during stride cycles. A higher number of EMG bursts were recorded between 60-95% of the
stride cycle (during the second half of the stride cycle) which is related to the muscle activity
of the ipsilateral LD. Fewer EMG bursts were recorded during the first half of the stride cycle
(between 23-36% of stride cycle). The higher percentage of EMG bursts during the second
half of the stride cycle might be due to the fact that the onset time of muscle activity with only
one activity burst per stride cycle was significant later in the stride cycle. The onset time of
the first burst decreased with increasing number of activity bursts.
The mean onset and offset times of EMG bursts are displayed in Table 28. The location of
muscle segments (p=0.6) or different conditions (p=0.3) had no significant effect on onset.
The mean value ±stdev of the total EMG activity duration was calculated to be 29.6±18.41 %
per stride cycle. The wide range of duration is related to the varying number of EMG bursts.
Correlation of EMG activity duration with the number of EMG bursts showed a significant
positive effect (p=0.02).
III.2.3.3 Intensity of muscle activity
The mean ±stdev intensity of muscle activity was 0.0025 µV2 ±0.0049 for slow walk, 0038
µV2 ±0154 for fast walk, 0211 µV2 ±0.0507 for slow trot, 0.023 µV2 ±0.0516 for fast trot,
0.0034 µV2 ±0.0056 for walk on 5% incline and 0.0064 µV2 ±0.0077 for walk on 10% incline
(Table 29) Results showed a significant effect on the intensity of muscle activity between
different conditions in walk (p=0.0001). Post-hoc comparison indicated that all walking
conditions (slow walk, fast walk, walk on 5% and 10% incline) were significantly different
(p=0.0001) except fast walk compared with walk on 5% incline (p=0.9). Analysis of the
intensity of muscle activity between walk and trot showed a significant difference between
gaits and between different speeds (p=0.0001). Post-hoc comparison indicated that slow walk,
fast walk, slow trot and fast trot resulted in significant differences of intensity of muscle
activity (p= 0.0001).

97
Table 29 Mean (± stdev) value, minimum and maximum value of the EMG intensity (µV2) for each condition in all sensors and all horses
N Mean (µV2) Stdev. Minimum Maximum
Slow Walk 5572 .0025 .0049 .0001 .17 Fast Walk 5315 .0038 .0154 .0001 .95 Slow Trot 7077 .0211 .0507 .0002 .50 Fast Trot 8101 .0230 .0516 .0007 1.54 Walk 5% incline 4244 .0034 .0056 .0001 .10 Walk 10% incline 4680 .0064 .0077 .0006 .15
The position of EMG electrodes along LD showed no significant influence on the intensity of
muscle activity (p= 1.0) during the different walking conditions although a trend of different
intensities could be detected between the different locations (Table 30). During level walk the
greatest intensity of muscle activity was shown for T14 and the lowest value for T16 while
T18 and L2 recorded very similar intensity of muscle activity. During walk on incline greater
intensity of muscle activity was observed over T18 and L2. However the lowest intensity
during walk on incline was found over T16. In trot intensity of muscle activity was shown to
be increased for sensors at T14 and L2.
The following figures illustrate the intensity of muscle activity between different sensors and
in different conditions (Fig. 37).
Table 30 Mean (± stdev) values of the intensity of muscle activity (µV2) for each condition and each sensor in all horses. T14 T16 T18 L2 Mean
µV2 Stdev Mean µV2 Stdev Mean
µV2 Stdev Mean µV2 Stdev
Slow walk 0.0042 0.0081 0.0014 0.0012 0.0023 0.0023 0.0022 0.0049Fast walk 0.0082 0.028 0.0019 0.0033 0.0022 0.0017 0.0028 0.0095Slow trot 0.037 0.083 0.014 0.027 0.0083 0.0089 0.025 0.046 Fast trot 0.035 0.084 0.012 0.0086 0.013 0.01 0.033 0.058 Walk 5% incline 0.0039 0.0052 0.0022 0.0028 0.0034 0.003 0.0044 0.009 Walk 10% incline 0.0059 0.0075 0.0046 0.005 0.009 0.01 0.006 0.006

98
0
0.005
0.01
0.015
0.02
0.025
0.03
0.035
0.04
Sensor
Mea
n in
tens
ity o
f LD
mus
cle
activ
ity (µ
V2)
SW
FW
ST
FT
W 5%
W 10%
T14 T16 T18 L2
Fig. 37 Mean (± SE) values of muscle intensity (µV2) of the LD muscle during all conditions (SW= slow walk, FW= fast walk, ST= slow trot, FT= fast trot, W5%= walk on 5% incline, W10%= walk on 10% incline) for all horses. There is an obviously increased muscle intensity of LD activity at T14 and L2.
III.2.4 Discussion and conclusion
The purpose of the presented study was to show the activity pattern along the thoracolumbar
LD muscle in different gaits, at different speeds and on different inclines in normal horses.
The LD is a segmental muscle and for the first time the interaction of all accessible segments
during gait cycles was quantified simultaneously.
III.2.4.1 Muscle activity of thoracolumbar LD during different conditions
In this study EMG activity bursts showed different activity patterns during stride cycles
between horses, muscle segments and between gaits, speed and on incline. Although two
EMG bursts predominantly occurred in different conditions a significantly higher number of
EMG bursts was recorded during walk on 10% incline. In contrast, a trend of single activity
bursts per stride cycle was observed in slow, fast walk and walk on 5% incline. These results
suggest that different conditions such as faster gaits and movement on increased incline
demand more LD activity as well as slow gaits may require less muscle activity. Although

99
prior studies have documented solely biphasic EMG activity patterns for LD per stride cycle
(Licka et al. 2004; Robert et al. 2001b; Robert et al. 2002; Tokuriki et al. 1997) a study of
another species, the cat, has previously described additional EMG bursts which occurred
during walk on incline additionally to EMG burst I and/ or EMG burst II (Wada et al. 2006a).
In order to evaluate the interaction between muscle activity and locomotion patterns the EMG
activity pattern was related to kinematic measurements. While in this study only kinematic
measurements of the feet were recorded thorough kinematic analysis of the back movement
by other authors were used to estimate the range of back motion during a stride cycle
(Audigie et al. 1999; Faber et al. 2001a; Faber et al. 2001b; Faber et al. 2000; Haussler et al.
2001; Licka et al. 2001a; Licka et al. 2001b).
The mean onset time of EMG bursts in the current study corresponded to the second half of
the hind limb stance phase which again is related to the phase of back flexion and laterolateral
movement (Faber et al. 2001a; Faber et al. 2000; Haussler et al. 2001). In the literature the
range of equine back motion was reported to be different between gaits where trot showed a
distinct reduction in dorsoventral and laterolateral movement compared to walk. In the present
study EMG measurements recorded during different gaits showed a significant increase of the
intensity of muscle activity between walk and trot which is conform to other EMG studies
(Robert et al. 2001b; Robert et al. 2002; Tokuriki et al. 1997). Due to different muscle
activity and different activity pattern of LD the function of this epaxial muscle may differ
between gaits due to different dynamic forces acting on the trunk. During walk decelerating
forces of the limbs at the beginning of stance phase, vertical force at midstance and
accelerating forces during propulsion influence trunk movement at the same time. These
forces acting in different directions demand a rather flexible connection between each other.
Simultaneous deceleration of a front limb and acceleration of the ipsilateral hind limb may
produce larger lateral movement of the vertebral column. As the LD is active during the
second half of hind limb stance phase, when the vertebral column moves to the contralateral
side, LD might not only restrict back flexion but may also move the back actively towards this
direction. In trot kinematic data of horse backs showed a rather rigid structure with a
decreased range of motion (Faber et al. 2001a; Haussler et al. 2001). The diagonal paired
limb movements produce forces working simultaneously in the same direction. The back as
axis between the diagonal pairs of limbs needs to be rather stiff to move the body forward in
an effective and economic way. The increased intensity of LD activity and a higher number of
EMG bursts during trot may also support the spine to resist against increased acceleration of
the rebouncing visceral mass and the forward and sideway acceleration generated by the
100
higher push-off force of the contralateral and ipsilateral hind limbs. Significantly higher
intensity of muscle activity was measured during walk on 10% incline compared to level walk
and walk on 5% incline. On the incline increased forces generated by the hind limbs and
transmitted onto the vertebral column may be canalised by a stiffer back in forward, upward
direction of the movement.
As hypothesized, differences of EMG activity were not only obvious between gaits also
different parts of LD showed significant differences between activity levels along the muscle.
III.2.4.2 Muscle activity of LD between different muscle segments
For the first time the examination of the whole accessible LD was performed during different
gaits, speeds and on incline in the horse. Although data was only collected for the right LD
and therefore the interpretation of muscle interaction between right and left LD was not
possible, analysis of the different segments reflect differences between certain areas.
During trot and walk on incline great intensity of muscle activity was found for the muscle
segments of T14 and L2 but during trot the greatest value was observed for T14 and during
walk on incline at L2. The high intensity of muscle activity might be due to the relatively
close position of these muscle segments to the fore and hind limbs. During faster and more
demanding gaits such as trot or walk on incline the impact of the accelerating forces
transmitted by the limbs onto the vertebral column during the second half of the stance phase
is increased. Higher forces might require higher intensity of epaxial muscle activity in order to
support the trunk. In level walk intensity of muscle activity is decreased at L2 and T18
compared to the great value at T14. In all conditions the lowest intensity of muscle activity
was recorded at the muscle segment of T16. These results correspond only to some extent
with findings of previous studies. In a previous study maximum EMG amplitudes were shown
at T12 but decreasing EMG values were recorded for T16 and L2 during trot (Licka et al.
2004). Other evaluations of the segmental muscle activity of equine LD are difficult to
compare due to different experimental set ups and analysing modalities. Several studies used
only one electrode per side (Robert et al. 2001b; Robert et al. 2002; Tokuriki et al. 1997) or
electrodes were often placed close to or on top of major muscles (spinalis and middle gluteal
muscle) overlying LD (Licka et al. 2004; Robert et al. 2001b; Robert et al. 2002). In the
present study placement of surface EMG electrodes was based on previous anatomical
dissections (see chapter III.1). Direct access to the LD without overlying other muscles is only
possible between T14 and L3. The LD muscle cranial to T14 is covered by the spinalis
muscle, the part caudal to L2 partly by the tongue of the middle gluteal muscle. Hence

101
accurate placement of electrodes is essential to minimize electromyographic cross-talk of
overlying and adjacent muscles. However some crosstalk of adjacent muscles could not be
entirely excluded. Some crosstalk of the spinalis and middle gluteal muscle might have been
recorded and have influenced the EMG trace of LD to a certain degree as EMG electrodes
were still placed relatively close to these muscles.
In the present study not only differences of the intensity of muscle activity between LD
segments were observed also the number of EMG bursts per stride cycles showed differences
among segments. Higher percentages of single EMG bursts were recorded at T14 and T16
whereas the caudal segments of T18 and L2 showed predominantly two and more EMG
bursts. The higher percentage of two and more EMG bursts at the caudal part of LD indicated
continuous muscle activity during the locomotion of both hind limbs and consequently
resulted in an earlier onset time of muscle activity during the stride cycle. Increased LD
activity may resist against the impact of accelerating forces of the limbs and support the
transmission of propulsive forces onto the trunk. The caudal part of the vertebral column is
also more exposed to dynamic forces of the visceral organs due to the lack of the supportive
rib cage hence higher muscle activity may also stabilise the trunk.
In this study onset time of EMG bursts were not significantly different between LD segments.
This result agrees with a former study of the feline LD (English 1980) which showed
synchronous onset of muscle activity along the muscle. But results are contrary to a recent
study of the feline LD which found variations between onset of activity times at different
levels of LD during level walk and walk on incline (Wada et al. 2006a; Wada et al. 2006b).
III.2.4.3 Conclusion
This study gives an insight of the muscle activity pattern along the equine LD. Results of this
study demonstrate, similar to results of previous studies, that limb movement strongly
influences vertebral column movement and therefore is associated with epaxial musculature
activity. LD activity increases due to increased speed, faster gait and increased incline
influenced by the different accelerating forces of the hind limbs during the second half of
stance. An increased muscle activity at the muscle segments close to fore and hind limbs also
demonstrate an effect of the transmitted forces through the limbs on to the trunk and
interacting epaxial muscle activity. Further research is needed to investigate differences of
muscle activity along LD in horses with back pain and lameness.

102
III.3 Ultrasonographic anatomy of the equine thoracolumbar Longissimus dorsi muscle
III.3.1 Introduction
Disorders of the equine back are thought to cause a variety of unspecific clinical signs, such
as poor performance, reluctance to be ridden and secondary hindlimb lameness in some
horses. Abnormalities of the vertebral column, spinal ligaments and the sacroiliac joints have
been associated with back pain of the horse (Jeffcott and Haussler 2004; Ross and Dyson
2002). It has been suggested that the adjacent epaxial musculature especially of the largest
epaxial muscle, the thoracolumbar Longissimus dorsi muscle (LD), plays a role in the
pathogenesis of back problems, however little is known at present. Knowledge of the normal
muscle structure is essential to evaluate the relationship between paraspinal muscle alterations
and back pain in the horse. The visualisation of muscle architecture, muscle size, and relation
to adjacent muscle is important to be able to diagnose muscle abnormalities and understand
pathological changes. Unlike in humans computed tomography (CT) and magnetic resonance
imaging (MRI) are not practical techniques to image the large equine back due to size
restrictions, however, ultrasonography is a feasible tool to illustrate the anatomical structure
of the epaxial musculature. Due to the non-invasive, portable and low cost properties of this
technique it is already widely used in equine practice for a variety of applications.
Ultrasonographic examination of the musculoskeletal system has mainly focused on imaging
of tendon and ligament abnormalities (Reef 1998). Injuries of muscles are more difficult to
detect ultrasonographically apart from cases of severe muscle pathology, such as muscle
ruptures or strain, which are easily visualised ultrasonographically as anechoic areas in case
of fluid accumulations or hyperechoic areas with thickening of the connective tissue septa
within the muscle (Jeffcott and Haussler 2004).
Different tissues are characterised by different echogenicity. The echogenicity describes the
amount of ultrasound signals of an ultrasound beam reflected by the tissue, for example,
ultrasound images of normal muscle tissue show less echogenic reflections than fat or
tendinous structures. The transverse image of normal muscle tissue shows fine echoes
scattered throughout the muscle. In the longitudinal view the muscle is characterised by
homogeneous, multiple, fine, parallel echoes. This sonographic appearance is due to multiple
muscle bundles (fascicles) surrounded by fibroadipose septa (perimysium). Connective tissue
fascia and fat overlying the muscle appear as a bright echogenic outer margin (Rantanen and
McKinnon 1997).
103
In humans ultrasound is not only used to distinguish between different types of muscle
diseases (Maurits et al. 2003; Pillen et al. 2003; Zuberi et al. 1999) but also to evaluate
normal musculature (Binzoni et al. 2001; Kawakami et al. 2006; Maganaris et al. 1998;
Rankin et al. 2006; Stokes et al. 2005).
Ultrasound images of myopathic muscles show an increase in echogenicity whereas
neuropathic muscles present areas of increased inhomogeneity due to pathologic disruption of
the muscle architecture (Maurits et al. 2003; Zuberi et al. 1999). To evaluate differences
between patients suffering from chronic lower back pain and healthy subjects muscle size was
measured ultrasonographically. The localised atrophy of the multifidus muscle in patients
with chronic neck or low back pain was observed as significantly decreased cross-section of
the muscle compared to healthy, asymptomatic subjects (Hides et al. 2008; Kristjansson
2004).
Ultrasonography has also been applied to evaluate the quantitative characterisation of normal
skeletal musculature in humans (Kristjansson 2004; Lee et al. 2007; Nielsen et al. 2000) and
has been used to demonstrate that architectural measurements of muscles such as muscle size
and muscle thickness, muscle fibre length and pennation angle are related to muscle function
(Abe et al. 2000a; Kawakami et al. 1993; Kawakami et al. 1995; Kumagai et al. 2000). The
architectural measurements of muscles were utilised to demonstrate differences between
trained and untrained subjects (Aagard et al., 2001; Sipila and Suominen 1991), between
gender (Chow et al. 2000) and age as well as to show effects of different types of physical
training (Abe et al. 2000a; Kawakami et al. 1995; Kearns et al. 2000; Kumagai et al. 2000).
Several studies have shown that exercise influences muscle thickness, muscle size, pennation
angle and fibre length. Significant increase of pennation angle and muscle fascicle length was
reported for different muscles following a four to sixteen weeks of resistance training (Aagard
et al., 2001; Kawakami et al. 1995; Seynnes et al. 2007). The effect of training was observed
as an increase in muscle thickness and cross-sectional area (Brancaccio et al. 2007; Kiesel et
al. 2007). Following resistance training different muscles such as triceps brachii,
gastrocnemius and quadriceps femoris muscles showed an increased pennation angle and
increased cross-section area of the muscle (Kawakami et al. 2006; Kawakami et al. 1995;
Seynnes et al. 2007; Suetta et al. 2008). Differences of muscle architecture were also found in
muscles of different types of athletes (Abe et al. 2000b; Kanehisa et al. 2003; Kumagai et al.
2000). In sprinters, for example, longer muscle fascicles and smaller pennation angles were
observed compared to long distance runners. Other studies demonstrated significant
differences in fibre length, pennation angle, muscle thickness and muscle size of limb muscles

104
(Chow et al. 2000) as well as the multifidus muscle (Hides et al. 2008) between gender
although another study showed that gender had no effect on neck muscle size after it was
corrected for body mass (Rankin et al. 2005).
Furthermore, several studies demonstrated that muscle architecture of certain human limb
muscles are significantly altered with age (Binzoni et al. 2001; Kubo et al. 2003a; Narici et al.
2003). Decreased muscle size and muscle thickness are thought to be due to a decrease in size
of muscle fibres and the disappearance of muscle fibres altogether (Maurits et al. 2003). Other
age-related muscle alterations were visible as an increase of echogenicity which corresponds
to the age-related replacement of contractile muscle tissue by other tissue such as fat and
collagen (Maurits et al. 2003; Sipila and Suominen 1991).
Based on the knowledge of the role of echogenicity and architectural measurements from
human research the ability of ultrasonography to image soft tissue structures may provide
valuable information of the equine back musculature. Measurements of muscle thickness,
pennation angle, fibre length and echogenicity characterise the capacity of LD to generate
force, document muscle atrophy or hypertrophy and assess the ratio between muscle and
connective tissue along this muscle (Bleakney and Maffulli 2002; Kawakami et al. 2000;
Kearns et al. 2001; Strobel et al. 2005). As the paraspinal stiffness is important for the spinal
stability ultrasonographic examination of the LD muscle structure is helpful to characterise
this muscle and therefore prevent damage to musculoskeletal structures caused by the lack of
muscle strength. In conjunction with radiographic images of the vertebral column muscle
ultrasound of LD can document the relationship between pathological changes of the vertebral
column and muscle alterations.
Back problems in horses are often accompanied by the wastage of the epaxial musculature
(Jeffcott and Haussler 2004). Decrease of muscle thickness and alterations of architectural
parameters indicate the disuse of the muscle following for example trauma, lameness or due
to underlying pain, bad fitted saddle, and form of training. Studies in disused muscles of
humans showed the replacement of muscle tissue by fat and connective tissue which
influenced the echogenicity (Strobel et al. 2005). Although the degree of fat and connective
tissue replacement, changes of muscle thickness, muscle fibre length and pennation angle in
the horse is unknown these parameters are useful to assess the degree of muscle involvement
and to monitor the results of treatment and training.

105
The aim of the present study was to illustrate the ultrasonographic anatomy of the equine LD.
The objectives of the studies were to compare longitudinal and transverse cross-sectional
ultrasound images with matching gross anatomical sections of the equine LD.
III.3.2 Material and Methods
In the present study a 6 year old Thoroughbred mare was used, which was euthanised for
reasons unrelated to this study. The dorsal spinous processes of the tenth thoracic vertebra
(T10) and the last lumbar vertebra (L6) were identified in the live horse. Between these two
landmarks a rectangular area extending 25 cm lateral from the midline was clipped and
scrubbed with chlorhexidine (hibiscrub®, ICI, UK). Ultrasound sites were marked at a
distance of 5 cm, 10 cm, 15 cm and 20 cm from the midline lateral to T10, T12, T14, T16,
T18 and L2 in 5 cm, 10 cm and 15 cm distance caudal to T18 using Tipp-Ex (BIC, Germany)
(Fig. 38). Ultrasound images were taken between T10 and L3 as it is impossible to scan parts
of LD due to the overlying muscle masses such as the muscles of the shoulder gridle and the
middle gluteal muscle. This grid was later used as indicator for the ultrasound sites and as an
orientation for sectioning of the frozen back with a band saw. The horse was standing square
on all four feet during the ultrasound examination. Ultrasound images were performed using a
real-time B mode ultrasound scanner (VingMed system 5, GE, Milwaukee, Wisconsin, USA)
with a 7.5 MHz linear transducer. All images were recorded on a digital video recorder (DCR-
PC 110E, Sony Cooperation). Longitudinal and transverse ultrasonographic images were
acquired at each location. Afterwards the horse was euthanized. After euthanasia the cadaver
was positioned in right lateral recumbency. Longitudinal and transverse ultrasound images
were collected at the same locations as in the live horse. After the ultrasound examination was
completed the neck, shoulder and pelvic girdle as well as the ventral part of the trunk were
removed. The isolated equine back was frozen at -20°C for 48 hours. Sagittal and transverse
sections were made with a band saw at the level of the previously marked sites. The right side
of the equine back was cut in five sagittal slices. The left side was sectioned into ten
transverse slices (Fig. 39). The thickness of the sagittal slices were 4.3 - 4.7 cm wide while
the thickness of the transverse slices varied between 5.5 cm and 8 cm. Photographs of each
slice were taken with a digital camera (Nikon D 70, Nikon Corporation, Japan).
Ultrasound images of the live horse and the cadaver were compared to evaluate visibility of
anatomical structures and image quality between the two conditions. Longitudinal and
transverse ultrasound images of the equine LD were compared to the corresponding sections
of the frozen equine back. The relationship between anatomical structures and muscle
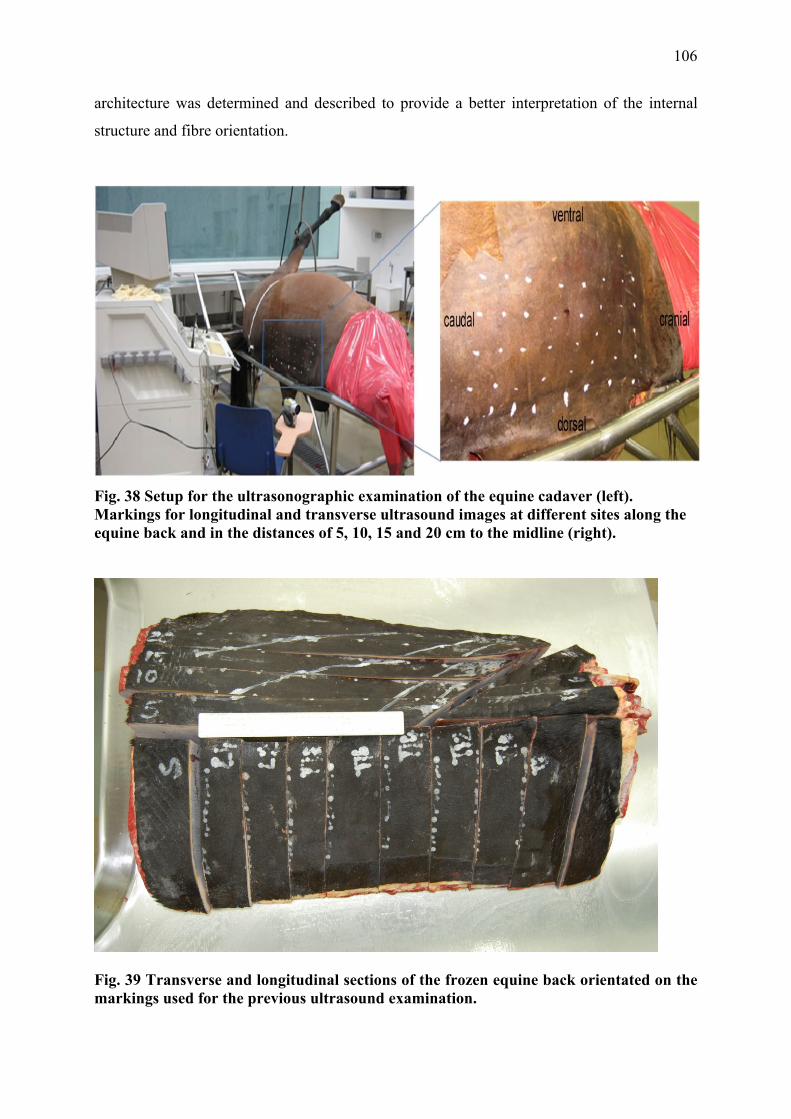
106
architecture was determined and described to provide a better interpretation of the internal
structure and fibre orientation.
Fig. 38 Setup for the ultrasonographic examination of the equine cadaver (left). Markings for longitudinal and transverse ultrasound images at different sites along the equine back and in the distances of 5, 10, 15 and 20 cm to the midline (right).
Fig. 39 Transverse and longitudinal sections of the frozen equine back orientated on the markings used for the previous ultrasound examination.
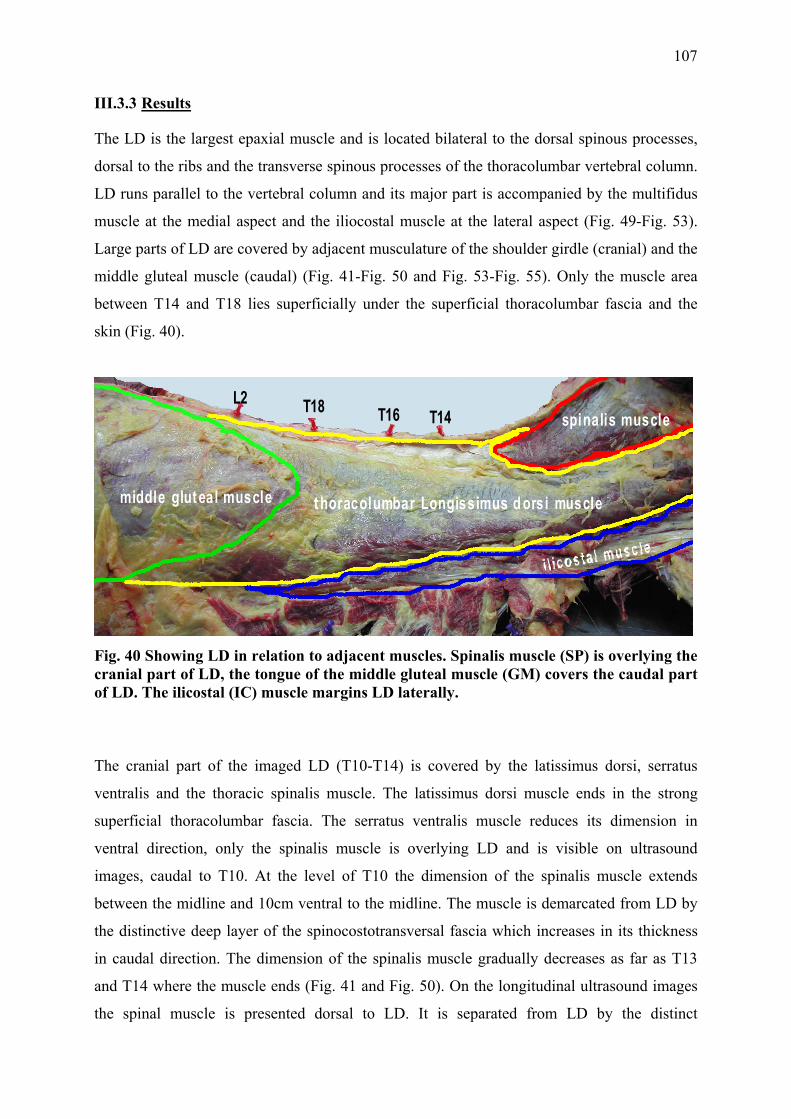
107
III.3.3 Results
The LD is the largest epaxial muscle and is located bilateral to the dorsal spinous processes,
dorsal to the ribs and the transverse spinous processes of the thoracolumbar vertebral column.
LD runs parallel to the vertebral column and its major part is accompanied by the multifidus
muscle at the medial aspect and the iliocostal muscle at the lateral aspect (Fig. 49-Fig. 53).
Large parts of LD are covered by adjacent musculature of the shoulder girdle (cranial) and the
middle gluteal muscle (caudal) (Fig. 41-Fig. 50 and Fig. 53-Fig. 55). Only the muscle area
between T14 and T18 lies superficially under the superficial thoracolumbar fascia and the
skin (Fig. 40).
middle glut eal muscle t horacolumbar Longissimus d orsi muscle
spinalis muscleT18L2
T16 T14
Fig. 40 Showing LD in relation to adjacent muscles. Spinalis muscle (SP) is overlying the cranial part of LD, the tongue of the middle gluteal muscle (GM) covers the caudal part of LD. The ilicostal (IC) muscle margins LD laterally.
The cranial part of the imaged LD (T10-T14) is covered by the latissimus dorsi, serratus
ventralis and the thoracic spinalis muscle. The latissimus dorsi muscle ends in the strong
superficial thoracolumbar fascia. The serratus ventralis muscle reduces its dimension in
ventral direction, only the spinalis muscle is overlying LD and is visible on ultrasound
images, caudal to T10. At the level of T10 the dimension of the spinalis muscle extends
between the midline and 10cm ventral to the midline. The muscle is demarcated from LD by
the distinctive deep layer of the spinocostotransversal fascia which increases in its thickness
in caudal direction. The dimension of the spinalis muscle gradually decreases as far as T13
and T14 where the muscle ends (Fig. 41 and Fig. 50). On the longitudinal ultrasound images
the spinal muscle is presented dorsal to LD. It is separated from LD by the distinct

108
hyperechoic spinocostotransversal fascia. Muscle fibre arrangement is clearly visible due to
the hyperechoic muscle septa. The muscle fibres of the spinal muscle are orientated in
craniodorsal to caudoventral direction, in contrast to the muscle fibre orientation of LD which
runs in cranioventral to caudodorsal direction (Fig. 41).
In the caudal part between T18 and the pelvis LD is covered by the gluteal tongue. The
triangular gluteal tongue is the cranial muscle part of the middle gluteal muscle which fills in
a recession of LD and is demarcated from this muscle by the deep layer of the thoracolumbar
fascia. The apex of the gluteal tongue reaches cranial as far as T18 (Fig. 44 and Fig. 53)
where it inserts between 10 cm and 15 cm away from the midline onto the superficial
thoracolumbar fascia. On ultrasound images the middle gluteal muscle is demarcated by the
hyperechoic thoracolumbar fascia. Similar to LD muscle fibre orientation the muscle fibres of
the middle gluteal muscle continue in a cranioventral to caudodorsal direction with a slightly
smaller pennation angle towards the thoracolumbar fascia (Fig. 44).
Parallel to this overlying muscle a distinct internal fascia arises from the superficial
thoracolumbar fascia subdividing LD caudal to T17. This internal fascia could be visualised
in the sagittal (Fig. 42 and Fig. 44) and transverse sections of the frozen back as well as on the
ultrasound images as a hyperechoic line. This fascia becomes stronger during the course of
the caudal LD. It runs from dorsolateral in a ventromedial direction in a distance of
approximately 10 cm lateral to the midline (Fig. 53- Fig. 55).
The muscle fibre orientation can be partly observed in the sagittal slices of the frozen cadaver
as well as in the longitudinal ultrasound images in form of hyperechoic muscle septa (Fig. 41-
Fig. 48). Muscle fibre orientation changes in a dorsal to ventral direction from a large
pennation angle inserting onto the aponeurosis (dorsal) to smaller pennation angle (ventral).
No distinct change was observed in the cranial to caudal direction. In the dorsal sections, 5 cm
and 10 cm away from the midline, muscle fibres appear to have a larger insertion angle into
the superficial thoracolumbar fascia. As LD reduces its depth further ventral (15 cm and 20
cm away from the midline) muscle fibres seem to decrease their pennation angle and insert in
a more horizontal direction to the rib cage. This is visible on the ultrasound images of Fig. 47
and Fig. 48. Muscle fibre septa run as hyperechoic line almost parallel to the transverse cross-
section of the rib which represents the hyperechoic image of bone.
The following pictures (Fig. 41-Fig. 55) display the sagittal and transverse frozen cuts and
corresponding ultrasound images of the epaxial musculature.

109
T10 T12 T14 T16
(a)
(b)
(c)
SP GM
cranial LD caudal LD
Fig. 41 (a) Sagittal section of the equine back 5 cm lateral to the midline, (b) details of the anatomic reference images corresponding to ultrasound images shown in (c) between T10- T16. Images of T10 and T12 show the spinalis muscle (SP) overlying LD. Both muscles are demarcated by a strong aponeurosis from each other. The muscle fibres of SP are orientated in craniodorsal to caudoventral direction whereas muscle fibres of LD run in a cranioventral to caudodorsal direction. The strong superficial thoracolumbar fascia and the skin define the dorsal border of the images.

110
T18 L2 L4
(a)
(b)
(c)
SP
thoracic LD
GM
Fig. 42 (a) Sagittal section of the equine back 5 cm lateral to the midline, (b) details of the anatomic reference images between T18- L4 corresponding to ultrasound images shown in (c). The image of L4 shows dorsal the overlying gluteal tongue which is demarcated by the prominent deep layer of the thoracolumbar fascia from LD. The muscle fibres of LD run in a cranioventral to caudodorsal direction. The strong superficial thoracolumbar fascia, subcutaneous fat and skin define the dorsal boundary of LD.
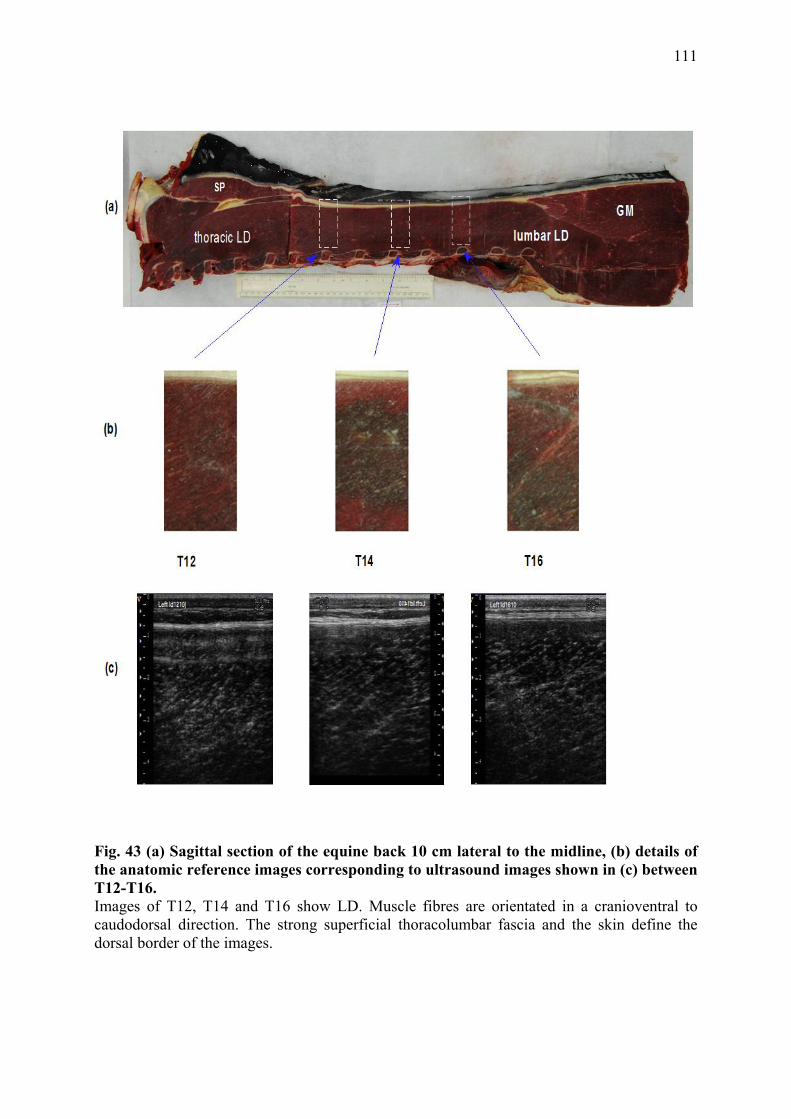
111
Fig. 43 (a) Sagittal section of the equine back 10 cm lateral to the midline, (b) details of the anatomic reference images corresponding to ultrasound images shown in (c) between T12-T16. Images of T12, T14 and T16 show LD. Muscle fibres are orientated in a cranioventral to caudodorsal direction. The strong superficial thoracolumbar fascia and the skin define the dorsal border of the images.

112
Fig. 44 (a) Sagittal section of the equine back 10 cm lateral to the midline, (b) details of the anatomic reference images corresponding to ultrasound images shown in (c) between T18- L4. Images of T18 and L2 show the gluteal tongue of the middle gluteal muscle (GM) overlying LD. Both muscles are demarcated from each other by the strong deep thoracolumbar fascia which is visible in the gross anatomic picture and the ultrasound images at the level of T18 and L2. The image at L4 shows only gluteal musculature. The muscle fibres of LD are orientated in a cranioventral to caudodorsal direction. The gluteal muscle fibres are orientated in a similar direction as LD but with a slightly smaller pennation angle. The strong superficial thoracolumbar fascia and the skin define the dorsal border of the images.

113
T12 T14 T16T11
(a)
(b)
(c)
GMlumbar LDSP
Fig. 45 (a) Sagittal section of the equine back 15 cm lateral to the midline, (b) details of the anatomic reference images corresponding to ultrasound images shown in (c) between T11- T16. The image at T11 shows the spinalis muscle (SP) overlying LD. Both muscles are demarcated by the strong deep spinocostotransversal fascia from each other. The images of T12, T14 and T16 show the transverse cut of the corresponding ribs (ventral). Muscle fibres of LD run in a cranioventral to caudodorsal direction. The strong superficial thoracolumbar fascia and the skin define the dorsal border of the images.

114
T18 L2 L4
SPthoracic LD GM(a)
(b)
(c)
Fig. 46 (a) Sagittal section of the equine back 15 cm lateral to the midline, (b) details of the anatomic reference images corresponding to ultrasound images shown in (c) between T18- L4. Images of L2 and L4 show the gluteal tongue of the middle gluteal muscle (GM) overlying LD. Both muscles are demarcated from each other by the deep thoracolumbar fascia. The muscle fibres of LD run in a cranioventral to caudodorsal direction. Muscle fibres of GM are orientated more parallel to the skin. The strong superficial thoracolumbar fascia and the skin define the dorsal border of the images.

115
Fig. 47 (a) Sagittal section of the equine back 20 cm lateral to the midline, (b) details of the anatomic reference images corresponding to ultrasound images shown in (c) between T10- T16. Images at T12, T14 and T16 show the sagittal section of the iliocostal muscle (IC). Muscle fibres of IC are orientated relatively parallel to the skin. The ribs are clearly visible on the ventral border of the images. The strong superficial thoracolumbar fascia and the skin define the dorsal border of the images.

116
Fig. 48 (a) Sagittal section of the equine back 20 cm lateral to the midline, (b) details of the anatomic reference images corresponding to ultrasound images shown in (c) between T18-L4. Images at T18 and L2 show the LD muscle. At T18 muscle fibres orientate relatively parallel to the skin whereas muscle fibres imaged at L2 and L4 insert in a steeper pennation angle onto the deep thoracolumbar fascia. At L4 middle gluteal muscle overlies LD. The strong superficial thoracolumbar fascia, fat and the skin define the dorsal border of the images.

117
Fig. 49 (a) Transverse section of the equine back at the level of T10, (b) details of the anatomic reference images corresponding to ultrasound images shown in (c). The image 10 cm lateral to the midline shows the prominent strong deep spinocostotransversal fascia demarcating the spinalis muscle (SP) from LD, at 15 cm lateral to the midline LD is covered by the latissimus dorsi muscle (LT), LD shows distinct marbling. The image of LD 20 cm lateral to the midline shows its ventral extension and the adjacent ilicostal muscle (IC) demarcated by the thoracolumbar fascia. The superficial thoracolumbar fascia and skin define the dorsal boundary of the images. Multifidus (M) and serratus ventralis (SV) muscle are located medial and ventral to LD.

118
Fig. 50 (a) Transverse section of the equine back at the level of T12. (b) details of the anatomic reference images corresponding to ultrasound images shown in (c). The image 5 cm lateral to the midline shows the prominent strong spinocostotransversal fascia demarcating spinalis muscle (SP) from LD, images 10 cm and 15 cm lateral to the midline show the cross-section of LD, the image 20 cm lateral to the midline shows the distinct demarcation between LD and IC and the cross-section of the 12th rib confining IC. The superficial thoracolumbar fascia and skin define the dorsal boundary of the images. The multifidus muscle (M) is located medial to LD.

119
Fig. 51 (a) Transverse section of the equine back at the level of T14, (b) details of the anatomic reference images corresponding to ultrasound images shown in (c). The image 5 cm lateral to the midline shows a residual strong fascia, at 10 cm and 15 cm lateral to the midline the marbled transverse cross-section of LD is visible, the image at 20 cm lateral to the midline shows the ventral extension of LD and the adjacent IC, the rib is visualised as a hyperechoic line. The superficial thoracolumbar fascia and skin define the dorsal boundary of the images. The multifidus muscle (M) is located medial to LD.

120
Fig. 52 (a) Transverse section of the equine back at the level of T16, (b) details of the anatomic reference images corresponding to ultrasound images shown in (c). Images at 5 cm and 10 cm lateral to the midline show the marbled LD, images 15 cm and 20 cm lateral to the midline, the 16th rib borders the ventral aspect of LD as a hyperechoic line. The superficial thoracolumbar fascia and skin define the dorsal boundary of the images. The multifidus muscle (M) is located medial to LD.

121
Fig. 53 (a) Transverse section of the equine back at the level of T18, (b) details of the anatomic reference images corresponding to ultrasound images shown in (c). The image 5 cm lateral from the midline shows LD covered by the strong superficial thoracolumbar fascia. 10 cm lateral to the midline LD is covered by the cranial extension of the gluteal tongue. Both muscles are demarcated by the deep layer of the superficial thoracolumbar fascia from which a thick aponeurosis runs in ventromedial direction. Images 15 cm and 20 cm lateral to the midline show LD and the corresponding rib as a hyperechoic line, at the distance of 20 cm lateral to the midline the caudal IC is separated from LD by a thin fascia. The multifidus muscle is located medial to LD.

122
Fig. 54 (a) Transverse section of the equine back at the level of L2, (b) details of the anatomic reference images corresponding to ultrasound images shown in (c). Images taken at 5 cm and 10 cm lateral to the midline show the strong deep layer of the superficial thoracolumbar fascia covering LD and demarcating LD from the gluteal tongue (GM), 15 cm lateral to the midline the gluteal tongue takes up the majority of the image, 20 cm lateral to the midline the image shows LD and the ventral extension of the gluteal tongue. The superficial thoracolumbar fascia, fat and skin define the dorsal boundary of the images. The multifidus muscle (M) is located medial to LD.

123
Fig. 55 (a) Transverse section of the equine back at the level of L4, (b) details of the anatomic reference images corresponding to ultrasound images shown in (c). The image 5 cm lateral to the midline shows the strong deep layer of the superficial thoracolumbar fascia overlying LD and demarcating LD from the middle gluteal muscle (GM). Images at 10 cm, 15 cm and 20 cm display the middle gluteal muscle. The superficial thoracolumbar fascia, fat and skin define the dorsal boundary of the images. In the transverse cross-section of the whole frozen slice the multifidus muscle (M) is located medial to LD and the internal fascia (white arrows) released from the deep layer of the thoracolumbar fascia is visible running in dorsolateral to ventromedial direction.

124
III.3.4 Discussion and Conclusion
The aim of this study was to develop an ultrasound guide of the equine LD. The lack of
familiarity with the normal cross-sectional anatomy of the equine epaxial musculature is a
major factor limiting the interpretation of ultrasound images. Therefore the frozen slices of
the equine back facilitated an accurate interpretation of the anatomical structures on
ultrasound images. Longitudinal and transverse ultrasound images were correlated to the
corresponding cross-sections of the frozen cadaver which showed a consistent match of
ultrasonographic features with the frozen anatomical structures.
In the present study the topographic anatomy of overlying and adjacent muscles to LD were
visualised to document the relationship between the different muscles in certain regions. The
knowledge of the exact location of LD and the relationship between adjacent muscles and LD
is important for the clinical examination of the equine back. Muscle alterations, such as
swelling, muscle hypertrophy or atrophy, muscle spasm, muscle pain, observed by visual
inspection and palpation need to be related to the correct muscle structure to allow the
adequate treatment and training. The comparison of ultrasound pictures and frozen slices
showed that parts of LD are covered by the spinalis muscle and serratus ventralis muscle
(cranial) and also the tongue of the middle gluteal muscle (caudal). Parallel to LD the
iliocostal muscle runs along its lateral border. Therefore muscle atrophy along the withers, for
example, may not include LD alone but also the spinalis muscle and therefore may have
different clinical significance.
It is also important to indicate the strong superficial thoracolumbar fascia which surrounds LD
and demarcates it from adjacent muscles. The superficial thoracolumbar fascia releases a
distinct, additional, internal fascia caudal to T17 which divides LD in a medial and lateral
part. This was visible on ultrasound images as well as in the cross-section of the
corresponding cadaver slices. Due to the internal fascia the effective line of pull of the muscle
fibres is altered. The visualisation of the LD muscle structure and the characteristics of the
fascia are important to document normal muscle structure which then can be used to compare
normal LD structure to LDs of horses with back problems.
Ultrasound images and dissections of LD showed that muscle volume changes through the
course of LD. The dimension of the cross-section of the medial part of LD next to the dorsal
spinous processes is large and decreases in lateral direction. The full muscle thickness of LD
was only visible with ultrasound in its whole depth in a distance of >10 cm away from the

125
midline as the medial muscle region was too thick to image in full depth. The pennation angle
decreases in a mediolateral direction. Although the muscle fibre length was not visible in its
full extent the decreasing pennation angle might be associated with decreasing muscle
thickness at a constant muscle fibre length. Changes of fibre orientation and muscle thickness
result in changes of muscle properties. The total PCSA increases in proportion to the
pennation angle of the muscle fascicles and volume (Aagard et al., 2001; Alexander and
Vernon 1975; Rutherford and Jones 1992). This means that the PCSA is decreased in the
lateral LD not only because of the decreased pennation angle but also because of reduced
muscle thickness. As the force generating capacity is proportional to PSCA it can be
presumed that the muscle force is less in the lateral LD compared to the medial LD (Payne et
al. 2004).
Not only the gross anatomical structure but also the basic internal muscle structure of LD
allows conclusions on the biomechanical function of this muscle. Detailed information of
muscle thickness, muscle fibre length and pennation angle characterise the functional capacity
of the muscle which can be used to compare normal LD structure to LDs of horses with back
problems. In humans parameters of the internal muscle structure including muscle fibre
orientation, muscle and fat thickness, echogenity and ratio of tendinous structures compared
to muscle tissue have been shown to be important to interpret muscle quantity (Aagard and al
2001; Binzoni et al. 2001; Kawakami et al. 2006; Kubo et al. 2003a; Maganaris et al. 1998;
Maurits et al. 2003; Narici et al. 2003; Nielsen et al. 2000; Strobel et al. 2005).
Changes of the muscle structure of the equine LD play an important role to diagnose primary
and secondary back problems in the horse. Measurements of pennation angle and muscle
thickness are helpful to monitor changes in muscle quantity influenced by factors such as type
of training, age, bad fitted saddles, back pain and lameness.
In humans, bed rest and muscle inactivity had a negative effect on muscle thickness and
pennation angle (Abe et al. 1997). As horses with back problems often show an atrophy of
LD parameters such as muscle thickness and pennation angle might be helpful to evaluate the
degree of muscle atrophy. These parameters could also be used to monitor the effect of
treatment and training as in humans, pennation angle and muscle thickness was shown to
increase with training resulting in an increase of maximal force-generating capacity (Aagard
et al. 2001; Seynnes et al. 2007).
It also might be important to valid the influence of age on LD after studies have documented
that muscle thickness is influenced by age (Kubo et al. 2003a, b). Age-related muscle atrophy

126
was observed in certain muscles of humans. For example, muscle thickness of elderly men
and woman was decreased compared to younger men (Reimers et al. 1998).
Other ultrasound studies in human musculature have demonstrated that ultrasound is able to
depict changes of the muscle composition. The replacement of muscle tissue by fat resulted in
an increased echogenicity and a decrease of the muscle bulk (Reimers et al. 1993; Sofka et al.
2004; Strobel et al. 2005). Substantial fatty atrophy was also characterised by the loss of the
visibility of tendons and the loss of the typical pennate muscle pattern (Khoury et al. 2008;
Strobel et al. 2005). Similar results were documented in a study comparing trained and
untrained men. Increased intramuscular echogenicity with decreased echoes reflected from
connective tissue septa and the bone were visible in untrained men compared to trained
athletes. These changes were thought to be due to the increase of intramuscular connective
tissue and fat in proportion to muscle tissue. An age-related increase of echogenicity of the
ultrasound images was detected in muscles of older men compared to middle aged men. In
this study increased echogenicity was reported to be the result of centripetalisation and
internalisation of fat into the muscle (Sipila and Suominen 1991). Therefore the replacement
of muscle tissue by fat in LD of horses with muscle atrophy due to back problems and age
could be evaluated by the echogenicity measurements of ultrasound images. According to
studies in humans, the atrophy and disuse of the equine LD is visible on the ultrasound image
as higher echogenicity and effaced muscle fibre pattern (Khoury et al. 2008; Sipila and
Suominen 1991)
In conclusion, ultrasound is a readily available and practical technique to image soft tissue
structures of the equine back. The present study provides anatomical information on the
equine LD, which will assist both clinical and research purposes. As the examined LD came
from a horse with no history of clinical signs of back problems, ultrasound images and frozen
cadaver slices could not be related to any obvious changes of muscle structure and images do
not give any conclusion on horses with back problems. But the present description provides a
reference for the ultrasonographic evaluation of the equine LD and may support the
interpretation of pathological conditions of the equine back. It was demonstrated that
ultrasound is relatively easy to perform with standard ultrasound equipment. Hypo- and
hyperechoic areas, fibre pattern and pennation angle as well as muscle depth and fat thickness
can be visualised and measured. Although ultrasound has been demonstrated to be useful to
monitor muscle quantity in humans the role of ultrasound measurements as parameters to

127
characterise the equine LD needs to be further evaluated. Differences between breed, age and
gender and in particular differences between horses with and without back pain need accurate
validation to install ultrasound as a precise technique to distinguish between normal and
pathological conditions.

128
III.4 Quantitative Ultrasonography of the equine thoracolumbar Longissimus dorsi muscle: repeatability of muscle thickness and pennation angle measurements
III.4.1 Introduction
Ultrasonography as a diagnostic technique has been widely used to evaluate soft tissue
structures in the horse (Reef 1998). Although ultrasound is mainly applied to image tendons,
ligaments and joints it has also been employed to determine the internal structure of muscles
and differentiate between soft, solid, vascular and cystic lesions (Rantanen and McKinnon
1997). Transverse images of muscle show the connective tissue surrounding the muscle
fascicles as fine, disorganized hyperechoic echoes scattered throughout the hypoechoic
muscle tissue. In the longitudinal view it is characterized by fine, homogeneous, multiple and
parallel hyperechoic lines within the hyperechoic muscle (see chapter III.3). This sonographic
appearance is due to multiple muscle bundles (fascicles) surrounded by fibroadipose septa
(perimysium). Internal and overlying connective tissue, fascia and fat appear as a bright
echogenic structures compared to the less echogenic muscle tissue (Rantanen and McKinnon
1997). Ultrasonograpic examination of the equine back muscles has been described in the
literature mainly in association with pathological findings such as muscle fibre tearing or
haemorrhage (Reef 1998; Ross and Dyson 2002). In chapter III.3 the normal ultrasonographic
anatomy is described in detail.
In humans ultrasonography is not only performed to characterise muscle lesions or diagnose
neuromuscular disorders (Zuberi et al. 1999), it is also used as a non-invasive tool for the
evaluation of muscle function by quantifying muscle architecture. Architectural
measurements such as pennation angle, muscle fibre length and muscle volume are important
characteristics of whole muscle function (Fukunaga et al. 1997; Gans 1982; Gans and Bock
1965; Otten 1988). Muscle fibre length describes the number of sarcomeres in series which is
related to shortening velocity and the range over which force can be generated. Pennation
angle defines the angle in which muscle fibres insert to the corresponding tendon or
aponeurosis. Increased pennation angle in a given muscle cross-section area and muscle
volume results in decreased muscle fibre length. Thus, shortening velocity and range of
excursion is reduced but the number of contractile muscle fibres placed in parallel is increased
which in turn increases maximum force generation (Maganaris et al. 1998). As it is often
difficult to image the whole muscle volume or cross-sectional area by ultrasound images,
muscle thickness can be used as an indirect measurement to help determine muscle function

129
(Klimstra et al. 2007; Maganaris and Baltzopoulos 1999). Previous studies have determined
the correlation between architectural measurements and muscle thickness using ultrasound
and verified these results by magnetic resonance imaging (MRI) or computed tomographic
(CT) measurements/ images (Dupont et al. 2001). A significant correlation between both
muscle fibre length and pennation angle and muscle thickness was observed (Abe et al. 1998;
Kawakami et al. 1993; Kearns et al. 2000) and it was suggested that pennation angle is a
function of the relative state of muscle enlargement (Kearns et al. 2000).
The equine thoracolumbar Longissimus dorsi muscle (LD) is one of the largest muscles of the
horse. The muscle is thought to be involved in the clinical signs of back pain, poor
performance, reluctance to riding and in back pain secondary to hind limb lameness (Jeffcott
and Haussler 2004; Ross and Dyson 2002). To date there is no documentation of LD changes
in normal horses or horses suffering from back pain, it would be useful however to have a
technique that would allow the evaluation of muscle structure reliably in the live horse. In
humans, it is well documented that back pain is associated with changes in the volume of back
muscles (Hides et al. 1994). Affected muscle groups undergo hypertrophy in the acute stage
and atrophy with an increase of fatty tissue in chronic cases (Kamaz et al. 2007). In these
studies many of the paraspinal muscle evaluations have been performed by MRI (Hides et al.
1995) and CT-scans (Danneels et al. 2000) which are not feasible techniques for the large
equine body. However, comparison of MRI, CT and ultrasound scans have justified the use of
ultrasound as a method for the detection of changes throughout large muscles in response, for
example, to disuse, training or muscle degeneration (Reeves et al. 2004; Walton et al. 1997).
Ultrasonographic measurements showed to be highly reliable and valid involving muscle
architecture and muscle thickness of humans (Baumgartner et al. 1998; Reeves et al. 2004;
Reimers et al. 1998; Sanada et al. 2006). Therefore it seems to be a promising method to
image the equine LD. It provides non-invasive visualization of muscle changes without any
exposure to ionizing radiation. Furthermore, ultrasound has the advantage to be a most
practical and cost-effective method to determine skeletal muscle.
Ultrasound studies in humans of different skeletal muscles, for example multifidus, erector
spinae and quadriceps muscle, have tried to establish normal values of muscle thickness and
architectural parameters to standardize real-time ultrasound examinations and use them as a
database for normal values (Blazevich et al. 2006; Kristjansson 2004; Reimers et al. 1996;
Scholten et al. 2003). Therefore measurements have been tested for inter- and intraobserver
130
reliability to prove ultrasound is an accurate and precise method. The results indicated that
ultrasound provides reliable data for muscle thickness and muscle architectural measurements
(Blazevich et al. 2006; Kristjansson 2004; Watanabe et al. 2004). Curently no data is
available on the reliability of ultrasound in the assessment of muscle morphology in the horse,
however ultrasound was proven to be a repeatable technique for the measurement of the
volume of tendon lesions in the horse and muscle volume in the dog (Weller et al., 2007;
Ferrari et al. 2006).
The aim of this study was to determine the practicability and reliability of ultrasonography to
determine muscle architecture of the LD in the live horse.
The objectives of the study were to
• determine inter- and intraobserver repeatability for measuring LD depth and pennation
angle using ultrasonography
• determine the practicability of using ultrasonography to measure LD depth and
pennation angle in live horses
III.4.2 Material and Methods
III.4.2.1 Subjects
Ten Welsh mountain ponies (section A, all mares, owned by the Royal Veterinary College)
weighing 227 kg to 525 kg (mean ±stdev 396 ± 104 kg) were used in this experiment. Their
height ranged from 112 cm to 152 cm (mean ±std 134 ±14 cm) and their age ranged from four
years to 11 years (mean ±stdev 7±4 years). Previous to the experimental procedure all horses
were judged to be clinically sound during in–hand gait examination and to have no clinical
signs of back pain by an experienced equine clinician.
III.4.2.2 Data collection
Ultrasonographic images were collected from the left and right thoracic and lumbar LD at the
level of the 16th rib, 10 cm lateral to the midline. For the procedure all ponies were confined
in stocks and stand square. Rib 16 was identified by palpation and a 6 cm x 4 cm skin patch
was clipped 10 cm lateral to the midline of the back. The skin patch was cleaned with water
and spirit to remove dirt. Ultrasound gel was applied to the ultrasound transducer and to the
scanning area to optimise acoustic coupling. Two observers acquired twenty B-mode images
each of the right and left LD from each pony, using a 7.5 MHz linear transducer with a laptop

131
based ultrasound machine (Echo Blaster 128 EXT-1Z, UAB Telemed, Vilnius, Lithuania).
Gain and power settings were kept constant for each acquisition: gain 82, power 82 (these
settings were selected based on pilot data). Images were acquired into a 512x512 matrix and
the images were saved as “tagged image file format“ (TIFF) files for further processing.
A total of 800 ultrasound images were obtained by two different examiners in 10 horses.
Based on image quality, mainly definition of muscle fibre and aponeurosis visibility, 440
images were selected. Measurements of muscle thickness and pennation angle were
performed in the JAVA image processing program Image J (Author: Wayne Rasband,
Research Service Brach, National Institute of Mental Health, Bethesda, Maryland, USA). The
muscle thickness was measured from the aponeurosis-muscle interface to the muscle-bone
interface with electronic callipers by one operator in 440 images. The repeatability of using
the electronic calipers was assessed by a standardised 2.0 cm measurement taken from the
scale displayed in each ultrasound image. Pennation angle were calculated by identifying and
tracking muscle fascicles and relate them to their corresponding aponeurosis with the help of
the electronic goniometer of Image J.
III.4.2.3 Data analysis
Muscle depth measurements resulting from the repeated ultrasonographic images of the two
examiners were used to assess the variation in muscle depth and pennation angle between
measurements of the right and left LD, between horses and to determine the intra- and inter
observer repeatability.
Mean and standard deviation were calculated for the different horses, observers and right and
left LD. The distribution of the data was assessed graphically and tested for normality using a
Kolmogorov-Smirnov test. An independent samples t-test, paired samples t-test and ANOVA
(with a Bonferroni post-hoc test) were carried out to test the differences between examiners,
right and left LD and the ten horses respectively. In this study, the statistical significance level
was set at p< 0.05. The inter-observer agreement was expressed as the 95% limits of
agreement of the differences between observers and calculated as the mean difference ± 1.96
x standard deviation of the differences (Bland and Altman 1986). This was performed after
the assumptions that the differences were normally distributed and that the differences were
independent from the size of the measurement were satisfied.
Intra-observer repeatability was determined by calculating the repeatability coefficient by
multiplying the standard deviation of the differences by 2.77 (British Standards Instituion,

132
1975). Variation in measurements was also expressed as ratio between standard deviation and
mean (coefficient of variation, CoV).
The relationship between age, weight and heights of the horses and muscle thickness or
pennation angle was assessed by calculating the Pearson’s correlation coefficient.
All data was processed in Excel (Microsoft Office 2003, Microsoft Cooperation, USA) and
SPSS 14.0 (SPSS Inc. Chicago, Illinois, USA).
III.4.3 Results
III.4.3.1 Variation in muscle thickness measurements
Muscle thickness measurements of the ten horses ranged from 2.2 cm to 5.3 cm resulting in a
mean±stdev value of 3.0 ±0.6 cm. There was a significant difference between horses (p=
0.0001) which reflected the influence of age, size and composition on LD muscle thickness.
No significant difference was detected between right and left LD of each horse (p= 0.5).
Calculation of the mean ±std muscle thickness values for operator 1 and operator 2 showed
3.6 ±0.8 cm (operator 1) and 3.4 ±0.8 cm (operator 2). There was no significant inter-operator
difference (p= 0.1). The variation of the measurements in the ten horses expressed as
coefficient of variation (CoV) ranged between 1.5-11.6 % for operator 1 and between 1.5-
11.3% for operator 2.
III.4.3.1.1 Intra-operator repeatability for muscle thickness measurements
Variation in measurement due to identifying endpoints with electronic callipers by the same
operator was shown to be small as standardised measurements of the image scale for all 440
selected scans resulted in a mean ±stdev value of 2.0±0.06 cm with a CoV of 0.3%.
The standard deviation of the difference between repeated muscle thickness measurements of
the ten horses for each operator ranged from 0.05-0.3 cm (operator 1) and from 0.05 cm to
0.4 cm (operator 2). This resulted in a repeatability coefficient (2.77 x stdev) of 0.40 cm for
operator 1 and in a repeatability coefficient of 0.42 cm for operator 2.
III.4.3.1.2 Inter-operator agreement for muscle thickness measurements
The mean ±std difference of muscle thickness measurements between operator 1 and
operator 2 was 0.09 ±0.2 cm. Therefore the 95% limits of agreement were calculated to be
between 0.3 cm and 0.5 cm. The width of the 95% limits of agreement was 0.8 cm.
Mean muscle thickness, standard deviation and minimum and maximum values for each
operator, right and left LD in each horse are displayed in Table 31-Table 34.

133
Table 31 Mean value, standard deviation and minimum and maximum values of the muscle thickness measurements of the right LD in all horses taken by operator 1 in cm.
Horse N Mean (cm) Stdev. (cm)
Minimum (cm)
Maximum (cm)
1 11 3.1 0.16 2.9 3.5 2 11 3.2 0.16 2.9 3.5 3 11 2.4 0.16 2.2 2.7 4 11 2.7 0.29 1.9 2.9 5 11 3.1 0.09 2.9 3.2 6 11 4.4 0.10 4.3 4.7 7 11 2.0 0.21 1.9 2.5 8 11 3.1 0.19 2.7 3.4 9 11 3.6 0.05 3.5 3.7 10 11 3.5 0.07 3.4 3.6
Table 32 Mean value, standard deviation and minimum and maximum values of the muscle thickness measurements of the left LD in all horses taken by operator 1 in cm.
Horse N Mean (cm)
Stdev. (cm)
Minimum (cm)
Maximum (cm)
1 11 3.2 0.12 3.0 3.4 2 11 3.1 0.18 2.7 3.4 3 11 2.1 0.08 2.0 2.3 4 11 3.1 0.15 2.8 3.4 5 11 3.5 0.09 3.3 3.7 6 11 3.4 0.12 3.2 3.6 7 11 2.0 0.24 1.7 2.4 8 11 1.9 0.10 1.8 2.1 9 11 3.6 0.14 3.4 3.9 10 11 3.9 0.08 3.7 4.0
Table 33 Mean value, standard deviation and minimum and maximum values of the muscle thickness measurements of the right LD in all horses taken by operator 2 in cm.
Horse N Mean (cm)
Stdev. (cm)
Minimum (cm)
Maximum (cm)
1 11 2.8 0.14 2.7 3.1 2 11 3.1 0.12 3.0 3.3 3 11 2.7 0.11 2.6 2.9 4 11 2.4 0.13 2.2 2.6 5 11 3.0 0.07 2.9 3.1 6 11 4.0 0.42 3.2 4.3 7 11 1.9 0.07 1.8 2.0 8 11 2.6 0.12 2.3 2.8 9 11 3.4 0.39 2.6 3.7 10 11 3.5 0.10 3.4 3.7

134
Table 34 Mean value, standard deviation and minimum and maximum values of the muscle thickness measurements of the left LD in all horses taken by operator 2 in cm.
Horse N Mean (cm)
Stdev. (cm)
Minimum (cm)
Maximum (cm)
1 11 3.3 0.12 3.1 3.5 2 11 3.2 0.14 3.1 3.5 3 11 2.4 0.11 2.2 2.6 4 11 3.2 0.17 2.9 3.5 5 11 3.3 0.05 3.2 3.4 6 11 3.2 0.10 3.0 3.3 7 11 1.8 0.15 1.5 2.0 8 11 1.8 0.12 1.6 2.0 9 11 3.7 0.17 3.5 4.0 10 11 3.6 0.10 3.4 3.7
III.4.3.2 Variation in pennation angle
The pennation angle measurements of the ten horses showed a range between 8° to 30° and a
mean±stdev value of 17 ±5°. There was a significant difference between the different horses
(p= 0.0001) which reflected the influence of age, size and composition on LD muscle quality.
No significant difference was detected between right and left LD of each horse (p= 0.1).
III.4.3.2.1 Intra-operator agreement for pennation angle
The repeatability coefficient was 8° for operator 1 and 7° for operator 2. Mean pennation
angle of LD, standard deviation and minimum and maximum values for each operator, right
and left LD in each horse are displayed in Table 35-Table 38.
III.4.3.2.2 Inter-operator repeatability for pennation angle
The calculations of the mean ±std pennation angle values for examiner 1 and examiner 2
showed 18 ±4° (operator 1) and 18 ±3° (operator 2). There was no significant inter-operator
difference detected (p= 0.1). The variation of the measurements in the ten horses were shown
as coefficient of variation (CoV) and ranged between 8.5-89.8% for operator 1 and between
4.5-46.9% for examiner 2. The mean ±std difference of pennation angle measurements
between operator 1 and operator 2 was -0.7° ±4°. Therefore the 95% limits of agreement were
calculated to be between -8° and 6°. The width of the 95% limits of agreement was 14°.

135
Table 35 Mean value, standard deviation, minimum and maximum of the pennation angle of the right LD in all horses taken by operator 1 in (°).
Horse N Mean (°) Stdev. (°)
Minimum (°)
Maximum (°)
1 11 15 1.92 12 19 2 11 16 3.17 12 20 3 11 19 2.70 14 24 4 11 19 3.34 14 25 5 11 18 3.66 11 24 6 11 22 2.71 17 27 7 11 15 2.57 11 22 8 11 20 2.35 17 24 9 11 11 1.13 10 12 10 11 20 2.77 13 24
Table 36 Mean value, standard deviation, minimum and maximum of the pennation angle of the left LD in all horses taken by operator 1 in (°).
Horse N Mean (°) Stdev. (°)
Minimum (°)
Maximum (°)
1 11 16 2.45 12 19 2 11 15 3.03 10 20 3 11 20 2.27 16 24 4 11 21 2.75 16 25 5 11 17 2.88 11 21 6 11 21 3.15 17 27 7 11 16 2.50 11 22 8 11 20 2.47 17 24 9 11 12 1.39 10 13 10 11 20 2.82 13 24
Table 37 Mean value, standard deviation, minimum and maximum of the pennation angle of the right LD in all horses taken by operator 2 in (°).
Horse N Mean (°) Stdev. (°)
Minimum (°)
Maximum (°)
1 11 15 2.27 12 19 2 11 14 2.37 10 17 3 11 18 2.13 14 23 4 11 19 3.47 14 25 5 11 18 3.18 11 24 6 11 22 3.17 17 27 7 11 15 2.45 11 22 8 11 21 2.04 18 24 9 11 13 0.65 12 13 10 11 20 2.71 13 23
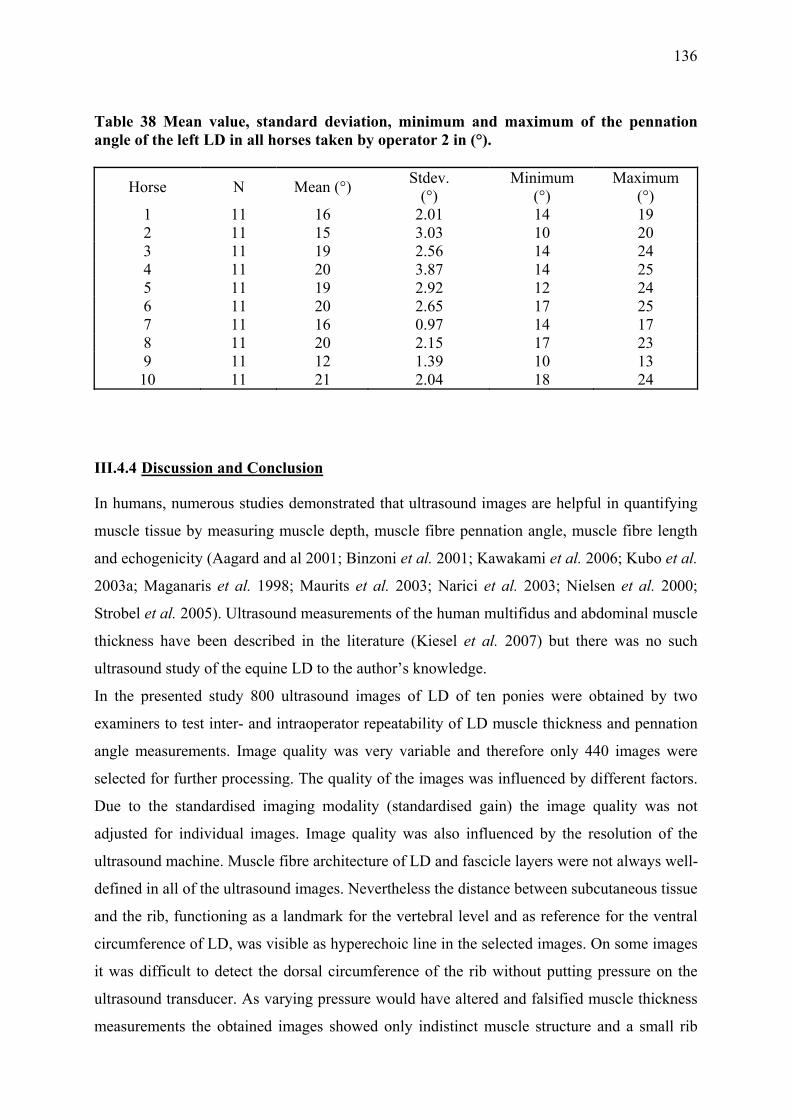
136
Table 38 Mean value, standard deviation, minimum and maximum of the pennation angle of the left LD in all horses taken by operator 2 in (°).
Horse N Mean (°) Stdev. (°)
Minimum (°)
Maximum (°)
1 11 16 2.01 14 19 2 11 15 3.03 10 20 3 11 19 2.56 14 24 4 11 20 3.87 14 25 5 11 19 2.92 12 24 6 11 20 2.65 17 25 7 11 16 0.97 14 17 8 11 20 2.15 17 23 9 11 12 1.39 10 13 10 11 21 2.04 18 24
III.4.4 Discussion and Conclusion
In humans, numerous studies demonstrated that ultrasound images are helpful in quantifying
muscle tissue by measuring muscle depth, muscle fibre pennation angle, muscle fibre length
and echogenicity (Aagard and al 2001; Binzoni et al. 2001; Kawakami et al. 2006; Kubo et al.
2003a; Maganaris et al. 1998; Maurits et al. 2003; Narici et al. 2003; Nielsen et al. 2000;
Strobel et al. 2005). Ultrasound measurements of the human multifidus and abdominal muscle
thickness have been described in the literature (Kiesel et al. 2007) but there was no such
ultrasound study of the equine LD to the author’s knowledge.
In the presented study 800 ultrasound images of LD of ten ponies were obtained by two
examiners to test inter- and intraoperator repeatability of LD muscle thickness and pennation
angle measurements. Image quality was very variable and therefore only 440 images were
selected for further processing. The quality of the images was influenced by different factors.
Due to the standardised imaging modality (standardised gain) the image quality was not
adjusted for individual images. Image quality was also influenced by the resolution of the
ultrasound machine. Muscle fibre architecture of LD and fascicle layers were not always well-
defined in all of the ultrasound images. Nevertheless the distance between subcutaneous tissue
and the rib, functioning as a landmark for the vertebral level and as reference for the ventral
circumference of LD, was visible as hyperechoic line in the selected images. On some images
it was difficult to detect the dorsal circumference of the rib without putting pressure on the
ultrasound transducer. As varying pressure would have altered and falsified muscle thickness
measurements the obtained images showed only indistinct muscle structure and a small rib

137
section in some cases. Fat tissue has been demonstrated to influence the quality of ultrasound
images of skeletal muscles and increase muscle echogenicity in humans (Haberkorn et al.
1993; Lee et al. 2006; Reimers et al. 1993). Additionally, the lack of visual defined muscle
structure has been described previously in humans and was suspected as a diagnostic sign of
muscle atrophy (Kristjansson 2004). As the examined horses were untrained and overweight
they had varying layer of subcutaneous fat as well as intramuscular fat and connective tissue
which might have influenced image quality. The difference between image quality of trained
and untrained LD as well as between different ultrasound machines is demonstrated in Fig.
56. The architecture of muscle fascicles of a trained thoroughbred horse imaged with an
advanced high-tech ultrasound machine is more clearly defined and hence more easily
visualised ultrasonographically compared to untrained ponies imaged with a middle of the
range ultrasound machine.
Fig. 56 Ultrasound image of LD of a trained thoroughbred imaged by a high quality ultrasound mashine (right) in comparison with an ultrasound image of LD of an untrained pony imaged by a ultrasound mashine of less quality
Analysed muscle parameters showed that muscle thickness and pennation angle were not
significant different between right and left LD which would be expected in horses without any
back pathology and/or lameness. But muscle thickness and pennation angle measurements
were significant different between horses. The significant difference between horses can be
related to multiple factors such as training condition of the horse, age, different height and

138
weight. Although the influence of weight, age and training condition was described in the
literature in humans (Seynnes et al., 2007; Sipila and Suominen, 1996) there was no
correlation between age, weight and heights of the horses and muscle thickness or pennation
angle.
LD muscle thickness imaged by two different examiners was proven to be a repeatable
parameter. The results correspond to human ultrasound studies where intra- and interobserver
reliability was tested for different skeletal muscles. Results demonstrated a high repeatability
for intra-observer and inter-observer measurements (Hides et al. 2007; Wallwork et al. 2007)
although one study found a lack of agreement between experienced and novice observers. In
conclusion it was suggested that inexperienced observers perform ultrasound training before
using ultrasound measurements to quantify muscle tissue (Hides et al. 2007). In the present
study limits of agreement were found to range from -0.3 cm to 0.5 cm (Bland and Altman
2007). These upper and lower limits seem to be satisfying in regards to a study of the cross-
section area of the equine multifidus where the lower and upper limit of agreement ranged
from -1.35 cm2 to 1.54 cm2 and were found to be acceptable (Tabor and McGowan 2002).
The average repeatability coefficient for both examiners was 0.4 cm which seems to be
acceptable in comparison with the mean± stdev muscle thickness value. However, ultrasound
studies of human muscle parameters showed a 10-31% increase of muscle thickness after
training or 2-6% decrease after 20 days of bed rest depending on the measured muscle group
(Abe et al 1997, Abe et al 2000) as there are no comparable studies available in the equine LD
or equine musculature it is difficult to predict the amount of muscle thickness changes of LD
due to disuse or training. With regards to the reported percentages of human muscle changes
following disuse and training the repeatability coefficient of 0.4 cm in the present study
suggests that only muscle changes larger then >13% would give reliable evidence of LD
changes.
In contrast to LD muscle thickness LD pennation angle showed low repeatability in this study.
The width of 95% limits of agreement (14°) is not acceptable for using this parameter as a
measurement to document muscle atrophy or monitor training or treatment effects.
Repeatability of measuring pennation angle was affected by the ability of the operator to
identify muscle fibres but also influenced by the fact that pennation angle changes with
muscle contraction.
In conclusion, ultrasonography is a non-invasive, safe and relatively cheap technique to
visualise skeletal muscle. In this study ultrasonography was proven to be a repeatable

139
technique to evaluate muscle thickness in the equine LD. To be able to evaluate relatively
small muscle thickness changes and pennation angle of the equine LD ultrasonography needs
to be reassessed in comparison with other techniques for example dissection and/ or computed
tomography.
IV. Discussion and Conclusion
The equine back is part of the axis of the equine body and provides the connection between
fore- and hindlimbs. Back pain has been frequently reported to effect the horse but misleading
clinical signs and unspecific symptoms make its diagnosis and treatment a challange. The
aetioapathogenesis of back pain is poorly understood and the role of the paraspinal muscles,
influencing and causing back pain, is unclear.
This thesis aimed at enhancing the understanding of the functional capacity of the
thoracolumbar LD by examining the muscle architecture of LD and its muscle activity at
different levels along this muscle. This knowledge provides a basis for further research into
horses with back problems. Additionally, ultrasonography was evaluated by imaging LD
muscle structure and measuring muscle parameters such as muscle thickness in order to install
this diagnostic technique as valuable method to examine LD for pathological changes and
quantify the muscle.
Muscle architectural parameters were shown to be useful in estimating the functional capacity
of muscles. Muscle fascicle length, pennation angle and physiological cross-section area
characterise muscle structure and determine muscle function. From these architectural
parameters the preference of the muscle for either generating force or high velocity
contraction over a wide range of excursion can be predicted (Wickiewicz et al. 1983). In
chapter III.1 architectural measurements of the equine LD revealed the complex structure of
this muscle. Muscle parameters show longer muscle fascicles and smaller pennation angle in
the cranial part of LD demonstrating that the muscle can perform contractions at higher
contraction velocity and over a wider range of excursion. These findings are supported by
kinematic experiments which show a higher range of motion at the cranial thoracic vertebral
column (Gomez Alvarez 2007). In contrast, architectural parameters of the caudal LD show
shorter muscle fascicle length and larger pennation angle. Additionally an internal fascia
divides LD in a lateral and a medial part increasing the attachment for muscle fibres and
hence the physiological cross-section area of the muscle. The muscle structure of the caudal
LD suggests a large capacity to generate force. Again, kinematic measurements of the caudal
140
equine back support this finding. Except for the lumbosacral junction decreased range of
motion was observed for the lumbar vertebral column and implicates strong muscle
contraction to restrict back flexion and stabilise the spine. This suggests that LD muscle
function in the lumbar area supports the lumbar vertebral spine against dynamic forces of the
abdominal contents especially as there is no support of ribs and rib cage. Furthermore the
strong lumbar LD provides a base for the attaching cranial part of the middle gluteal muscle
and transmits propulsive forces developed by the hindlimb and the hindlimb muscles to the
vertebral column.
Measurements of muscle activity of LD (Chapter III.2) supported the functional complexity of
the muscle structure. In Chapter III.2 EMG measurements of LD were recorded in the second
half of the stance phase of each hindlimb during flexion of the back. Higher intensity of
muscle activity was measured at T14 and L2. This finding might be related to the larger range
of motion in the cranial thoracic spine and the higher force generation of the lumbar LD.
Potential cross-talk of adjacent muscle may have influenced the intensity of LD activity at
these segments. In spite of the high muscle intensity at T14 and L2 the muscle activity pattern
showed differences between these two segments. A higher percentage of only single or two
EMG bursts was demonstrated for T14 and T16 while a higher percentage of two to four
EMG bursts were measured mainly at L2. The pattern of two EMG bursts is associated to the
second half of the stance phase of each hindlimb. Therefore the lumbar muscle segment
showed a higher muscle activity and contracted not only during the ipsilateral but also during
the collateral stance phase of the hindlimbs. The effect of gait and incline was demonstrated
by the significantly increased intensity of muscle activity on incline of 10% as well as
increased intensity of muscle activity between walk and trot. The number of recorded EMG
bursts was higher in walk on incline compared to level walk. Increased LD activity on incline
has been reported previously for the cat and horses (Robert et al. 2001b; Wada et al. 2006a).
The study in cats walking up an incline suggested that LD actively contributes not only to
restrict dorsal flexion but also limit lateral bending which was higher during walk on incline
by active muscle contraction (Wada et al. 2006a). Although horses have a stiffer vertebral
column compared to cats, the propulsive and vertical forces of the hindlimb increase on
incline (Dutto et al. 2004; Parsons et al. 2008). This requires increased stiffness of the
vertebral column to transmit the propulsion up the incline against gravity onto the whole body
without losing propulsive forces by lateral bending of the body axis.
The difference of LD activity between gaits is related to increased muscle activity and
therefore force generation of LD which increases the stiffness of the vertebral column and

141
spinal stability. Kinematic studies have shown that back motion is significantly decreased in
trot compared to walk which depends on higher muscle forces and therefore increased spinal
stiffness.
The results of the presented study can provide a base for further research and thorough
examination of horses with back pain. In humans back problems were related to unexpected
loads or spinal instability which can lead to inflammation, local pain and altered motion
which activate mechanoreceptors in ligaments and joint capsules, muscle spindles in the
paraspinal musculature and skin receptors (Denegar et al. 2006). The afferent signals are
processed in the CNS which responds through the activation of appropriate muscles to avoid
pain and damage to musculoskeletal structures (Denegar et al. 2006). The origin of primary
back pain in horses was also reported to be due to mechanical, chemical or other damaging
factors affecting nociceptive receptors of soft tissue, vertebral bone or articulations of the
equine back (Jeffcott and Haussler 2004).
In human patients with low back pain altered EMG activity of the back muscles was detected
during trunk motion and gait (van Dieën, 2003). Increased EMG activity was recorded during
the swing phase where the lumbar muscles are normally silent. Another study of patients with
chronic back pain showed decreased EMG activity during trunk motion suggesting avoidance
behaviour and disuse (Thomas, 2008). Experimentally induced back pain and slight lameness
in horses were shown to effect back kinematics significantly (Gomez Alvarez 2007).
Increased extension and compensatory lateral movement in horses with unilateral back pain
suggest an increase in back muscle activity. Increased flexion and extension and a lateral
bending away from the lame forelimb was detected in horses with induced forelimb lameness.
Also horses with increased hindlimb lameness showed a slight increase of back motion but a
decreased range of motion of the lumbosacral segment and the pelvis (Gomez Alvarez 2007).
Consequently LD muscle activation would be expected to change with back pain and
lameness. Increased LD activity may support increased lateral bending and extension to avoid
unexpected painful movements. Based on the presented EMG measurements the influence of
back pain on the activity of muscle segments along the equine LD could be examined.
Changes of LD structure due to back problems, training or treatment are more difficult to
document in live horses as architectural measurements of the equine LD can obviously be not
accomplished by dissections in live horses. In chapter III.3 and III.4 of the present thesis
ultrasound was evaluated as a method to visualise and measure LD and its architectural
parameters in live horses. For the examination of the paraspinal soft tissue structures
ultrasonography seems to be the method of choice as it is non-invasive, low-cost intensive and
142
practicable to use. The gross LD structure documented in longitudinal and transverse
ultrasound images corresponded to the frozen muscle slices of the same muscle section.
Therefore ultrasound allows visualisation of the overall muscle structure, subcutaneous fat
amount and the relationship between LD and adjacent muscles such as spinalis, ilicostal and
the cranial part of the middle gluteal muscle. The proportion of fat and connective tissue is
visible as hyperechoic marbling (Wood et al. 1999). In future it would be interesting to show
the ratio of intramuscular fat and connective tissue to LD muscle tissue in horses with back
problems since studies in humans have demonstrated an increase of intramuscular fat with
disuse. Other muscle parameters measured on ultrasound images such as muscle thickness,
pennation angle and muscle fibre length were shown to quantify musculature in humans.
Chapter III.4 showed the repeatability of LD muscle thickness measurements in the horse.
Muscle thickness is closely associated with muscle volume (Miyatani et al. 2004) and
therefore could be a helpful parameter to document equine back muscle dysfunction leading,
for example, to muscle atrophy or hypertrophy. In humans, quantifying muscle tissue by
ultrasound has been already used to show changes of musculature due to disuse and back or
neck pain as well as muscle changes following training (Abe et al. 1997; Hides et al. 2008;
Kawakami et al. 1995; Suetta et al. 2008). Therefore measurements of LD muscle thickness
could be helpful to monitor back treatment and training effects by ultrasound in horses. In
present study muscle thickness measurements were found to be repeatable but pennation
angle measurements on ultrasound images were not. The reason for this might be due to the
quality of ultrasound images where in some cases muscle fascicle insertion and orientation
were difficult to follow and the variability of pennation angle with contraction status of the
muscle. Ultrasound image quality between different horses was influenced by the
standardised imaging set up (standardised depth and gain) which could not be adjusted to the
different physical conditions of the individual horse. Additionally subcutaneous fat thickness
of the untrained horses might have influenced the image quality as increased thickness of fat
layers were shown to effect image brightness and sharpness in humans (Haberkorn et al.
1993) However, ultrasound was shown to be a useful and practical technique to examine back
muscle structure but further studies are necessary to document the influence of age and gender
as well as to document the effect of back problems on changes of LD muscle parameters.
In conclusion the presented thesis provides anatomical as well as functional information about
the equine LD and also includes data about the use of ultrasound in the assessement of the LD
in live horses. This will aid in determining the role of LD disorders in the development of

143
back problems in the horse, the pathogenesis of which is is not well understood at the
moment, one of the reasons why the diagnosis and treatment of back problems presents the
equine practitioner with a huge challenge.

144
V. References
Aagard, P et al., (2001) A mechanism for increased contractile strength of human pennate muscle in response to strength training: changes in muscle architecture. The Journal of Physiology, 613-623.
Abe, T., Brechue, W.F., Fujita, S. and Brown, J.B. (1998) Gender differences in FFM
accumulation and architectural characteristics of muscle. Med Sci Sports Exerc 30, 1066-1070.
Abe, T., DeHoyos, D.V., Pollock, M.L. and Garzarella, L. (2000a) Time course for strength
and muscle thickness changes following upper and lower body resistance training in men and women. Eur J Appl Physiol 81, 174-180.
Abe, T., Kawakami, Y., Suzuki, Y., Gunji, A. and Fukunaga, T. (1997) Effects of 20 days bed
rest on muscle morphology. J Gravit Physiol 4, S10-14. Abe, T., Kumagai, K. and Brechue, W.F. (2000b) Fascicle length of leg muscles is greater in
sprinters than distance runners. Med Sci Sports Exerc 32, 1125-1129. Alexander, M.J. (1985) Biomechanical aspects of lumbar spine injuries in athletes: a review.
Can J Appl Sport Sci 10, 1-20. Alexander, R. (2003) Principles of animal locomotion, Princeton University, Princeton, New
Jersey. Alexander, R., Dimery, N. and Ker, R. (1985) Elastic structures in the back and their role in
galloping in some mammals. Journal of Zoology, 467-482. Alexander, R. and Vernon, A. (1975) The dimensions of knee and ankle muscles and the
forces they exert. Journal of Human Movement Studies 1, 115-123. Alexander, R.M. (1991) Energy-saving mechanisms in walking and running. J Exp Biol 160,
55-69. Audigie, F., Pourcelot, P., Degueurce, C., Denoix, J.M. and Geiger, D. (1999) Kinematics of
the equine back: flexion-extension movements in sound trotting horses. Equine Vet J Suppl 30, 210-213.
Back, W. and Clayton, H. (2001) Equine Locomotion, Saunders. Baumgartner, R.N., Koehler, K.M., Gallagher, D., Romero, L., Heymsfield, S.B., Ross, R.R.,
Garry, P.J. and Lindeman, R.D. (1998) Epidemiology of sarcopenia among the elderly in New Mexico. Am J Epidemiol 147, 755-763.
Biewener, A.A. (2003) Animal Locomotion, Oxford University Press Inc., New York. Biewener, A.A. and Roberts, T.J. (2000) Muscle and tendon contributions to force, work, and
elastic energy savings: a comparative perspective. Exerc Sport Sci Rev 28, 99-107.

145
Binzoni, T., Bianchi, S., Hanquinet, S., Kaelin, A., Sayegh, Y., Dumont, M. and Jequier, S.
(2001) Human gastrocnemius medialis pennation angle as a function of age: from newborn to the elderly. J Physiol Anthropol Appl Human Sci 20, 293-298.
Bland, J.M. and Altman, D.G. (1986) Statistical methods for assessing agreement between
two methods of clinical measurement. Lancet 1, 307-310. Bland, J.M. and Altman, D.G. (2007) Agreement between methods of measurement with
multiple observations per individual. J Biopharm Stat 17, 571-582. Blazevich, A.J., Gill, N.D. and Zhou, S. (2006) Intra- and intermuscular variation in human
quadriceps femoris architecture assessed in vivo. J Anat 209, 289-310. Bleakney, R. and Maffulli, N. (2002) Ultrasound changes to intramuscular architecture of the
quadriceps following intramedullary nailing. J Sports Med Phys Fitness 42, 120-125. Bogduk, N. (1980) A reappraisal of the anatomy of the human lumbar erector spinae. J Anat
131, 525-540. Bojadsen, T.W., Silva, E.S., Rodrigues, A.J. and Amadio, A.C. (2000) Comparative study of
Mm. Multifidi in lumbar and thoracic spine. J Electromyogr Kinesiol 10, 143-149. Boszczyk, B.M., Boszczyk, A.A. and Putz, R. (2001) Comparative and functional anatomy of
the mammalian lumbar spine. Anat Rec 264, 157-168. Brancaccio, P., Limongelli, F.M., D'Aponte, A., Narici, M. and Maffulli, N. (2007) Changes
in skeletal muscle architecture following a cycloergometer test to exhaustion in athletes. J Sci Med Sport.
British Standards Institution (1975) Precision of test methods 1: Guide for the determination
and reproducibility for a standard test method (BS 597, Part 1, London, BSI.
Brown, N.A., Kawcak, C.E., McIlwraith, C.W. and Pandy, M.G. (2003a) Architectural properties of distal forelimb muscles in horses, Equus caballus. J Morphol 258, 106-114.
Brown, N.A., Pandy, M.G., Kawcak, C.E. and McIlwraith, C.W. (2003b) Force- and moment-
generating capacities of muscles in the distal forelimb of the horse. J Anat 203, 101-113.
Caldwell, J.S., McNair, P.J. and Williams, M. (2003) The effects of repetitive motion on
lumbar flexion and erector spinae muscle activity in rowers. Clin Biomech (Bristol, Avon) 18, 704-711.
Carlson, H. (1978) Morphology and contraction properties of cat lumbar back muscles. Acta
Physiol Scand 103, 180-197. Cassiat, G., Pourcelot, P., Tavernier, L., Geiger, D., Denoix, J.M. and Degueurce, D. (2004)
Influence of individual competition level on back kinematics of horses jumping a vertical fence. Equine Vet J 36, 748-753.

146
Chiou, W.K., Wong, M.K. and Lee, Y.H. (1994) Epidemiology of low back pain in Chinese
nurses. Int J Nurs Stud 31, 361-368. Chow, R.S., Medri, M.K., Martin, D.C., Leekam, R.N., Agur, A.M. and McKee, N.H. (2000)
Sonographic studies of human soleus and gastrocnemius muscle architecture: gender variability. Eur J Appl Physiol 82, 236-244.
Clayton, H. (1999) The Mysteries of the Back. Dressage Today, 28. Danneels, L.A., Vanderstraeten, G.G., Cambier, D.C., Witvrouw, E.E. and De Cuyper, H.J.
(2000) CT imaging of trunk muscles in chronic low back pain patients and healthy control subjects. Eur Spine J 9, 266-272.
Demoulin, C., Crielaard, J.M. and Vanderthommen, M. (2007a) Spinal muscle evaluation in
healthy individuals and low-back-pain patients: a literature review. Joint Bone Spine 74, 9-13.
Demoulin, C., Distree, V., Tomasella, M., Crielaard, J.M. and Vanderthommen, M. (2007b)
Lumbar functional instability: a critical appraisal of the literature. Ann Readapt Med Phys 50, 677-684, 669-676.
Denegar, C., Saliba, E. and Saliba, S. (2006) Therapeutic Modalities for Musculoskeletal
Injuries, 2nd Edition edn. p 312. Denoix, J. (1999a) Lesions of the vertebral column in poor performance horses. In:
Proceedings of the World Equine Veterinary Association symposium, Paris, France. Denoix, J.M. (1999b) Spinal biomechanics and functional anatomy. Vet Clin North Am
Equine Pract 15, 27-60. Denoix, J.M. (1999c) Ultrasonographic evaluation of back lesions. Vet Clin North Am Equine
Pract 15, 131-159. Denoix, J.M. (2006) Ultrasonographic examination: Back. In: Back and Beyond, Orhtopaedic
Poor Performance: Hindlimbs and Back, Newmarket. pp 23-30. Denoix, J.M. and Pailloux, J. (2001) Physical therapy and massage for the horse, Manson
Publishing Ltd., London. Drake, J.D. and Callaghan, J.P. (2006) Elimination of electrocardiogram contamination from
electromyogram signals: An evaluation of currently used removal techniques. J Electromyogr Kinesiol 16, 175-187.
Drevemo, S., Dalin, G., Fredricson, I. and Hjerten, G. (1980) Equine locomotion; 1. The
analysis of linear and temporal stride characteristics of trotting standardbreds. Equine Vet J 12, 60-65.
Dumas, G.A., Poulin, M.J., Roy, B., Gagnon, M. and Jovanovic, M. (1991) Orientation and
moment arms of some trunk muscles. Spine 16, 293-303.

147
Dupont, A.C., Sauerbrei, E.E., Fenton, P.V., Shragge, P.C., Loeb, G.E. and Richmond, F.J. (2001) Real-time sonography to estimate muscle thickness: comparison with MRI and CT. J Clin Ultrasound 29, 230-236.
Dutto, D.J., Hoyt, D.F., Cogger, E.A. and Wickler, S.J. (2004) Ground reaction forces in
horses trotting up an incline and on the level over a range of speeds. J Exp Biol 207, 3507-3514.
English, A. (1980) The functions of the lumbar spine during stepping in the cat. Journal of
Morphology, 55-66. Erichsen, C., Eksell, P., Holm, K.R., Lord, P. and Johnston, C. (2004) Relationship between
scintigraphic and radiographic evaluations of spinous processes in the thoracolumbar spine in riding horses without clinical signs of back problems. Equine Vet J 36, 458-465.
Ettema, G.J. and Huijing, P.A. (1989) Properties of the tendinous structures and series elastic
component of EDL muscle-tendon complex of the rat. J Biomech 22, 1209-1215. Faber, M., Johnston, C., Schamhardt, H., van Weeren, R., Roepstorff, L. and Barneveld, A.
(2001a) Basic three-dimensional kinematics of the vertebral column of horses trotting on a treadmill. Am J Vet Res 62, 757-764.
Faber, M., Johnston, C., Schamhardt, H.C., van Weeren, P.R., Roepstorff, L. and Barneveld,
A. (2001b) Three-dimensional kinematics of the equine spine during canter. Equine Vet J Suppl, 145-149.
Faber, M., Johnston, C., van Weeren, P.R. and Barneveld, A. (2002) Repeatability of back
kinematics in horses during treadmill locomotion. Equine Vet J 34, 235-241. Faber, M., Schamhardt, H., van Weeren, R., Johnston, C., Roepstorff, L. and Barneveld, A.
(2000) Basic three-dimensional kinematics of the vertebral column of horses walking on a treadmill. Am J Vet Res 61, 399-406.
Felder, A., Ward, S.R. and Lieber, R.L. (2005) Sarcomere length measurement permits high
resolution normalization of muscle fiber length in architectural studies. J Exp Biol 208, 3275-3279.
Ferrari, M., Weller, R., Pfau, T., Payne, R.C. and Wilson, A.M. (2006) A comparison of
three-dimensional ultrasound, two-dimensional ultrasound and dissections for determination of lesion volume in tendons. Ultrasound Med Biol 32, 797-804.
Fuglsang-Frederiksen, A., Scheel, U. and Buchthal, F. (1976) Diagnostic yield of analysis of
the pattern of electrical activity and of individual motor unit potentials in myopathy. J Neurol Neurosurg Psychiatry 39, 742-750.
Fukunaga, T., Kawakami, Y., Kuno, S., Funato, K. and Fukashiro, S. (1997) Muscle
architecture and function in humans. J Biomech 30, 457-463. Gambaryan, P. (1974) How Mammals Run: Anatomical Adaptation, Wiley, New York.

148
Gans, C. (1982) Fiber architecture and muscle function. Exerc Sci Sport Sci Revs 10, 160-207. Gans, C. and Bock, W.J. (1965) The functional significance of muscle architecture--a
theoretical analysis. Ergeb Anat Entwicklungsgesch 38, 115-142. Gills, C. (1999) Spinal ligament pathology. Vet Clin North Am Equine Pract 15, 97-102. Gomez Alvarez, C.B. (2007) The biomechanical interaction between vertebral column and
limbs in the horse: A kinematical study, University of Utrecht, Utrecht. Gordon, A.M., Huxley, A.F. and Julian, F.J. (1966) Tension development in highly stretched
vertebrate muscle fibres. J Physiol 184, 143-169. Haberkorn, U., Layer, G., Rudat, V., Zuna, I., Lorenz, A. and van Kaick, G. (1993)
Ultrasound image properties influenced by abdominal wall thickness and composition. J Clin Ultrasound 21, 423-429.
Haussler, K.K. (1999) Anatomy of the thoracolumbar vertebral region. Vet Clin North Am
Equine Pract 15, 13-26, v. Haussler, K.K., Bertram, J.E., Gellman, K. and Hermanson, J.W. (2001) Segmental in vivo
vertebral kinematics at the walk, trot and canter: a preliminary study. Equine Vet J Suppl, 160-164.
Henson, F. (2005) How to: Use diagnostic imaging to work up the back case. In: BEVA
Congress, Harrogate. p 139. Herzog, W. (2000) Skeletal Muscle Mechanisms, John Wiley & Sons, New York. Hides, J., Gilmore, C., Stanton, W. and Bohlscheid, E. (2008) Multifidus size and symmetry
among chronic LBP and healthy asymptomatic subjects. Man Ther 13, 43-49. Hides, J.A., Miokovic, T., Belavy, D.L., Stanton, W.R. and Richardson, C.A. (2007)
Ultrasound imaging assessment of abdominal muscle function during drawing-in of the abdominal wall: an intrarater reliability study. J Orthop Sports Phys Ther 37, 480-486.
Hides, J.A., Richardson, C.A. and Jull, G.A. (1995) Magnetic resonance imaging and
ultrasonography of the lumbar multifidus muscle. Comparison of two different modalities. Spine 20, 54-58.
Hides, J.A., Stokes, M.J., Saide, M., Jull, G.A. and Cooper, D.H. (1994) Evidence of lumbar
multifidus muscle wasting ipsilateral to symptoms in patients with acute/subacute low back pain. Spine 19, 165-172.
Hildebrand, M. (1959) Motions of the running cheetah and horse. Journal of Mammalogy 40,
481-495. Hildebrand, M. (1974) Analysis of vertebrate structure, John Wiley and Sons, New York.

149
Holm, K.R., Wennerstrand, J., Lagerquist, U., Eksell, R. and Johnston, C. (2006) Effect of local analgesia on movement of the equine back. Equine Vet J 38, 65-69.
Hunter, G. (2000) Muscle physiology, In: NSCA´s essentials of strength training and
conditioning, 2nd edition edn., TB Baechle and RW Earle. Huxley, A.F. (1957) Muscle structure and theories of contraction. Prog Biophys Biophys
Chem 7, 255-318. Jeffcott, L.B. (1979) The Fourth Sir Frederick Hobday Memorial Lecture. Back problems in
the horse--a look at past, present and future progress. Equine Vet J 11, 129-136. Jeffcott, L.B. (1980) Disorders of the thoracolumbar spine of the horse--a survey of 443 cases.
Equine Vet J 12, 197-210. Jeffcott, L.B. and Dalin, G. (1980) Natural rigidity of the horse's backbone. Equine Vet J 12,
101-108. Jeffcott, L.B., Dalin, G., Drevemo, S., Fredricson, I., Bjorne, K. and Bergquist, A. (1982)
Effect of induced back pain on gait and performance of trotting horses. Equine Vet J 14, 129-133.
Jeffcott, L.B., Dalin, G., Ekman, S. and Olsson, S.E. (1985) Sacroiliac lesions as a cause of
chronic poor performance in competitive horses. Equine Vet J 17, 111-118. Jeffcott, L.B. and Haussler, K.K. (2004) Back and pelvis; In: Equine Sports Medicine and
Surgery, Saunders. Johnston, C., Holm, K.R., Erichsen, C., Eksell, P. and Drevemo, S. (2004) Kinematic
evaluation of the back in fully functioning riding horses. Equine Vet J 36, 495-498. Johnston, C., Holmt, K., Faber, M., Erichsen, C., Eksell, P. and Drevemo, S. (2002) Effect of
conformational aspects on the movement of the equine back. Equine Vet J Suppl, 314-318.
Kamaz, M., Kiresi, D., Oguz, H., Emlik, D. and Levendoglu, F. (2007) CT measurement of
trunk muscle areas in patients with chronic low back pain. Diagn Interv Radiol 13, 144-148.
Kandel, E., Schwartz, J. and Jessell, T. (2000) Principles of neural science, McGraw-Hill
Professional. p 1568. Kanehisa, H., Muraoka, Y., Kawakami, Y. and Fukunaga, T. (2003) Fascicle arrangements of
vastus lateralis and gastrocnemius muscles in highly trained soccer players and swimmers of both genders. Int J Sports Med 24, 90-95.
Kawakami, Y., Abe, T. and Fukunaga, T. (1993) Muscle-fiber pennation angles are greater in
hypertrophied than in normal muscles. J Appl Physiol 74, 2740-2744. Kawakami, Y., Abe, T., Kanehisa, H. and Fukunaga, T. (2006) Human skeletal muscle size
and architecture: variability and interdependence. Am J Hum Biol 18, 845-848.

150
Kawakami, Y., Abe, T., Kuno, S.Y. and Fukunaga, T. (1995) Training-induced changes in
muscle architecture and specific tension. Eur J Appl Physiol Occup Physiol 72, 37-43. Kawakami, Y., Muraoka, Y., Kubo, K., Suzuki, Y. and Fukunaga, T. (2000) Changes in
muscle size and architecture following 20 days of bed rest. J Gravit Physiol 7, 53-59. Kearns, C.F., Abe, T. and Brechue, W.F. (2000) Muscle enlargement in sumo wrestlers
includes increased muscle fascicle length. Eur J Appl Physiol 83, 289-296. Kearns, C.F., Isokawa, M. and Abe, T. (2001) Architectural characteristics of dominant leg
muscles in junior soccer players. Eur J Appl Physiol 85, 240-243. Khoury, V., Cardinal, E. and Brassard, P. (2008) Atrophy and fatty infiltration of the
supraspinatus muscle: sonography versus MRI. AJR Am J Roentgenol 190, 1105-1111. Kiesel, K.B., Underwood, F.B., Mattacola, C.G., Nitz, A.J. and Malone, T.R. (2007) A
comparison of select trunk muscle thickness change between subjects with low back pain classified in the treatment-based classification system and asymptomatic controls. J Orthop Sports Phys Ther 37, 596-607.
Kimura, J. (2001) Electrodiagnosis in Diseases of Nerve and Muscle: Principles and
Practice, Oxford University Press. p 1024. Kitamura, K., Tokunaga, M., Iwane, A.H. and Yanagida, T. (1999) A single myosin head
moves along an actin filament with regular steps of 5.3 nanometres. Nature 397, 129-134.
Klimstra, M., Dowling, J., Durkin, J.L. and MacDonald, M. (2007) The effect of ultrasound
probe orientation on muscle architecture measurement. J Electromyogr Kinesiol 17, 504-514.
Koob, T. and Long, J. (2000) The Vertebrate Body Axis: Evolution and Mechanical Function.
American Zoologist 40, 1-18. Kristjansson, E. (2004) Reliability of ultrasonography for the cervical multifidus muscle in
asymptomatic and symptomatic subjects. Man Ther 9, 83-88. Kubo, K., Kanehisa, H., Azuma, K., Ishizu, M., Kuno, S.Y., Okada, M. and Fukunaga, T.
(2003a) Muscle architectural characteristics in women aged 20-79 years. Med Sci Sports Exerc 35, 39-44.
Kubo, K., Kanehisa, H., Azuma, K., Ishizu, M., Kuno, S.Y., Okada, M. and Fukunaga, T.
(2003b) Muscle architectural characteristics in young and elderly men and women. Int J Sports Med 24, 125-130.
Kumagai, K., Abe, T., Brechue, W.F., Ryushi, T., Takano, S. and Mizuno, M. (2000) Sprint
performance is related to muscle fascicle length in male 100-m sprinters. J Appl Physiol 88, 811-816.

151
Labeit, S. and Kolmerer, B. (1995) Titins: giant proteins in charge of muscle ultrastructure and elasticity. Science 270, 293-296.
Lee, J.P., Tseng, W.Y., Shau, Y.W., Wang, C.L., Wang, H.K. and Wang, S.F. (2007)
Measurement of segmental cervical multifidus contraction by ultrasonography in asymptomatic adults. Man Ther 12, 286-294.
Lee, S.W., Chan, C.K., Lam, T.S., Lam, C., Lau, N.C., Lau, R.W. and Chan, S.T. (2006)
Relationship between low back pain and lumbar multifidus size at different postures. Spine 31, 2258-2262.
Licka, T., Frey, A. and Peham, C. (2009) Electromyographic activity of the longissimus dorsi
muscles in horses when walking on a treadmill. Vet J 180 (1), 71-76. Licka, T. and Peham, C. (1998) An objective method for evaluating the flexibility of the back
of standing horses. Equine Vet J 30, 412-415. Licka, T., Peham, C. and Zohmann, E. (2001a) Range of back movement at trot in horses
without back pain. Equine Vet J Suppl, 150-153. Licka, T.F., Peham, C. and Frey, A. (2004) Electromyographic activity of the longissimus
dorsi muscles in horses during trotting on a treadmill. Am J Vet Res 65, 155-158. Licka, T.F., Peham, C. and Zohmann, E. (2001b) Treadmill study of the range of back
movement at the walk in horses without back pain. Am J Vet Res 62, 1173-1179. Lieber, R.L. (2002) Skeletal Muscle Structure, Function and Plasticity, Lippincott Williams
& Wilkins. p 369. Lieber, R.L. and Blevins, F.T. (1989) Skeletal muscle architecture of the rabbit hindlimb:
functional implications of muscle design. J Morphol 199, 93-101. Lu, W.W., Hu, Y., Luk, K.D., Cheung, K.M. and Leong, J.C. (2002) Paraspinal muscle
activities of patients with scoliosis after spine fusion: an electromyographic study. Spine 27, 1180-1185.
Lupton, J.I. (1876) Mayhew´s illustrated horse management, Allen, London. Maganaris, C.N. and Baltzopoulos, V. (1999) Predictability of in vivo changes in pennation
angle of human tibialis anterior muscle from rest to maximum isometric dorsiflexion. Eur J Appl Physiol Occup Physiol 79, 294-297.
Maganaris, C.N., Baltzopoulos, V. and Sargeant, A.J. (1998) In vivo measurements of the
triceps surae complex architecture in man: implications for muscle function. J Physiol 512 ( Pt 2), 603-614.
Magid, A. and Law, D.J. (1985) Myofibrils bear most of the resting tension in frog skeletal
muscle. Science 230, 1280-1282.

152
Maurits, N.M., Bollen, A.E., Windhausen, A., De Jager, A.E. and Van Der Hoeven, J.H. (2003) Muscle ultrasound analysis: normal values and differentiation between myopathies and neuropathies. Ultrasound Med Biol 29, 215-225.
McLaughlin, R.M., Jr., Gaughan, E.M., Roush, J.K. and Skaggs, C.L. (1996) Effects of
subject velocity on ground reaction force measurements and stance times in clinically normal horses at the walk and trot. Am J Vet Res 57, 7-11.
Medler, S. (2002) Comparative trends in shortening velocity and force production in skeletal
muscles. Am J Physiol Regul Integr Comp Physiol 283, R368-378. Mendez, J. and Keys, A. (1960) Density and composition of mammalian muscle. Metabolism
9, 184-188. Miyatani, M., Kanehisa, H., Ito, M., Kawakami, Y. and Fukunaga, T. (2004) The accuracy of
volume estimates using ultrasound muscle thickness measurements in different muscle groups. Eur J Appl Physiol 91, 264-272.
Moorhouse, K. (2005) Role of Intrinsic and Reflexive Dynamics in the Control of Spinal
Stability, State University Virginia, Blacksburg, Virginia. Narici, M. (1999) Human skeletal muscle architecture studied in vivo by non-invasive
imaging techniqiue: functional significance and application. Journal of Electromyography and Kinesiology 9, 97-103.
Narici, M.V., Maganaris, C.N., Reeves, N.D. and Capodaglio, P. (2003) Effect of aging on
human muscle architecture. J Appl Physiol 95, 2229-2234. Nickel, R., Schummer, A. and Seiferle E.. (1984) Lehrbuch der Anatomie der Haustiere,
Verlag Paul Parey. Nielsen, P.K., Jensen, B.R., Darvann, T., Jorgensen, K. and Bakke, M. (2000) Quantitative
ultrasound image analysis of the supraspinatus muscle. Clin Biomech (Bristol, Avon) 15 Suppl 1, S13-16.
Nordin, M. and Hirsch-Frankel, V. (2001) Basic Biomechanics of the Musculoskeletal System,
Lippincott Williams & Wilkins. p 467. O´Reilly, J., Summers, A. and Ritter, D. (2000) The Evolution of the Functional Role of
Trunk Muscles During Locomotion in Adult Amphibians. American Zoologist, 123-135.
Otten, E. (1988) Concepts and models of functional architecture in skeletal muscle. Exerc
Sport Sci Rev 16, 89-137. Pabst, D. (2000) To Bend a dolphin: convergence of Force Transmission Designs in
Cetaceans and Scombrid Fishes. American Zoologist 40. Panjabi, M.M. (2003) Clinical Spinal Instabilitz and Low Back Pain.. J Electromyogr Kinesiol
13,371-379.

153
Panjabi, M.M. (1992a) The stabilizing system of the spine. Part I. Function, dysfunction, adaptation, and enhancement. J Spinal Disord 5, 383-389; discussion 397.
Panjabi, M.M. (1992b) The stabilizing system of the spine. Part II. Neutral zone and
instability hypothesis. J Spinal Disord 5, 390-396; discussion 397. Parsons, K.J., Pfau, T. and Wilson, A.M. (2008) High-speed gallop locomotion in the
thoroughbred racehorse. I. The effect of incline on stride parameters. J Exp Biol 211, 935-944.
Payne, R.C., Crompton, R.H., Isler, K., Savage, R., Vereecke, E.E., Gunther, M.M., Thorpe,
S.K. and D'Aout, K. (2006) Morphological analysis of the hindlimb in apes and humans. I. Muscle architecture. J Anat 208, 709-724.
Payne, R.C., Hutchinson, J.R., Robilliard, J.J., Smith, N.C. and Wilson, A.M. (2005)
Functional specialisation of pelvic limb anatomy in horses (Equus caballus). J Anat 206, 557-574.
Payne, R.C., Veenman, P. and Wilson, A.M. (2004) The role of the extrinsic thoracic limb
muscles in equine locomotion. J Anat 205, 479-490. Peham, C., Frey, A., Licka, T. and Scheidl, M. (2001) Evaluation of the EMG activity of the
long back muscle during induced back movements at stance. Equine Vet J Suppl, 165-168.
Peham, C. and Schobesberger, H. (2006) A novel method to estimate the stiffness of the
equine back. J Biomech 39, 2845-2849. Pillen, S., Scholten, R.R., Zwarts, M.J. and Verrips, A. (2003) Quantitative skeletal muscle
ultrasonography in children with suspected neuromuscular disease. Muscle Nerve 27, 699-705.
Pourcelot, P., Audigie, F., Degueurce, C., Denoix, J.M. and Geiger, D. (1998) Kinematics of
the equine back: a method to study the thoracolumbar flexion-extension movements at the trot. Vet Res 29, 519-525.
Prentice, W. and Voight, M. (2001) Techniques in Musculoskeletal Rehabilitation, McGraw-
Hill Professional. p 780. Quiroz-Rothe, E., Novales, M., Aguilera-Tejero, E. and Rivero, J.L. (2002) Polysaccharide
storage myopathy in the M. longissimus lumborum of showjumpers and dressage horses with back pain. Equine Vet J 34, 171-176.
Rankin, G., Stokes, M. and Newham, D.J. (2005) Size and shape of the posterior neck
muscles measured by ultrasound imaging: normal values in males and females of different ages. Man Ther 10, 108-115.
Rankin, G., Stokes, M. and Newham, D.J. (2006) Abdominal muscle size and symmetry in
normal subjects. Muscle Nerve 34, 320-326.

154
Rantanen, N.W. and McKinnon, A.O. (1997) Equine Diagnostic Ultrasonography, Blackwell Publishing.
Rassier, D.E., MacIntosh, B.R. and Herzog, W. (1999) Length dependence of active force
production in skeletal muscle. J Appl Physiol 86, 1445-1457. Reef, V. (1998) Equine Diagnostic Ultrasound, Saunders. Reeves, N.D., Maganaris, C.N. and Narici, M.V. (2004) Ultrasonographic assessment of
human skeletal muscle size. Eur J Appl Physiol 91, 116-118. Reimers, C.D., Harder, T. and Saxe, H. (1998) Age-related muscle atrophy does not affect all
muscles and can partly be compensated by physical activity: an ultrasound study. J Neurol Sci 159, 60-66.
Reimers, C.D., Schlotter, B., Eicke, B.M. and Witt, T.N. (1996) Calf enlargement in
neuromuscular diseases: a quantitative ultrasound study in 350 patients and review of the literature. J Neurol Sci 143, 46-56.
Reimers, K., Reimers, C.D., Wagner, S., Paetzke, I. and Pongratz, D.E. (1993) Skeletal
muscle sonography: a correlative study of echogenicity and morphology. J Ultrasound Med 12, 73-77.
Rewcastle, S. (1983) Fundamental adaptations in hte lacertilian hind limb: A partial analysis
of the sprawling limb posture and gait. Copeia, 476-487. Rhodin, M., Johnston, C., Holm, K.R., Wennerstrand, J. and Drevemo, S. (2005) The
influence of head and neck position on kinematics of the back in riding horses at the walk and trot. Equine Vet J 37, 7-11.
Ritter, D. (1995) Epaxial muscle function during locomotion in a lizard (Varanus salvator)
and the proposal of a key innovation in the vertebrate axial musculoskeletal system. J Exp Biol 198, 2477-2490.
Ritter, D.A., Nassar, P.N., Fife, M. and Carrier, D.R. (2001) Epaxial muscle function in
trotting dogs. J Exp Biol 204, 3053-3064. Robert, C., Audigié, F., Valette, J.P., Pourcelot, P. and Denoix, J.M. (2001a) Effects of
treadmill speed on the mechanics of the back in the trotting saddlehorse. Equine Vet J Suppl, 154-159.
Robert, C., Valette, J.P., Degueurce, C. and Denoix, J.M. (1999) Correlation between surface
electromyography and kinematics of the hindlimb of horses at trot on a treadmill. Cells Tissues Organs 165, 113-122.
Robert, C., Valette, J.P. and Denoix, J.M. (2001b) The effects of treadmill inclination and
speed on the activity of three trunk muscles in the trotting horse. Equine Vet J 33, 466-472.
Robert, C., Valette, J.P., Pourcelot, P., Audigié, F. and Denoix, J.M. (2002) Effects of trotting
speed on muscle activity and kinematics in saddlehorses. Equine Vet J Suppl, 295-301.

155
Rockwell, E., Evans, F. and Pheasant, H. (1938) The comparative morphology of the
vertebral spinal column. Journal of Morphology. Rooney, J. (1982) The Horse Back: Biomechanics of Lameness. Equine Practice 4, 17-27. Ross, M. and Dyson, S. (2002) Diagnosis and Management of Lameness in the horse,
Saunders. Rutherford, O.M. and Jones, D.A. (1992) Measurement of fibre pennation using ultrasound in
the human quadriceps in vivo. Eur J Appl Physiol Occup Physiol 65, 433-437. Sacks, R.D. and Roy, R.R. (1982) Architecture of the hind limb muscles of cats: functional
significance. J Morphol 173, 185-195. Sanada, K., Kearns, C.F., Midorikawa, T. and Abe, T. (2006) Prediction and validation of
total and regional skeletal muscle mass by ultrasound in Japanese adults. Eur J Appl Physiol 96, 24-31.
Schlacher, C., Peham, C., Licka, T. and Schobesberger, H. (2004) Determination of the
stiffness of the equine spine. Equine Vet J 36, 699-702. Scholten, R.R., Pillen, S., Verrips, A. and Zwarts, M.J. (2003) Quantitative ultrasonography
of skeletal muscles in children: normal values. Muscle Nerve 27, 693-698. Seidman, J. and Seidman, C. (2001) The genetic basis for cardiomyopathy: from mutation
identification to mechanistic paradigms. Cell 104, 5557-5567. Seynnes, O.R., de Boer, M. and Narici, M.V. (2007) Early skeletal muscle hypertrophy and
architectural changes in response to high-intensity resistance training. J Appl Physiol 102, 368-373.
Sharir, A., Milgram, J. and Shahar, R. (2006) Structural and functional anatomy of the neck
musculature of the dog (Canis familiaris). J Anat 208, 331-351. Sipila, S. and Suominen, H. (1991) Ultrasound imaging of the quadriceps muscle in elderly
athletes and untrained men. Muscle Nerve 14, 527-533. Smith, N.C., Wilson, A.M., Jespers, K.J. and Payne, R.C. (2006) Muscle architecture and
functional anatomy of the pelvic limb of the ostrich (Struthio camelus). J Anat 209, 765-779.
Sofka, C.M., Haddad, Z.K. and Adler, R.S. (2004) Detection of muscle atrophy on routine
sonography of the shoulder. J Ultrasound Med 23, 1031-1034. Stokes, M., Rankin, G. and Newham, D.J. (2005) Ultrasound imaging of lumbar multifidus
muscle: normal reference ranges for measurements and practical guidance on the technique. Man Ther 10, 116-126.

156
Strobel, K., Hodler, J., Meyer, D.C., Pfirrmann, C.W., Pirkl, C. and Zanetti, M. (2005) Fatty atrophy of supraspinatus and infraspinatus muscles: accuracy of US. Radiology 237, 584-589.
Stubbs, N.C., Hodges, P.W., Jeffcott, L.B., Cowin, G., Hodgson, D.R. and McGowan, C.M.
(2006) Functional anatomy of the caudal thoracolumbar and lumbosacral spine in the horse. Equine Vet J Suppl, 393-399.
Suetta, C., Andersen, J.L., Dalgas, U., Berget, J., Koskinen, S., Aagaard, P., Magnusson, S.P.
and Kjaer, M. (2008) Resistance training induces qualitative changes in muscle morphology, muscle architecture, and muscle function in elderly postoperative patients. J Appl Physiol 105, 180-186.
Tabor, G. and McGowan, C.M. (2002) Measurement of equine epaxial muscles using
ultrasound imaging. In: EAVDI Annual Conference, Murcia, Spain. Thomas JS, France CR, Sha D, Wiele NV. (2008) The influence of pain-related fear on peak
muscle activity and force generation during maximal isometric trunk exertions. Spine (Phila Pa 1976) 33(11):E342-8.
Thorstensson, A., Carlson, H., Zomlefer, M.R. and Nilsson, J. (1982) Lumbar back muscle
activity in relation to trunk movements during locomotion in man. Acta Physiol Scand 116, 13-20.
Tokuriki, M. (1973a) Electromyographic and joint-mechanical studies in quadrupedal
locomotion. I. Walk. Nippon Juigaku Zasshi 35, 433-436. Tokuriki, M. (1973b) Electromyographic and joint-mechanical studies in quadrupedal
locomotion. II. Trot. Nippon Juigaku Zasshi 35, 525-533. Tokuriki, M. (1974) Electromyographic and joint-mechanical studies in quadrupedal
locomotion. 3. Gallop (author's transl). Nippon Juigaku Zasshi 36, 121-132. Tokuriki, M. and Aoki, O. (1995) Electromyographic activity of the hindlimb muscles during
the walk, trot and canter. Equine Vet J 18, 152-155. Tokuriki, M., Aoki, O., Niki, Y., Kurakawa, Y., Hataya, M. and Kita, T. (1989)
Electromyographic activity of cubital joint muscles in horses during locomotion. Am J Vet Res 50, 950-957.
Tokuriki, M., Ohtsuki, R., Kai, M., Hiraga, A., Oki, H., Miyahara, Y. and Aoki, O. (1999)
EMG activity of the muscles of the neck and forelimbs during different forms of locomotion. Equine Vet J Suppl 30, 231-234.
Tokuriki, M., Otsuki, R. and Kai, M. (1997) Electromyographic activity of trunk muscles
during locomotion on a treadmill. In: 5th WEVA Congress, J Equine Vet Sci, Padova. p 488.
Townsend, H.G. and Leach, D.H. (1984) Relationship between intervertebral joint
morphology and mobility in the equine thoracolumbar spine. Equine Vet J 16, 461-465.

157
Townsend, H.G., Leach, D.H., Doige, C.E. and Kirkaldy-Willis, W.H. (1986) Relationship
between spinal biomechanics and pathological changes in the equine thoracolumbar spine. Equine Vet J 18, 107-112.
Townsend, H.G., Leach, D.H. and Fretz, P.B. (1983) Kinematics of the equine thoracolumbar
spine. Equine Vet J 15, 117-122. Van der Helm, F.C. and Veenbaas, R. (1991) Modelling the mechanical effect of muscles
with large attachment sites: application to the shoulder mechanism. J Biomech 24, 1151-1163.
Van Dieën JH, Selen LP, Cholewicki J. (2003) Trunk muscle activation in low-back pain patients, an analysis of the literature. J Electromyogr Kinesiol. 13(4):333-51. Review Van Eijden, T.M., Korfage, J.A. and Brugman, P. (1997) Architecture of the human jaw-
closing and jaw-opening muscles. Anat Rec 248, 464-474. Van Roy, P., Barbaix, E., Clarijs, J.P. and Mense, S. (2001) Anatomical background of low
back pain: variability and degeneration of the lumbar spinal canal and intervertebral disc. Schmerz 15, 418-424.
Von Tscharner, V. (2000) Intensity analysis in time-frequency space of surface myoelectric
signals by wavelets of specified resolution. J Electromyogr Kinesiol 10, 433-445. Wada, N., Akatani, J., Miyajima, N., Shimojo, K. and Kanda, K. (2006a) The role of vertebral
column muscles in level versus upslope treadmill walking-an electromyographic and kinematic study. Brain Res 1090, 99-109.
Wada, N., Miyajima, N., Akatani, J., Shimojo, K. and Kanda, K. (2006b) Electromyographic
activity of m. longissimus and the kinematics of the vertebral column during level and downslope treadmill walking in cats. Brain Res 1103, 140-144.
Wakeling JM, Nigg BM, Rozitis AI. (2002) Muscle activity damps the soft tissue resonance
that occurs in response to pulsed and continuous vibrations. J Appl Physiol. 93(3):1093-103.
Walker, W. and Liem, K. (1994) Functional anatomy of the vertebrate, Saunders college
Publishing, Fort Worth. Wallwork, T.L., Hides, J.A. and Stanton, W.R. (2007) Intrarater and interrater reliability of
assessment of lumbar multifidus muscle thickness using rehabilitative ultrasound imaging. J Orthop Sports Phys Ther 37, 608-612.
Walton, J.M., Roberts, N. and Whitehouse, G.H. (1997) Measurement of the quadriceps
femoris muscle using magnetic resonance and ultrasound imaging. Br J Sports Med 31, 59-64.
Watanabe, K., Miyamoto, K., Masuda, T. and Shimizu, K. (2004) Use of ultrasonography to
evaluate thickness of the erector spinae muscle in maximum flexion and extension of the lumbar spine. Spine 29, 1472-1477.

158
Weaver, M.P., Jeffcott, L.B. and Nowak, M. (1999) Back problems. Radiology and
scintigraphy. Vet Clin North Am Equine Pract 15, 113-129, vii-viii. Weller, R., Pfau, T., Ferrari, M., Griffith, R., Bradford, T. and Wilson, A. (2007) “The
determination of muscle volume with a freehand 3D ultrasonography system”. Ultrasound Med Biol. 33(3):402-7.
Wells, J.B. (1965) Comparison of Mechanical Properties between Slow and Fast Mammalian
Muscles. J Physiol 178, 252-269. Wennerstrand, J., Johnston, C., Roethlisberger-Holm, K., Erichsen, C., Eksell, P. and
Drevemo, S. (2004) Kinematic evaluation of the back in the sport horse with back pain. Equine Vet J 36, 707-711.
Wickiewicz, T.L., Roy, R.R., Powell, P.L. and Edgerton, V.R. (1983) Muscle architecture of
the human lower limb. Clin Orthop Relat Res, 275-283. Wijnberg, I.D., Back, W., de Jong, M., Zuidhof, M.C., van den Belt, A.J. and van der Kolk,
J.H. (2004) The role of electromyography in clinical diagnosis of neuromuscular locomotor problems in the horse. Equine Vet J 36, 718-722.
Wijnberg, I.D., Franssen, H., Jansen, G.H., Back, W. and van der Kolk, J.H. (2003)
Quantitative electromyographic examination in myogenic disorders of 6 horses. J Vet Intern Med 17, 185-193.
Woledge, R.C., Curtin, N.A. and Homsher, E. (1985) Energetic aspects of muscle contraction.
Monogr Physiol Soc 41, 1-357. Wood, J.D., Enser, M., Fisher, A.V., Nute, G.R., Richardson, R.I. and Sheard, P.R. (1999)
Manipulating meat quality and composition. Proc Nutr Soc 58, 363-370. Zajac, F.E. (1989) Muscle and tendon: properties, models, scaling, and application to
biomechanics and motor control. Crit Rev Biomed Eng 17, 359-411. Zuberi, S.M., Matta, N., Nawaz, S., Stephenson, J.B., McWilliam, R.C. and Hollman, A.
(1999) Muscle ultrasound in the assessment of suspected neuromuscular disease in childhood. Neuromuscul Disord 9, 203-207.

159
VI. Summary
Back problems are very common in horses but unlike in humans their aetiopathogenesis are
poorly understood and their diagnosis and treatment are a challenge. The role of musculature
in the development of back problems in humans is well established, but while this has been
suggested to be the case in the horse there is no scientific evidence for this to date.
The aim of this thesis was to evaluate the structure and function of the largest muscle of the
equine back, the Longissimus dorsi muscle (LD) and investigate the usefulness of
ultrasonography in determining LD architecture in live horses.
Dissection of clinically normal horse and pony cadaver backs demonstrated the complex
architecture of this muscle with its regional variations in diameter, muscle fibre length and
pennation angle. The cranial thoracic LD was characterised by a small diameter, long muscle
fibres and small pennation angles which suggested a specialization for high velocity
contractions and excursion. Caudally muscle fibre length decreased whereas the pennation
angle and the cross-section area increased. This design enables the muscle to exert large
forces economically and to experience high tension.
The observed anatomical differences corresponded to regional differences in muscle activity
pattern and the intensity of muscle activity in six horses examined. Electromyographic
measurements showed significant differences at different anatomical locations, gaits, speeds
and inclines.
Ultrasonography was evaluated as a tool to visualize and quantify LD architecture in live
horses. In the first ultrasonographic study the ultrasonographic anatomy of the LD was
determined by matching ultrasonographic images to corresponding frozen sections in a
cadaver. Inter- and intra-operator repeatability of ultrasound based muscle measurements.
While muscle thickness measurements were found to be repeatable, pennation angle was not.
The presented thesis contributes to understanding the biomechanics of the equine LD by
illustrating the relationship between anatomy and function through integrating cadaveric data
with measurements in live horses. In the second part the use of ultrasonography in
determining LD architecture and function in live horses as future diagnostic tool was
investigated and its usefulness and limitations established.

160
VII. Zusammenfassung
Rückenprobleme sind ein zunehmendes Problem in der Pferdepraxis, aber anders als beim
Menschen ist die Ätiopathogenese nur wenig erforscht, deshalb sind Diagnose und
Behandlung oft eine Herausforderung für den Tierarzt. Beim Menschen ist die Rolle der
Rückenmuskulatur in der Entwicklung von Rückenproblemen wissenschaftlich erwiesen.
Obwohl dies auch beim Pferd vermutet wird, gibt es bis heute keine wissenschaftliche
Erkenntnisse hierzu.
Das Ziel dieser Arbeit war die Stuktur und Funktion des grössten Rückenmuskels des Pferdes,
des Musculus longissimus dorsi (LD), zu untersuchen und die ultrasonographische
Darstellbarkeit der Muskel Architektur an lebenden Pferden zu erforschen.
Anatomische Sektionen von klinisch gesunden Kavaderrücken veranschaulichten eine
komplexe Muskelarchitektur mit unterschiedlichen Durchmesser, Muskelfaserlänge und
Fiederungswinkel entlang des Muskels. Der kraniale Teil des LD ist charakterisiert durch
einen schmallen Durchmesser, lange Muskelfasern und kleinen Fiederungswinkeln, was
daraufhindeutet, dass dieser Teil des Muskels zu schnellen Kontraktionen und grosse
Exkursionen fähig ist. In kaudaler Richtung verkürzen sich die Muskelfasern, wohingegen
sich der Fiederungswinkel und der Durchmesser des Muskels vergröβert. Diese Anordnung
ermöglicht dem Muskel grosse Kräfte zu entwickeln und hoher Spannung zu wiederstehen.
Die festgestellten regionalen anatomischen Unterschiede entlang des LD stimmten mit
regionalen Unterschieden in der Muskelaktivität überein. Erregbarkeitsmuster und Intensität
der Muskelaktivität wurde in sechs Pferden anhand von elektromyographische Messungen
untersucht. Diese zeigten signifikante Unterschiede zwischen verschiedenen Muskelbereichen
und unter verschiedenen Bedingungen wie unterschiedlichen Gangarten, Geschwindigkeiten
und Steigungen.
Ultraschall wurde als non-invasive Technik zur Visualisierung und Quantifizierung der LD
Architektur am lebenden Pferd untersucht. In der ersten Ultraschallstudie wurde die
ultrasonographische Anatomie des LD mit den korrospondierenden, gefrorenen
Kadaverschnitten verglichen. Die Reproduzierbarkeit von Ultraschall basierten Messungen an
lebenden Pferden wurde in einer zweiten Studie untersucht. Es wurde festgestellt, daβ
Messungen der Muskeldicke reproduzierbar war, Messungen des Fiederungwinkels aber
nicht.
Die vorliegende Doktorarbeit trägt zum biomechanischen Verständniss des equinen LD bei,
indem der Zusammenhang zwischen Anatomie und Funktion dargestellt wird. Dies geschieht

161
durch die Verbindung von Daten aus Untersuchungen mit lebenden Pferden und Kadavern.
Im zweiten Teil wurde die Bewertung der LD-Architektur und Funktion durch Ultraschall
überprüft um Ultraschall als diagnostische Technik zu etablieren und dessen Limitationen
aufzuzeigen.

162
VIII. Acknowledgements
Formost, I would like to thank Dr. Renate Weller for offering me to do this research project
and for her and Dr. Thilo Pfau’s unfailing support and patience during the last three years. I
also would like to thank Alan Wilson and the Structure and Motion Lab at the Royal
Veterinary Collage in London to give me the opportunity and support to realize this project. I
would also like to thank Dr. Rachel Payne for her help with chapter III.1, Dr. James Wakeling
with chapter III.2, Richard Prior with chapter III.3, Pattama Ritruechai with chapter III.4. and
Aviva Petrie for her help with the statistics.
Finally, I would like to thank Dr. Johann Maierl for his efforts during the painstaking
corrections and for his profound suggestions when submitting this thesis in Munich.
And last but not least I would like to thank Harald Kronseder for his financial support.

163