Embed Size (px)
DESCRIPTION
7 th Annual CMAS Conference, October 6th , 2008. The Analysis of Ozone Dependence on Synoptic Weather Patterns. Fong (Fantine) Ngan and DaeWon Byun IMAQS, Department of Earth Sciences, University of Houston. Contents. Introduction Methodology Cluster Characteristics - PowerPoint PPT Presentation
Citation preview
Fong (Fantine) Ngan and DaeWon Byun
IMAQS, Department of Earth Sciences, University of Houston
7th Annual CMAS Conference, October 6th , 2008
Introduction Methodology Cluster Characteristics Clusters .vs. Ozone Episodes Clusters .vs. CMAQ Forecasting Summary and Future Work
Synoptic flow patterns have been classified during 2005/2006 TexAQS-II.
Understanding the dependence of O3 on meteorology
How high O3 events are associated with certain weather scenarios
Evaluating AQF results according to the weather clusters
• Houston/Galveston area is a unique environment for O3 development.
(Various emissions + complex geophysical characteristics)
• Banta et al. (2005), Darby (2005) – Met. factors are a key on determining the production, dilution and transport of O3.
• Muller & Jackson (1985), Eder et al. (1995), Davis et al. (1998) – The development of O3 levels depends greatly on meteorological conditions which affect photochemical reaction and transport of O3 precursors.
• Appel et al. (2007) – model biases in O3 prediction vary based on the meteorological conditions.
MethodologyMethodology
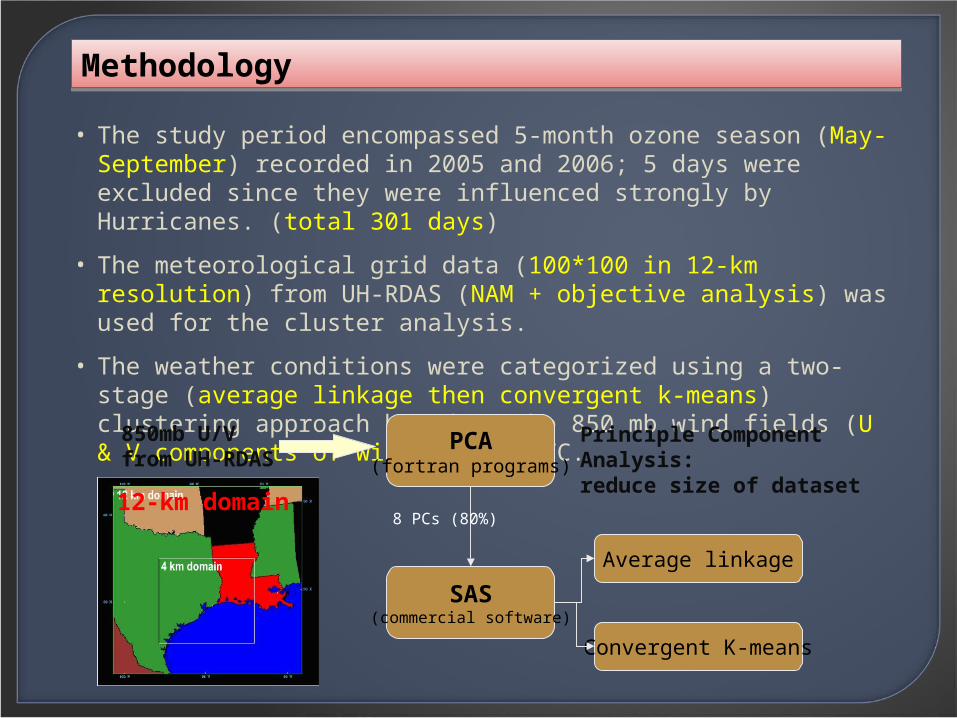
• The study period encompassed 5-month ozone season (May-September) recorded in 2005 and 2006; 5 days were excluded since they were influenced strongly by Hurricanes. (total 301 days)
• The meteorological grid data (100*100 in 12-km resolution) from UH-RDAS (NAM + objective analysis) was used for the cluster analysis.
• The weather conditions were categorized using a two-stage (average linkage then convergent k-means) clustering approach based on the 850 mb wind fields (U & V components of wind) at 12 UTC.
PCA(fortran programs)
SAS(commercial software)
Average linkage
Convergent K-means
8 PCs (80%)
Principle Component Analysis: reduce size of dataset
850mb U/V from UH-RDAS
12-km domain
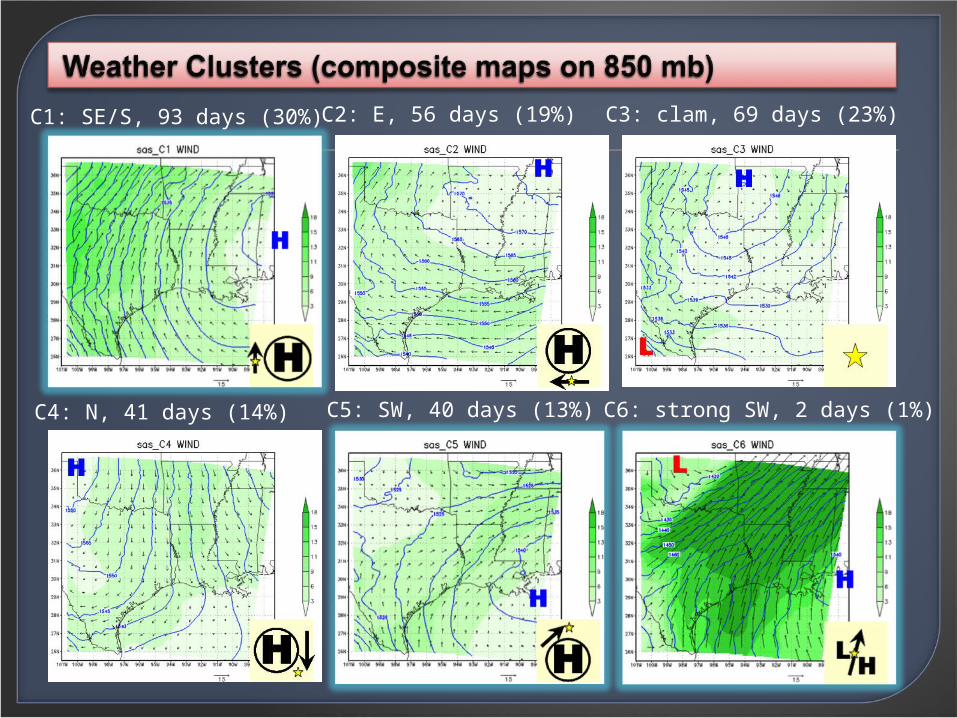
C1: SE/S, 93 days (30%) C2: E, 56 days (19%) C3: clam, 69 days (23%)
C4: N, 41 days (14%) C5: SW, 40 days (13%) C6: strong SW, 2 days (1%)
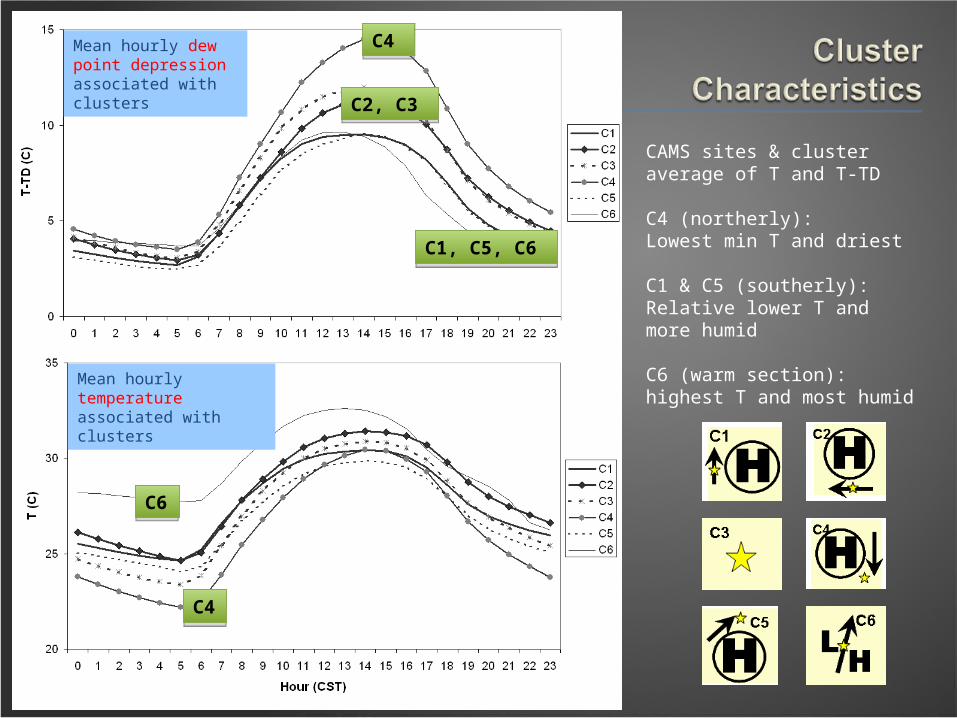
Mean hourly dew point depression associated with clusters
Mean hourly temperature associated with clusters
CAMS sites & cluster average of T and T-TD
C4 (northerly): Lowest min T and driest
C1 & C5 (southerly):Relative lower T and more humid
C6 (warm section): highest T and most humid
C4 C4
C2, C3 C2, C3
C1, C5, C6 C1, C5, C6
C6C6
C4 C4
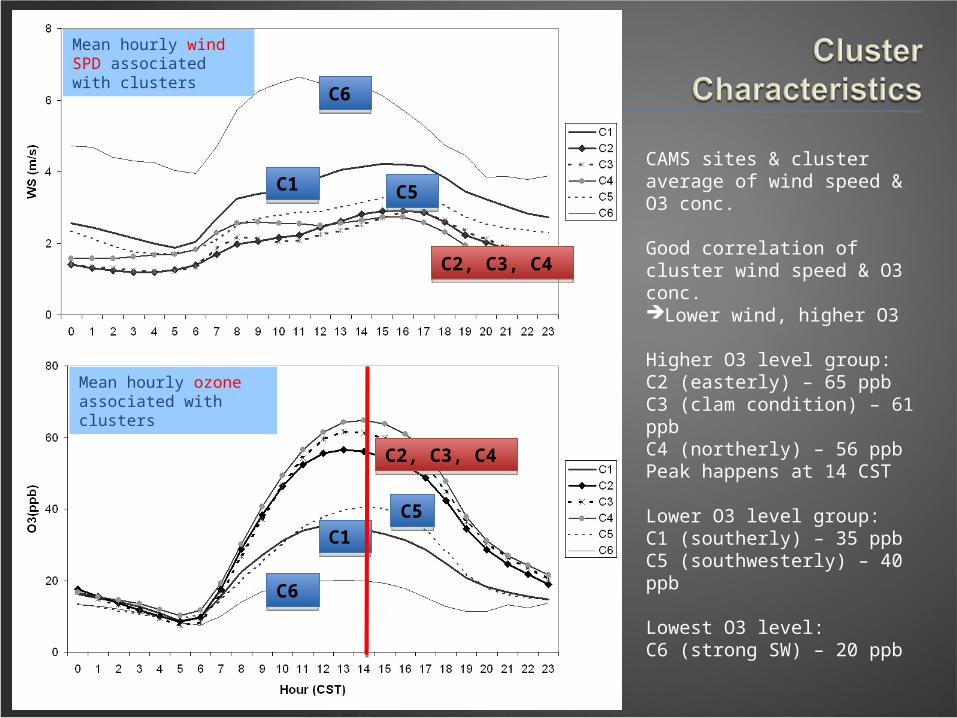
Mean hourly wind SPD associated with clusters
Mean hourly ozone associated with clusters
CAMS sites & cluster average of wind speed & O3 conc.
Good correlation of cluster wind speed & O3 conc.Lower wind, higher O3
Higher O3 level group:C2 (easterly) – 65 ppbC3 (clam condition) – 61 ppbC4 (northerly) – 56 ppbPeak happens at 14 CST
Lower O3 level group:C1 (southerly) – 35 ppbC5 (southwesterly) – 40 ppb
Lowest O3 level:C6 (strong SW) – 20 ppb
C6 C6
C2, C3, C4 C2, C3, C4
C1 C1 C5 C5
C2, C3, C4 C2, C3, C4
C6 C6
C1 C1 C5 C5
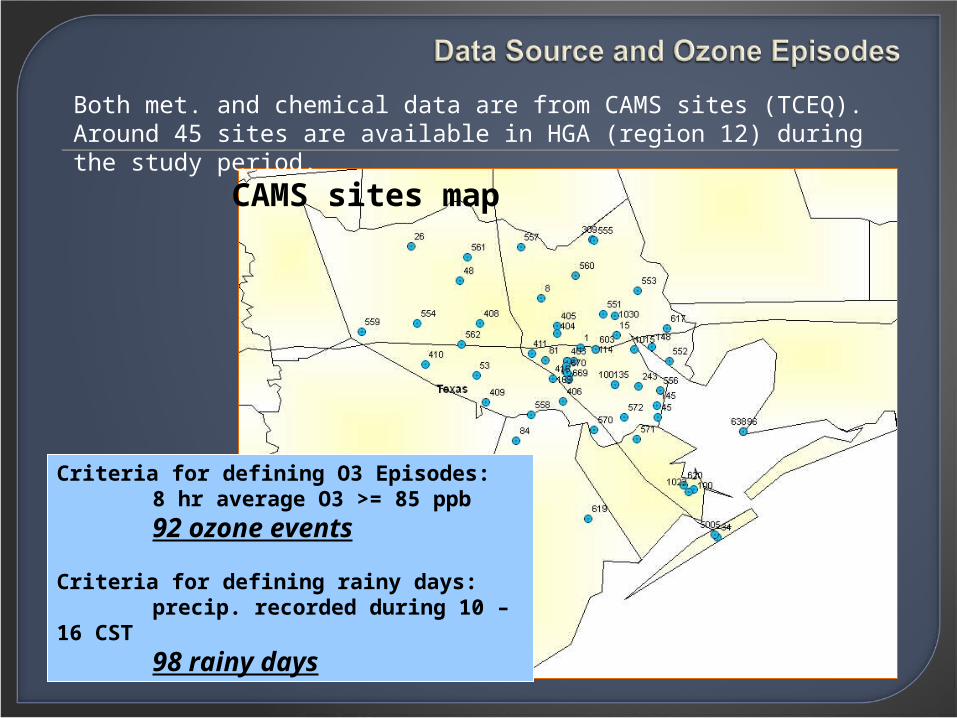
Both met. and chemical data are from CAMS sites (TCEQ). Around 45 sites are available in HGA (region 12) during the study period.
Criteria for defining O3 Episodes: 8 hr average O3 >= 85 ppb
92 ozone events
Criteria for defining rainy days: precip. recorded during 10 – 16 CST
98 rainy days
CAMS sites map
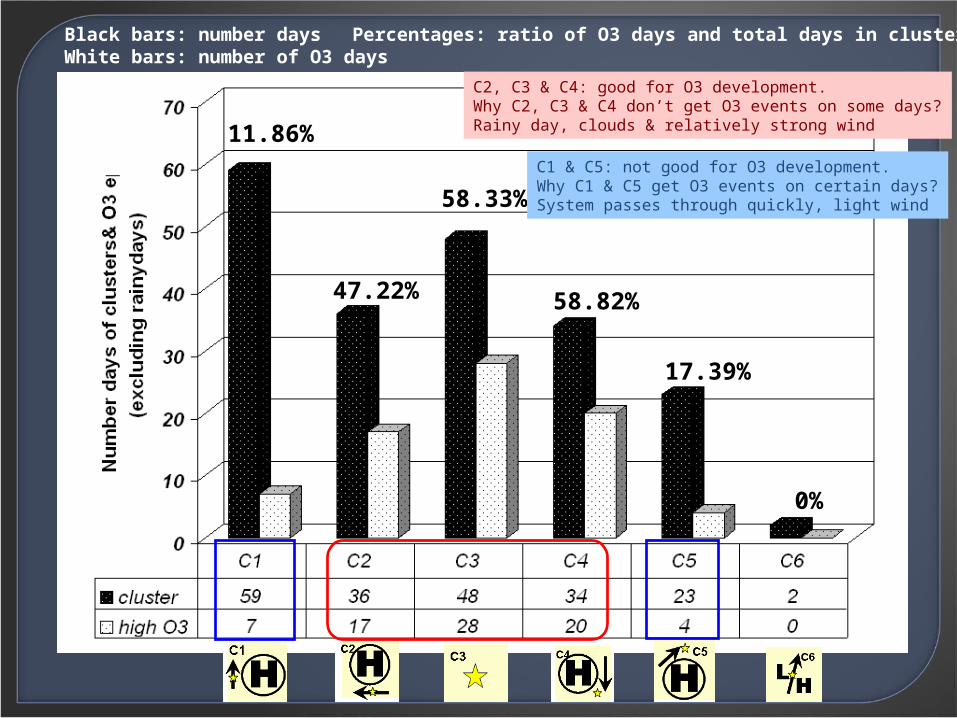
11.86%
47.22%
58.33%
58.82%
17.39%
0%
Black bars: number days White bars: number of O3 days
C1 & C5: not good for O3 development.Why C1 & C5 get O3 events on certain days?System passes through quickly, light wind
C2, C3 & C4: good for O3 development.Why C2, C3 & C4 don’t get O3 events on some days?Rainy day, clouds & relatively strong wind
Percentages: ratio of O3 days and total days in clusters
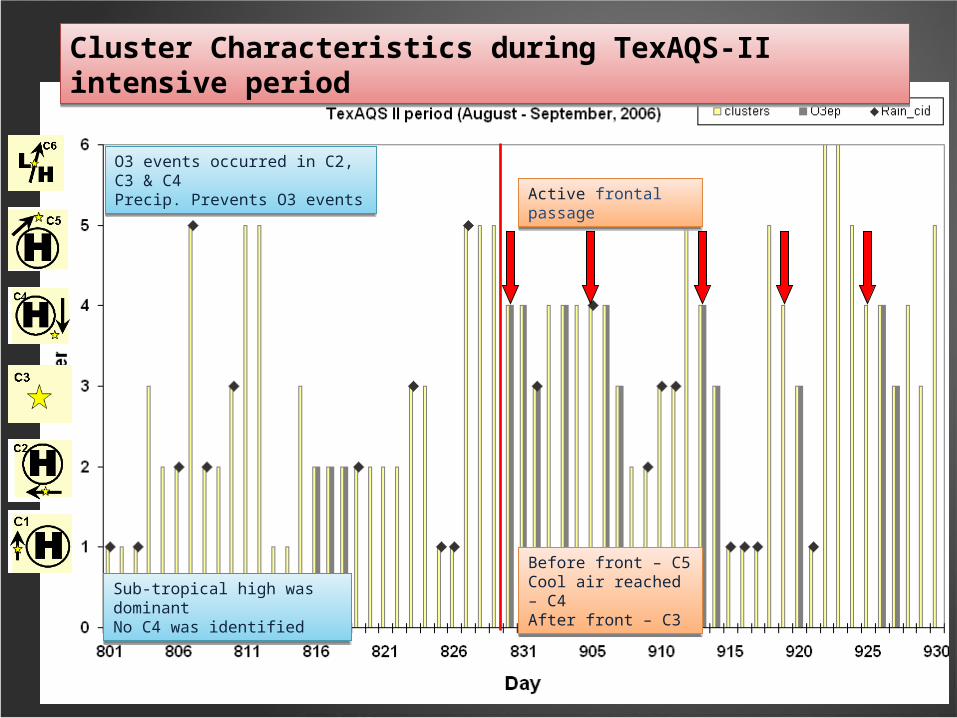
Cluster Characteristics during TexAQS-II intensive periodCluster Characteristics during TexAQS-II intensive period
O3 events occurred in C2, C3 & C4Precip. Prevents O3 events
O3 events occurred in C2, C3 & C4Precip. Prevents O3 events
Sub-tropical high was dominantNo C4 was identified
Sub-tropical high was dominantNo C4 was identified
Active frontal passageActive frontal passage
Before front – C5Cool air reached – C4After front – C3
Before front – C5Cool air reached – C4After front – C3
C4
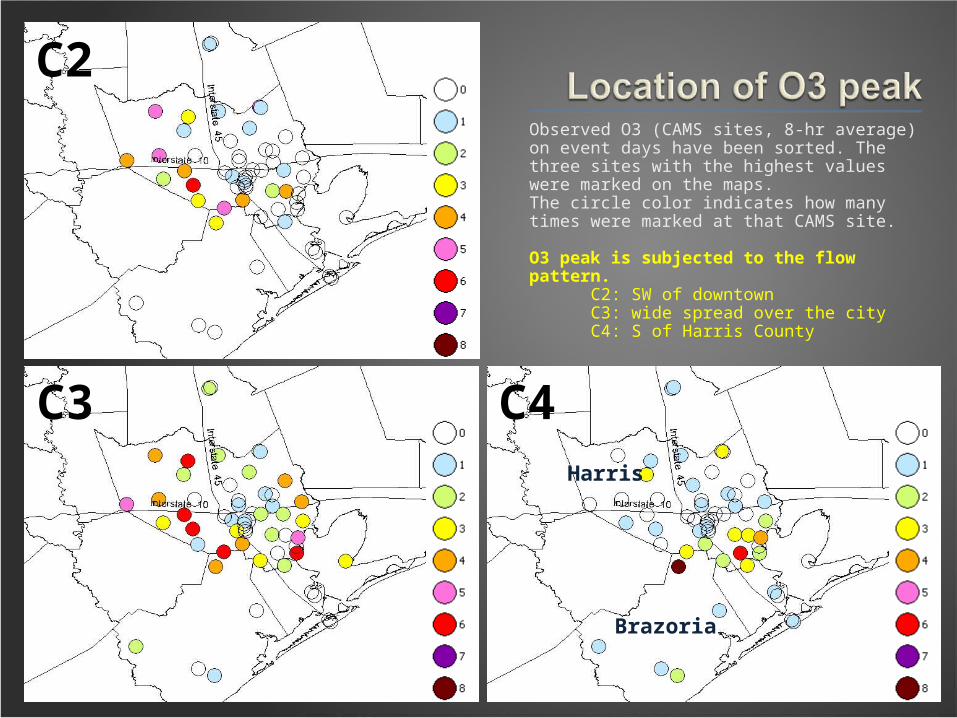
C2Observed O3 (CAMS sites, 8-hr average) on event days have been sorted. The three sites with the highest values were marked on the maps. The circle color indicates how many times were marked at that CAMS site.
O3 peak is subjected to the flow pattern. C2: SW of downtown C3: wide spread over the city C4: S of Harris County
C3Harris
Brazoria
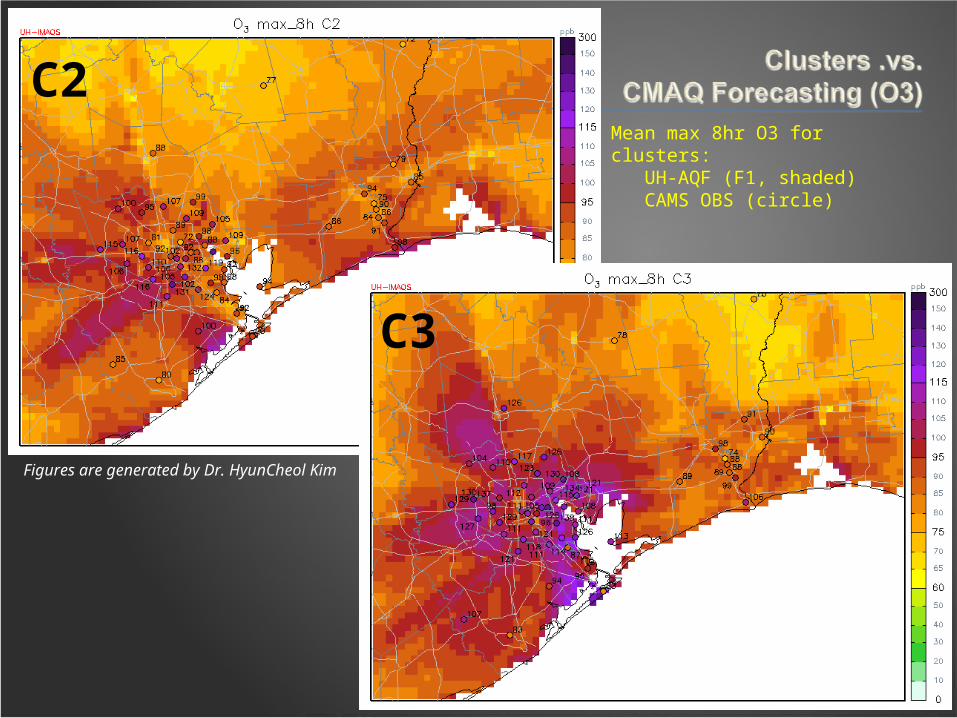
Mean max 8hr O3 for clusters: UH-AQF (F1, shaded) CAMS OBS (circle)
C2
C3
Figures are generated by Dr. HyunCheol Kim
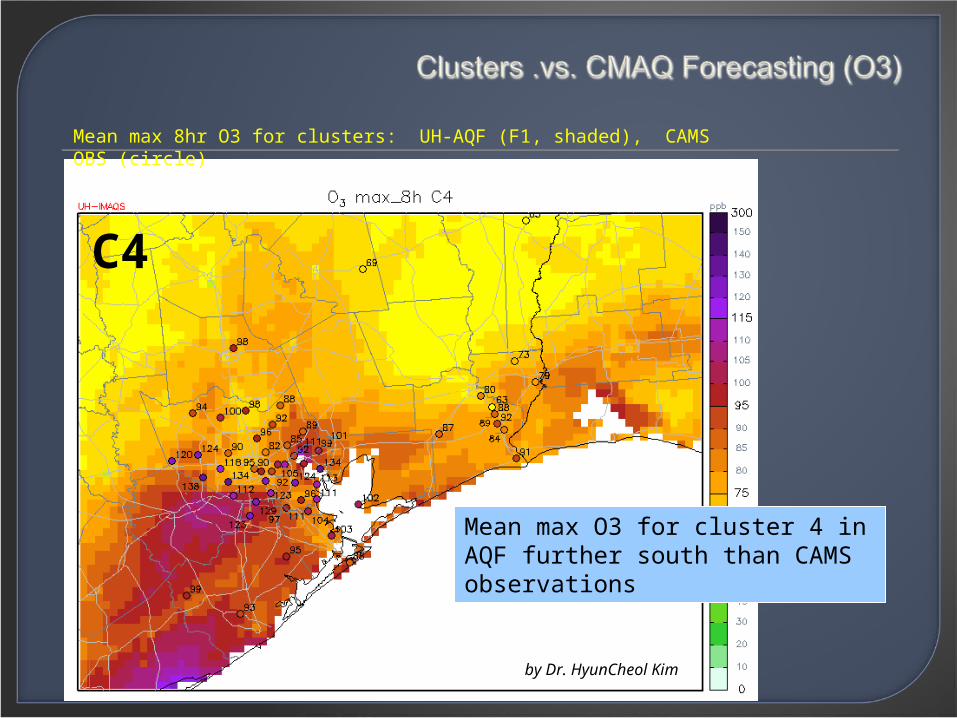
C4
Mean max 8hr O3 for clusters: UH-AQF (F1, shaded), CAMS OBS (circle)
Mean max O3 for cluster 4 in AQF further south than CAMS observations
by Dr. HyunCheol Kim
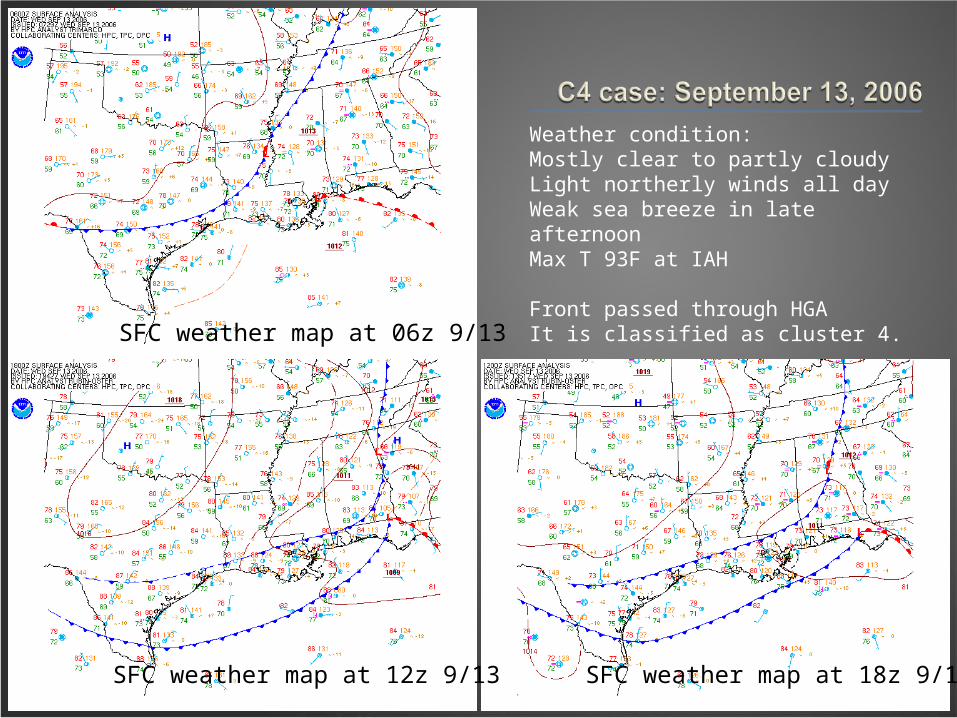
Weather condition: Mostly clear to partly cloudyLight northerly winds all dayWeak sea breeze in late afternoonMax T 93F at IAH
Front passed through HGAIt is classified as cluster 4.SFC weather map at 06z 9/13
SFC weather map at 12z 9/13 SFC weather map at 18z 9/13
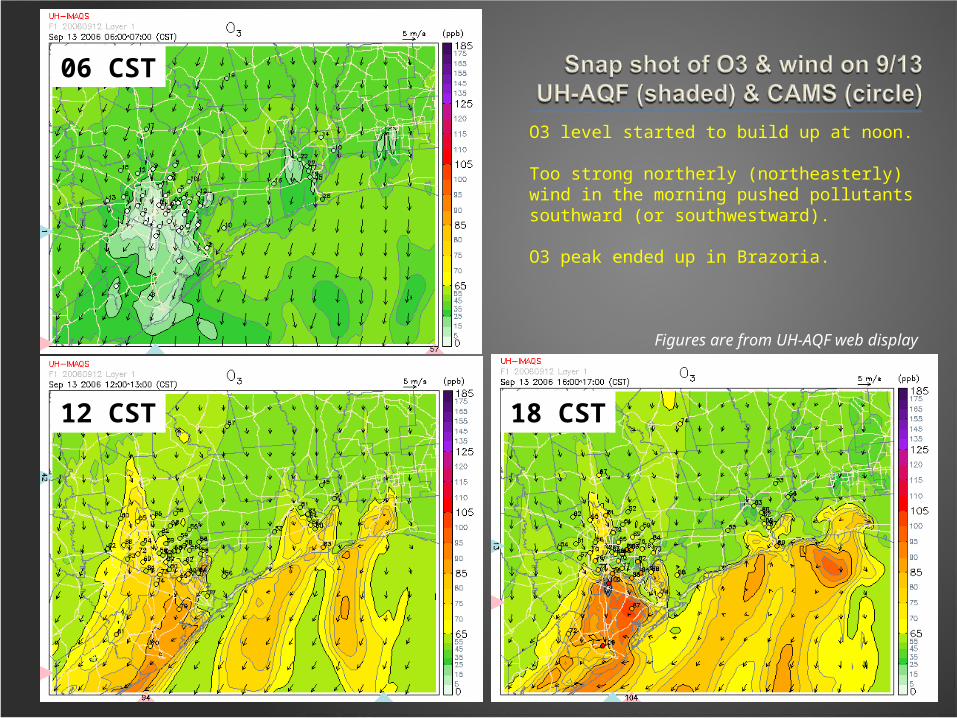
O3 level started to build up at noon.
Too strong northerly (northeasterly) wind in the morning pushed pollutants southward (or southwestward).
O3 peak ended up in Brazoria.
06 CST
12 CST 18 CST
Figures are from UH-AQF web display
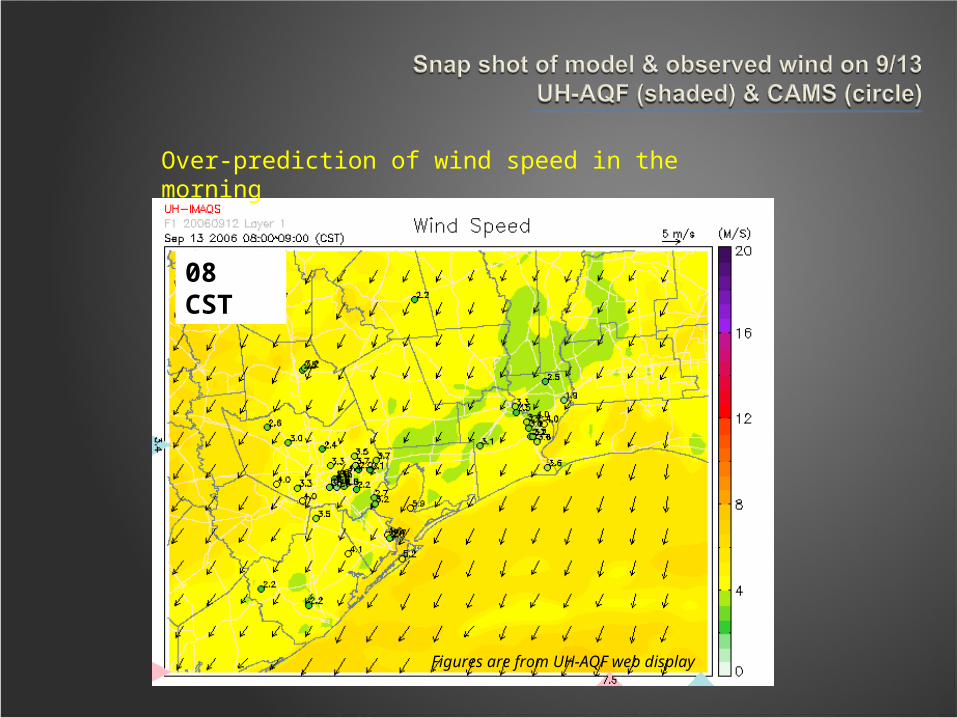
Over-prediction of wind speed in the morning
08 CST
Figures are from UH-AQF web display
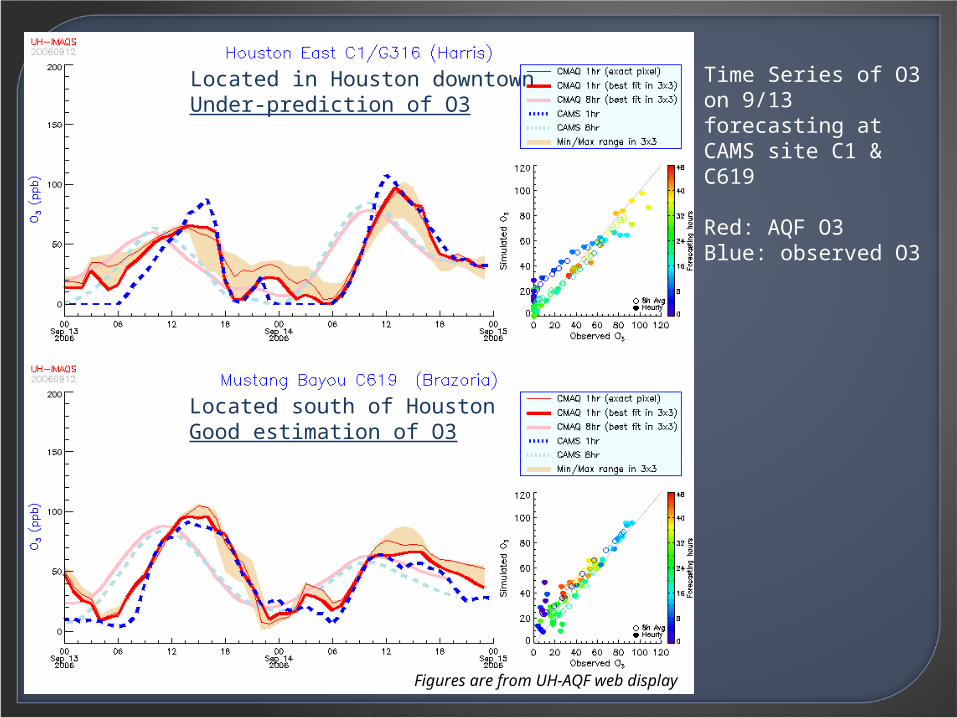
Time Series of O3 on 9/13 forecasting at CAMS site C1 & C619
Red: AQF O3Blue: observed O3
Figures are from UH-AQF web display
Located in Houston downtownUnder-prediction of O3
Located south of HoustonGood estimation of O3
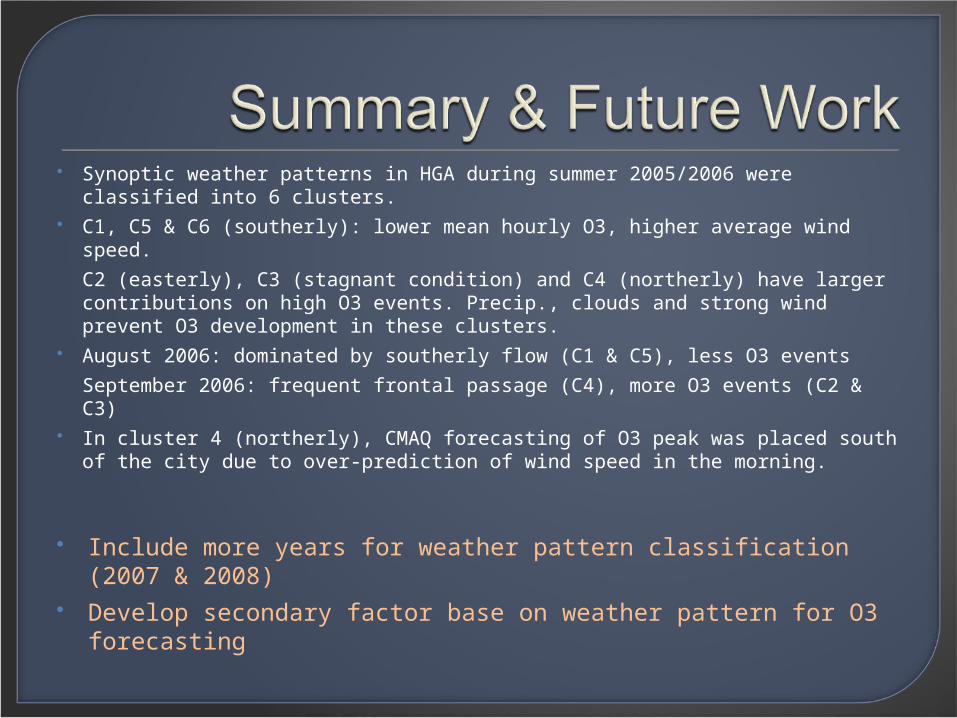
Synoptic weather patterns in HGA during summer 2005/2006 were classified into 6 clusters.
C1, C5 & C6 (southerly): lower mean hourly O3, higher average wind speed.
C2 (easterly), C3 (stagnant condition) and C4 (northerly) have larger contributions on high O3 events. Precip., clouds and strong wind prevent O3 development in these clusters.
August 2006: dominated by southerly flow (C1 & C5), less O3 events
September 2006: frequent frontal passage (C4), more O3 events (C2 & C3) In cluster 4 (northerly), CMAQ forecasting of O3 peak was placed south of
the city due to over-prediction of wind speed in the morning.
Include more years for weather pattern classification (2007 & 2008) Develop secondary factor base on weather pattern for O3 forecasting