Embed Size (px)
Citation preview

International Research Journal of Finance and Economics
ISSN 1450-2887 Issue 163 September, 2017
http://www.internationalresearchjournaloffinanceandeconomics.com
The Analysis of Optimal Portfolio Forming with Single Index
Model on Indonesian Most Trusted Companies
Partono, Thomas
Faculty of economics, Universitas Negeri Semarang
Widiyanto
Faculty of economics, Universitas Negeri Semarang
Yulianto, Arief
Faculty of economics, Universitas Negeri Semarang
Handika Vidayanto
Faculty of economics, Universitas Negeri Semarang
Abstract
This study aims to form the optimal portfolio in trusted company in Indonesia. This
research is a descriptive research with quantitative approach and purposive sampling
technique. The population is the Indonesian Most Trusted Companies with 33 sample
companies, while the total sample of 27 companies. The analysis model is Single Index
Model. The results of this research there are eight stocks forming the optimal portfolio, and
the respective percentage of shares that UNVR by 23%, PGAS by 29%, JSMR by 24%,
ADHI by 11%, NISP amounted to 2%, HMSP by 5%, and WEHA by 1%. Portfolios are
formed also generate the expected return of 1.6% with 0,1% systematic risk and 0,1%
unique risk and for the total risk is 4%. While the stock formed from the overall sample
Indonesian Most Trusted Companies provide expected return of -0.4%, with a greater risk
of 5%. Rational investors will choose investments into companies that have a single index
model analysis on trusted companies.
Keywords: Cut-off, Optimal Portfolio, Return, Risk, Single Index Model
JEL Classification: G4
1. Introduction Nowadays, investment has been known in indonesian society, the investment’s awareness by society
starts increasing with be appreciated of Asean Economic’s Community’appearance that has
contribution in increasing the business competition and investment in indonesia. Therefore, investment
starts becoming a need in indonesian society, according to Wahyono (2011), the investment’s needs is
a basic needs in regional otonomy and district management indepently. The investment aims to obtain
even long term or short term profit.
Generally, the investors want a high return from their investment, therefore the investment
financial especially in stock investment becomes one of the good prospect choice because of it gives a
high return with easier transacting and investing. Return is also one of factors which motivated the
investor to invest and also a reward for their courage to bear the risks of investing that they do.
(Tandelilin, 2010). In general, the invested funds usage in stock market generally uses the surplus

51
funds except primary needs in investing because its developing needs time and process to get a high
return so that the investors can not take it with the profit that they want anytime. But
investment gives a higher return than save the money with a good investment decision. An Investment
decision is a decision to invest on concrete or abstract asset, investment is also called decision of
budgeting asset. (Cahyaningdyah & Res
It is important to establish portfolio when you invest in stock market because it will influence
the risk and the return that can be obtained. The investment risk can be decreased by investment
diversification (Anoraga & Pakarti, 2008). Portfol
portfolio because it can decrease the risk if be compared with investing only in
statement agree with Markowitz theory which is said “don’t put all your eggs in one basket”, which
means, do not put all your investments in one security because if the security is collapse,then the entire
investment is also falling. Based on the theory we need portfolio diversification, and portfolio forming
with kinds of analysis.
Through this portfolio
low risk or try to minimize the risk. Tandelilin (2001) argued, there are two portfolio strategies can be
done, they are pasive and active strategy, which pasive strategy is investm
disposed based on the movement of market index with an assumption that market does not do a
mispricing, the goal is to get return as big as market index by minimizing the risk. Meanwhile active
strategy included searching and utiliz
on purpose of getting higher return than passive strategy, which the investors are more active on
trading in Stock Market.
Indonesian Most Trusted Companies is an index that composed by busi
which provide Indonesia trustworthy companies list with a direct survey toward investor, analyst,
investment manager, and assesment based on transparency, accountability, responsibility,
independence, and justice because the assesment ar
Indonesia Composite Index
portfolio which has function as the indicator between market index and the correlation with asset
returns. Tandelilin (2
calculation. This index describes the market movement commonly so that it is used as measurement to
define the systematic risks of portfolio. IHSG development has increased si
Exchange established on 1984 until 2015. In the 1990s IHSG is valued by Rp. 300,00 until in 2015 it
reached the highest price Rp. 5.523,29 although at the same year it also decreased significantly 12,13%
until the end of the year from t
Sources : Indonesia Stocks Exchange 2016
funds except primary needs in investing because its developing needs time and process to get a high
return so that the investors can not take it with the profit that they want anytime. But
investment gives a higher return than save the money with a good investment decision. An Investment
decision is a decision to invest on concrete or abstract asset, investment is also called decision of
budgeting asset. (Cahyaningdyah & Res
It is important to establish portfolio when you invest in stock market because it will influence
the risk and the return that can be obtained. The investment risk can be decreased by investment
diversification (Anoraga & Pakarti, 2008). Portfol
portfolio because it can decrease the risk if be compared with investing only in
statement agree with Markowitz theory which is said “don’t put all your eggs in one basket”, which
s, do not put all your investments in one security because if the security is collapse,then the entire
investment is also falling. Based on the theory we need portfolio diversification, and portfolio forming
with kinds of analysis.
Through this portfolio
low risk or try to minimize the risk. Tandelilin (2001) argued, there are two portfolio strategies can be
done, they are pasive and active strategy, which pasive strategy is investm
disposed based on the movement of market index with an assumption that market does not do a
mispricing, the goal is to get return as big as market index by minimizing the risk. Meanwhile active
strategy included searching and utiliz
on purpose of getting higher return than passive strategy, which the investors are more active on
trading in Stock Market.
Indonesian Most Trusted Companies is an index that composed by busi
which provide Indonesia trustworthy companies list with a direct survey toward investor, analyst,
investment manager, and assesment based on transparency, accountability, responsibility,
independence, and justice because the assesment ar
Indonesia Composite Index
portfolio which has function as the indicator between market index and the correlation with asset
returns. Tandelilin (2010) argued that IHSG is an index which all of stocks registered as component of
calculation. This index describes the market movement commonly so that it is used as measurement to
define the systematic risks of portfolio. IHSG development has increased si
Exchange established on 1984 until 2015. In the 1990s IHSG is valued by Rp. 300,00 until in 2015 it
reached the highest price Rp. 5.523,29 although at the same year it also decreased significantly 12,13%
until the end of the year from t
Grafic 1.
Sources : Indonesia Stocks Exchange 2016
International Research Journal of Finance and Economics
funds except primary needs in investing because its developing needs time and process to get a high
return so that the investors can not take it with the profit that they want anytime. But
investment gives a higher return than save the money with a good investment decision. An Investment
decision is a decision to invest on concrete or abstract asset, investment is also called decision of
budgeting asset. (Cahyaningdyah & Res
It is important to establish portfolio when you invest in stock market because it will influence
the risk and the return that can be obtained. The investment risk can be decreased by investment
diversification (Anoraga & Pakarti, 2008). Portfol
portfolio because it can decrease the risk if be compared with investing only in
statement agree with Markowitz theory which is said “don’t put all your eggs in one basket”, which
s, do not put all your investments in one security because if the security is collapse,then the entire
investment is also falling. Based on the theory we need portfolio diversification, and portfolio forming
with kinds of analysis.
Through this portfolio, the investors are hoped be able to maximize the expected return with the
low risk or try to minimize the risk. Tandelilin (2001) argued, there are two portfolio strategies can be
done, they are pasive and active strategy, which pasive strategy is investm
disposed based on the movement of market index with an assumption that market does not do a
mispricing, the goal is to get return as big as market index by minimizing the risk. Meanwhile active
strategy included searching and utiliz
on purpose of getting higher return than passive strategy, which the investors are more active on
trading in Stock Market.
Indonesian Most Trusted Companies is an index that composed by busi
which provide Indonesia trustworthy companies list with a direct survey toward investor, analyst,
investment manager, and assesment based on transparency, accountability, responsibility,
independence, and justice because the assesment ar
Indonesia Composite Index
portfolio which has function as the indicator between market index and the correlation with asset
010) argued that IHSG is an index which all of stocks registered as component of
calculation. This index describes the market movement commonly so that it is used as measurement to
define the systematic risks of portfolio. IHSG development has increased si
Exchange established on 1984 until 2015. In the 1990s IHSG is valued by Rp. 300,00 until in 2015 it
reached the highest price Rp. 5.523,29 although at the same year it also decreased significantly 12,13%
until the end of the year from the closing price in 2014.
Grafic 1. The development of Indonesia Composite Index or IHSG
Sources : Indonesia Stocks Exchange 2016
International Research Journal of Finance and Economics
funds except primary needs in investing because its developing needs time and process to get a high
return so that the investors can not take it with the profit that they want anytime. But
investment gives a higher return than save the money with a good investment decision. An Investment
decision is a decision to invest on concrete or abstract asset, investment is also called decision of
budgeting asset. (Cahyaningdyah & Ressany, 2012)
It is important to establish portfolio when you invest in stock market because it will influence
the risk and the return that can be obtained. The investment risk can be decreased by investment
diversification (Anoraga & Pakarti, 2008). Portfol
portfolio because it can decrease the risk if be compared with investing only in
statement agree with Markowitz theory which is said “don’t put all your eggs in one basket”, which
s, do not put all your investments in one security because if the security is collapse,then the entire
investment is also falling. Based on the theory we need portfolio diversification, and portfolio forming
, the investors are hoped be able to maximize the expected return with the
low risk or try to minimize the risk. Tandelilin (2001) argued, there are two portfolio strategies can be
done, they are pasive and active strategy, which pasive strategy is investm
disposed based on the movement of market index with an assumption that market does not do a
mispricing, the goal is to get return as big as market index by minimizing the risk. Meanwhile active
strategy included searching and utilizing information by following the times and price stock movement
on purpose of getting higher return than passive strategy, which the investors are more active on
Indonesian Most Trusted Companies is an index that composed by busi
which provide Indonesia trustworthy companies list with a direct survey toward investor, analyst,
investment manager, and assesment based on transparency, accountability, responsibility,
independence, and justice because the assesment ar
Indonesia Composite Index (IHSG) is one of important instruments on optimal measurement of
portfolio which has function as the indicator between market index and the correlation with asset
010) argued that IHSG is an index which all of stocks registered as component of
calculation. This index describes the market movement commonly so that it is used as measurement to
define the systematic risks of portfolio. IHSG development has increased si
Exchange established on 1984 until 2015. In the 1990s IHSG is valued by Rp. 300,00 until in 2015 it
reached the highest price Rp. 5.523,29 although at the same year it also decreased significantly 12,13%
he closing price in 2014.
The development of Indonesia Composite Index or IHSG
Sources : Indonesia Stocks Exchange 2016
International Research Journal of Finance and Economics
funds except primary needs in investing because its developing needs time and process to get a high
return so that the investors can not take it with the profit that they want anytime. But
investment gives a higher return than save the money with a good investment decision. An Investment
decision is a decision to invest on concrete or abstract asset, investment is also called decision of
sany, 2012)
It is important to establish portfolio when you invest in stock market because it will influence
the risk and the return that can be obtained. The investment risk can be decreased by investment
diversification (Anoraga & Pakarti, 2008). Portfolio forming with diversification is helpful on optimal
portfolio because it can decrease the risk if be compared with investing only in
statement agree with Markowitz theory which is said “don’t put all your eggs in one basket”, which
s, do not put all your investments in one security because if the security is collapse,then the entire
investment is also falling. Based on the theory we need portfolio diversification, and portfolio forming
, the investors are hoped be able to maximize the expected return with the
low risk or try to minimize the risk. Tandelilin (2001) argued, there are two portfolio strategies can be
done, they are pasive and active strategy, which pasive strategy is investm
disposed based on the movement of market index with an assumption that market does not do a
mispricing, the goal is to get return as big as market index by minimizing the risk. Meanwhile active
ing information by following the times and price stock movement
on purpose of getting higher return than passive strategy, which the investors are more active on
Indonesian Most Trusted Companies is an index that composed by busi
which provide Indonesia trustworthy companies list with a direct survey toward investor, analyst,
investment manager, and assesment based on transparency, accountability, responsibility,
independence, and justice because the assesment are based on GCG (Good Corporate Governance).
(IHSG) is one of important instruments on optimal measurement of
portfolio which has function as the indicator between market index and the correlation with asset
010) argued that IHSG is an index which all of stocks registered as component of
calculation. This index describes the market movement commonly so that it is used as measurement to
define the systematic risks of portfolio. IHSG development has increased si
Exchange established on 1984 until 2015. In the 1990s IHSG is valued by Rp. 300,00 until in 2015 it
reached the highest price Rp. 5.523,29 although at the same year it also decreased significantly 12,13%
he closing price in 2014.
The development of Indonesia Composite Index or IHSG
International Research Journal of Finance and Economics
funds except primary needs in investing because its developing needs time and process to get a high
return so that the investors can not take it with the profit that they want anytime. But
investment gives a higher return than save the money with a good investment decision. An Investment
decision is a decision to invest on concrete or abstract asset, investment is also called decision of
It is important to establish portfolio when you invest in stock market because it will influence
the risk and the return that can be obtained. The investment risk can be decreased by investment
io forming with diversification is helpful on optimal
portfolio because it can decrease the risk if be compared with investing only in
statement agree with Markowitz theory which is said “don’t put all your eggs in one basket”, which
s, do not put all your investments in one security because if the security is collapse,then the entire
investment is also falling. Based on the theory we need portfolio diversification, and portfolio forming
, the investors are hoped be able to maximize the expected return with the
low risk or try to minimize the risk. Tandelilin (2001) argued, there are two portfolio strategies can be
done, they are pasive and active strategy, which pasive strategy is investm
disposed based on the movement of market index with an assumption that market does not do a
mispricing, the goal is to get return as big as market index by minimizing the risk. Meanwhile active
ing information by following the times and price stock movement
on purpose of getting higher return than passive strategy, which the investors are more active on
Indonesian Most Trusted Companies is an index that composed by busi
which provide Indonesia trustworthy companies list with a direct survey toward investor, analyst,
investment manager, and assesment based on transparency, accountability, responsibility,
e based on GCG (Good Corporate Governance).
(IHSG) is one of important instruments on optimal measurement of
portfolio which has function as the indicator between market index and the correlation with asset
010) argued that IHSG is an index which all of stocks registered as component of
calculation. This index describes the market movement commonly so that it is used as measurement to
define the systematic risks of portfolio. IHSG development has increased si
Exchange established on 1984 until 2015. In the 1990s IHSG is valued by Rp. 300,00 until in 2015 it
reached the highest price Rp. 5.523,29 although at the same year it also decreased significantly 12,13%
The development of Indonesia Composite Index or IHSG
International Research Journal of Finance and Economics
funds except primary needs in investing because its developing needs time and process to get a high
return so that the investors can not take it with the profit that they want anytime. But
investment gives a higher return than save the money with a good investment decision. An Investment
decision is a decision to invest on concrete or abstract asset, investment is also called decision of
It is important to establish portfolio when you invest in stock market because it will influence
the risk and the return that can be obtained. The investment risk can be decreased by investment
io forming with diversification is helpful on optimal
portfolio because it can decrease the risk if be compared with investing only in
statement agree with Markowitz theory which is said “don’t put all your eggs in one basket”, which
s, do not put all your investments in one security because if the security is collapse,then the entire
investment is also falling. Based on the theory we need portfolio diversification, and portfolio forming
, the investors are hoped be able to maximize the expected return with the
low risk or try to minimize the risk. Tandelilin (2001) argued, there are two portfolio strategies can be
done, they are pasive and active strategy, which pasive strategy is investment strategy in passive
disposed based on the movement of market index with an assumption that market does not do a
mispricing, the goal is to get return as big as market index by minimizing the risk. Meanwhile active
ing information by following the times and price stock movement
on purpose of getting higher return than passive strategy, which the investors are more active on
Indonesian Most Trusted Companies is an index that composed by busi
which provide Indonesia trustworthy companies list with a direct survey toward investor, analyst,
investment manager, and assesment based on transparency, accountability, responsibility,
e based on GCG (Good Corporate Governance).
(IHSG) is one of important instruments on optimal measurement of
portfolio which has function as the indicator between market index and the correlation with asset
010) argued that IHSG is an index which all of stocks registered as component of
calculation. This index describes the market movement commonly so that it is used as measurement to
define the systematic risks of portfolio. IHSG development has increased si
Exchange established on 1984 until 2015. In the 1990s IHSG is valued by Rp. 300,00 until in 2015 it
reached the highest price Rp. 5.523,29 although at the same year it also decreased significantly 12,13%
The development of Indonesia Composite Index or IHSG
International Research Journal of Finance and Economics - Issue 163 (2017)
funds except primary needs in investing because its developing needs time and process to get a high
return so that the investors can not take it with the profit that they want anytime. But on the process,
investment gives a higher return than save the money with a good investment decision. An Investment
decision is a decision to invest on concrete or abstract asset, investment is also called decision of
It is important to establish portfolio when you invest in stock market because it will influence
the risk and the return that can be obtained. The investment risk can be decreased by investment
io forming with diversification is helpful on optimal
portfolio because it can decrease the risk if be compared with investing only in one emiten.
statement agree with Markowitz theory which is said “don’t put all your eggs in one basket”, which
s, do not put all your investments in one security because if the security is collapse,then the entire
investment is also falling. Based on the theory we need portfolio diversification, and portfolio forming
, the investors are hoped be able to maximize the expected return with the
low risk or try to minimize the risk. Tandelilin (2001) argued, there are two portfolio strategies can be
ent strategy in passive
disposed based on the movement of market index with an assumption that market does not do a
mispricing, the goal is to get return as big as market index by minimizing the risk. Meanwhile active
ing information by following the times and price stock movement
on purpose of getting higher return than passive strategy, which the investors are more active on
Indonesian Most Trusted Companies is an index that composed by business megazine SWA
which provide Indonesia trustworthy companies list with a direct survey toward investor, analyst,
investment manager, and assesment based on transparency, accountability, responsibility,
e based on GCG (Good Corporate Governance).
(IHSG) is one of important instruments on optimal measurement of
portfolio which has function as the indicator between market index and the correlation with asset
010) argued that IHSG is an index which all of stocks registered as component of
calculation. This index describes the market movement commonly so that it is used as measurement to
define the systematic risks of portfolio. IHSG development has increased since Indonesia Stock
Exchange established on 1984 until 2015. In the 1990s IHSG is valued by Rp. 300,00 until in 2015 it
reached the highest price Rp. 5.523,29 although at the same year it also decreased significantly 12,13%
The development of Indonesia Composite Index or IHSG
Issue 163 (2017)
funds except primary needs in investing because its developing needs time and process to get a high
on the process,
investment gives a higher return than save the money with a good investment decision. An Investment
decision is a decision to invest on concrete or abstract asset, investment is also called decision of
It is important to establish portfolio when you invest in stock market because it will influence
the risk and the return that can be obtained. The investment risk can be decreased by investment
io forming with diversification is helpful on optimal
one emiten. This
statement agree with Markowitz theory which is said “don’t put all your eggs in one basket”, which
s, do not put all your investments in one security because if the security is collapse,then the entire
investment is also falling. Based on the theory we need portfolio diversification, and portfolio forming
, the investors are hoped be able to maximize the expected return with the
low risk or try to minimize the risk. Tandelilin (2001) argued, there are two portfolio strategies can be
ent strategy in passive
disposed based on the movement of market index with an assumption that market does not do a
mispricing, the goal is to get return as big as market index by minimizing the risk. Meanwhile active
ing information by following the times and price stock movement
on purpose of getting higher return than passive strategy, which the investors are more active on
ness megazine SWA
which provide Indonesia trustworthy companies list with a direct survey toward investor, analyst,
investment manager, and assesment based on transparency, accountability, responsibility,
e based on GCG (Good Corporate Governance).
(IHSG) is one of important instruments on optimal measurement of
portfolio which has function as the indicator between market index and the correlation with asset
010) argued that IHSG is an index which all of stocks registered as component of
calculation. This index describes the market movement commonly so that it is used as measurement to
nce Indonesia Stock
Exchange established on 1984 until 2015. In the 1990s IHSG is valued by Rp. 300,00 until in 2015 it
reached the highest price Rp. 5.523,29 although at the same year it also decreased significantly 12,13%

International Research Journal of Finance and Economics - Issue 163 (2017) 52
This study noted the whole stocks that ever listed on Indonesian Most Trusted Companies
during 2012-2014 based on SWA’s survey and never do corporate action such stock split and reverse
stock based on SWA’s survey. As a candidate determination of calculation this portfolio used Single
Index Model method.
According to Bodie, dkk (2014), using single index model have an accuracy rate that almost
valid, the model gives appropriate indicator to analyze the security. If we compare to the Markowitz
model with covariance matrix will involve risks estimation from a thousand components and may
influences error estimation will get consequence for the portfolio which should be smaller than the
risks estimation and errors estimation from single index mode.
In the concept of Single Index Model, asset return can be influenced only by the return of
market index, the relation between asset returns similar in Markowitz’s model is replaced with a
relation between asset returns and return of market index (Hartono, 2014). Meanwhile in measuring
optimal portfolio we used the best combination between the highest excess return with low risks
(Hartono, 2014). Here’s the concept that shows Single Index Model, on picture 2.
Picture 2. The relation between asset return and market index
Sources: Hartono (2014)
Single Index Model gives an easiness calculation in analyzing portfolio forming. When
choosing stock investment, the investors faced two choices, returns and risks. Single Index Model is
one of method that used to predict the returns and the risks of stock by comparing excess return to beta
(ERB) and Cut-off Rate (Ci).
Procedure of making an optimal Portofolio Picture 3. Research Design
53 International Research Journal of Finance and Economics - Issue 163 (2017)
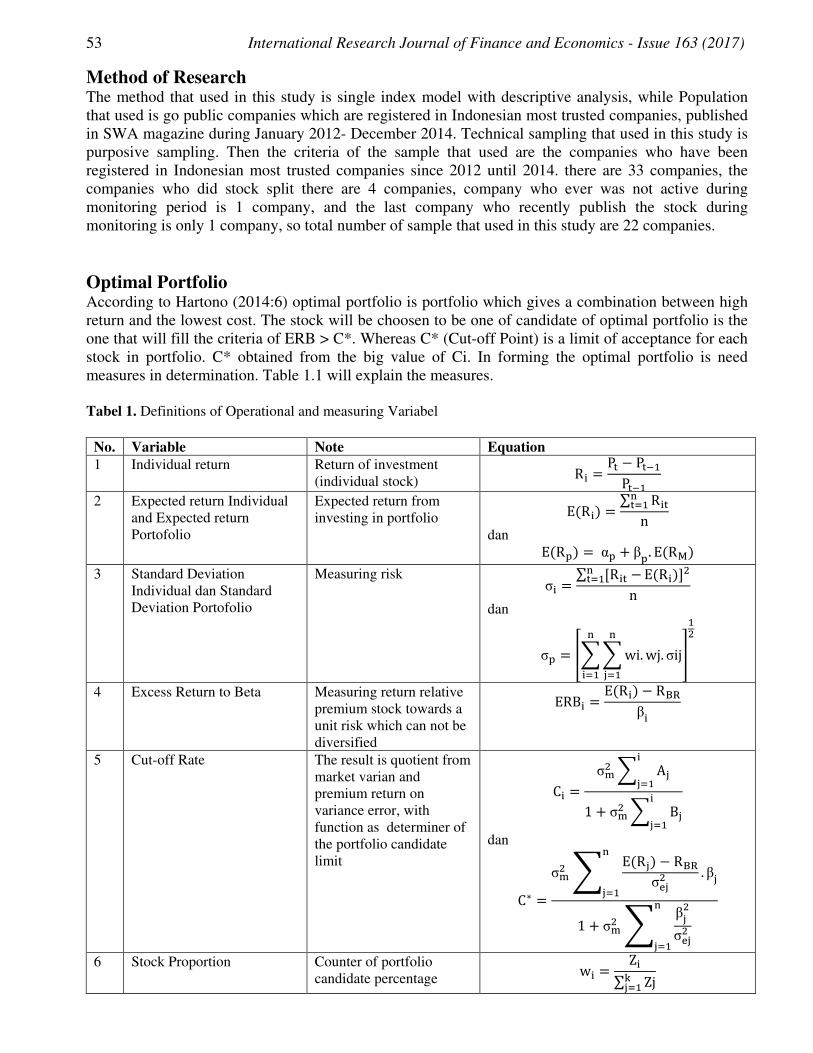
Method of Research The method that used in this study is single index model with descriptive analysis, while Population
that used is go public companies which are registered in Indonesian most trusted companies, published
in SWA magazine during January 2012- December 2014. Technical sampling that used in this study is
purposive sampling. Then the criteria of the sample that used are the companies who have been
registered in Indonesian most trusted companies since 2012 until 2014. there are 33 companies, the
companies who did stock split there are 4 companies, company who ever was not active during
monitoring period is 1 company, and the last company who recently publish the stock during
monitoring is only 1 company, so total number of sample that used in this study are 22 companies.
Optimal Portfolio According to Hartono (2014:6) optimal portfolio is portfolio which gives a combination between high
return and the lowest cost. The stock will be choosen to be one of candidate of optimal portfolio is the
one that will fill the criteria of ERB > C*. Whereas C* (Cut-off Point) is a limit of acceptance for each
stock in portfolio. C* obtained from the big value of Ci. In forming the optimal portfolio is need
measures in determination. Table 1.1 will explain the measures.
Tabel 1. Definitions of Operational and measuring Variabel
No. Variable Note Equation
1 Individual return Return of investment
(individual stock) R� = P� − P���P���
2 Expected return Individual
and Expected return
Portofolio
Expected return from
investing in portfolio E(R�) = ∑ R�� ���n
dan E(R�) = α� + β�. E(R�)
3 Standard Deviation
Individual dan Standard
Deviation Portofolio
Measuring risk σ� = ∑ [R�� − ��� E(R�)]�n
dan
σ� = �� � wi. wj. σij ���
��� �
��
4 Excess Return to Beta Measuring return relative
premium stock towards a
unit risk which can not be
diversified
ERB� = E(R�) − R !β�
5 Cut-off Rate The result is quotient from
market varian and
premium return on
variance error, with
function as determiner of
the portfolio candidate
limit
C� = σ#� � A�����
1 + σ#� � B�����
dan
C∗ =σ#� ' E(R�) − R !
σ(�� . β� ���
1 + σ#� ' β��σ(��
���
6 Stock Proportion Counter of portfolio
candidate percentage w� = Z�∑ Zj*���

International Research Journal of Finance and Economics - Issue 163 (2017) 54
7 Individual Beta and
Portofolio Beta
Systematic risk measuring
of security βi = σim
σ��
dan
βp = � wi. βi ���
8 Alpha Individual and Alpha
Portofolio
The expected value of
return which is
independent towards
market return
αi = E(Ri). βi. E(Rm)
dan
αp = � wi. αi ���
Sources: Hartono (2014), Tandelilin (2010), Bodie dkk (2014).
This study used secondary data and the method of data collecting with documentary method
from idx statictic, yahoo finance, SWA magazine, and sites of the companies. Descriptive analysis is
used in this study. In addition the method of the study is single index model and using toolback on Ms.
Excel.
Result and Discussion Return is the main goal of investors in investing, in stock portfolio is needed an expected return
calculating in order to determine the prospect of investment. Beside the return, the other calculation
like Standard deviation is needed to measure the level of risks in investing. The result of calculating
expected return and each individual risks can be seen on table 2.
Table 2. The result of calculation of standard deviation and expected return
No Nama Perusahaan KODE σi E(Ri)
1 PT Adhi Karya (Persero) Tbk. ADHI 0,1624 0,0359
2 PT Agung Podomoro Land (Persero) Tbk. APLN 0,1066 -0,0067
3 PT Aneka Tambang (Persero) Tbk. ANTM 0,1313 -0,0194
4 PT Bank Central Asia Tbk. BBCA 0,0614 0,0118
5 PT Bank Danamon Indonesia Tbk. BDMN 0,0865 -0,0009
6 PT Bank Mandiri (Persero) Tbk. BMRI 0,0756 0,0101
7 PT Bank Negara Indonesia (Persero) Tbk. BBNI 0,0722 0,0105
8 PT Bank OCBC Tbk. NISP 0,0640 0,0060
9 PT Bank Rakyat Indonesia (Persero) Tbk. BBRI 0,0858 0,0115
10 PT Bumi Resources Minerals Tbk. BRMS 0,2239 -0,0377
11 PT Bumi Resources Tbk. BUMI 0,1926 -0,1116
12 PT Gajah Tunggal Tbk. GJTL 0,1146 -0,0270
13 PT Garuda Indonesia (Persero) Tbk. GIAA 0,0760 0,0016
14 PT Gudang Garam Tbk. GGRM 0,0782 -0,0036
15 PT HM Sampoerna Tbk. HMSP 0,0692 0,0132
16 PT Indo Tambang Raya Megah Tbk. ITMG 0,1104 -0,0320
17 PT Indocement Tunggal Prakasa Tbk. INTP 0,0778 0,0075
18 PT Indofood Sukses Makmur Tbk. INDF 0,0496 0,0093
19 PT Indosat Tbk. ISAT 0,0947 -0,0137
20 PT Jasa Marga (Persero) Tbk. JSMR 0,0545 0,0128
21 PT Panorama Transportasi Tbk. WEHA 0,0854 0,0089
22 PT Perusahaan Gas Negara (Persero) Tbk. PGAS 0,0671 0,0152
23 PT Semen Indonesia (Persero) Tbk. SMGR 0,0724 0,0070
24 PT Tambang Batubara Bukit Asam Tbk. PTBA 0,1096 -0,0148
25 PT Trikomsel Oke Tbk. TRIO 0,1277 0,0024
26 PT Unilever Indonesia Tbk. UNVR 0,0665 0,0128
27 PT United Tractors Tbk. UNTR 0,0865 -0,0152
Sources: The data processed in 2016

55 International Research Journal of Finance and Economics - Issue 163 (2017)
Table 2 explains that from 27 stock samples of companies there are 16 stocks that have positive value
of expected return and 11 stocks have negative value of expected return, it means 11 stocks that have
negative value cannot give return for the portfolio. Although expected return with positive value can
give a return for the portfolio. Individual standard deviation showed in table 2 explains that many
stocks which have the biggest standard deviation, BRMS, has a value 22,4% which means BRMS’s
stock has the higher level of risks among 27 stock samples of companies. It followed by BUMI’s stock
19,4%, ADHI’s stock 16,2%, ANTM’s stock 13,1%, and the last TRIO’s stock 12,8%. The five stocks
are stocks with the biggest risks. Then stock with the lowest standard deviation is INDF with 5% which
means it showed the lowest risk of entire sample.
Alpha, Beta, and Variance Error of Each Stock
Alpha, beta and variance error also have important role in forming optimal portfolio which is alpha is
the part of security return without get any influence from market. Whereas beta that used as a measure
of systematic risks is coefficient of switch measure of Ri as the effect from Rm changes (Tandelilin,
2010), beta is also used as one of variance error. The variance error can be concluded as unique risks, it
can be counted from total risks minus individual beta and multiplied by market risk (Hartono, 2014).
Table 3. Alpha , Beta, Variance Error.
No. Codes αi Βi σεi²
1 ADHI 0,0130 2,8687 0,0151
2 APLN -0,0238 2,1407 0,0051
3 ANTM -0,0332 1,7286 0,0132
4 BBCA 0,0025 1,1589 0,0019
5 BDMN -0,0118 1,3669 0,0049
6 BMRI -0,0030 1,6481 0,0020
7 BBNI -0,0015 1,4946 0,0022
8 NISP 0,0046 0,1704 0,0041
9 BBRI -0,0033 1,8457 0,0027
10 BRMS -0,0650 3,4177 0,0341
11 BUMI -0,1355 3,0005 0,0247
12 GJTL -0,0410 1,7498 0,0089
13 GIAA -0,0004 0,2487 0,0057
14 GGRM -0,0086 0,6184 0,0056
15 HMSP 0,0042 1,1328 0,0030
16 ITMG -0,0325 0,0626 0,0122
17 INTP 0,0008 0,8435 0,0051
18 INDF 0,0043 0,6273 0,0019
19 ISAT -0,0251 1,4293 0,0062
20 JSMR 0,0070 0,7201 0,0023
21 WEHA 0,0039 0,6213 0,0068
22 PGAS 0,0118 0,4297 0,0042
23 SMGR -0,0061 1,6481 0,0015
24 PTBA -0,0200 0,6594 0,0114
25 TRIO -0,0096 1,4956 0,0132
26 UNVR 0,0104 0,2997 0,0043
27 UNTR -0,0223 0,8828 0,0064
Sources: Data processed in 2016
Excess Return to Beta (Erbi) and Cut-Off Point (C*) From (Ci)
Excess return to beta is such an important component in making the optimal portfolio with index single
method. According to Hartono (2014) ERB is a measure of the excess of relative return to one unit of
risks that cannot be divercificated by beta. ERB also shows the value of the assets, it is the relation
between excess returns and risks. Cut-off (Ci) is C value for the first asset that counted from

International Research Journal of Finance and Economics - Issue 163 (2017) 56
accumulation of the A1 values until Ai and B1 until B1 values until B1 (Hartono, 2014). Cut-off point
(C*) is the biggest value of C1 which has fuction as the limit and determining the optimal portfolio
candidates. Cut-off point (C*) explains the determination of the optimal portfolio candidates.
Tabel 4. Determination the candidate of optimum portfolio, ERB>C*
No Code ERBi Ci Ket
1 UNVR 0,02876 0,0008 Portfolio candidate
2 PGAS 0,02575 0,00217 Portfolio candidate
3 JSMR 0,01199 0,00437 Portfolio candidate
4 ADHI 0,01107 0,0067 Portfolio candidate
5 NISP 0,01078 0,00672 Portfolio candidate
6 INDF 0,00822 0,00689 Portfolio candidate
7 HMSP 0,00797 0,0071 Portfolio candidate
8 WEHA 0,00757 0,00711 Portfolio candidate
9 BBCA 0,00657 0,00698 Non portfolio candidate
10 BBNI 0,00422 0,00627 Non portfolio candidate
11 INTP 0,00396 0,00619 Non portfolio candidate
12 BBRI 0,00396 0,00567 Non portfolio candidate
13 BMRI 0,00363 0,00526 Non portfolio candidate
14 SMGR 0,00173 0,00452 Non portfolio candidate
15 TRIO -0,0012 0,00441 Non portfolio candidate
16 BDMN -0,0037 0,00407 Non portfolio candidate
17 APLN -0,0051 0,00325 Non portfolio candidate
18 GIAA -0,0103 0,00323 Non portfolio candidate
19 BRMS -0,0123 0,00272 Non portfolio candidate
20 ISAT -0,0125 0,00225 Non portfolio candidate
21 GGRM -0,0126 0,00215 Non portfolio candidate
22 ANTM -0,0136 0,00183 Non portfolio candidate
23 GJTL -0,0178 0,00123 Non portfolio candidate
24 UNTR -0,0219 0,00099 Non portfolio candidate
25 PTBA -0,0287 0,00089 Non portfolio candidate
26 BUMI -0,0386 -0,0003 Non portfolio candidate
27 ITMG -0,5768 -0,0003 Non portfolio candidate
Sources: Data processed 2016
Based on the table, with the candidates portfolio determination that can seen with measuring
ERBi value and C* 0,000711 as stock candidates determiners where the stocks which has ERBi value
more than C* value, it means that the stock can be clasified as portfolio candidates stock . Based on the
result, there are 8 assets of stocks of portfolio candidates, UNVR, PGAS, JSMR, ADHI, NISP, INDF,
HMSP, WEHA, while the others 19 stocks are not included in portfolio candidates because the values
of ERB > C*. Besides that the values of ERBi are not more than the individual values of Ci. The
previous study from Quranitasari, Rustam and Sulasmiyati (2016), there are 29 stocks of portfolio
candidates in indexs of LQ-45. Then according to Setyoningsih, Suhadak and Topowijoyo (2015),
there are 12 stocks of candidates in 100 compass indexs. The others researchs from Pardosi and
Wijayanto (2015) with Krismeidyan, Topowijoyo and Nuzula (2014), the result of both studies, there
are 7 candidates stocks for the optimal portfolio. On the other side, Khotim, Darminto and Topowijoyo
(2014) explain that there are 6 stocks of candidates in the sri kehati index. The others, Wisambudi,
Sudjana and Topowijoyo (2014) found 4 stocks candidates in the JII index. And the last is the previous
study from Agmiviolya, Dzulkirom and Hidayat (2014) which found 9 stocks of portfolio candidates
on basis food and beverages sectors.
Stocks Proportion of the Candidates Optimal Portfolio
Calculating the proportions of each stock is important things to form portfolio because stocks
proportions affect the level of risks and along total returns that can be gained in the future after the

57
portfolio is formed. In this calculation, only Stock proportion of portfolio candidate which will be
calculated because these stocks will be selected and formed as opti
calculation symbolized by wi with a scale of each stock and zi as a component that included to wi.
Picture 4 shows the percentage of each stocks of optimal portfolio. The percentage is the best optimal
composition based on the ca
affect the performance of portfolio including the returns and the risks.
Sources: Data processed in 2016
The Proportion of Non
The aim of calculating non
that the stocks are selected based on the criteria of ERB>C* have better performance than non
cancidates stocks. The proportion of non
calculated using wi and zi, similar with candidates of optimal portfolio.
Sources: Data processed in 2016
The Result of Optimal Portf
The result of forming portfolio based on selected candidate are sistematic risks, unique risks, total
risks, expected return portfolio, and alpha and beta that used so that help investor calculating returns
and risks. The portfolio should be calculated in order to compare the performance of optimal portfolio,
both candidate optimal portfolio and non
portfolio is formed. In this calculation, only Stock proportion of portfolio candidate which will be
calculated because these stocks will be selected and formed as opti
calculation symbolized by wi with a scale of each stock and zi as a component that included to wi.
Picture 4 shows the percentage of each stocks of optimal portfolio. The percentage is the best optimal
composition based on the ca
affect the performance of portfolio including the returns and the risks.
Sources: Data processed in 2016
Proportion of Non
The aim of calculating non
that the stocks are selected based on the criteria of ERB>C* have better performance than non
cancidates stocks. The proportion of non
calculated using wi and zi, similar with candidates of optimal portfolio.
Sources: Data processed in 2016
Result of Optimal Portf
The result of forming portfolio based on selected candidate are sistematic risks, unique risks, total
risks, expected return portfolio, and alpha and beta that used so that help investor calculating returns
ks. The portfolio should be calculated in order to compare the performance of optimal portfolio,
both candidate optimal portfolio and non
International Research Journal of Finance and Economics
portfolio is formed. In this calculation, only Stock proportion of portfolio candidate which will be
calculated because these stocks will be selected and formed as opti
calculation symbolized by wi with a scale of each stock and zi as a component that included to wi.
Picture 4 shows the percentage of each stocks of optimal portfolio. The percentage is the best optimal
composition based on the calculation of single index model. If the percentage is changed then it will
affect the performance of portfolio including the returns and the risks.
Picture 4.
Sources: Data processed in 2016
Proportion of Non-Candidates Portfolio
The aim of calculating non-stock candidates is to compare the optimal portfolio performance as prove
that the stocks are selected based on the criteria of ERB>C* have better performance than non
cancidates stocks. The proportion of non
calculated using wi and zi, similar with candidates of optimal portfolio.
Picture 5. The presentages of non
Sources: Data processed in 2016
Result of Optimal Portfolio, Non
The result of forming portfolio based on selected candidate are sistematic risks, unique risks, total
risks, expected return portfolio, and alpha and beta that used so that help investor calculating returns
ks. The portfolio should be calculated in order to compare the performance of optimal portfolio,
both candidate optimal portfolio and non
JSMR
24%
ADHI
11%
ANTM
5%
GJTL
9%
UNTR
7%
PTBA
4%
International Research Journal of Finance and Economics
portfolio is formed. In this calculation, only Stock proportion of portfolio candidate which will be
calculated because these stocks will be selected and formed as opti
calculation symbolized by wi with a scale of each stock and zi as a component that included to wi.
Picture 4 shows the percentage of each stocks of optimal portfolio. The percentage is the best optimal
lculation of single index model. If the percentage is changed then it will
affect the performance of portfolio including the returns and the risks.
Picture 4. The presentages of optimal portfolio
Candidates Portfolio
stock candidates is to compare the optimal portfolio performance as prove
that the stocks are selected based on the criteria of ERB>C* have better performance than non
cancidates stocks. The proportion of non-candidate portfolio uses the best composition that is
calculated using wi and zi, similar with candidates of optimal portfolio.
The presentages of non
olio, Non-Candidate Portfolio and Samples
The result of forming portfolio based on selected candidate are sistematic risks, unique risks, total
risks, expected return portfolio, and alpha and beta that used so that help investor calculating returns
ks. The portfolio should be calculated in order to compare the performance of optimal portfolio,
both candidate optimal portfolio and non-candidate optimal portfolio are using single index model, the
JSMR
24%
NISP
2%
INDF
5%
HMSP
5%
GGRM
4%
ANTM
5%
PTBA
4%
BUMI
10%
ITMG
6%
International Research Journal of Finance and Economics
portfolio is formed. In this calculation, only Stock proportion of portfolio candidate which will be
calculated because these stocks will be selected and formed as opti
calculation symbolized by wi with a scale of each stock and zi as a component that included to wi.
Picture 4 shows the percentage of each stocks of optimal portfolio. The percentage is the best optimal
lculation of single index model. If the percentage is changed then it will
affect the performance of portfolio including the returns and the risks.
The presentages of optimal portfolio
Candidates Portfolio
stock candidates is to compare the optimal portfolio performance as prove
that the stocks are selected based on the criteria of ERB>C* have better performance than non
candidate portfolio uses the best composition that is
calculated using wi and zi, similar with candidates of optimal portfolio.
The presentages of non-candidate optimal portfolio
Candidate Portfolio and Samples
The result of forming portfolio based on selected candidate are sistematic risks, unique risks, total
risks, expected return portfolio, and alpha and beta that used so that help investor calculating returns
ks. The portfolio should be calculated in order to compare the performance of optimal portfolio,
candidate optimal portfolio are using single index model, the
HMSP
5%
WEHA
1%
BBCA
1%
BBNI
4%
INTP
1%
BRMS
4%
ISAT
8%
ITMG
International Research Journal of Finance and Economics
portfolio is formed. In this calculation, only Stock proportion of portfolio candidate which will be
calculated because these stocks will be selected and formed as opti
calculation symbolized by wi with a scale of each stock and zi as a component that included to wi.
Picture 4 shows the percentage of each stocks of optimal portfolio. The percentage is the best optimal
lculation of single index model. If the percentage is changed then it will
affect the performance of portfolio including the returns and the risks.
The presentages of optimal portfolio
stock candidates is to compare the optimal portfolio performance as prove
that the stocks are selected based on the criteria of ERB>C* have better performance than non
candidate portfolio uses the best composition that is
calculated using wi and zi, similar with candidates of optimal portfolio.
candidate optimal portfolio
Candidate Portfolio and Samples
The result of forming portfolio based on selected candidate are sistematic risks, unique risks, total
risks, expected return portfolio, and alpha and beta that used so that help investor calculating returns
ks. The portfolio should be calculated in order to compare the performance of optimal portfolio,
candidate optimal portfolio are using single index model, the
UNVR
23%
PGAS
29%
INTP
1%
BBRI
4%BMRI
5%
SMGR
11%
BDMN
APLN
9%GIAA
1%BRMS
4%
International Research Journal of Finance and Economics
portfolio is formed. In this calculation, only Stock proportion of portfolio candidate which will be
calculated because these stocks will be selected and formed as optimal portfolio. This Stocks
calculation symbolized by wi with a scale of each stock and zi as a component that included to wi.
Picture 4 shows the percentage of each stocks of optimal portfolio. The percentage is the best optimal
lculation of single index model. If the percentage is changed then it will
affect the performance of portfolio including the returns and the risks.
The presentages of optimal portfolio
stock candidates is to compare the optimal portfolio performance as prove
that the stocks are selected based on the criteria of ERB>C* have better performance than non
candidate portfolio uses the best composition that is
calculated using wi and zi, similar with candidates of optimal portfolio.
candidate optimal portfolio
Candidate Portfolio and Samples
The result of forming portfolio based on selected candidate are sistematic risks, unique risks, total
risks, expected return portfolio, and alpha and beta that used so that help investor calculating returns
ks. The portfolio should be calculated in order to compare the performance of optimal portfolio,
candidate optimal portfolio are using single index model, the
PGAS
29%
SMGR
11%
TRIO
2%BDMN
6%
APLN
9%
International Research Journal of Finance and Economics - Issue 163 (2017)
portfolio is formed. In this calculation, only Stock proportion of portfolio candidate which will be
mal portfolio. This Stocks
calculation symbolized by wi with a scale of each stock and zi as a component that included to wi.
Picture 4 shows the percentage of each stocks of optimal portfolio. The percentage is the best optimal
lculation of single index model. If the percentage is changed then it will
stock candidates is to compare the optimal portfolio performance as prove
that the stocks are selected based on the criteria of ERB>C* have better performance than non
candidate portfolio uses the best composition that is
The result of forming portfolio based on selected candidate are sistematic risks, unique risks, total
risks, expected return portfolio, and alpha and beta that used so that help investor calculating returns
ks. The portfolio should be calculated in order to compare the performance of optimal portfolio,
candidate optimal portfolio are using single index model, the
Issue 163 (2017)
portfolio is formed. In this calculation, only Stock proportion of portfolio candidate which will be
mal portfolio. This Stocks
calculation symbolized by wi with a scale of each stock and zi as a component that included to wi.
Picture 4 shows the percentage of each stocks of optimal portfolio. The percentage is the best optimal
lculation of single index model. If the percentage is changed then it will
stock candidates is to compare the optimal portfolio performance as prove
that the stocks are selected based on the criteria of ERB>C* have better performance than non
candidate portfolio uses the best composition that is
The result of forming portfolio based on selected candidate are sistematic risks, unique risks, total
risks, expected return portfolio, and alpha and beta that used so that help investor calculating returns
ks. The portfolio should be calculated in order to compare the performance of optimal portfolio,
candidate optimal portfolio are using single index model, the

International Research Journal of Finance and Economics - Issue 163 (2017) 58
stocks are registered in IMTC. The portfolio establishment used the same proportions for each
individuals stock. IMTC get the same proportion, 1/27 stock or 0,037 or 3,7%, it can be seen on table
5.
Tabel 5. Result of portfolio forming with single index model and samples
Portfolio Result Optimal SIM Non Candidate Entirement
Alpha Portfolio (αp) 0,0095 -0,0321 -0,0141
Beta Portoflio (βp) 0,7877 1,6215 1,2707
Systematic Risk (βp²σm²) 0,1% 0,4% 0,2%
Unique Risk (σεp²) 0,1% 0,1% 0,0%
Risk Total (σp) 4,2% 6,5% 5,0%
Expected Return Portofolio E(Rp) 1,6% -1,9% -0,4%
Sources: Data processed in 2016
There are different results between optimal portfolio and portfolio that formed by IMTC on
both portfolio and market. Portfolio that formed by single index model gives a high return and low risk
on the composition. Different with non-candidate portfolio and IMTC, the risks that should be
guaranteed by optimal portfolio is 4,2% equals with market risk. Whereas the result of the risks for
whole stocks of IMTC is 5% and the high risks guaranteed by non-candidate portfolio is 6,5%. The
return produced from optimal portfolio 1,6% is bigger than from market 0,8%. Whereas IMTC gives
return -0,4%. Non-candidate portfolio give a return -1,9% means that it gives the biggest low cost than
others. From the result it can be concluded that optimal portfolio is most profitable, whose calculation
based on ERB>C*.
Conclusion Generally, the performance of optimal portfolio is formed better than market, non-candidate portfolio,
even IMTC. There are 8 stocks of candidate optimal portfolio, UNVR (23%), PGAS (29%), JSMR
(24%), ADHI (11%), NISP (2%), INDF (5%), HMSP (5%), WEHA (1%). It is hoped that the
proportions of funds realizing the performance of optimal portfolio. 8 stocks from Indonesian Most
Trusted Companies are the best candidates from 27 stocks of IMTC.
References [1] Agmiviolya, Youvia Clara., M. Dzulkirom AR, dan R. Rustam Hidayat. 2014.”Analisis
ortofolio Dengan Single index model Dalam Upaya Meminimalisir Risiko Investasi di Pasar
Modal (Studi pada perusahaan sektor Food and Beverages yang listing di Bursa Efek Indonesia
periode 2011-2013)”. Jurnal Administrasi Bisnis (JAB). (Vol.13 No.1). Hlm. 1-8. Universitas
Brawijaya.
[2] Anoraga, Pandji., dan Puji pakarti.2008.”Pengantar Pasar Modal”.Jakarta:Rineka Cipta
[3] Anwar, Jusuf.2005.”Pasar Modal Sebagai Sarana Pembiayaan dan Sarana
Investasi”.Bandung:PT Alumni.
[4] Bodie, Zvie., Alex Kane, dan Alan J.Marcus.”Manajemen Portofolio dan Investasi”. Jakarta:
Salemba Empat.
[5] Cahyaningdyah, Dwi., dan Yustieana Dian Ressany.2012.”Pengaruh Kebijakan Manajemen
Keuangan Terhadap Nilai Perusahaan”. Jurnal Dinamika Manajemen (JDM). (Vol.3 No.1).
Hlm.20-28. Universitas Negeri Semarang.
[6] Ehrhardt, Michael., and Eugene F. Brigham.2011. Financial Management: Theory and
Practicee. USA: South Western Cengage Learning.
[7] Finance.yahoo.com.”Historical Price”. (diakses pada November 2015)
59 International Research Journal of Finance and Economics - Issue 163 (2017)
[8] Hartono, Jogiyanto.2003.”Teori Portofolio dan Analisis Investasi”. Yogyakarta:BPFE.
[9] -----.2014.”Teori dan Praktik Portofolio dengan Excel”. Jakarta: Salemba Empat.
[10] Idx.co.id.”Milestones”. (diakses pada Maret 2016)
[11] Khotim, Achmad., Darminto., Topowijoyo. 2014.”Analisis Pembentukan Portofolio Optimal
Dengan Menggunakan Model Indeks Tunggal dan Stochastic Dominance Dalam Pengambilan
Keputusan Investasi (Studi pada saham-saham Indeks Sri-Kehati yang Listing di Bursa Efek
Indonesia periode 2010-2013)”. Jurnal Administrasi Bisnis (JAB). (Vol.11 No.1). Hlm. 1-11.
Universitas Brawijaya.
[12] Krismeidyan, Michael., Topowijoyo., Nila Firdausi Nuzula. 2014.”Penentuan Portofolio Saham
yang Optimal Dengan Single index model Sebagai Salah Satu Alat Pengambilan Keputusan
Investasi Saham (Studi pada Perusahaan yang Terdaftar di BEI periode 2011-2013)”. Jurnal
Administrasi Bisnis (JAB). (Vol.17 No.1). Hlm.1-9. Universitas Brawijaya.
[13] La, le., dan Bin Mei.2014.”Portfolio diversification through timber real estate investment
trusts: A Cointegration Analysis”.Forest Policy and Economics”. (Vol.50). Hlm.269-274.
University of Georgia.
[14] Pardosi, Bernanto, Andhi Wijayanto. 2015. ”Analisis Perbedaan Return dan Risiko Saham
Portofolio Optimal Dengan Bukan Portofolio Optimal”. Management Analysis Journal (MAJ).
(Vol.4 No.1). Hlm.1-9. Universitas Negeri Semarang.
[15] Quranitasari, dkk.2016.”Analisis Pembentukan Portofolio Optimal dalam Meminimalkan
Tingkat Risiko Investasi Dengan Menggunakan Model Indeks Tunggal”.Jurnal Administrasi
Bisnis (JAB). (Vol.31 No.1). Hlm.140-149. Universitas Brawijaya.
[16] Setyoningsih, Agustin Tri., Suhadak., Topowijoyo. 2015.”Analisis Portofolio Optimal Dengan
Single index model Untuk Meminimumkan Risiko Bagi Investor di Bursa Efek Indonesia (Studi
pada saham indeks Kompas100 periode Februari 2010-Juli 2014)”. Jurnal Administrasi Bisnis
(JAB). (Vol.23 No.1). Hlm.1-9. Universitas Brawijaya.
[17] Tandelilin, Eduardus.2010.”Analisis Investasi dan Manajemen Portofolio”. Yogyakarta:BPFE.
[18] Wahyono.2011.”Strategi Pemasaran Daerah Sebagai Upaya Meningkatkan Peluang Investasi di
Kota Semarang”. Jurnal Dinamika Manajemen (JDM). (Vol.2 No.1). Hlm.92-100. Universitas
Negeri Semarang
[19] Wisambudi, M. Bagus., Nengah Sudjana., dan Topowijoyo. 2014.”Analisis Pembentukan
Portofolio Optimal Dengan Menggunakan Model Indeks Tunggal (Studi Pada Saham Jakarta
Islamic Index (JII) Periode 2011-2013”. Jurnal Administrasi Bisnis (JAB). (Vol.12 No.1).
Hlm.1-6. Universitas Brawijaya.