Embed Size (px)
Citation preview
1
The analysis of European lacquer: optimization of
thermochemolysis temperature of natural resins
Louise Decq1,2
, Frederic Lynen2, Michael Schilling
3, Wim Fremout
1, Vincent
Cattersel4, Delphine Steyaert
5, Charles Indekeu
4, Emile Van Binnebeke
5 and
Steven Saverwyns1
1 Royal Institute for Cultural Heritage (KIK-IRPA), Department Laboratories, Jubelpark 1,
1000 Brussels (Belgium). 2 Ghent University, Department of Organic and Macromolecular Chemistry, Krijgslaan
281, 9000 Ghent (Belgium). 3
Getty Conservation Institute, 1200 Getty Center Drive, Suite 700, Los Angeles, CA
90049-1684 (USA).
4 University of Antwerp, Conservation Studies – Heritage & Sustainability, Blindestraat 9,
2000 Antwerp (Belgium). 5 Royal Museums of Art and History (RMAH), Jubelpark 10, 1000 Brussels (Belgium)
* Corresponding author’s email address, phone: [email protected] /
[email protected], +32-2-7396711
Keywords: European lacquer; THM-GC/MS; temperature optimisation;
thermochemolysis; AMDIS; sandarac; mastic; colophony; Congo copal, pyrolysis
with on-line methylation
Acknowledgments
The authors would like to express their deep appreciation to Jonas Veenhoven (University of Antwerp, Antwerp,
Belgium) and Henk van Keulen (Rijksdienst Cultureel Erfgoed, Amsterdam, the Netherlands) for the interesting
discussions and insights on this research. The authors would like to express their gratitude to Hans Beeckman
(Royal Museum for Middle Africa – KMMA, Tervuren, Belgium), Viviane Leyman (Botanic Garden Meise,
Meise, Belgium), Annegret Fuhrman (Hochschule für Bildende Künste, Dresden, Germany) for providing us with
natural resins from their collections. The authors appreciate the statistical support of Jonas Tundo, data analyst at
Artycs, Brussels. The research leading to these results has been subsidized by the Belgian Science Policy through
the contract no. BR/121/A3/ELINC within the BRAIN project “European Lacquer in Context” (ELinC).
Abstract
In order to optimize chromatographic analysis of European lacquer,
thermochemolysis temperature was evaluated for the analysis of natural resins. Five
main ingredients of lacquer were studied: sandarac, mastic, colophony, Manila copal
and Congo copal. For each, five temperature programs were tested: four fixed
temperatures (350°C, 480°C, 550°C, 650°C) and one ultrafast thermal desorption
(UFD), in which the temperature rises from 350 to 660°C in one minute. In total,
integrated signal of 27 molecules partially characterizing the five resins were
monitored to compare the different methods. A compromise between detection of
compounds released at low temperatures and compounds formed at high temperatures
was searched. 650°C is too high for both groups, 350°C showed best for the first,
550°C for the second. Fixed temperatures of 480°C or UFD proved to show the best
consensus in order to detect most marker molecules. UFD was slightly better for the
molecules released at low temperatures, while 480°C showed best compounds formed
at high temperatures.
2
1. Introduction
Oriental lacquers are natural polymers produced from the exudates of three
species from the Anacardiaceae family growing in different regions of Asia[1–3].
They are the object of a tradition of thousands of years of craftsmanship, admired for
their durability and gloss. With the rise of overseas trade in the 17th
century, oriental
lacquerware arrives on a more regular basis in Europe. It was scares, valuable and not
well understood, but the impact of its arrival was considerable and long-lasting: loved
for their exclusivity and beauty, these glossy luxury objects came into vogue and
brought a new, exotic taste to the Old World [4]. Soon, local production of furniture
and small objects was inspired by the success of imported oriental lacquer. Lacking
the raw materials and the technology of the East, European craftsman imitated Asian
lacquer using their own skills and materials familiar to them. The flourishing
worldwide trade brought them a wide range of possible ingredients to choose from,
including mastic, sandarac, shellac, amber, copals, gum elemi and benzoin. It is
remarkable how close the imitation’s surfaces can resemble their oriental examples. A
new tradition was born.
European lacquers, are complex, multi-layered coatings, mainly composed of
various natural resins. Depending on the recipes, oils, gums, pigments and other
ingredients can be added. Unlike Asian lacquer, different resins were usually
combined to achieve the best coating properties, such as gloss, color, applicability,
hardness and flexibility[5,6]. Hard resins such as copal and sandarac could for
example be mixed with gum elemi as plasticizer[6]. If resins in themself are diverse in
constitution, European lacquers are even more. A wide range of different molecules is
expected to be present, including terpenoids, fatty acids, alcohols and hydrocarbons.
Moreover, the polylabdanoid matrix in many of them as well as compositional
evolution during preparation and aging can make them hard to dissolve in standard
solvents, making the analysis of European lacquer challenging.
In order to know more about the technology and ingredients used, subsequent
lacquer layers have to be sampled and analyzed separately, at the same time
minimizing the damage to the object. This results in many samples of very limited
size. For these small samples of diverse constitution, thermochemolysis gas
chromatography–mass spectrometry, also called thermally assisted hydrolysis and
methylation gas chromatography-mass spectrometry (THM-GC/MS), was chosen as
principle technique, efficiently returning a maximum of information on the different
ingredients with the use of only very limited sample amount. Thermochemolysis-
GC/MS is today one of the most important techniques to analyze resinous materials in
general [7–19], and it is a powerful method to analyze European lacquer as well
[20,21].
Prior to gas chromatography, thermochemolysis reduces the sample to less polar,
alkylated and smaller molecular weight products. Since the introduction of pyrolysis
GC–MS with in situ derivatisation, tetramethyl ammonium hydroxide (TMAH) has
been the preferred alkylation reagent for the analysis of modern natural resins [13].
Methylation of acidic and hydroxylic groups in combination with transesterification
of esters and cleavage reactions can take place [19,22]. Thermochemolysis has been
applied in many set-ups, with different alkylation reagents and at different
3
temperatures; all three factors may have important influence on the cleavage and
methylation obtained. The choice for TMAH during this project has been motivated
by the maximal interchange of results and findings with other institutes.
When optimizing the thermochemolysis for European lacquer ingredients, it is the
aim to obtain chromatograms that are most characteristic for the compounds present,
so that most can be known about how the lacquer was made. Molecules have to be
cleaved and methylated to enable analysis, but more extensive fragmentation or
modification hamper the interpretation and are therefore to be avoided. Unwanted side
reactions, including isomerization, elimination and nitrogen incorporation, have been
frequently observed in thermochemolysis with TMAH as alkylation reagent
[14,19,23–29], with solvent type, excess of TMAH and temperature being identified
as influencing factors. Water as solvent for the TMAH is suggested to perform better
than methanol but limited solubility of resins and a long drying time are important
counter arguments [26,27,30]. Excess of TMAH favors side reactions by increasing
both alkalinity and availability of reactive nitrogen groups in the reaction[26–28].
Most clearly, however, high thermochemolysis temperature has been proven to
enhance the occurrence of unwanted side products [14,19,25,26].
Therefore, a main focus point in the method optimization for European lacquer
was the choice of the temperature program to be used for hydrolysis and methylation
of the resin sample in presence of TMAH. For resinous materials in general, an
optimized temperature is not agreed upon. Temperatures of 600-650°C or higher have
been reported frequently [9–12,17,31,24,32,33]. Also a double shot method
combining a lower temperature thermal desorption at 250 or 300 °C, followed by high
temperature pyrolysis (600 or 610°C) has been used successfully by some authors
[7,18,34]; 550°C is also applied for varnish and lacquer analysis[3,8,35]. For the
study of amber, thermochemolysis temperatures up to 650°C are applied [17,36], but
after optimization study by Anderson[14], 480°C is frequently preferred, sometimes
completed with an additional analysis at 300°C to show occluded compounds only
[13,15,16,37,38]. Steadily increasing temperatures have been used rarely (200-700°C)
[21].
With this test, an optimal thermochemolysis temperature is searched for five
terpenoid natural resins, all important ingredients in the production of 17th
, 18th
and
19th
Century European lacquer: sandarac, mastic, colophony, Manila copal and Congo
copal. While terpenoids exhibit enormous structural diversity and chemical
complexity, they are all united by a common biosynthetic origin [39]. They again can
be subdivided into mono-, sesqui-, di- and triterpenes, depending on the number of
five carbon building blocks (isopentenyl diphosphate and dimethylallyl diphosphate)
which were involved during biosynthesis. Mono- and sesquiterpenes are usually
volatile [39]. They can have important influence during the production and
application of the lacquer, but, due to their volatile nature and polymerisation, they
are unlikely to survive aging in detectable amounts [12]. Therefore, in this study focus
is given to the detection of diterpenes (as present in sandarac, colophony, Manila
copal and Congo copal) and triterpenes (as present in mastic) and their polymers.
The five selected resins were analyzed at 5 different temperature programs. For
four programs a fixed oven temperature was chosen: 350, 480, 550 and 650°C. The
fifth program, called ultrafast thermal desorption (UFD) consisted of a rising
4
temperature, climbing from 350°C to 660°C in one minute. Each resin-temperature
combination was repeated three times.
2. Materials and techniques
2.1. Analytical reagents and reference materials
The reagents used to prepare samples and facilitate hydrolysis and methylation
were tetramethylammonium hydroxide 25wt.% in methanol (Sigma Aldrich) and
absolute methanol for HPLC analysis (Acros organics, 99.99%). Retention index
calibration was performed using Supelco C7-C30 saturated alkanes standard
(1000µg/ml in hexane).
Since contamination and misidentification easily happen with resins [12,40–45]
resin samples from historical, non-commercial origin were chosen. All five have been
harvested at least 100 years ago, and unavoidably underwent natural aging during
their long storage. The sandarac and mastic samples date from the 18th
century,
conserved in the well-studied Vigani’s cabinet in Cambridge Queens’ College (resp.
resins “Sandaracha” A/26 and “Mastiche” A/11 [46,47]). The colophony and Manila
copal were provided by Botanic Garden Meise (resp. “Pinus taeda L.” BR-CBC-
02205 originally from the collection of Ambroise Delacre, pharmacist at Brussels, ca.
1880 and “Resina Copal Manilla” BR-CBC01525, originally from the collection of
Carl von Martius (1794-1868)); Congo copal was provided by the Royal Museum for
Middle Africa in Tervuren (“Copaifera demeusei” 202 100/30).
2.2. Preparation of samples for thermochemolysis-GC/MS
Several grains of each sample were ground, and a small amount of 200-400µg
was transferred to a glass vial. 80-160 µl 2.5wt% TMAH in methanol solution was
added, relative to the weight of the sample. This solution also contained 100ng/µl
heptadecanoic acid and 5ng/µl anthracene in solution, both as internal standard. The
content of the vial was well mixed to homogenize, and 2µl was transferred to the
stainless steel pyrolysis cup (Frontier Lab Eco-cup LF) with auto-Rx glass fiber disc.
For the fixed temperatures, the cup was pyrolyzed at given temperatures for 0.2
minutes, and left in the oven when chromatographical analysis started. For ultrafast
desorption, the cup was heated during one minute, and ejected a few seconds later,
before chromatographical analysis was started.
Efforts were taken to minimize the time span between preparation of the mixture
with TMAH and the last analysis of the resin. The series of five temperatures for a
resin were repeated two times, adding up to 15 analyses per resin. It resulted in a time
span of 19 hours on average.
2.3. Instrumentation on-line thermochemolysis-GC/MS
5
Thermochemolysis was carried out in a Frontier Lab Multi-Shot Pyrolyzer
(3030D), in a helium atmosphere, fed with an autoshot sampler AS-1020ET. The
interface and the injector of the chromatographic system were kept at 300°C, but the
analytical column was directly coupled to the pyrolyzer via a custom made split
device (split ratio 20), minimizing dead volume and improving the signal1. For the
chromatographic separations, a TraceGC gas chromatograph (Thermo), hyphenated
with a PolarisQ Ion Trap mass spectrometer (Thermo), was used. Separations were
accomplished on a SLB-5ms capillary column (Supelco, 20m x 0.18mm i.d. x 0.18µm
film thickness) applying following temperature program: initially the oven
temperature was maintained at 35°C for 1 min after pyrolysis. Next, a 10°C/min
gradient was applied until 240°C; finally the column was heated to a temperature of
315°C at a rate of 6°C/min; this temperature was maintained during 5 min. Carrier gas
was helium at a constant flow of 0.9 mL/min. The MS transfer line temperature was
kept at 290°C. Ionization was carried out in the ion volume of the ion trap mass
spectrometer under the standard EI positive mode at 70 eV. The mass spectrometer
was scanned in the 35–650 amu range, with a cycle time of 0.59 s.
2.4. Data treatment of pyrograms
Integrated signal of selected markers in the pyrograms was calculated with the
AMDIS software (Automated Mass spectral Deconvolution and Identification
System,v.2.70). AMDIS computes the integrated signal value as the area under the
component after deconvolution[48]; This calculation avoids signal from background
and adjacent peaks. The chromatograms were not normalized. Kováts retention
indices were calculated by AMDIS, based on the separation of a C7-C30 alkanes
mixture. Therefore, retention indices higher than 3000 could not be determined. Mass
spectral identification was performed using the NIST 11 Mass Spectral Library, using
spectra provided by other institutions (via shared libraries of RAdICAL/ESCAPE and
Users’ Group for Mass Spectrometry and Chromatography MaSC) and published
reference data.
3. Results and discussion
Molecules produced during thermochemolysis depend on the compounds present
in the sample and their relation to the polymeric network or matrix. Some will be
released at low temperatures; others are only formed at high temperatures, or may be
destroyed or altered at higher temperatures. Therefore, it is expected that marker
compounds react differently on different temperature programs.
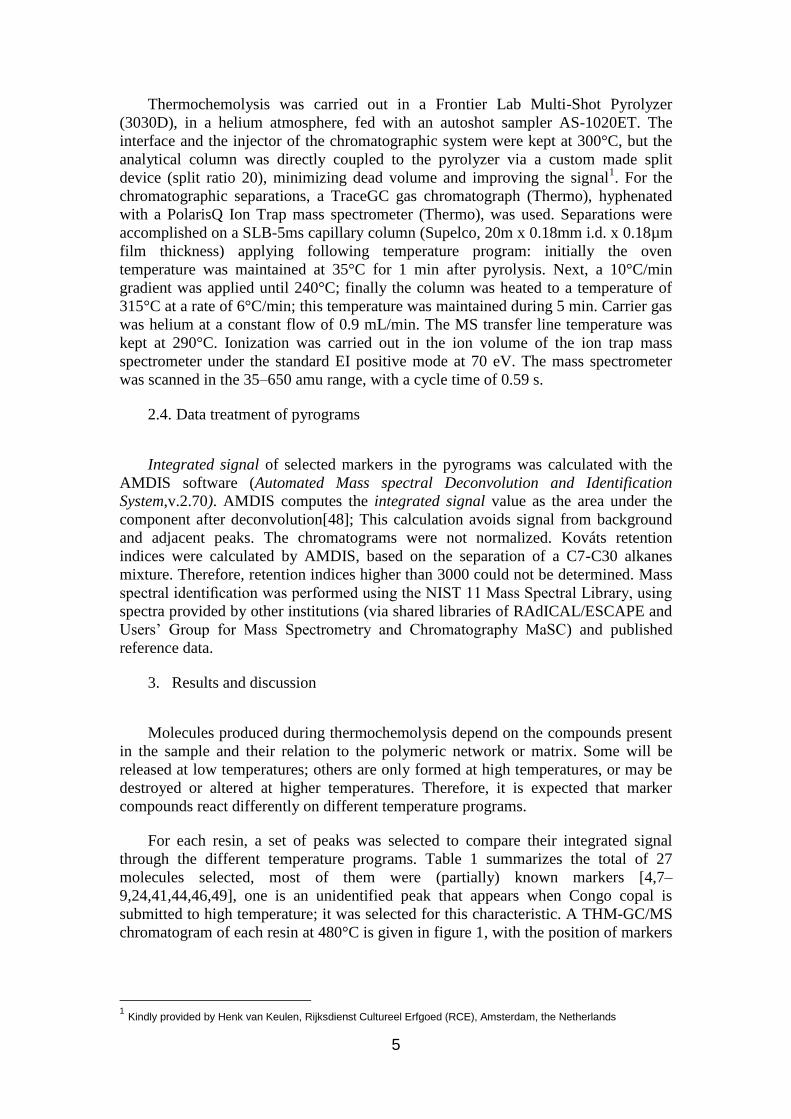
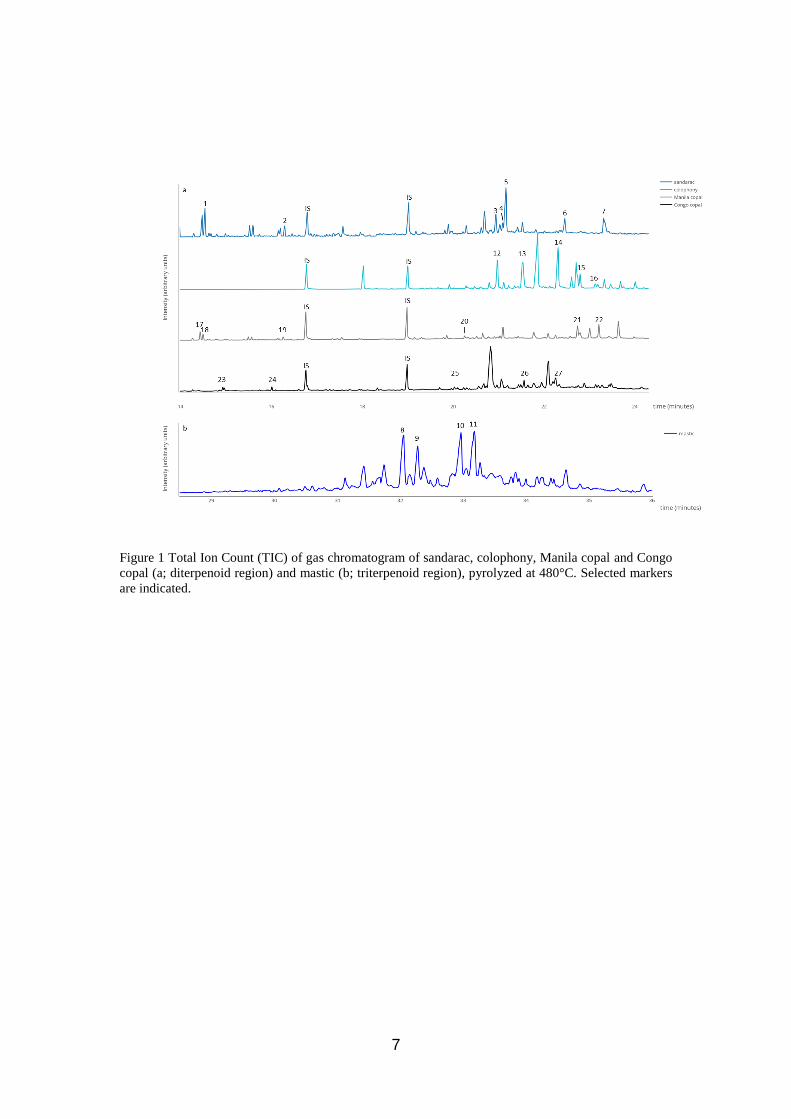
For each resin, a set of peaks was selected to compare their integrated signal
through the different temperature programs. Table 1 summarizes the total of 27
molecules selected, most of them were (partially) known markers [4,7–
9,24,41,44,46,49], one is an unidentified peak that appears when Congo copal is
submitted to high temperature; it was selected for this characteristic. A THM-GC/MS
chromatogram of each resin at 480°C is given in figure 1, with the position of markers
1 Kindly provided by Henk van Keulen, Rijksdienst Cultureel Erfgoed (RCE), Amsterdam, the Netherlands
6
followed indicated. The mean and standard deviation of three measurements for all
selected molecules are visualized in figure 22.
Some fragments formed during pyrolysis, are not characteristic for only one resin.
Both sandarac and Manila copal contain a polycommunic acid polymer, and this
familiarity results in some common peaks [7,9,18,24,44]. However, being trapped in a
structure that is chemically not identical, their properties regarding pyrolysis
temperature may differ. Therefore, polycommunic acid markers “b1” and “b4”
(named by Van den Berg [18], with structures suggested there; polycommunic acid
pyrolysates extensively studied in amber class 1 [15,38,50]; markers nr. 1, 2, 18, 19)
are followed separately for both resins.
Table 1. Overview of resin samples used and the markers selected of each. Retention index (completed
with published values by van Keulen) and retention time are given, as well as main molecular
fragmentation.
Resin
(current
plant name)
Marker
number
Markers Retention
Index
(retention
time)
Retention
Index
(Van
Keulen
2015 [8])
Characteristic EI
fragment ions
(m/z)
Sandarac
(Tetraclinis articulata
(Vahl)
Mast.)
1
2 3
4
5 6
7
Poly communic marker b1
Poly communic marker b4 Ferruginol methoxy
Trans-communic acid methyl ester
Sandaracopimaric acid methyl ester Methyl-hydroxy sandaracopimaric acid
Sandaracopimaric acid, 12 acetoxy
1601 (14.52)
1758 (16.29) 2239 (20.93)
2257 (21.09)
2265 (21.15) 2413 (22.45)
2511 (23.3)
1614
1774 2246
-
2300 2414
2507
161-177-236
173-188-248 189-285-300
105-121-241-316
121-181-257-316 121-346
121-299-314
Mastic
(Pistacia
lentiscus L.)
8 9
10
11
Mastic compound 5 Mastic component
Moronic acid ME
Oleanolic acid ME
- (32.04) - (32.27)
- (32.96)
- (33.17)
- -
3505
3588
219 203-219-262
189-249-468
203-262-468
Colophony
(Pinus taeda
L.)
12
13
14
15 16
Pimaric acid ME
Isopimaric acid ME
Abietic acid ME
Tetradehydroabietic acid 7 methoxy ME Methyl 12-methoxyabieta8,11,13-trien-
20oate
2244 (20.97)
2307 (21.53)
2397 (22.31)
2451 (22.79) 2488 (23.13)
-
-
-
- -
121-257-316
241-257-316
241-256-316
227-267-342 269-344
Manila
copal
(Agathis
dammara (Lamb.)
Rich. &
A.Rich.)
17
18 19
20 21
22
Marker 4
Poly communic marker b1 Poly communic marker b4
16.17-bisnordehydroabietic acid ME Agathic acid isomer DME1
Agathic acid isomer DME2
1593 (14.44)
1598 (14.50) 1756 (16.26)
2163 (20.26) 2445 (22.74)
2498 (23.21)
-
1614 1774
- -
-
145-160-188-220
161-177-236 173-188-248
211-271 189
121-175-201-288
Congo copal
(Guibourtia
demeusei
(Harms) J.Leonard)
23 24
25
26 27
Poly ozic marker C1 Poly ozic marker C2
Copal unknown
copalic/entcopalic acid “copal 11”
1637 (14.93) 1733 (16.01)
2141 (20.04)
2315(21.56) 2395 (22.26)
1678 -
-
2330 -
161-177-236 173-189-248
107-177-305
81-244-303 223-305-318
2 Due to one failed analysis, only two measurements for the combination 480°C - mastic could be used.
7
Figure 1 Total Ion Count (TIC) of gas chromatogram of sandarac, colophony, Manila copal and Congo
copal (a; diterpenoid region) and mastic (b; triterpenoid region), pyrolyzed at 480°C. Selected markers
are indicated.
8
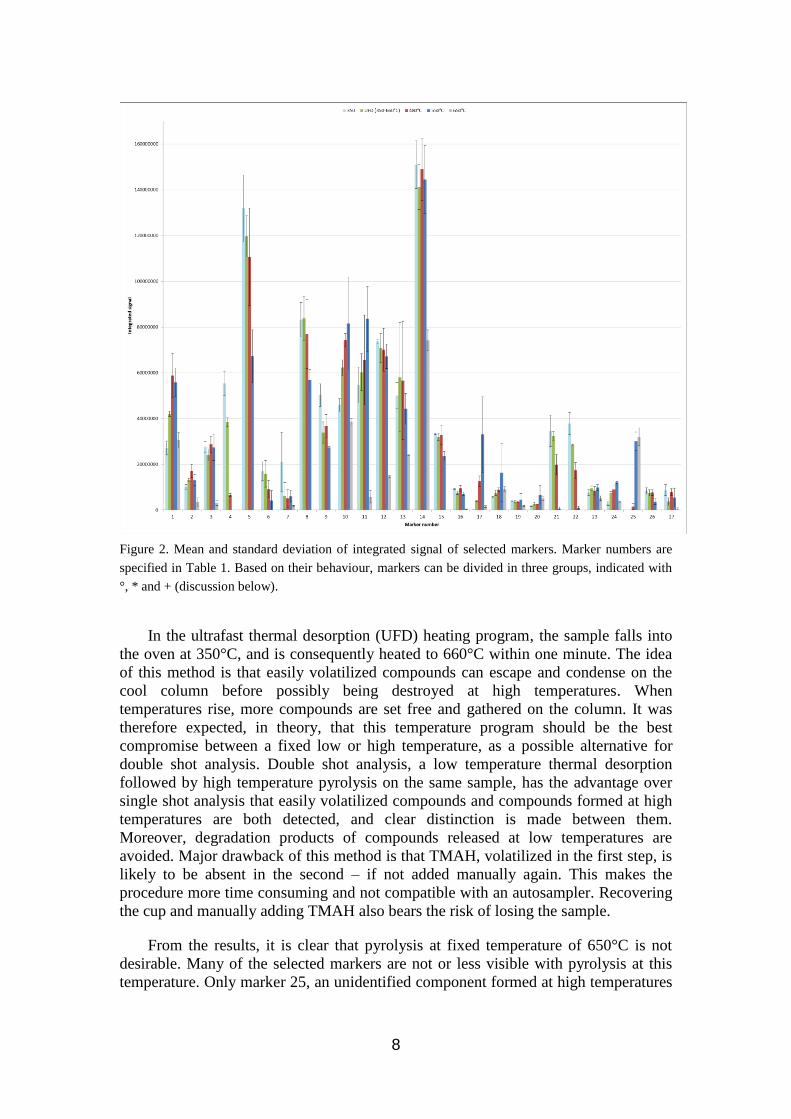
Figure 2. Mean and standard deviation of integrated signal of selected markers. Marker numbers are
specified in Table 1. Based on their behaviour, markers can be divided in three groups, indicated with
°, * and + (discussion below).
In the ultrafast thermal desorption (UFD) heating program, the sample falls into
the oven at 350°C, and is consequently heated to 660°C within one minute. The idea
of this method is that easily volatilized compounds can escape and condense on the
cool column before possibly being destroyed at high temperatures. When
temperatures rise, more compounds are set free and gathered on the column. It was
therefore expected, in theory, that this temperature program should be the best
compromise between a fixed low or high temperature, as a possible alternative for
double shot analysis. Double shot analysis, a low temperature thermal desorption
followed by high temperature pyrolysis on the same sample, has the advantage over
single shot analysis that easily volatilized compounds and compounds formed at high
temperatures are both detected, and clear distinction is made between them.
Moreover, degradation products of compounds released at low temperatures are
avoided. Major drawback of this method is that TMAH, volatilized in the first step, is
likely to be absent in the second – if not added manually again. This makes the
procedure more time consuming and not compatible with an autosampler. Recovering
the cup and manually adding TMAH also bears the risk of losing the sample.
From the results, it is clear that pyrolysis at fixed temperature of 650°C is not
desirable. Many of the selected markers are not or less visible with pyrolysis at this
temperature. Only marker 25, an unidentified component formed at high temperatures
9
in Congo copal, is best detected at 650°C. This temperature program will be left out in
the further discussion.
When comparing the intensity of a peak at the remaining temperature programs,
three groups can be discerned. A first group of markers (2, 3, 12, 13, 14, 16, 19, 23,
27, indicated with ° in figure 2) perform well at all temperature programs (UFD, 350,
480, 550°C). Differences between them are minimal. A second group of markers (4,
5, 6, 7, 8, 9, 15, 21, 22, 26, indicated with * in figure 2) shows a slight or important
trend in favor of low temperatures; these tend to decrease in intensity or disappear at
high temperatures. For these molecules, a temperature of 350°C, is preferable. As
expected, UFD performs also very well for these molecules. It seems that those
molecules are indeed condensed on the column before higher temperature could
destroy them. 480°C is a less performing option, but can be esteemed acceptable.
A third group comprises molecules that slightly or explicitly tend to be more
present when high temperatures are applied (1, 10, 11, 17, 18, 20, 24, 25, indicated
with + in figure 2). These molecules are best detected with a fixed pyrolysis
temperature of 550°C. A fixed temperature of 480°C performs well. Remarkably,
UFD does not reach the expectations: for these molecules, UFD shows an overall
lower integrated signal than when 480°C pyrolysis temperature was applied. Several
explanations could be valid and may enforce each other. Possibly, the rise in
temperature is so steep that some molecules are still present in the pyrolysis oven and
get partially destroyed when the temperature of 660°C is reached. However, some
limited tests with an adapted UFD, that rise in one minute to only 550°C, keeping this
temperature for another minute, did not perform better. Some molecules may not be
formed because their precursors left the oven earlier, or other side reactions may have
taken place. The TMAH, abundantly present at the start of the temperature rise, might
be volatilized and evacuated together with the first compounds formed, being absent
for the compounds formed at higher temperatures.
The analysis of all results shows that both 480°C and UFD are valuable pyrolysis
temperature programs, returning a significant signal for a whole range of marker
molecules. In general, differences between these two options are limited; UFD
performs better for heat sensitive compounds that are released at low temperatures
(e.g. 350°C), whereas 480°C is generally a better choice for compounds formed at
high temperatures, best seen at 550°C. Repeated measures could not reveal significant
differences between variances obtained with temperature treatments (ANOVA).
During data analysis, the question rose whether variability depended on the
temperature program chosen.
4. Conclusion
The experiment illustrates the important influence of thermochemolysis
temperature on the integrated signal of several resin markers. The optimal temperature
depends on the molecules of interest. However, fixed temperatures of 550°C and
650°C are not ideal as consensus temperature to detect most markers. 350°C could be
10
considered, but a fixed temperature of 480°C or UFD give best results in detecting the
whole series of marker molecules.
5. References
1. J. C. Frade, M. I. Ribeiro, J. Graça, and J. Rodrigues, Anal. Bioanal. Chem. 395,
2167 (2009).
2. T. Honda, R. Lu, N. Kitano, Y. Kamiya, and T. Miyakoshi, J. Appl. Polym. Sci.
118, 897 (2010).
3. A. Heginbotham and M. R. Schilling, in East Asian Lacquer: Material Culture,
Science and Conservation, edited by S. Rivers, R. Faulkner, and B. Pretzel
(Archetype Publications, London, 2011), pp. 92–106.
4. J. Koller, K. Walch, and U. Baumer, in Japanische Und Europäische Lackarbeiten:
Rezeption, Adaption, Restaurierung / Japanese and European Lacquerware:
Adoption, Adaptation, Conservation, edited by M. Kühlenthal (Bayerisches
Landesamt für Denkmalpflege, Munich, 2000), pp. 537–559.
5. V. Cattersel, L. Decq, C. Indekeu, E. Van Binnebeke, D. Steyaert, W. Fremout, and
S. Saverwyns, in Furniture Finishes, Miko Vasques Dias (Stichting Ebenist,
Amsterdam, 2015), pp. 56–62.
6. M. Webb, Lacquer: Technology and Conservation: A Comprehensive Guide to the
Technology and Conservation of Asian and European Lacquer (Butterworth-
Heinemann, Oxford, 2000).
7. K. J. van den Berg, J. van der Horst, and J. J. Boon, in Preprints ICOM Committee
ICOM for Conservation 12th Triennial Meeting, Lyon, France, 29 Aug-3 September
1999, Vol. II (James & James, London, Lyon, 1999), pp. 855–861.
8. H. van Keulen, in Furniture Finishes, Miko Vasques Dias (Stichting Ebenist,
Amsterdam, 2015), pp. 134–141.
9. J. Romero-Noguera, I. Martín-Sánchez, M. T. Doménech-Carbó, L. Osete-Cortina,
M. M. López-Miras, and F. Bolívar-Galiano, Int. Biodeter. Biodegr. 90, 99 (2014).
10. M. Regert, T. Devise, A.-S. Le Hô, and A. Rougeulle, Archaeometry 50, 668
(2008).
11. A.-S. Le Hô, M. Regert, O. Marescot, C. Duhamel, J. Langlois, T. Miyakoshi, C.
Genty, and M. Sablier, Anal. Chim. Acta 710, 9 (2012).
12. I. D. van der Werf, K. J. van den Berg, S. Schmitt, and J. J. Boon, Stud. Conserv.
45, 1 (2000).
13. J. Poulin and K. Helwig, Org. Geochem. 44, 37 (2012).
14. K. B. Anderson and R. E. Winans, Anal. Chem. 63, 2901 (1991).
15. K. B. Anderson, R. E. Winans, and R. E. Botto, Org. Geochem. 18, 829 (1992).
16. P. S. Bray and K. B. Anderson, Geochem. T. 9, 3 (2008).
17. M. Havelcová, V. Machovič, M. Linhartová, L. Lapčák, A. Přichystal, and Z.
Dvořák, Microchem. J. 128, 153 (2016).
18. K. J. van den Berg, J. Ossebaar, and H. van Keulen, in Proceedings of Art2002,
7th International Conference on Non-Destructive Testing and Microanalysis for the
Diagnostics and Conservation of the Cultural and Environmental Heritage, 2-6 June
2002, Antwerp, Belgium, edited by R. Van Grieken, K. Janssens, L. Van’t Dack, and
G. Meersman (Antwerp, Belgium, 2002).
19. F. Shadkami and R. Helleur, J. Anal. Appl. Pyrol. 89, 2 (2010).
20. Anne-Solenn Le Hô, Céline Daher, Ludovic Bellot-Gurlet, Yannick
Vandenberghe, Jean Bleton, Myrtho Bonnin, Léa Drieu, Juliette Langlois, Céline
11
Paris, Marc-André Paulin, Anne Forray-Carlier, and Anne Jacquin, ICOM-CC
Conference Paper (2014).
21. A. Heginbotham, H. Khanjian, R. Rivenc, and M. Schilling, in 15th Triennial
Conference New Delhi, 22-26 September 2008: Preprints, ICOM Committee for
Conservation (Allied Publishers, New Delhi, 2008), pp. 608–616.
22. J. W. de Leeuw and M. Baas, J. Anal. Appl. Pyrol. 26, 175 (1993).
23. S. Watts and E. R. de la Rie, Stud. Conserv. 47, 257 (2002).
24. D. Scalarone, M. Lazzari, and O. Chiantore, J. Anal. Appl. Pyrol. 115 (2003).
25. K. Sutherland, J. Chromatogr. A 1149, 30 (2007).
26. A. Piccirillo, D. Scalarone, and O. Chiantore, Journal of Analytical and Applied
Pyrolysis 74, 33 (2005).
27. J. D. J. van den Berg and J. J. Boon, Journal of Analytical and Applied Pyrolysis
61, 45 (2001).
28. D. Jun-Kai, J. Wei, Z. Tian-Zhi, S. Ming, Y. Xiao-Guang, and F. Chui-Chang,
Journal of Analytical and Applied Pyrolysis 42, 1 (1997).
29. I. Pastorova, K. J. van den Berg, J. J. Boon, and J. W. Verhoeven, J. Anal. Appl.
Pyrol. 43, 41 (1997).
30. J. M. Challinor, J. Anal. Appl. Pyrol. 61, 3 (2001).
31. C. Riedo, D. Scalarone, and O. Chiantore, Analytical and Bioanalytical Chemistry
401, 1761 (2011).
32. D. Scalarone, M. Lazzari, and O. Chiantore, J. Anal. Appl. Pyrol. 64, 345 (2002).
33. M. T. Doménech-Carbó, J. de la Cruz-Cañizares, L. Osete-Cortina, A. Doménech-
Carbó, and H. David, Int. J. Mass Spectrom. 284, 81 (2009).
34. S. Prati, S. Smith, and G. Chiavari, Chromatographia 59, 227 (2004).
35. S. Saverwyns, M. Vermeulen, and E. Van Binnebeke, E-Preservation Science 11,
64 (2014).
36. I. D. van der Werf, D. Fico, G. E. De Benedetto, and L. Sabbatini, Microchem. J.
125, 85 (2016).
37. K. B. Anderson and R. E. Botto, Org. Geochem. 20, 1027 (1993).
38. K. B. Anderson, Geochem. Trans. 7, (2006).
39. J. H. Langenheim, Plant Resins: Chemistry, Evolution, Ecology, and Ethnobotany
(Timber Press, Portland, Or, 2003).
40. R. J. Stacey, C. R. Cartwright, and C. McEwan, Archaeometry 48, 323 (2006).
41. J. Koller, U. Baumer, E. Schmid, and D. Grosser, in Baroque and Rococo
Lacquers (Bayerischen Landesamtes für Denkmalpflege, Munich, 1997), pp. 379–
394.
42. F. Piozzi, S. Passannanti, M. Paternostro, and G. Nasini, Phytochemistry 13, 2231
(1974).
43. U. Baumer and P. Dietemann, Anal. Bioanal. Chem. 397, 1363 (2010).
44. J. S. Mills and R. White, Stud. Conserv. 22, 12 (1977).
45. G. Nasini and F. Piozzi, Phytochemistry 20, 514 (1981).
46. G. Steigenberger, The Vigani Cabinet – Analysis of Historical Resinous Materials
by Gas Chromatography - Mass Spectrometry and Infrared Spectroscopy - PhD
Dissertation (the Department of Mathematics and Natural Sciences at the Technical
University Dresden, 2013).
47. G. Steigenberger and C. Herm, Anal Bioanal Chem 401, 1771 (2011).
48. (n.d.).
49. G. Chiavari, S. Montalbani, and V. Otero, Rapid Commun. Mass Sp. 22, 3711
(2008).
50. K. B. Anderson and W. Bray, Archaeometry 48, 633 (2006).

12


![Rock the [nail product]Vote! · 2019-02-05 · favorite polish/nail color 1. OPI Products: Nail Lacquer 2. Essie: Nail Lacquer collection 3. China Glaze: Nail Lacquer 4. CND: Nail](https://img.pdfslide.us/doc/110x75/5f1ec1d9d40da55eed45b4f4/rock-the-nail-productvote-2019-02-05-favorite-polishnail-color-1-opi-products.jpg)