Embed Size (px)
Citation preview

IJER © Serials Publications12(5), 2015: 1671-1692
ISSN: 0972-9380
THE ANALYSIS OF APPLICATION OFBALANCED SCORECARD AS BENCHMARKPERFORMANCE MEASUREMENT
Abstract: This study aims to determine the performance of PT. BRI (Persero), Tbk. KCPLemhannas when measured using a 4 (four) perspective on the Balanced Scorecard. Thisstudy uses data source in the form of primary data and secondary data compiled from PT.BRI (Persero), Tbk. KCP National Resilience Institute. Secondary data were obtained fromthe Annual Financial Report of PT. BRI (Persero), Tbk. KCP National Resilience Institutein 2010, 2011, and 2012. While the primary data in the form of results of customerquestionnaires and interviewing employees. Mechanical questionnaires conducted with theaim of obtaining data on customer satisfaction, while interviewing employees to assessemployee satisfaction. The method used is descriptive analysis method. The results of researchon performance assessment based on the financial perspective, the financial ratios used bythe results of the study have an average ROA of 3.81%, ROA with an average of 66.53%and LDR had an average of 77.07%. In the Customer Perspective, market share has anaverage of 11.75%, customer acquisition has an average of 3.15%, customer satisfactionoccupies very good criteria, and profitability of customers has an average 55.67%. InternalBusiness Processes perspective, innovation and operating Processes Company occupy criteriafairly well. In the perspective of growth and learning, employee turnover showed a verygood performance, employee productivity and employee satisfaction is good enough to obtaina good criteria. From the overall perspective, the value of the performance of PT BRI (Persero)Tbk. KCP Lemhannas occupy the criteria of “good” with an average value of 4 (four).
Keywords: Balanced Scorecard, Performance Management, Performance
INTRODUCTION
An organization that is formed with a specific purpose must have the means andstrategies to realize the goal of which is the ideals of the organization. Ideally, anorganization is required to have a vision which is realized with some missions in orderto achieve the main objective of the organization. And that the organization is stillrunning on the track, not to deviate from the original purpose of the organization,and can develop executable business venture, it would require plans that are strategic.
* STIE Indonesia Jakarta, E-mail: [email protected]** STIE Indonesia Jakarta

1672 Dade Nurdiniah and Resti Dian Ramadhani
Departing from the importance of the vision, mission, and strategic planning ofan organization, we need a method or system as a means of measuring the performanceof the organization in achieving goals. The purpose of performance measurement isnot just to find out how the performance management within the organization, butwas able to create a better performance. The main objective is to implement aperformance measurement system to improve the performance of the organization sothat it can better serve customers, employees, owners, and stakeholders. Performancemeasurement is one way to assess the achievement of which has been obtained by anorganization. If the performance measurement system implemented well, and able torepresent the state of the overall organization, then the organization will be able tosee and evaluate the achievement that has been achieved during run time, so that theorganization can determine the right strategy further in the future.
Today many organizations are still using traditional performance measurementsystems that measure performance is more focused on the financial sector. Traditionalperformance measurement is still not enough to look at the overall performance of anorganization. Performance measurement used an organization should not only focuson the financial sector alone, but non-financial sector also needs to be assessed andevaluated for the advancement and achievement of the objectives of the organizationin the long term. Traditional performance measurement systems only measure theperformance of an organization at a given time. By measuring the performance of thebroader through financial and non-financial approach then the organization will beable to take the right decision for their survival in the long term.
Act No. 10 of 1998 states that banking is a business entity collecting funds fromthe public in the form of savings and channel them to the public in the form of loans orother forms in order to improve the living standards of many people. Under the Act,the structure of banking in Indonesia consists of Commercial Banks and Rural Banks(BPR). The main difference is the commercial and rural banks in terms of its operationalactivities. BPR cannot create demand deposits and has the range, as well as operationalactivities are limited. Furthermore, in their business activities embraced dual banksystem, which commercial banks can carry out banking operations and conventionalor based on sharia principles. Meanwhile, the principle of BPR activities may berestricted to only conduct conventional banking operations or based on shariaprinciples. The development of the banking industry and competition increasinglyfierce requires each bank to have a proper strategy in achieving competitive advantage.In this case, each of the banking industry should be able to develop its business, oneway to have a good strategy and excel through design strategies. To make a gooddesign strategy, the necessary management tools in a comprehensive strategy thatwould see perspectives that exist within an enterprise.
One of the concepts of management strategy is the implementation of a method ormeans of performance measurement, namely the Balanced Scorecard. BalancedScorecard is a performance measurement concept introduced by Robert S.Kaplan(Professor of Accounting at the Harvard Business School) and David P. Norton

The Analysis of Application of Balanced Scorecard as Benchmark Performance... 1673
(president of Renaissance Solutions, Inc.). The balanced scorecard concept is the conceptof performance measurement to assess the performance of the organization from fourperspectives: financial perspective (financial perspective), the perspective of thecustomer / consumer (customer perspective), internal business process perspective(internal business process perspective), learning and growth perspective (learning andgrowth perspective). By using the concept of balanced scorecard performancemeasurement in an organization, the performance measurement will be shown to bemore comprehensive because of the balanced scorecard is not only emphasizes thefinancial perspective, but also non-financial perspective.
Basically, the Balanced Scorecard development, both in the private and publicsectors is intended to provide satisfaction for the customer. The difference can be seenfrom the purpose and the interested parties. Implementation of Balanced Scorecard inthe business sector is intended to increase competition (competitiveness), while forthe public sector more emphasis on the value of the mission and achieving the (mission,value, effectiveness). From the financial aspect, the business sector will give priorityto profitability; growth and market share while the public sector for the purpose ofmeasuring productivity and efficiency levels.
LITERATURE
1. Performance and Performance Measurement
Prior to the definition of performance measurement, then we must first know themeaning of the performance (performance) itself, according Mahsun (2009: 25) of avariety of literature in general is abstracted performance is an overview of the level ofachievement of the implementation of an activity / program / policies in realizing thetarget, purpose, mission and vision of the organization as stated in the strategicplanning of an organization. The term is often used to refer to the performance orachievements of the success rate of individuals and groups of individuals.
According to Robertson in Mahsun (2009: 25), performance measurement is definedas a process of assessing the progress of work towards the goals and objectives thathave been defined previously, including information on the efficiency, the use ofresources in producing goods and services, quality of goods and services, comparisonof the results of activities with the target, and the effectiveness of actions in achievingits objectives. Meanwhile, according to Lohman in Mahsun (2009: 25) performancemeasurement is an assessment activity achievement of specific targets derived fromthe strategic objectives of the organization.
2. Objectives and Benefits of Performance Measurement
Performance measurement is an important part of the process of management control,both public and private organizations. Objective measurements / assessment ofperformance by Mahmudi (2010: 14) are as follows:

1674 Dade Nurdiniah and Resti Dian Ramadhani
a. Knowing the level of achievement of organizational goals
b. Provides a means of learning employee
c. Improve the performance of the next period
d. Provide systematic consideration in making the decision to grant reward andpunishment
e. Motivating employees
According Yuwono, et.all (2008: 29) the benefits of a good performancemeasurement system is:
a. Track performance against customer expectations that will bring thecompany closer to its customers and make all the people in the organizationwho are involved in efforts to provide customer satisfaction.
b. Motivating employees to perform services as a chain of internal customersand suppliers
c. Identify various waste as well as encourage efforts towards waste reduction is
d. Make strategic objectives which are usually still vague to be more concrete soas to accelerate the process of organizational learning
e. Building consensus to make a change by giving “reward” for the expectedbehaviour.
3. BALANCED SCORECARD (BSC)
3.1. Definition of Balanced Scorecard
Definition of balanced scorecard can also be taken based on the words containedhim, that is “balanced” and “scorecard”. Scorecard or score card can be interpretedas cards used to record the performance. To record the results of a performancewould require the measurement process. The measurement results will be used as ameans of control. Balanced or unbalanced means there is a balance between themany elements that are used in the measurement of performance. The balanceincludes:
a. the balance between the size of the non-financial and financial size,
b. balance between internal measure of critical business processes, innovation,and learning and growth, and external measures for shareholders andcustomers,
c. the balance between the size of the outcomes that are the result of pastperformance and the size of that drive future performance,
d. the balance between size and the outcome is objective over the subjectivecharacter size on performance drivers.

The Analysis of Application of Balanced Scorecard as Benchmark Performance... 1675
According to Kaplan and Norton (1996:18) in the initial discovery, “Balancedscorecard is a new framework for integrating various sizes derived from the company’sstrategy. In addition to the size of future performance, balanced scorecard alsointroduced future financial performance drivers which include customer perspective,internal business processes, and learning and growth “.
3.2. Concept and Development of the Balanced Scorecard
The emergence of the concept of balanced scorecard beginning of the study is conductedby David P. Norton and Robert S. Kaplan in 1990 on “Measuring OrganizationalPerformance In The Future”. The study was conducted because of the realization thatfinancial performance measure is not a measure of performance that is adequate tomeasure the performance of a company. According to estimates, about 60% of themeasures used for decision-making, resource allocation, and performance managementare still the size of a financial nature. Financial measures are still used despite muchcriticism of its use (Niven 2003: 7).
The study conducted by Kaplan and Norton in 1990 were then published in anarticle entitled “The Balanced Scorecard-Measured that Drive Performance” in theHarvard Business Review magazine issue of January-February 1992. The results ofthe study concluded that in order to measure the performance of companies in futurefront required a comprehensive measurement system that includes four perspectives,namely financial, customer, internal business processes, and learning and growth.The measurement system by Kaplan and Norton balanced scorecard called. Later in1996 Kaplan and Norton developed the balanced scorecard concept they’ve built.Results of a study they did conclude that the balanced scorecard can be developed asa strategic management system, and not just a performance measurement system.From then on it appeared term strategy map (a map of the strategy).
3.3. Perspective Balanced Scorecard
There are four perspectives that are used in a balanced scorecard, namely financial(financial), customers (customer), internal business processes (internal business process),and learning and growth (learning and growth). The fourth perspective should providea balance between short-term goals and long-term, between the desired results and thefactors driving the achievement of these results, and between hard objective measuresand subjective measures soft. Here below will be described each of these perspectives.
(a) Financial Perspective
Financial perspective is in balanced scorecard to describe the success of the privatesector in the financial aspect, what should be disclosed to shareholders. Financialperformance measures provide an overview of the impact of the economic measuresthat have been taken in the past. This size gives clues as to whether the company’sstrategy to contribute to the improvement of corporate profits. Financial goals usually

1676 Dade Nurdiniah and Resti Dian Ramadhani
associated with profitability as measured by operating income, return on capitalemployed (ROCE), economic value added (economic value added), sales growth, orthe creation of cash flows.
(b) Customer Perspective
Customer perspective in balanced scorecard describing what we must show to thecustomers in order to realize our vision. In this perspective, the identified customerand market segments will be entered into the company and performance measureswithin the segment. The measures used in this perspective consist of the size of genericand specific size. Generic measures used consisted of customer satisfaction, customerretention, customer acquisition, customer profitability, and market share in targetedsegments. Specific size used depends on the value proposition that will be given tothe customer. Generic measures mentioned above can be grouped in a chain of cause-effect relationships.
(c) Internal Business Process Perspective
Internal business process perspective in balanced scorecard describing what businessprocesses must we know well to please shareholders and our customers. In thisperspective identified the critical internal processes that must be controlled well bythe company. The identified business process should allow the company to providevalue proposition to customers and meet the expectations of financial benefit toshareholders. Internal business process perspective reveals fundamental differencesin performance measures between the traditional approach and the balanced scorecardapproach. Traditional approaches attempt to monitor and improve business processesthat exist today and use a measure that focuses on improving existing businessprocesses while the balanced scorecard approach will identify new processes to becontrolled companies in order to meet various customer and financial objectives.
(d) Learning and Growth perspective
Learn and growth perspective in balanced scorecard describing how we maintain ourability to change and improve ourselves to realize our vision. In this perspectiveidentified enterprise infrastructure to be built in order to create growth and increaselong-term performance. The three main sources of learning and growth of the companycome from the people, systems, and procedures of the company. According to Kaplanand Norton (1996: 127) there are three main categories for learning and growthperspective, the capability of personnel, information systems capabilities, as well asmotivation, empowerment, and alignment.
3.4. Benefits and Balanced Scorecard Advantages
According to Kaplan and Norton (1996: 10) the balanced scorecard as a strategicmanagement system can provide the framework to translate organizational strategies

The Analysis of Application of Balanced Scorecard as Benchmark Performance... 1677
into operational terms and can be implemented. Balanced scorecard can be used toproduce a variety of important management processes, namely:
a. Clarify and translate vision and strategy. Balanced scorecard can clarify itsvision and strategy for achieving this vision and to produce a consensus of allmembers of the organization to the vision and strategy that has been set.
b. Communicating and linking the various strategic objectives and measures.Balanced scorecard is useful to communicate the company’s strategythroughout the organization, aligning personal objectives and the strategypart of the organization, and the link between remuneration and performancemeasures.
c. Plan, set goals, and aligning the various initiatives strategies. Balancedscorecard is useful to associate various strategic objectives with long-termgoals and annual budgets and identify and align strategic initiative.
d. Improve feedback and strategic learning. Balanced scorecard is useful tocarry out a strategic review of periodic and systematic as well as gettingfeedback needed to learn and improve strategies.
RESEARCH METHODS
1. Location
The location of the study was conducted at PT Bank Rakyat Indonesia (Persero) Tbk.Branch Office of the National Resilience Institute, Kebon Sirih No. 24, Central Jakarta.
2. Strategies and Methods
Research strategies used were of analytical strategy, where research a need to be solvedanalytically, which is done by breaking the problem into sub-problems (variables).The method used is descriptive analysis method, which aims to make a systematicdescription, factual, and accurate about the facts and the nature of the population or aparticular area.
3. Population and Sample
Use of the population in this study includes the population to measure companyperformance through customer satisfaction. To measure customer satisfaction, thepopulation used are all customers of Bank BRI KCP National Resilience Institute, wherethe number of customers to the month of March 2013 was approximately 4,020customers.
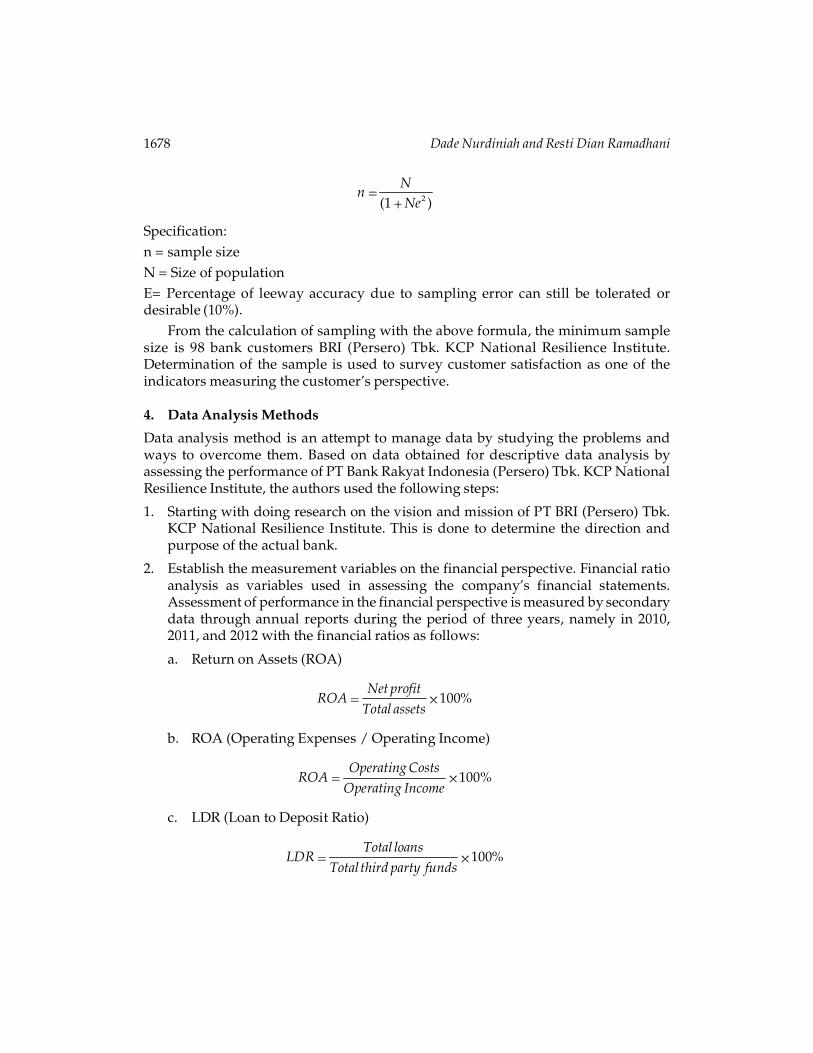
The sampling technique used is the technique of sample selection probabilities,namely the selection of a random sample (simple random sampling), which gives equalopportunity and are not limited to each element of the population to be selected as asample. The formula determines the desired sample using Slovin formula as follows:
1678 Dade Nurdiniah and Resti Dian Ramadhani
2(1 )N
nNe
Specification:n = sample sizeN = Size of populationE= Percentage of leeway accuracy due to sampling error can still be tolerated ordesirable (10%).
From the calculation of sampling with the above formula, the minimum samplesize is 98 bank customers BRI (Persero) Tbk. KCP National Resilience Institute.Determination of the sample is used to survey customer satisfaction as one of theindicators measuring the customer’s perspective.
4. Data Analysis Methods
Data analysis method is an attempt to manage data by studying the problems andways to overcome them. Based on data obtained for descriptive data analysis byassessing the performance of PT Bank Rakyat Indonesia (Persero) Tbk. KCP NationalResilience Institute, the authors used the following steps:
1. Starting with doing research on the vision and mission of PT BRI (Persero) Tbk.KCP National Resilience Institute. This is done to determine the direction andpurpose of the actual bank.
2. Establish the measurement variables on the financial perspective. Financial ratioanalysis as variables used in assessing the company’s financial statements.Assessment of performance in the financial perspective is measured by secondarydata through annual reports during the period of three years, namely in 2010,2011, and 2012 with the financial ratios as follows:
a. Return on Assets (ROA)
100%Net profit
ROATotal assets
b. ROA (Operating Expenses / Operating Income)
100%Operating Costs
ROAOperating Income
c. LDR (Loan to Deposit Ratio)
100%Total loans
LDRTotal third party funds

The Analysis of Application of Balanced Scorecard as Benchmark Performance... 1679
3. Establish the measurement variables at the customer’s perspective as follows:
a. Market Share (Market Share)
Market share is calculated by comparing the total assets of the company withtotal assets of the company’s competitors.
b. Customer Acquisition (Customer Equitation)
100%NewCustomer NumbersYear
CACustomer NumbersYear
c. Customer satisfaction levels are measured using a questionnaire that wasdistributed to subscribers or customers of Bank BRI KCP Lemhannas by usingsamples
d. Customer profitability is calculated by the following formula:
100%Net profit before tax
Customer profitabilityNet sales
4. Establish the measurement variables at the internal process perspective.
a. The level of innovation is obtained by analysing each of the products /services into new and innovation in the enterprise
b. process is obtained by using the following formula:
min100%
Ad istrativeCostsAETR
Total Revenue
5. Set the measurement variables in learning and growth perspective.a. Employee Turnover
100%Number of EmployeesQuit
EmployeeTurnoverTotal Employees
b. Employee Productivity
The level of employee productivity is the yardstick to measure how much thelevel of productivity of employees in a given period. To measure the level ofemployee productivity, use the following formula:
100%Net profit before tax
Productivity of employeesNumber of employeesoverall
c. Employee Satisfaction
On the measurement of employee satisfaction and motivation done byconducting interviews on all employees regarding hygiene factors (extrinsic)
1680 Dade Nurdiniah and Resti Dian Ramadhani
that supervision, salary and facilities, company policies, working conditionsand relationships with superiors and co-workers. The Motivational factors(intrinsic): achievement, recognition, responsibility and growth. These factorsspelled out in beads of interview questions
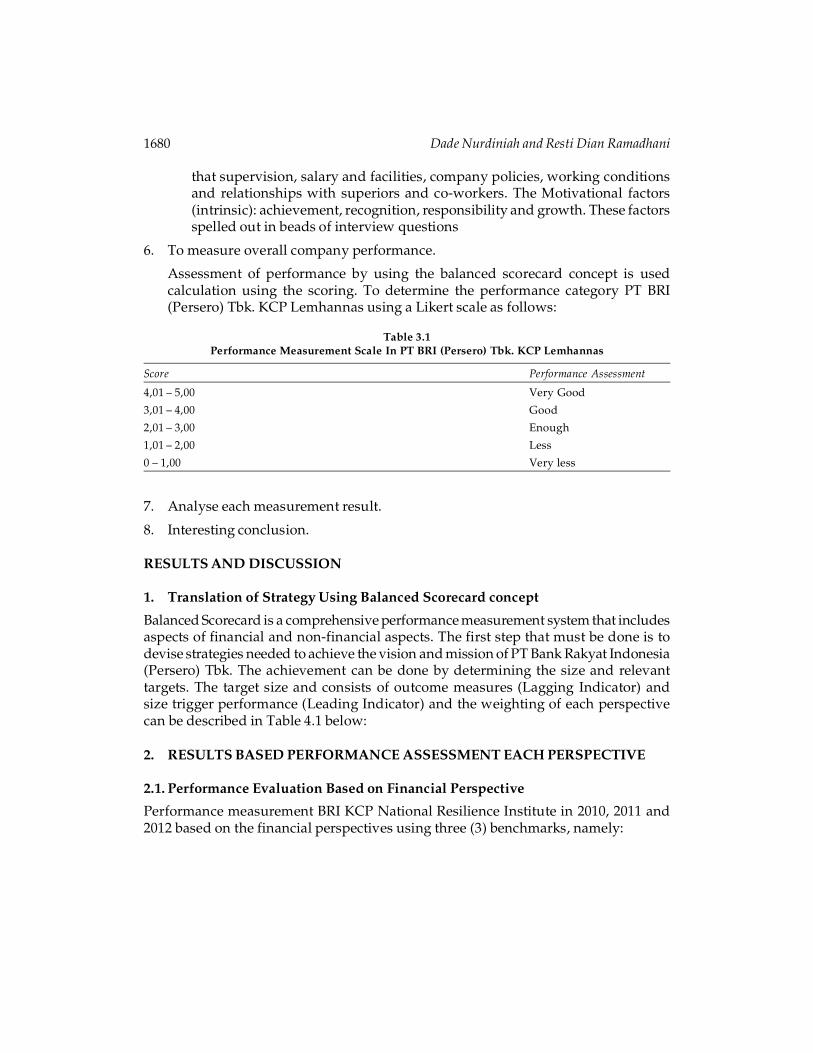
6. To measure overall company performance.
Assessment of performance by using the balanced scorecard concept is usedcalculation using the scoring. To determine the performance category PT BRI(Persero) Tbk. KCP Lemhannas using a Likert scale as follows:
Table 3.1Performance Measurement Scale In PT BRI (Persero) Tbk. KCP Lemhannas
Score Performance Assessment
4,01 – 5,00 Very Good
3,01 – 4,00 Good
2,01 – 3,00 Enough
1,01 – 2,00 Less
0 – 1,00 Very less
7. Analyse each measurement result.
8. Interesting conclusion.
RESULTS AND DISCUSSION
1. Translation of Strategy Using Balanced Scorecard concept
Balanced Scorecard is a comprehensive performance measurement system that includesaspects of financial and non-financial aspects. The first step that must be done is todevise strategies needed to achieve the vision and mission of PT Bank Rakyat Indonesia(Persero) Tbk. The achievement can be done by determining the size and relevanttargets. The target size and consists of outcome measures (Lagging Indicator) andsize trigger performance (Leading Indicator) and the weighting of each perspectivecan be described in Table 4.1 below:
2. RESULTS BASED PERFORMANCE ASSESSMENT EACH PERSPECTIVE
2.1. Performance Evaluation Based on Financial Perspective
Performance measurement BRI KCP National Resilience Institute in 2010, 2011 and2012 based on the financial perspectives using three (3) benchmarks, namely:

The Analysis of Application of Balanced Scorecard as Benchmark Performance... 1681
Table 4.1Translation of Strategy Using Balanced Scorecard concept.
Strategic Objective Outcome Measure (Lagging Size Trigger (LeadingIndicator) Indicator)
Perspektif Keuangana. Increased ROA a. Increased ROA a. ROAb. Increased Efficiency b. Increased efficiency and ability b. BOPO
to conduct operationsc. LDR enhancement c. Increased return on liabilities to c. LDR
customers who have investedfunds to loans to borrowers
Customer Perspectivea. Improved Target Market a. Increased mastery of the target a. Market Share
marketb. The increasing number of b. The increasing number of b. Customer Acquisation
customers customersc. Increased Customer c. customer satisfaction c. Customer Satisfaction
Satisfaction Survey(Questionnaire)
d. Increased Revenue d. rising corporate profits d. Customer ProfitabilityServices Offered
Internal Business ProcessPerspectivea. Development Services a. Increasing the products / a. Proses Inovasi
services being offeredb. Service Improvement b. Increased product service, b. Operating ratio /
efficiency, effectiveness, AETR (Administrativeaccuracy of transactions Expense to Totalcarried out Revenue)
Learning and GrowthPerspectivea. Employee Loyalty a. Employee Loyalty level a. Employee Turnoverb. Improved Quality and b. Improved Employee b. Employee
Competence Employees Productivity and Quality of ProductivityHuman Resources
c. Improved Employee c. Employee satisfaction c. Employee SatisfactionSatisfaction Survey (Interview)
(a) Return On Assets (ROA)
Table 4.2Calculation results ROA PT Bank Rakyat Indonesia (Persero) Tbk. In 2010 s / d in 2012
Description Year 2010 Year 2011 Year 2012
(%) ROA 4,64% 4,93% 5,15%Average 4,91%
Source: PT Bank Rakyat Indonesia (Persero) Tbk. Annual Report 2012
Measurements using one of the financial perspective profitability ratios Returnon Assets (ROA), which is the ratio used to measure the ability of the bank’s

1682 Dade Nurdiniah and Resti Dian Ramadhani
management in the overall gain. The greater the ROA ratio of a bank is the greater thelevel of profit that the bank achieved and the better the position of the bank in termsof asset utilization. Based on Table 4.2. above, ROA PT Bank Rakyat Indonesia (Persero)Tbk. KCP National Resilience Institute has increased every year. The best standardaccording to Bank Indonesia ROA was 1.5%, while the average ROA of PT Bank RakyatIndonesia (Persero) Tbk. stood at 4.91%, the ROA PT Bank Rakyat Indonesia (Persero)Tbk. is ranked first, it can be considered very good.
(b) BOPO
Table 4.3Calculation results BOPO PT Bank Rakyat Indonesia (Persero) Tbk.
Year 2010 to 2012
Description Year 2010 Year 2011 Year 2012
(%) BOPO 70,86% 66,69% 59,93%Average 65,83%
Source: PTBankRakyatIndonesia(Persero) Tbk. Annual Report 2012
ROA is the ratio between operating expenses to operating income. Operatingcosts are costs incurred by the bank in order to carry out its core business activitiessuch as interest expense, marketing costs, labor costs and other operating costs.Operating income is the main income of the bank that is the income from theplacement of funds in the form of credit and other operating income. The smallerthe bank’s ROA indicates more efficient in carrying out its business activities. Soundbank BOPO ratio of less than one opposite bank less healthy, ROA ratio is greaterthan one. According to Bank Indonesia regulation operating efficiency is measuredby the average BOPO. Average BOPO PT Bank Rakyat Indonesia (Persero) Tbk.stands at65.83%, the PT BRI (Persero) Tbk. KCP Lemhannas included in the excellentcategory.
(c) LDR (Loan to Deposit Ratio)
Table 4.4Calculation results LDR PT Bank Rakyat Indonesia (Persero)
From 2010 to 2012
Description Year 2010 Year 2011 Year 2012
(%) LDR 75,17% 76,20% 79,85%Average 77,07%
Source: PT Bank Rakyat Indonesia (Persero) Tbk. Annual Report 2012
The best standard LDR is between 85% - 110%. On average LDR PT Bank RakyatIndonesia (Persero) Tbk. In 2010 up to 2012 was 77.07%, PT BRI (Persero) Tbk. KCPLemhannas included in either category.

The Analysis of Application of Balanced Scorecard as Benchmark Performance... 1683
2.2. Performance Evaluation Based on Customer Perspective
(a) Share (Market Share)
Table 4.5Calculation Results Market Share of PT Bank Rakyat Indonesia (Persero) Tbk.
from 2010 to 2012
Description Year 2010 Year 2011 Year 2012
(%) Market Share 13,14% 11,41% 10,69%Average 11,75%
Source: Secondary data were processed
Based on data from Bank Indonesia in 2011, PT BRI (Persero) Tbk. Ranked secondin market share in 2010 and 2011. The percentage share of their respective markets,the year 2010 was 13.14% and in 2011 decreased to 11.41%. Whereas in 2012 the marketshare of PT BRI (Persero) Tbk. amounted to 10.69%. The average market share by PTBRI (Persero) Tbk. Is 11.75%. Based on data from Bank Indonesia in 2011, respectivelyPT BRI (Persero) Tbk. is the second largest bank in terms of market share and totalassets. Thus, from the above analysis, PT BRI (Persero) Tbk. got a very good categoryin terms of market share.
(b) Customer Acquisition (Customer Aquisation)
Table 4.6Calculation Results Customer Acquisition
Description Year 2010 Year 2011 Year 2012
New Customer Numbers 111 people 120 people 125 peopleNumber of Customers Now 3.647 people 3.770 people 3.895 people(%) customer acquisition 3,04% 3,18% 3,21%Average 3,15%
Source: Secondary data were processed
Customer acquisition is a benchmark used by companies to determine how muchPT. BRI (Persero) Tbk. KCP Lemhannas able to attract new customers within a certainperiod or new business opportunities. Table 4.6. above shows an increase in newcustomers every year. The average growth of new subscribers each year is 3.15%. Thecustomer acquisition growth PT BRI (Persero) Tbk KCP Lemhannas included in bothcategories because it has a value of 3.15%.
(c) Customer Satisfaction
The result of validity and reliability of customer satisfaction questionnaire consistingof 21 questions and 98 grains of respondents. The critical point is testing the validityof 0,361, where the questions which have a validity coefficient is in a position of lessthan 0.361 (<0.361) declared invalid, while the questions which have a validitycoefficient is in a position of more than 0,361 (> 0.361) declared invalid.

1684 Dade Nurdiniah and Resti Dian Ramadhani
Reliability coefficient was calculated using the formula of Cronbach’s Alpha andtechnique produces instrument reliability of 0.987. Reliability testing is a critical pointof 0.7, this means that if the reliability of the instrument in the position of a position ofless than 0.7 otherwise unreliable, whereas if the reliability of the instrument is in aposition of more than 0.7 otherwise unreliable. From the calculation of thequestionnaire, the average level of satisfaction generated is equal to 4.7. Based on aLikert scale, the criteria satisfaction PT Bank Rakyat Indonesia (Persero) Tbk. is verysatisfying.
(d) Profitability Customer (Customer Profitability)
Table 4.7Customer profitability(in millions of dollars)
Description Year 2010 Year 2011 Year 2012
Net Profit Before Tax 931.764 1.177.869 1.600.977Net Sales 2.055.538 2.162.020 2.448.061(%)Customer profitability 45,33% 54,48% 65,40%Average 55,07%
Source: Secondary data were processed
Customer profitability (CP) is a measure used to determine how much benefit isgained by PT BRI (Persero) Tbk. KCP Lemhannas of products offered. Table 4.7. showsthat the average PT BRI (Persero) Tbk. KCP National Resilience Institute managed togenerate revenue from product offerings / services for the period of 2010 until theyear amounted to 55.07 percent 2012adalah. This means that every Rp 1.00 (a dollar)net sales in the form of interest given the company a profit of Rp 0.55 (zero point fivedollars). Customer profitability calculation results also increased every year. Basedon the above analysis, the performance of PT BRI (Persero) Tbk. included in bothcategories.
2.3. Performance Assessment Based on Internal Business Process Perspective
(a) Innovation
Noted, since 2010 to 2012, PT BRI (Persero) Tbk. KCP National Resilience Institute hasdeveloped very rapidly. Various new products launched every year, but the researchersdid not obtain definitive data on the number of new products or innovations thathave been implemented by PT BRI (Persero) Tbk. KCP National Resilience Institutesince 2010-2012.
Several new products were launched by PT BRI (Persero) Tbk. from 2010 to 2012,among others:
1. The facility of online shopping payment can be done directly through thewebsite merchants’ option

The Analysis of Application of Balanced Scorecard as Benchmark Performance... 1685
2. Features short message (SMS) notification
3. BRI Roving
4. The launch of the e-buzz BRI BRI working unit that is mobile so it can provideconventional banking services and e-channel at potential locations notreached by conventional uker BRI
5. Full Briguna
6. BRIZZI card that is rechargeable money BRI namely prepaid card that can beused as a substitute for cash payments and can refilled.
7. Britama business
Based on the many innovations made by PT BRI (Persero) Tbk. since 2010 to 2012,the valuation process of innovation included in the category quite well. Because bydoing innovations, PT BRI (Persero) Tbk. Can maintain the existence of the companyand continue to increase the number of customers each year.
(b) Operation Process
To determine the effectiveness and efficiency and accuracy of the transactions carriedout by PT BRI (Persero) Tbk., The calculation is done by using the ratio of AETR(Administrative Expense to Total Revenue) at 4.8 the following table:
Table 4.8Ratio Calculation Results of Operations (AETR)
Description Year 2010 Year 2011 Year 2012
(%) AETR 10,23% 10,13% 10,87%Average 10,41%
Source: Secondary data were processed
The best standard of 10%. Bank with AETR level between 8.5% -10% means thebank can control administrative costs but still provide good service. Based on thecalculation of average AETR at 4.8 in the above table, the PT BRI (Persero) Tbk. KCPLemhannas included in the category good enough, because the average operatingratio is at a position above 10%.
2.4. Performance Assessment Based Learning and Growth Perspective
(a) Employee Turnover
Employee turnover rate is determined by comparing the employee who came outwith total employees at PT. BRI (Persero) Tbk. KCP National Resilience Institute. Thetotal number of employees at PT PT. BRI (Persero) Tbk. KCP Lemhannas from year toyear has not changed, ie 13 people. This is because the number of employees adjustedto the capacity of the existing jobs at the company. So far, the number of employees 13

1686 Dade Nurdiniah and Resti Dian Ramadhani
people, the company is able to run well. In 2012 there is one (1) employee who resigned,for reasons to be married, and soon PT BRI (Persero) Tbk. KCP Lemhannas get out ofthe replacement employee.
Thus, the turnover rate of employees of PT BRI (Persero) Tbk. KCP Lemhannas isvery low. This means that employees feel comfortable working in the management ofPT BRI (Persero) Tbk. KCP National Resilience Institute, the reverse is also that PTBRI (Persero) Tbk. KCP Lemhannas able to retain their employees very well. Employeeturnover rate PT BRI (Persero) Tbk. KCP Lemhannas can be seen from the followingtable:
Table 4.9Calculation results of Employee Turnover in PT BRI (Persero)
Tbk. KCP Lemhannas
Description Year 2010 Year 2011 Year 2012
Number of Employees Quit 0 1 1Total employee 13 13 13(%)Employeeturnover 0,00% 7,69% 7,69%Average 5,13%
Source: Primary data processed
Turnover of employees at PT Bank Rakyat Indonesia (Persero) Tbk. KCPLemhannas very low. This means the company is able to retain its employees well.There are only 1 (one) employee who came out in 2011 and 2012. The number ofemployees from year to year is also likely to remain, because every employeewho resigned, PT Bank Rakyat Indonesia (Persero) Tbk. KCP National ResilienceInstitute to immediately find a replacement, so that the work left by employees whoresign, are not neglected and interfere with operational processes / activities of thecompany.
(b) Employee productivity
Table 4.10Calculation results Employee Productivity at PT Bank Rakyat Indonesia (Persero) Tbk.
(in millions of dollars)
Description Year 2010 Year 2011 Year 2012
Net Profit Before Tax 931.764 1.177.869 1.600.977total Employees 13 13 13productivity 71.674 90.605 123.152Average 95.144
Source: Secondary data were processed
4.10.di table above shows that the productivity of employees in 2010 was US $71.674 million, - that each employee provides part of net profit in 2010 to the companyamounted to USD 71.674 million, -. In 2011, employee productivity increased by USD

The Analysis of Application of Balanced Scorecard as Benchmark Performance... 1687
90.605 million, -, as well as a significant increase occurred in the year 2012 in theamount of USD 123 152 000, -.
From Table 4.10. above, can also be seen that an increase in employee productivityfrom year to year. The percentage increase in the year 2010 to the year 2011 is 11.67%(eleven point six seven percent) and from 2011 to 2012 was 15.23% (fifteen point twothree per cent and the average productivities employees from 2010 to 2012 is Rp 95.144million, -. Based on the analysis above, the productivity of employees of PT BRI(Persero), Tbk. included in the category quite well, because the small number ofemployees was able to increase its productivity from year to year.
(c) Employee Satisfaction
Measurement of employee satisfaction PT Bank Rakyat Indonesia (Persero) Tbk.conducted by interviews to several employees. Measurement of employee satisfactionis realized in three sub-questions interview follows:
1. Employee Satisfaction
Basically the HR management of PT Bank Rakyat Indonesia (Persero) Tbk. hasbeen implemented well, each employee also has tasks in accordance with the jobdescription. Because the management system applied to the KCP is a family, then theflexibility of work still applies here. So do not rule out the possibility, inter employeeis allowed to provide assistance related to the work of other employees, with a recordof all the duties and responsibilities have been completed. Each of these employeeshave understood correctly, that customer satisfaction / customer is the main vision ofthe company, therefore every employee strive to provide the best service for itscustomers.
The system has been implemented with good discipline. Regulations on rewardand punishment for employees have been established firmly. PT Bank Rakyat Indonesia(Persero) Tbk. KCP Lemhannas provide opportunities for employees to continue careerin a higher position, with the provision of opportunity to all employees to follow thejob opening, held by the central office every two (2) years. Job opening is implementedin order to support the career opportunities and promotion / position for all employeesof PT Bank Rakyat Indonesia (Persero) Tbk. without exception.
2. Satisfaction Information Systems
Application of hours of work on PT Bank Rakyat Indonesia (Persero) Tbk. KCPLemhannas according to the working hours applied and regulated by the central office,which is 9 hours starting at 08:00 to 17:00 pm. The level of communication andinteraction among employees is very high. Because the management systemsimplemented over the family and because of the number of employees who are not somuch, as well as the scope of the office space that is not so wide, then there is nodifficulty for employees to communicate and interact. Interaction among employeesis also very high due to the linkage of work each employee.

1688 Dade Nurdiniah and Resti Dian Ramadhani
Facilities provided by the company are quite limited, to the extent and needs ofeach employee and office. But, will cause trouble, if one of those facilities damaged ornot functioning. Therefore, some employees argued that it would be better, if facilitiessuch as printers, copiers and other equipment supplied some backup. Thus, if there isdamage, it will not interfere with the process or the continuity of operations of thecompany. Access to information provided by the central office is less by a fewemployees. Internet access, for example, the central office only provides Internet accessto open the BRI website. For the rest, KCP National Resilience Institute provides amodem for each employee to gain access to a much wider internet.
3. Employee Motivation
Some employees of PT BRI (Persero) Tbk. KCP Lemhannas get special facilitiesrelated to transportation. Each Finding Officer and Accounts Officer facilitated 1 piecemotorcycle, because of their high mobilization, which is expected to facilitate andexpedite the implementation of the tasks and operations office and 1 (one) official carfor Assistant Branch Manager.
Related salaries and incentives earned, nearly all employees were satisfied. Sincethere are clear rules on remuneration and incentives for employees of state-ownedenterprises, so enterprises cannot deviate from the prescribed rules. Grantingpermission and leave has also been quite satisfactory. No reduction or licenseentitlement for employees with specific reasons, because of regulations regardingpermits and leave is set by the central office and the government. Granted leave couldalso increases with length of service and position carried the employees.
3. BANK PERFORMANCE BY OVERALL
How to measure the Balanced Scorecard is a measure of the balance betweenperspectives with other perspectives with their respective benchmarks perspective.Balance criteria used to measure the extent to which the strategic objectives we achievebalance in all perspectives.
Results of performance assessment on the financial perspective according tostandards set by Bank Indonesia, showed that the average ROA have very good sorated 5, while BOPO slightly above the standard set so that rated 4. LDR has an averagecalculation results according to the standard, so it was considered quite good and getsthe value 3.
At the customer’s perspective, the market share of PT BRI (Persero) Tbk has rankednumber two (2) of the overall bank in Indonesia. It shows excellent achievement, sorated 5. Customer acquisition rated 4, because the average customer acquisitioncalculations slightly above average according to a Likert scale that has been set.Customer satisfaction has a very good category because it has an average satisfactionof 4.11. Customer satisfaction is quite good standard if it had an average on a Likertscale above 3.50. The profitability of customers get a good category, so rated 4.

The Analysis of Application of Balanced Scorecard as Benchmark Performance... 1689
Internal Business Processes perspective, innovation conducted by PT BRI (Persero)Tbk stated enough, so the rated 3. While operating ratios calculated using calculationAETR get good enough category, according to standards set by Bank Indonesia, it isgiven a value of 3.On the Learning and Growth perspective, low employee turnoverobtain excellent category, because it means the company has the ability to retain itsemployees, so that employees get the value 5. Productivity is good enough, then rated3. Satisfaction of employees rated 3, as the result of the interview shows no significantcomplaints from employees.
Tabel 4.11Overall Bank Performance Results
No. Indicator Year
2010 2011 2012 Avarage Category value
A Financialperspective
1 ROA 3,56% 3,74% 4,11% 3,81% Very good 52 BOPO 73,07% 65,70% 60,82% 66,53% Good 43 LDR 75,17% 76,20% 79,85% 77,07% Enough 3
Financial perspective category Good 4B Customer
perspective4 Market Share 13,14% 11,41% 10,69% 11,75% Vey good 55 Customer 3,04% 3,18% 3,21% 3,15% Good 4
acquisition6 Customer - - - 4,19 Very good 5
satisfactory7 Profitability 45,33% 54,48% 65,40% 55,67% Good 4
customerCustomer perspective category Very good 4,5
C Internal businessperspective process
8 Inovation process - - - - Enough 39 Operation 12,26% 14,13% 14,14% 13,51% Enough 3
processInternal business perspective process category Enough 3
D Learning andGrowthPerspective
10 Employee 0,00% 7,69% 7,69% 5,13% Very good 5turnover
11 Employee Rp Rp Rp Rp Good enough 3Productivity 71.674 90.605 123.152 95.144
12 Employee - - - - Good 4SatisfactionLearning and Growth Perspective category Good 4On average Overall Perspective 15,5The average value (15,5/4) 3,88
Source: Secondary data were processed

1690 Dade Nurdiniah and Resti Dian Ramadhani
The average score obtained from the four perspectives is 15.5. So that the valueobtained is 15.5 / 4 = 3.88. The overall assessment of the amount of value obtainedfrom measurements of the balanced scorecard on the performance of PT BRI (Persero)KCP Lemhnnas can be expressed with “excellent”, “good”, “pretty”, “less” and “verypoor”. The figure below shows the position of performance assessment that has beenachieved by PT BRI KCP National Resilience Institute
Figure 4.1: Performance Assessment
Figure 4.1 above shows that the company’s performance can be judged based onthe scores were determined based on the Likert scale 4:12 table. Based on the averageratings performance has been measured using the Balanced Scorecard, PT BRI (Persero)Tbk KCP National Resilience Institute is in the area is good, since the average scoreobtained was 3.88 (three point eight eight).
CONCLUSIONS AND RECOMMENDATIONS
1. Conclusion
Based on the description that has been presented previously, measurement ofperformance using the Balanced Scorecard method is done by using four perspectives,which in turn can be summarized as follows:
(a) Financial Perspective
Financial ratios used are ROA, ROA and LDR. These results indicate that the PT. BRI(Persero) KCP National Resilience Institute from 2010 until 2012 can achieve costeffectiveness and optimal yield corporate profits. On this perspective, PT BRI (Persero)Tbk. KCP Lemhannas included in both categories, with an average score of 4 (four)
(b) Customer Perspective
Results from this study explains that the market share in PT BRI (Persero) Tbk hasincreased every year (2010, 2011, 2012) and reached an average value of 11.75%. The

The Analysis of Application of Balanced Scorecard as Benchmark Performance... 1691
increase in this market segments mastery occurs because PT BRI (Persero) Tbk improveproduct quality funding and credit products, as well as better quality services to itscustomers. Acquisitions customers get good category with an average starting in 2010-2012 was 3.15%. Customer satisfaction PT BRI (Persero) Tbk KCP Lemhannas measuredusing a questionnaire which was distributed to the client that contains the feedbackand level of satisfaction with all services and facilities provided by PT BRI (Persero)Tbk KCP National Resilience Institute. Customer satisfaction is included in the excellentcategory with an average value of 4.19 customer satisfaction. Customer profitabilityincluded in either category with an average percentage of 55.67 profitability. On thisperspective, PT BRI (Persero) Tbk. KCP Lemhannas included in the excellent category,with an average score of 4.5 (four point five).
(c) Internal Business Process Perspective
On this perspective, used two indicators that measure the level of innovation andoperating processes. PT BRI (Persero) Tbk continues to improve services by addingproducts and services that are new in every year. Noted, from the 2010-2012 timespan, there are several new products and services offered, this means that thecompany’s performance in terms of innovation can be said to be good. Operationprocess is measured by the formula AETR, and is included in the category quite well,with an average score of 13.51%. On this perspective, PT BRI (Persero) Tbk. KCPLemhannas included in the category enough, with an average score of 3 (three).
(d) Learning and Growth Perspective
Employee turnover PT BRI (Persero) Tbk KCP Lemhannas very low, with an averageturnover from 2010 to 2012 was 5.13%, this means that the company is able to retainits employees well. Productivity of employees considered quite good with averageprofitability is $ 95.144 million, -. Employee satisfaction is measured through theinterview method, and the results showed that the employees working at PT BRI(Persero) Tbk, an average KCP Lemhannas have the satisfaction of a good, judgingfrom the absence of significant complaints for employees. On this perspective, PT BRI(Persero) Tbk. KCP Lemhannas included in both categories, with an average score of4 (four)
(e) Overall Corporate Performance
Performance PT BRI (Persero) Tbk KCP Lemhannas measured with Likert scale andgenerating position is in the range of performance “good” category with an averagescore of “3.88” (three point eight eight).
2. Suggestion
For further research, on a non-financial perspective is expected to develop ameasurement outside of this study. The results showed that the financial perspective

1692 Dade Nurdiniah and Resti Dian Ramadhani
using three benchmarks: ROA, ROA, and LDR. It is hoped in future studies may usefinancial ratios measuring more complete.
For company management should set targets for each expected result, as a referencein the implementation of each activity companies. The management also should paymore attention to indicators on internal business process perspective for furtherrefinement and improvement, because of the measurement results, performance basedon this perspective still has considerable value.
References
Baharudin Djunaidi. (2013), Perjalanan Konsep dan Implementasi Balanced Scorecard. KompasEdisi Sabtu 4 Mei 2013. Jakarta.
Hansen, Don R, dan Maryanne M. Mowen, (2005), Akuntansi Manajemen. Edisi 7. SalembaEmpat, Jakarta.
Ikhwan, Awan. (2011), “Pengukuran Kinerja Dengan Pendekatan Balanced Scorecard Pada PT BankMuamalat Indonesia Tbk Cabang Bogor”. Skripsi Mahasiswa Institut Pertanian Bogor. Bogor.
Mahmudi. (2010), Manajemen Kinerja Sektor Publik. UPP STIM YKPN. Yogyakarta.Mahsun, Mohamad, SE, M.Si, Ak. (2010), Pengukuran Kinerja Sektor Publik. Edisi Pertama.
BPFE. Yogyakarta.Mulyadi. (2007), Sistem Terpadu Pengelolaan Kinerja Personel Berbasis Balanced Scorecard. UPP
STIM YKPN. Yogyakarta.Prawironegoro, Darsono dan Purwanti, Ari. (2009), Akuntansi Manajemen. Edisi 3.Mitra
Wacana Media. Jakarta.Santoso. B. Totok dan T. Sigit. (2006), Bank dan Lembaga Keuangan Lainny. Edisi kedua. Salemba
Empat. Jakarta.Tanopruwito, Djoni dan Khaerul E, Said. (2012), Akuntansi Manajemen: Ringkasan Teori, Soal
dan Jawaban. Hartomo Media Pustaka. Jakarta.http://www.bi.go.id diakses tanggal 1 April 2013http://www.lmfeui.com diakses tanggal 3 April 2013http://www.infobanknews.com diakses tanggal 26 April 2013http://elibrary.unisba.ac.id/ diakses tanggal 26 April 2013http://banking.blog.gunadarma.ac.id/2012/04/13/analisis-pengaruh-rasio-rasio-
keuangan-terhadap-kinerja-bank-umum-di-indonesia-berdasarkan-data-yang-diperoleh-dari-statistik-perbankan-indonesia-januari-2012/ diakses tanggal 10 Mei 2013
http://www.newsbanking.com/search/label/PERBANKAN diakses tanggal 10 Mei 2013Widianingsih, Wina. (2009), Analisis Perbandingan Kinerja Keuangan PT Bank Muamalat Tbk dan
PT Bank Syariah Mandiri Tbk. Skripsi Mahasiswa Universitas Islam. BandungWulansari, Nurul dan Hermana, Budi. 2008. Analisis Biaya Dana, Persentase Aktiva Produktif,
dan Pendapatan sebagai Faktor Pembeda Antara Bank Fokus dan Bank Terbatas MenurutKerangka Arsitektur Perbankan Indonesia. UG Jurnal Volume 2 Nomor 2. Jakarta
Zunia, Meirdania. (2010), Analisis Penilaian Kinerja Organisasi Dengan Menggunakan KonsepBalanced Scorecard pada PT Bank Jateng Semarang. Skripsi Mahasiswa UniversitasDiponegoro. Semarang.


