Embed Size (px)
Citation preview

Kevin EaganJennifer B. LozanoSylvia HurtadoMatthew H. Case
the american freshman:national norms fall 2013COOPERATIVE INSTITUTIONAL RESEARCH PROGRAM
at the HIGHER EDUCATION RESEARCH INSTITUTE AT UCLA cirp
COOPERATIVE INSTITUTIONAL RESEARCH PROGRAM at the HIGHER EDUCATION RESEARCH INSTITUTE AT UCLA cirp

The American Freshman:National Norms Fall 2013
Prepared by the Staff of theCooperative Institutional Research Program
Kevin EaganJennifer B. LozanoSylvia HurtadoMatthew H. Case
Higher Education Research InstituteGraduate School of Education & Information StudiesUniversity of California, Los Angeles

Higher Education Research Institute University of California, Los Angeles
Sylvia Hurtado, Professor and Director
HERI Affiliated Scholars
Walter R. Allen, Allan Murray Cartter Professor of Higher EducationAlexander W. Astin, Founding Director and Senior ScholarHelen S. Astin, Senior ScholarMitchell J. Chang, ProfessorPatricia M. McDonough, ProfessorLinda J. Sax, ProfessorRick Wagoner, Assistant ProfessorVictor B. Sáenz, Associate Professor, University of Texas at Austin
The Higher Education Research Institute (HERI) is based in the Graduate School of Education & Information Studies at the University of California, Los Angeles. The Institute serves as an interdisciplinary center for research, evaluation, information, policy studies, and research training in postsecondary education.3005 Moore Hall/Mailbox 951521 Los Angeles, CA 90095-1521 www.heri.ucla.edu 310-825-1925
CIRP Advisory Committee
Betsy O. Barefoot Vice President John N. Gardner InstituteVictor M. H. Borden Associate Vice President and Professor Indiana UniversityMark L. Gunty Assistant Director of Institutional Research University of Notre DameMarsha Hirano-Nakanishi Assistant Vice Chancellor, Academic Research California State University Office of the ChancellorChristine M. Keller Associate Vice President for Academic Affairs Association of Public and Land Grant UniversitiesKurt J. Keppler Vice Chancellor for Student Life and Enrollment Services Louisiana State UniversityRandy L. Swing Executive Director Association for Institutional ResearchSylvia Hurtado Professor and Director, HERI (ex-officio)M. Kevin Eagan, Jr. Interim Director, CIRP (ex-officio)
ACKNOWLEDGMENTS: Cover design by Escott & Associates. Page layout and text design by The Oak Co. The authors wish to thank Lesley McBain and Melissa Aragon for their assistance in the preparation of this manuscript.
Published by the Higher Education Research Institute. Suggested citation:
Eagan, K., Lozano, J. B., Hurtado, S., & Case, M. H. (2013). The American freshman: National norms fall 2013. Los Angeles: Higher Education Research Institute, UCLA.
To download additional copies of this monograph with expanded tables, please visit http://heri.ucla.edu/tfsPublications.php.
Copyright © 2013 By the Regents of the University of California ISBN 978-1-878477-27-9 (paperback) ISBN 978-1-878477-23-1 (e-book) ISBN 978-1-878477-26-2 (e-book, expanded edition) ISBN 978-1-878477-24-8 (print-on-demand edition)
iii
CONTENTS
Introduction 1
The American Freshman: National Norms Fall 2013 4
Students Submitting More College Applications 5
Fewer Students Enroll in Their First-Choice Institution 6
Increasing Importance of Cost and Financial Aid in Students’ College Choice 7
Participation in Online Education 8
Taking Stock of Students’ Views One Year after Obama’s Re-Election 10Gays’ and Lesbians’ Right to Adopt a Child 10Undocumented Students and Access to Public Education 10Raising Taxes 11Control of Handgun Sales 12
Students’ High Schools and Neighborhoods Increasingly Diverse 12
Skills for a Diverse Workplace 13
Revised Careers in 2013 14
References 16
The 2013 National Norms
All First-Time, Full-Time Freshmen by Institutional Type 17
Appendix A: Research Methodology 43
Appendix B: The 2013 CIRP Freshman Survey Instrument 53
Appendix C: Institutions Participating in the 2013 CIRP Freshman Survey 61
Appendix D: The Precision of the Normative Data and Their Comparisons 71
Appendix E: Changes to the Career Category Response Options for the 2013 Survey 75
About the Authors 81

iv

1
INTRODUCTION
undergraduate experience. They found that students who interact more with faculty in their first year are more likely to develop mentoring relationships by their senior year. The authors suggest that this early contact with faculty serves as a way to socialize students into developing interpersonal and navigational skills necessary to establish meaningful, productive relationships with faculty later in college.
A number of publications have focused on diver-sity and climate-related issues. Two longitudinal studies used the CIRP Freshman Survey and the College Senior Survey to examine students’ cross-class interaction. Park and Denson (2013) found that students attending more racially diverse and socioeconomically diverse institu-tions are more likely to have cross-class inter- actions, increasing diversity engagement on campuses. These findings point to a need for institutions to think broadly about diversity, as the authors emphasize the role of socioeconomic diversity within institutions as one factor that can address broader equity concerns within higher education. Park, Denson, and Bowman (2013) also found that, through cross-class interactions, students attending racially diverse institutions are more likely to be involved with curricular/co-curricular diversity activities. The authors conclude that both socioeconomic diver-sity and racial diversity collectively contribute to a healthier campus racial climate for students, while emphasizing that socioeconomic diversity and racial diversity are not interchangeable.
Issues of college access, affordability, admissions policies, and completion have continued to dominate discussions of the role of higher educa-tion in the past year. Court decisions regarding affirmative action in college admissions as well as proposals from the Obama administration to create a college rating system have only served to intensify these debates. At both federal and state levels, colleges and universities are under increasing scrutiny for their cost of attendance, prevalence of part-time instructors, criteria used to admit students, and the added value of the credentials they confer. The Higher Education Research Institute (HERI) continues to inform national conversations regarding higher educa-tion policy, and below we highlight several publications that contribute to ongoing debates.
Research published in the last year analyzed data from all five national surveys administered by the Cooperative Institutional Research Program (CIRP): the CIRP Freshman Survey, the Your First College Year survey, the Diverse Learning Environments survey, the College Senior Survey, and the HERI Faculty Survey. Many of these studies used multiple CIRP surveys, highlighting the longitudinal advantages of the CIRP surveys in examining and understanding student experi-ences and outcomes throughout college. For example, Fuentes, Ruiz Alvarado, Berdan, and DeAngelo (2013) used the CIRP Freshman Survey, the Your First College Year survey, and the College Senior Survey to look at students’ interactions with faculty over the course of their

2
the faculty and in the curriculum to cultivating academic validation and inclusive learning envi-ronments for diverse student bodies. Victorino, Nylund-Gibson and Conley (2013) examined the relationship between faculty perceptions of campus racial climate and satisfaction with opportunities for research, teaching load, and autonomy. The authors found that faculty who perceive positive climates on their campus also tended to report higher levels of satisfaction. These findings held irrespective of faculty’s race/ethnicity or gender, indicating that a positive campus racial climate matters for all faculty.
Hurtado and Figueroa (2013) compared the experiences of STEM women of color with White, female, male, and Asian counterparts, and show distinct experiences across race and gender with regard to stress related to discrimi-nation and bias. In another faculty study, an op-ed describing institutions’ use of part-time faculty appointments (Eagan, 2013) contributed to the national discussions about contingent faculty. More information about the HERI Faculty Survey, which is available for adminis-tration through May of 2014, can be found at http://heri.ucla.edu/facoverview.php.
In addition to publishing research articles, monographs, and briefs, HERI staff and affili-ates have disseminated CIRP findings at national and regional conferences. In 2013 we also intro-duced the HERI Faculty Institute on Work/Life Issues. Given the strong demand from this inaugural offering, we look forward to the 2014 Faculty Institute where we will unveil findings from the 2014 HERI Faculty Survey. More information on the 2014 Faculty Institute, which is one of four summer institutes for 2014, can be found at http://heri.ucla.edu/ facultyInstitute.php.
Another longitudinal study using the CIRP Freshman Survey and the College Senior Survey looked at undocumented students’ access to college (Herrera, Garibay, Garcia, & Johnston, 2013). Herrera et al. found that Latino students and female students were more likely to support educational access for undocumented immi-grants. Likewise, the authors found that students who engaged with diversity while in college—by attending a racial/cultural awareness workshop, by enrolling in an ethnic studies course, or by participating in study abroad—tended to be more supportive of undocumented students enrolling in college. As this continues to be an important public policy issue, it is important to understand how students’ perspectives toward undocumented student populations change.
Continuing roughly a decade of research on the pathways taken by students pursuing science, technology, engineering, and mathematics (STEM) degrees, a team led by Drs. Sylvia Hurtado and Kevin Eagan published results from analyses of CIRP Freshman Survey and College Senior Survey data. Eagan, Hurtado, Chang, Garcia, Herrera, and Garibay (2013) examined whether participation in a structured undergraduate research program significantly contributed to STEM students’ intentions to pursue graduate or professional degrees in STEM disciplines. Their findings show that students who participate in undergraduate research programs are substantially more likely to express intentions to pursue a STEM graduate or professional degree compared to their peers who do not participate in these opportunities.
Hurtado and Ruiz Alvarado (2013) used data from the Diverse Learning Environments survey and the HERI Faculty Survey to look at inclu-sive learning environments. Their findings highlighted the importance of diversity in both
3
New Reporting Feature: First Choice Institution Freshmen in Comparison with PeersThis year we are also excited to include a new feature in our standard reporting package deliv-ered to campuses. Institutions will find an enrollment management report in their institu-
tional profile that compares the responses from students who indicated they had enrolled in their first-choice institution against their peers who did not enroll in their first-choice campus. We hope this additional cut of the data will provide campuses with helpful information about the needs and expectations of their students.
Kevin EaganInterim Director
Cooperative Institutional Research Program

4
THE AMERICAN FRESHMAN: NATIONAL NORMS FALL 2013
Analyses of the 48th annual administration of the CIRP Freshman Survey find substantive
shifts in students’ college application strategies, as students increasingly apply to more than
four institutions. With fewer students enrolling in their first-choice institution, the data show
that college cost and financial aid issues have become even more salient in students’ college
choice process. Given the proliferation of online education in recent years, students’ partici-
pation in online instruction before coming to college and expectations to enroll in online
courses while in college are examined. More than a year after President Barack
Obama was re-elected, we take stock of students’ attitudes about some of the
most-discussed political issues in 2013, including gun control, taxes, and gay
rights. We also review the changing demographics of students’ high schools and
neighborhoods, and changes in the CIRP Freshman Survey made to more
accurately capture students’ cognitive and interpersonal skills associated with
engaging in a diverse society. Finally, we analyze the impact of changes made to the 2013
CIRP Freshman Survey that expanded and revised our set of response options for students’
and their parents’ careers.
The results reported in this monograph are based upon 165,743 first-time, full-time students
who entered 234 four-year U.S. colleges and universities of varying levels of selectivity and
type. Weights have been applied to these data to reflect the more than 1.5 million first-time,
full-time undergraduate students who began college at 1,583 four-year colleges and universi-
ties across the U.S. in the fall of 2013. This means that differences of one percentage point
in the results published here reflect the characteristics, behaviors, and attitudes of more than
15,000 first-year students nationally. We describe the full methodology of the CIRP Freshman
Survey administration, stratification scheme, and weighting approach in Appendix A.
College cost and financial
aid issues have become even
more salient in students’
college choice process.
5
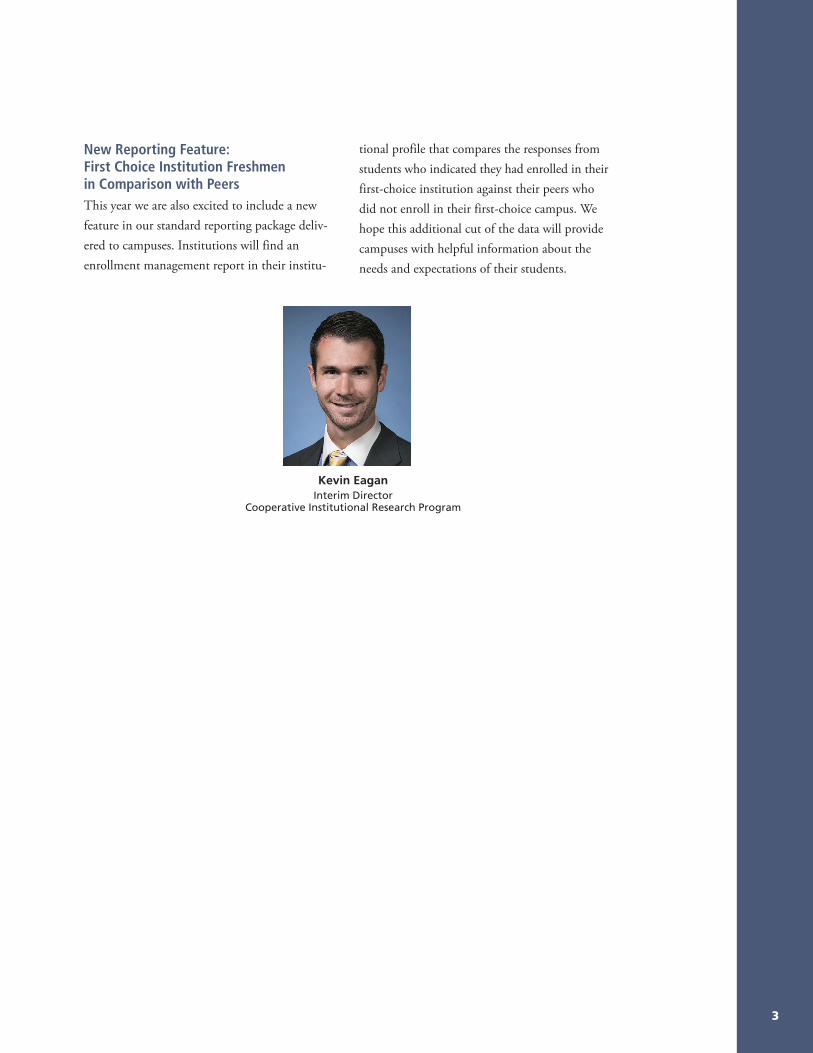
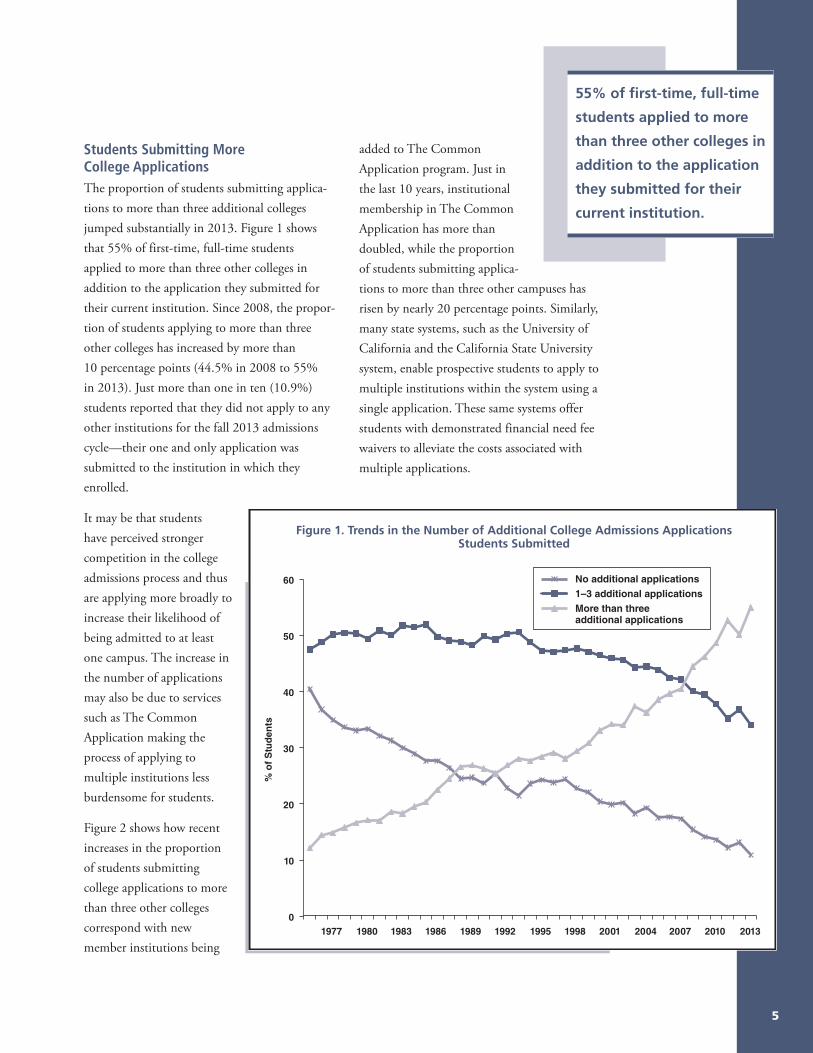
Students Submitting More College ApplicationsThe proportion of students submitting applica-tions to more than three additional colleges jumped substantially in 2013. Figure 1 shows that 55% of first-time, full-time students applied to more than three other colleges in addition to the application they submitted for their current institution. Since 2008, the propor-tion of students applying to more than three other colleges has increased by more than 10 percentage points (44.5% in 2008 to 55% in 2013). Just more than one in ten (10.9%) students reported that they did not apply to any other institutions for the fall 2013 admissions cycle—their one and only application was submitted to the institution in which they enrolled.
It may be that students have perceived stronger competition in the college admissions process and thus are applying more broadly to increase their likelihood of being admitted to at least one campus. The increase in the number of applications may also be due to services such as The Common Application making the process of applying to multiple institutions less burdensome for students.
Figure 2 shows how recent increases in the proportion of students submitting college applications to more than three other colleges correspond with new member institutions being
added to The Common Application program. Just in the last 10 years, institutional membership in The Common Application has more than doubled, while the proportion of students submitting applica-tions to more than three other campuses has risen by nearly 20 percentage points. Similarly, many state systems, such as the University of California and the California State University system, enable prospective students to apply to multiple institutions within the system using a single application. These same systems offer students with demonstrated financial need fee waivers to alleviate the costs associated with multiple applications.
% o
f S
tud
ents
60
50
40
30
20
10
01977 1980 1983 1986 1989 1992 1995 1998 2001 2004 2007 2010 2013
No additional applications1–3 additional applicationsMore than three additional applications
Figure 1. Trends in the Number of Additional College Admissions Applications Students Submitted
55% of first-time, full-time
students applied to more
than three other colleges in
addition to the application
they submitted for their
current institution.

6
Fewer Students Enroll in Their First-Choice InstitutionAs students apply for admission at increasing numbers of colleges and universities, fewer students are enrolling at their first-choice institu-tion. The proportion of students enrolling at their first-choice institution is at its lowest point since we began asking the question in 1974. In 2013, 56.9% of students enrolled at their first-choice campus, which is down 2.4 percentage points from 2012. This contrasts with more than
three-quarters (75.5%) of students having been admitted to their first-choice campus.
The top reasons why students who are accepted to their first choice institu-tion opt to enroll elsewhere mostly center around cost. As shown in Figure 3, roughly a quarter (25.7%) of students accepted to their first-choice college or university chose to enroll at a different institution because they were not
offered aid by their first-choice campus. Just over 40% of students said that being unable to afford their first-choice college was a “very important” consideration in deciding to enroll in an institu-tion other than their first-choice college.
Although inadequate aid and higher costs prompted many students to turn down admis-sions offers by their first-choice institutions in lieu of admissions offers elsewhere, other students who were accepted to their first-choice
college enrolled elsewhere due to more attractive finan-cial aid packages and lower college costs at competing campuses. Nearly 60% of students who were accepted to but turned down their first-choice insti tution decided to enroll elsewhere due to the financial aid package offered by their current institution. Like- wise, 62.1% of students admitted to but not enrolled
% o
f S
tud
ents
Nu
mb
er of C
om
mo
n A
pp
lication
Mem
bers
60
50
40
30
20
10
0
600
500
400
300
200
100
0
1977 1980 1983 1986 1989 1992 1995 1998 2001 2004 2007 2010 2013
More than three additional applications
Number of Member Institutions in the Common Application
Figure 2. Trends in College Admissions Applications and Common Application Member Institutions
Not offered aid by first choice
institution
% o
f S
tud
ents
Could not afford first choice institution
Was offered financial assistance
by current institution
The cost of attending
this college
25.7
70
60
50
40
30
20
10
0
40.4
59.7 62.1
Figure 3. College Choice Factors among Students Accepted to But Not Enrolled in First-Choice Institution (% Indicating “Very Important”)

7
in their first-choice campuses indicated that the cost of their current institution was a “very important” factor in their college choice.
Increasing Importance of Cost and Financial Aid in Students’ College ChoiceThe top reasons for choosing a particular college continue to be the institution’s “very good” academic reputation (64% indicating “very impor-tant” in 2013) and the college’s graduates getting good jobs (53.1% indicating “very important” in 2013); however, cost considerations increasingly weigh on students’ enrollment decisions. Fig- ure 4 shows trends in the most salient factors in students’ college choice process. The percentage of students indicating that the cost of attending their current institution was a “very important” factor in their college choice process is at its highest point in the 10 years we have asked the question. Figure 4 shows that the cost of attendance at this college was rated as being “very important” in students’ enrollment decision by 45.9% of students—up 2.6 percentage points from 2012 and up 14.9 percentage points from 2004.
Similarly, the percentage of students indicating their financial aid packages as “very important” in their college choice decision is also at its highest point in the 42-year history of the item. Nearly half (48.7%) of students reported that their current institution’s financial aid offer was a “very important” factor in their decision to enroll at that campus—up from 33.7% in 2004.
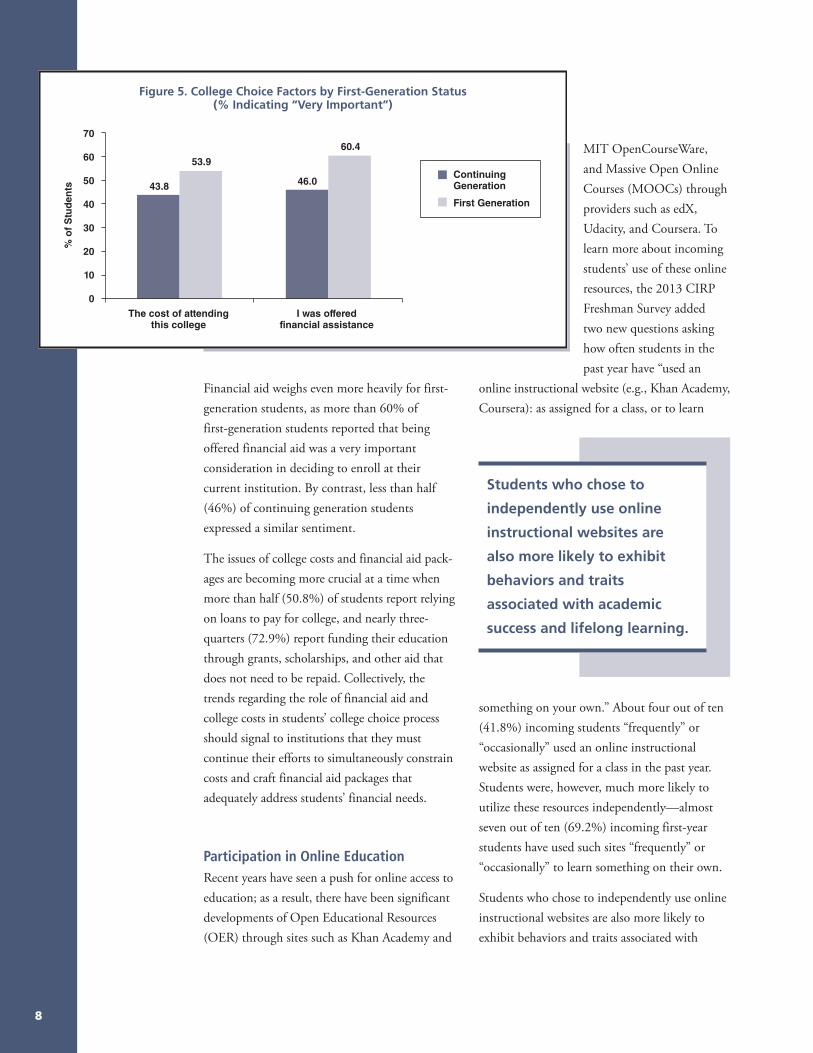
Parsing the data by education levels of students’ parents reveals that college costs and financial aid packages are particularly salient for first-generation students (i.e., students in families where neither parent attended any college). Figure 5 breaks down financial aid and cost concerns by first-generation status. The findings indicate that more than half (53.9%) of first-generation students reported that the cost of attendance at their current institution was a “very important” factor in their decision to enroll at that college. By contrast, 43.8% of continuing generation students rated cost of attendance as being “very important” in their enrollment decision.
% o
f S
tud
ents
60
70
50
40
30
20
10
0
19771974 1980 1983 1986 1989 1992 1995 1998 2001 2004 2007 2010 2013
I was offeredfinancial assistance
The cost of attendingthis college
This college has a very goodacademic reputation
This college’s graduatesget good jobs
Figure 4. Top Reasons for Choosing Current Institution (% Indicating “Very Important”)
8
Financial aid weighs even more heavily for first-generation students, as more than 60% of first-generation students reported that being offered financial aid was a very important consideration in deciding to enroll at their current institution. By contrast, less than half (46%) of continuing generation students expressed a similar sentiment.
The issues of college costs and financial aid pack-ages are becoming more crucial at a time when more than half (50.8%) of students report relying on loans to pay for college, and nearly three-quarters (72.9%) report funding their education through grants, scholarships, and other aid that does not need to be repaid. Collectively, the trends regarding the role of financial aid and college costs in students’ college choice process should signal to institutions that they must continue their efforts to simultaneously constrain costs and craft financial aid packages that adequately address students’ financial needs.
Participation in Online EducationRecent years have seen a push for online access to education; as a result, there have been significant developments of Open Educational Resources (OER) through sites such as Khan Academy and
MIT OpenCourseWare, and Massive Open Online Courses (MOOCs) through providers such as edX, Udacity, and Coursera. To learn more about incoming students’ use of these online resources, the 2013 CIRP Freshman Survey added two new questions asking how often students in the past year have “used an
online instructional website (e.g., Khan Academy, Coursera): as assigned for a class, or to learn
The cost of attending this college
% o
f S
tud
ents
I was offered financial assistance
43.8
70
60
50
40
30
20
10
0
53.9
46.0
60.4
ContinuingGeneration
First Generation
Figure 5. College Choice Factors by First-Generation Status (% Indicating “Very Important”)
Students who chose to
independently use online
instructional websites are
also more likely to exhibit
behaviors and traits
associated with academic
success and lifelong learning.
something on your own.” About four out of ten (41.8%) incoming students “frequently” or “occasionally” used an online instructional website as assigned for a class in the past year. Students were, however, much more likely to utilize these resources independently—almost seven out of ten (69.2%) incoming first-year students have used such sites “frequently” or “occasionally” to learn something on their own.
Students who chose to independently use online instructional websites are also more likely to exhibit behaviors and traits associated with

9
academic success and life-long learning, measured by the CIRP Habits of Mind construct. Table 1 shows the proportion of students engaging in instructional websites by their Habits of Mind construct scores. Among the students who “frequently” used an online instructional website to learn something on their own, 42.3% scored in the high Habits of Mind group and only 15.4% in the low group. By comparison, of the incoming students who “occasionally” or never used instructional websites to learn something on their own, only 22.3% and 25.5%, respectively, scored in the high group.
As colleges and universities across the country have been increasing online course offerings to accommodate larger enrollments and constrain costs, the 2013 CIRP Freshman Survey also included two new items asking incoming students whether they expected to take a course exclusively online either at their institution or at a different institution. Overall, few incoming first-year students indicated there is a “very good chance” that they will enroll in online courses while attending college (6.5% at their institution and 2.9% at a different institution).
Students’ expectations to take courses online at their institution also vary by the type of institution in which they enroll. As shown in Figure 6, a substantially higher percentage of students at Historically Black Colleges and Universities (HBCUs) than students attending other
institution types expect there to be a “very good chance” that they will take a course exclusively online at their institution (13.9%). By contrast, students attending private colleges and universities are among the least likely to expect to enroll in online courses at their institutions (5.8% at private colleges, 3.9% at private universities).
Students who have used an online instructional website in the past year are also more likely to be drawn to taking courses online while in college. Nearly 30% of incoming first-year students who used an online instruc-tional website frequently in the past year indicate there is either “some chance” or a “very good chance” they will take a course exclusively online at their institution.
Table 1. Habits of Mind among Students Who Used an Online Instructional Website in the Past Year
Used an online instructional website (e.g., Khan Academy, Coursera) TFS Habits of Mind Group
to learn something on your own Low Average High
Not at all 31.6 42.9 25.5
Occasionally 34.7 43.0 22.3
Frequently 15.4 42.3 42.3
3.9
5.8 6.7
8.0
13.9
0
2
4
6
8
10
12
14
16
PrivateUniversities
Private 4-Year Colleges
Public Universities
Public 4-Year Colleges
HBCUs
% o
f S
tud
ents
Figure 6. Students’ Expectations That They Will Take a Course Exclusively Online at Their Institution, by Institution Type
(% Indicating “Very Good Chance”)
Students who have used
an online instructional
website in the past year
are also more likely to be
drawn to taking courses
online while in college.

10
Taking Stock of Students’ Views One Year after Obama’s Re-ElectionFreshmen started college in 2013 slightly less than a year after Barack Obama was re-elected for a second term; the year since his re-election featured a great deal of political wrangling both in Washington, D.C. and in the states. In June of 2013, the Supreme Court issued a landmark ruling in United States vs. Windsor, striking down a key portion of the Defense of Marriage Act (DOMA) that denied federal benefits to married same-sex couples. The shooting at Sandy Hook Elementary School sparked an intense debate on gun control both in Congress and in the states. Congress passed a hotly contested bill that raised taxes on the wealthiest Americans, and the Senate passed a comprehensive immigration reform package. Given these widely publicized political debates, we examined students’ political views related to some of these events.
Gays’ and Lesbians’ Right to Adopt a Child. In 2013, the survey included a question on gays’ and lesbians’ right to legally adopt a child, and the vast majority of first-year students were supportive (83.3%). First introduced three years
ago, this is the second time this item has appeared on the CIRP Freshman Survey. As reported in 2010, over three quarters (76.5%) of students were supportive of gays’ and lesbians’ right to adoption; this year’s support increased by 6.8 percentage points. Last year’s survey results also showed widespread support of same-sex marriage (75.0%) among first-year students.
Although most students are supportive, and both men and women have increased their support since 2010, women continue to be considerably more supportive than men. In 2013, 86.8% of women and 79.2% of men endorsed the rights of gays and lesbians to adopt children, compared to 2010 when 82.1% of women and 69.8% of men supported this senti-ment (see Figure 7). These findings, coupled with students’ support in 2012 of same-sex
marriage, underscore the overwhelming support for gay rights among college students.
Undocumented Students
and Access to Public
Education. While Congress continues to debate a comprehensive immigration reform package, undocu-mented students have garnered support for access to higher education with state-level DREAM Acts
69.8
79.282.186.8
0
10
20
30
40
50
60
70
80
90
100
2010 2013
% o
f S
tud
ents
Men
Women
Figure 7. Support for Gays and Lesbians to Legally Adopt a Child, by Year and Sex (% Indicating “Agree Strongly” or “Agree Somewhat”)
Incoming college
students have voiced
stronger and stronger
support over time for
undocumented students’
access to education.

11
having passed in over a dozen states. The freshman cohort of 2013 posted the lowest level of support for the idea that undocumented immigrants should be denied access to public education since the question was first asked in 1996. Figure 8 shows an overall drop from 56.3% in 1996 to 40.7% in 2013, a 15.6 percentage point drop, and a steady decline since 2008. Thus incoming college students have voiced stronger and stronger support over time for undocumented students’ access to education.
Regional differences persist in support for the idea of granting access to public education among undocumented students, and this is reflected by only some states having enacted legislation allowing undocumented students to pay in-state tuition rates to facilitate their access to a college education. Students attending insti-tutions located in the Far West (69.4%) and the Plains states (64.7%) were the most likely to support allowing undocumented students to access public education. These regions include California, Kansas, and Nebraska, all states that have passed measures supportive of undocu-mented students being granted access to education. By contrast, students at colleges and universities in the Southwest (48.5%) and Rocky Mountains (49.7%) were among the most likely
to support the notion of denying access to public education for undocumented students.
Raising Taxes. In the year after Congress passed the first set of significant tax increases on the wealthy since the Clinton administration, incoming freshmen’s support of raising taxes to
reduce the deficit has reached its highest level since this question was first asked in 1985, with over a third (36.9%) of incoming students in agreement (see Figure 8). Last year we reported on the substantial increase in students’ agree-ment that wealthier people should pay more taxes, and support for this idea jumped another 3.5 percentage points in 2013. Now more than two-thirds (68.1%) endorse the idea that wealthier people should pay a larger share of taxes than they do now. Economic populism appears to be resonating with this year’s college freshmen.
15
25
35
45
55
65
75
85
95
1974 1977 1980 1983 1986 1989 1992 1995 1998 2001 2004 2007 2010 2013
% o
f S
tud
ents
The federal government should raise taxes to help reduce the deficit
Wealthier people should pay a larger share of taxes than they do nowUndocumented immigrants should be denied access to public education
The federal government should do more to control the sale of handguns
Figure 8. Trends on Students’ Political and Social Views (% Indicating “Agree Strongly” or “Agree Somewhat”)
Now more than two-thirds (68.1%)
endorse the idea that wealthier
people should pay a larger share
of taxes than they do now.
12
As the government struggles for bipartisan agree-ments on budget issues, differences in support for increased taxes to reduce the deficit and for increasing taxes on the wealthy are apparent across students’ political ideologies. Nearly half (49.7%) of all students identifying as liberal or far left agree that the government should raise taxes to reduce the deficit, which compares to just more than a third (35.1%) of students iden-tifying as middle of the road and a quarter (25.1%) of students with conservative or far right political ideologies.
Control of Handgun Sales. Another closely watched political issue in 2013 was gun control. Since 1989 first-year students have responded to an item on the CIRP Freshman Survey regarding their level of agreement with a statement that the federal government should do more to control the sale of handguns. Support peaked in 1998 with over eight out of ten students (84.1%) supporting the federal government in controlling handgun sales (see Figure 8). In 2013, just over six out of ten students (63.8%) supported stronger gun control from the federal government, an overall drop of 20 percentage
points from this item’s 1998 peak. While the majority of students still support this statement, the level of support has diminished since 1998.
The political ideological divides are even starker in the case of gun control compared to taxes, with just over one-third (36.5%) of conservative and far right students endorsing stronger gun control compared to 82.2% of liberal and far left students. Nearly two-thirds (64.8%) of students identifying their political ideology as “middle of the road” agreed that the federal government should do more to control the sale of handguns.
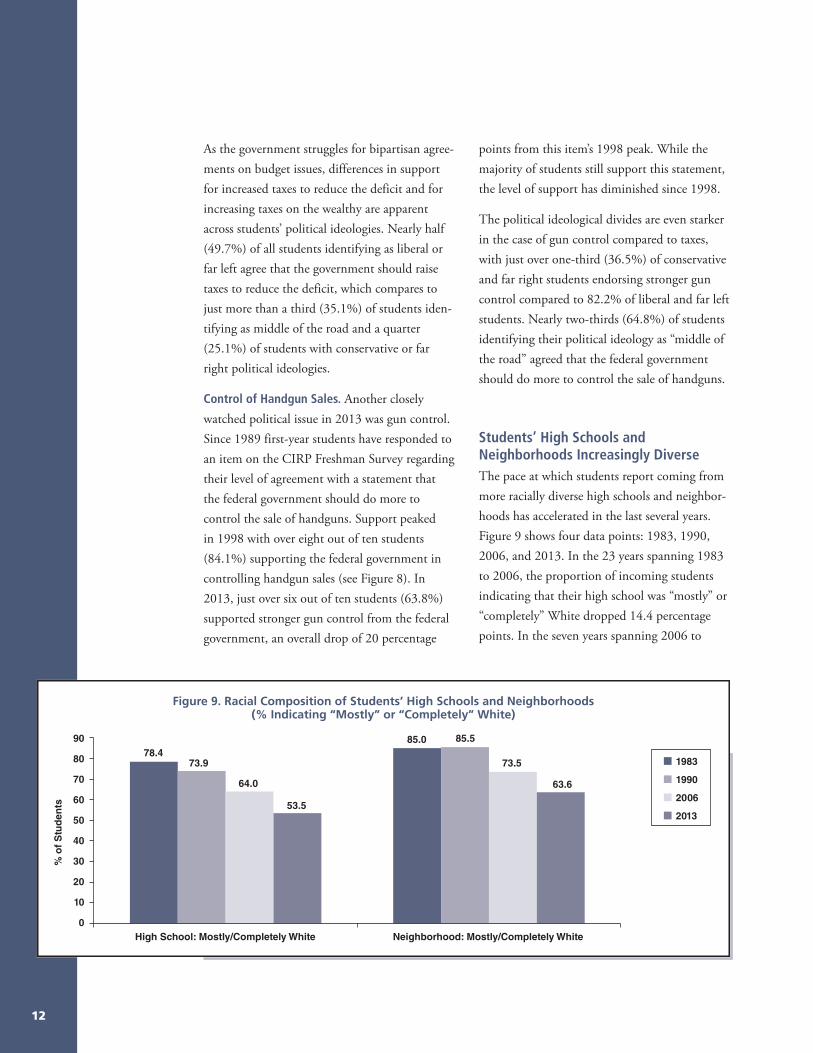
Students’ High Schools and Neighborhoods Increasingly DiverseThe pace at which students report coming from more racially diverse high schools and neighbor-hoods has accelerated in the last several years. Figure 9 shows four data points: 1983, 1990, 2006, and 2013. In the 23 years spanning 1983 to 2006, the proportion of incoming students indicating that their high school was “mostly” or “completely” White dropped 14.4 percentage points. In the seven years spanning 2006 to
High School: Mostly/Completely White
% o
f S
tud
ents
Neighborhood: Mostly/Completely White
78.473.9
64.0
53.5
85.0 85.5
73.5
63.670
80
90
60
50
40
30
20
10
0
1983
1990
2006
2013
Figure 9. Racial Composition of Students’ High Schools and Neighborhoods (% Indicating “Mostly” or “Completely” White)
13
2013, that figure has dropped another 10.5 percentage points, with just more than half (53.5%) of students indicating their high school was “mostly” or “completely” White.
Similarly, neighborhoods are rapidly becoming more racially diverse. Between 1983 and 2006, the proportion of students indicating that their neighborhood was “mostly” or “completely” White dropped 11.5 points from 85% to 73.5%. In the seven years since 2006, the proportion of students indicating they came from a neighbor-hood that was “mostly” or “completely” White fell nearly 10 more percentage points to 63.6%.
These data point to large demographic changes currently underway across the U.S., and they correspond with the increasing racial diversity of the student sample represented in the CIRP Freshman Survey. The data portend substantial shifts in the composition of future incoming cohorts at colleges and universities nation- wide, and campuses need to consider how to accommodate the needs of a more diverse student body.
Skills for a Diverse WorkplaceThe 2013 CIRP Freshman Survey had a new set of response options for items developed from research on preparing college students for a
diverse workplace and democracy, following longitu-dinal research on the pluralistic orienta-tion scale (Engberg & Hurtado, 2011; Hurtado, 2005). The new response categories ask whether students view each skill as “a major strength,” “some- what strong,” “average,” “somewhat weak,” or “a major weakness” for survey items shown in Table 2. Although previous CIRP items are not comparable in terms of trends, the survey items now correspond with published empirical evidence. This research identifies the college experiences associated with gains students make while in college on a set of cognitive and inter-personal skills that compose the pluralistic orientation scale.
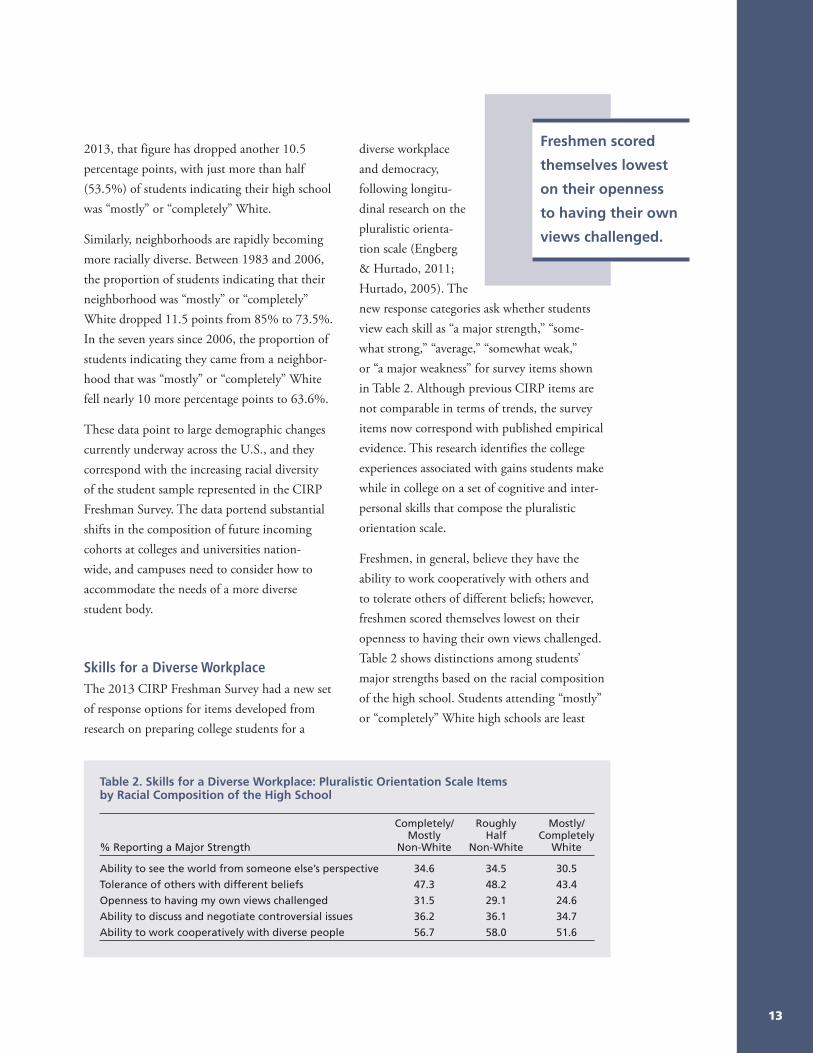
Freshmen, in general, believe they have the ability to work cooperatively with others and to tolerate others of different beliefs; however, freshmen scored themselves lowest on their openness to having their own views challenged. Table 2 shows distinctions among students’ major strengths based on the racial composition of the high school. Students attending “mostly” or “completely” White high schools are least
Table 2. Skills for a Diverse Workplace: Pluralistic Orientation Scale Items by Racial Composition of the High School
Completely/ Roughly Mostly/ Mostly Half Completely % Reporting a Major Strength Non-White Non-White White
Ability to see the world from someone else’s perspective 34.6 34.5 30.5
Tolerance of others with different beliefs 47.3 48.2 43.4
Openness to having my own views challenged 31.5 29.1 24.6
Ability to discuss and negotiate controversial issues 36.2 36.1 34.7
Ability to work cooperatively with diverse people 56.7 58.0 51.6
Freshmen scored
themselves lowest
on their openness
to having their own
views challenged.

14
confident across all the skill measures of perspective-taking, tolerance, openness, ability to discuss controversial issues, or cooperation with diverse people. For example, only one quarter (24.6%) of students at predominantly White high schools indicate openness to having their own views challenged as a “major strength,” compared with 31.5% of students at non-White and 29.1% of students from roughly half non-White high schools. These different experiences and skills become evident in classrooms and interactions on college campuses, requiring faculty and staff to be attentive to students’ backgrounds and how they can move students from their own embedded worldviews.
Revised Careers in 2013We revised the list of career categories for students and their parents on the 2013 CIRP Freshman Survey in an effort to modernize the set of options offered (Appendix E shows how the new career categories map onto the previous ones). We more than doubled the number of career options in business (going from five cate-gories to eleven) and added three new choices to better distinguish the broad category of education (early childcare provider, librarian, and teacher’s assistant/ paraprofessional). We also created a new aggregated category referred to as “Service/Industry.” This new service/industry category included new occupations such as custodian/janitor/housekeeper, food service, and hair stylist. Additionally, existing careers related to skilled trades and interior design were included in this broad classification.
Expanding the set of career options available for students to select had the desired effect of substantially reducing the proportion of students who selected “other.” In 2012, 11.5% of
students did not find a relevant career category in our list and opted to mark “other.” In 2013, the proportion of students marking “other” dropped to just 4.9%, showing that the updated categories are capturing more of students’ intended future careers.
Business continues to be the most popular career aspiration for entering college students, as 13% of incoming first-time, full-time students reported planning to pursue a career in business after graduation. Roughly 11% of students reported aspirations to be a medical doctor, surgeon, dentist, or orthodontist. Health care support (e.g., home health worker, medical/dental assistant) was the third most popular career aspiration with 9.2% of students indi-cating plans to pursue an occupation in this area.
Another change made to the career question in 2013 had to do with how students reported their parents’ occupational status. In previous surveys, students had the option of choosing “unemployed” as a career category for each of their parents. In the survey redesign process, we decided to ask students about their parents’ employment status separately from parents’ careers. This new employment status question included three options: employed, unemployed, and retired.
Having students report parental employment status this way significantly changed unemploy-ment rates for parents when compared against previous CIRP Freshman Survey administra-tions. For example, in 2012, 9.1% of students reported that their mother was unemployed and 4.7% of students indicated that their father was unemployed. In 2013, 20.5% of students indicated their mother was unemployed, and 8.5% reported their father was unemployed.

15
Digging into the data, we found that students were more likely to report a parent as unem-ployed if that parent also had a designated occupation/career as a homemaker. For example, 13.8% of students reported that their mother worked as a homemaker, and 57.1% of those respondents also indicated that their mother was unemployed.
Given that students now have the option of identifying a career or occupation for each parent and indicating each parent’s current employment status, the proportion of students indicating that they have an unemployed parent is no longer comparable to previous years’ surveys.

16
References
Eagan, M. K. (2013, February). The plight of part-time faculty. University Business. http://www.universitybusiness.com/article/plight-part-time-faculty.
Eagan, M. K., Hurtado, S., Chang, M. J., Garcia, G., Herrera, F., & Garibay, J. (2013). Making a difference in science education: The impact of undergraduate research programs. American Educational Research Journal, 50(4), 683–713.
Engberg, M., & Hurtado, S. (2011). Developing pluralistic skills and dispositions in college: Examining racial/ethnic group differences. Journal of Higher Education, 82(4), 416–443.
Fuentes, M. V., Ruiz Alvarado, A., Berdan, J., and DeAngelo, L. (2013). Mentorship matters: Does early faculty contact lead to quality faculty interaction? Research in Higher Education, (online version).
Herrera, F. A., Garibay, J. C., Garcia, G. A., & Johnston, M. P. (2013). Documenting attitudes toward undocumented immigrant access to public education: A multilevel analysis. The Review of Higher Education, 36(4), 513–549.
Hurtado, S. (2005). The next generation of diversity and intergroup relations research. Journal of Social Issues, 61(3), 595–610.
Hurtado, S. & Figueroa, T. (2013). Women of color among STEM faculty: Experiences in academia. Proceedings of the National Academy of Sciences Conference, “Seeking Solutions: Maximizing American Talent by Advancing Women of Color in Academia.” Washington, DC.
Hurtado, S. & Ruiz Alvarado, A. (2013). Diversity in teaching and learning: Affirming students as empowered learners. Diversity & Democracy: Civic Learning for Shared Futures, 16(3).
Park, J. J., & Denson, N. (2013). When race and class both matter: The relationship between socio-economic diversity, racial diversity, and student reports of cross-class interaction. Research in Higher Education, 54(7).
Park, J. J., Denson, N., & Bowman, N. A. (2013). Does socioeconomic diversity make a difference? Examining the effects of racial and socioeconomic diversity on the campus climate for diversity. American Educational Research Journal, 50(3), 466–496.
Victorino, C., Nylund-Gibson, K., & Conley, S. (2013). Campus racial climate: A litmus test for faculty satisfaction at four-year colleges and universities. Journal of Higher Education, 84(6).

2013 National Norms
All First-Time, Full-Time Freshmen by Institutional Type
Please refer to the HERI website publications section for information on how to obtain the expanded set of tables. http://heri.ucla.edu/research-publications.php


2013 CIRP Freshman Survey Weighted National Norms—All Respondents
Baccalaureate Black Colleges All Bacc Institutions 4-year Colleges Universities and Universities Institutions 4-yr Coll Universities Public Private Nonsec Catholic Oth Relig Public Private All HBCU Public Private
19
First-Time, Full-Time Freshmen 165,558 96,488 69,070 33,635 62,853 28,699 13,777 20,377 43,363 25,707 3,995 2,670 1,325How old will you be on December 31 of this year?
17 or younger 2.0 1.9 2.1 2.1 1.7 1.7 1.7 1.6 2.1 2.1 2.9 2.7 3.218 68.8 67.5 70.2 69.3 65.2 67.0 69.8 61.3 70.5 69.1 67.2 65.6 70.319 27.7 28.5 26.8 26.4 31.2 29.3 27.1 34.9 26.5 27.9 26.1 27.5 23.620 or older 1.5 2.1 0.9 2.2 2.0 2.0 1.4 2.2 0.9 0.9 3.8 4.3 2.8
Is English your native language?Yes 89.4 90.4 88.4 88.8 92.4 90.7 90.7 94.9 88.7 87.1 97.6 97.7 97.5No 10.6 9.6 11.6 11.2 7.6 9.3 9.3 5.1 11.3 12.9 2.4 2.3 2.5
In what year did you graduate from high school?2013 98.0 97.4 98.7 97.1 97.7 97.5 98.5 97.5 98.8 98.4 96.3 95.5 97.92012 1.4 1.8 0.9 2.0 1.6 1.7 1.0 1.7 0.8 1.2 2.3 2.8 1.22011 or earlier 0.5 0.7 0.3 0.8 0.6 0.7 0.5 0.7 0.3 0.3 1.2 1.4 0.8Passed G.E.D./Never completed high school 0.1 0.1 0.1 0.1 0.1 0.1 0.1 0.1 0.1 0.1 0.2 0.2 0.0
Are you enrolled (or enrolling) as a:Full-time student 100.0 100.0 100.0 100.0 100.0 100.0 100.0 100.0 100.0 100.0 100.0 100.0 100.0Part-time student 0.0 0.0 0.0 0.0 0.0 0.0 0.0 0.0 0.0 0.0 0.0 0.0 0.0
How many miles is this college from your permanent home?
5 or less 5.5 6.5 4.4 7.8 4.9 4.3 7.0 4.5 4.5 4.0 5.8 6.4 4.86 to 10 7.0 8.0 6.0 9.9 5.5 4.7 9.5 4.4 6.2 5.0 5.8 5.6 6.111 to 50 25.6 26.5 24.5 30.8 21.3 17.9 31.0 19.9 25.3 21.5 17.1 17.8 15.751 to 100 15.5 16.8 14.2 16.3 17.3 16.5 16.2 18.5 15.6 8.6 17.3 20.6 11.2101 to 500 29.5 26.4 32.9 23.6 29.7 29.8 23.0 32.9 35.0 24.1 31.1 34.5 24.9Over 500 16.9 15.9 18.0 11.5 21.2 26.8 13.2 19.8 13.4 36.9 22.8 15.1 37.2
What was your average grade in high school?A or A+ 25.8 19.4 32.8 15.5 24.2 24.8 21.8 24.8 31.3 38.8 12.4 9.1 18.7A- 27.0 22.9 31.4 20.7 25.5 27.0 25.7 24.0 31.1 32.4 13.5 11.5 17.2B+ 21.3 23.4 19.0 24.8 21.6 21.7 24.6 20.1 19.5 16.7 23.4 22.5 25.1B 17.6 22.1 12.7 25.6 17.8 17.2 18.5 18.0 13.5 9.3 23.1 24.8 19.8B- 5.1 7.4 2.7 8.4 6.1 5.8 5.6 6.7 2.9 2.0 13.3 15.7 8.6C+ 2.4 3.7 1.0 3.8 3.5 2.6 2.8 4.6 1.2 0.5 11.2 12.9 7.9C 0.8 1.1 0.4 1.1 1.2 0.8 0.9 1.6 0.5 0.2 3.0 3.3 2.5D 0.0 0.0 0.0 0.0 0.1 0.0 0.0 0.1 0.0 0.0 0.1 0.1 0.2
From what kind of high school did you graduate?Public school (not charter or magnet) 75.8 77.0 74.5 82.3 70.4 69.9 62.9 74.5 78.3 59.0 78.2 83.8 67.5Public charter school 2.9 3.6 2.2 4.3 2.8 2.6 3.6 2.6 2.4 1.5 6.3 4.8 9.1Public magnet school 3.5 3.0 4.1 3.3 2.7 3.2 2.4 2.3 4.4 2.8 7.1 6.8 7.7Private religious/parochial school 10.9 9.8 12.0 6.6 13.8 10.5 22.5 12.8 9.9 20.6 5.3 2.6 10.5Private independent college-prep school 6.3 5.8 6.9 3.1 9.1 13.2 7.7 5.9 4.7 15.6 2.8 1.8 4.9Home school 0.6 0.8 0.4 0.4 1.2 0.6 0.8 2.0 0.3 0.5 0.2 0.2 0.4

2013 CIRP Freshman Survey Weighted National Norms—All Respondents
Baccalaureate Black Colleges All Bacc Institutions 4-year Colleges Universities and Universities Institutions 4-yr Coll Universities Public Private Nonsec Catholic Oth Relig Public Private All HBCU Public Private
Prior to this term, have you ever taken courses for credit at this institution?
Yes 5.4 5.5 5.2 5.8 5.2 4.2 6.4 5.5 5.4 4.4 7.9 6.0 11.6No 94.6 94.5 94.8 94.2 94.8 95.8 93.6 94.5 94.6 95.6 92.1 94.0 88.4
Since leaving high school, have you ever taken courses, whether for credit or not for credit, at any other institution (university, 4- or 2-year college, technical, vocational, or business school)?
Yes 10.8 11.2 10.4 11.4 11.0 10.3 10.3 11.9 10.7 9.1 13.3 11.6 16.5No 89.2 88.8 89.6 88.6 89.0 89.7 89.7 88.1 89.3 90.9 86.7 88.4 83.5
Where do you plan to live during the fall term?With my family or other relatives 17.3 19.8 14.5 27.0 11.0 10.3 18.6 7.9 15.4 10.8 9.5 8.1 12.2Other private home, apartment, or room 2.5 2.0 3.0 2.9 0.9 1.1 1.1 0.7 3.6 0.6 2.4 2.5 2.1College residence hall 76.9 74.9 79.0 65.7 86.4 86.6 79.3 89.8 77.0 87.4 85.3 86.2 83.7Fraternity or sorority house 0.6 0.2 1.0 0.1 0.3 0.7 0.0 0.0 1.2 0.0 0.1 0.1 0.1Other campus student housing 2.4 2.7 2.1 3.8 1.2 1.2 0.9 1.4 2.4 1.0 2.3 2.7 1.7Other 0.3 0.3 0.3 0.4 0.2 0.1 0.1 0.2 0.3 0.1 0.4 0.5 0.3
To how many colleges other than this one did you apply for admission this year?
None 10.9 11.6 10.3 12.1 10.9 10.2 8.8 12.6 11.6 4.6 8.0 8.6 6.91 8.4 8.6 8.1 9.1 8.1 6.7 6.3 10.3 9.3 3.3 6.5 6.6 6.12 11.3 11.7 11.0 12.2 11.0 9.0 9.0 13.9 12.4 5.1 11.9 12.4 10.83 14.4 15.4 13.4 16.0 14.5 12.2 13.2 17.4 14.6 8.4 17.6 18.2 16.54 12.9 14.1 11.6 14.7 13.3 12.5 12.4 14.6 12.0 10.0 16.3 17.7 13.55 10.5 10.9 10.0 10.7 11.2 11.6 12.1 10.4 9.8 10.9 12.6 12.3 13.06 8.0 7.8 8.2 7.6 8.0 8.9 9.7 6.4 7.6 10.9 8.5 8.0 9.57 to 10 17.7 15.2 20.4 14.1 16.7 20.6 21.0 10.8 17.5 32.1 12.0 10.3 15.311 or more 5.9 4.7 7.0 3.5 6.3 8.4 7.5 3.7 5.2 14.6 6.6 5.7 8.4
Were you accepted by your first choice college?Yes 75.6 78.4 72.4 77.0 80.2 76.9 78.9 84.1 74.2 65.4 75.6 74.4 78.1No 24.4 21.6 27.6 23.0 19.8 23.1 21.1 15.9 25.8 34.6 24.4 25.6 21.9
Is this college your:First choice 56.9 57.3 56.5 55.5 59.5 58.2 56.7 62.0 57.2 53.6 38.5 36.4 42.5Second choice 27.1 27.5 26.6 29.0 25.7 26.5 28.3 23.6 26.3 27.8 31.5 33.6 27.6Third choice 9.9 9.8 10.1 9.9 9.6 10.0 10.1 9.0 9.8 11.3 16.5 16.8 16.1Less than third choice 6.1 5.4 6.8 5.5 5.3 5.3 4.9 5.4 6.7 7.3 13.4 13.2 13.8
The current economic situation significantly affected my college choice:
Agree strongly 26.4 27.0 25.7 28.8 24.9 25.2 27.6 23.3 26.6 22.1 28.0 27.4 29.2Agree somewhat 42.1 43.3 40.8 44.2 42.2 39.9 42.8 44.0 41.5 37.7 39.3 40.7 36.6Disagree somewhat 18.6 17.9 19.3 16.5 19.6 19.5 18.4 20.4 18.7 21.7 20.7 20.5 21.1Disagree strongly 13.0 11.8 14.3 10.6 13.3 15.4 11.3 12.3 13.2 18.5 12.0 11.4 13.1
20

21
2013 CIRP Freshman Survey Weighted National Norms—All Respondents
Baccalaureate Black Colleges All Bacc Institutions 4-year Colleges Universities and Universities Institutions 4-yr Coll Universities Public Private Nonsec Catholic Oth Relig Public Private All HBCU Public Private
Citizenship status:U.S. citizen 95.4 96.0 94.8 96.5 95.4 93.6 96.5 96.6 95.4 92.2 98.2 98.3 98.0Permanent resident (green card) 2.2 2.0 2.3 2.4 1.5 1.8 1.9 1.0 2.4 2.3 1.0 1.0 0.8Neither 2.4 2.0 2.9 1.1 3.1 4.6 1.5 2.4 2.3 5.5 0.9 0.7 1.2
Are your parents:Both alive and living with each other 69.3 65.1 73.8 62.7 68.1 69.3 69.6 66.2 72.5 79.3 33.3 30.3 38.9Both alive, divorced or living apart 27.2 30.9 23.2 33.2 28.1 26.9 26.4 30.2 24.4 17.9 59.8 62.5 54.7One or both deceased 3.5 4.0 3.0 4.1 3.8 3.9 4.0 3.6 3.1 2.8 6.9 7.2 6.4
How many AP courses did you take in high school?
Not offered at my high school 6.3 7.3 5.2 5.8 9.0 8.7 6.6 10.4 4.8 6.8 7.8 7.2 9.0None 21.0 29.7 11.9 32.1 26.7 23.7 27.8 28.9 12.6 9.2 40.0 45.7 29.21 to 4 47.6 48.4 46.9 49.1 47.4 46.8 51.3 46.1 48.2 41.3 43.5 40.6 49.05 to 9 22.1 13.2 31.5 11.6 15.2 18.6 13.3 12.8 30.3 36.4 7.1 5.1 10.810 to 14 2.7 1.2 4.3 1.1 1.4 1.9 0.8 1.3 3.9 5.8 0.9 0.8 1.215+ 0.3 0.3 0.3 0.2 0.3 0.3 0.2 0.4 0.2 0.5 0.7 0.7 0.8
How many AP exams did you take in high school?Not offered at my high school 6.5 7.8 5.1 6.6 9.3 8.6 6.8 11.3 4.9 6.1 8.5 8.0 9.3None 27.1 37.3 16.4 40.1 33.9 30.1 35.0 37.2 17.4 12.6 48.6 54.9 36.81 to 4 44.8 43.5 46.2 43.6 43.3 44.3 46.8 40.6 47.0 42.8 36.9 32.9 44.45 to 9 19.1 10.4 28.3 8.9 12.2 15.5 10.7 9.7 27.1 33.4 5.0 3.2 8.510 to 14 2.2 0.9 3.7 0.7 1.0 1.4 0.5 0.8 3.4 4.8 0.5 0.6 0.315+ 0.2 0.2 0.3 0.1 0.2 0.2 0.1 0.3 0.2 0.4 0.5 0.4 0.6
Please mark which of the following courses you have completed:
Algebra II 98.0 97.4 98.7 97.9 96.7 96.8 97.6 96.2 98.8 98.1 96.0 96.2 95.6Pre-calculus/Trigonometry 85.1 79.7 90.7 78.7 80.9 84.7 83.8 75.5 89.9 94.0 70.2 66.1 77.2Probability & Statistics 32.4 30.8 34.0 29.2 32.6 34.4 29.1 32.7 34.0 34.0 25.4 21.6 32.0Calculus 36.6 27.3 45.8 23.9 31.3 36.7 29.3 27.2 43.9 53.0 18.5 15.1 24.4AP Probability & Statistics 19.3 13.2 25.4 12.0 14.7 17.0 12.5 13.6 25.0 27.1 8.9 7.1 12.1AP Calculus 35.9 22.7 48.6 20.3 25.6 31.5 22.6 21.3 47.0 55.1 14.8 11.1 21.0
Have you had any special tutoring or remedial work in any of the following subjects?
English 9.6 11.4 7.7 11.1 11.8 11.3 12.2 12.0 7.6 8.1 18.5 19.0 17.4Reading 8.3 10.0 6.4 9.6 10.4 9.5 11.1 10.8 6.5 6.4 17.5 17.3 17.7Mathematics 17.9 20.2 15.4 19.4 21.3 21.8 22.1 20.3 14.7 17.9 22.6 22.4 23.0Social Studies 6.0 7.4 4.5 7.3 7.6 6.8 8.4 8.0 4.4 4.6 15.0 14.7 15.3Science 8.4 9.6 7.1 9.0 10.3 10.3 11.4 9.8 6.7 8.6 14.8 14.8 14.9Foreign Language 7.6 9.0 6.2 8.5 9.6 9.3 10.2 9.7 5.9 7.2 14.5 14.6 14.2Writing 7.7 9.1 6.2 8.5 9.7 9.4 10.2 9.7 6.0 6.9 15.0 15.1 14.8
Do you feel you will need any special tutoring or remedial work in any of the following subjects?
English 11.3 12.7 9.8 12.9 12.4 12.2 11.6 13.1 10.1 8.6 15.2 16.0 13.6Reading 6.5 7.3 5.7 7.5 7.1 7.1 7.0 7.2 5.7 5.6 9.5 10.8 7.0Mathematics 27.2 31.2 22.9 34.0 27.8 26.7 28.0 28.7 23.9 18.6 39.5 41.3 36.0Social Studies 5.1 5.9 4.3 6.1 5.7 5.2 5.3 6.4 4.4 3.7 12.3 13.6 9.9Science 15.4 16.5 14.2 16.7 16.4 16.0 17.4 16.3 14.7 12.1 22.5 23.0 21.5Foreign Language 13.2 16.1 10.2 15.9 16.3 15.1 15.3 17.9 10.2 10.2 29.0 29.7 27.8Writing 15.1 17.0 13.0 16.8 17.2 17.5 16.6 17.2 13.1 12.9 19.9 21.2 17.5

22
2013 CIRP Freshman Survey Weighted National Norms—All Respondents
Baccalaureate Black Colleges All Bacc Institutions 4-year Colleges Universities and Universities Institutions 4-yr Coll Universities Public Private Nonsec Catholic Oth Relig Public Private All HBCU Public Private
Do you consider yourself:Pre-Med 22.3 19.9 24.8 19.1 20.8 19.0 25.3 20.2 25.6 21.7 33.9 27.5 45.8Pre-Law 7.0 7.1 7.0 6.9 7.2 8.0 6.6 6.8 6.5 8.8 13.4 14.1 12.1
Your intended major:Arts and Humanities
Art, fine and applied 1.4 1.9 0.9 1.6 2.2 3.5 1.0 1.5 0.9 0.9 0.8 0.9 0.4English (language and literature) 1.4 1.6 1.3 1.4 1.8 2.1 1.7 1.6 1.2 1.5 0.6 0.4 1.1History 1.0 1.2 0.7 1.2 1.3 1.3 0.9 1.4 0.7 0.9 0.5 0.5 0.5Journalism/Communication 2.2 2.1 2.2 2.0 2.3 2.3 2.6 2.2 1.9 3.5 2.4 2.7 1.8Classical and Modern Languages and Literature 0.3 0.3 0.3 0.2 0.4 0.4 0.2 0.4 0.3 0.3 0.0 0.0 0.0Media/Film Studies 0.9 1.2 0.7 1.3 0.9 1.1 0.4 1.1 0.5 1.1 0.7 0.4 1.2Music 1.3 1.5 1.0 1.3 1.7 1.4 0.5 2.6 1.0 1.2 1.4 1.6 1.0Philosophy 0.2 0.2 0.2 0.1 0.2 0.3 0.2 0.2 0.2 0.3 0.2 0.3 0.1Theatre/Drama 0.9 1.1 0.7 1.0 1.2 1.6 0.3 1.3 0.6 1.1 0.5 0.6 0.4Theology/Religion 0.2 0.3 0.2 0.2 0.6 0.2 0.4 1.0 0.1 0.3 0.4 0.3 0.5Other Arts and Humanities 0.8 1.0 0.7 1.0 0.9 1.0 0.6 1.0 0.6 0.7 0.4 0.4 0.4
Biological & Life SciencesBiology (general) 7.6 7.1 8.2 6.0 8.4 7.6 10.9 7.9 8.1 8.4 14.1 9.1 23.2Animal Biology (zoology) 0.7 0.7 0.7 0.6 0.8 1.0 0.4 0.8 0.8 0.2 0.4 0.3 0.6Ecology & Evolutionary Biology 0.1 0.1 0.2 0.1 0.1 0.1 0.1 0.1 0.2 0.2 0.1 0.1 0.1Marine Biology 0.8 1.0 0.5 1.3 0.6 0.6 0.1 0.7 0.6 0.2 0.1 0.1 0.1Microbiology 0.3 0.1 0.4 0.1 0.1 0.1 0.1 0.1 0.5 0.1 0.1 0.1 0.1Molecular, Cellular, & Developmental Biology 0.6 0.4 0.8 0.5 0.3 0.5 0.3 0.2 0.8 0.7 0.2 0.2 0.2Neurobiology/Neuroscience 1.2 0.5 1.8 0.2 0.9 1.2 0.7 0.8 1.9 1.7 0.3 0.2 0.4Plant Biology (botany) 0.1 0.1 0.1 0.1 0.2 0.1 0.3 0.1 0.1 0.1 0.2 0.1 0.4Agriculture/Natural Resources 0.3 0.3 0.3 0.4 0.3 0.3 0.2 0.4 0.3 0.2 0.7 1.0 0.2Biochemistry/Biophysics 1.6 1.1 2.1 1.0 1.3 1.4 1.1 1.4 2.2 1.8 0.5 0.4 0.6Environmental Science 0.6 0.6 0.6 0.4 0.9 1.2 0.4 0.9 0.6 0.6 0.1 0.1 0.2Other Biological Science 0.8 0.4 1.3 0.4 0.4 0.4 0.3 0.5 1.5 0.5 0.3 0.3 0.4
BusinessAccounting 2.3 2.5 2.1 2.5 2.4 2.1 3.2 2.4 2.0 2.3 2.6 3.1 1.7Business Administration (general) 2.8 3.0 2.6 2.8 3.2 2.5 3.2 3.9 2.4 3.4 3.3 3.4 3.0Entrepreneurship 0.7 0.6 0.7 0.5 0.7 0.8 0.5 0.7 0.6 1.2 0.8 1.0 0.5Finance 2.0 1.1 2.9 0.9 1.4 1.6 2.0 0.8 2.3 5.1 0.9 0.7 1.4Hospitality/Tourism 0.3 0.3 0.3 0.4 0.1 0.1 0.1 0.1 0.4 0.1 0.4 0.5 0.1Human Resources Management 0.1 0.1 0.1 0.2 0.1 0.1 0.1 0.2 0.2 0.1 0.2 0.3 0.0International Business 0.9 0.9 0.9 0.7 1.1 1.5 1.0 0.9 0.8 1.4 0.2 0.3 0.1Marketing 2.2 2.0 2.5 2.0 1.8 1.7 2.7 1.5 2.5 2.8 1.4 1.2 1.7Management 2.0 2.4 1.6 2.5 2.3 2.1 2.7 2.3 1.5 1.7 2.6 3.0 1.7Computer/Management Information Systems 0.3 0.3 0.3 0.3 0.4 0.3 0.4 0.5 0.3 0.1 0.2 0.4 0.0Real Estate 0.1 0.1 0.1 0.1 0.1 0.1 0.1 0.1 0.1 0.1 0.1 0.2 0.1Other Business 0.8 0.7 0.9 0.5 0.9 0.8 0.6 1.1 0.9 0.8 0.4 0.6 0.1
EducationElementary Education 2.0 2.9 1.0 2.9 2.9 2.0 2.6 3.8 1.0 0.9 2.5 2.4 2.7Music/Art Education 0.6 0.8 0.3 0.8 0.7 0.6 0.3 1.0 0.4 0.2 0.8 1.1 0.3Physical Education/Recreation 0.5 0.7 0.2 0.8 0.6 0.2 0.3 1.2 0.2 0.1 1.9 2.8 0.3Secondary Education 1.0 1.1 0.8 0.9 1.4 0.9 1.3 1.8 0.8 0.6 0.9 1.0 0.6Special Education 0.7 0.9 0.4 0.9 1.0 0.8 1.0 1.1 0.4 0.4 0.7 0.9 0.4Other Education 0.4 0.5 0.2 0.6 0.3 0.2 0.3 0.4 0.3 0.1 0.4 0.4 0.3
23
2013 CIRP Freshman Survey Weighted National Norms—All Respondents
Baccalaureate Black Colleges All Bacc Institutions 4-year Colleges Universities and Universities Institutions 4-yr Coll Universities Public Private Nonsec Catholic Oth Relig Public Private All HBCU Public Private
Your intended major (continued):Engineering
Aerospace/Aeronautical/Astronautical Engineering 0.6 0.8 0.5 1.3 0.1 0.1 0.2 0.1 0.5 0.4 0.2 0.1 0.4Biological/Agricultural Engineering 0.2 0.2 0.3 0.2 0.1 0.1 0.2 0.1 0.3 0.1 0.3 0.4 0.2Biomedical Engineering 1.1 0.4 1.8 0.4 0.4 0.6 0.5 0.1 1.9 1.6 0.4 0.1 0.9Chemical Engineering 1.1 0.3 2.0 0.3 0.4 0.2 0.6 0.4 2.0 1.8 0.3 0.1 0.7Civil Engineering 1.2 1.1 1.3 1.6 0.5 0.4 1.0 0.3 1.4 0.8 0.9 1.1 0.7Computer Engineering 1.3 0.9 1.8 1.1 0.6 0.6 0.8 0.5 2.0 1.2 1.3 1.0 1.9Electrical/Electronic Communications Engineering 1.2 0.8 1.6 1.2 0.4 0.5 0.5 0.2 1.7 1.2 0.9 1.1 0.5Engineering Science/Engineering Physics 0.2 0.2 0.3 0.1 0.2 0.2 0.2 0.1 0.2 0.4 0.4 0.3 0.5Environmental/Environmental Health Engineering 0.3 0.2 0.4 0.2 0.3 0.3 0.3 0.2 0.4 0.3 0.2 0.3 0.0Industrial/Manufacturing Engineering 0.4 0.3 0.5 0.3 0.2 0.3 0.1 0.1 0.6 0.3 0.6 0.9 0.2Materials Engineering 0.2 0.1 0.2 0.1 0.1 0.1 0.1 0.1 0.2 0.1 0.1 0.1 0.1Mechanical Engineering 2.8 1.9 3.8 2.4 1.3 1.7 1.7 0.7 4.0 2.9 1.5 1.5 1.6Other Engineering 0.6 0.4 0.8 0.4 0.3 0.3 0.2 0.4 0.8 0.6 0.1 0.1 0.2
Health ProfessionsClinical Laboratory Science 0.2 0.2 0.1 0.3 0.1 0.1 0.1 0.1 0.1 0.1 0.2 0.2 0.1Health Care Administration/Studies 0.3 0.3 0.3 0.3 0.2 0.2 0.3 0.2 0.3 0.4 0.2 0.2 0.2Health Technology 0.1 0.2 0.1 0.2 0.1 0.1 0.2 0.1 0.1 0.0 0.2 0.1 0.4Kinesiology 1.3 1.5 1.0 2.0 0.8 0.5 0.5 1.2 1.1 0.5 0.6 0.6 0.6Nursing 5.0 6.1 3.7 6.5 5.7 4.7 9.9 4.4 4.0 2.5 7.0 9.8 1.9Pharmacy 1.5 1.1 1.9 0.9 1.5 1.9 2.3 0.7 1.9 2.1 3.5 0.7 8.8Therapy (occupational, physical, speech) 2.1 2.4 1.9 1.8 3.1 2.5 2.8 3.7 2.0 1.3 3.0 3.6 1.8Other Health Profession 2.3 2.2 2.3 2.1 2.4 1.9 2.9 2.7 2.3 2.2 1.2 1.0 1.6
Math and Computer ScienceComputer Science 2.5 2.4 2.6 3.0 1.7 1.7 1.6 1.7 2.6 2.7 3.1 3.3 2.7Mathematics/Statistics 1.0 0.9 1.1 0.8 0.9 1.1 0.7 0.9 1.0 1.3 0.6 0.5 0.7Other Math and Computer Science 0.2 0.3 0.2 0.3 0.2 0.2 0.2 0.3 0.2 0.2 0.1 0.2 0.0
Physical ScienceAstronomy & Astrophysics 0.1 0.1 0.1 0.1 0.1 0.1 0.1 0.1 0.2 0.1 0.0 0.0 0.0Atmospheric Science 0.1 0.0 0.1 0.0 0.0 0.0 0.0 0.0 0.1 0.0 0.0 0.0 0.0Chemistry 1.2 1.1 1.4 0.9 1.2 1.3 1.4 1.1 1.4 1.4 2.0 1.3 3.3Earth & Planetary Sciences 0.1 0.1 0.1 0.1 0.1 0.2 0.1 0.1 0.1 0.1 0.1 0.1 0.0Marine Sciences 0.2 0.3 0.1 0.4 0.2 0.1 0.1 0.2 0.1 0.1 0.0 0.0 0.1Physics 0.6 0.5 0.7 0.4 0.7 0.9 0.4 0.6 0.6 0.9 0.4 0.2 0.7Other Physical Science 0.1 0.1 0.1 0.1 0.2 0.1 0.1 0.2 0.1 0.1 0.1 0.2 0.1
Social ScienceAnthropology 0.3 0.3 0.3 0.3 0.3 0.4 0.1 0.2 0.4 0.3 0.0 0.0 0.0Economics 1.0 0.6 1.3 0.3 1.0 1.8 0.6 0.5 1.1 2.2 0.2 0.0 0.5Ethnic/Cultural Studies 0.1 0.1 0.1 0.1 0.1 0.1 0.1 0.2 0.1 0.1 0.0 0.0 0.0Geography 0.0 0.0 0.0 0.0 0.1 0.0 0.0 0.1 0.0 0.0 0.0 0.0 0.0Political Science (gov’t., international relations) 2.5 2.2 2.8 1.9 2.6 3.5 2.3 2.0 2.5 3.9 2.3 1.5 3.6Psychology 4.7 5.4 3.9 5.5 5.3 4.9 5.5 5.5 4.0 3.9 6.7 6.7 6.7Public Policy 0.1 0.1 0.1 0.1 0.1 0.2 0.0 0.1 0.1 0.2 0.1 0.1 0.0Social Work 0.5 0.7 0.3 0.7 0.6 0.4 0.5 0.9 0.4 0.2 3.1 3.2 2.8Sociology 0.6 0.8 0.4 1.0 0.6 0.5 0.6 0.8 0.4 0.4 0.9 0.5 1.6Women’s/Gender Studies 0.0 0.0 0.0 0.0 0.1 0.1 0.1 0.1 0.0 0.0 0.0 0.0 0.1Other Social Science 0.3 0.2 0.3 0.3 0.2 0.3 0.2 0.2 0.3 0.3 0.1 0.1 0.1

24
2013 CIRP Freshman Survey Weighted National Norms—All Respondents
Baccalaureate Black Colleges All Bacc Institutions 4-year Colleges Universities and Universities Institutions 4-yr Coll Universities Public Private Nonsec Catholic Oth Relig Public Private All HBCU Public Private
Your intended major (continued):Other Majors
Architecture/Urban Planning 0.3 0.2 0.5 0.2 0.2 0.2 0.3 0.2 0.4 0.7 0.1 0.2 0.0Criminal Justice 2.3 3.4 1.1 3.9 2.8 2.6 2.3 3.2 1.1 0.8 5.5 7.6 1.4Library Science 0.0 0.0 0.0 0.0 0.0 0.0 0.0 0.0 0.0 0.0 0.0 0.0 0.0Security & Protective Services 0.0 0.1 0.0 0.1 0.0 0.0 0.0 0.1 0.0 0.0 0.1 0.1 0.1Military Sciences/Technology/Operations 0.1 0.1 0.0 0.1 0.0 0.1 0.0 0.0 0.0 0.0 0.1 0.0 0.1Other 2.0 2.4 1.7 2.0 2.8 2.4 1.8 3.8 1.6 1.7 2.2 2.7 1.3Undecided 10.2 10.1 10.2 10.5 9.7 10.8 9.6 8.6 10.3 9.7 3.4 4.4 1.7
How much of your first year’s educational expenses (room, board, tuition, and fees) do you expect to cover from each of the sources listed below?Family resources (parents, relatives, spouse, etc.)
None 22.2 25.6 18.6 30.7 19.3 17.9 19.8 20.3 20.4 11.2 38.2 41.2 32.6Less than $1,000 11.0 12.6 9.3 14.5 10.3 8.7 10.6 11.6 10.4 4.8 20.6 21.1 19.6$1,000 to $2,999 12.4 13.5 11.3 14.4 12.4 10.3 12.3 14.4 12.5 6.6 18.2 18.6 17.5$3,000 to $5,999 11.5 12.1 10.9 12.1 12.0 10.6 11.7 13.5 11.8 7.3 10.2 9.7 11.3$6,000 to $9,999 9.7 9.7 9.8 9.0 10.5 10.0 9.9 11.3 10.2 8.2 4.9 4.5 5.7$10,000 or more 33.1 26.5 40.1 19.2 35.6 42.5 35.7 28.9 34.8 61.9 7.8 4.9 13.3
My own resources (savings from work, work-study, other income)
None 37.7 39.2 36.2 41.7 36.1 37.1 35.3 35.5 34.9 41.2 51.6 52.3 50.2Less than $1,000 26.4 26.7 26.0 27.9 25.1 24.2 25.0 25.9 26.9 22.4 27.4 27.9 26.3$1,000 to $2,999 22.1 21.0 23.3 19.0 23.5 24.1 23.5 22.9 23.7 21.4 14.4 13.6 16.0$3,000 to $5,999 8.1 7.6 8.6 6.7 8.7 8.2 8.9 9.0 8.7 8.3 4.0 3.9 4.1$6,000 to $9,999 2.9 2.7 3.0 2.4 3.2 2.9 3.5 3.4 3.0 2.9 1.7 1.5 2.0$10,000 or more 2.9 2.8 2.9 2.3 3.5 3.5 3.8 3.4 2.7 3.8 1.0 0.8 1.4
Aid which need not be repaid (grants, scholarships, military funding, etc.)
None 27.1 26.5 27.7 32.2 19.4 23.2 18.5 16.3 28.1 25.9 25.9 28.7 20.4Less than $1,000 5.8 5.7 5.9 7.8 3.1 3.0 3.0 3.3 6.7 2.6 6.1 6.0 6.4$1,000 to $2,999 11.9 10.9 13.0 13.8 7.2 6.5 7.5 7.8 15.0 5.0 14.7 16.5 11.3$3,000 to $5,999 12.8 12.9 12.7 16.1 9.0 7.5 9.2 10.2 14.5 5.3 18.9 20.8 15.4$6,000 to $9,999 10.8 10.7 11.0 11.3 10.0 8.5 10.0 11.4 12.1 6.3 12.0 12.0 12.0$10,000 or more 31.5 33.2 29.6 18.8 51.2 51.3 51.7 50.9 23.6 54.8 22.4 16.1 34.5

25
2013 CIRP Freshman Survey Weighted National Norms—All Respondents
Baccalaureate Black Colleges All Bacc Institutions 4-year Colleges Universities and Universities Institutions 4-yr Coll Universities Public Private Nonsec Catholic Oth Relig Public Private All HBCU Public Private
How much of your first year’s educational expenses (room, board, tuition, and fees) do you expect to cover from each of the sources listed below?Aid which must be repaid (loans, etc.)
None 49.2 46.0 52.6 50.8 40.0 43.9 37.4 37.4 52.5 53.1 39.2 39.7 38.3Less than $1,000 4.0 4.1 3.8 4.6 3.6 3.1 3.5 4.1 4.3 2.0 6.7 7.1 6.0$1,000 to $2,999 8.5 9.2 7.7 9.5 8.9 8.2 9.3 9.4 8.2 5.6 13.3 14.7 10.6$3,000 to $5,999 16.0 16.8 15.1 15.8 18.0 16.5 19.4 18.9 15.3 14.0 18.0 18.9 16.4$6,000 to $9,999 9.6 10.3 8.8 8.6 12.4 11.5 11.5 13.8 9.0 8.1 9.9 10.1 9.5$10,000 or more 12.8 13.6 11.9 10.7 17.1 16.8 19.0 16.4 10.7 17.1 12.9 9.6 19.2
Other than aboveNone 92.4 91.8 93.0 92.4 91.1 92.0 91.4 90.1 92.9 93.6 88.9 89.1 88.7Less than $1,000 2.7 2.9 2.4 3.0 2.8 2.6 2.7 3.1 2.6 1.7 4.1 4.0 4.3$1,000 to $2,999 1.7 1.9 1.5 1.9 1.9 1.7 1.9 2.1 1.5 1.3 2.9 3.1 2.5$3,000 to $5,999 1.2 1.2 1.1 1.1 1.4 1.2 1.4 1.6 1.1 0.9 1.9 2.0 1.7$6,000 to $9,999 0.7 0.7 0.6 0.6 0.9 0.8 0.9 1.1 0.6 0.6 0.8 0.6 1.1$10,000 or more 1.4 1.4 1.4 1.0 1.8 1.8 1.7 2.0 1.3 1.9 1.3 1.1 1.7
What is your best estimate of your parents’ total income?
Less than $10,000 3.9 5.1 2.7 5.8 4.3 3.6 4.1 5.1 2.9 1.9 16.2 17.4 14.0$10,000 to $14,999 3.1 3.9 2.2 4.6 3.0 2.8 2.7 3.4 2.4 1.6 9.0 10.1 6.9$15,000 to $19,999 2.7 3.3 2.1 4.0 2.5 2.2 2.6 2.8 2.3 1.5 5.3 5.8 4.3$20,000 to $24,999 3.8 4.4 3.1 5.0 3.6 3.5 3.6 3.7 3.4 2.0 7.9 8.1 7.7$25,000 to $29,999 3.1 3.6 2.6 3.9 3.2 2.8 3.2 3.5 2.8 1.9 6.2 6.7 5.2$30,000 to $39,999 5.9 6.7 5.0 7.3 6.1 5.4 6.1 6.7 5.4 3.5 9.6 9.6 9.4$40,000 to $49,999 6.8 7.8 5.8 8.1 7.5 6.6 7.0 8.4 6.1 4.6 9.5 9.5 9.4$50,000 to $59,999 7.5 8.3 6.7 8.2 8.3 7.8 8.1 8.9 7.0 5.3 8.5 9.6 6.5$60,000 to $74,999 9.7 10.4 8.9 10.4 10.5 9.9 10.0 11.3 9.3 7.3 7.5 7.0 8.4$75,000 to $99,999 13.1 13.2 13.0 13.1 13.4 12.9 12.9 14.1 13.5 11.0 7.6 6.5 9.6$100,000 to $149,999 17.5 15.7 19.4 15.2 16.2 17.0 16.9 15.1 19.7 18.5 6.7 5.5 8.8$150,000 to $199,999 8.6 7.4 9.9 6.7 8.2 9.1 9.2 6.9 9.7 10.9 3.1 2.0 5.1$200,000 to $249,999 5.0 3.9 6.2 3.3 4.6 5.4 5.0 3.7 5.7 8.3 1.6 1.1 2.5$250,000 or more 9.2 6.3 12.3 4.4 8.6 11.1 8.5 6.4 10.0 21.9 1.4 1.0 2.2
Do you have any concern about your ability to finance your college education?
None (I am confident that I will have sufficient funds) 32.2 30.4 34.0 29.7 31.3 33.1 29.4 30.4 32.9 38.6 26.9 26.3 28.1Some (but I probably will have enough funds) 55.1 56.2 53.9 56.8 55.6 54.5 56.5 56.1 54.7 50.7 52.9 54.9 49.1Major (not sure I will have enough funds to
complete college) 12.7 13.4 12.1 13.5 13.2 12.4 14.1 13.5 12.4 10.7 20.2 18.8 22.8

26
2013 CIRP Freshman Survey Weighted National Norms—All Respondents
Baccalaureate Black Colleges All Bacc Institutions 4-year Colleges Universities and Universities Institutions 4-yr Coll Universities Public Private Nonsec Catholic Oth Relig Public Private All HBCU Public Private
Your current religious preference Baptist 9.3 12.9 5.5 12.9 12.8 8.7 7.7 19.2 5.9 3.9 49.2 49.4 48.7Buddhist 1.4 1.0 1.8 1.1 0.8 1.1 0.8 0.5 1.9 1.4 0.3 0.2 0.5Church of Christ 5.9 7.2 4.6 8.1 6.0 5.7 5.7 6.3 5.1 2.8 14.5 16.9 10.0Eastern Orthodox 0.8 0.6 1.0 0.6 0.6 0.7 0.7 0.4 0.9 1.3 0.0 0.0 0.0Episcopalian 1.2 1.3 1.1 1.1 1.4 1.9 0.8 1.3 0.9 1.7 0.6 0.5 1.0Hindu 0.9 0.4 1.5 0.3 0.5 0.7 0.5 0.2 1.4 1.9 0.1 0.1 0.0Jewish 2.8 1.6 4.1 1.4 1.8 3.4 0.5 1.0 4.1 4.1 0.1 0.1 0.2LDS (Mormon) 0.2 0.2 0.3 0.2 0.1 0.2 0.1 0.2 0.3 0.1 0.0 0.0 0.1Lutheran 2.4 2.5 2.4 1.7 3.4 2.3 2.2 5.1 2.5 1.8 0.3 0.2 0.4Methodist 3.5 3.9 3.1 3.3 4.7 3.4 1.9 7.2 3.1 3.2 3.8 3.3 4.6Muslim 1.6 1.0 2.3 1.0 0.9 1.2 1.3 0.6 2.1 2.9 1.0 1.1 0.8Presbyterian 2.5 2.3 2.8 1.9 2.7 2.6 1.3 3.6 2.6 3.6 0.5 0.6 0.5Quaker 0.2 0.2 0.1 0.1 0.2 0.2 0.1 0.3 0.1 0.1 0.1 0.1 0.1Roman Catholic 26.2 25.3 27.2 26.1 24.3 23.3 50.1 12.6 25.3 34.7 4.5 1.5 10.2Seventh-day Adventist 0.6 0.9 0.3 0.4 1.4 0.4 0.3 2.9 0.3 0.2 0.5 0.4 0.7United Church of Christ/Congregational 0.6 0.6 0.5 0.6 0.7 0.8 0.6 0.8 0.5 0.6 0.4 0.4 0.4Other Christian 12.6 14.0 11.1 13.4 14.6 11.4 9.2 20.3 11.5 9.7 14.2 15.1 12.6Other Religion 2.7 2.8 2.6 2.9 2.7 3.3 2.2 2.4 2.7 2.1 2.5 2.3 2.8None 24.6 21.6 27.7 22.7 20.2 28.8 14.1 15.2 28.7 23.7 7.2 7.7 6.3
Father’s current religious preference Baptist 9.7 13.2 6.1 13.1 13.4 9.1 7.6 20.2 6.6 4.3 49.0 48.7 49.5Buddhist 1.9 1.2 2.6 1.3 1.0 1.3 1.0 0.6 2.8 2.1 0.7 0.3 1.3Church of Christ 6.2 7.3 5.1 8.5 6.0 6.1 5.7 6.0 5.6 3.0 13.6 16.1 8.9Eastern Orthodox 0.9 0.7 1.2 0.7 0.6 0.8 0.7 0.5 1.1 1.6 0.0 0.0 0.0Episcopalian 1.4 1.4 1.4 1.3 1.5 2.1 0.9 1.3 1.2 2.0 0.4 0.4 0.4Hindu 1.2 0.5 1.9 0.4 0.6 0.9 0.5 0.2 1.7 2.5 0.1 0.1 0.0Jewish 3.5 2.1 4.8 1.9 2.4 4.6 0.8 1.3 4.8 5.1 0.1 0.2 0.1LDS (Mormon) 0.3 0.3 0.4 0.3 0.2 0.2 0.2 0.2 0.5 0.2 0.1 0.2 0.0Lutheran 3.0 3.0 3.0 2.1 4.0 2.9 2.8 5.7 3.2 2.5 0.2 0.2 0.2Methodist 3.8 4.2 3.5 3.5 4.9 3.7 2.2 7.3 3.5 3.4 3.2 2.7 4.1Muslim 2.1 1.4 2.8 1.5 1.4 1.6 1.8 0.9 2.6 3.3 2.5 2.6 2.4Presbyterian 2.9 2.7 3.2 2.3 3.2 3.2 1.6 4.0 3.0 4.2 0.6 0.7 0.5Quaker 0.2 0.2 0.1 0.1 0.2 0.2 0.1 0.2 0.1 0.2 0.0 0.0 0.0Roman Catholic 29.9 28.9 31.0 30.7 26.7 26.7 50.8 14.9 29.5 37.1 4.9 2.2 10.0Seventh-day Adventist 0.6 0.8 0.4 0.4 1.3 0.4 0.4 2.5 0.4 0.3 0.4 0.4 0.4United Church of Christ/Congregational 0.6 0.7 0.5 0.6 0.8 0.9 0.6 0.8 0.5 0.6 0.4 0.3 0.5Other Christian 12.4 13.5 11.3 13.4 13.7 11.6 8.7 18.1 11.7 9.5 12.6 13.3 11.1Other Religion 2.2 2.3 2.2 2.4 2.2 2.3 2.0 2.1 2.2 1.8 2.1 2.1 1.9None 17.1 15.7 18.6 15.5 16.1 21.4 11.6 13.2 19.1 16.4 9.1 9.3 8.8

27
2013 CIRP Freshman Survey Weighted National Norms—All Respondents
Baccalaureate Black Colleges All Bacc Institutions 4-year Colleges Universities and Universities Institutions 4-yr Coll Universities Public Private Nonsec Catholic Oth Relig Public Private All HBCU Public Private
Mother’s current religious preference Baptist 10.4 14.0 6.6 13.9 14.1 10.0 8.3 20.8 7.0 4.7 51.6 51.5 51.8Buddhist 2.0 1.2 2.9 1.4 1.0 1.4 1.0 0.7 3.0 2.4 0.4 0.3 0.7Church of Christ 6.9 8.1 5.7 9.4 6.6 6.8 6.4 6.7 6.3 3.3 14.9 17.5 10.2Eastern Orthodox 0.9 0.7 1.2 0.7 0.7 0.8 0.8 0.5 1.1 1.7 0.0 0.1 0.0Episcopalian 1.6 1.6 1.5 1.5 1.8 2.6 1.0 1.5 1.3 2.4 0.7 0.6 0.8Hindu 1.1 0.5 1.9 0.4 0.6 0.9 0.5 0.3 1.7 2.5 0.1 0.1 0.1Jewish 3.3 2.0 4.6 1.8 2.3 4.3 0.7 1.2 4.6 4.7 0.1 0.0 0.2LDS (Mormon) 0.3 0.3 0.4 0.4 0.2 0.2 0.1 0.2 0.4 0.2 0.1 0.2 0.0Lutheran 3.2 3.1 3.2 2.2 4.2 3.1 2.7 6.0 3.4 2.4 0.4 0.5 0.2Methodist 4.3 4.7 3.9 3.9 5.5 4.5 2.3 8.1 3.9 3.7 4.1 3.6 5.0Muslim 1.8 1.1 2.5 1.1 1.0 1.3 1.4 0.6 2.3 3.2 1.0 1.0 0.9Presbyterian 3.2 2.9 3.5 2.4 3.4 3.4 1.6 4.2 3.3 4.4 0.7 0.7 0.6Quaker 0.2 0.2 0.2 0.2 0.2 0.3 0.2 0.3 0.2 0.2 0.0 0.0 0.0Roman Catholic 31.5 30.1 33.0 31.9 27.9 28.1 53.6 15.1 31.4 39.5 5.3 2.1 11.2Seventh-day Adventist 0.7 0.9 0.4 0.5 1.5 0.5 0.4 2.9 0.4 0.3 0.5 0.4 0.8United Church of Christ/Congregational 0.7 0.8 0.7 0.7 0.9 1.1 0.7 0.8 0.7 0.7 0.5 0.4 0.7Other Christian 13.5 14.7 12.3 14.6 14.9 12.7 9.4 19.6 12.8 10.2 13.5 14.5 11.6Other Religion 2.3 2.3 2.2 2.4 2.2 2.5 1.8 2.0 2.4 1.7 2.0 2.2 1.7None 12.1 10.8 13.4 10.6 11.0 15.6 7.2 8.6 13.7 12.0 4.2 4.5 3.6
Highest academic degree plannedNone 0.5 0.6 0.3 0.6 0.7 0.7 0.5 0.8 0.3 0.2 1.4 1.5 1.3Vocational certificate 0.1 0.1 0.1 0.1 0.2 0.2 0.2 0.2 0.1 0.0 0.2 0.2 0.1Associate (A.A. or equivalent) 0.4 0.6 0.2 0.6 0.6 0.4 0.6 0.9 0.3 0.1 1.3 1.2 1.3Bachelor’s degree (B.A., B.S., etc.) 20.9 24.0 17.7 25.3 22.5 18.9 20.1 27.1 18.2 15.4 15.7 18.8 10.0Master’s degree (M.A., M.S., etc.) 42.0 43.0 41.0 44.7 40.8 41.6 43.9 38.7 40.8 42.0 34.8 40.1 24.9Ph.D. or Ed.D. 19.5 18.8 20.3 18.2 19.5 21.6 18.2 18.2 20.7 19.0 27.8 25.7 31.8M.D., D.O., D.D.S., D.V.M. 11.3 8.0 14.7 6.5 9.9 10.1 11.2 9.0 14.6 15.0 11.6 6.3 21.4J.D. (Law) 3.9 3.3 4.6 2.7 4.0 4.9 3.8 3.2 4.0 6.8 4.9 4.2 6.3B.D. or M.DIV. (Divinity) 0.2 0.3 0.1 0.2 0.3 0.2 0.2 0.5 0.1 0.2 0.6 0.4 0.9Other 1.1 1.2 1.0 1.0 1.4 1.5 1.4 1.5 0.9 1.3 1.8 1.6 2.1
Highest academic degree planned at this collegeNone 0.9 1.1 0.6 1.1 1.2 0.9 0.9 1.6 0.7 0.4 2.1 2.5 1.4Vocational certificate 0.2 0.2 0.1 0.2 0.3 0.2 0.2 0.4 0.1 0.1 0.3 0.3 0.3Associate (A.A. or equivalent) 1.9 2.6 1.1 2.7 2.6 2.0 2.0 3.5 1.2 0.5 4.2 4.5 3.6Bachelor’s degree (B.A., B.S., etc.) 66.7 70.1 63.1 67.5 73.2 74.4 67.2 75.0 61.8 68.1 59.1 55.4 65.7Master’s degree (M.A., M.S., etc.) 22.0 20.5 23.6 23.2 17.2 16.6 22.4 15.3 24.0 22.1 20.0 25.5 10.1Ph.D. or Ed.D. 4.2 3.1 5.4 3.3 2.8 3.1 4.4 1.8 5.8 3.6 8.5 6.9 11.2M.D., D.O., D.D.S., D.V.M. 2.6 0.8 4.4 0.7 0.9 1.0 1.5 0.6 4.8 2.6 2.5 1.5 4.3J.D. (Law) 0.6 0.4 0.9 0.4 0.4 0.5 0.3 0.4 0.8 1.5 1.4 1.9 0.6B.D. or M.DIV. (Divinity) 0.1 0.2 0.1 0.2 0.1 0.1 0.1 0.2 0.1 0.1 0.5 0.5 0.4Other 0.9 1.0 0.7 0.9 1.2 1.2 1.2 1.3 0.6 1.1 1.5 1.0 2.4

28
2013 CIRP Freshman Survey Weighted National Norms—All Respondents
Baccalaureate Black Colleges All Bacc Institutions 4-year Colleges Universities and Universities Institutions 4-yr Coll Universities Public Private Nonsec Catholic Oth Relig Public Private All HBCU Public Private
For the activities below, indicate which ones you “Frequently” or “Occasionally” did during the past year:
Attended a religious service 72.7 74.0 71.4 71.3 77.2 68.7 82.1 83.0 70.0 76.8 88.7 87.9 90.1Was bored in class* 38.3 36.6 40.1 38.2 34.6 36.3 30.6 34.9 41.3 35.2 35.4 38.2 30.0Demonstrated for a cause (e.g., boycott, rally, protest) 23.5 23.3 23.8 22.3 24.5 25.8 26.5 22.2 23.4 25.4 32.5 28.8 39.4Tutored another student 60.3 54.7 66.3 53.7 56.0 57.0 58.1 53.9 65.3 70.3 61.8 58.8 67.5Studied with other students 88.6 87.3 90.1 86.2 88.6 88.8 90.3 87.6 89.6 91.9 88.4 87.4 90.3Was a guest in a teacher’s home 17.9 19.1 16.6 16.8 22.0 20.8 16.2 25.8 16.1 18.8 20.2 18.9 22.5Smoked cigarettes* 2.2 2.5 1.9 2.8 2.2 2.5 1.8 2.2 1.9 1.7 1.8 1.9 1.7Drank beer 35.0 33.5 36.6 33.8 33.2 40.2 31.9 27.3 35.9 39.2 12.3 12.7 11.6Drank wine or liquor 40.6 39.3 42.0 39.3 39.3 46.6 37.9 33.0 41.4 44.5 31.7 32.8 29.5Felt overwhelmed by all I had to do* 33.1 33.0 33.2 31.8 34.5 35.2 34.4 34.0 33.6 31.7 29.7 29.1 30.8Felt depressed* 8.9 9.3 8.4 9.0 9.7 10.0 8.5 10.0 8.8 7.0 11.1 11.2 10.9Performed volunteer work 88.5 86.4 90.8 84.4 88.8 88.7 90.4 88.1 90.2 93.4 84.9 83.7 87.3Asked a teacher for advice after class* 30.9 30.7 31.1 28.8 33.1 33.7 33.6 32.2 30.2 34.9 37.2 35.2 41.1Voted in a student election* 21.1 20.3 21.9 19.5 21.4 21.5 23.2 20.5 21.1 25.0 29.8 26.0 36.8Socialized with someone of another racial/ethnic
group* 73.8 72.1 75.6 71.9 72.3 73.8 72.1 70.9 75.0 78.0 73.1 71.5 76.0Came late to class 52.8 52.5 53.1 54.3 50.2 52.6 48.4 48.9 53.1 53.2 61.7 64.8 55.8Used the Internet for research or homework* 81.8 79.5 84.2 78.4 81.0 82.3 80.9 79.9 83.7 86.2 76.0 75.5 76.9Performed community service as a part of a class 57.3 57.7 56.9 55.9 60.0 57.5 65.3 59.8 56.2 59.9 60.7 58.1 65.7Discussed religion* 31.2 30.2 32.3 26.4 34.8 31.1 35.4 38.0 30.5 39.6 34.0 31.7 38.4Discussed politics* 32.3 28.9 35.9 26.7 31.5 33.2 31.5 29.8 34.6 41.3 26.0 22.5 32.7Worked on a local, state, or national political
campaign 10.2 9.7 10.7 9.1 10.4 10.4 10.8 10.1 10.3 12.2 16.5 14.5 20.1Skipped school/class 27.5 26.8 28.3 28.1 25.1 26.4 21.5 25.6 29.4 23.8 26.2 29.1 20.9Publicly communicated my opinion about a cause
(e.g., blog, email, petition) 44.0 43.8 44.2 43.3 44.5 45.2 43.3 44.4 43.7 46.3 54.1 53.4 55.3Helped raise money for a cause or campaign 57.3 57.4 57.1 56.2 58.8 58.1 59.7 59.1 56.5 59.8 61.6 62.4 60.0Fell asleep in class 45.1 45.6 44.5 47.4 43.4 43.0 39.6 45.7 45.5 40.6 57.9 59.7 54.6Failed to complete homework on time 52.4 54.0 50.6 55.2 52.6 54.7 48.1 52.8 51.4 47.4 52.6 54.2 49.4Used an online instructional website (e.g.,
Khan Academy, Coursera) as assigned for a class 41.8 42.3 41.2 42.2 42.4 41.6 42.5 43.3 41.5 40.3 53.4 54.2 51.8Used an online instructional website (e.g.,
Khan Academy, Coursera) to learn something on your own 69.2 70.8 67.4 72.9 68.3 68.0 66.2 69.4 68.1 64.9 87.5 89.3 84.3
* responses for “Frequently” onlyStudents rated as “A Major Strength” or “Somewhat Strong” as compared with the average person their age:
Ability to see the world from someone else’s perspective 76.5 74.2 79.1 73.9 74.6 76.1 76.2 72.3 78.7 80.7 73.1 71.2 76.6
Tolerance of others with different beliefs 80.5 77.6 83.7 76.7 78.6 81.0 80.7 75.3 83.4 84.8 71.9 69.8 75.8Openness to having my own views challenged 62.9 61.9 64.1 62.0 61.7 62.6 63.7 59.9 63.8 65.0 68.4 67.9 69.4Ability to discuss and negotiate controversial issues 70.2 67.6 72.9 67.8 67.4 69.3 68.2 65.2 72.7 74.0 70.8 69.8 72.5Ability to work cooperatively with diverse people 85.4 84.0 87.1 83.8 84.1 84.9 86.3 82.3 86.9 87.6 83.4 82.6 84.9

29
2013 CIRP Freshman Survey Weighted National Norms—All Respondents
Baccalaureate Black Colleges All Bacc Institutions 4-year Colleges Universities and Universities Institutions 4-yr Coll Universities Public Private Nonsec Catholic Oth Relig Public Private All HBCU Public Private
What is the highest level of formal education obtained by your father?
Junior high/Middle school or less 5.1 6.5 3.6 8.5 4.1 3.9 5.4 3.6 3.9 2.7 7.8 8.3 6.9Some high school 5.1 6.2 3.9 7.4 4.7 4.3 5.1 5.0 4.2 3.0 8.6 9.2 7.4High school graduate 17.8 21.3 14.1 23.0 19.1 16.7 19.4 21.2 15.3 9.1 31.5 34.0 27.0Postsecondary school other than college 3.2 3.4 3.0 3.4 3.5 3.0 4.1 3.6 3.2 2.0 3.9 4.2 3.4Some college 14.4 15.5 13.2 16.5 14.4 12.9 14.6 15.6 13.9 10.2 18.5 18.5 18.3College degree 28.7 26.7 30.8 24.9 28.9 29.6 29.0 28.3 30.5 32.0 17.8 16.8 19.8Some graduate school 2.1 1.7 2.5 1.4 2.0 2.2 1.8 1.8 2.4 2.8 1.1 1.0 1.1Graduate degree 23.6 18.7 28.9 14.9 23.3 27.3 20.5 20.9 26.6 38.2 10.8 7.9 16.1
What is the highest level of formal education obtained by your mother?
Junior high/Middle school or less 4.6 5.7 3.3 7.7 3.4 3.3 4.7 2.8 3.5 2.5 6.1 6.5 5.3Some high school 3.6 4.2 2.9 5.2 3.0 2.7 3.5 3.0 3.1 2.3 4.8 4.9 4.5High school graduate 14.9 17.1 12.6 18.7 15.1 13.1 16.2 16.5 13.5 8.6 19.9 20.9 18.2Postsecondary school other than college 3.1 3.4 2.8 3.5 3.3 3.2 3.9 3.1 3.0 2.1 3.7 3.9 3.3Some college 16.0 17.4 14.5 18.6 15.9 14.1 15.4 17.8 15.3 11.4 21.2 22.1 19.4College degree 35.0 32.5 37.6 30.1 35.4 35.5 34.6 35.6 36.9 40.6 26.1 26.7 24.9Some graduate school 2.6 2.3 2.9 1.9 2.7 2.8 2.6 2.6 2.8 3.6 1.8 1.6 2.4Graduate degree 20.3 17.5 23.3 14.3 21.3 25.3 19.1 18.6 21.9 28.9 16.4 13.4 22.0
During the past year, did you “Frequently”:Ask questions in class 56.3 55.1 57.6 52.7 58.1 60.0 59.2 55.7 56.1 63.6 62.7 62.2 63.6Support your opinions with a logical argument 60.8 56.1 65.9 54.2 58.4 62.6 58.4 54.3 64.3 72.4 55.9 53.5 60.5Seek solutions to problems and explain them to others 55.4 51.6 59.6 50.4 53.0 55.4 54.8 49.9 58.1 65.6 54.8 53.6 57.1Revise your papers to improve your writing 50.2 48.4 52.2 45.1 52.4 52.6 55.3 50.9 50.9 57.4 52.0 49.3 57.0Evaluate the quality or reliability of information you
received 42.6 39.8 45.6 38.7 41.2 43.4 43.0 38.2 44.5 49.8 45.2 42.9 49.4Take a risk because you feel you have more to gain 39.9 39.4 40.4 39.4 39.5 40.4 39.8 38.5 39.9 42.4 42.9 41.9 44.9Seek alternative solutions to a problem 47.6 46.0 49.3 45.8 46.3 47.4 48.5 44.2 48.6 52.0 50.1 48.0 54.0Look up scientific research articles and resources 27.8 25.6 30.2 24.8 26.6 28.5 28.0 24.1 29.7 32.1 27.6 25.8 31.0Explore topics on your own, even though it is not
required for a class 35.5 33.4 37.8 33.3 33.6 36.8 32.3 31.1 36.9 41.4 36.3 34.5 39.6Accept mistakes as part of the learning process 56.8 55.9 57.6 56.3 55.5 56.2 58.0 53.6 57.4 58.6 62.1 61.9 62.5Seek feedback on your academic work 49.5 48.6 50.6 46.3 51.3 52.7 53.1 49.2 49.6 54.8 56.6 56.1 57.4Work with other students on group projects 51.3 50.0 52.6 49.4 50.9 51.1 54.5 48.9 51.8 55.5 52.9 52.1 54.6Integrate skills and knowledge from different sources
and experiences 56.3 51.8 61.2 50.0 54.1 57.1 56.4 50.2 59.7 67.2 50.0 46.9 55.7

30
2013 CIRP Freshman Survey Weighted National Norms—All Respondents
Baccalaureate Black Colleges All Bacc Institutions 4-year Colleges Universities and Universities Institutions 4-yr Coll Universities Public Private Nonsec Catholic Oth Relig Public Private All HBCU Public Private
Your intended career occupationActor or Entertainer 1.2 1.6 0.9 1.4 1.8 2.6 0.7 1.7 0.8 1.3 0.9 0.9 1.0Artist 0.8 1.1 0.5 1.0 1.2 2.0 0.5 0.9 0.5 0.5 0.3 0.2 0.4Graphic Designer 0.8 1.1 0.5 1.1 1.2 1.1 0.7 1.5 0.5 0.5 0.8 0.9 0.7Musician 1.5 1.9 1.2 1.9 1.9 1.6 0.6 2.7 1.1 1.5 2.3 2.6 1.9Writer/Producer/Director 1.7 1.9 1.4 1.9 1.9 2.2 1.2 2.0 1.3 2.0 1.0 0.8 1.3Farmer or Forester 0.4 0.5 0.2 0.6 0.4 0.4 0.2 0.6 0.2 0.1 0.2 0.3 0.1Natural Resource Specialist/Environmentalist 0.6 0.7 0.6 0.6 0.9 0.8 0.3 1.2 0.6 0.3 0.7 0.9 0.3Accountant 1.6 1.6 1.5 1.7 1.5 1.3 2.2 1.4 1.6 1.5 1.1 1.2 0.9Administrative Assistant 0.3 0.4 0.2 0.4 0.4 0.5 0.2 0.5 0.2 0.3 0.5 0.5 0.5Business Manager/Executive 2.7 2.4 3.1 2.0 2.8 2.7 3.1 2.6 2.7 4.7 1.7 1.7 1.6Business Owner/Entrepreneur 2.4 2.3 2.5 2.2 2.4 2.5 2.5 2.2 2.2 3.3 2.7 2.8 2.6Retail Sales 0.7 0.9 0.6 1.0 0.7 0.6 1.0 0.7 0.6 0.5 2.2 2.0 2.6Sales/Marketing 1.7 1.6 1.9 1.5 1.6 1.5 2.2 1.4 1.9 1.9 0.7 0.6 0.8Human Resources 0.3 0.3 0.3 0.3 0.3 0.2 0.3 0.3 0.3 0.3 0.2 0.2 0.2Finance (e.g., Actuary, Banking, Loan Officer, Planner) 2.0 1.4 2.6 1.2 1.6 1.9 1.9 1.1 2.2 4.1 0.8 0.5 1.4Management Consultant 0.4 0.3 0.4 0.3 0.3 0.3 0.3 0.3 0.4 0.5 0.2 0.2 0.2Real Estate Agent/Realtor/Appraiser/Developer 0.2 0.2 0.2 0.2 0.2 0.2 0.2 0.1 0.2 0.2 0.2 0.2 0.2Sports Management 1.1 1.1 1.0 0.7 1.5 1.4 1.4 1.7 1.0 1.2 1.1 1.3 0.7Journalist 0.8 0.8 0.9 0.6 0.9 1.0 0.9 0.8 0.7 1.5 0.8 0.8 0.9Public/Media Relations 1.3 1.3 1.2 1.2 1.4 1.4 1.6 1.4 1.1 1.6 1.8 2.1 1.2Advertising 0.4 0.3 0.4 0.3 0.4 0.3 0.5 0.4 0.4 0.6 0.1 0.1 0.1College Administrator/Staff 0.2 0.2 0.2 0.2 0.3 0.3 0.2 0.3 0.2 0.2 0.0 0.0 0.0College Faculty 0.5 0.5 0.5 0.3 0.6 0.7 0.3 0.7 0.5 0.5 0.4 0.5 0.2Early Childcare Provider 1.1 1.4 0.8 1.6 1.2 1.1 1.4 1.3 0.8 0.7 2.0 2.7 1.0Elementary School Teacher 2.4 3.4 1.5 3.6 3.2 2.3 3.1 4.1 1.4 1.5 2.2 2.6 1.5Secondary School Teacher 2.3 2.9 1.6 2.9 2.8 2.2 2.1 3.7 1.7 1.4 1.5 2.0 0.7Librarian 0.5 0.4 0.6 0.4 0.4 0.6 0.3 0.4 0.6 0.9 0.4 0.3 0.6Teacher’s Assistant/Paraprofessional 0.2 0.2 0.1 0.2 0.1 0.1 0.1 0.1 0.2 0.1 0.2 0.3 0.0K-12 Administrator 0.2 0.3 0.1 0.3 0.3 0.3 0.2 0.3 0.1 0.1 0.2 0.3 0.2Other K-12 Professional 0.6 0.7 0.4 0.7 0.7 0.7 0.6 0.8 0.4 0.4 0.4 0.5 0.1Military 2.2 3.0 1.4 4.6 1.0 1.0 1.1 1.1 1.5 1.1 1.5 1.5 1.5Federal/State/Local Government Official 1.9 2.1 1.7 2.1 2.1 2.5 1.8 1.9 1.6 2.0 2.4 2.8 1.7Protective Services (e.g., Homeland Security,
Law Enforcement, Firefighter) 1.5 2.1 0.9 2.5 1.8 1.8 1.6 1.8 0.9 0.7 2.0 2.6 0.9Postal Worker 0.1 0.2 0.1 0.2 0.2 0.1 0.1 0.2 0.1 0.1 0.1 0.1 0.0Dietician/Nutritionist 0.7 0.7 0.7 0.9 0.6 0.5 0.7 0.7 0.7 0.5 0.2 0.3 0.2Home Health Worker 0.8 1.3 0.3 1.4 1.2 1.0 1.1 1.6 0.3 0.2 1.7 1.9 1.5Medical/Dental Assistant (e.g., Hygienist, Lab Tech,
Nursing Asst.) 0.9 1.0 0.8 1.1 0.8 0.7 1.1 0.8 0.8 0.7 1.6 1.8 1.2Registered Nurse 2.9 3.5 2.3 3.5 3.5 2.7 5.9 3.1 2.4 1.7 4.3 6.3 1.0Therapist (e.g., Physical, Occupational, Speech) 3.4 4.1 2.8 4.0 4.1 3.5 3.9 4.9 3.0 2.1 3.7 4.4 2.6Computer Programmer/Developer 1.9 1.8 2.1 2.1 1.4 1.3 1.5 1.5 2.2 1.8 2.2 2.4 1.7Computer/Systems Analyst 0.5 0.6 0.4 0.7 0.4 0.3 0.5 0.5 0.5 0.3 0.6 0.5 0.8Web Designer 0.3 0.3 0.3 0.4 0.1 0.2 0.0 0.2 0.3 0.2 0.3 0.3 0.2Lawyer/Judge 3.0 2.5 3.5 2.1 3.0 3.5 3.0 2.5 3.2 4.6 4.3 4.2 4.4Paralegal 0.4 0.3 0.4 0.3 0.3 0.4 0.3 0.3 0.5 0.3 0.6 0.5 0.8Clinical Psychologist 2.0 2.0 2.0 2.0 2.1 2.0 2.1 2.1 2.0 1.6 2.6 2.7 2.5Dentist/Orthodontist 1.4 1.3 1.5 1.5 1.0 0.9 1.0 1.0 1.6 1.1 1.6 1.4 2.0Medical Doctor/Surgeon 9.9 6.4 13.5 5.2 7.8 8.0 9.6 6.8 13.6 13.0 11.5 6.6 19.8

31
2013 CIRP Freshman Survey Weighted National Norms—All Respondents
Baccalaureate Black Colleges All Bacc Institutions 4-year Colleges Universities and Universities Institutions 4-yr Coll Universities Public Private Nonsec Catholic Oth Relig Public Private All HBCU Public Private
Your intended career occupation (continued)Optometrist 0.6 0.5 0.6 0.7 0.3 0.3 0.4 0.3 0.7 0.5 0.8 1.0 0.4Pharmacist 1.7 1.3 2.1 1.2 1.5 1.9 1.9 0.9 2.1 1.9 3.2 1.3 6.5Veterinarian 1.1 1.2 1.0 1.0 1.5 1.6 0.8 1.7 1.1 0.4 0.8 0.9 0.6Engineer 6.8 4.0 9.6 4.7 3.1 3.6 4.7 1.8 10.1 7.7 3.2 3.1 3.4Research Scientist (e.g., Biologist, Chemist, Physicist) 3.3 2.8 3.7 2.7 3.0 3.7 2.1 2.8 3.9 3.2 1.2 1.1 1.4Urban Planner/Architect 1.1 0.9 1.4 1.1 0.6 0.9 0.3 0.5 1.4 1.1 1.0 1.1 0.8Custodian/Janitor/Housekeeper 0.2 0.2 0.2 0.2 0.1 0.1 0.0 0.1 0.2 0.2 0.2 0.3 0.1Food Service (e.g., Chef/Cook Server) 0.1 0.1 0.1 0.1 0.1 0.1 0.1 0.1 0.1 0.1 0.2 0.2 0.1Hair Stylist/Aesthetician/Manicurist 0.2 0.2 0.2 0.2 0.2 0.1 0.3 0.2 0.2 0.2 0.4 0.3 0.6Interior Designer 0.2 0.2 0.2 0.3 0.2 0.1 0.2 0.3 0.2 0.1 0.3 0.1 0.4Skilled Trades (e.g., Plumber, Electrician, Construction) 0.4 0.5 0.2 0.8 0.2 0.1 0.2 0.4 0.3 0.1 0.3 0.3 0.3Social/Non-Profit Services 3.1 4.1 2.1 4.7 3.5 2.7 5.2 3.3 2.3 1.5 5.4 7.3 2.2Clergy 0.8 0.8 0.9 0.6 1.0 0.9 1.5 0.9 0.8 1.0 2.9 0.7 6.7Homemaker/Stay at Home Parent 1.3 1.6 1.0 1.5 1.8 1.3 1.6 2.5 1.2 0.6 2.6 3.4 1.3Other 4.9 5.6 4.3 5.1 6.1 5.3 5.3 7.2 4.3 4.1 5.4 5.1 6.0Undecided 9.5 9.3 9.8 8.6 10.1 12.0 9.5 8.6 9.5 11.2 3.2 3.6 2.6
Your father’s occupationActor or Entertainer 0.2 0.2 0.1 0.3 0.2 0.2 0.2 0.2 0.1 0.1 0.5 0.5 0.4Artist 0.3 0.3 0.2 0.3 0.3 0.4 0.2 0.3 0.2 0.3 0.5 0.7 0.1Graphic Designer 0.3 0.4 0.3 0.4 0.4 0.4 0.4 0.3 0.3 0.2 0.0 0.0 0.0Musician 0.3 0.3 0.3 0.3 0.3 0.4 0.3 0.3 0.3 0.3 0.3 0.2 0.4Writer/Producer/Director 0.2 0.2 0.2 0.2 0.2 0.3 0.1 0.2 0.1 0.3 0.3 0.2 0.6Farmer or Forester 0.7 0.8 0.5 0.8 0.9 0.6 0.6 1.4 0.5 0.3 0.3 0.2 0.5Natural Resource Specialist/Environmentalist 0.3 0.3 0.2 0.3 0.3 0.3 0.2 0.3 0.2 0.2 0.4 0.6 0.3Accountant 1.7 1.5 1.9 1.3 1.7 1.5 2.5 1.5 1.8 2.3 0.6 0.5 0.7Administrative Assistant 0.3 0.3 0.3 0.4 0.3 0.3 0.4 0.3 0.3 0.3 0.6 0.5 0.8Business Manager/Executive 5.9 5.0 6.7 4.3 5.8 5.9 6.6 5.3 6.1 9.2 2.3 2.2 2.5Business Owner/Entrepreneur 5.6 5.1 6.2 4.6 5.6 6.1 6.2 4.6 5.7 8.1 2.6 2.3 3.1Retail Sales 0.8 0.9 0.8 0.8 0.9 0.8 0.9 1.0 0.8 0.7 0.9 0.8 1.0Sales/Marketing 4.0 3.7 4.4 3.5 3.9 4.1 4.2 3.7 4.3 4.5 1.4 1.5 1.4Human Resources 0.4 0.4 0.4 0.4 0.5 0.5 0.5 0.5 0.4 0.4 0.7 0.7 0.6Finance (e.g., Actuary, Banking, Loan Officer, Planner) 2.3 1.9 2.6 1.5 2.4 2.8 2.8 1.8 2.3 3.7 0.8 0.6 1.0Management Consultant 0.9 0.8 1.0 0.7 0.9 1.1 0.8 0.8 0.9 1.2 0.6 0.3 0.9Real Estate Agent/Realtor/Appraiser/Developer 1.1 0.9 1.3 0.9 1.0 1.1 1.0 0.8 1.2 1.6 0.5 0.4 0.5Sports Management 0.1 0.1 0.1 0.1 0.1 0.1 0.1 0.1 0.1 0.1 0.0 0.0 0.0Journalist 0.2 0.2 0.2 0.2 0.2 0.3 0.1 0.1 0.2 0.3 0.2 0.4 0.0Public/Media Relations 0.3 0.3 0.3 0.3 0.4 0.3 0.4 0.4 0.3 0.3 0.4 0.2 0.6Advertising 0.2 0.2 0.2 0.1 0.2 0.3 0.2 0.2 0.1 0.2 0.2 0.3 0.0College Administrator/Staff 0.4 0.4 0.4 0.3 0.5 0.6 0.3 0.5 0.4 0.5 0.5 0.4 0.7College Faculty 0.8 0.7 0.9 0.5 1.0 1.4 0.5 0.8 0.8 1.2 0.4 0.2 0.6Early Childcare Provider 0.9 1.0 0.9 0.9 1.0 1.1 1.0 0.9 0.9 0.8 0.8 0.9 0.8Elementary School Teacher 1.6 1.7 1.4 1.6 1.7 1.8 1.7 1.7 1.4 1.5 1.7 1.5 2.0Secondary School Teacher 1.9 1.9 1.8 1.7 2.1 2.1 1.8 2.3 1.8 1.9 1.7 1.7 1.8Librarian 0.8 0.7 0.9 0.6 0.9 1.0 0.8 0.9 0.8 1.0 0.5 0.3 0.9Teacher’s Assistant/Paraprofessional 0.1 0.2 0.1 0.1 0.2 0.2 0.1 0.2 0.1 0.1 0.3 0.2 0.3K-12 Administrator 0.5 0.6 0.4 0.5 0.6 0.5 0.5 0.7 0.5 0.4 0.9 0.7 1.2Other K-12 Professional 0.5 0.5 0.4 0.5 0.5 0.6 0.4 0.6 0.4 0.4 0.7 0.7 0.6Military 2.4 2.8 2.1 3.4 2.3 1.9 1.5 2.9 2.3 1.3 4.6 4.6 4.7Federal/State/Local Government Official 2.5 2.7 2.3 2.7 2.7 2.6 2.7 2.7 2.4 2.0 2.1 2.1 2.1

32
2013 CIRP Freshman Survey Weighted National Norms—All Respondents
Baccalaureate Black Colleges All Bacc Institutions 4-year Colleges Universities and Universities Institutions 4-yr Coll Universities Public Private Nonsec Catholic Oth Relig Public Private All HBCU Public Private
Your father’s occupation (continued)Protective Services (e.g., Homeland Security,
Law Enforcement, Firefighter) 2.9 3.3 2.4 3.8 2.8 2.8 3.1 2.7 2.6 1.8 4.2 5.0 2.9Postal Worker 1.0 1.1 1.0 1.3 0.8 0.8 0.9 0.8 1.1 0.8 1.3 1.2 1.5Dietician/Nutritionist 1.6 1.9 1.3 1.9 1.8 1.8 1.5 1.9 1.3 1.3 1.7 1.7 1.6Home Health Worker 0.2 0.3 0.2 0.3 0.3 0.2 0.3 0.3 0.2 0.1 0.3 0.3 0.2Medical/Dental Assistant (e.g., Hygienist, Lab Tech,
Nursing Asst.) 0.4 0.4 0.4 0.4 0.4 0.3 0.3 0.4 0.4 0.3 0.5 0.5 0.6Registered Nurse 0.6 0.6 0.6 0.7 0.5 0.4 0.4 0.7 0.6 0.3 0.6 0.7 0.6Therapist (e.g., Physical, Occupational, Speech) 0.7 0.7 0.6 0.6 0.7 0.7 0.7 0.8 0.6 0.6 0.8 0.8 0.9Computer Programmer/Developer 1.8 1.6 1.9 1.6 1.7 1.8 1.6 1.6 2.0 1.8 1.1 1.2 1.0Computer/Systems Analyst 2.1 2.0 2.1 1.9 2.0 2.1 1.6 2.1 2.2 2.0 1.7 1.9 1.4Web Designer 0.3 0.4 0.2 0.4 0.3 0.3 0.4 0.3 0.3 0.2 0.3 0.3 0.3Lawyer/Judge 2.5 1.9 3.1 1.3 2.5 3.2 2.6 1.7 2.6 4.9 1.0 0.4 1.8Paralegal 0.2 0.2 0.2 0.2 0.1 0.2 0.1 0.1 0.2 0.2 0.3 0.3 0.2Clinical Psychologist 0.3 0.3 0.4 0.2 0.4 0.3 0.3 0.4 0.3 0.4 0.5 0.2 0.8Dentist/Orthodontist 1.0 0.8 1.1 0.9 0.8 0.8 0.9 0.8 1.1 1.3 0.5 0.5 0.4Medical Doctor/Surgeon 3.2 2.2 4.1 1.5 2.9 3.3 2.3 2.7 3.7 5.6 1.0 0.5 1.7Optometrist 0.8 0.9 0.8 1.0 0.7 0.6 0.6 0.8 0.8 0.7 0.8 1.0 0.5Pharmacist 0.4 0.4 0.4 0.3 0.4 0.3 0.5 0.4 0.4 0.4 0.4 0.1 0.8Veterinarian 0.2 0.2 0.2 0.1 0.2 0.2 0.1 0.3 0.2 0.1 0.1 0.1 0.2Engineer 6.9 5.5 8.1 5.5 5.6 5.5 6.1 5.4 8.5 7.0 4.7 4.5 5.0Research Scientist (e.g., Biologist, Chemist, Physicist) 1.0 0.7 1.2 0.7 0.8 1.0 0.5 0.7 1.2 1.2 0.4 0.5 0.3Urban Planner/Architect 1.4 1.2 1.5 1.4 1.1 1.2 0.9 1.2 1.6 1.1 1.8 2.0 1.5Custodian/Janitor/Housekeeper 1.3 1.6 1.0 1.7 1.5 1.3 1.5 1.6 1.0 0.8 2.9 2.9 2.8Food Service (e.g., Chef/Cook Server) 1.2 1.2 1.3 1.4 0.9 1.1 1.1 0.7 1.4 1.0 1.3 1.1 1.6Hair Stylist/Aesthetician/Manicurist 0.3 0.3 0.3 0.3 0.3 0.2 0.3 0.3 0.3 0.2 0.7 0.8 0.7Interior Designer 0.1 0.1 0.1 0.2 0.1 0.1 0.1 0.1 0.2 0.1 0.2 0.1 0.2Skilled Trades (e.g., Plumber, Electrician, Construction) 7.8 8.8 6.9 9.6 8.0 7.3 8.9 8.1 7.4 4.8 6.3 6.7 5.6Social/Non-Profit Services 0.5 0.6 0.4 0.6 0.5 0.5 0.5 0.6 0.4 0.4 1.3 1.6 0.8Clergy 0.7 0.8 0.6 0.6 1.0 0.6 0.5 1.7 0.6 0.6 1.4 1.0 1.9Homemaker/Stay at Home Parent 1.4 1.5 1.3 1.6 1.3 1.3 1.2 1.3 1.4 1.0 2.1 1.7 2.7Other 17.6 20.1 15.3 21.8 18.3 17.0 18.8 19.4 16.1 12.1 27.1 28.4 25.2Undecided 1.5 1.6 1.3 1.7 1.5 1.2 1.3 1.7 1.4 0.9 4.3 5.2 3.0
Your mother’s occupationActor or Entertainer 0.4 0.3 0.4 0.3 0.4 0.5 0.3 0.3 0.4 0.4 0.1 0.1 0.1Artist 0.5 0.5 0.5 0.4 0.6 0.8 0.5 0.6 0.4 0.7 0.3 0.2 0.4Graphic Designer 0.3 0.3 0.3 0.3 0.3 0.4 0.2 0.3 0.3 0.4 0.1 0.1 0.1Musician 0.4 0.4 0.4 0.3 0.5 0.6 0.3 0.4 0.4 0.5 0.5 0.4 0.6Writer/Producer/Director 0.2 0.2 0.2 0.1 0.2 0.3 0.1 0.2 0.1 0.3 0.0 0.0 0.0Farmer or Forester 0.2 0.2 0.1 0.2 0.2 0.2 0.2 0.2 0.1 0.1 0.1 0.0 0.3Natural Resource Specialist/Environmentalist 0.2 0.2 0.2 0.1 0.2 0.2 0.1 0.2 0.2 0.2 0.2 0.2 0.2Accountant 3.4 3.1 3.6 2.9 3.3 3.2 3.7 3.1 3.6 3.8 2.4 2.3 2.7Administrative Assistant 2.1 2.2 2.1 2.1 2.2 2.0 2.8 2.2 2.1 2.1 2.1 2.1 2.0Business Manager/Executive 2.4 2.1 2.7 1.9 2.4 2.6 2.6 2.1 2.6 3.0 1.7 1.3 2.2Business Owner/Entrepreneur 2.1 1.9 2.2 1.7 2.1 2.2 2.0 2.0 2.0 2.9 1.3 1.0 1.8Retail Sales 1.2 1.2 1.2 1.2 1.2 1.0 1.2 1.3 1.3 1.0 1.1 1.2 1.1Sales/Marketing 2.4 2.2 2.5 2.2 2.3 2.3 2.4 2.3 2.6 2.5 1.2 1.2 1.1Human Resources 1.4 1.4 1.4 1.4 1.3 1.4 1.5 1.2 1.4 1.2 2.3 2.0 2.7Finance (e.g., Actuary, Banking, Loan Officer, Planner) 2.1 2.0 2.1 2.0 2.0 2.2 2.1 1.9 2.1 2.1 1.6 1.5 1.9

33
2013 CIRP Freshman Survey Weighted National Norms—All Respondents
Baccalaureate Black Colleges All Bacc Institutions 4-year Colleges Universities and Universities Institutions 4-yr Coll Universities Public Private Nonsec Catholic Oth Relig Public Private All HBCU Public Private
Your mother’s occupation (continued)Management Consultant 0.6 0.5 0.6 0.6 0.5 0.6 0.4 0.4 0.6 0.7 0.4 0.5 0.2Real Estate Agent/Realtor/Appraiser/Developer 1.1 1.0 1.2 1.1 0.9 0.8 1.0 0.9 1.2 1.3 0.4 0.5 0.3Sports Management 0.0 0.1 0.0 0.0 0.1 0.0 0.1 0.1 0.0 0.0 0.2 0.2 0.1Journalist 0.2 0.2 0.2 0.1 0.3 0.3 0.2 0.2 0.2 0.4 0.2 0.2 0.1Public/Media Relations 0.5 0.4 0.5 0.4 0.5 0.5 0.5 0.4 0.5 0.5 0.8 0.5 1.3Advertising 0.2 0.2 0.3 0.2 0.2 0.2 0.2 0.2 0.2 0.4 0.1 0.2 0.0College Administrator/Staff 0.6 0.6 0.5 0.5 0.7 0.8 0.7 0.7 0.5 0.6 0.5 0.4 0.6College Faculty 0.8 0.7 0.8 0.5 0.9 1.2 0.7 0.8 0.7 1.2 0.4 0.2 0.8Early Childcare Provider 2.8 3.2 2.6 3.4 2.9 2.6 2.9 3.3 2.7 2.1 3.6 3.8 3.1Elementary School Teacher 4.5 4.7 4.3 4.4 5.1 4.7 5.2 5.6 4.4 4.2 4.8 4.4 5.4Secondary School Teacher 2.3 2.2 2.3 2.0 2.5 2.7 1.9 2.7 2.3 2.4 1.8 1.4 2.5Librarian 0.8 0.8 0.8 0.8 0.9 0.9 0.9 0.9 0.8 0.9 0.7 0.7 0.7Teacher’s Assistant/Paraprofessional 1.6 1.8 1.3 1.9 1.8 1.8 1.7 1.7 1.3 1.2 0.9 0.9 0.7K-12 Administrator 1.1 1.3 1.0 1.3 1.2 1.2 1.1 1.3 1.1 0.8 2.0 1.6 2.5Other K-12 Professional 1.3 1.4 1.1 1.4 1.4 1.3 1.4 1.6 1.1 1.1 1.7 1.8 1.6Military 0.8 0.8 0.8 0.9 0.8 0.8 0.6 0.9 0.8 0.7 1.4 1.5 1.1Federal/State/Local Government Official 1.5 1.7 1.4 1.7 1.7 1.7 1.6 1.7 1.4 1.2 2.6 2.5 2.7Protective Services (e.g., Homeland Security,
Law Enforcement, Firefighter) 0.6 0.7 0.5 0.7 0.7 0.6 0.8 0.7 0.6 0.4 1.6 1.8 1.3Postal Worker 0.7 0.8 0.7 0.9 0.7 0.6 0.7 0.7 0.7 0.6 1.1 1.3 0.8Dietician/Nutritionist 1.3 1.4 1.2 1.5 1.3 1.3 1.2 1.5 1.2 1.1 1.5 1.7 1.2Home Health Worker 2.6 3.1 2.1 3.2 3.0 2.9 2.4 3.4 2.2 1.5 4.8 5.1 4.3Medical/Dental Assistant (e.g., Hygienist, Lab Tech,
Nursing Asst.) 2.3 2.4 2.1 2.6 2.1 2.1 2.2 2.2 2.3 1.6 3.3 4.0 2.2Registered Nurse 4.9 4.8 5.1 4.7 4.8 4.3 5.6 4.9 5.3 4.6 3.8 3.5 4.1Therapist (e.g., Physical, Occupational, Speech) 1.9 1.9 1.8 1.8 2.0 2.0 1.9 1.9 1.9 1.7 1.8 1.4 2.5Computer Programmer/Developer 1.1 1.1 1.1 1.2 1.1 1.1 1.1 1.1 1.2 1.0 1.2 1.5 0.8Computer/Systems Analyst 1.4 1.5 1.4 1.5 1.5 1.4 1.4 1.7 1.4 1.2 1.8 1.8 1.7Web Designer 0.1 0.1 0.1 0.1 0.1 0.1 0.1 0.1 0.1 0.1 0.1 0.1 0.2Lawyer/Judge 1.3 0.9 1.6 0.6 1.2 1.8 1.0 0.8 1.4 2.5 0.7 0.3 1.4Paralegal 0.6 0.6 0.7 0.6 0.6 0.6 0.6 0.5 0.7 0.5 0.4 0.4 0.5Clinical Psychologist 0.3 0.3 0.4 0.2 0.4 0.5 0.2 0.3 0.4 0.5 0.3 0.3 0.3Dentist/Orthodontist 0.4 0.3 0.5 0.3 0.4 0.4 0.4 0.4 0.5 0.5 0.3 0.2 0.6Medical Doctor/Surgeon 1.3 0.9 1.7 0.7 1.2 1.6 0.9 1.0 1.5 2.5 0.8 0.6 1.1Optometrist 0.2 0.1 0.2 0.1 0.1 0.1 0.2 0.1 0.2 0.2 0.2 0.3 0.1Pharmacist 0.5 0.4 0.6 0.3 0.5 0.5 0.4 0.4 0.5 0.6 0.4 0.3 0.7Veterinarian 0.1 0.1 0.1 0.1 0.1 0.2 0.1 0.2 0.1 0.1 0.0 0.0 0.0Engineer 1.1 0.7 1.5 0.6 0.8 0.8 0.8 0.7 1.5 1.5 0.9 0.9 0.9Research Scientist (e.g., Biologist, Chemist, Physicist) 0.6 0.4 0.7 0.3 0.5 0.6 0.4 0.4 0.7 0.9 0.1 0.1 0.2Urban Planner/Architect 0.2 0.2 0.3 0.1 0.2 0.2 0.1 0.2 0.3 0.4 0.1 0.1 0.1Custodian/Janitor/Housekeeper 0.8 0.9 0.7 1.0 0.8 0.6 1.0 0.8 0.7 0.6 0.8 0.7 1.0Food Service (e.g., Chef/Cook Server) 1.5 1.5 1.5 1.7 1.3 1.4 1.4 1.2 1.6 1.0 1.9 1.7 2.3Hair Stylist/Aesthetician/Manicurist 1.4 1.4 1.4 1.5 1.2 1.2 1.3 1.2 1.5 0.9 1.7 1.9 1.4Interior Designer 0.3 0.3 0.3 0.4 0.3 0.3 0.3 0.3 0.3 0.4 0.3 0.4 0.2Skilled Trades (e.g., Plumber, Electrician, Construction) 0.4 0.4 0.4 0.4 0.4 0.3 0.4 0.4 0.4 0.3 0.3 0.2 0.5Social/Non-Profit Services 3.3 4.0 2.6 4.3 3.6 3.1 3.6 4.0 2.8 2.1 7.8 8.7 6.2Clergy 0.6 0.6 0.5 0.6 0.6 0.6 0.4 0.7 0.5 0.5 0.7 0.8 0.4Homemaker/Stay at Home Parent 13.8 12.4 15.2 12.6 12.1 12.4 13.2 11.3 14.3 18.8 5.5 5.0 6.3Other 13.7 15.1 12.3 16.1 14.1 13.6 14.5 14.3 12.9 10.1 16.9 18.7 14.0Undecided 0.8 0.9 0.8 1.0 0.7 0.7 0.7 0.8 0.8 0.6 1.6 1.4 1.8

34
2013 CIRP Freshman Survey Weighted National Norms—All Respondents
Baccalaureate Black Colleges All Bacc Institutions 4-year Colleges Universities and Universities Institutions 4-yr Coll Universities Public Private Nonsec Catholic Oth Relig Public Private All HBCU Public Private
Current employment status:Your mother
Employed 76.2 77.1 75.3 76.8 77.5 76.4 77.4 78.6 76.5 70.3 78.2 78.6 77.6Unemployed 20.5 20.3 20.7 21.1 19.2 19.9 19.4 18.4 20.1 23.4 19.3 19.1 19.7Retired 3.3 2.6 4.0 2.0 3.4 3.7 3.2 3.0 3.4 6.3 2.4 2.3 2.6
Your fatherEmployed 87.6 86.4 88.7 85.7 87.4 87.2 87.4 87.5 88.4 90.0 74.7 73.9 76.1Unemployed 8.5 9.5 7.4 10.4 8.4 8.1 8.7 8.5 7.7 6.0 19.5 20.5 17.6Retired 4.0 4.1 3.9 3.9 4.3 4.8 3.8 4.0 3.8 4.0 5.8 5.5 6.3
Race/Ethnicity—mark all that apply (total may add to more than 100%)
American Indian/Alaska Native 2.5 3.0 1.8 3.4 2.6 2.4 1.8 3.2 1.9 1.6 3.7 3.6 3.8Asian American/Asian 11.7 6.8 17.0 6.7 6.9 8.8 7.8 4.6 16.4 19.1 1.8 0.9 3.6Native Hawaiian/Pacific Islander 1.4 1.3 1.5 1.6 0.9 0.8 1.4 0.8 1.6 1.0 0.7 0.3 1.2African American/Black 11.9 16.4 7.1 16.4 16.4 13.9 17.4 18.3 7.2 6.9 93.9 94.0 93.7Mexican American/Chicano 7.1 8.4 5.6 11.8 4.2 3.6 6.8 3.5 5.9 4.7 1.2 1.4 0.8Puerto Rican 2.0 2.4 1.6 2.5 2.2 2.7 2.4 1.5 1.5 1.9 1.7 1.9 1.4Other Latino 5.9 6.5 5.3 7.9 4.8 5.5 6.2 3.4 5.1 5.9 1.1 0.8 1.5White/Caucasian 68.3 66.3 70.4 61.6 72.1 72.2 66.2 74.8 70.9 68.6 5.4 5.7 5.0Other 3.5 3.6 3.5 3.8 3.2 3.8 3.1 2.8 3.4 3.8 3.8 3.6 4.1
Students “Agree Strongly” or “Agree Somewhat”:Wealthy people should pay a larger share of taxes
than they do now 68.1 70.7 65.1 71.9 69.4 71.8 70.6 66.4 66.1 61.3 79.2 79.1 79.4Affirmative action in college admissions should be
abolished 52.0 50.3 53.9 50.9 49.6 49.7 51.1 48.9 53.5 55.4 50.8 53.4 46.2The federal government should do more to control
the sale of handguns 63.8 63.1 64.7 62.6 63.6 68.9 69.2 55.9 63.3 69.8 83.0 82.8 83.2A national health care plan is needed to cover
everybody’s medical costs 61.3 63.5 58.8 64.5 62.3 66.4 65.1 57.0 58.5 59.7 84.8 84.4 85.4The federal government should raise taxes to reduce
the deficit 36.9 35.3 38.7 35.8 34.7 36.6 34.2 33.2 38.9 38.0 39.6 37.3 43.6Addressing global warming should be a federal
priority 60.8 60.2 61.4 60.7 59.6 65.4 62.7 52.7 60.7 64.2 69.7 69.0 71.0The chief benefit of a college education is that it
increases one’s earning power 72.0 72.8 71.2 75.5 69.5 68.1 73.8 68.7 72.1 67.6 77.1 77.9 75.8Gays and lesbians should have the legal right to
adopt a child 83.3 80.7 86.2 81.8 79.4 86.1 83.0 71.3 86.5 85.1 73.9 72.9 75.7Undocumented immigrants should be denied access
to public education 40.7 40.8 40.5 41.3 40.1 37.8 40.7 42.0 41.2 38.2 34.9 35.8 33.1How would you characterize your political views?
Far left 2.8 3.0 2.6 3.0 3.1 4.2 2.1 2.6 2.6 2.4 5.9 6.5 5.0Liberal 27.7 25.7 29.9 25.2 26.2 32.7 25.1 20.7 29.7 31.1 27.7 24.6 33.4Middle-of-the-road 46.3 48.1 44.3 50.0 45.9 44.1 49.2 46.0 45.2 41.0 49.6 51.0 46.9Conservative 21.2 21.0 21.5 19.7 22.6 17.4 21.8 27.8 20.9 23.8 13.6 14.2 12.4Far right 1.9 2.1 1.7 2.1 2.2 1.6 1.8 2.9 1.7 1.6 3.2 3.7 2.3

35
2013 CIRP Freshman Survey Weighted National Norms—All Respondents
Baccalaureate Black Colleges All Bacc Institutions 4-year Colleges Universities and Universities Institutions 4-yr Coll Universities Public Private Nonsec Catholic Oth Relig Public Private All HBCU Public Private
The following reasons were “Very Important” in deciding to go to college:
To be able to get a better job 86.3 85.7 87.0 86.6 84.6 83.6 89.1 83.3 87.0 86.9 90.2 90.1 90.3To gain a general education and appreciation of ideas 69.6 70.0 69.2 68.6 71.7 73.0 74.0 69.5 67.9 74.6 79.1 78.9 79.6To make me a more cultured person 45.9 45.7 46.1 43.2 48.7 50.6 49.3 46.6 44.2 53.9 59.0 56.5 63.7To be able to make more money 73.3 73.9 72.7 77.1 70.0 69.0 75.7 68.3 73.7 68.5 86.9 88.7 83.6To learn more about things that interest me 81.6 81.0 82.2 80.0 82.2 83.1 82.4 81.4 81.7 84.2 82.9 82.0 84.5To get training for a specific career 77.1 78.0 76.0 79.8 75.9 71.6 79.9 78.0 77.4 70.6 85.8 84.8 87.5To prepare myself for graduate or professional school 60.8 59.0 62.8 58.9 59.1 58.8 64.2 56.9 63.5 59.9 79.8 77.2 84.8
During your last year in high school, how much time did you spend during a typical week doing the following activities?Studying/homework
None 1.9 2.2 1.6 2.6 1.8 1.5 1.2 2.3 1.7 1.0 3.2 3.9 1.8Less than one hour 9.5 11.1 7.7 12.8 9.0 8.6 7.3 10.3 8.4 5.3 11.8 14.1 7.71 to 2 hours 20.1 23.4 16.3 25.8 20.5 19.5 18.1 22.7 17.4 12.2 31.2 33.9 26.33 to 5 hours 27.1 27.9 26.1 28.9 26.8 25.8 26.8 27.7 26.9 23.1 28.4 28.0 29.06 to 10 hours 20.4 18.6 22.5 16.8 20.8 21.2 22.6 19.7 22.1 24.0 13.7 11.1 18.511 to 15 hours 10.6 8.7 12.8 7.1 10.7 11.4 12.4 9.1 11.9 16.2 5.5 4.2 7.916 to 20 hours 5.7 4.5 7.2 3.4 5.8 6.3 6.8 4.8 6.4 10.0 3.1 2.2 4.6Over 20 hours 4.6 3.5 5.8 2.6 4.6 5.6 4.8 3.5 5.1 8.3 3.1 2.5 4.2
Socializing with friendsNone 0.5 0.6 0.4 0.6 0.5 0.5 0.5 0.5 0.4 0.3 1.2 0.9 1.6Less than one hour 2.2 2.5 1.8 2.6 2.4 2.3 2.1 2.6 1.9 1.5 4.2 4.5 3.71 to 2 hours 9.6 10.5 8.5 10.9 10.0 9.6 10.2 10.4 8.8 7.5 14.3 13.9 15.23 to 5 hours 24.0 24.0 23.9 23.9 24.1 23.7 24.3 24.3 24.1 23.3 26.8 26.5 27.46 to 10 hours 27.3 25.9 29.0 25.2 26.8 27.5 27.4 25.8 28.8 29.6 23.0 22.3 24.211 to 15 hours 16.3 15.5 17.3 15.0 16.2 16.3 16.0 16.1 17.0 18.1 11.3 11.1 11.616 to 20 hours 8.7 8.6 8.9 8.7 8.5 8.5 8.4 8.6 8.7 9.4 5.9 6.3 5.3Over 20 hours 11.4 12.5 10.1 13.2 11.6 11.6 11.0 11.9 10.1 10.2 13.4 14.5 11.2
Talking with teachers outside of classNone 10.9 11.3 10.4 12.8 9.5 8.6 8.6 10.9 11.2 7.8 13.1 14.3 10.7Less than one hour 39.0 38.3 39.9 39.2 37.2 36.4 37.2 37.9 40.8 36.6 32.9 33.2 32.41 to 2 hours 32.1 31.2 33.3 29.6 33.0 34.1 33.4 31.8 32.5 36.0 27.7 27.5 28.13 to 5 hours 12.4 12.8 11.8 12.1 13.7 14.3 14.4 12.9 11.2 14.0 15.9 14.7 18.16 to 10 hours 3.5 3.8 3.0 3.7 4.0 4.0 4.0 3.9 2.9 3.5 5.5 5.1 6.111 to 15 hours 1.1 1.3 0.9 1.3 1.4 1.3 1.4 1.5 0.9 1.1 2.2 2.2 2.316 to 20 hours 0.5 0.6 0.3 0.7 0.5 0.6 0.5 0.5 0.3 0.4 1.6 1.8 1.1Over 20 hours 0.5 0.6 0.3 0.6 0.7 0.7 0.6 0.7 0.3 0.5 1.2 1.2 1.1
Exercise or sportsNone 5.6 6.4 4.6 6.9 5.7 5.5 5.1 6.2 5.0 3.4 9.8 10.1 9.2Less than one hour 8.7 9.0 8.3 9.5 8.4 8.4 8.5 8.5 8.5 7.4 12.3 11.6 13.61 to 2 hours 15.1 15.5 14.7 16.7 14.1 14.3 14.6 13.6 14.9 14.1 20.0 19.9 20.23 to 5 hours 19.0 18.3 19.9 18.8 17.6 18.3 18.0 16.8 19.8 20.2 20.2 19.4 21.96 to 10 hours 18.7 17.1 20.6 17.0 17.2 17.9 18.0 16.1 20.5 21.3 13.1 12.8 13.811 to 15 hours 13.9 13.5 14.4 12.7 14.6 14.6 14.6 14.6 14.2 15.1 8.8 9.0 8.516 to 20 hours 8.2 8.3 8.0 7.6 9.2 8.7 9.0 9.8 7.8 8.9 5.0 5.2 4.5Over 20 hours 10.8 11.9 9.4 10.9 13.1 12.3 12.2 14.3 9.3 9.7 10.8 12.1 8.3

36
2013 CIRP Freshman Survey Weighted National Norms—All Respondents
Baccalaureate Black Colleges All Bacc Institutions 4-year Colleges Universities and Universities Institutions 4-yr Coll Universities Public Private Nonsec Catholic Oth Relig Public Private All HBCU Public Private
During your last year in high school, how much time did you spend during a typical week doing the following activities?Partying
None 37.8 38.3 37.2 36.2 40.8 36.7 37.0 46.5 38.0 34.2 26.8 26.9 26.7Less than one hour 16.1 15.6 16.7 15.5 15.6 16.6 15.2 14.9 16.8 16.4 15.9 15.7 16.11 to 2 hours 16.9 16.7 17.1 17.2 16.1 16.6 17.5 15.1 16.9 17.5 22.1 21.5 23.13 to 5 hours 16.3 15.9 16.7 16.8 14.9 16.3 17.1 12.6 16.1 18.7 20.4 21.0 19.26 to 10 hours 7.8 7.8 7.9 8.3 7.3 8.3 8.0 6.0 7.7 8.6 7.9 8.0 7.811 to 15 hours 2.8 2.9 2.7 3.1 2.6 2.9 2.6 2.4 2.7 2.6 3.5 3.5 3.416 to 20 hours 1.1 1.3 1.0 1.3 1.2 1.4 1.2 1.2 0.9 1.0 1.6 1.3 2.0Over 20 hours 1.2 1.5 0.9 1.6 1.3 1.3 1.3 1.4 0.9 1.0 2.0 2.1 1.7
Working (for pay)None 42.7 40.4 45.4 39.7 41.3 43.0 39.4 40.5 43.9 50.6 44.6 42.5 48.4Less than one hour 3.6 3.5 3.6 3.3 3.7 3.7 3.3 3.9 3.5 4.0 3.8 3.8 3.91 to 2 hours 5.0 5.0 5.1 4.5 5.5 5.5 5.2 5.7 4.8 6.1 5.7 5.9 5.23 to 5 hours 8.3 8.4 8.3 7.8 9.1 9.3 9.6 8.6 8.1 9.1 9.4 9.2 9.96 to 10 hours 11.4 11.9 11.0 11.6 12.2 11.4 13.2 12.4 11.0 10.9 11.4 12.0 10.311 to 15 hours 9.8 10.0 9.5 10.2 9.8 9.3 10.0 10.1 10.0 7.8 6.2 6.2 6.416 to 20 hours 8.8 9.2 8.4 10.0 8.2 7.9 9.0 8.1 9.1 5.7 6.7 6.9 6.2Over 20 hours 10.3 11.7 8.8 12.9 10.3 9.9 10.4 10.5 9.6 5.7 12.2 13.6 9.6
Volunteer workNone 25.6 28.1 22.6 30.1 25.8 25.5 23.2 27.4 23.8 18.5 28.6 31.1 24.0Less than one hour 19.2 19.1 19.4 18.8 19.5 19.4 18.4 20.2 19.7 18.4 13.1 13.4 12.61 to 2 hours 25.0 23.6 26.6 22.7 24.7 24.4 26.4 24.2 25.8 29.3 21.8 21.1 22.93 to 5 hours 16.7 15.5 18.1 14.8 16.3 16.6 17.4 15.4 17.6 19.9 16.5 14.8 19.66 to 10 hours 7.0 6.8 7.2 6.7 7.1 7.4 7.6 6.5 7.1 7.7 9.3 8.9 10.111 to 15 hours 2.7 2.8 2.6 2.8 2.8 2.8 2.8 2.7 2.6 2.7 4.1 3.9 4.416 to 20 hours 1.4 1.4 1.3 1.5 1.4 1.3 1.4 1.4 1.2 1.4 2.2 2.6 1.6Over 20 hours 2.4 2.6 2.2 2.7 2.5 2.6 2.8 2.3 2.2 2.1 4.3 4.1 4.8
Student clubs/groupsNone 26.7 30.3 22.5 32.5 27.5 26.6 24.8 29.7 24.2 16.3 28.4 31.5 22.8Less than one hour 13.8 13.8 13.7 14.1 13.5 13.1 13.3 14.0 14.0 12.8 11.3 11.8 10.31 to 2 hours 24.8 23.3 26.4 22.5 24.4 24.5 26.0 23.4 26.0 27.8 21.9 21.0 23.63 to 5 hours 18.1 16.8 19.5 15.6 18.1 18.7 19.0 17.2 18.7 22.5 19.3 17.4 22.96 to 10 hours 8.6 7.9 9.4 7.5 8.4 8.7 8.8 8.0 9.0 10.9 9.2 8.2 11.011 to 15 hours 3.7 3.5 4.0 3.4 3.6 3.8 3.7 3.5 3.8 4.5 3.7 3.7 3.816 to 20 hours 1.8 1.8 1.9 1.7 1.9 1.9 1.9 1.8 1.8 2.3 2.5 2.4 2.8Over 20 hours 2.6 2.6 2.6 2.7 2.5 2.8 2.4 2.4 2.5 2.9 3.6 4.1 2.9
Watching TVNone 10.2 9.5 11.0 9.4 9.6 10.3 7.9 9.7 11.0 11.0 10.7 9.5 12.9Less than one hour 17.8 17.8 17.9 18.2 17.3 17.2 17.6 17.1 18.2 16.7 18.0 16.9 20.01 to 2 hours 25.5 25.5 25.4 26.0 25.0 24.6 26.0 24.8 25.5 24.9 23.7 24.6 22.03 to 5 hours 24.7 24.5 25.0 24.2 24.8 25.0 25.9 24.0 24.8 25.9 20.8 21.0 20.66 to 10 hours 13.0 13.1 12.8 12.7 13.6 13.3 13.3 14.1 12.6 13.5 12.2 12.6 11.411 to 15 hours 4.7 4.9 4.4 4.7 5.1 5.1 5.0 5.2 4.4 4.6 6.1 6.6 5.216 to 20 hours 1.9 2.1 1.7 2.0 2.1 2.1 1.9 2.2 1.7 1.6 2.9 3.0 2.8Over 20 hours 2.3 2.6 1.8 2.7 2.6 2.3 2.4 2.9 1.9 1.7 5.6 5.8 5.1

37
2013 CIRP Freshman Survey Weighted National Norms—All Respondents
Baccalaureate Black Colleges All Bacc Institutions 4-year Colleges Universities and Universities Institutions 4-yr Coll Universities Public Private Nonsec Catholic Oth Relig Public Private All HBCU Public Private
During your last year in high school, how much time did you spend during a typical week doing the following activities?Household/childcare duties
None 20.9 20.7 21.1 19.8 21.7 22.8 17.9 22.5 20.6 22.8 22.2 22.5 21.7Less than one hour 20.9 19.8 22.2 19.5 20.1 21.4 18.2 19.9 22.0 22.8 15.8 15.7 16.11 to 2 hours 30.2 29.5 31.0 29.7 29.3 29.2 31.0 28.5 31.1 30.6 25.9 25.9 25.73 to 5 hours 17.6 18.2 16.9 18.6 17.7 16.5 20.3 17.6 17.1 15.9 17.6 17.5 17.86 to 10 hours 6.1 6.7 5.5 7.0 6.4 5.8 7.2 6.6 5.6 4.9 8.3 7.9 9.211 to 15 hours 2.1 2.4 1.7 2.6 2.3 2.1 2.7 2.3 1.7 1.6 3.7 3.7 3.516 to 20 hours 0.9 1.1 0.6 1.1 1.0 0.9 1.1 1.1 0.6 0.6 2.2 2.1 2.4Over 20 hours 1.3 1.6 1.0 1.7 1.5 1.3 1.7 1.5 1.0 0.8 4.3 4.7 3.7
Reading for pleasureNone 31.8 33.7 29.6 35.1 31.9 30.2 31.1 33.9 30.8 25.3 33.0 34.6 30.1Less than one hour 24.9 23.8 26.1 24.0 23.6 23.9 24.4 23.0 26.1 26.2 23.8 24.4 22.61 to 2 hours 21.2 20.3 22.3 19.8 21.0 21.3 22.4 19.9 21.7 24.3 20.3 20.4 20.33 to 5 hours 12.6 12.3 12.9 11.5 13.2 13.8 12.6 12.9 12.4 14.5 11.7 10.3 14.36 to 10 hours 5.4 5.5 5.4 5.3 5.7 5.9 5.4 5.6 5.3 5.8 6.0 5.5 7.011 to 15 hours 2.1 2.2 2.1 2.1 2.3 2.3 2.2 2.3 2.0 2.2 2.7 2.6 3.016 to 20 hours 0.9 0.9 0.8 0.9 1.0 1.0 0.8 1.0 0.8 0.8 1.0 1.0 0.8Over 20 hours 1.1 1.3 0.8 1.3 1.3 1.6 1.0 1.2 0.8 0.9 1.5 1.2 2.0
Playing video/computer gamesNone 43.8 43.3 44.3 42.7 44.0 43.9 46.8 42.8 43.4 47.6 39.4 37.6 42.9Less than one hour 16.5 16.8 16.2 16.7 16.8 16.5 16.9 17.1 16.3 15.8 17.8 17.6 18.01 to 2 hours 14.3 14.6 14.1 14.6 14.5 14.4 14.2 14.8 14.2 13.7 16.8 17.7 15.23 to 5 hours 11.7 11.6 11.8 11.7 11.6 11.8 11.3 11.5 12.0 11.1 12.8 13.0 12.46 to 10 hours 6.8 6.8 6.9 6.9 6.7 6.7 5.8 7.1 7.1 6.2 5.8 6.2 5.111 to 15 hours 3.2 3.2 3.2 3.3 3.1 3.3 2.4 3.3 3.3 2.8 3.1 3.5 2.416 to 20 hours 1.5 1.5 1.5 1.6 1.4 1.4 1.0 1.6 1.5 1.2 1.5 1.5 1.3Over 20 hours 2.1 2.2 2.1 2.5 1.8 1.8 1.6 2.0 2.2 1.6 2.8 2.9 2.6
Online social networks (Facebook, Twitter, etc.)None 5.6 5.8 5.3 6.1 5.4 5.4 5.4 5.5 5.5 4.6 7.2 6.8 8.1Less than one hour 16.9 17.1 16.6 17.4 16.7 16.4 16.0 17.3 17.0 15.3 16.6 16.7 16.41 to 2 hours 26.2 25.4 27.1 24.7 26.3 26.2 26.2 26.4 27.1 26.9 22.0 20.8 24.43 to 5 hours 24.5 23.5 25.7 22.6 24.6 24.6 25.1 24.2 25.0 28.0 18.9 18.2 20.26 to 10 hours 13.1 12.9 13.2 12.9 13.0 13.4 13.3 12.5 13.1 13.7 12.4 13.0 11.411 to 15 hours 5.7 6.1 5.4 6.2 5.9 6.0 6.0 5.7 5.3 5.4 7.0 7.4 6.216 to 20 hours 3.1 3.4 2.7 3.6 3.2 3.2 3.0 3.2 2.8 2.5 4.6 4.7 4.4Over 20 hours 5.0 5.8 4.0 6.5 5.0 4.9 5.0 5.0 4.1 3.6 11.3 12.6 8.9

38
2013 CIRP Freshman Survey Weighted National Norms—All Respondents
Baccalaureate Black Colleges All Bacc Institutions 4-year Colleges Universities and Universities Institutions 4-yr Coll Universities Public Private Nonsec Catholic Oth Relig Public Private All HBCU Public Private
The following reasons were “Very Important” in deciding to go to this particular college:
My parents wanted me to come here 17.6 18.5 16.6 18.5 18.5 16.6 21.8 18.6 16.7 16.3 24.9 21.8 30.7My relatives wanted me to come here 8.4 9.3 7.3 9.5 9.2 7.6 10.9 9.8 7.3 7.0 17.9 15.1 23.1My teacher advised me 7.3 8.6 5.9 8.9 8.2 8.0 8.8 8.0 5.9 6.0 13.6 12.4 15.7This college has a very good academic reputation 64.0 60.0 68.5 54.6 66.5 68.8 69.8 62.6 66.2 76.9 52.3 44.5 66.4This college has a good reputation for its social
activities 44.1 42.1 46.4 41.4 42.9 42.9 44.0 42.4 46.0 47.9 43.7 42.6 45.8I was offered financial assistance 48.7 52.2 44.7 42.0 64.5 61.4 66.1 66.7 42.3 53.6 54.5 52.6 58.0The cost of attending this college 45.9 47.1 44.5 53.5 39.3 38.3 44.3 37.9 47.5 33.1 49.7 52.5 44.8High school counselor advised me 10.3 11.8 8.5 12.4 11.0 11.6 12.9 9.5 8.0 10.3 17.3 17.1 17.6Private college counselor advised me 4.5 5.4 3.5 4.4 6.5 6.3 7.2 6.4 3.0 5.6 9.7 8.2 12.4I wanted to live near home 19.6 22.1 16.7 24.0 19.9 16.6 26.3 19.8 17.3 14.4 21.0 21.7 19.8Not offered aid by first choice 10.9 11.0 10.7 11.6 10.4 10.0 12.9 9.5 11.1 9.5 18.3 18.3 18.2Could not afford first choice 14.9 15.0 14.7 17.5 12.0 12.0 14.4 10.8 16.1 9.5 21.6 23.0 18.9This college’s graduates gain admission to top
graduate/professional schools 33.0 29.4 37.0 25.6 34.0 36.5 38.4 29.6 35.0 44.4 36.6 26.4 55.2This college’s graduates get good jobs 53.1 50.4 56.1 46.0 55.6 56.3 62.0 51.8 53.1 67.2 49.7 42.1 63.8I was attracted by the religious affiliation/orientation
of this college 8.3 10.5 5.8 5.2 16.8 6.4 20.3 24.7 3.2 15.2 17.5 15.6 20.9I wanted to go to a school about the size of this
college 37.6 41.1 33.6 32.7 51.2 50.7 51.6 51.4 30.6 44.7 34.2 31.3 39.5Rankings in national magazines 17.6 13.0 22.8 11.3 15.2 18.0 17.1 11.7 21.3 28.1 17.8 12.0 28.5Information from a website 18.3 17.9 18.7 16.8 19.3 21.9 19.1 17.0 17.4 23.6 23.7 21.5 27.8I was admitted through an Early Action or
Early Decision program 14.3 13.1 15.5 10.4 16.3 21.3 16.8 11.4 13.9 21.4 13.3 11.4 16.7The athletic department recruited me 9.4 14.0 4.2 8.5 20.5 17.1 15.1 26.3 3.8 5.8 12.6 13.3 11.3A visit to this campus 42.9 45.3 40.1 38.5 53.4 55.0 50.8 53.0 37.2 50.9 39.3 38.6 40.5Ability to take online courses 3.8 4.8 2.7 5.5 3.9 3.1 4.3 4.5 2.9 2.0 11.6 12.4 10.2The percentage of students that graduate from
this college 29.7 31.3 27.9 27.0 36.5 35.5 43.5 34.1 26.5 32.9 35.7 31.3 43.8

39
2013 CIRP Freshman Survey Weighted National Norms—All Respondents
Baccalaureate Black Colleges All Bacc Institutions 4-year Colleges Universities and Universities Institutions 4-yr Coll Universities Public Private Nonsec Catholic Oth Relig Public Private All HBCU Public Private
Students rated as “Highest 10%” or “Above Average” as compared with the average person their age:
Academic ability 72.1 63.7 81.2 61.0 67.0 70.0 67.1 64.1 80.3 84.6 64.1 60.1 71.6Artistic ability 28.6 29.0 28.3 28.6 29.5 31.8 25.6 29.3 27.6 31.0 31.1 30.8 31.7Competitiveness 59.7 58.0 61.5 56.9 59.4 58.0 59.2 60.9 61.2 62.8 61.9 61.4 63.0Computer skills 36.4 35.0 37.8 36.5 33.2 33.2 35.1 32.3 37.9 37.6 44.8 44.8 44.7Cooperativeness 72.1 70.9 73.4 70.3 71.7 70.9 74.7 71.1 73.1 74.2 72.1 71.1 74.0Creativity 54.4 54.6 54.2 53.8 55.5 56.9 53.5 55.2 53.3 57.7 59.9 59.9 60.0Drive to achieve 78.1 76.0 80.5 74.6 77.7 77.7 78.8 77.1 79.8 82.9 82.2 81.4 83.6Emotional health 53.0 50.9 55.3 50.3 51.7 50.8 53.2 51.8 54.7 57.5 56.2 54.7 58.9Leadership ability 63.2 61.4 65.2 59.8 63.4 62.5 63.3 64.3 64.1 69.3 70.3 70.6 69.7Mathematical ability 47.4 39.8 55.8 39.2 40.6 42.9 41.4 38.0 55.3 57.6 41.2 38.2 46.7Physical health 56.3 54.9 57.8 53.1 57.0 56.6 57.2 57.3 57.3 59.9 53.2 52.0 55.3Popularity 35.3 34.4 36.3 33.8 35.0 34.6 35.1 35.4 35.2 40.5 44.3 45.5 42.0Public speaking ability 38.4 35.9 41.2 34.6 37.5 38.6 36.5 36.9 39.8 46.9 40.2 38.4 43.6Risk-taking 43.9 43.8 44.1 44.4 43.1 43.2 42.7 43.2 43.6 46.0 50.5 49.5 52.2Self-confidence (intellectual) 60.7 57.2 64.5 56.5 58.2 59.3 57.1 57.5 63.8 67.6 71.6 70.8 73.2Self-confidence (social) 48.0 47.9 48.1 48.3 47.4 46.0 49.0 47.9 47.7 49.7 64.3 65.1 62.8Self-understanding 58.4 57.1 59.8 56.3 58.0 58.9 57.8 57.3 59.1 62.7 69.3 68.4 70.9Spirituality 37.9 39.0 36.6 37.5 40.9 35.4 40.8 46.2 35.7 40.1 56.0 56.0 56.0Understanding of others 70.3 68.9 71.8 68.4 69.6 70.4 70.6 68.3 71.4 73.6 69.2 68.3 70.9Writing ability 46.8 43.5 50.3 41.9 45.5 47.6 44.7 44.0 48.9 56.1 47.4 45.3 51.2
Students believed current abilities as “A Major Strength” or “Somewhat Strong” in each of the following areas:
General knowledge 76.2 72.9 79.8 72.5 73.3 74.8 74.6 71.3 79.3 81.6 76.0 75.2 77.5Knowledge of a particular field or discipline 68.6 65.7 71.9 63.9 67.8 69.4 66.7 66.9 71.0 75.3 67.1 66.9 67.4Knowledge of people from different races/cultures 45.1 43.4 47.0 42.5 44.5 46.0 46.9 41.9 45.6 52.3 55.0 53.3 58.1Understanding of the problems facing your
community 43.6 42.7 44.6 42.1 43.5 44.9 46.1 40.8 43.4 49.3 56.9 54.8 60.7Understanding of national issues 40.1 37.1 43.4 36.8 37.5 39.5 39.3 34.6 42.4 47.4 42.5 40.1 46.9Understanding of global issues 36.0 33.5 38.9 33.2 33.8 36.3 35.4 30.7 37.8 43.1 39.0 36.9 43.0Critical thinking skills 63.7 58.5 69.5 57.6 59.5 62.6 59.6 56.5 68.4 74.0 61.9 60.0 65.4Problem-solving skills 69.7 65.0 75.0 64.1 66.0 67.5 67.4 63.9 74.3 78.0 66.7 65.0 69.8Leadership abilities 63.5 61.6 65.7 59.8 63.7 62.9 64.4 64.1 64.7 69.7 68.7 68.5 69.2Ability to get along with people of different
races/cultures 83.4 81.9 85.0 81.4 82.6 83.5 83.2 81.3 84.7 86.3 81.1 79.9 83.4Ability to manage your time effectively 52.9 51.1 55.0 50.0 52.4 51.6 54.7 51.9 54.6 56.8 58.2 57.2 60.1Foreign language ability 32.1 29.2 35.4 29.7 28.6 31.3 31.1 24.8 33.8 41.5 24.4 21.3 30.0Interpersonal skills 50.4 46.1 55.1 44.3 48.3 49.4 51.3 45.8 53.4 62.0 52.7 49.9 57.8
Military Status:None 97.1 95.6 98.8 92.6 99.1 99.2 98.9 99.0 98.8 99.0 95.7 95.7 95.7ROTC, cadet, or midshipman at a service academy 2.6 4.1 1.0 6.9 0.7 0.6 0.9 0.7 1.0 0.9 3.5 3.3 3.9In Active Duty, Reserves, or National Guard 0.2 0.3 0.1 0.4 0.2 0.1 0.2 0.2 0.2 0.1 0.7 0.9 0.3A discharged veteran NOT serving in Active Duty,
Reserves, or National Guard 0.1 0.1 0.1 0.1 0.1 0.0 0.1 0.1 0.1 0.0 0.1 0.1 0.0

40
2013 CIRP Freshman Survey Weighted National Norms—All Respondents
Baccalaureate Black Colleges All Bacc Institutions 4-year Colleges Universities and Universities Institutions 4-yr Coll Universities Public Private Nonsec Catholic Oth Relig Public Private All HBCU Public Private
How would you describe the racial composition of the high school you last attended?
Completely White 6.6 6.1 7.1 5.5 6.8 6.8 6.5 7.0 7.1 7.1 2.0 1.8 2.3Mostly White 46.9 45.4 48.7 41.0 50.7 50.4 51.1 50.7 47.8 52.1 20.9 18.7 24.9Roughly half non-White 25.3 25.9 24.6 26.8 24.9 24.3 22.3 26.8 25.0 23.1 28.6 30.4 25.4Mostly non-White 16.9 17.3 16.5 20.4 13.6 14.3 15.1 12.2 17.2 14.0 33.7 35.8 29.8Completely non-White 4.2 5.2 3.1 6.3 4.0 4.2 4.9 3.3 2.9 3.7 14.8 13.4 17.6
How would you describe the racial composition of the neighborhood where you grew up?
Completely White 16.3 15.9 16.6 14.0 18.2 18.2 17.2 18.7 16.7 16.4 2.7 2.4 3.1Mostly White 47.4 45.2 49.9 42.4 48.7 48.5 46.7 49.7 49.4 51.8 17.4 15.7 20.5Roughly half non-White 14.7 14.9 14.4 15.8 13.8 13.9 13.8 13.6 14.4 14.3 18.0 19.5 15.3Mostly non-White 14.8 15.5 14.0 18.1 12.5 12.3 14.6 11.7 14.5 11.9 34.3 34.6 33.8Completely non-White 6.9 8.4 5.1 9.7 6.9 7.1 7.8 6.3 4.9 5.5 27.6 27.8 27.3
How many years do you expect it will take you to graduate from this college?
1 0.1 0.1 0.1 0.1 0.1 0.0 0.1 0.1 0.1 0.0 0.1 0.1 0.22 0.5 0.5 0.4 0.5 0.6 0.8 0.5 0.5 0.5 0.2 0.8 1.1 0.53 2.7 2.3 3.1 1.9 2.7 2.3 1.9 3.5 3.5 1.9 4.0 3.4 5.04 84.3 85.0 83.6 82.6 87.8 88.8 85.9 87.8 83.1 85.4 80.0 82.5 75.35 8.1 7.8 8.5 10.5 4.5 4.2 6.7 3.9 8.3 9.2 6.3 7.2 4.66 or more 2.7 2.2 3.2 2.1 2.4 2.8 3.9 1.2 3.3 2.8 5.6 2.4 11.3Do not plan to graduate from this college 1.6 2.2 1.0 2.4 1.9 1.1 1.1 3.1 1.2 0.5 3.3 3.4 3.0
Objectives considered to be “Essential” or “Very Important”:
Becoming accomplished in one of the performing arts (acting, dancing, etc.) 16.1 18.2 13.7 18.0 18.6 18.1 15.8 20.4 13.2 15.4 32.6 33.2 31.5
Becoming an authority in my field 60.7 59.8 61.8 58.6 61.1 61.8 62.1 60.0 60.9 64.8 70.6 69.9 72.0Obtaining recognition from my colleagues for
contributions to my special field 58.8 57.7 60.0 57.3 58.2 59.3 60.2 56.1 59.5 61.8 66.6 64.8 69.9Influencing the political structure 21.5 22.1 20.8 22.3 21.9 22.2 22.4 21.4 20.2 23.2 38.5 36.9 41.5Influencing social values 42.9 44.1 41.4 43.0 45.5 44.7 47.6 45.1 40.2 45.4 57.3 55.4 60.9Raising a family 73.3 73.0 73.6 71.6 74.7 72.1 78.5 75.4 73.2 75.0 74.2 73.4 75.7Being very well off financially 82.0 81.3 82.7 83.3 79.0 78.9 84.3 76.5 83.5 80.2 86.9 86.3 87.9Helping others who are in difficulty 71.8 71.8 71.8 70.3 73.6 72.2 76.4 73.6 70.6 75.8 76.5 74.8 79.8Making a theoretical contribution to science 25.2 23.0 27.9 23.2 22.7 23.5 25.6 20.6 28.6 25.5 37.1 32.5 45.5Writing original works (poems, novels, etc.) 15.8 17.5 13.8 16.9 18.1 18.7 15.9 18.6 13.3 15.5 31.1 29.4 34.1Creating artistic works (painting, sculpture, etc.) 15.0 17.1 12.6 17.1 17.0 17.9 15.0 17.2 12.3 13.8 27.1 26.8 27.6Becoming successful in a business of my own 41.2 42.0 40.2 42.2 41.8 41.3 43.3 41.6 39.2 43.5 66.0 65.3 67.2Becoming involved in programs to clean up the
environment 25.2 25.8 24.5 25.6 25.9 27.1 26.5 24.6 24.3 25.2 43.3 41.1 47.4Developing a meaningful philosophy of life 44.8 43.4 46.4 41.9 45.2 46.2 45.1 44.3 44.8 52.0 56.5 55.1 59.0Participating in a community action program 29.7 29.5 29.9 28.0 31.3 30.4 34.0 30.9 28.4 34.8 51.6 48.5 57.4Helping to promote racial understanding 35.7 36.4 34.9 35.4 37.5 38.2 38.8 36.2 34.0 38.1 57.7 54.9 62.8Keeping up to date with political affairs 36.1 33.5 39.3 32.2 35.0 37.4 36.7 31.9 37.5 45.3 42.8 40.0 47.8Becoming a community leader 36.8 36.1 37.7 34.9 37.6 36.7 39.8 37.3 35.9 43.6 54.0 51.5 58.6Improving my understanding of other countries and
cultures 49.6 47.6 52.1 45.0 50.6 53.5 51.0 47.6 49.7 60.2 56.4 53.1 62.4Adopting “green” practices to protect the
environment 38.9 37.4 40.6 36.2 38.8 42.9 40.2 34.3 39.9 42.9 44.1 41.9 48.0

41
2013 CIRP Freshman Survey Weighted National Norms—All Respondents
Baccalaureate Black Colleges All Bacc Institutions 4-year Colleges Universities and Universities Institutions 4-yr Coll Universities Public Private Nonsec Catholic Oth Relig Public Private All HBCU Public Private
Students estimate “Very Good Chance” that they will:
Change major field 12.9 11.7 14.2 12.2 11.2 12.3 10.7 10.4 14.4 13.4 10.8 11.1 10.1Change career choice 12.6 11.5 13.9 11.1 11.9 13.8 11.2 10.5 13.7 14.7 8.3 8.6 7.8Participate in student government 7.4 7.3 7.5 7.3 7.4 7.4 8.7 6.8 7.0 8.9 16.4 14.3 20.4Get a job to help pay for college expenses 49.1 49.6 48.6 49.4 49.8 49.1 52.0 49.3 50.1 43.7 46.2 49.4 40.5Work full-time while attending college 7.7 8.6 6.6 10.4 6.4 5.9 7.4 6.5 7.3 4.3 14.4 15.6 12.2Join a social fraternity or sorority 13.4 11.6 15.6 12.4 10.6 10.7 8.5 11.6 15.1 17.1 29.8 29.4 30.4Play club, intramural, or recreational sports 30.7 29.2 32.6 27.6 31.1 30.6 33.1 30.5 31.6 35.6 23.4 22.7 24.8Play intercollegiate athletics (e.g., NCAA or
NAIA-sponsored) 14.0 20.0 6.9 14.3 26.6 23.5 19.9 32.7 6.4 8.5 20.9 22.9 17.2Make at least a “B” average 68.8 65.8 72.3 62.4 69.8 71.2 72.5 67.2 70.7 77.6 62.4 61.2 64.5Need extra time to complete your degree
requirements 6.3 7.1 5.4 7.9 6.1 5.4 6.3 6.7 5.8 4.1 12.9 13.1 12.5Participate in student protests or demonstrations 5.8 6.2 5.3 6.2 6.3 7.1 6.0 5.8 5.3 5.4 14.6 12.8 17.8Transfer to another college before graduating 5.8 6.9 4.4 7.7 6.0 4.7 5.2 7.5 4.8 3.0 13.9 13.6 14.6Be satisfied with your college 58.2 55.6 61.4 52.6 59.0 60.8 61.8 56.0 59.2 68.8 44.7 42.2 49.3Participate in volunteer or community service work 34.1 31.4 37.4 27.0 36.6 36.1 39.6 35.6 34.3 47.8 40.1 38.2 43.6Seek personal counseling 11.1 11.3 10.9 11.4 11.2 11.5 11.8 10.6 11.0 10.8 20.0 19.5 21.0Communicate regularly with your professors 39.5 39.3 39.8 35.0 44.3 46.9 46.9 40.6 37.2 48.1 40.9 39.4 43.7Socialize with someone of another racial/ethnic group 64.1 61.3 67.6 58.7 64.2 66.9 65.7 61.0 65.8 73.7 54.7 53.4 56.9Participate in student clubs/groups 49.8 45.6 54.9 43.5 48.2 51.9 51.4 43.0 52.0 64.2 43.4 41.3 47.4Participate in a study abroad program 34.0 31.4 37.3 27.1 36.4 40.8 37.9 31.4 34.3 47.2 29.9 26.3 36.3Have a roommate of a different race/ethnicity 30.2 28.7 31.9 26.5 31.3 35.0 28.6 29.1 30.1 37.8 24.6 25.3 23.3Discuss course content with students outside of class 48.2 43.6 53.9 39.2 48.6 52.1 50.2 44.4 52.1 59.8 38.3 34.5 45.2Work on a professor’s research project 31.6 31.7 31.4 31.5 32.1 33.8 32.5 30.2 31.1 32.4 41.1 40.4 42.4Take courses from more than one college
simultaneously 6.2 6.4 6.0 6.6 6.2 6.2 7.5 5.6 6.1 5.7 13.3 11.1 17.4Take a leave of absence from this college temporarily 2.6 3.1 1.9 3.3 2.8 2.4 3.0 3.0 1.9 1.9 8.0 7.7 8.5Take a course exclusively online at this institution 6.5 7.0 6.0 8.0 5.8 4.6 6.3 6.8 6.7 3.9 13.9 14.0 13.6Take a course exclusively online at a different
institution 2.9 3.2 2.5 3.3 3.1 2.4 3.0 3.6 2.6 2.2 7.5 7.5 7.6

42
2013 CIRP Freshman Survey Weighted National Norms—All Respondents
Baccalaureate Black Colleges All Bacc Institutions 4-year Colleges Universities and Universities Institutions 4-yr Coll Universities Public Private Nonsec Catholic Oth Relig Public Private All HBCU Public Private
CIRP Construct: Habits of MindHigh 29.4 26.6 32.4 25.1 28.6 31.2 30.5 25.1 31.0 38.0 32.5 30.3 36.7Average 42.7 42.1 43.4 42.1 42.1 42.0 42.3 42.1 43.5 43.0 38.1 38.4 37.4Low 27.9 31.3 24.2 32.9 29.4 26.8 27.3 32.8 25.5 19.0 29.4 31.3 25.9Mean 50.10 49.33 50.92 48.93 49.83 50.48 50.36 48.96 50.58 52.32 50.41 49.84 51.48
CIRP Construct: Academic Self-ConceptHigh 24.6 18.9 30.8 17.3 20.9 22.8 20.3 19.4 29.3 36.4 26.6 24.0 31.3Average 46.8 44.3 49.5 43.4 45.4 46.1 46.4 44.2 50.1 47.3 38.9 37.9 40.8Low 28.6 36.8 19.7 39.3 33.7 31.1 33.3 36.4 20.6 16.3 34.5 38.0 27.9Mean 49.65 48.02 51.43 47.60 48.53 49.02 48.62 48.02 51.16 52.53 49.77 49.09 51.04
CIRP Construct: Social Self-ConceptHigh 27.5 26.7 28.4 26.4 27.1 26.6 27.9 27.3 27.4 32.1 41.7 41.7 41.7Average 38.7 38.0 39.5 37.7 38.5 38.2 38.8 38.5 39.4 39.8 33.5 33.8 32.8Low 33.8 35.3 32.1 36.0 34.4 35.2 33.3 34.2 33.2 28.1 24.8 24.4 25.6Mean 49.19 48.93 49.48 48.80 49.09 48.91 49.41 49.10 49.22 50.49 52.53 52.65 52.32
CIRP Construct: Pluralistic OrientationHigh 28.5 27.2 29.9 27.3 27.0 28.3 28.5 24.9 29.7 30.5 34.5 32.8 37.7Average 44.1 42.8 45.5 42.7 43.0 44.2 44.3 41.2 45.2 46.7 37.3 37.9 36.2Low 27.4 30.0 24.6 30.0 30.0 27.5 27.2 33.9 25.1 22.9 28.2 29.3 26.2Mean 49.86 49.36 50.41 49.36 49.35 49.80 49.91 48.65 50.34 50.68 50.45 50.10 51.10
CIRP Construct: Social AgencyHigh 25.8 25.8 25.8 24.5 27.3 27.0 30.0 26.3 24.3 31.0 47.2 43.7 53.5Average 43.5 43.2 43.7 42.8 43.7 43.2 43.9 44.1 43.5 44.4 37.4 39.3 33.8Low 30.7 31.0 30.4 32.7 28.9 29.8 26.0 29.6 32.2 24.5 15.4 16.9 12.7Mean 49.35 49.31 49.40 48.89 49.79 49.72 50.52 49.51 48.99 50.81 54.35 53.55 55.79
CIRP Construct: Civic EngagementHigh 24.1 23.4 24.9 22.0 25.1 25.9 26.5 23.7 23.8 29.2 36.5 33.8 41.5Average 48.3 48.0 48.5 47.9 48.2 47.7 49.0 48.2 48.5 48.8 44.4 46.0 41.4Low 27.6 28.6 26.6 30.1 26.7 26.4 24.5 28.1 27.7 22.0 19.1 20.2 17.1Mean 49.90 49.68 50.13 49.30 50.14 50.32 50.54 49.79 49.88 51.18 52.45 51.87 53.56
CIRP Construct: College Reputation OrientationHigh 26.4 22.9 30.3 18.9 27.7 29.3 32.5 23.8 28.3 38.1 26.3 17.2 43.1Average 40.2 40.5 39.9 39.9 41.1 41.3 41.1 41.0 39.4 41.8 35.3 37.3 31.6Low 33.4 36.7 29.8 41.2 31.2 29.4 26.4 35.3 32.4 20.0 38.4 45.5 25.3Mean 48.37 47.77 49.05 46.99 48.72 49.01 49.77 47.93 48.59 50.79 47.74 46.28 50.42
CIRP Construct: Likelihood of College InvolvementHigh 27.2 24.2 30.8 20.6 28.4 31.4 31.3 24.2 27.5 42.1 27.9 25.2 32.6Average 44.8 44.4 45.3 45.5 43.2 42.8 43.5 43.4 46.2 42.4 42.3 42.7 41.6Low 28.0 31.4 23.9 34.0 28.4 25.8 25.2 32.4 26.4 15.6 29.9 32.1 25.8Mean 49.37 48.58 50.32 47.92 49.35 50.00 50.10 48.38 49.69 52.43 49.07 48.40 50.28

APPENDIX A
Research Methodology

RESEARCH METHODOLOGY
45
The data reported here have been weighted to provide a normative picture of the American college first-year student population for persons engaged in policy analysis, human resource planning, campus administration, educational research, and guidance and counseling, as well as for the general community of students and parents. This Appendix provides a brief overview of the CIRP methodology and describes the procedures used to weight the annual freshman survey results to produce the national normative estimates.
Historical OverviewFrom 1966 to 1970, approximately 15 percent of the nation’s institutions of higher education were selected by sampling procedures and invited to participate in the program. As the academic community became aware of the value of program participation, additional institutions asked to participate. Beginning in 1971, all institutions that have entering first-year classes and that respond to the U.S. Department of Education’s Higher Education General Information Survey were invited to participate. A minimal charge plus a unit rate based on the number of forms processed helps to defray the direct costs of the survey.
The National Population for 2013For the purposes of the 2013 CIRP Freshman Survey, the population has been defined as all institutions of higher education admitting first-time first-year students and granting a baccalaureate-level degree or higher listed in the U.S. Department of Education’s Integrated Postsecondary Education Data System (IPEDS). An institution is considered eligible if it was operating at the time of the IPEDS survey and had a first-time, full-time freshman class of at least 25 students. In addition, a small number of institutions or their branches are included even though their separate enrollments were not available from the IPEDS files. In 2013, the national population included 1,583 institutions. It should be noted that the population reflects institutions of “higher education,” rather than “postsecondary education.” Most proprietary, special vocational, or semiprofessional institutions are not currently included in the population.

Institutional Stratification DesignThe institutions identified as part of the national population are divided into 26 stratification groups based on type (four-year college, univer-sity), control (public, private nonsectarian, Roman Catholic, other religious), institutional race (predominantly non-Black, predominantly Black), and the “selectivity level” of the insti-tution. Selectivity, defined as the median SAT Verbal and Math scores of the entering class (or ACT composite score), was made an integral part of the stratification design in 1968. Table A1 shows the distribution of institutions across the stratification cells. The dividing lines between low, medium and high selectivity levels are different for different types of institutions and should not be used as a measure of institu-tional or program quality.
A comprehensive restratification of the national population was undertaken in 2008 and is annu-ally updated, reviewing not only institutions’ selectivity scores, but also their control and reli-gious affiliation (if any) as reported to IPEDS. In 2013, “university” is defined by 2010 Basic Carnegie Classification as “research universities” or “doctoral/research universities.” Appendix C lists the current stratification cell assignment of institutions that participated in the 2013 CIRP Freshman Survey.
Having defined the population in terms of the stratification cell scheme, the IPEDS file is used to compute the male and female first-time, full-time (FTFT) population in each cell. These population counts form the target counts of the weighting procedure.
Identifying the Norms SampleGenerally speaking, an institution is included in the national norms sample if it provided a representative sample of its FTFT population. The minimum percentage required of a sample is 65 percent. Institutions whose sample propor-tions were less than but close to these cutoffs are included if the method used to administer the survey showed no systematic biases in first-year class coverage.
Information about the FTFT population and the method of survey administration is obtained from participating institutions at the time they return their completed surveys. In the event an institution did not return FTFT information, counts from the most recent IPEDS survey are used. This procedure, although not optimal, is adequate unless the institution experienced a substantial change in its FTFT population since the last IPEDS survey.
The 2013 DataAlthough 224,507 respondents at 343 colleges and universities returned their forms in time for their data to be included in the 2013 norms, the normative data presented here are based on responses from 165,743 FTFT freshmen entering 234 baccalaureate institutions.
The normative data presented here were collected by administering the 2013 CIRP Freshman Survey during registration, freshman orientation, or the first few weeks of classes (i.e., before the students have had any substantial experience with college life). The survey is designed to elicit a wide range of biographic and demographic data, as well as data on the students’ high school background, career plans, educational aspirations, financial arrangements, high school activities, and current attitudes.
46

47
Table A1. 2013 CIRP Freshman Survey National Norms Sample and Population
Selectivity Institutions First-time, Full-time Freshmen Cell Weights
Institution Strat Average Norms Unweighted Weighted
Type Cell Level Score Population Survey Sample Number Number Men Women Men Women
Public 1 low 800–1079 61 8 5 10,095 155,040 70,813 84,227 11.51 12.28
Universities 2 medium 1080–1189 56 8 5 12,470 188,155 91,416 96,740 13.17 12.62 3 high 1190–1600 48 14 5 20,798 259,724 127,031 132,693 8.30 8.21
Private 4 medium 800–1184 35 12 6 5,854 29,587 12,549 17,038 4.55 4.80
Universities 5 high 1185–1339 28 7 5 6,878 51,434 23,409 28,025 6.71 5.94 6 very high 1340–1600 32 14 8 12,975 64,727 32,769 31,958 3.89 3.75
Public 7,10 low 800–984 114 10 8 11,117 110,081 45,767 64,314 9.04 8.634-year 8 medium 985–1034 130 18 10 12,544 172,978 78,030 94,947 7.09 5.66Colleges 9 high 1035–1600 99 15 11 7,304 131,231 61,183 70,048 14.29 18.25
Private 11,15 low 800–989 110 11 9 2,320 28,989 12,462 16,528 11.91 7.73Nonsectarian 12 medium 990–1069 73 19 13 5,656 29,585 12,645 16,940 4.32 4.284-year 13 high 1070–1189 74 17 12 4,922 34,936 15,927 19,009 6.70 5.87Colleges 14 very high 1190–1600 81 43 34 15,374 42,295 18,660 23,636 2.32 2.31
Catholic 16,19 low 800–994 57 12 14 3,391 16,345 5,746 10,598 4.57 3.854-year 17 medium 995–1084 44 12 9 3,683 16,430 6,686 9,744 4.12 3.59Colleges 18 high 1085–1600 49 18 11 6,167 32,414 13,574 18,840 4.80 4.29
Other 20,24 very low 800–999 148 13 9 2,014 32,618 16,511 16,107 12.71 13.60Religious 21 low 1000–1039 77 13 11 2,824 25,105 12,341 12,764 5.14 6.784-year 22 medium 1040–1109 75 15 12 3,838 29,425 12,515 16,910 7.20 7.40Colleges 23 high 1110–1600 112 33 26 11,523 54,195 23,574 30,620 3.86 3.84
Predominantly 34,40 public — 39 9 6 2,670 29,427 12,060 17,367 8.36 8.85
Black Colleges 35,38 39,41 private — 41 9 5 1,326 15,468 6,472 8,996 9.60 12.04
All Institutions 1,583 330 234 1,550,189
Note:– The broad categories of Institution Control (i.e., public, private, and religious affiliation) are defined by data submitted to Integrated Postsecondary Educational Data System (IPEDS).– Universities are those institutions defined by 2010 Basic Carnegie Classification as “Research Universities” or “Doctoral/Research Universities.”– Selectivity is based on median SAT Verbal + Math scores and/or ACT composite scores of the entering class as reported to IPEDS. Other comparable sources (e.g., Common Data Set) are used for institutions not reporting SAT/ACT scores to IPEDS. Institutions with unknown selectivity are grouped with the low-selectivity institutions when computing National Norms. The stratification design presented here is used to group schools to develop population weights and should not be used as a measure of institutional or program quality.
– Cell Weights are the ratio between the number of first-time, full-time freshmen enrolled in all colleges and the number of first-time, full-time freshmen enrolled in the norms sample colleges.
– Two-year colleges are not included in the norms sample.

48
In addition to standard biographic and demo-graphic items that have been administered annually to each entering class, the survey also contains other research-oriented items that may have been modified from previous years. The inclusion of modified items permits a more thorough coverage of student characteristics but also represents a compromise between two mutually exclusive objectives: (1) comparability of information from year to year which is required for assessing trends; and (2) flexibility in item content to meet changing information and research needs.
The survey, reproduced as Appendix B, has been developed in collaboration with students, profes-sional associations, participating institutions, government agencies, educational researchers, administrators, policy makers, and members of the CIRP Advisory Committee. The survey content is reviewed annually by the research directors at the Higher Education Research Institute (HERI) at UCLA with the assistance of the CIRP Advisory Committee as well as others interested in the annual freshman survey program.
First-time, full-time freshmen enrolled at insti-tutions meeting minimal quality requirements for inclusion in the norms were differentially weighted to represent the national FTFT popu-lation. Part-time students and those who are not first-time college students (i.e., transfers and former enrollees) were excluded from the normative sample.
Weighting the SampleThose institutions identified as being part of the norms sample are weighted by a two-step proce-dure. The first weight is designed to adjust for response bias within institutions. Counts of the male and female FTFT population for each institution are divided by that institution’s male and female FTFT respondent count. The resulting weights, when applied to each respon-dent, bring the male and female respondent counts up to the corresponding counts for the population at that institution.
The second weight is designed to compensate for nonparticipating institutions within each stratification cell. The weighted male and female counts for all participating institutions in each stratification cell are first summed, and then are divided into the national male and female FTFT counts for all institutions in that stratification cell, producing a second set of cell weights.
To bring the racial composition of the weighted sample more in line with the data reported by IPEDS, we applied an adjusted second weight to the following stratification cells: public universi-ties of high selectivity; private universities of high selectivity; public four-year colleges of medium selectivity; and other religious four-year colleges of low selectivity. For these stratification cells, we computed separate second weights for Asian/Pacific Islander students and for students who did not identify as Asian or Pacific Islander. These separate second weights were combined with the first weight (weighting within institu-tions) as described in the next paragraph.

The final weight is simply the product of the first and second weights. Weighting each response in the norms sample using the final weight brings the male and female counts up to the national number of first-time full-time freshmen in each stratification cell (see Table A1).
The weighted data are combined separately to form various comparison groups. Comparison groups are hierarchically organized, allowing participating institutions to compare their results by type (four-year college, university), control (public, private nonsectarian, Roman Catholic, other religious), and selectivity level.
CIRP ConstructsCIRP Constructs represent sets of related survey items that measure an underlying trait or aspect of a student’s life. Item Response Theory (IRT), a modern psychometric method that has several advantages over methods used in more traditional factor analysis, is used to create a construct score for each respondent. Computing an individual’s construct score in IRT involves deriving a
maximum likelihood score estimate based on the pattern of the person’s responses to the entire set of survey items for that construct (or to a sub-set of the items that were answered). Items that tap into the trait more effectively are given greater weight in the estimation process (see Table A2). A respondent’s construct score is thus not a simple arithmetic mean or weighted sum, but rather the estimated score that is most likely, given how the student answered the set of items. CIRP Constructs are scored on a Z-score metric and rescaled for a mean of approximately fifty and standard deviation of ten.
The low, average, and high construct score group percentages and the mean for the construct are reported here. Low scores represent students who are one-half standard deviation below the mean. Average scores represent students whose scores are within one-half standard deviation of the mean. High scores represent students who are one-half standard deviation or more above the mean. Please visit HERI’s website for more detailed information about CIRP Constructs.
49

50
Table A2. List of CIRP Freshman Survey Constructs (including survey items and estimation ‘weights’)
Habits of Mind is a unified measure of the behaviors and traits associated with academic success. These learning behaviors are seen as the foundation for lifelong learning.How often in the past year did you:• Seek solutions to problems and explain them to others (1.99) • Ask questions in class (1.20)• Support your opinions with a logical argument (1.74) • Look up scientific research articles and resources (1.05)• Seek alternative solutions to a problem (1.61) • Revise your papers to improve your writing (1.04)• Evaluate the quality or reliability of information you received (1.58) • Take a risk because you felt you had more to gain (1.03)• Explore topics on your own, even though it was not required for a class (1.27) • Accept mistakes as part of the learning process (0.95)• Seek feedback on your academic work (1.24)
Academic Self-Concept is a unified measure of students’ beliefs about their abilities and confidence in academic environments.Rate yourself on each of the following traits as compared with the average person your age:• Academic ability (3.52) • Self-confidence—intellectual (1.22)• Mathematical ability (1.32) • Drive to achieve (0.95)
Social Self-Concept is a unified measure of students’ beliefs about their abilities and confidence in social situations.Rate yourself on each of the following traits as compared with the average person your age:• Self-confidence—social (2.33) • Popularity (1.92)• Leadership ability (1.96) • Public speaking ability (1.68)
Pluralistic Orientation measures skills and dispositions appropriate for living and working in a diverse society.Rate yourself on each of the following traits as compared with the average person your age:• Ability to work cooperatively with diverse people (1.68) • Ability to discuss and negotiate controversial issues (1.53)• Tolerance of others with different beliefs (1.64) • Ability to see the world from someone else’s perspective (1.40)• Openness to having my views challenged (1.57)
Social Agency measures the extent to which students value political and social involvement as a personal goal.Indicate the importance to you personally of each of the following:• Participating in a community action program (2.42) • Influencing social values (1.58)• Helping to promote racial understanding (2.05) • Helping others who are in difficulty (1.36)• Becoming a community leader (2.01) • Keeping up to date with political affairs (1.35)
Civic Engagement measures the extent to which students are motivated and involved in civic, electoral, and political activities.Indicate activities you did in the past year: Indicate the importance to you personally of each of the following:• Demonstrated for a cause (e.g., boycott, rally, protest) (1.46) • Influencing social values (0.97)• Worked on a local, state, or national political campaign (1.42) • Keeping up to date with political affairs (0.86)• Publicly communicated my opinion about a cause (e.g. blog, email, petition) (1.35)• Helped raise money for a cause or campaign (1.11)• Performed volunteer work (0.80)

51
Table A2 (continued)
College Reputation Orientation measures the degree to which students value academic reputation and future career potential as a reason for choosing this college.How important was each reason in your decision to come here?• This college’s graduates get good jobs (6.11) • This college has a very good academic reputation (1.54)• This college’s graduates gain admission to top graduate/professional schools (2.50)
Likelihood of College Involvement is a unified measure of students’ expectations about their involvement in college life generally.What is your best guess as to the chances that you will:• Participate in student clubs/groups (3.25) • Participate in a study abroad program (1.24)• Participate in a volunteer or community service work (1.58) • Participate in student government (0.96)• Socialize with someone of another racial/ethnic group (1.28)


APPENDIX B
The 2013 CIRP Freshman Survey Instrument


55
Send to CTP to proof & make 8.5 pdf!!! Run stubs separate from Mac.
Turn over for Question 24
Below is a list of different undergraduate major fields grouped into general categories. (Fill in appropriate two-digit code on your survey)
ARTS AND HUMANITIES
01 Art, fine and applied
02 English (language and literature)
03 History
04 Journalism/Communication
05 Classical and Modern
Languages and Literature
06 Media/Film Studies
07 Music
08 Philosophy
09 Theatre/Drama
10 Theology/Religion
11 Other Arts and Humanities
BIOLOGICAL & LIFE
SCIENCES
12 Biology (general)
13 Animal Biology (zoology)
14 Ecology & Evolutionary
Biology
15 Marine Biology
16 Microbiology
17 Molecular, Cellular, &
Developmental Biology
18 Neurobiology/Neuroscience
19 Plant Biology (botany)
20 Agriculture/Natural Resources
21 Biochemistry/Biophysics
22 Environmental Science
23 Other Biological Science
BUSINESS
24 Accounting
25 Business Admin. (general)
26 Entrepreneurship
27 Finance
28 Hospitality/Tourism
29 Human Resources Management
30 International Business
31 Marketing
32 Management
33 Computer/Management
Information Systems
34 Real Estate
35 Other Business
EDUCATION
36 Elementary Education
37 Music/Art Education
38 Physical Education/Recreation
39 Secondary Education
40 Special Education
41 Other Education
ENGINEERING
42 Aerospace/Aeronautical/
Astronautical Engineering
43 Biological/Agricultural
Engineering
44 Biomedical Engineering
45 Chemical Engineering
46 Civil Engineering
47 Computer Engineering
48 Electrical/Electronic
Communications Engineering
49 Engineering Science/
Engineering Physics
50 Environmental/Environmental
Health Engineering
51 Industrial/Manufacturing
Engineering
52 Materials Engineering
53 Mechanical Engineering
54 Other Engineering
HEALTH PROFESSIONS
55 Clinical Laboratory Science
56 Health Care Administration/
Studies
57 Health Technology
58 Kinesiology
59 Nursing
60 Pharmacy
61 Therapy (occupational,
physical, speech)
62 Other Health Profession
MATH AND COMPUTER
SCIENCE
63 Computer Science
64 Mathematics/Statistics
65 Other Math and Computer
Science
PHYSICAL SCIENCE
66 Astronomy & Astrophysics
67 Atmospheric Sciences
68 Chemistry
69 Earth & Planetary Sciences
70 Marine Sciences
71 Physics
72 Other Physical Science
SOCIAL SCIENCE
73 Anthropology
74 Economics
75 Ethnic/Cultural Studies
76 Geography
77 Political Science (gov’t.,
international relations)
78 Psychology
79 Public Policy
80 Social Work
81 Sociology
82 Women’s/Gender Studies
83 Other Social Science
OTHER MAJORS
84 Architecture/Urban Planning
85 Criminal Justice
86 Library Science
87 Security & Protective
Services
88 Military Sciences/
Technology/Operations
89 OTHER
90 UNDECIDED
23.2013 CIRP FRESHMAN SURVEYPLEASE PRINT IN ALL CAPS YOUR NAME AND PERMANENT/HOME ADDRESS (one letter or number per box).
FIRST
NAME:
ADDRESS:
CITY:
MI LAST
STUDENT ID# (as instructed): EMAIL (print letters carefully):
STATE: ZIP: PHONE:
When were you born?
Month(01-12)
Day(01-31)
Year
MARKING DIRECTIONS• Use a black or blue pen.• Fill in your response completely. Mark out any answer you wish to change with an “X”.CORRECT MARK INCORRECT MARKS
SE
RIA
L #
Group Code
A B
1. Your sex: Male Female
2. How old will you be on December 31 of this year? (Mark one)16 or younger . 17....................18....................19....................20....................
21-24 .........25-29 .........30-39 .........40-54 .........55 or older .
3. Is English your native language?Yes No
4. In what year did you graduate from high school? (Mark one)2013..........2012..........2011..........
Did not graduate but passed G.E.D. test .
Never completed high school ...........
5. Are you enrolled (or enrolling) as a: (Mark one) Full-time student ........
Part-time student .......
6. How many miles is this college from your permanent home? (Mark one)5 or less
6-1011-50
51-100101-500
Over 500
7. What was your average grade in high school? (Mark one)
A or A+A–B+
BB–C+
CD
8. What were your scores on the SAT I and/or ACT?
SAT Critical Reading ...........
SAT Mathematics ................
SAT Writing .........................
9. From what kind of high school did you graduate? (Mark one)
Public school (not charter or magnet)Public charter schoolPublic magnet schoolPrivate religious/parochial schoolPrivate independent college-prep schoolHome school
10. Prior to this term, have you ever taken courses for credit at this institution?
Yes No
11. Since leaving high school, have you ever taken courses, whether for credit or not for credit, at any other institution (university, 4- or 2-year college, technical, vocational, or business school)?
Yes No
12. Where do you plan to live during the fall term? (Mark one)With my family or other relatives ...........Other private home, apartment, or room .College residence hall ...........................Fraternity or sorority house ...................Other campus student housing .............Other......................................................
13. To how many colleges other than this one did you apply for admission this year?
None 123
7-1011 or more
456
14. Were you accepted by your first choice college? Yes No
15. Is this college your: (Mark one)
First choice ............ Second choice .......Third choice ...........
Less than third choice ...........
2010 or earlier
ACT Composite .........................
aaaaa~aa
` `
`````
` `
````
`
`
``
`
`
`
`
`
`
`
``
``
`
`
`
`
`
`
`
`
`
` `
` `
``````
```
```
```
` `
``
`
`
17. Citizenship status:U.S. citizenPermanent resident (green card)Neither
`
`
`
`````
18. Are your parents: (Mark one)Both alive and living with each other.....Both alive, divorced or living apart ........One or both deceased ...........................
`
`
`
19. How many Advanced Placement courses or exams did you take in high school?(Mark one in each row)
AP Courses ...........................AP Exams ..............................
15+
10-1
4
1-4
Not
offe
red
atm
y hi
gh s
choo
l
5-9
Non
e
````````````
21. Have you had, or do you feel you will need, any special tutoring or remedial work in any of the following subjects? (Mark all that apply)
20. Please mark which of the following courses you have completed:
Algebra IIPre-calculus/TrigonometryProbability & StatisticsCalculusAP Probability & StatisticsAP Calculus
YNYNYNYNYNYN
46.Please indicate the importance to you personally of each of the following: (Mark one for each item)
Becoming accomplished in one of the performing arts (acting, dancing, etc.) .........................Becoming an authority in my field ........................................Obtaining recognition from my colleagues for contributions to my special field .........................................Influencing the political structure ..........................................Influencing social values ......................................................Raising a family ....................................................................Being very well off financially ...............................................Helping others who are in difficulty ......................................Making a theoretical contribution to science ........................Writing original works (poems, novels, etc.) ........................Creating artistic works (painting, sculpture, etc.) ....................Becoming successful in a business of my own ....................Becoming involved in programs to clean up the environment Developing a meaningful philosophy of life ..........................Participating in a community action program .......................Helping to promote racial understanding .............................Keeping up to date with political affairs................................Becoming a community leader .............................................Improving my understanding of other countries and cultures .Adopting “green” practices to protect the environment ........
Not ImportantNSomewhat ImportantS
Very ImportantVEssentialE
EE E E E E E E E E E E E E E E E E E E
V V V V V V V V V V V V V V V V V V V V
S S S S S S S S S S S S S S S S S S S S
N N N N N N N N N N N N N N N N N N N N
What is your best guess as to the chances that you will:(Mark one for each item)
Change major field .....................................................................Change career choice ................................................................Participate in student government ..............................................Get a job to help pay for college expenses................................Work full-time while attending college ........................................Join a social fraternity or sorority ...............................................Play club, intramural, or recreational sports ...............................Play intercollegiate athletics (e.g., NCAA or NAIA-sponsored)...Make at least a “B” average .......................................................Need extra time to complete your degree requirements ............Participate in student protests or demonstrations ......................Transfer to another college before graduating ...........................Be satisfied with your college .....................................................Participate in volunteer or community service work ...................Seek personal counseling ..........................................................Communicate regularly with your professors .............................Socialize with someone of another racial/ethnic group ..............Participate in student clubs/groups ............................................Participate in a study abroad program .......................................Have a roommate of a different race/ethnicity ...........................Discuss course content with students outside of class ..............Work on a professor’s research project .....................................Take courses from more than one college simultaneously ........Take a leave of absence from this college temporarily..............Take a course exclusively online: At this institution ....................................................................... At a different institution ............................................................
No ChanceNVery Little ChanceL
Some ChanceSVery Good ChanceV
V V V V V V V V V V V V V V V V V V V V VVVV
VV
S S S S S S S S S S S S S S S S S S S S SSSS
SS
N N N N N N N N N N N N N N N N N N N N NNNN
NN
The remaining ovals are provided for questions specifically designed by your college rather than the Higher Education Research Institute. If your college has chosen to use the ovals, please observe carefully the supplemental directions given to you.
48.49.50.51.
ABCDE
ABCDE
ABCDEABCDE
52.53.54.55.
ABCDE
ABCDE
ABCDEABCDE
56.57.58.59.
ABCDE
ABCDE
ABCDEABCDE
60.61.62.63.
ABCDE
ABCDE
ABCDEABCDE
64.65.66.67.
ABCDE
ABCDE
ABCDEABCDE
THANK YOU!© Prepared by the Higher Education Research Institute, University of California, Los Angeles, California 90095-1521 Data Recognition Corp.-6G3144-13612-54321
47.
LLLLLLLLLLLLLLLLLLLLLLLL
LL
45. How many years do you expect it will take you to graduate from this college?
1 2 3 4 5 6+`
Do not plan to graduate from this college`
` ` ` ` `
4
23.
24.
Please indicate your intended major using the codes provided on the attached fold out.
Please indicate your intended career as well as the careers of your parents, using the codes provided on the attached fold out.
16. The current economic situation significantly affected my college choice: (Mark one)
Agree StronglyAgree SomewhatDisagree SomewhatDisagree Strongly
``
``
22. Do you consider yourself:(Mark Yes or No for each item)
Pre-Med ...........................................Pre-Law ...........................................
English ..........................................Reading ........................................Mathematics .................................Social Studies ...............................Science .........................................Foreign Language ........................Writing ..........................................
Yes
Have Had
`
`
```````
```````
No
Will Need
`
`
43. Military Status: (Mark one)NoneROTC, cadet, or midshipman at a service academyIn Active Duty, Reserves, or National GuardA discharged veteran NOT serving in Active Duty, Reserves, or National Guard
````
44. How would you describe the racial composition of the high school you last attended and the neighborhood where you grew up? (Mark one in each row)
````````
``
Com
plet
ely
non-
Whi
teM
ostly
non
-Whi
teR
ough
ly h
alf n
on-W
hite
Mos
tly W
hite
Com
plet
ely
Whi
te
High school I last attended .............Neighborhood where I grew up .........
Your intended career
Your mother’s career
Your father’s career
42. During your last year in high school, how much time did you spend during a typical week doing the following activities?
Hours per week:
Studying/homework .....................Socializing with friends ..................Talking with teachers outside of class .....................................Exercise or sports........................Partying .......................................Working (for pay) .........................Volunteer work ............................Student clubs/groups ...................Watching TV ................................Household/childcare duties .........Reading for pleasure ...................Playing video/computer games ...Online social networks (Facebook, Twitter, etc.) ..........
`
`
`
`
`
`
`
`
`
`
`
`
`
`
`
`
`
`
`
`
`
`
`
`
`
`
`
`
`
`
`
`
`
`
`
`
`
`
`
`
`
`
`
`
`
`
`
`
`
`
`
`
`
`
`
`
`
`
`
`
`
`
`
`
`
`
`
`
`
`
`
`
`
`
`
`
`
`
`
`
`
`
`
`
`
`
`
`
`
`
`
`
`
`
`
`
`
`
`
`
`
`
`
`
Non
eLe
ss th
an 1
hou
r1-
2
3-5
6-10
11-1
516
-20
Ove
r 20
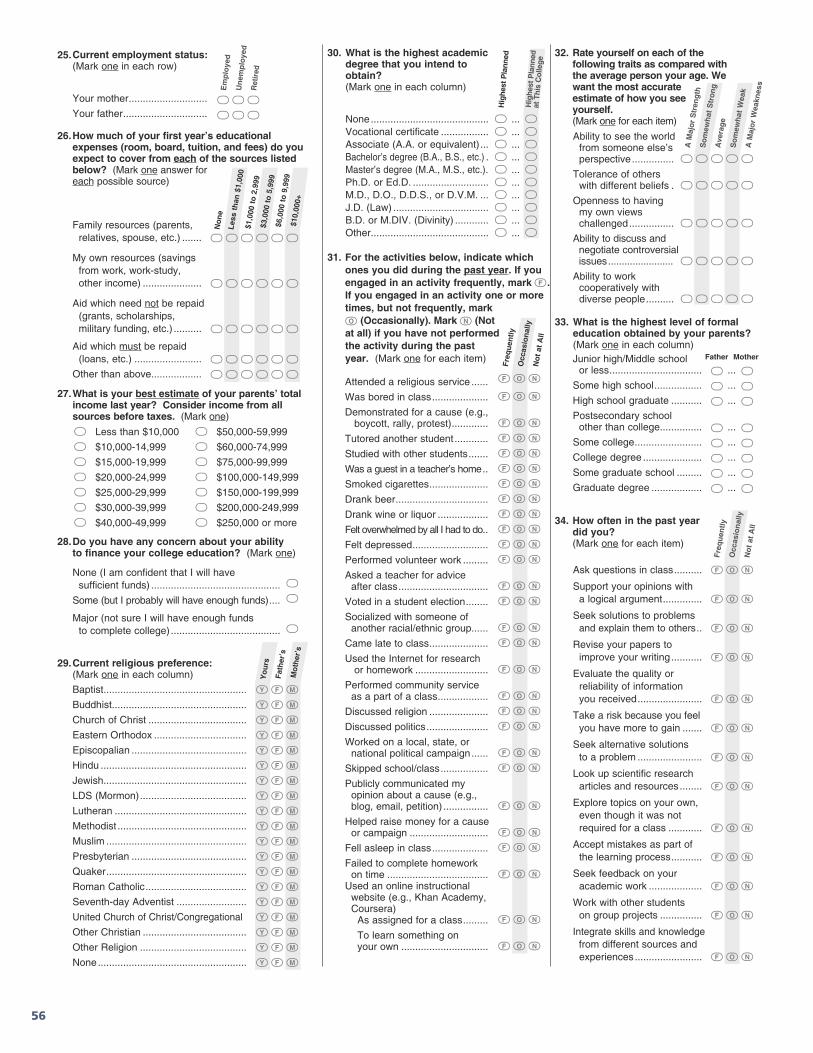
56
27.What is your best estimate of your parents’ total income last year? Consider income from all sources before taxes. (Mark one)
Less than $10,000$10,000-14,999$15,000-19,999$20,000-24,999$25,000-29,999$30,000-39,999$40,000-49,999
$50,000-59,999$60,000-74,999$75,000-99,999$100,000-149,999$150,000-199,999$200,000-249,999$250,000 or more
```````
```````
28.Do you have any concern about your ability to finance your college education? (Mark one)
None (I am confident that I will have sufficient funds) .............................................. `
`
`
Some (but I probably will have enough funds) ....
Major (not sure I will have enough funds to complete college) .......................................
26.How much of your first year’s educational expenses (room, board, tuition, and fees) do you expect to cover from each of the sources listed below? (Mark one answer for each possible source)
Family resources (parents, relatives, spouse, etc.) .......
Non
eLe
ss th
an $
1,00
0$1
,000
to 2
,999
$3,0
00 to
5,9
99$6
,000
to 9
,999
$10,
000+
``````
``````
``````
````````````
My own resources (savings from work, work-study, other income) .....................
Aid which need not be repaid (grants, scholarships, military funding, etc.) ..........
Aid which must be repaid (loans, etc.) ........................Other than above..................
31. For the activities below, indicate which ones you did during the past year. If you engaged in an activity frequently, mark .If you engaged in an activity one or more times, but not frequently, mark (Occasionally). Mark (Not at all) if you have not performed the activity during the pastyear. (Mark one for each item)
Freq
uent
lyO
ccas
iona
llyN
ot a
t All
FON
FON
FON
FON
FON
FON
FON
FON
FON
FON
FON
FON
FONFON
FONFON
FONFONFONFONFONFONFONFONFONFON
FON
FON
F
NO
29.Current religious preference:(Mark one in each column) Yo
urs
Fath
er’s
Mot
her’s
Baptist...................................................Buddhist................................................Church of Christ ...................................Eastern Orthodox .................................Episcopalian .........................................Hindu ....................................................Jewish...................................................LDS (Mormon) ......................................Lutheran ...............................................Methodist ..............................................Muslim ..................................................Presbyterian .........................................Quaker ..................................................Roman Catholic ....................................Seventh-day Adventist .........................United Church of Christ/Congregational Other Christian .....................................Other Religion ......................................None .....................................................
Y
Y Y Y
Y
Y Y Y
Y
Y Y Y
Y
Y Y
Y Y
Y
Y
F F
F
F F F
F
F F F
F
F F
F F
F
F F
F
M
M M M
M
M M M
M
M M M
M
M M
M M
M
M
32. Rate yourself on each of the following traits as compared with the average person your age. We want the most accurate estimate of how you see yourself.(Mark one for each item)Ability to see the world from someone else’s perspective ...............Tolerance of others with different beliefs .Openness to having my own views challenged ................Ability to discuss and negotiate controversial issues ........................Ability to work cooperatively with diverse people ..........
33. What is the highest level of formal education obtained by your parents? (Mark one in each column)
Father Mother
`` ...
`````
`````
`````
`````
`````
Som
ewha
t Str
ong
Ave
rage
Som
ewha
t Wea
kA
Maj
or W
eakn
ess
A M
ajor
Str
engt
h
`` ...
`` ...
`` ...
`` ...
`` ...
`` ...
`` ...
Junior high/Middle school or less .................................Some high school .................High school graduate ...........Postsecondary school other than college...............Some college ........................College degree .....................Some graduate school .........Graduate degree ..................
34. How often in the past year did you?(Mark one for each item)
F
F
F
F
F
F
F
F
F
F
F
F
F
Not
at A
ll
O
O
O
O
O
O
O
O
O
O
O
O
O
N
N
N
N
N
N
N
N
N
N
N
N
N
Freq
uent
lyO
ccas
iona
lly
Ask questions in class ..........
Support your opinions with a logical argument ..............
Seek solutions to problems and explain them to others ..
Revise your papers to improve your writing ...........
Evaluate the quality or reliability of information you received .......................
Take a risk because you feel you have more to gain .......
Seek alternative solutions to a problem .......................
Look up scientific research articles and resources ........
Explore topics on your own, even though it was not required for a class ............
Accept mistakes as part of the learning process ...........
Seek feedback on your academic work ...................
Work with other students on group projects ...............
Integrate skills and knowledge from different sources and experiences ........................
General knowledge ...................................................................................Knowledge of a particular field or discipline ..............................................Knowledge of people from different races/cultures ...................................Understanding of the problems facing your community ............................Understanding of national issues ..............................................................Understanding of global issues .................................................................Critical thinking skills .................................................................................Problem-solving skills ................................................................................Leadership abilities ....................................................................................Ability to get along with people of different races/cultures ........................Ability to manage your time effectively ......................................................Foreign language ability ............................................................................Interpersonal skills .....................................................................................
`````
`````
`````
`````
`````
`````
`````
`````
`````
`````
`````
`````
`````
Som
ewha
t Str
ong
Ave
rage
Som
ewha
t Wea
kA
Maj
or W
eakn
ess
A M
ajor
Str
engt
h39. Think about your current abilities and tell us how strong or weak you believe you are in each of the following areas: (Mark one for each item)
36. How would you characterize your political views? (Mark one)
Far leftLiberalMiddle-of-the-roadConservativeFar right
`
`
`
`
`
Very
Impo
rtan
t37. In deciding to go to college, how important to you was each of the following reasons?(Mark one answer for each possible reason)
To be able to get a better job ..........
To gain a general education and appreciation of ideas .............
To make me a more cultured person ..........................................To be able to make more money .....
To learn more about things that interest me ...................................To get training for a specific career .
To prepare myself for graduate or professional school ......................
Not
Impo
rtan
t
V
V
VV
VV
V
S
S
SS
SS S
N
N
NN
NN N
Som
ewha
t Im
port
ant
White/Caucasian .........................African American/Black ...............American Indian/Alaska Native ...Asian American/Asian .................Native Hawaiian/Pacific Islander .Mexican American/Chicano .........Puerto Rican ................................Other Latino .................................Other............................................
`
`
`
`
`
`
`
`
`
35. Are you: (Mark all that apply)
40. Mark one in each row:
Wealthy people should pay a larger share of taxes than they do now ..................Affirmative action in college admissions should be abolished ...............................The federal government should do more to control the sale of handguns ............A national health care plan is needed to cover everybody’s medical costs ..........The federal government should raise taxes to reduce the deficit ..........................Addressing global warming should be a federal priority ........................................The chief benefit of a college education is that it increases one’s earning power ...Gays and lesbians should have the legal right to adopt a child ............................Undocumented immigrants should be denied access to public education ............
Disagree Strongly1Disagree Somewhat2
Agree Somewhat3Agree Strongly4
432143214321432143214321432143214321
3
41. Below are some reasons that might have influenced your decision to attend this particular college. How important was each reason in your decision to come here?(Mark one answer for each possible reason)
Very
Impo
rtan
tSo
mew
hat I
mpo
rtan
tN
ot Im
port
ant
VVV V VV
VVV
V
VV V
V
V VV
V
VV
VV
V
SSS S SS
S
SSS
S
S SS
S
SSS
S
SS
S
S
NNNN N NN
N
NNN
N
N N
N
N N
NN
N
NN
N
My parents wanted me to come here....................................................................My relatives wanted me to come here ..................................................................My teacher advised me .........................................................................................This college has a very good academic reputation ...............................................This college has a good reputation for its social activities ....................................I was offered financial assistance .........................................................................The cost of attending this college .........................................................................High school counselor advised me .......................................................................Private college counselor advised me ...........................................................................I wanted to live near home ....................................................................................Not offered aid by first choice ...............................................................................Could not afford first choice ..................................................................................This college’s graduates gain admission to top graduate/professional schools ...This college’s graduates get good jobs .................................................................I was attracted by the religious affiliation/orientation of this college .....................I wanted to go to a school about the size of this college ......................................Rankings in national magazines ...........................................................................Information from a website ....................................................................................I was admitted through an Early Action or Early Decision program .....................The athletic department recruited me ...................................................................A visit to this campus ............................................................................................Ability to take online courses.................................................................................The percentage of students that graduate from this college.................................
30. What is the highest academic degree that you intend to obtain? (Mark one in each column)
None ..........................................Vocational certificate .................Associate (A.A. or equivalent) ...Bachelor’s degree (B.A., B.S., etc.) .Master’s degree (M.A., M.S., etc.) .Ph.D. or Ed.D. ...........................M.D., D.O., D.D.S., or D.V.M. ...J.D. (Law) ..................................B.D. or M.DIV. (Divinity) ............Other..........................................
Hig
hest
Pla
nned
``````````
``````````
Hig
hest
Pla
nned
at T
his
Col
lege
...
...
...
...
...
...
...
...
...
...
Attended a religious service ......Was bored in class ....................Demonstrated for a cause (e.g., boycott, rally, protest) .............Tutored another student ............Studied with other students .......Was a guest in a teacher’s home ..Smoked cigarettes .....................Drank beer .................................Drank wine or liquor ..................Felt overwhelmed by all I had to do ..Felt depressed ...........................Performed volunteer work .........Asked a teacher for advice after class ................................Voted in a student election ........Socialized with someone of another racial/ethnic group......Came late to class .....................Used the Internet for research or homework ..........................Performed community service as a part of a class ..................Discussed religion .....................Discussed politics ......................Worked on a local, state, or national political campaign ......Skipped school/class .................Publicly communicated my opinion about a cause (e.g., blog, email, petition) ................Helped raise money for a cause or campaign ............................Fell asleep in class ....................Failed to complete homework on time ....................................Used an online instructional website (e.g., Khan Academy, Coursera) As assigned for a class ......... To learn something on your own ...............................
25.Current employment status:(Mark one in each row)
`
`
`
`
`
`
Em
ploy
edU
nem
ploy
edR
etire
d
Your mother ............................Your father ..............................
38. Rate yourself on each of the following traits as compared with the average person your age. We want the most accurate estimate of how you see yourself.(Mark one in each row)
Abo
ve A
vera
ge
``
`
```
`
```
`
```
`
``
``
`
`
```
`
```
`
```
`
``
``
`
``
``
`
```
`
```
`
```
`
``
``
`
`
```
`
```
`
```
`
``
``
`
``
``
`
```
`
```
`
```
`
``
``
`
Academic ability ...................Artistic ability ........................Competitiveness ...................Computer skills .....................Cooperativeness...................Creativity...............................Drive to achieve....................Emotional health ...................Leadership ability .................Mathematical ability ..............Physical health .....................Popularity..............................Public speaking ability ..........Risk-taking ............................Self-confidence (intellectual) .Self-confidence (social) ........Self-understanding ...............Spirituality .............................Understanding of others ....... Writing ability ........................
Ave
rage
Bel
ow A
vera
geLo
wes
t 10%
Hig
hest
10%
Below is a list of different careers grouped into general categories. (Fill in appropriate two-digit codes on your survey)
ARTS
01 Actor or Entertainer
02 Artist
03 Graphic Designer
04 Musician
05 Writer/Producer/Director
AGRICULTURE
06 Farmer or Forester
07 Natural Resource
Specialist/Environmentalist
BUSINESS
08 Accountant
09 Administrative Assistant
10 Business Manager/Executive
11 Business Owner/Entrepreneur
12 Retail Sales
13 Sales/Marketing
14 Human Resources
15 Finance (e.g., Actuary,
Banking, Loan Officer, Planner)
16 Management Consultant
17 Real Estate Agent/Realtor/
Appraiser/Developer
18 Sports Management
COMMUNICATIONS
19 Journalist
20 Public/Media Relations
21 Advertising
EDUCATION
22 College Administrator/Staff
23 College Faculty
24 Early Childcare Provider
25 Elementary School Teacher
26 Secondary School Teacher
27 Librarian
28 Teacher’s Assistant/
Paraprofessional
29 K-12 Administrator
30 Other K-12 Professional
GOVERNMENT
31 Military
32 Federal/State/Local
Government Official
33 Protective Services
(e.g., Homeland Security,
Law Enforcement, Firefighter)
34 Postal Worker
HEALTHCARE SUPPORT
35 Dietician/Nutritionist
36 Home Health Worker
37 Medical/Dental Assistant
(e.g., Hygienist, Lab Tech,
Nursing Asst.)
38 Registered Nurse
39 Therapist (e.g., Physical,
Occupational, Speech)
INFORMATION TECHNOLOGY
40 Computer Programmer/Developer
41 Computer/Systems Analyst
42 Web Designer
LAW
43 Lawyer/Judge
44 Paralegal
MEDICAL PRACTITIONERS
45 Clinical Psychologist
46 Dentist/Orthodontist
47 Medical Doctor/Surgeon
48 Optometrist
49 Pharmacist
50 Veterinarian
SCIENCE AND ENGINEERING
51 Engineer
52 Research Scientist (e.g., Biologist,
Chemist, Physicist)
53 Urban Planner/Architect
SERVICE INDUSTRY
54 Custodian/Janitor/Housekeeper
55 Food Service (e.g., Chef/Cook
Server)
56 Hair Stylist/Aesthetician/
Manicurist
57 Interior Designer
58 Skilled Trades (e.g., Plumber,
Electrician, Construction)
59 Social/Non-Profit Services
60 CLERGY
61 HOMEMAKER/STAY AT
HOME PARENT
62 OTHER
63 UNDECIDED
24.
Carefully detach this section after answering Questions 23 and 24

57
2
27.What is your best estimate of your parents’ total income last year? Consider income from all sources before taxes. (Mark one)
Less than $10,000$10,000-14,999$15,000-19,999$20,000-24,999$25,000-29,999$30,000-39,999$40,000-49,999
$50,000-59,999$60,000-74,999$75,000-99,999$100,000-149,999$150,000-199,999$200,000-249,999$250,000 or more
```````
```````
28.Do you have any concern about your ability to finance your college education? (Mark one)
None (I am confident that I will have sufficient funds) .............................................. `
`
`
Some (but I probably will have enough funds) ....
Major (not sure I will have enough funds to complete college) .......................................
26.How much of your first year’s educational expenses (room, board, tuition, and fees) do you expect to cover from each of the sources listed below? (Mark one answer for each possible source)
Family resources (parents, relatives, spouse, etc.) .......
Non
eLe
ss th
an $
1,00
0$1
,000
to 2
,999
$3,0
00 to
5,9
99$6
,000
to 9
,999
$10,
000+
``````
``````
``````
````````````
My own resources (savings from work, work-study, other income) .....................
Aid which need not be repaid (grants, scholarships, military funding, etc.) ..........
Aid which must be repaid (loans, etc.) ........................Other than above..................
31. For the activities below, indicate which ones you did during the past year. If you engaged in an activity frequently, mark .If you engaged in an activity one or more times, but not frequently, mark (Occasionally). Mark (Not at all) if you have not performed the activity during the pastyear. (Mark one for each item)
Freq
uent
lyO
ccas
iona
llyN
ot a
t All
FON
FON
FON
FON
FON
FON
FON
FON
FON
FON
FON
FON
FONFON
FONFON
FONFONFONFONFONFONFONFONFONFON
FON
FON
F
NO
29.Current religious preference:(Mark one in each column) Yo
urs
Fath
er’s
Mot
her’s
Baptist...................................................Buddhist................................................Church of Christ ...................................Eastern Orthodox .................................Episcopalian .........................................Hindu ....................................................Jewish...................................................LDS (Mormon) ......................................Lutheran ...............................................Methodist ..............................................Muslim ..................................................Presbyterian .........................................Quaker ..................................................Roman Catholic ....................................Seventh-day Adventist .........................United Church of Christ/Congregational Other Christian .....................................Other Religion ......................................None .....................................................
Y
Y Y Y
Y
Y Y Y
Y
Y Y Y
Y
Y Y
Y Y
Y
Y
F F
F
F F F
F
F F F
F
F F
F F
F
F F
F
M
M M M
M
M M
M M
M
M M M
M
M M
M
M M
32. Rate yourself on each of the following traits as compared with the average person your age. We want the most accurate estimate of how you see yourself.(Mark one for each item)Ability to see the world from someone else’s perspective ...............Tolerance of others with different beliefs .Openness to having my own views challenged ................Ability to discuss and negotiate controversial issues ........................Ability to work cooperatively with diverse people ..........
33. What is the highest level of formal education obtained by your parents? (Mark one in each column)
Father Mother
`` ...
`````
`````
`````
`````
`````
Som
ewha
t Str
ong
Ave
rage
Som
ewha
t Wea
kA
Maj
or W
eakn
ess
A M
ajor
Str
engt
h
`` ...
`` ...
`` ...
`` ...
`` ...
`` ...
`` ...
Junior high/Middle school or less .................................Some high school .................High school graduate ...........Postsecondary school other than college...............Some college ........................College degree .....................Some graduate school .........Graduate degree ..................
34. How often in the past year did you?(Mark one for each item)
F
F
F
F
F
F
F
F
F
F
F
F
F
Not
at A
ll
O
O
O
O
O
O
O
O
O
O
O
O
O
N
N
N
N
N
N
N
N
N
N
N
N
N
Freq
uent
lyO
ccas
iona
lly
Ask questions in class ..........
Support your opinions with a logical argument ..............
Seek solutions to problems and explain them to others ..
Revise your papers to improve your writing ...........
Evaluate the quality or reliability of information you received .......................
Take a risk because you feel you have more to gain .......
Seek alternative solutions to a problem .......................
Look up scientific research articles and resources ........
Explore topics on your own, even though it was not required for a class ............
Accept mistakes as part of the learning process ...........
Seek feedback on your academic work ...................
Work with other students on group projects ...............
Integrate skills and knowledge from different sources and experiences ........................
General knowledge ...................................................................................Knowledge of a particular field or discipline ..............................................Knowledge of people from different races/cultures ...................................Understanding of the problems facing your community ............................Understanding of national issues ..............................................................Understanding of global issues .................................................................Critical thinking skills .................................................................................Problem-solving skills ................................................................................Leadership abilities ....................................................................................Ability to get along with people of different races/cultures ........................Ability to manage your time effectively ......................................................Foreign language ability ............................................................................Interpersonal skills .....................................................................................
`````
`````
`````
`````
`````
`````
`````
`````
`````
`````
`````
`````
`````
Som
ewha
t Str
ong
Ave
rage
Som
ewha
t Wea
kA
Maj
or W
eakn
ess
A M
ajor
Str
engt
h39. Think about your current abilities and tell us how strong or weak you believe you are in each of the following areas: (Mark one for each item)
36. How would you characterize your political views? (Mark one)
Far leftLiberalMiddle-of-the-roadConservativeFar right
`
`
`
`
`
Very
Impo
rtan
t37. In deciding to go to college, how important to you was each of the following reasons?(Mark one answer for each possible reason)
To be able to get a better job ..........
To gain a general education and appreciation of ideas .............
To make me a more cultured person ..........................................To be able to make more money .....
To learn more about things that interest me ...................................To get training for a specific career .
To prepare myself for graduate or professional school ......................
Not
Impo
rtan
t
V
V
VV
VV
V
S
S
SS
SS S
N
N
NN
NN N
Som
ewha
t Im
port
ant
White/Caucasian .........................African American/Black ...............American Indian/Alaska Native ...Asian American/Asian .................Native Hawaiian/Pacific Islander .Mexican American/Chicano .........Puerto Rican ................................Other Latino .................................Other............................................
`
`
`
`
`
`
`
`
`
35. Are you: (Mark all that apply)
40. Mark one in each row:
Wealthy people should pay a larger share of taxes than they do now ..................Affirmative action in college admissions should be abolished ...............................The federal government should do more to control the sale of handguns ............A national health care plan is needed to cover everybody’s medical costs ..........The federal government should raise taxes to reduce the deficit ..........................Addressing global warming should be a federal priority ........................................The chief benefit of a college education is that it increases one’s earning power ...Gays and lesbians should have the legal right to adopt a child ............................Undocumented immigrants should be denied access to public education ............
Disagree Strongly1Disagree Somewhat2
Agree Somewhat3Agree Strongly4
432143214321432143214321432143214321
41. Below are some reasons that might have influenced your decision to attend this particular college. How important was each reason in your decision to come here?(Mark one answer for each possible reason)
Very
Impo
rtan
tSo
mew
hat I
mpo
rtan
tN
ot Im
port
ant
VVV V VV
VVV
V
VV V
V
V VV
V
VV
VV
V
SSS S SS
S
SSS
S
S SS
S
SSS
S
SS
S
S
NNNN N NN
N
NNN
N
N NN
N
NN
N N
N
NN
My parents wanted me to come here....................................................................My relatives wanted me to come here ..................................................................My teacher advised me .........................................................................................This college has a very good academic reputation ...............................................This college has a good reputation for its social activities ....................................I was offered financial assistance .........................................................................The cost of attending this college .........................................................................High school counselor advised me .......................................................................Private college counselor advised me ...........................................................................I wanted to live near home ....................................................................................Not offered aid by first choice ...............................................................................Could not afford first choice ..................................................................................This college’s graduates gain admission to top graduate/professional schools ...This college’s graduates get good jobs .................................................................I was attracted by the religious affiliation/orientation of this college .....................I wanted to go to a school about the size of this college ......................................Rankings in national magazines ...........................................................................Information from a website ....................................................................................I was admitted through an Early Action or Early Decision program .....................The athletic department recruited me ...................................................................A visit to this campus ............................................................................................Ability to take online courses.................................................................................The percentage of students that graduate from this college.................................
30. What is the highest academic degree that you intend to obtain? (Mark one in each column)
None ..........................................Vocational certificate .................Associate (A.A. or equivalent) ...Bachelor’s degree (B.A., B.S., etc.) .Master’s degree (M.A., M.S., etc.) .Ph.D. or Ed.D. ...........................M.D., D.O., D.D.S., or D.V.M. ...J.D. (Law) ..................................B.D. or M.DIV. (Divinity) ............Other..........................................
Hig
hest
Pla
nned
``````````
``````````
Hig
hest
Pla
nned
at T
his
Col
lege
...
...
...
...
...
...
...
...
...
...
Attended a religious service ......Was bored in class ....................Demonstrated for a cause (e.g., boycott, rally, protest) .............Tutored another student ............Studied with other students .......Was a guest in a teacher’s home ..Smoked cigarettes .....................Drank beer .................................Drank wine or liquor ..................Felt overwhelmed by all I had to do ..Felt depressed ...........................Performed volunteer work .........Asked a teacher for advice after class ................................Voted in a student election ........Socialized with someone of another racial/ethnic group......Came late to class .....................Used the Internet for research or homework ..........................Performed community service as a part of a class ..................Discussed religion .....................Discussed politics ......................Worked on a local, state, or national political campaign ......Skipped school/class .................Publicly communicated my opinion about a cause (e.g., blog, email, petition) ................Helped raise money for a cause or campaign ............................Fell asleep in class ....................Failed to complete homework on time ....................................Used an online instructional website (e.g., Khan Academy, Coursera) As assigned for a class ......... To learn something on your own ...............................
25.Current employment status:(Mark one in each row)
`
`
`
`
`
`
Em
ploy
edU
nem
ploy
edR
etire
d
Your mother ............................Your father ..............................
38. Rate yourself on each of the following traits as compared with the average person your age. We want the most accurate estimate of how you see yourself.(Mark one in each row)
Abo
ve A
vera
ge
``
`
```
`
```
`
```
`
``
``
`
`
```
`
```
`
```
`
``
``
`
``
``
`
```
`
```
`
```
`
``
``
`
`
```
`
```
`
```
`
``
``
`
``
``
`
```
`
```
`
```
`
``
``
`
Academic ability ...................Artistic ability ........................Competitiveness ...................Computer skills .....................Cooperativeness...................Creativity...............................Drive to achieve....................Emotional health ...................Leadership ability .................Mathematical ability ..............Physical health .....................Popularity..............................Public speaking ability ..........Risk-taking ............................Self-confidence (intellectual) .Self-confidence (social) ........Self-understanding ...............Spirituality .............................Understanding of others ....... Writing ability ........................
Ave
rage
Bel
ow A
vera
geLo
wes
t 10%
Hig
hest
10%
Below is a list of different careers grouped into general categories. (Fill in appropriate two-digit codes on your survey)
ARTS
01 Actor or Entertainer
02 Artist
03 Graphic Designer
04 Musician
05 Writer/Producer/Director
AGRICULTURE
06 Farmer or Forester
07 Natural Resource
Specialist/Environmentalist
BUSINESS
08 Accountant
09 Administrative Assistant
10 Business Manager/Executive
11 Business Owner/Entrepreneur
12 Retail Sales
13 Sales/Marketing
14 Human Resources
15 Finance (e.g., Actuary,
Banking, Loan Officer, Planner)
16 Management Consultant
17 Real Estate Agent/Realtor/
Appraiser/Developer
18 Sports Management
COMMUNICATIONS
19 Journalist
20 Public/Media Relations
21 Advertising
EDUCATION
22 College Administrator/Staff
23 College Faculty
24 Early Childcare Provider
25 Elementary School Teacher
26 Secondary School Teacher
27 Librarian
28 Teacher’s Assistant/
Paraprofessional
29 K-12 Administrator
30 Other K-12 Professional
GOVERNMENT
31 Military
32 Federal/State/Local
Government Official
33 Protective Services
(e.g., Homeland Security,
Law Enforcement, Firefighter)
34 Postal Worker
HEALTHCARE SUPPORT
35 Dietician/Nutritionist
36 Home Health Worker
37 Medical/Dental Assistant
(e.g., Hygienist, Lab Tech,
Nursing Asst.)
38 Registered Nurse
39 Therapist (e.g., Physical,
Occupational, Speech)
INFORMATION TECHNOLOGY
40 Computer Programmer/Developer
41 Computer/Systems Analyst
42 Web Designer
LAW
43 Lawyer/Judge
44 Paralegal
MEDICAL PRACTITIONERS
45 Clinical Psychologist
46 Dentist/Orthodontist
47 Medical Doctor/Surgeon
48 Optometrist
49 Pharmacist
50 Veterinarian
SCIENCE AND ENGINEERING
51 Engineer
52 Research Scientist (e.g., Biologist,
Chemist, Physicist)
53 Urban Planner/Architect
SERVICE INDUSTRY
54 Custodian/Janitor/Housekeeper
55 Food Service (e.g., Chef/Cook
Server)
56 Hair Stylist/Aesthetician/
Manicurist
57 Interior Designer
58 Skilled Trades (e.g., Plumber,
Electrician, Construction)
59 Social/Non-Profit Services
60 CLERGY
61 HOMEMAKER/STAY AT
HOME PARENT
62 OTHER
63 UNDECIDED
24.
Carefully detach this section after answering Questions 23 and 24

1
Send to CTP to proof & make 8.5 pdf!!! Run stubs separate from Mac.
Turn over for Question 24
Below is a list of different undergraduate major fields grouped into general categories. (Fill in appropriate two-digit code on your survey)
ARTS AND HUMANITIES
01 Art, fine and applied
02 English (language and literature)
03 History
04 Journalism/Communication
05 Classical and Modern
Languages and Literature
06 Media/Film Studies
07 Music
08 Philosophy
09 Theatre/Drama
10 Theology/Religion
11 Other Arts and Humanities
BIOLOGICAL & LIFE
SCIENCES
12 Biology (general)
13 Animal Biology (zoology)
14 Ecology & Evolutionary
Biology
15 Marine Biology
16 Microbiology
17 Molecular, Cellular, &
Developmental Biology
18 Neurobiology/Neuroscience
19 Plant Biology (botany)
20 Agriculture/Natural Resources
21 Biochemistry/Biophysics
22 Environmental Science
23 Other Biological Science
BUSINESS
24 Accounting
25 Business Admin. (general)
26 Entrepreneurship
27 Finance
28 Hospitality/Tourism
29 Human Resources Management
30 International Business
31 Marketing
32 Management
33 Computer/Management
Information Systems
34 Real Estate
35 Other Business
EDUCATION
36 Elementary Education
37 Music/Art Education
38 Physical Education/Recreation
39 Secondary Education
40 Special Education
41 Other Education
ENGINEERING
42 Aerospace/Aeronautical/
Astronautical Engineering
43 Biological/Agricultural
Engineering
44 Biomedical Engineering
45 Chemical Engineering
46 Civil Engineering
47 Computer Engineering
48 Electrical/Electronic
Communications Engineering
49 Engineering Science/
Engineering Physics
50 Environmental/Environmental
Health Engineering
51 Industrial/Manufacturing
Engineering
52 Materials Engineering
53 Mechanical Engineering
54 Other Engineering
HEALTH PROFESSIONS
55 Clinical Laboratory Science
56 Health Care Administration/
Studies
57 Health Technology
58 Kinesiology
59 Nursing
60 Pharmacy
61 Therapy (occupational,
physical, speech)
62 Other Health Profession
MATH AND COMPUTER
SCIENCE
63 Computer Science
64 Mathematics/Statistics
65 Other Math and Computer
Science
PHYSICAL SCIENCE
66 Astronomy & Astrophysics
67 Atmospheric Sciences
68 Chemistry
69 Earth & Planetary Sciences
70 Marine Sciences
71 Physics
72 Other Physical Science
SOCIAL SCIENCE
73 Anthropology
74 Economics
75 Ethnic/Cultural Studies
76 Geography
77 Political Science (gov’t.,
international relations)
78 Psychology
79 Public Policy
80 Social Work
81 Sociology
82 Women’s/Gender Studies
83 Other Social Science
OTHER MAJORS
84 Architecture/Urban Planning
85 Criminal Justice
86 Library Science
87 Security & Protective
Services
88 Military Sciences/
Technology/Operations
89 OTHER
90 UNDECIDED
23.2013 CIRP FRESHMAN SURVEYPLEASE PRINT IN ALL CAPS YOUR NAME AND PERMANENT/HOME ADDRESS (one letter or number per box).
FIRST
NAME:
ADDRESS:
CITY:
MI LAST
STUDENT ID# (as instructed): EMAIL (print letters carefully):
STATE: ZIP: PHONE:
When were you born?
Month(01-12)
Day(01-31)
Year
MARKING DIRECTIONS• Use a black or blue pen.• Fill in your response completely. Mark out any answer you wish to change with an “X”.CORRECT MARK INCORRECT MARKS
SE
RIA
L #
Group Code
A B
1. Your sex: Male Female
2. How old will you be on December 31 of this year? (Mark one)16 or younger . 17....................18....................19....................20....................
21-24 .........25-29 .........30-39 .........40-54 .........55 or older .
3. Is English your native language?Yes No
4. In what year did you graduate from high school? (Mark one)2013..........2012..........2011..........
Did not graduate but passed G.E.D. test .
Never completed high school ...........
5. Are you enrolled (or enrolling) as a: (Mark one) Full-time student ........
Part-time student .......
6. How many miles is this college from your permanent home? (Mark one)5 or less
6-1011-50
51-100101-500
Over 500
7. What was your average grade in high school? (Mark one)
A or A+A–B+
BB–C+
CD
8. What were your scores on the SAT I and/or ACT?
SAT Critical Reading ...........
SAT Mathematics ................
SAT Writing .........................
9. From what kind of high school did you graduate? (Mark one)
Public school (not charter or magnet)Public charter schoolPublic magnet schoolPrivate religious/parochial schoolPrivate independent college-prep schoolHome school
10. Prior to this term, have you ever taken courses for credit at this institution?
Yes No
11. Since leaving high school, have you ever taken courses, whether for credit or not for credit, at any other institution (university, 4- or 2-year college, technical, vocational, or business school)?
Yes No
12. Where do you plan to live during the fall term? (Mark one)With my family or other relatives ...........Other private home, apartment, or room .College residence hall ...........................Fraternity or sorority house ...................Other campus student housing .............Other......................................................
13. To how many colleges other than this one did you apply for admission this year?
None 123
7-1011 or more
456
14. Were you accepted by your first choice college? Yes No
15. Is this college your: (Mark one)
First choice ............ Second choice .......Third choice ...........
Less than third choice ...........
2010 or earlier
ACT Composite .........................
aaaaa~aa
` `
`````
` `
````
`
`
``
`
`
`
`
`
`
`
``
``
`
`
`
`
`
`
`
`
`
` `
` `
``````
```
```
```
` `
`
``
`
17. Citizenship status:U.S. citizenPermanent resident (green card)Neither
`
`
`
`````
18. Are your parents: (Mark one)Both alive and living with each other.....Both alive, divorced or living apart ........One or both deceased ...........................
`
`
`
19. How many Advanced Placement courses or exams did you take in high school?(Mark one in each row)
AP Courses ...........................AP Exams ..............................
15+
10-1
4
1-4
Not
offe
red
atm
y hi
gh s
choo
l
5-9
Non
e
````````````
21. Have you had, or do you feel you will need, any special tutoring or remedial work in any of the following subjects? (Mark all that apply)
20. Please mark which of the following courses you have completed:
Algebra IIPre-calculus/TrigonometryProbability & StatisticsCalculusAP Probability & StatisticsAP Calculus
YNYNYNYNYNYN
46.Please indicate the importance to you personally of each of the following: (Mark one for each item)
Becoming accomplished in one of the performing arts (acting, dancing, etc.) .........................Becoming an authority in my field ........................................Obtaining recognition from my colleagues for contributions to my special field .........................................Influencing the political structure ..........................................Influencing social values ......................................................Raising a family ....................................................................Being very well off financially ...............................................Helping others who are in difficulty ......................................Making a theoretical contribution to science ........................Writing original works (poems, novels, etc.) ........................Creating artistic works (painting, sculpture, etc.) ....................Becoming successful in a business of my own ....................Becoming involved in programs to clean up the environment Developing a meaningful philosophy of life ..........................Participating in a community action program .......................Helping to promote racial understanding .............................Keeping up to date with political affairs................................Becoming a community leader .............................................Improving my understanding of other countries and cultures .Adopting “green” practices to protect the environment ........
Not ImportantNSomewhat ImportantS
Very ImportantVEssentialE
EE E E E E E E E E E E E E E E E E E E
V V V V V V V V V V V V V V V V V V V V
S S S S S S S S S S S S S S S S S S S S
N N N N N N N N N N N N N N N N N N N N
What is your best guess as to the chances that you will:(Mark one for each item)
Change major field .....................................................................Change career choice ................................................................Participate in student government ..............................................Get a job to help pay for college expenses................................Work full-time while attending college ........................................Join a social fraternity or sorority ...............................................Play club, intramural, or recreational sports ...............................Play intercollegiate athletics (e.g., NCAA or NAIA-sponsored)...Make at least a “B” average .......................................................Need extra time to complete your degree requirements ............Participate in student protests or demonstrations ......................Transfer to another college before graduating ...........................Be satisfied with your college .....................................................Participate in volunteer or community service work ...................Seek personal counseling ..........................................................Communicate regularly with your professors .............................Socialize with someone of another racial/ethnic group ..............Participate in student clubs/groups ............................................Participate in a study abroad program .......................................Have a roommate of a different race/ethnicity ...........................Discuss course content with students outside of class ..............Work on a professor’s research project .....................................Take courses from more than one college simultaneously ........Take a leave of absence from this college temporarily..............Take a course exclusively online: At this institution ....................................................................... At a different institution ............................................................
No ChanceNVery Little ChanceL
Some ChanceSVery Good ChanceV
V V V V V V V V V V V V V V V V V V V V VVVV
VV
S S S S S S S S S S S S S S S S S S S S SSSS
SS
N N N N N N N N N N N N N N N N N N N N NNNN
NN
The remaining ovals are provided for questions specifically designed by your college rather than the Higher Education Research Institute. If your college has chosen to use the ovals, please observe carefully the supplemental directions given to you.
48.49.50.51.
ABCDE
ABCDE
ABCDEABCDE
52.53.54.55.
ABCDE
ABCDE
ABCDEABCDE
56.57.58.59.
ABCDE
ABCDE
ABCDEABCDE
60.61.62.63.
ABCDE
ABCDE
ABCDEABCDE
64.65.66.67.
ABCDE
ABCDE
ABCDEABCDE
THANK YOU!© Prepared by the Higher Education Research Institute, University of California, Los Angeles, California 90095-1521 Data Recognition Corp.-6G3144-13612-54321
47.
LLLLLLLLLLLLLLLLLLLLLLLL
LL
45. How many years do you expect it will take you to graduate from this college?
1 2 3 4 5 6+`
Do not plan to graduate from this college`
` ` ` ` `
23.
24.
Please indicate your intended major using the codes provided on the attached fold out.
Please indicate your intended career as well as the careers of your parents, using the codes provided on the attached fold out.
16. The current economic situation significantly affected my college choice: (Mark one)
Agree StronglyAgree SomewhatDisagree SomewhatDisagree Strongly
``
``
22. Do you consider yourself:(Mark Yes or No for each item)
Pre-Med ...........................................Pre-Law ...........................................
English ..........................................Reading ........................................Mathematics .................................Social Studies ...............................Science .........................................Foreign Language ........................Writing ..........................................
Yes
Have Had
`
`
```````
```````
No
Will Need
`
`
43. Military Status: (Mark one)NoneROTC, cadet, or midshipman at a service academyIn Active Duty, Reserves, or National GuardA discharged veteran NOT serving in Active Duty, Reserves, or National Guard
````
44. How would you describe the racial composition of the high school you last attended and the neighborhood where you grew up? (Mark one in each row)
````````
``
Com
plet
ely
non-
Whi
teM
ostly
non
-Whi
teR
ough
ly h
alf n
on-W
hite
Mos
tly W
hite
Com
plet
ely
Whi
te
High school I last attended .............Neighborhood where I grew up .........
Your intended career
Your mother’s career
Your father’s career
42. During your last year in high school, how much time did you spend during a typical week doing the following activities?
Hours per week:
Studying/homework .....................Socializing with friends ..................Talking with teachers outside of class .....................................Exercise or sports........................Partying .......................................Working (for pay) .........................Volunteer work ............................Student clubs/groups ...................Watching TV ................................Household/childcare duties .........Reading for pleasure ...................Playing video/computer games ...Online social networks (Facebook, Twitter, etc.) ..........
`
`
`
`
`
`
`
`
`
`
`
`
`
`
`
`
`
`
`
`
`
`
`
`
`
`
`
`
`
`
`
`
`
`
`
`
`
`
`
`
`
`
`
`
`
`
`
`
`
`
`
`
`
`
`
`
`
`
`
`
`
`
`
`
`
`
`
`
`
`
`
`
`
`
`
`
`
`
`
`
`
`
`
`
`
`
`
`
`
`
`
`
`
`
`
`
`
`
`
`
`
`
`
`
Non
eLe
ss th
an 1
hou
r1-
2
3-5
6-10
11-1
516
-20
Ove
r 20
58

59
Below is a list of different careers grouped into general categories. (Fill in appropriate two-digit codes on your survey)
ARTS
01 Actor or Entertainer
02 Artist
03 Graphic Designer
04 Musician
05 Writer/Producer/Director
AGRICULTURE
06 Farmer or Forester
07 Natural Resource
Specialist/Environmentalist
BUSINESS
08 Accountant
09 Administrative Assistant
10 Business Manager/Executive
11 Business Owner/Entrepreneur
12 Retail Sales
13 Sales/Marketing
14 Human Resources
15 Finance (e.g., Actuary,
Banking, Loan Officer, Planner)
16 Management Consultant
17 Real Estate Agent/Realtor/
Appraiser/Developer
18 Sports Management
COMMUNICATIONS
19 Journalist
20 Public/Media Relations
21 Advertising
EDUCATION
22 College Administrator/Staff
23 College Faculty
24 Early Childcare Provider
25 Elementary School Teacher
26 Secondary School Teacher
27 Librarian
28 Teacher’s Assistant/
Paraprofessional
29 K-12 Administrator
30 Other K-12 Professional
GOVERNMENT
31 Military
32 Federal/State/Local
Government Official
33 Protective Services
(e.g., Homeland Security,
Law Enforcement, Firefighter)
34 Postal Worker
HEALTHCARE SUPPORT
35 Dietician/Nutritionist
36 Home Health Worker
37 Medical/Dental Assistant
(e.g., Hygienist, Lab Tech,
Nursing Asst.)
38 Registered Nurse
39 Therapist (e.g., Physical,
Occupational, Speech)
INFORMATION TECHNOLOGY
40 Computer Programmer/Developer
41 Computer/Systems Analyst
42 Web Designer
LAW
43 Lawyer/Judge
44 Paralegal
MEDICAL PRACTITIONERS
45 Clinical Psychologist
46 Dentist/Orthodontist
47 Medical Doctor/Surgeon
48 Optometrist
49 Pharmacist
50 Veterinarian
SCIENCE AND ENGINEERING
51 Engineer
52 Research Scientist (e.g., Biologist,
Chemist, Physicist)
53 Urban Planner/Architect
SERVICE INDUSTRY
54 Custodian/Janitor/Housekeeper
55 Food Service (e.g., Chef/Cook
Server)
56 Hair Stylist/Aesthetician/
Manicurist
57 Interior Designer
58 Skilled Trades (e.g., Plumber,
Electrician, Construction)
59 Social/Non-Profit Services
60 CLERGY
61 HOMEMAKER/STAY AT
HOME PARENT
62 OTHER
63 UNDECIDED
24.
Carefully detach this section after answering Questions 23 and 24
Turn over for Question 24
Below is a list of different undergraduate major fields grouped into general categories. (Fill in appropriate two-digit code on your survey)
ARTS AND HUMANITIES
01 Art, fine and applied
02 English (language and literature)
03 History
04 Journalism/Communication
05 Classical and Modern
Languages and Literature
06 Media/Film Studies
07 Music
08 Philosophy
09 Theatre/Drama
10 Theology/Religion
11 Other Arts and Humanities
BIOLOGICAL & LIFE
SCIENCES
12 Biology (general)
13 Animal Biology (zoology)
14 Ecology & Evolutionary
Biology
15 Marine Biology
16 Microbiology
17 Molecular, Cellular, &
Developmental Biology
18 Neurobiology/Neuroscience
19 Plant Biology (botany)
20 Agriculture/Natural Resources
21 Biochemistry/Biophysics
22 Environmental Science
23 Other Biological Science
BUSINESS
24 Accounting
25 Business Admin. (general)
26 Entrepreneurship
27 Finance
28 Hospitality/Tourism
29 Human Resources Management
30 International Business
31 Marketing
32 Management
33 Computer/Management
Information Systems
34 Real Estate
35 Other Business
EDUCATION
36 Elementary Education
37 Music/Art Education
38 Physical Education/Recreation
39 Secondary Education
40 Special Education
41 Other Education
ENGINEERING
42 Aerospace/Aeronautical/
Astronautical Engineering
43 Biological/Agricultural
Engineering
44 Biomedical Engineering
45 Chemical Engineering
46 Civil Engineering
47 Computer Engineering
48 Electrical/Electronic
Communications Engineering
49 Engineering Science/
Engineering Physics
50 Environmental/Environmental
Health Engineering
51 Industrial/Manufacturing
Engineering
52 Materials Engineering
53 Mechanical Engineering
54 Other Engineering
HEALTH PROFESSIONS
55 Clinical Laboratory Science
56 Health Care Administration/
Studies
57 Health Technology
58 Kinesiology
59 Nursing
60 Pharmacy
61 Therapy (occupational,
physical, speech)
62 Other Health Profession
MATH AND COMPUTER
SCIENCE
63 Computer Science
64 Mathematics/Statistics
65 Other Math and Computer
Science
PHYSICAL SCIENCE
66 Astronomy & Astrophysics
67 Atmospheric Sciences
68 Chemistry
69 Earth & Planetary Sciences
70 Marine Sciences
71 Physics
72 Other Physical Science
SOCIAL SCIENCE
73 Anthropology
74 Economics
75 Ethnic/Cultural Studies
76 Geography
77 Political Science (gov’t.,
international relations)
78 Psychology
79 Public Policy
80 Social Work
81 Sociology
82 Women’s/Gender Studies
83 Other Social Science
OTHER MAJORS
84 Architecture/Urban Planning
85 Criminal Justice
86 Library Science
87 Security & Protective
Services
88 Military Sciences/
Technology/Operations
89 OTHER
90 UNDECIDED
23.


APPENDIX C
Institutions Participating in the 2013 CIRP Freshman Survey


1243 Adrian College Adrian MI 21 yes 494 Agnes Scott College Decatur GA 23 no 1 Alabama A & M University Normal AL 34 yes 354 Albertus Magnus College New Haven CT 16 yes 1244 Albion College Albion MI 23 yes 2232 Albright College Reading PA 22 yes 2233 Allegheny College Meadville PA 23 no 414 American University Washington DC 5 no 1135 Amherst College Amherst MA 14 yes 2432 Anderson University Anderson SC 22 yes 2046 Antioch College Yellow Springs OH no 125 Art Center College of Design Pasadena CA 12 yes 1322 Augsburg College Minneapolis MN 22 yes 522 Augusta State University Augusta GA 7 no 599 Aurora University Aurora IL 12 yes
1141 Babson College Wellesley MA 14 yes 454 Barry University Miami FL 4 no 1042 Bates College Lewiston ME 14 yes 5275 Bay Path College Longmeadow MA 11 yes 2519 Belmont University Nashville TN 23 yes 2931 Beloit College Beloit WI 14 yes 7072 Benedictine College Atchison KS 18 yes 692 Benedictine University Lisle IL 4 yes 1934 Bennett College for Women Greensboro NC 38 yes 2751 Bennington College Bennington VT 14 yes 503 Berry College Mount Berry GA 13 yes 5349 Bethany Lutheran College Mankato MN 23 yes 5753 Biola University La Mirada CA 4 yes 1641 Bloomfield College Bloomfield NJ 20 no 2049 Bluffton University Bluffton OH 21 yes 1142 Boston College Chestnut Hill MA 6 yes 1043 Bowdoin College Brunswick ME 14 no 605 Bradley University Peoria IL 13 yes 1193 Bridgewater State University Bridgewater MA 8 yes 2404 Brown University Providence RI 6 no 2231 Bryn Athyn College of the New Church Bryn Athyn PA 22 yes 2236 Bryn Mawr College Bryn Mawr PA 14 no 749 Butler University Indianapolis IN 14 yes
131 California Baptist University Riverside CA 20 no 135 California Institute of Technology Pasadena CA 6 yes 5010 California State University-Long Beach Long Beach CA 8 yes 230 California State University-Northridge Northridge CA 7 yes 5751 California State University-San Bernardino San Bernardino CA 7 no 4851 California State University-San Marcos San Marcos CA 7 yes 5795 Calvin College Grand Rapids MI 23 yes 1936 Campbell University Buies Creek NC 21 no 5571 Carl Albert State College Poteau OK 10 no 1327 Carleton College Northfield MN 14 yes 606 Carthage College Kenosha WI 23 yes 2053 Case Western Reserve University Cleveland OH 6 no 2750 Castleton State College Castleton VT 7 yes 1938 Catawba College Salisbury NC 11 yes 416 Catholic University of America Washington DC 4 no 1745 Cazenovia College Cazenovia NY 11 no
63
Institutions Participating in the 2013 CIRP Freshman Survey
Stratification Included inACE Institution City State Cell National Norms

815 Central College Pella IA 23 yes 2054 Central State University Wilberforce OH 34 yes 141 Chapman University Orange CA 23 yes 1941 Chowan University Murfreesboro NC 20 yes 2523 Christian Brothers University Memphis TN 18 no 2435 Citadel Military College of South Carolina Charleston SC 9 yes 1748 Clarkson University Potsdam NY 4 no 9113 Clearwater Valley Upward Bound Moscow ID no 6133 Coastal Carolina University Conway SC 7 yes 1044 Colby College Waterville ME 14 no 1749 Colgate University Hamilton NY 14 yes 2439 College of Charleston Charleston SC 9 yes 7402 Colorado Christian University Lakewood CO 22 yes 319 Colorado College Colorado Springs CO 14 yes 318 Colorado State University-Fort Collins Fort Collins CO 2 no 359 Connecticut College New London CT 14 yes 1077 Coppin State University Baltimore MD 34 no 1463 Cottey College Nevada MO 15 yes 5821 Covenant College Lookout Mountain GA 23 no 1573 Creighton University Omaha NE 18 no 6430 CUNY Lehman College Bronx NY 8 yes 7254 CUNY Medgar Evers College Brooklyn NY 10 no 5287 Curry College Milton MA 11 yes
6166 Dalton State College Dalton GA 10 no 1942 Davidson College Davidson NC 23 no 2244 Delaware Valley College Doylestown PA 12 yes 5882 DeSales University Center Valley PA 17 no 2247 Dickinson College Carlisle PA 14 yes 687 Dominican University River Forest IL 17 yes 1943 Duke University Durham NC 6 no
753 Earlham College Richmond IN 23 yes 464 Eckerd College Saint Petersburg FL 23 yes 1982 Elizabeth City State University Elizabeth City NC 34 no 634 Elmhurst College Elmhurst IL 23 yes 1947 Elon University Elon NC 14 yes 5105 Embry-Riddle Aeronautical University-Daytona Beach Daytona Beach FL 13 no 1158 Emmanuel College Boston MA 17 yes 2787 Emory & Henry College Emory VA 20 yes 511 Emory University Atlanta GA 6 no 2444 Erskine College Due West SC 21 yes
362 Fairfield University Fairfield CT 18 yes 6529 Fairleigh Dickinson University-College at Florham Madison NJ 12 yes 2788 Ferrum College Ferrum VA 20 yes 463 Florida State University Tallahassee FL 3 yes 1773 Fordham University Bronx NY 5 yes 1195 Framingham State University Framingham MA 8 yes 5414 Franklin Pierce University Rindge NH 11 yes 897 Friends University Wichita KS 12 no 2446 Furman University Greenville SC 14 no
961 Georgetown College Georgetown KY 23 yes 2263 Gettysburg College Gettysburg PA 14 yes 2847 Gonzaga University Spokane WA 18 no
64
Institutions Participating in the 2013 CIRP Freshman Survey
Stratification Included inACE Institution City State Cell National Norms

5199 Grace College and Theological Seminary Winona Lake IN 21 yes 641 Greenville College Greenville IL 21 yes 834 Grinnell College Grinnell IA 14 yes 1953 Guilford College Greensboro NC 22 yes 1338 Gustavus Adolphus College Saint Peter MN 23 yes
1776 Hamilton College Clinton NY 14 yes 9107 Harrisburg University of Science and Technology Harrisburg PA 11 no 1777 Hartwick College Oneonta NY 13 yes 180 Harvey Mudd College Claremont CA 14 yes 2267 Haverford College Haverford PA 14 yes 2072 Hiram College Hiram OH 12 yes 1755 Hobart William Smith Colleges Geneva NY 14 yes 1778 Hofstra University Hempstead NY 4 no 2794 Hollins University Roanoke VA 13 yes 2266 Holy Family University Philadelphia PA 16 yes 152 Holy Names University Oakland CA 16 yes 424 Howard University Washington DC 41 no 8 Huntingdon College Montgomery AL 20 yes
579 Idaho State University Pocatello ID 1 no 642 Illinois College Jacksonville IL 22 yes 646 Illinois Wesleyan University Bloomington IL 14 yes 7813 Institute of American Indian and Alaska Native Cul Santa Fe NM 7 yes
1956 Johnson C. Smith University Charlotte NC 35 no 2272 Juniata College Huntingdon PA 13 no
1272 Kalamazoo College Kalamazoo MI 14 yes 1617 Keene State College Keene NH 8 no 652 Knox College Galesburg IL 14 yes 5341 Kuyper College Grand Rapids MI 22 no
523 LaGrange College Lagrange GA 21 yes 2947 Lawrence University Appleton WI 14 yes 1794 Le Moyne College Syracuse NY 17 yes 2277 Lebanon Valley College Annville PA 22 yes 2537 Lee University Cleveland TN 23 yes 2194 Lewis & Clark College Portland OR 14 yes 655 Lewis University Romeoville IL 17 yes 2539 Lincoln Memorial University Harrogate TN 13 no 2279 Lincoln University of Pennsylvania Lincoln University PA 34 yes 2796 Longwood University Farmville VA 8 no 657 Loyola University Chicago Chicago IL 5 yes 2283 Lycoming College Williamsport PA 22 yes
1344 Macalester College Saint Paul MN 23 yes 1796 Manhattan College Riverdale NY 18 yes 1275 Marygrove College Detroit MI 16 yes 1804 Marymount Manhattan College New York NY 12 yes 2799 Marymount University Arlington VA 16 yes 2543 Maryville College Maryville TN 23 yes 2285 Marywood University Scranton PA 17 yes 1197 Massachusetts College of Liberal Arts North Adams MA 8 yes 5170 McKendree University Lebanon IL 21 yes 913 McPherson College McPherson KS 20 yes
65
Institutions Participating in the 2013 CIRP Freshman Survey
Stratification Included inACE Institution City State Cell National Norms

525 Mercer University Macon GA 13 yes 2079 Miami University-Oxford Oxford OH 3 yes 2633 Midwestern State University Wichita Falls TX 8 yes 199 Mills College Oakland CA 13 yes 1412 Millsaps College Jackson MS 23 yes 1508 Missouri University of Science and Technology Rolla MO 3 no 1662 Montclair State University Montclair NJ 8 yes 2287 Moore College of Art and Design Philadelphia PA 11 yes 2289 Moravian College and Moravian Theological Seminary Bethlehem PA 22 yes 5796 Morehouse College Atlanta GA 35 yes 844 Morningside College Sioux City IA 23 yes 1096 Mount St. Mary’s University Emmitsburg MD 17 yes 203 Mount St. Mary’s College Los Angeles CA 16 yes
1589 Nebraska Wesleyan University Lincoln NE 23 yes 5888 Neumann University Aston PA 16 yes 471 New College of Florida Sarasota FL 9 yes 1965 North Carolina Central University Durham NC 34 yes 674 North Central College Naperville IL 23 no 2454 North Greenville University Tigerville SC 22 no 2157 Northeastern State University Tahlequah OK 8 yes 1184 Northeastern University Boston MA 6 yes 679 Northwestern University Evanston IL 6 no 2083 Notre Dame College Cleveland OH 16 yes
1286 Oakland University Rochester Hills MI 1 yes 2084 Oberlin College Oberlin OH 14 no 207 Occidental College Los Angeles CA 14 yes 2163 Oklahoma City University Oklahoma City OK 23 yes 5566 Oklahoma Wesleyan University Bartlesville OK 21 yes 190 Otis College of Art and Design Los Angeles CA 12 no 4892 Oxford College of Emory University Oxford GA no
214 Pacific Union College Angwin CA 21 no 6615 Palm Beach Atlantic University West Palm Beach FL 22 yes 9106 Patrick Henry College Purcellville VA no 104 Philander Smith College Little Rock AR 38 yes 1826 Polytechnic Institute of New York University Brooklyn NY 5 yes 1827 Pratt Institute-Main Brooklyn NY 13 no 683 Principia College Elsah IL 13 yes 2409 Providence College Providence RI 18 yes
373 Quinnipiac University Hamden CT 13 no
2825 Radford University Radford VA 8 no 7241 Ramapo College of New Jersey Mahwah NJ 9 yes 2805 Randolph College Lynchburg VA 22 yes 2209 Reed College Portland OR 14 yes 1187 Regis College Weston MA 16 yes 334 Regis University Denver CO 18 yes 534 Reinhardt University Waleska GA 20 yes 2410 Rhode Island College Providence RI 7 yes 2413 Rhode Island School of Design Providence RI 14 no 2645 Rice University Houston TX 6 no 1667 Rider University Lawrenceville NJ 12 no 685 Rockford University Rockford IL 12 yes
66
Institutions Participating in the 2013 CIRP Freshman Survey
Stratification Included inACE Institution City State Cell National Norms

468 Rollins College Winter Park FL 13 yes 2309 Rosemont College Rosemont PA 16 yes 1672 Rutgers University-Camden Camden NJ 9 no 1668 Rutgers University-New Brunswick New Brunswick NJ 3 no 1673 Rutgers University-Newark Newark NJ 1 no
5082 Sacred Heart University Fairfield CT 18 no 6101 Sage College of Albany Albany NY no 976 Saint Catharine College Saint Catharine KY 19 yes 2313 Saint Francis University Loretto PA 17 yes 1843 Saint Joseph’s College-New York Brooklyn NY 12 yes 2856 Saint Martin’s University Lacey WA 17 no 781 Saint Mary’s College Notre Dame IN 18 yes 227 Saint Mary’s College of California Moraga CA 18 yes 1354 Saint Mary’s University of Minnesota Winona MN 4 yes 2758 Saint Michael’s College Colchester VT 18 yes 2974 Saint Norbert College De Pere WI 18 yes 1675 Saint Peter’s University Jersey City NJ 16 yes 8307 San Diego Christian College El Cajon CA 20 no 248 San Francisco Conservatory of Music San Francisco CA 13 yes 238 San Jose State University San Jose CA 8 no 267 Santa Clara University Santa Clara CA 18 yes 535 Savannah State University Savannah GA 34 no 693 School of the Art Institute of Chicago Chicago IL 13 yes 7449 School of Visual Arts New York NY no 246 Scripps College Claremont CA 14 yes 2857 Seattle Pacific University Seattle WA 23 yes 2858 Seattle University Seattle WA 18 no 1676 Seton Hall University South Orange NJ 4 yes 2564 Sewanee-The University of the South Sewanee TN 23 yes 1836 Siena College Loudonville NY 18 no 1189 Smith College Northampton MA 14 no 170 Sonoma State University Rohnert Park CA 8 no 2553 Southern Adventist University Collegedale TN 21 yes 700 Southern Illinois University Edwardsville Edwardsville IL 8 yes 2657 Southern Methodist University Dallas TX 5 yes 2664 Southwestern University Georgetown TX 23 yes 502 Spelman College Atlanta GA 35 no 1329 St. Catherine University Saint Paul MN 18 yes 1949 St. Andrews University Laurinburg NC 20 yes 1842 St. John’s University-New York Queens NY 4 yes 2648 St. Mary’s University San Antonio TX 17 no 5498 St. Thomas Aquinas College Sparkill NY 11 yes 1110 Stevenson University Stevenson MD 11 no 1204 Suffolk University Boston MA 12 no 1864 SUNY at Binghamton Vestal NY 3 no 7028 SUNY at Purchase College Purchase NY 9 no 1878 SUNY College at Potsdam Potsdam NY 9 yes 4894 SUNY Institute of Technology at Utica-Rome Utica NY 9 yes 2336 Swarthmore College Swarthmore PA 14 no
2674 Tarleton State University Stephenville TX 7 yes 2677 Texas A & M University-Kingsville Kingsville TX 1 no 2675 Texas Christian University Fort Worth TX 5 yes 1753 The College of New Rochelle New Rochelle NY 11 yes 2063 The College of Wooster Wooster OH 14 yes
67
Institutions Participating in the 2013 CIRP Freshman Survey
Stratification Included inACE Institution City State Cell National Norms

1835 The Sage Colleges Troy NY 12 no 476 The University of Tampa Tampa FL 12 yes 7256 Touro College New York NY 12 no 981 Transylvania University Lexington KY 23 yes 379 Trinity College Hartford CT 14 yes 2685 Trinity University San Antonio TX 23 yes 435 Trinity Washington University Washington DC 16 yes 1024 Tulane University of Louisiana New Orleans LA 6 yes 2561 Tusculum College Greeneville TN 21 yes
1884 Union College Schenectady NY 14 no 341 United States Air Force Academy USAFA CO 9 yes 380 United States Coast Guard Academy New London CT 9 yes 1100 United States Naval Academy Annapolis MD 9 no 76 University of Arkansas at Pine Bluff Pine Bluff AR 34 yes 382 University of Bridgeport Bridgeport CT 11 yes 257 University of California-Los Angeles Los Angeles CA 3 no 262 University of California-Riverside Riverside CA 1 yes 260 University of California-San Diego La Jolla CA 3 yes 259 University of California-Santa Barbara Santa Barbara CA 3 no 1456 University of Central Missouri Warrensburg MO 8 no 2147 University of Central Oklahoma Edmond OK 8 no 567 University of Hawaii at Manoa Honolulu HI 2 yes 9109 University of Hawaii-West Oahu Kapolei HI 7 yes 584 University of Idaho Moscow ID 2 yes 705 University of Illinois at Chicago Chicago IL 2 no 4890 University of Illinois at Springfield Springfield IL 9 yes 704 University of Illinois at Urbana-Champaign Champaign IL 3 no 184 University of La Verne La Verne CA 4 no 984 University of Louisville Louisville KY 2 yes 1207 University of Massachusetts Amherst Amherst MA 2 yes 5773 University of Massachusetts-Dartmouth North Dartmouth MA 9 yes 1294 University of Michigan-Ann Arbor Ann Arbor MI 3 yes 6400 University of Michigan-Flint Flint MI 9 no 1609 University of Nevada-Reno Reno NV 1 yes 1984 University of North Carolina at Chapel Hill Chapel Hill NC 3 no 785 University of Notre Dame Notre Dame IN 6 yes 6232 University of Pittsburgh-Bradford Bradford PA 8 yes 2342 University of Pittsburgh-Pittsburgh Campus Pittsburgh PA 3 yes 265 University of Redlands Redlands CA 13 yes 1889 University of Rochester Rochester NY 6 yes 374 University of Saint Joseph West Hartford CT 17 yes 2343 University of Scranton Scranton PA 18 no 2458 University of South Carolina-Columbia Columbia SC 3 no 9119 University of South Florida Sarasota-Manatee Sarasota FL 9 yes 477 University of South Florida-Main Campus Tampa FL 2 yes 4895 University of South Florida-St. Petersburg Campus St. Petersburg FL 9 no 268 University of Southern California Los Angeles CA 6 yes 157 University of the Pacific Stockton CA 4 yes 2302 University of the Sciences Philadelphia PA 14 yes 2104 University of Toledo Toledo OH 1 yes 2731 University of Utah Salt Lake City UT 2 no 2819 University of Virginia-Main Campus Charlottesville VA 3 no
787 Valparaiso University Valparaiso IN 23 no 2567 Vanderbilt University Nashville TN 6 yes
68
Institutions Participating in the 2013 CIRP Freshman Survey
Stratification Included inACE Institution City State Cell National Norms

5053 Vanguard University of Southern California Costa Mesa CA 20 no 1891 Vassar College Poughkeepsie NY 14 yes 5517 Villa Maria College Buffalo NY 16 yes 2828 Virginia Union University Richmond VA 38 no 2459 Voorhees College Denmark SC 38 yes
789 Wabash College Crawfordsville IN 13 yes 1987 Wake Forest University Winston Salem NC 5 no 5562 Walsh University North Canton OH 17 yes 2214 Warner Pacific College Portland OR 20 yes 1588 Wayne State College Wayne NE 8 no 1295 Wayne State University Detroit MI 1 yes 2349 Waynesburg University Waynesburg PA 21 yes 1895 Wells College Aurora NY 12 yes 384 Wesleyan University Middletown CT 14 yes 5035 Western New England University Springfield MA 12 yes 2352 Westminster College New Wilmington PA 22 no 707 Wheaton College Wheaton IL 23 no 2867 Whitman College Walla Walla WA 14 yes 2297 Widener University-Main Campus Chester PA 4 no 2354 Wilkes University Wilkes-Barre PA 12 yes 2215 Willamette University Salem OR 14 yes 1213 Williams College Williamstown MA 14 yes 2355 Wilson College Chambersburg PA 20 yes 1992 Wingate University Wingate NC 12 yes 1993 Winston-Salem State University Winston-Salem NC 34 yes 2113 Wittenberg University Springfield OH 23 yes 2463 Wofford College Spartanburg SC 23 yes
1026 Xavier University of Louisiana New Orleans LA 39 yes
69
Institutions Participating in the 2013 CIRP Freshman Survey
Stratification Included inACE Institution City State Cell National Norms

APPENDIX D
The Precision of the Normative Data and Their Comparisons


THE PRECISION OF THE NORMATIVE DATA AND THEIR COMPARISONS
73
A common question asked about sample surveys relates to the precision of the data, which is typi-cally reported as the accuracy of a percentage “plus or minus x percentage points.” This figure, which is known as a confidence interval, can be estimated for items of interest if one knows the response percentage and its standard error.
Given the CIRP’s large normative sample, the calculated standard error associated with any particular response percentage will be small (as will its confidence interval). It is important to note, however, that traditional methods of calcu-lating standard error assume conditions which, (as is the case with most real sample survey data), do not apply here. Moreover, there are other possible sources of error which should be considered in comparing data across normative groups, across related item categories, and over time. In reference to the precision of the CIRP data, these concerns include:
1) Traditional methods of calculating standard error assume that the individuals were selected through simple random sampling. Given the complex stratified design of the CIRP, where whole institutions participate, it is likely that the actual standard errors will be somewhat larger than the standard error estimates produced through traditional computational methods. In addition, while every effort has been made to maximize the comparability of the institutional sample from year to year (repeat participation runs
about 90 percent), comparability is reduced by non-repeat participation and year-to-year variation in the quality of data collected by continuing institutional participants. While the CIRP stratification and weighting procedures are designed to minimize this institutional form of “response bias,” an unknown amount of non-random variation is introduced into the results.
2) The wording of some questions in the survey instrument, the text and number of response options, and their order of presentation have changed over the years. We have found that even small changes can produce large order and context effects. Given this, the exact wording and order of items on the survey instrument (see Appendix B) should be examined carefully prior to making compari-sons across survey years.
3) Substantial changes in the institutional strati-fication scheme were made in 1968, 1971, 1975, 2001, and 2009. These changes resulted in a revision of the weights applied to individual institutions. Stratification cell assignments of a few institutions may also change from time to time, but the scale of these changes and their effect on the national normative results are likely to be small in comparison to other sources of bias.
Since it is impractical to report statistical indi-cators for every percentage in every CIRP comparison group, it is important for those who

74
Table D1. Estimated Standard Errors of Percentages for Comparison Groups of Various Sizes
Unweighted size of Percentage
comparison groups 1% 5% 10% 15% 20% 25% 30% 35% 40% 45% 50%
500 .445 .975 1.342 1.597 1.789 1.936 2.049 2.133 2.191 2.225 2.236 1,000 .315 .689 .949 1.129 1.265 1.369 1.449 1.508 1.549 1.573 1.581 5,000 .141 .308 .424 .505 .566 .612 .648 .675 .693 .704 .707 10,000 .099 .218 .300 .357 .400 .433 .458 .477 .490 .497 .500 20,000 .070 .154 .212 .252 .283 .306 .324 .337 .346 .352 .354 40,000 .050 .109 .150 .179 .200 .217 .229 .238 .245 .249 .250 55,000 .042 .093 .128 .152 .171 .185 .195 .203 .209 .212 .213 70,000 .038 .082 .113 .135 .151 .164 .173 .180 .185 .188 .189 90,000 .033 .073 .100 .119 .133 .144 .153 .159 .163 .166 .167 110,000 .030 .066 .090 .108 .121 .131 .138 .144 .148 .150 .151 130,000 .028 .060 .083 .099 .111 .120 .127 .132 .136 .138 .139 240,000 .020 .044 .061 .073 .082 .088 .094 .097 .100 .102 .102
Note: Assumes simple random sampling.
are interested to be able to estimate the precision of the data. Toward this end, Table D1 provides estimates of standard errors for comparison groups of various sizes and for different percent-ages1 which can be used to derive confidence interval estimates.
For example, suppose the item we are interested in has a response percentage of 15.7 percent among students at all nonsectarian four-year colleges (a normative group that is 28,272 in size). First, we choose the column that is closest to the observed percentage 15.7—in this case “15%.”2 Next, we select the row closest to the unweighted sample size of 28,272—in this case “20,000.” Consulting Table D1, we find the esti-mated standard error would be .252.
To calculate the confidence interval at the 95% probability level, we multiply the estimated standard error by the critical value of t for the unweighted sample size (which, for all CIRP comparison groups, will be equal to 1.96 at the .05 level of probability).3 In this example, we would multiply the estimated standard error of .252 by 1.96, which yields .494. If we round this figure to a single decimal point we would then estimate our confidence interval to be 15.7 ± .5. In practical terms, this confidence interval means that if we were to replicate this survey using the same size sample, we would expect that the resulting percentage would fall between 15.2 percent and 16.1 percent 95 times out of 100.
1 Calculated by √x%(100–x%) where x is the percentage of interest and N is the population count from Table A1. N2 Since the distribution of the standard errors is symmetrical around the 50 percent mid-point, for percentages over 50
simply subtract the percentage from 100 and use the result to select the appropriate column. For example, if the percentage we were interested in was 59, 100 – 59 percent yields 41, so we would use the column labeled ‘40%.’
3 To calculate the confidence interval at the 99% probability level the critical t value is 2.56.

APPENDIX E
Changes to the Career Category Response Options for the 2013 Survey


77
ARTS
Actor or Entertainer Actor or entertainer
Artist Artist
Graphic Designer
Musician Musician (performer, composer)
Writer/Producer/Director
AGRICULTURE
Farmer or Forester Farmer or rancher
Natural Resource Specialist/Environmentalist
Conservationist or forester
BUSINESS
Accountant Accountant or Actuary
Administrative Assistant Business (clerical)
Business Manager/Executive Business executive (management, administrator)
Business Owner/Entrepreneur Business owner or proprietor
Retail Sales
Sales/Marketing Business salesperson or buyer
Human Resources
Finance (e.g., Actuary, Banking, Loan Officer, Planner)
Management Consultant
Real Estate Agent/Realtor/Appraiser/Developer
Sports Management
COMMUNICATIONS
Journalist Writer or journalist
Public/Media Relations
Advertising
EDUCATION
College Administrator/Staff College administrator/staff
College Faculty College teacher
Early Childcare Provider
Elementary School Teacher Teacher or administrator (elementary)
Secondary School Teacher Teacher or administrator (secondary)
Librarian
Teacher’s Assistant/Paraprofessional
K-12 Administrator School principal or superintendent
Other K-12 Professional School counselor
Changes to the Career Category Response Options for the 2013 Survey
2013 TFS Previous TFS
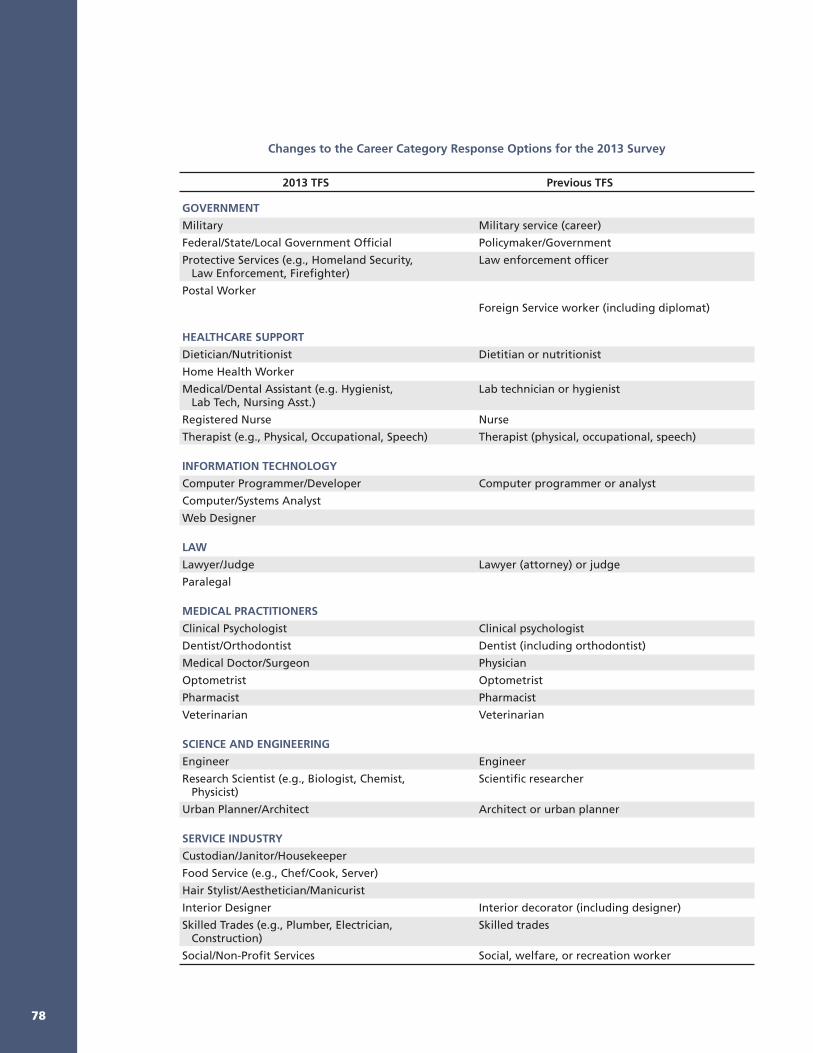
78
GOVERNMENT
Military Military service (career)
Federal/State/Local Government Official Policymaker/Government
Protective Services (e.g., Homeland Security, Law enforcement officer Law Enforcement, Firefighter)
Postal Worker
Foreign Service worker (including diplomat)
HEALTHCARE SUPPORT
Dietician/Nutritionist Dietitian or nutritionist
Home Health Worker
Medical/Dental Assistant (e.g. Hygienist, Lab technician or hygienist Lab Tech, Nursing Asst.)
Registered Nurse Nurse
Therapist (e.g., Physical, Occupational, Speech) Therapist (physical, occupational, speech)
INFORMATION TECHNOLOGY
Computer Programmer/Developer Computer programmer or analyst
Computer/Systems Analyst
Web Designer
LAW
Lawyer/Judge Lawyer (attorney) or judge
Paralegal
MEDICAL PRACTITIONERS
Clinical Psychologist Clinical psychologist
Dentist/Orthodontist Dentist (including orthodontist)
Medical Doctor/Surgeon Physician
Optometrist Optometrist
Pharmacist Pharmacist
Veterinarian Veterinarian
SCIENCE AND ENGINEERING
Engineer Engineer
Research Scientist (e.g., Biologist, Chemist, Scientific researcher Physicist)
Urban Planner/Architect Architect or urban planner
SERVICE INDUSTRY
Custodian/Janitor/Housekeeper
Food Service (e.g., Chef/Cook, Server)
Hair Stylist/Aesthetician/Manicurist
Interior Designer Interior decorator (including designer)
Skilled Trades (e.g., Plumber, Electrician, Skilled trades Construction)
Social/Non-Profit Services Social, welfare, or recreation worker
Changes to the Career Category Response Options for the 2013 Survey
2013 TFS Previous TFS
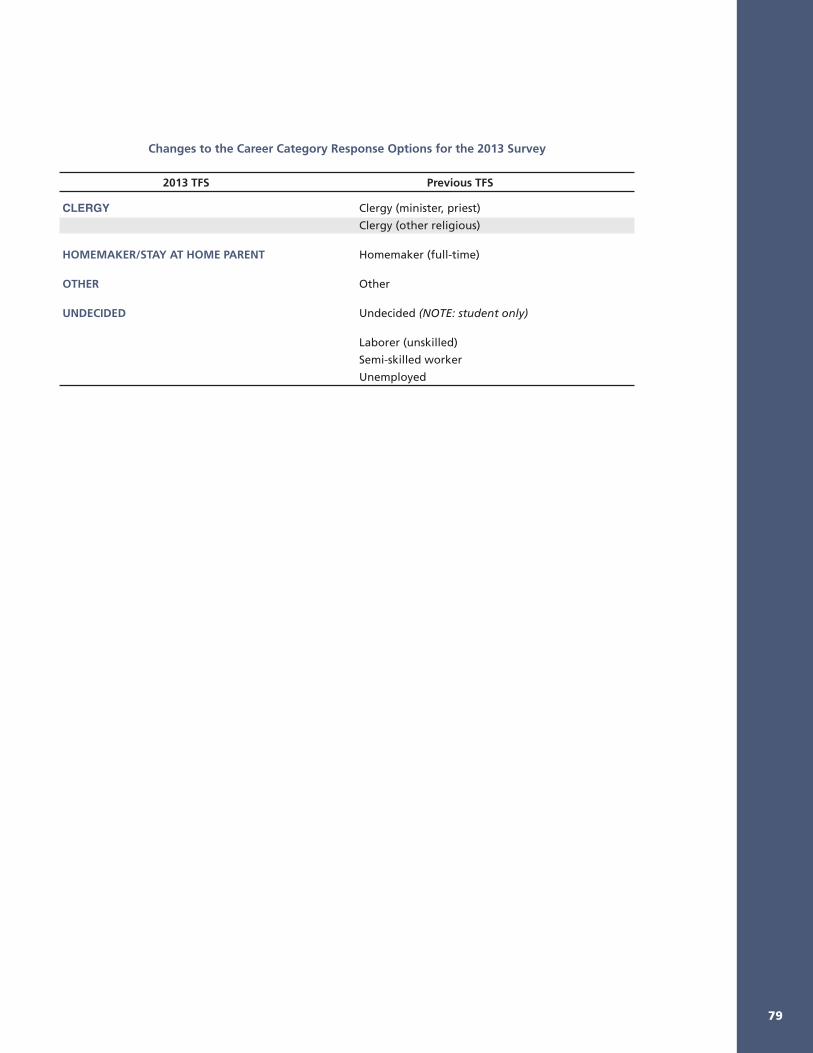
79
CLERGY Clergy (minister, priest)
Clergy (other religious)
HOMEMAKER/STAY AT HOME PARENT Homemaker (full-time)
OTHER Other
UNDECIDED Undecided (NOTE: student only)
Laborer (unskilled)
Semi-skilled worker
Unemployed
Changes to the Career Category Response Options for the 2013 Survey
2013 TFS Previous TFS


81
ABOUT THE AUTHORS
Kevin Eagan is Assistant Professor in Residence and interim Director of the Cooperative Institutional Research Program (CIRP). He is also the interim Managing Director of the Higher Education Research Institute (HERI), where the CIRP surveys are administered. His research interests include issues related to undergraduate science, technology, engineering, and mathematics (STEM) education, contingent faculty, student retention, institutional contexts and structures of opportunity, survey validity and reliability, and advanced quantitative methods.
Jennifer B. Lozano is a doctoral student in the Higher Education and Organizational Change program at UCLA’s Graduate School of Education and Information Studies, and an analyst for the Cooperative Institutional Research Program (CIRP). Her research interests include gender, faculty, technology, and organizational and comparative studies. She earned her M.A. in higher education from the University of Redlands and her B.A. in economics from Sonoma State University.
Sylvia Hurtado is Director of the Higher Education Research Institute (HERI) at UCLA and Professor in the Graduate School of Education and Information Studies. Dr. Hurtado has published numerous articles and books related to her primary interest in student educational outcomes, STEM education, campus climates, and diversity in higher education. She has served on many editorial boards for journals in education and served on the board of the Higher Learning Commission and National Academies’ Board of Higher Education and Work, and she is past President of the Association for the Study of Higher Education (ASHE).
Matthew H. Case is Manager, Student Success Data at California State University, Office of the Chancellor. He oversees the delivery and dissemination of leading indicator, retention, graduation, and other student success information for the CSU system.
PUBLICATIONS
To download reports visit the HERI publications webpage: www.heri.ucla.edu/research-publications.php
HERI Publications List (Rev 2/2014)
The American Freshman: National Norms for Fall 2013*2013, 81 pagesE-book with expanded tables, 185 pagesProvides national normative data on the characteristics of students attending American colleges and universities as first-time, full-time freshmen. Data from 165,743 entering first-year students are statistically adjusted to reflect the 1.5 million students entering four-year institutions for the first time in 2013. The annual report covers: demographic charac-teristics; expectations of college; degree goals and career plans; college finances; and attitudes, values, and life goals.*Publications from earlier years are also available.
Undergraduate Teaching Faculty: The 2010–2011 HERI Faculty Survey*October 2012, 99 pagesE-book with expanded tables, 231 pagesProvides an informative profile of full-time undergraduate faculty at American colleges and universities. The 2010–2011 norms covers several areas: Faculty Work-Life, Use of Student-Centered Pedagogy, and Training the Next Generation of Faculty. The report includes a section devoted to examining the experiences and perceptions of part-time faculty as well. Results are reported by institutional type for all faculty, male faculty, and female faculty.*Publications from earlier years, under the title The American College Teacher, are also available: 2007–2008, 2004–2005, 2001–2002, 1998–1999, 1995–1996, 1992–1993, 1989–1990.
Completing College: Assessing Graduation Rates at Four-Year InstitutionsNovember 2011, 55 pagesProvides the latest information on four-, five-, and six-year degree attainment rates collected longitudinally from 356 baccalaureate-granting institutions. Differences by institu-tional type, gender, first-generation status, and race/ethnicity are examined. The study highlights main predictors of degree completion and provides several formulas for calculating expected institutional completion rates.
The American Freshman: Forty Year TrendsMarch 2006, 261 pagesSummarizes trends data in the Cooperative Institutional Research Program (CIRP) Freshman Survey between 1966 and 2006. The report examines changes in the diversity of students entering college; parental income and students’ financial concerns; and issues of access and affordability in college. Trends in students’ political and social attitudes are also covered.
Advancing in Higher Education: A Portrait of Latina/o College Freshmen at Four-Year Institutions, 1975–2006October 2008, 90 pagesWith national data taken from the Cooperative Institutional Research Program (CIRP) Freshman Survey, this report is a data resource for higher education in understanding the unique characteristics of the increasing numbers of Latina/o first-time, full-time freshmen. For the first time, CIRP trends are disaggregated by specific Latina/o ethnic origin group and by gender, to highlight the heterogeneity in the popu-lation unavailable in other national reports on Hispanic college students.
Beyond Myths: The Growth and Diversity of Asian American College Freshmen, 1971–2005September 2007, 63 pagesThe first-year student trends examined in this report help to address some common characterizations of Asian American students, particularly with respect to their educational success, that are often overstated and taken out of context. The find-ings suggest that Asian Americans still have to overcome a number of obstacles, such as levels of family income and financial aid, to earn a coveted spot in higher education. Featuring data collected from the Cooperative Institutional Research Program (CIRP) Freshman Survey, it is based on 361,271 Asian/Asian American first-time full-time students who entered college between 1971 and 2005—representing the largest compilation and analysis of data on Asian American college students ever undertaken.
First in My Family: A Profile of First-Generation College Students at Four-Year Institutions Since 1971February 2007, 62 pagesFirst-generation college students are receiving increasing attention from researchers, practitioners, and policymakers who seek to understand students’ college decision-making process in order to support their progress in higher education. This report explores the changing dynamic between first-generation college students and their non-first-generation peers by utilizing longitudinal trends data collected through the Cooperative Institutional Research Program (CIRP) Freshman Survey from 1971 to 2005.
Black Undergraduates From Bakke to GrutterNovember 2005, 41 pagesSummarizes the status, trends, and prospects of Black college freshmen using data collected from 1971 to 2004 through the Cooperative Institutional Research Program (CIRP). Based on more than half a million Black freshman students, the report examines gender differences; socioeconomic status; academic preparation and aspirations; and civic engagement.

ISBN # 978-1-878477-23-1


![Dean's List fall 2018(2).xlsx [Read-Only]...Marshall Santonio V Freshman Durham NC Martin Destiny Freshman Chesapeake VA ... Samson Biruktawit K Freshman Mebane NC Sanchez-Gazga Irene](https://img.pdfslide.us/doc/110x75/607e619fd57b1e113761ac7a/deans-list-fall-20182xlsx-read-only-marshall-santonio-v-freshman-durham.jpg)