Embed Size (px)
Citation preview

THE ALTERATION OF INTRACELLULAR ENZYMES
HI. TH~ EFFECT OF TEMPERATURE ON THE KINETICS OF ALTERED AND UNALTERED YEAST CATALASE*
Bx M. J. FRASER$ AND J. GORDIN KAPLAN
(From the Department of Pkysiology, Dalkousie University, Halifax, Canada)
(Received for publication, August 4, 1954)
INTRODUCTION
As a result of certain similarities in behavior between surface-unfolded (3) and intracellular erythrocyte catalase (4), the hypothesis was advanced "that catalase within the cell exists partially, but reversibly, unfolded at some intra- cellular interface; upon cytolysis, the enzyme is desorbed from the interface and changed to the roUed-up (native), soluble condition, with consequent increase in a c t i v i t y . . . " . The series of investigations of which this is part is designed to put this interracial hypothesis to the test.
In the first of these papers ((1) hereafter referred to as Paper I), it was shown that the catalase of the intact yeast cell could be caused to undergo in situ an abrupt change in a wide variety of properties and thus made to imitate in almost every detail the behavior of catalase extracted from the cell into solution. The process by which this change was brought about was called enzyme alteration, and the existence of this phenomenon was taken to indicate that catalase could exist in no less than 2 distinct states, the rolled-up, highly active, soluble configuration (in which it is usually studied) which it possesses following alteration in situ or after extraction, and also the configuration, what- ever it may be, which it possesses within the intact cell. Those properties of the intracellular catalase which underwent change were: (a) its specific activity,
* The authors are indebted to Dr. Charles Masson and Dr. Walter "Frost of Hali- fax, and to Dr. Britton Chance of Philadelphia, for their very helpful comments. Plans for a kinetic study of surface-spread catalase were made jointly with Professor Teru Hayashi of Columbia University in 1949, and while such a study has not as yet been undertaken, this discussion was the seed from which the present experiments have grown. This work has been supported by grants from the National Cancer In- stitute of Canada, and the National Research Council, Ottawa.
:~ Recipient of National Research Council bursary, and at present 1851 Exhibition Scholar, Department of Colloid Science, University of Cambridge. The data to be presented in this paper have been abstracted from a thesis submitted by M. J. Fraser to the Faculty of Graduate Studies, Dalhousie University, in partial fulfillment of the requirements for the M.Sc. degree.
515
The Journal of General Physiology
Dow
nloaded from http://rupress.org/jgp/article-pdf/38/4/515/1241030/515.pdf by guest on 17 M
arch 2022

516 KINETIC STUDY OF YEAST CATALASE
which increased by more than an order of magnitude (this is the Euler effect, named after its discoverer (5)); (b) its optimal substrate concentration, which was greatly reduced, owing to its much greater sensitivity to the destructive effect of H202; (c) its response to changes in the pH of the external medium (the activity of the altered intracellular enzyme was virtually abolished below pH 4 and above pH 10, whereas the unaltered enzyme was only slightly in- hibited at the former pH and strongly activated at the latter); (d) its activity following pretreatment with heat which, at durations and intensities causing but little change in the unaltered catalase, caused total destruction of the altered enzyme. In Paper I, chloroform and ultraviolet radiation were the agents used to achieve the in situ enzyme alteration.
In the second paper ((2), hereafter referred to as Paper II), the ability of surface-active agents (alcohols, ketones, aldehydes) to cause enzyme altera- tion was shown to be closely correlated with their surface activity. For exam- ple, concentrations of these agents, varying over a 4,000-fold range, which caused equal activation of the catalase of a yeast suspension, depressed the surface tension of the treatment mixture to the same extent (to 42 ± 2 dynes, for doubled activity). I t was also shown that the altering activity of these agents was not correlated with their ability to kill the yeast cells. The conclu- sion was drawn that altering agents studied in Paper I I caused the alteration of catalase by adsorbing at some critical intracellular interface, and this was taken as support for, but not proof of, the interfacial hypothesis.
On the basis of the interfacial hypothesis, it was possible to make some in- teresting predictions concerning the changes in kinetic properties of the cata- lase which should accompany desorption of the enzyme from an interface and it has proven possible to confront these predictions with the testimony of experiment. We propose to show in this paper that the regular changes in en- zyme kinetics which accompany enzyme alteration are of a nature and in a direction predicted by, or at least consistent with, the interfacial hypothesis.
THEORETICAL
A. Effect of Temperature on the Enzyme-Catalyzed Reaction.--It is well known that the rates of enzyme-catalyzed reactions generally follow the Ar- rhenius equation, one form of which is
(log k'l - - log k'l) u = 2.3 R (1)
i / r , - l iT,
in which the specific rate constants ktx and k'2 are determined at two absolute temperatures, Tt and T2. Hence a plot of log k' versus l I T yields a straight line whose slope is #/2.3 R, in which R is the gas constant, and/~ the experi- mental energy of activation. The energy of activation is believed to be the energy required to reach a critical intermediate configuration, the activated complex, whose attainment is necessary before the reaction can proceed to
Dow
nloaded from http://rupress.org/jgp/article-pdf/38/4/515/1241030/515.pdf by guest on 17 M
arch 2022

M. J. FRASER AND J. GORDIN Y~APLAN 517
completion (6). I t is at present agreed that catalysts in general, and enzymes in particular, accelerate the rate of a reaction by reducing its energy of ac- tivation; that is, the energy barrier over which the reactants must pass before the products of the reaction can be formed (6).
We should thus predict that the altered enzyme, shown in Papers I and I I to be in a much more highly active state, and pictured according to our hy- pothesis as having been desorbed from the interface into a more specific con- figuration, should catalyze the decomposition of H~O2 with a lower energy of activation than that exhibited by the less specific, and less active, unaltered enzyme-substrate system.
From the experimental energy of activation, #, determined by means of an Arrhenius plot, we may calculate the heat of activation AH~:, from the relation (see reference 6),
AH$ = I.t - RT (2)
While, strictly, Equation 2 should have a term (+pA V$) for the volume change associated with the activation process, the magnitude of this term is so small at atmospheric pressure (we calculate 1.4 cal./mole, using the AV$ of luciferin (7)) that it may safely be neglected. Knowing AH• and the specific second order velocity constants for the catalase-H~O~ system (about which more be- low), we may determine the entropy of activation, AS:~, by substituting these constants in the Eyring modification of the Arrhenius equation (6) :
k T k ~' == ~, - ~ .e'-(Alt$)lRr.e(~s$ )/~ (3)
Here k" is the specific second order rate constant, K~, the so called transmission coefficient, assumed to be unity in these experiments (i.e., ignoring the pos- sibility that some of the activated complexes might be turned back to their initial state; we shall omit it in the treatment which follows), k is the Boltz- mann constant, and k Planck's constant. The factor kT /h is a universal fre- quency factor, having the dimensions of reciprocal seconds, and being de- pendent only on temperature and not on the nature of the reaction.
Having determined AH:~, and ASS, we may then determine the free energy of activation (AFar) by applying to the activation process the thermodynamic equation, 1
~F$ = ~ - T ~ t (4)
B. Effect of Temperature on the Enzyme Alone . - -At higher temperatures, heat, in addition to accelerating the rate of the enzyme-catalyzed reaction,
1 We shall refer to these quantities as thermodynamic constants, although they refer strictly to the (assumed) activation process, and are simply analogous to the same constants determined for the usual reversible reactions of classical thermody- namics.
Dow
nloaded from http://rupress.org/jgp/article-pdf/38/4/515/1241030/515.pdf by guest on 17 M
arch 2022

518 KINETIC STUDY OF YEAST CATALASE
will also irreversibly decrease the amount of active enzyme by converting part (or all) into a structurally modified, inactive ('denatured') form. The process of heat destruction of the enzyme may also be subjected to a kinetic analysis, and data relating the rate of catalase destruction in the absence of substrate to varying temperatures permit the calculation of the various thermodynamic constants of the activation of this process, exactly as described above for the activation of the enzyme-substrate systems. In this case, we substitute in the Eyring equation an experimentally measured first order specific reaction rate constant.
Our interpretation of the reason for which one m a y substitute 2 dimen- sionally different rate constants (i.e., first and second order) in this equation, without modifying the dimensions of AFJ; or AS:~ calculated from it, stems from a consideration of another form of the Eyring equation,
kT k' - - - . K ~ (5 )
h
in which KS is the equilibrium constant for the formation of the activated com- plex (X$) through the reaction
a + B + - . . ~ X ~ : (6)
In a monomolecular reaction of the type A ~-- A ~ --~ products, it follows that
Kt = M~]/[A] (7)
hence K:~ is dimensionless and the fight-hand side of Equation 5 has the proper dimensions, corresponding to a first order k', of sec_ 1, which, as we have seen above, is the unit of the frequency factor kT/h. In a bimolecular reaction of the type A + B ~ X$ -+ products, it follows that
K, = [x,]/M][B] (8)
hence KS has the units of liter, mole -~, and the right-hand side of Equation 5 will thus have, as it ought, the dimensions of liter-mole-X-sec_ x, correspond- ing to a second order rate constant. If the van't Hoff equation is applied to an equilibrium between activated complex and reactants,
K$ -- e~(~r*)/Rr (9)
and the right-hand side is substituted for K:~ in Equation 5, one obtains
k ' = k__T .e-(Aet~ m r ; (10) h
by substituting the right-hand side of Equation 4 for AFt: in Equation 10, one obtains the relation shown in Equation 3, which is the form of the Eyring equation to be used in the calculation of our data. I t is clear that by sub- stituting the proper rate constant in Equations 10 and 3, the symbols AF$,
Dow
nloaded from http://rupress.org/jgp/article-pdf/38/4/515/1241030/515.pdf by guest on 17 M
arch 2022

M. J. FRASER AND J. GORDIN KAPLAN 519
A~/~ and AS:~ will represent the standard free energy, heat content, and entropy changes, respectively, occurring upon formation of the activated com- plex, either for the enzyme-catalyzed decomposition of H20~, or for the heat- induced inactivation of the enzyme itself.
The interpretation which we shall make of differences (as between altered and unaltered enzymes) in A//$ and AS~ of the heat inactivation process is based on treatment by Glasstone, Laidler, and Eyring (6) of the pH depend- ence of these thermodynamic constants. It is known that AH~: and AS:~ for the heat-induced inactivation of enzymes and for the "denaturation" of pro- teins are strongly pH-sensitive, possessing maximum values at the pH of optimal activity or maximum stability, falling off as the pH is varied in either direction. The explanation of this phenomenon (6) is based on the assumption (amply supported; see Mirsky and Pauling (8)) that the soluble protein is restrained to its highly specific configuration by many weak secondary va- lences which can be destroyed by acid, alkali, or heat; structural modification ("denaturation") of the protein causes rupture of these bonds and hence a very large increase in entropy. A large entropy of activation for the heat modifica- tion process indicates that attainment of the activated complex was accom- panied by rupture of a high proportion of these bonds. Hence, if acid and alkali have spontaneously loosened the structure of the unheated protein by having destroyed certain of these secondary valences, the AS~ accompanying the activated complex required for heat modification to occur will be small, since much of the loosening of structure has occurred prior to formation of the activated complex. Since the AF~ of heat modification changes but little with pH, it follows from equation 4 that a reduction in AS:~ will be accompanied by a corresponding reduction in AH~.
According to the interfacial hypothesis, the unaltered enzyme possesses lower activity because it is in a structurally less specific state owing to its be- ing partially, but reversibly, unfolded at the interface in question, whereas the altered enzyme is in a more specific, and hence more active, state. It ought therefore to have been possible to predict that the rate of heat destruction of the altered enzyme would be more sensitive to change in temperature than that of the unaltered, leading to higher values of A//:~ and AS~ for the former reac- tion than for the latter; this "prediction" (which we must admit was made retroactively, therefore being more of a postdiction) is based on the assump- tion that there will be a relatively small difference between the AF~ values of the two reactions; i.e., compared to the difference in ABe.
Glasstone, Laidler, and Eyring (reference 6, p. 443) also discuss the reason that heat modification of the structure of proteins occurs at moderate tem- peratures despite the unusually high energies of activation characteristic of this process; e.g., in the case of ovalbumin, 132 kcal.). The large compensatory increases in entropy of activation which accompany the high A//~: values en-
Dow
nloaded from http://rupress.org/jgp/article-pdf/38/4/515/1241030/515.pdf by guest on 17 M
arch 2022

520 KINETIC STUDY OF YEAST CATALASE
sure a comparatively low AF:~, from which they conclude that "according to the theory of absolute reaction rates, the reaction will be rapid at ordinary temperatures, in spite of the high heat of activation." We have reported in Paper I that at temperatures between 50 and 56°C. the rate of heat inactiva- tion of the altered catalase is much greater than that of the unaltered enzyme. Hence it might be anticipated that this would be reflected in a significantly lower AF, for the heat inactivation of the altered catalase.
We must emphasize that we have undertaken this study in order to deter- mine whether kinetic data can shed light on the essentially biological problem of the structure and organization of an enzyme within the cell. We should like to make it clear that we consider this study to be a contribution neither to the exact measurement of catalase rate constants or turnover numbers nor to the mechanism of catalase action, since the work of Chance (9) has made such a pre-occupation unnecessary. One assumption which we have made in our work is that the activated complexes for enzymatic decomposition of sub- strate and for heat destruction of the enzyme are the same for both altered and unaltered enzymes.
EXPERIMENTAL
A. G~era/.--Methods of washing and handling yeast and of making extracts of yeast catalase have been described in Paper I. All yeast suspensions and enzyme and substrate solutions were made up in M/15 SSrensen's phosphate buffer at pH 7.1-7.2. In experiments on the effect of pH, phosphate buffer was also used; pH 4 was reached by adding a small amount of phosphoric acid, since it was felt that the disadvantage of reduced buffering capacity was outweighed by the advantage of not using a different buffer for this one point. Three methods of causing enzyme alteration were employed: chloroform and ultraviolet (UV) irradiation, described in Paper I, and n-propanol, described in Paper If. Activity measurements were made manometrically, unless otherwise specified, using apparatus and methods described in Paper I. In studies of the effect of temperature on the enzyme-catalyzed reaction, use was made of the American Instrument Company, Silver Spring, Maryland, refrigerated Warburg respirometer, not described in previous papers.
The crystalline beef liver catalase was obtained from the Worthington Labora- tories, Freehold, New Jersey. Final suhstrate concentration in the Warhurg vessels was 0.44 M, unless otherwise specified. In all our experiments, each manometric ac- tivity determination was done in duplicate.
B. Comparizen o] ManomeZeic and Titrknetric Mahods.--Since it had been re- ported that there existed large discrepancies between catalase activity constants de- termined manometrically and titrimetrically, (10), we decided to calculate turnover numbers from the rate constants determined by each of these two methods. Turnover numbers will be defined as the number of molecules of H20~ decomposed by 1 mole- cule of catalase in 1 second.
Our titrimetric method was adapted from the standard manganimetric procedure of von Euler and Josephson (11), the principal differences being that 2 ml. aliquots of
Dow
nloaded from http://rupress.org/jgp/article-pdf/38/4/515/1241030/515.pdf by guest on 17 M
arch 2022

M. J. ICRASER AND J. GORDIN KAPLAN 521
reaction mixture were withdrawn at 1 minute intervals and that the reaction mixtures were incubated at temperatures from 20-30°C., using the sensitive (~-0.01°C.) con- stant temperature bath and shaker described in Paper I . The purpose of these modifications was to permit comparison with an identical enzyme-substrate mixture run under closely similar conditions in the Warburg respirometer. In both cases, sub- strate was made up in •/20 phosphate buffer a t pH 7.2.
With both methods, the reaction mixture contained 2.5 × 10 -e gm. crystaUine catalase per ml., and was 0.044 g with respect to H~O~. Since 2 ml. of reaction mix- ture was analyzed in each case, the aliquots contained 5 × 10 -6 gm. catalase, or, as- suming a molecular weight of 225,000 for this protein,
5 X 10 -6 (gin.) X 6.023 X 10" (moh./mole) = 1.34 × 10 'a tools, catalase (11)
225,000 (gm./mole)
Using the titrimetric method, turnover numbers were calculated by making use of the first order equation
d[H~Ofl0 v6 = = k'[H~O~]0 (12)
dt
in which ~0 is the initial velocity of decomposition of substrate in moles H20~Aiter/ sec., and k" is the velocity constant, measured in sec. -I. Since the titrimetric first order velocity constants, K, were expressed as rain. -I and log10, it was necessary "to introduce the following conversion factor in order to use these constants:--
K(min_ 1) × 2.3 k' = = (13)
60(sec./min.)
The initial velocity of substrate decomposition is thus
2.3K ro ffi - - ~ X 0.044 =, 1.69 X I0 -s K moles H202/Hter/sec. (14)
or, to convert to molecules of substrate,
1.69 moles H~O~ × 2 ml. × 6.023 × 10²³ mols./mole X K = ( 1 5 )
Liter/sec. × 1000 ml./liter
= 2.03 × 10 is K mols. H20~/sec. (16)
We then obtain the titrimetric turnover number (T.N.,) by dividing this expression by Equation 11,
T.N., = 2.03 × 10 is K tools. H~O~/sec. = 1.51 X 10⁶ K tools. H202/mol. catalase/sec. (17) 1.34 X 10 '3 mols. csta]ase
The pseudo-zero order rate constants obtained manometrically have dimensions of /~l./min., so that these activity constants (A) must first be converted to moles O~/sec., by the following expression:~
A (~1. OJmin.) X 10 -6 (liter/~,l.) -- 7.44 X 10 -1° A moles O2/sec. (18)
60(sec./min.) X 22.4 (liter/mole)
Dow
nloaded from http://rupress.org/jgp/article-pdf/38/4/515/1241030/515.pdf by guest on 17 M
arch 2022

522 KINETIC STUDY O1 ~ YEAST CATALASE
From the stoichiometry of the decomposition of H20~,
2H202 = 2H20 ~ 02, (19)
it follows that expression 18 must be multiplied by 2 in order to convert to moles sub- strate broken down per second : -
Rate of H202 decomposition = 1.49 X 10 -9 A moles H20~/sec. (20)
Converting to molecules by multiplying by Avogadro's number, we obtain
Rate of H~O2 decomposition ffi 8.97 X 10¹⁴ A tools. H202/sec. (21)
and to obtain the corresponding turnover (T.N.,~) we divide this expression by Equa- tion 11,
8.97 X 10¹⁴ A mols. H20~/sec. T.N.,~ ffi
1.34 × 10 ~8 mols. catalase (22)
= 66.9 A mols. H202/mol. catalase/sec.
Thus, by substituting the appropriate rate constants into Equations 17 and 22, we obtain directly the corresponding turnover numbers for both titrimetric and manomet- ric methods.
C. Determination of Thermodynamic Constants of Enzyme-Substrate Systems.-- 1 ml. aliquots of altered and unaltered yeast cells, of yeast catalase extract, or of a suitably diluted crystalline catalase preparation (exact concentration given in Re- suits) were pipetted into the Warburg flasks, and run at temperatures from 5 to 40°C. at intervals of 5°C. Altered cells were generally run at a concentration of ~0 th per cent (wet weight/volume) and unaltered at X%oths per cent; it will be shown below that the effect of temperature on the rate of H~O2 breakdown was independent of concentration of enzyme (or of substrate).
The linear portions of the curves relating 02 produced to time permitted calcula- tion of pseudo-zero order velocity constants (dimensious-microliters/minute), whose logarithms could then be plotted against the reciprocal of the corresponding absolute temperatures in the Arrhenius plot. The experimental energy of activation was de- termined from the slope of this curve, and the other thermodynamic constants calcu- lated as described above.
I t was found that catalase activity of yeast suspensions, both altered and unaltered, was directly proportional to the concentration of the yeast (or, up to a certain point, of H~O~) at temperatures at either end of the range employed in these experiments. This fact permitted development of what we call the short method of determining experimental energies of activation, calculated from the slopes of (or from pairs of points along) the straight lines relating activity to enzyme concentration at two dif- ferent temperatures (5 and 25°C.). As will be seen below, values obtained by means of the short method were very close to those of the usual method, in which a standard yeast and substrate were run at 8 different temperatures.
D. Thermodynamic Constants of the Heat Inactivation Process.--50 ml. of yeast sus- pensions or of enzyme solutions contained in Erlenmeyer flasks were heated while being shaken at 60 c.1,.~, in the constant temperature bath described above; 4 ml.
Dow
nloaded from http://rupress.org/jgp/article-pdf/38/4/515/1241030/515.pdf by guest on 17 M
arch 2022

M. J. FRASER AND J. GORDIN KAPLAN 523
aliquots were withdrawn at intervals that varied with the temperature employed (from 15 minutes at lower temperatures to 1 minute at higher) and pipetted quickly into test tubes immersed in an ice bath. Usually 6 aliquots were withdrawn to deter- mine a rate of inactivation at any temperature, and these rates were determined in any experiment a t 8 temperatures at intervals of 1 or 2°C. Of course, preliminary ex- periments were necessary to establish for any given type of enzyme preparation the range within which the rate of inactivation could be measured with accuracy and con- venience. Attainment of temperature equilibrium within the Erlenmeyers occurred ( t o within 0.1°C. of bath temperature) in approximately 3 minutes; this would intro- duce a slight error a t the highest temperatures employed, when the final aliquots were withdrawn after from but 4 to 7 minutes' treatment. Unaltered cells were run at a concentration of l ~ 0 t h per cent, and altered at ~0 th per cent.
Heat inactivation of all catalases was found to follow the first order equation at all temperatures; hence a plot of log residual activity v e r s u s time gave a straight line whose slope was taken as the rate of inactivation. The log of these rates was then plotted against the reciprocal of the absolute temperature at which they were deter- mined, and the Arrhenins equation was found to be closely followed for all types of preparation. From the Arrhenius plot, the other thermodynamic constants were calcu- lated as described above. The lag period observed during heat pretreatment of unal- tered catalase was not included in calculations of the rate of inactivation. A problem was posed by the fact that there was no overlap of temperature ranges for the inacti- vation of unaltered on the one hand, and of altered, extracted, or crystalline enzymes on the other. In order to compare the free energies of activation of the various prepara- tions, it was necessary to calculate the AF:~ values at the same temperature for all, since this constant varies sufficiently with temperature to mask a small but significant difference between altered and unaltered enzymes. Consequently all AFS values were calculated using T' = 60°C. (333°K.) in Equation 4, even though AH~/and ASS may have been calculated at temperatures from 50 to 62°C. The reason for which this is justifiable is that AH S and ASS are relatively less temperature-sensitive; for example, ASS of the chloroform-altered cells at T = 50°C. is 340.6 entropy units (cal./deg./ mole) and at T = 60 ° is 341.1 e .u . The AF:~ values could also be calculated at T = 60 ° by taking the observed first order rate constants for heat inactivation at another temperature, and correcting them to 60 ° by means of Equation 1. These corrected rate constants were then substituted in Equation 10, thus obtaining AFS directly, without first having determined the ASS. The values of AF:~ obtained by this method were the same as those obtained with the quicker method discussed above (i.e., sub- stituting the uncorrected ASS and AH S values in Equation 4).
We should point out that the kinetic study of the heat inactivation process was a much more difficult affair than that of the activation of the enzyme-substrate system. For one thing, duplicate catalase assays of 6 aliquots at 8 temperatures involve an enormous amount of experimental work. Further, the first order rate constants for this process were more variable than for the enzyme-substrate system; consequently, the differences between the/~ values of the unaltered and of the altered and extracted catalases were somewhat less clear cut than they were found to be for the enzyme- substrate system. The same difficulty did not obtain in the case of ASS and AF:~.
Dow
nloaded from http://rupress.org/jgp/article-pdf/38/4/515/1241030/515.pdf by guest on 17 M
arch 2022

524 K I N E T I C STUDY OF YEAST CATALASE
E. StaM~tir.al Treatment.--We have found it essential to treat our data statistically, to be certain of their significance. We have used the t test (see Fisher and Yates 02)); whenever means are presented, the ± symbol will be a standard deviation, and when- ever differences between means, it will be the standard error of the difference between the means.
45 o
40
3.*
_Z
O
25
6' 20
'~"~ IS o >- I.-.
i - IC
5
0 t t t I I I O O.O8 O.IS 0.22 0,29 0 3 7 0 . 4 4
M O L A R C O N C E N T R A T I O N O F HzO z
FIG. 1. Variation of activity with substrate concentration at three rates of agita- tion (72 X, 100 X, and 120 X per minute) of reaction mixture: 2 cc. unaltered intra- cellular yeast catalase (0.03 per cent yeast and 0-0.44 M H20~). Each point represents the average of two measurements at 25.0°C.
RESULTS
A. Preliminary Experiments.--It was shown in Paper I tha t the critique of the manometric technique of catalase assay advanced by Beers and Sizer (13) was without either experimental or theoretical foundation. I n order to demon- strate tha t the pseudo-zero order rate constants obtained by our methods are, contrary to the claims of these authors, related to the laws of mass action governing the catalase H~O2 reaction, we have again studied the effect of sub- strate and enzyme concentration on these constants, as well as the rate of shak-
Dow
nloaded from http://rupress.org/jgp/article-pdf/38/4/515/1241030/515.pdf by guest on 17 M
arch 2022

M. J. ~RASER AND J. GORDIN KAPLAN 525
ing of the reaction vessels. Fig. 1 shows that our velocity constants were di- rectly proportional to substrate concentration, and, contrary to Beers and Sizer (13), independent of rate of shaking. Fig. 2 shows that our rate constants were directly proportional to enzyme concentration. The linearity, also re- ported in Paper I, of the curves relating manometric activity constants to enzyme and substrate concentrations shows that these constants, even if
180
160
; 4 0 / O
.~ t2o
- / o o / >
~"~ 6o o
- / i- >
,o o / /
0 t t t 1 t o 20 4o 6o 80 IOO
RELATIVE ENZYME CONCENTRATION(*/e) FIO. 2. Variation of activity with enzyme concentration at a rate of agitation of
120 X per minute. Reaction mixtures: 2 cc. of UV-altered intracellular yeast catalase (0-0.01 per cent yeast and 0.15 xt H20~) 25°C.
inexact, bear some definite relation to the mass action laws controlling the reaction between enzyme and substrate.
B. Comparison of Manometric and Titrimetric Methods.--Table I presents rate constants, turnover numbers and experimental energies of activation of the crystalline catalase-substrate system, determined manometrically and titrimetrically. I t will be noted that there is only a 21 per cent average dif- ference between turnover numbers obtained in these two ways, which is a very much smaller difference than that previously noted by Theorell and Ag-
Dow
nloaded from http://rupress.org/jgp/article-pdf/38/4/515/1241030/515.pdf by guest on 17 M
arch 2022

526 K I N E T I C STUDY OF YEAST CATALASE
ner (10). I t will be noted also that the # values are, within experimental error, the same by either method (standard deviations for this constant are given in Table I l l ) , since the per cent difference in turnover numbers (T.N.~/T.N.~ X 100) is unaffected by temperature within this range. However, the small temperature intervals in the two experiments (5 and 10 ° ) would of course make the # values quite inaccurate and would probably account for the 4 to 5 kcal. difference in the two experiments.
In view of the data of Table I, conclusions derived from use of manometric rate constants are not artifacts of the manometric technique. All data to be presented below were obtained manometrically, unless otherwise specified.
TABLE I Comparison of Manometric and Titrimetric Techniques
Experiment No.
Tcln- ~era- A ture
°C. ~d./min.
20 142 30 163
25 165 30 203
(T.N.),,
9.51 X 10⁴ 1.09 X 10⁴
1.11 X 10⁴ 1.36 )< 104
kcal./ mole
2.4
7.4
min.-~
0.080 0.099
0.088 0.111
K* gm. en-
zyme/co.
32,000 39,600
35,200 44,400
I
(T.N.)t
1.21 X 10⁴ 1.49 X 10⁴
1.33 X 10⁴ 1.68 X 10⁴
kml./ mo~
3.8
8.3
(T.N.)m (T.N.)t X 100
78.6 73.2
83.5 8 1 . 0
Average . . . . . . . . . . . . . . . . . . . . . . . . . . . . . . . . . . . . . . . . . . . . . . . . . . . . . . . . . . . . . . . . . . . 79.1
* By analogy to "Kat f."
C. Thermodynamic Constants of Enzyme-Substrate Systems.--Variation of catalase activity with temperature of the reaction mixture of a standard suspension of unaltered yeast is demonstrated in Fig. 3. After a short lag period of unknown significance, 2 all curves became linear, thus permitting calculation of pseudo-zero order activity constants. When log10 activity is plotted against 1/T°K. in the Arrhenius plot, we obtain the remarkably linear curves shown in Fig. 4. I t will be immediately obvious, from curve A, that the activity of the unaltered yeast catalase was much more sensitive to changes in temperature than was that of either B, altered or C, extracted yeast, or of D, crystalline liver, catalase. This means that the # value for the unaltered enzyme-substrate system was higher than that of the other systems studied; the magnitude of this difference is indicated on the figure.
In these Arrhenius plots, we have observed that the curve for the unaltered enzyme was linear through 40°C., whereas those for the altereff intracellular,
2 Dr. Britton Chance informs us that the lag period is unrelated to the degree of saturation of the reaction medium with 02.
Dow
nloaded from http://rupress.org/jgp/article-pdf/38/4/515/1241030/515.pdf by guest on 17 M
arch 2022

M. J. FRASER AND ~. GORDIN KAPLAN 527
extracted, and crystalline catalases were linear through 30 °, 25 °, and 20°C., respectively, above which temperatures they fell off the curve in the direction of lower activity, as illustrated in Fig. 4, curve C. This appears to be due to the greater sensitivity of the altered, extracted, and crystalline enzymes, to inactivation by H202, demonstrated in Paper I; if this be so, the inactivation of catalase by its substrate, here demonstrated, must be itself a temperature- sensitive process, as has been found by Williams (14).
3 ~
o / / / / o
-- OI o ~ n .
0 o.s uo ds 2:o 2:s 3.'0 3Ls 4:o s.6 TIME ('MI N.)
FIG. 3.02 evolution curves for unaltered intracellular yeast catalase (0.09 per cent yeast, with 0.44 M HsO2) from 5-40°C.
The # values thus obtained may now 15e substituted in Equation 3, in order to obtain the AS~, but a problem arises in the choice of the bimolecular rate constant, Y. Since, as will be shown below, the enzymatic properties of altered intracellular, extracted, and crystalline catalases do not differ significantly, we have adopted the same k" value for all, namely, 3.5 X 10⁷ liters mole-lsec. -1, a value which is the average of the Y values of Chance (15) for erythrocyte and of Chance and Herbert (16) for bacterial catalases, corrected to 0°C. on the basis of the/z value of 1410 cal./mole reported by Chance and Herbert (16).
The activity of the unaltered cells bore, at constant temperature, a constant ratio to that of the altered cells, as shown in Table II; the activity of the latter at 30°C. is seen to be 17 times that of the former, and by extrapolation of the Arrhenius plots, to be 26 times at 0°C. Another way in which the ratio of ac-
Dow
nloaded from http://rupress.org/jgp/article-pdf/38/4/515/1241030/515.pdf by guest on 17 M
arch 2022

528 KINETIC STUDY O~" YEAST CATALASE
~>I,8 >.
<o
I.;
A.UNALTERED,S~ 9 ,300 ~ o ~
4o" 3s" ,3o" 2s" 2o" ~s* ~o" s'c. I I I I I I I
I 1 ~ I I I I I I 3.,s 3.20 3.2s 3.3o 3.3s 3.4o 3~s 3~ss ' 3.50 3.60
I]T X I000 ~BS~'
Fzo. 4. Arrbenius curves of the enzyme-catalyzed decomposition of tt2Oz for un- altered (A) and altered (]3) intracellular yeast catalases, yeast catalase extract (C), and crystalline beef liver catalase (El).
TABLE II Ratio of Activities of Unaltered and Altered Yeact Catalase at Standard Yeast Cell Concentration
Activity of altered ¢~talsse + Activity of unaltered catalase
30oc. (observed), n - 7 0"C. (calculated)
17 .4 4- 3 . 2 26 .0 & 4 . 8
tivities at 0°C. may be calculated, is by making use of Equation 10. We may write, for the altered enzyme, A,
kT . e _ a r a ~ / R r k 'a -- -~- (23)
and for the unaltered enzyme, U,
k T .¢..Arv~lRr k"~ = T (24)
At 30°C. (303°K.) we know, from Table I I that
k"_._~A ffi= 17.4 = e (arv~-ar't~)11"osxa°8 (25)
from which it follows that
AFp:~ -- aFA~ = 1710 cal./mole. (26)
Dow
nloaded from http://rupress.org/jgp/article-pdf/38/4/515/1241030/515.pdf by guest on 17 M
arch 2022

M. J. YRASER AND J. GORDIN KAPLAI~ 529
Hence, at 0°C., (273°K.), it follows that
k"--~A ~" e '171011"08X275 ~ 24 (27) keg
assuming that AFrt~ - - AF,~: changes negligibly in this 30 ° range. This ratio agrees well with that determined graphically by extrapolation (Table II). Therefore, in order to obtain a value of kv at 0 °, we shall correct the bimolecu- lar rate constant used for the altered and extracted enzymes by the factor 1/26 (Table II). That the extent of the Euler effect may also be determined by the physiological state of the yeast cell is suggested by the work of Yamahnzi et al. (24).
On the basis of the 26-fold difference of k" for altered and unaltered en- zymes, we may calculate the AS:~ and z3aw~ values, as described above. The re- sults are summarized in Table III. I t wiU be remarked that the experimental energy, enthalpy, entropy, and free energy of activation of the unaltered en- zyme-substrate system are all significantly higher (in all but one case at the I per cent level) than the same constants for the altered, extracted, or crystalline enzyme-substrate systems. I t will be also remarked that these constants do not significantly differ (even at the I0 per cent level) among the latter three enzyme-substrate systems. Section B shows that all altering agents apparently alter the enzyme in the same way, at least as far as these thermodynamic con- stants are concerned. This confirms the evidence presented in Paper I, that crystalline liver catalase, and extracted yeast catalase behave in all respects like the intracelIular enzyme altered by any of the agents used, and that all of these catalases differ significantly from the yeast enzyme in si~u within the untreated ceil. That these data are consistent with the interracial hypothesis will be made clear in the Discussion.
We felt it necessary to recalculate AS~ and AF~ in order to see how they would vary if they were determined on the basis of a second order rate con- stant and/~ value obtained from our own experiments, rather than from those of Chance. We substitute in Equation 14 a titrimetric value of K, 0.080 rain.-*, obtained from Table I (T -- 20°C.), and a substrate concentration of 0.044 ~. We solve for v0 and obtain a value d 1.35 X I0 -'4 moles H~O~/liter/sec. The enzyme concentration used in this experiment was 2.5 X I0 -s gm./ml., or on the basis of a molecular weight of 225,000, 1.13 X I0 "-8 moles catalase/liter.
Since the initial velocity obviously depends also on the enzyme concentra- tion, a factor which was assumed to be constant in Equation 14, it is clear that the first order rate constant, K, actually must include this term:--
K ,. k"[E] (2S)
in which k" is the specific second order rate constant, and (E) is the concen- tration of enzyme. We may substitute this for K in Equation 14, to obtain
Vo = k"[E][Sl (29)
Dow
nloaded from http://rupress.org/jgp/article-pdf/38/4/515/1241030/515.pdf by guest on 17 M
arch 2022

530 KINETIC STUDY OF YEAST CATALASE
TABLE ]TI
Thermodynamic Constants for Catalase H20~ Reaction (pH ffi 7.2) Using Chance's (k")oo ffi 3.5 X 10⁷ Liter Mole --x Sec. -x
Starred values obtained by short method.
kcal./mole kcal./mole
A. Unaltered intracellular yeast catalase
+12 .1 + 1 1 . 6 8.2 7.7 9.3 8.8 9.2 8.7 9.4 8.9 9.2* 8.7 7.6* 7.1 7.8" 7.3 8.0* 7.5
as~ aF~
e.u. kcal./mole
+12 .3 - -2 .0 + 2 . 0 + 1 . 7 + 2 . 4 + 1 . 6 --4.2 - -3 .5 - -2 .8
+8.2 8.2 8.3 8.2 8.2 8.3 8.2 8.2 8.3
+ 9 . 0 4- 1.4 + 8 . 5 4- 1.4 + 0 . 8 -4-- 5 .0 + 8 . 2 4- 0.1
B. n-Propanol altered inlracellular yeast catalase
+ 4 . 6 5.2 7.2 5.4 4 .6 5.3" 3.3" 3 .1" 3.5* 2.3*
+ 4 . 1 4.7 6.7 4.9 4.1 4.8 2.8 2.6 3.0 1.8
- 8 . 7 - 6 . 5 + 0 . 8 - 5 . 8 - 8 . 7 - 6 . 2
- 1 3 . 5 - 1 4 . 2 - 1 2 . 7 - 1 7 . 1
+ 6 . 5 6.5 6.5 6.5 6.5 6.5 6.5 6.5 6.5 6.5
+ 4 . 5 -I- 1.4 + 4 . 0 4- 1.4 --9.3 4- 5.2 + 6 . 5 -4- 0 .0
B'. Chloroform altered intracellular yea~l, catalase
+3 .4* ] + 2 . 9 ] --13.1 + 6 . 5
B L U v ligM-oltered intracellular yeast catalase
+ 3 . 7 * + 3 . 2 ] --10.2 + 6 . 5 I
C. Yeaxt catalase extract
+ 4 . 5 + 4 . 0 2.9 2.4 4.1 3.6
+ 3 . 8 -4- 1.3 + 3 . 3 q- 1.3
--10.6 --17.3 --12.3
--13.4 -4- 3.5
+ 6 . 9 7.1 7.0
+ 7 . 0 -;- 0.I
Dow
nloaded from http://rupress.org/jgp/article-pdf/38/4/515/1241030/515.pdf by guest on 17 M
arch 2022

M. J, ~'RASER AND J'. GORDIN XAPLAN
TABLE ll~--Conclud~
531
t, ~ t ~St ag~
kgal./mMe kcal./mgle e.~t. kcal.lmole
D. Beef liver catalase
+4.7 +4.2 --9.7 +6.8 5.1 4.6 --8.0 6.8 1.8 1.3 - -22.0 7.3
+3.9 4- 1.8 +3.4 4- 1.8 --13.2 + 7.6 +7.0 + 0.3
Differences between the means
A - B +4.5 4- 0.7 (P < 0.01)
A-C +5.2 4- i.o (P < 0.01)
A - D +5.1 4- 1.3 (P < 0.01)
B-C +0.7 4- 0.9 (P > o. 1)
B-D + 0 . 6 4- 1.2 (P > o. 1)
+4.5 4- 0.7 (P < 0.01)
+5.2 4- 1.o (P < 0.01)
+5.1 4- 1.3 (P < 0.01)
+0.7 4- 0.9 (P > o. 1)
+ 0 . 6 4- 1.2 (P > 0. I)
+1o.1 4- 2.4 (P < O.Ol)
+14.2 4- 2.7 (P < o.oi)
+14.0 -4- 5.1 (P < 0.05)
+ 4 . 1 4- 2.7 (P > O. I)
+ 3 . 9 -4- 4.9 (P > o. i)
+1.7 4- 0.02 (e < o.oi)
+1.2 -4- 0.06 (P < o.oi)
+1.2 4- 0.2 (P < 0.01)
-0 .5 4- 0.3 (P > o. i)
-0 .5 4- O.3 (P > 0.1)
Rearranging, and solving for k" by substituting the known values of v0, (E) and (S), we obtain
1.35 X 10 -~4 moles H~O2 liter-' sec. -~ kt/200 .~. 1.13 × 10 -8 moles catalase liter' X 0.044 moles H,O2 liter -~ (30)
= 2.7 X 10⁵ liter moles catalase -~ sect ~
This value of k" may be corrected to 0°C., by substituting in Equation 1 a value of tt (3,900 cal./mole) found in Table I I I , section D, yielding k"0 ° = 1.7 × 10⁵ liter/mole enzyme/sec. The two thermodynamic constants recalcu- lated substituting this value of k" in the Eyring equation are presented in Table IV. Again, the unaltered enzyme is seen to be different from the altered, ex- tracted, and crystalline forms; the AF~ values for these enzyme-substrate systems are all approximately 3 kcal./mole higher and the AS~: values about 10 e.u. lower, than those calculated using Chance's velocity constant.
I t will be noted from Equations 25 and 26, that it is possible to calculate the difference in AF:~ between altered and unaltered enzyme-substrate systems, given only the ratio of their activity, determined manometrically, at constant temperature. The difference thus obtained is indistinguishable from that
Dow
nloaded from http://rupress.org/jgp/article-pdf/38/4/515/1241030/515.pdf by guest on 17 M
arch 2022

532 KINETIC STUDY OF YEAST CATALASE
obtained by substituting Chance's second order rate constant (and ~ 6 t h this value for unaltered enzyme) into the Eyring equation, then calculating the AFv* and AFa,, and subtracting to obtain the difference; when done this way, AFRO; - - AFa;~ = 1700 cal./mole (Table I I I ) . From the Arrhenius plot, we have obtained the difference in g between altered and unaltered systems, and we may thus calculate the difference in AH, (A~,) which, from Table I I I , is 4500 cal./mole. Given this, and the known difference in &F, (Aaet), we may
TABLE IV Thermodynamic Constants for Catalase H202 Reaction Calculated Using (k")o • = 1.7 X 10 u
Liter mole -1 Sec. -1
CatMase preparation AS:~ AF*
A. Unaltered intracellular yeast catalase
B. Altered intracellular yeast catalase
C. Yeast catalase extract
D. Crystalline beef liver catalase
E. Crystalline beef liver catalase, Sizer* (18)
- 9 . 5 -4- 5 .6
- -21 .4 4- 6.1
- -24 .0 4- 3 .5
- -23 .9 4- 9 .6
- -22 .5
kcal./mole
+11.1 -4- 0.2
+ 9 . 8 4- 0 . 2
+ 9 . 9 -4- 0 .1
-4-10.0 4- 0.2
+ 9 . 8
* Statistical treatment and sample size not given; value of AFt in table calculated from /~ = 4.2 kcal./mole and AH:~ ffi +3.7 kcal./mole.
calculate directly the difference in entropy of activation of altered and unal- tered enzyme-substrate systems (Aas,) from the equation
A~, -- A~, - TAns, (31)
At 0°C.,
1710 cal . /mole = 4500 cal . /mole -- 273°K. (A~s,) (32)
from which we may calculate A~s, directly as 10.2 cal. mole -1 deg. -1. The difference obtained by actually subtracting the measured values of Asia from those of Astv was 10.1 cal. mole -1 deg. -1 (Table I I I ) .
D. Ef fec t o f E n z y m e and Substrate Concentrat ions on ~ . - - I t was at this point necessary to demonstrate that the thermodynamic constants, as well as the differences between them, were valid generally, and not simply for the condi- tions of enzyme and substrate concentrations obtaining thus far in our ex- periments. I t was shown in Figs. 1 and 2 that at constant temperature the relation between activity and enzyme or substrate concentrations is linear. If these relations remain linear at the other end of the temperature range used in these studies, it follows that t~ would be independent of enzyme and
Dow
nloaded from http://rupress.org/jgp/article-pdf/38/4/515/1241030/515.pdf by guest on 17 M
arch 2022

M. J. FRASER AND J. GORDIN KAPLAN 533
substrate concentrations, since the same/z value would be obtained by com- paring points anywhere along two lines coming from the origin of a graph re- lating activity to enzyme (or substrate) concentration at two different tem- peratures.
Fig. 5 represents the variation in catalase activity of altered and unaltered cells as a function of enzyme concentration, at 5 and 25°C. The curves are linear at both temperatures, showing that the energies of activation are in- dependent of the concentration of cells, at least within the range examined. As explained above, the slope of these curves may be used to calculate/z from
z
A.ONA'TE EO
w
I-
I- U
0 I0 20 30 40 50 60 70 80 90 I00 RELATIVE ENZYME CONCENTRATION~/o')
FzG. 5. Variation of activity with enzyme concentration at 5 and 25°C. A. Unal- tered intracellular yeast catalase (0-0.18 per cent yeast, 0.44 x¢ H20~). B. Altered intraceUular yeast catalase (0-0.01 yeast, 0.44 ~ H~Og). A curves give ~a - 3,300 cal./mole, B curves give ~UN = 7,600 cal./mole.
Equation 1. The/z values calculated by this short method have been presented, starred, in Table III, and are not statistically distinguishable from the values obtained by the longer method, in which a standard cell suspension is subjected to 6 or 8 different temperatures.
Fig. 6 shows the effect of substrate concentration on the activity of yeast suspensions at 5 and 25°C. From part A, it is noted that there is, for the un- altered enzyme, a linear relation between activity and substrate concentration throughout the range examined, at both temperatures, giving a /z value of 7,800 cal./mole, a value only slightly lower than those obtained by the long method (Table III). Part B, the propanol-altered catalase, shows a linear relation between activity and substrate concentration up to 0.13 M, above
Dow
nloaded from http://rupress.org/jgp/article-pdf/38/4/515/1241030/515.pdf by guest on 17 M
arch 2022
534 KINETIC STUDY OF YEAST CATALASE
which the curves fall off the line at both temperatures. Below 0.13 ~x, the ac- tivation energy for the altered enzyme-substrate system, calculated from the slopes, is 3.1 kcal.; above this concentration, the tt values calculated for 0.145 ~, 0.295 ~, and 0.44 x¢ H202 are respectively 3.3, 4.2, and 3.5 kcal./mole. Since the mean value of tt in Table I I I (which does not include data from ex-
40¢
= . f A. UNALTERED
> Kx~
o
,~ B. ALTERED / / / /
I -
I .,4~ / o . - ' - " ~ S °
0 0 0 9 0.18 0.26 0.35 0.44
MOLAR CONCENTRATION H202
FIG. 6. A. Variation of activity with substrate concentration at 5 and 25°C. for unaltered intracellular yeast catalase (0.18 per cent yeast, 0-0.44 ~ H202). Curves give/z = 7,800 cal./mole. B. Variation of activity with substrate concentration at 5 and 25°C. for n-propanol-altered intraceUular yeast catalase (0.01 per cent yeast). Linear portions of curves give/z = 3,100 cal./mole; points at 0.15, 0.29, and 0.44 H,O2 give g values of 3,300, 4200, and 3,500 cal./mole respectively.
periments in which substrate concentration was varied) was 4.5 -4- 1.4 kcal./ mole, it appears that activation energies do not change with varying concen- tration of H202, even though the activity of these altered preparations deviates from linearity at higher substrate concentrations. As opposed to the tempera- ture-sensitive substrate-induced inactivation of catalase demonstrated in section B above, the inactivation of catalase by H202 shown in Fig. 6 is not
temperature-sensitive, since tt values are the same all along these curves. The evidence suggests, but does not establish, identification of these two distinct
Dow
nloaded from http://rupress.org/jgp/article-pdf/38/4/515/1241030/515.pdf by guest on 17 M
arch 2022

M. J. ~'RASER AND J. GORDIN KAPLAN 535
types of H,O,-induced inactivation of catalase with the formation of the two inactive enzyme-substrate complexes (one reversible, one irreversible), in the reaction mechanism of Chance (9).
Fig. 6, B, shows that at 0.44 ~, the concentration of substrate used in de- termination of thermodynamic constants, the activity of the altered enzyme has decreased by about one-third from the expected value (i.e., if there were no inhibition by substrate); at this concentration, there was no inhibition of the unaltered enzyme. Hence, the observed difference in activity of altered and unaltered enzymes would have been larger had we worked at lower substrate concentrations, and this would have had the effect of exaggerating the dif- ferences between ASS and AF:~ values of altered and unaltered enzyme-sub- strate systems. For example, the &APt would have been approximately 2100 cal./mole, instead of the 1700 cal. reported in Table III .
E. Effect of pH on Thermodynamic Constants of Emyme-Substrate Systems.- I t was reported in Paper I that altered and unaltered enzymes respond dif- ferently to change in pH, and that cells, in which the catalase has been fully altered, have been killed by the alteration process.* Since the pH of the living yeast cell is given as 5.8 (Conway and O'Malley (17)), it seemed possible that some of the changes in enzyme properties following alteration might be due to an increase in the effective pH of the intracellular enzyme, as the dead cell comes into equilibrium with the medium, buffered at pH 7.2. This hypothesis was tested by performing four experiments in which activity of altered and unaltered suspensions, of different concentration, were determined at two temperatures and at varying pH; this permitted determination of ~ values by the short method, and, from these, calculation of the other constants. The re- sults of a typical experiment are presented in Table V.
Section A reveals that the activity and the thermodynamic constants of the unaltered catalase do not change within the pH range examined (5.3-8.0). On the other hand, the activity of the altered enzyme diminished appreciably at pH 6.0 and at this pH there is a rise in the AH~;. There is also a compensa- tory rise in the AS$, with the result that, even at pH 4.0, where the AH:~ has risen to within the usual range for the unaltered enzyme-substrate system, there has been only a slight change in the AFt. We may conclude that it is
a Although cells in which enzyme alteration is complete are dead cells (as deter- mined by inability to grow on nutrient medium), cells killed by heat (Paper I) possess a catalase of unchanged kinetic properties, as do cells killed by a brief exposure to UV (unpublished data). Further, it was shown in Paper II that alteration and killing by n-butanol were unrelated processes. Hence the kinetic changes in eatalase caused by altering agents do not follow simply from the death of the cell. Indeed, the un- altered cells in the heat inactivation studies (section F following) were probably dead, since 30 minutes at 56°C. i.e. 2°C. below the_range used in the present studies, was sufficient to cause almost complete sterilization of a yeast population (Paper I).
Dow
nloaded from http://rupress.org/jgp/article-pdf/38/4/515/1241030/515.pdf by guest on 17 M
arch 2022

536 KINETIC STUDY OF YEAST CATALASE
possible that some, but not all, of the changes in kinetic properties of the catalase-substrate system which accompany enzyme alteration may be due to a rise in the intracellular pH. This point will be discussed below.
F. Thermodynamic Constants for the Heat Destruction Process.--Preheating the various enzyme preparations caused an irreversible loss in catalase ac- tivity when this was subsequently assayed at 30°C. Fig. 7 shows the effect of heating for 0 to 10 minutes an unaltered cell suspension while shaking at 63°C.; during this 10 minute period, there has been more than a 6-fold reduc-
TABLE V Effect of pH on Thermodynami, Constangs for the Enzyme Catalyzed Reaction
Activities of unaltered intracellular yeast catalase measured with 0.18 per cent yeast and 0.44 g H~O~, and of altered intracellular yeast catalase with 0.01 per cent yeast and 0.44 H~O2, the latter being corrected for this 18-fold dilution of cells.
iActivity at 5°C. pH
[--~./m-~.n. kval./mole
A. Unaltered intracellular yeast catalase 5.3 111 +7.8 6.0 115 +8.2 7.1 106 +7.6 8.0 103 +8.0
attt . ~ t
keal./mole e.~t. kcaL/mole
+7.3 7.7 7.1 7.5
--3.9 --2.0 --4.2 - -2 .8
+ 8 . 4 8.2 8.2 8.2
B. n-Propand altered intracellular yeast catalase
4.0* 582 +9.8 5.3 1197 7.1 6.0 1782 5.0 7.1 2070 3.3 8.0 2133 3.5
+9.3 6.6 4.5 2.8 3.0
+7.8 +0.4 -9 .2
-13.5 -12.7
+7.2 6.5 6.5 6.5 6.5
* kn0 o value corrected for lowered activity in calculation of ASS and AFS values. In other cases small variation makes this correction unnecessary.
tion in activity. Within the temperature range chosen for any given catalase preparation (intra- or extracellular) the inactivation takes place very slowly at the lower end of the range, and very rapidly 7 or 8 ° higher. When log10 residual activity is plotted against time, a series of straight lines is obtained, showing that the heat destruction is a first order process. Fig. 8 presents such a plot for the destruction of the unaltered, intracellular enzyme. In the case of the unaltered catalase, one invariably observes a marked lag phase, during which there is often remarked a slight increase in activity; the duration of the lag phase varies inversely with temperature. Following the lag, the diminution of activity is seen to follow a first order course. In the case of the altered intra- cellular enzyme, or of the extracted and crystalline catalases, such a lag period has never been observed by us; as shown in Fig. 9, the heat destruction process
Dow
nloaded from http://rupress.org/jgp/article-pdf/38/4/515/1241030/515.pdf by guest on 17 M
arch 2022

M . J. ] ? R A S E R Al~D J. GORDIN KAPLAN 537
- - /
, ,
OMIN.
/ o/°
O I 2 3 TIME (MIN.)
I I 4
Fxo. 7. O= evolution curves for unaltered intracellular yeast eatalase (0.18 per cent yeast tested at 30°C. with 0.44 ~ H202) heated at 63°C. for 0, 2, 4, 6, 8, and 10 min- utes, giving activities of 385, 277, 215, 167, 87 and 61 gl. O2/minute.
i f RATES OF INACTIVATION 58"C. 0,0495 MIN', ~ 62°C. O.162 MIN~ 60% 0,0743 " 63 °" O.218 - 61 °- 0.103 ,, 65% 0.426 .
66". o.82s ,,
6.5 63" 62" 61" 60"
0 5 I0 15 20 25 30 35 40 45 50 TIME OF HEATING (MIN.)
FIG. 8. Heat inactivation curves for unaltered, intracellular catalase (0.36 per cent yeast), heated in the range 58-66°C. The 60 ° curve is shown in greater detail to illus- trate the lag phase. Each point is the average of two activity determinations.
follows a strict first order course from the beginning of the heating of the preparation.
Dow
nloaded from http://rupress.org/jgp/article-pdf/38/4/515/1241030/515.pdf by guest on 17 M
arch 2022

538 KINETIC STUDY OF YEAST CATALASE
The slopes of these first order curves are a measure of the rate of heat destruc- tion at the temperature at which they were measured, and may be used for the Arrhenius treatment. Typical curves are plotted in Fig. 10: all curves are linear, showing that the rates of heat destruction of unaltered and altered intracellular, catalase, and of extracted yeast and crystalline liver catalases vary logarithmically with temperature according to the Arrhenius equation. The temperature range within which inactivation is conveniently measurable is strikingly different for the unaltered (58-66°C.) than for the other prepara- tions (ca. 45-55°C.), confirming the evidence in Paper I. Experimental ac-
22
\ \ ~c.o.9c2~ M,a- ' S2:C.O.O3S4 M,~ -~O.S \ \ ~C.9.0.0~ S3=C.O.OSgO II II
\ \ sq~c.o_.o_!2Z " s_4_:c.o. ,o9 ,, X 5 r C 0 . 0 1 4 0 " S5"C.O. 174 "
o o ~ ,b ,'s ~o 2's ~o ~s 4b Zs s~ TIME OF HEATING (MIN . )
FIG. 9. Heat inactivation curves for n-propanol-altered, intracellular catalase (0.02 per cent yeast) heated in the range 47-55°C. Each point is the average of two activity determinations.
tivation energies were calculated from the slopes of these curves, and the other thermodynamic constants calculated from #, using an experimentally determined value of k' (loge and seconds -1) to substitute in the Eyring equa- tion.
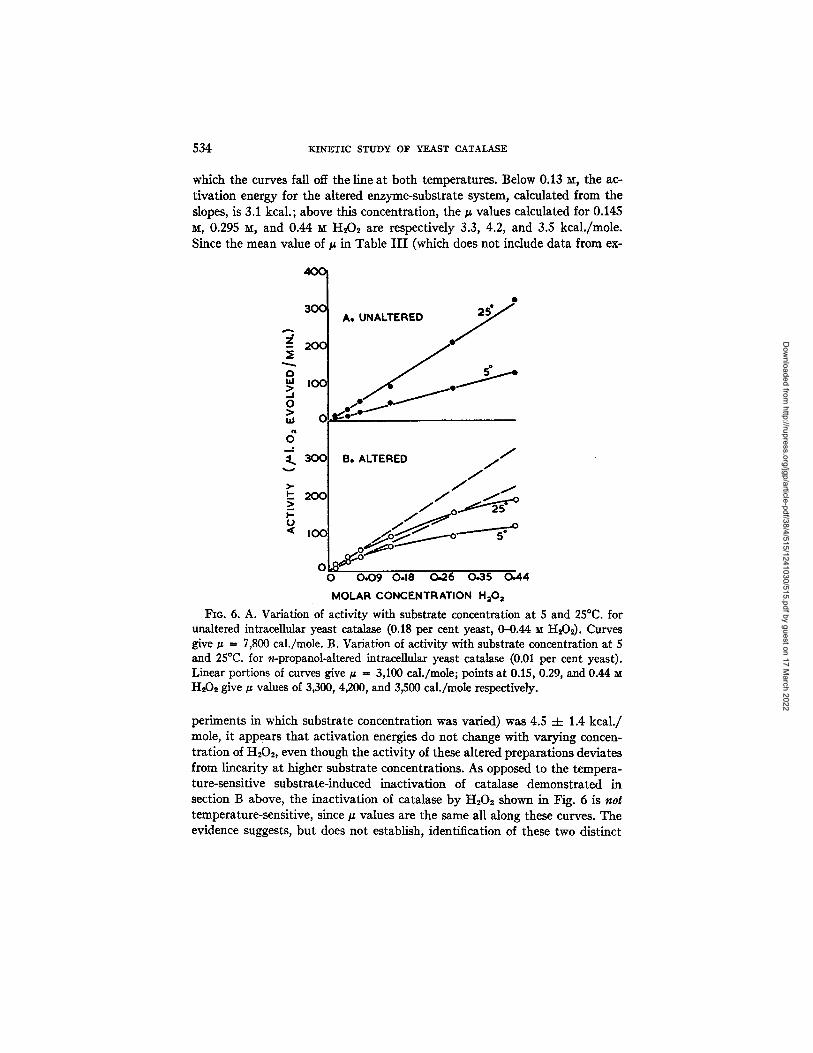
These data have been collected in Table VI. The mean # and AH$ for the unaltered catalase are 20.6 kcal./mole lower than those for the altered, but the difference between the means is not quite significant at the 5 per cent level (p = 0.1). However, when the method of paired comparisons is used, in which unaltered and altered values were paired in chronological order, as presented in Table VI (including two altered-unaltered pairs, actually run as controls for each other), the average difference between the individual paired values of/~ (#0 -- /~) is --22.2 =t= 9.6, (in which 9.6 is the standard error of
Dow
nloaded from http://rupress.org/jgp/article-pdf/38/4/515/1241030/515.pdf by guest on 17 M
arch 2022

M. .T. FRASER AND S. GORDIN J~PLAN 539
the difference) which is significant at the 5 per cent level. The reason for which the difference in this constant for altered and unaltered catalases is less sig- nificant than that in the case of ASS and AFS, is the large scatter in g values of the unaltered enzyme.
Despite the fact that there is overlap in the ASS, the 70 e.u. difference be- tween the mean values for altered and unaltered is significant at the 1 per cent level: there is a greater entropy increase upon activating the heat destruction of the altered enzyme than occurs upon activating the destruction of the un-
5 o A. UNALTEP, E D t ~ = 8 3 , 4 0 0 • B. C3H~OH ALTERED: # = 9 8 , 9 0 0 o C . UV ALTERED, ~ = I I I tOOO
4 x Do HCCI~ A L T E R E D : p = 120 ,OOO • F.. CRYSTALLI N E" ~ = 92a5OO
_ ' x ' ~ o Fo E X T R A C T t ~ = I O 6 , O O O
-o o
o g '
O
65 • 6 o ° 55 ° s o + 4 5 ° 4oOc , I ! l I I I I I , I , 2.93 2.96 2.99 3J::)2 ~ 8 Ill ~ ~ 4 ' ' 3.O5 3.17 3.20
YT x Iooo "ABS:' FIG. 10. Arrhenius curves for the heat inactivation of: A, unaltered, intracellular
yeast catalase (58--66°C.); B, n-propanol-altered intracellular yeast catalase (47- 55°C.); C, UV-altered intracellular yeast catalase (47-55°C.); D, chloroform-altered intracellular yeast catalase (47-55°C.); E, crystalline beef liver catalase (45-52°C.); F, extracted yeast catalase (43-51°C).
altered enzyme. On the other hand, there is no overlap in the AFS values, those for the unaltered catalase being 2.8 :t= 0.3 kcal./mole higher than for the al- tered, intraceUular enzyme; this difference is also significant at the 1 per cent level. All our AF S values for the various enzyme preparations, were between 21 and 24 kcal./mole, which are within the narrow range characteristic of the free energy of activation of the heat modification of protein structure and of the heat inactivation of enzymes (see reference 6).
We attempted to study the effect of pH on the thermodynamic constants of the heat inactivation process, but did only two complete experiments, owing to the enormous amount of experimental work involved. While the paucity of data precluded statistical treatment of the results and makes it impossible for
Dow
nloaded from http://rupress.org/jgp/article-pdf/38/4/515/1241030/515.pdf by guest on 17 M
arch 2022
540 K I N E T I C STUDY OF YEAST CATALASE
TABLE VI Thermodynamic Constants for the Hea~ Inactivation of Calalases
Except when indicated AF~ values are calculated at 60°C. ~ r ~ and AS~ values of A calculated at 62 °, of B st 52 °, and of C and D at 50°C.
I
kcal./mole ] kcal./mole e.u. kcal./raote A. Unaltered inlracdlular yeast catclase
+70.8 64.4 75.9
103.0 121.9 120.5 111.3
+70.1 63.7 75.2
102.3 121.2 119.8 110.7
+140 122 156 236 293 288 261
+23.5 23.1 23.3 23.7 23.6 23.9 23.8
+95.4 4- 24.5 +94.7 4- 24.5 +214 4- 73 +23.6 -4- 0.3
B. Altered inlracdlular yeast calalase Alteration by n-propanol
+98.9 +98.3 104.0 103.4 121.4 120.8 131.6 131.0
Alteration by chloroform 134.0 [ 133.4 120.0 [ 119.4
Alteration by ultraviolet light 111.0 110.4 107.0 106.4
+116.0 4-4- 12.8 +115.3 4- 12.8
+231 247 298 329
341 298
270 259
+284 -4-
+21.4 21.1 21.6 21.4
19.8 20.2
20.5 20.2
39 +20.8 -4- 0.7
C. Feast catalase extract +99.4 106.0 120.0
+98.7 105.3 119.3
+236 254 296
20.1 20.7 20.7
D. Cryst¢lline beef liver catalase +92.5 ] +91.8
88.3 I 87.6 I +214 l +20.5
201 20.7
E. CrysSalline beef liver ca4alase (Sizer) Below 62°C. +55.0 r 54-3" I Above 62°C. +255.0 254.3*
+90 +290
+24.2* +23.2*
F. Differences between the means A-B
--20.6 .4- 10.6 --20.6 4- 10.6 (P <0.1) (P <0.I)
- 70 4-4- 3O (P < o.oi)
2.8 4- O.3 (P + O.Ol)
* Calculated by us for T •ffi 62°C.
Dow
nloaded from http://rupress.org/jgp/article-pdf/38/4/515/1241030/515.pdf by guest on 17 M
arch 2022

M. ~. FRASER AND J. GORDIN KAPLAN 541
us to regard these data as definitive, the results of the two experiments were in qualitative agreement, and one of them is presented in Table VH. It will be noted, from section A, that the constants for the unaltered enzyme appeared to be invariant in the range pH 5.3-8.0, whereas, from section B, there seemed to be at pH 5.3 a large decrease in/~ and, of course, AHS, which, since the AFS remained constant, caused a large compensatory decrease in AS:~. Thus, at low pH the AHS and ASS of the altered enzyme were not different from those of the unaltered, whereas the AF$ continued to be below the range charac- teristic of the unaltered enzyme. The altered enzyme thus appeared to possess a maximum energy of activation for the heat destruction process at the pH of maximum activity (see Table V) and of minimum g for the enzyme-substrate
TABLE VII Effect of pH on Thermodynamic Constants for the Hea~ Inactivation of Catalases
All AF$ values calculated at 60°C, AH$ and ASS values calculated at 62 ° in A, at 52 ° in B.
°" " I kcal./mole
A. Unaltered intracdlular yeast catalase
5.3 +98.9 I 7.1 110.4 8.0 95.5
kcal./n~te
+98.2 109.7 95.9
+226 257 217
kcal./mole
+22.9 24.1 23,6
B. n-Propanol altered intravdlular yeast catalase
5.3 +94.3 t 93.6 7.1 131.6 I 131.0
+217 329
+21.3 21.4
system; this is exactly what one would expect on the basis of the treatment of Glasstone et al., discussed above in the Theoretical section.
DISCUSSION
There can be no doubt that the phenomenon of enzyme alteration, demon- strated in Paper I, has been unequivocally confirmed in this paper, in which highly significant differences in the kinetics of intracellular catalase, before and after treatment of the cells with the altering agents CHCI~, UV, and C3H~OH, have been observed. We must now see to what extent these dif- ferences are consistent with the interracial hypothesis of enzyme alteration, which states that the enzyme within the intact, unaltered cell is in a struc- turally less specific, partially unfolded condition and that following desorption, it is converted to the more specific, more active, altered configuration. The basis of interpretation of these differences in thermodynamic constants has been presented in the Theoretical section; much of what follows will be specu- lation.
Dow
nloaded from http://rupress.org/jgp/article-pdf/38/4/515/1241030/515.pdf by guest on 17 M
arch 2022

542 K I N E T I C STUDY OF YEAST CATALASE
As a result of the lack of significant difference in any of the kinetic proper- ties among altered intracellular, extracted yeast and crystalline liver cata- lases, our data have confirmed the evidence presented in Paper I showing that the extracted and crystalline enzymes have also undergone enzyme al- teration, and are in a state identical with, or very similar to, that of the al- tered intracellular catalase. We shall therefore consider the term "altered" to embrace the extracted and the crystalline catalases, as well.
The essential facts, with respect to the enzyme-substrate systems will now be enumerated: (a) the activity of the altered enzyme is greater by more than an order of magnitude than that of the unaltered; (b) the energy of activation of the altered enzyme is lower; (c) the entropy of activation of the altered en- zyme has a comparatively large negative value, by contrast to the unaltered; (d) the free energy of activation of the altered enzyme-substrate system is lower than that of the unaltered.
(a) The activity of an enzyme should be a measure of its structural spe- cificity. The low activity of the unaltered enzyme is consistent with its exist- ence within the cell in a partially unfolded condition.
(b) The more efficient the catalyst, the lower the energy of activation re- quired to activate decomposition of its substrate, or to put it operationally, the less should the rate of its action vary with temperature. The #, AH$ values for the altered enzyme have been shown to fulfill this expectation.
(c) Sizer (18) has shown that the ASS of the crystalline catalase-substrate system is a negative quantity (with reference to the standard state used by him and by us); he has interpreted this finding, plausibly, as indicating an in- crease in order upon formation of the activated enzyme-substrate complex. We have found that the more active, altered enzyme reduces its entropy on formation of the activated complex by about 10 e.u. more than does the un- altered; it was possible to calculate this, knowing only the differences in ac- tivity and in # value between altered and unaltered enzyme-substrate systems.
(d) At any given temperature, the more rapid the reaction, the lower the free energy of its activation. The significantly lower (approximately 1.5 kcal./mole) AF S of the altered enzyme-substrate system probably accounts for its much greater activity; i.e., point (a).
The essential changes in the kinetics of heat destruction of catalase which follow alteration will also be enumerated: (A) the altered enzyme is rapidly destroyed by treatment at temperatures and durations to which the unaltered catalase is quite indifferent. (B) The # and AHJ; for this process have been found to be higher for the altered enzyme. (C) The ASS was also considerably higher for the altered enzyme. (D) On the other hand, the AF S was lower after alteration.
A. The relative stability of the unaltered enzyme to heat, and the rather long lag periods before appreciable heat destruction commences, might be
Dow
nloaded from http://rupress.org/jgp/article-pdf/38/4/515/1241030/515.pdf by guest on 17 M
arch 2022

~. ~. FRASER AND J. GORDIN KAPLAN 543
imagined as being due to the many weak linkages which hold the catalase ad- sorbed to its intracellular interface. The altered, desorbed enzyme would not be protected in this way.
B. The interfacially bound protein is already partially opened up within the cell, whereas the soluble, altered enzyme possesses certain weak valence forces which confer upon it its high degree of specificity. Hence, the energy required to activate the destruction of the former by heat should be lower than that re- quired for the latter, since these extra bonds must be destroyed. This is con- sistent with the observed 21 kcal./mole increase in/t and AH~, following altera- tion.
C. If alteration causes only a relatively small change in AF~ of heat destruc- tion (which is what we should anticipate, given the very narrow range of AF$ values for a wide variety of proteins (6)), the increase in AH~: following altera- tion should be accompanied by a compensatory increase in ASS. In terms of the interfacial hypothesis, the increase in entropy, which occurs upon forma- tion of the activated complex for the unaltered catalase, is low since the protein, partially extended at the interface, is already in a relatively disordered, less specifiable state. Thus the 70 e.u. increase in the AS;~ of the altered enzyme is consistent with this hypothesis.
D. The rate of heat destruction at any temperature should be determined by the magnitude of the free energy of activation of this process. The relative in- stability to heat of the altered enzyme must be, at least partially, due to the 3 kcal. decrease in AF$ of heat destruction, which accompanied alteration.
Certain of the changes in activity and thermodynamic constants which occur after alteration could be accounted for if the enzyme existed within the cell in equilibrium with a medium of very low pH (e.g., pH 4.0). It was shown in Paper I that at this pH, the activity of altered catalase was but approxi- mately l~5th that of the same enzyme at pH 7 (although from Table V it is seen that, in these experiments, activity at pH 4 was approximately ~ t h that at pH 7). Similarly, we have shown above that energies and entropies of ac- tivation (of both processes studied) for the altered enzyme, change at low pH in a direction and magnitude so as to resemble the unaltered enzyme. Accord- ing to the pH hypothesis, alteration consists in changing the effective pH of intracellular catalase from 4.0 to that of the external medium (in this case, pH 7.2), thus activating the enzyme and changing certain of its kinetic proper- ties. It is apparent that many of the changes in properties and kinetics follow- ing alteration cannot be explained in this manner; for example, the AF:~ of both reactions studied increased only slightly at low pH, and further it is dif- ficult to attribute the relative resistance to heat destruction of the unaltered enzyme to its being surrounded by a more acid medium. Yet, admitting that the pH hypothesis of alteration cannot explain a good part of our data, we might admit it tentatively as an explanation for part of them, provided that there
Dow
nloaded from http://rupress.org/jgp/article-pdf/38/4/515/1241030/515.pdf by guest on 17 M
arch 2022

544 KINETIC STUDY O]F YEAST CATALASE
were a reasonable explanation of an effective pH of 4.0 in the neighborhod of eatalase, while the lowest estimate of the pH of the intact yeast cell, that of Conway and O'Malley (17), is 5.8. If the catalase existed at an intracellular interface, a reasonable explanation would, in fact, exist, for Danielli has em- phasized (19) that hydrogen ions tend to concentrate at interfaces, often producing a pH of as much as 2 units lower at the interface than obtains in the bulk phase. Thus, the pH hypothesis would extend and modify, but not replace, the interracial hypothesis: part of the decreased structural and en- zymatic specificity of the interfacially adsorbed eatalase might then be due to the comparatively high local concentration of hydrogen ions at the interface. I t might be mentioned that Agner and Theorell (20) found that catalase ac- tivity at pH 4 was 70 per cent optimal, whereas Chance (21) has found with his rapid flow methods that activity at pH 4 was undiminished.
Any explanation of the 200-fold difference in k" between our values (at 0°C., 1.7 X 10⁵ liter mole -1 seC. -1, titrimetric; 1.4 X 10⁵ liter mole -~ sec. -1, manometric, calculated on the basis of the 20 per cent reduction in manometric turnover number (see Table I)) and that of Chance (3.5 X 10⁷ liter mole -~ sec_~), is beyond the scope of this paper and the capacity of its authors. Suf- fice it to say that, as we have shown, our conclusions are valid no matter whose ktp we use, although, of course, the constants obtained by the fast flow spectro- photometric techniques of Chance have to be taken more seriously than ours, obtained by more workaday methods. Our values do agree with those calculated by Sizer (18), (k" = 3.4 X 10⁵ liter mole -1 sec.-1), from the "Kat . f" of Sumner (22). Surprisingly enough, despite the similarity of rate constants, our turnover numbers, corrected to 0°C. (7.5 X 10⁸ mols. H~O~/mol. eatalase/ sec.) do not at all agree with Sizer's (3.4 X 10⁵ tools. H~O2/mol. catalase/sec., which is numerically equal to his k", quoted directly above); the reason for the disparity is that Sizer failed to correct for the substrate concentration used in Kat.f determinations (usually 0.01 ~), whereas his value would be correct only if a substrate concentration of 1 M had been employed. When such a correction is introduced, the turnover number calculated from Sum- ner's data is only slightly lower than our own: 3.4 X 10⁵ liter mole -1 catalase sec - 1 X 0.01 ~ H2Os -- 3.4 X 10 s mols. H20~ mol. -~ catalase sec. -1.
We have been unable to confirm one other interesting finding of Sizer (18), that the energy of activation of the heat destruction process suddenly increases approximately 5-fold at 62-68°C. We have found that in this temperature range the inactivation of even our most heat-resistant preparations (unaltered intra- cellular) occurs too rapidly to permit accurate rate determinations, especially in view of the finite time required to bring the reaction mixture to the bath temperature.
A comparison of the kinetics of other enzymes inside and outside of the cell led Sizer to the general conclusion that "it thus appears that the activation
Dow
nloaded from http://rupress.org/jgp/article-pdf/38/4/515/1241030/515.pdf by guest on 17 M
arch 2022

M. J. FRASER AND J. GORDIN KAPLAN 545
energy is not changed by the extraction of an enzyme from cells or tissues" (23). This conclusion is no longer tenable, in view of the results of the present paper.
While the next paper in this series will present a kinetic study of the process of enzyme alteration itself, we may permit ourselves to speculate that the energy of activation of alteration should be, on the basis of the present data, of the order of 21 kcal., if our interpretation of the meaning of the difference in ~ values for heat destruction of altered and unaltered enzymes is correct. The fact that the unaltered enzyme requires 21 kcal./mole less energy to ac- tivate its destruction indicates that bonds totalling 21 kcal. bond strength (perhaps 4 hydrogen bonds ?) must be formed during the process of enzyme alteration and this would therefore represent a minimum energy of activation for this process.
SUMMARY AND CONCLUSIONS
1. The very large increase in catalase activity (Euler effect) which follows treatment of yeast cells with CHC18, UV and n-propanol is accompanied by highly significant changes in kinetic properties. With respect to the enzymatic decomposition of H202, the thermodynamic constants of the activation process ~, AH~, Ag~, AFt, decrease, following treatment of the intracellular enzyme, by 4.5 kcal., 4.5 kcal., 10.1 e.u. and 1.7 kcal., respectively, all these differences being significant at the 1 per cent level.
2. Similar differences exist between the untreated, intracellular enzyme on the one hand, and the extracted yeast and crystalline beef liver catalases on the other. Significant differences in these thermodynamic constants do not exist among the treated intraceUular, extracted yeast, and crystalline liver catalases.
3. These data provide unequivocal confirmation of the phenomenon of en- zyme alteration reported previously, and confirm previous evidence that the extracted and crystalline enzymes have also undergone enzyme alteration and have properties which are identical with, or very similar to, those of the cata- lase altered in situ.
4. With respect to the process of heat destruction of catalase, the greatly diminished stability to heat of the altered enzymes, previously reported, has been confirmed. The thermodynamic constants of activation of this process have likewise changed following alteration, in the case of #, AH~, and Ag:~ an increase of 20.6 kcal., 20.6 kcal., and 70 e.u., respectively, and of AF~ a de- crease of 2.8 kcal.
5. All these data have been shown to be consistent with, and in some cases predictable from, the interracial hypothesis, which states that the unaltered catalase exists within the cell adsorbed to some interface, in a partially, but reversibly, unfolded configuration of relatively low specificity; enzyme altera-
Dow
nloaded from http://rupress.org/jgp/article-pdf/38/4/515/1241030/515.pdf by guest on 17 M
arch 2022

546 KINETIC STUDY OF YEAST CATALASE
tion consists, in the case of catalase, of desorbing the enzyme from the inter- face into its rolled-up, soluble, highly specific configuration. While the inter- facial hypothesis has successfully withstood this experimental attack, the present data do not provide its unequivocal proof, since they are consistent with any hypothesis of alteration in which the unaltered, intracellular enzyme is in a relatively disordered state by comparison to the altered enzyme. While evidence of an interracial process in enzyme alteration has been adduced pre- viously, critical proof of the interracial hypothesis awaits creation of a model system, in which most of the aspects of intracellular alteration can be repro- duced.
6. Certain of the changes in kinetic properties following alteration of the intracellular enzyme, such as increased activity and the modified energies and entropies of activation of both enzyme-substrate system and heat destruc- tion of the catalase itself, might be explained by a decrease (two orders of magnitude) in the effective hydrogen ion concentration, allowing the intra- cellular enzyme to be brought to the same pH as the extracellular medium. If such a pH change does, in fact, occur, it is necessary to invoke the interracial hypothesis to explain why the unaltered, intracellular enzyme is in equilibrium with a medium whose pH is approximately 2 units lower than that of the cyto- plasm itself.
7. I t is concluded that kinetic data of this kind may be used to shed light on the structure of a soluble, cytoplasmic enzyme, not attached to any of the formed elements within the cell, yet organized within it in a condition of rela- tively low structural specificity; further, that information obtained exclu- sively from a study of the kinetics of the extracted or crystalline enzymes may not, in the case of this enzyme, at least, be extrapolated to the same enzyme within the intact cell.
REFERENCES
1. Kaplan, J. G., Exp. Cell Research, 1955, in press. 2. Kaplan, J. G., .1". Gen. Physiol., 1954, 38, 197. 3. Kaplan, J. G., ] . Colloid Se., 1952, 7, 382. 4. Kaplan, J. G., Physiol. Zool., 1952, 9.5, 123. 5. yon Euler, H., and Blix, R., Z. physiol. Chem., 1919, 108, 83. 6. Glasstone, S., Laidler, K. J., and Eyring, H., 1941, The Theory of Rate Processes,
New York, McGraw-Hill. 7. Brown, D. E., Johnson, F. H. and Marsland, D. A., J. Cell. and Camp. Physiol.,
1942, 20, 151. 8. Mirsky, A. E., and Pauling, L., Proc. Nat. Acad. So., 1936, 22,439. 9. Chance, B., in The Enzymes, (J. B. Sumner and K. Myrback, editors), New York,
Academic Press, 1951, 2, 428. 10. Theoren, H., and Agner, K., Ark. Kemi, Mineral. och Geol., 1942, 16 A, No. 7. 11. yon Euler, H., and Josephson, K., Ann. Chem., Berlin, 1927, 462, 158; 466, 9.
Dow
nloaded from http://rupress.org/jgp/article-pdf/38/4/515/1241030/515.pdf by guest on 17 M
arch 2022

M. J. FRASER AND J. GORDIN KAPLAN 547
12. Fisher, R. A., and Yates, F., Statistical Tables for Biological, Agricultural and Medical Research, Edinburgh, Oliver and Boyd, 1943.
13. Beers, R. F., and Sizer, I. W., Science, 1953, 117, 710. 14. Williams, J., f . Gen. Physiol., 1928, 11, 309. 15. Chance, B., Acta chem. Stand., 1947, 1, 236. 16. Chance, B., and Herbert D., Biochem..L, 1950, 46, 402. 17. Conway, E. J., and O'Maney, E., Biochem. ]., 1946, 40, 59. 18. Sizer, I. W., ]. Biol. Chem., 1944, 154, 461. 19. Danielli, J. F., Proc. Roy. Soc. London, Series B, 1937, 122, 155. 20. Agner, K., and Theorell, H., Arch. Biocbem., 1945, 10, 321. 21. Chance, B., ]. Biol. Chem., 1952, 194, 471. 22. Sumner, J. B., and Somers, G. F., Chemistry and Methods of Enzymes, New
York, Academic Press, 1943. 23. Sizer, I. W., Advances gnzymol., 1943, 3, 56. 24. Yamahuzi, K., Imagawa, H., and Suzuki, S., 1940, Biocl~em Z., 304, 266; cited
in Chem. Abst. 1940, 34, 511.
Dow
nloaded from http://rupress.org/jgp/article-pdf/38/4/515/1241030/515.pdf by guest on 17 M
arch 2022


![2-BME-Neuroscience-Ch4 - · PDF file2.04.2017 · Storage, alteration, and packaging ... digestive enzymes Functions ... [36,37,38!,39!!], which is followed by an](https://img.pdfslide.us/doc/110x75/5aabbe267f8b9aa06a8c471c/2-bme-neuroscience-ch4-alteration-and-packaging-digestive-enzymes-functions.jpg)


![Regulation of the intracellular Ca2+. Regulation of intracellular [H]:](https://img.pdfslide.us/doc/110x75/5a4d1b717f8b9ab0599b56a5/regulation-of-the-intracellular-ca2-regulation-of-intracellular-h.jpg)