Embed Size (px)
Citation preview
'See the following pages for the list of authors. OCR Output
(To be submitted to Nucl. Instr. Meth. A)
described.
electrons, muons, neutrinos (from missing energy), charged hadrons, ·rr°’s and V°’s isof the detector is its ability to identify particles; the performance in identification ofhadrons, and the accuracy obtained in energy and angle is given. An essential propertyof charged tracks is specified. Calorimeters are used to measure photons and neutralaccuracy of the tracking detectors to measure the impact parameter and momentumThe performance of the ALEPH detector at the LEP e+e‘ collider is reviewed. The
Abstract
The ALEPH Collaboration"
Performance of the ALEPH detector at LEP
CERN—PPE-94-170
1 Neeeeeeee eeeelllllllllllllllllllllllllllllllCERN—PPE/94—170
EUROPEAN ORGANIZATION FOR NUCLEAR RESEARCH
i

6Now at Max-Planck-Institut fur Kernphysik, 6900 Heidelberg, Germany. OCR Output5Now at Johannes-Gutenberg University, 6500 Mainz, Germany.1Now at University of Birmingham, Birmingham B15 2TT, U.K.3Now at Le Croy, 1217 Geneva, Switzerland.°Now at Humboldt Universitz, 10115 Berlin, Germany.1Now at ETH, 5232 Villingen, Switzerland.Now at University at Chicago, Chicago IL 60680, U.S.A.9Now at DESY, 22603 Hamburg, Germany.Now at FNAL, Batavia IL 60510, U.S.A.
Now at SSC Laboratory, Dallas TX 75237, U.S.A.6Now at University of Oregon, U.S.A.Now at SLAC, Stanford CA 94309, U.S.A.
°Now at LBL, Berkeley CA 94720, U.S.A.3Now at CALTECH, Pasadena CA 91125, U.S.A.Now at Harvard University, Cambridge MA02138, U.S.A.
1Now at Columbia University, New York NY10027, U.S.A.°Now at Rheinische Friedrich-Wilhelms-Universitat Bonn, 5300 Bonn 1, Germany.Now at SLAC, Stanford, CA 94309, U.S.A.Permanent address: Universitat de Barcelona, 08208 Barcelona, Spain.
?Also at Istituto di Matematica e Fisica, Universita di Sassari, Sassari, Italy.6Partially supported by Colciencias, Colombia.5Now at University of Pittsburgh, Pittsburgh, PA 15260, U.S.A.4Now at Rutgers University, Piscataway, NJ 08854, USA.Now at Universita di Pavia, Pavia, Italy.
2Supported by the US Department of Energy, grant DE-FG03—92ER40689.lAlso at CERN, PPE Division, 1211 Geneva 23, Switzerland.°Now at Dipartimento di Fisica, Universita di Milano, Milano, Italy.9Permanent address: Kangnung National University, Kangnung, Korea.8Supported by Fonds zur Forderung der wissenschaftlichen Forschung, Austria.Supported by the Direction des Sciences de la Matiére, C.E.A.
°Supported by the Bundesministerium fiir Forschung und Technologie, Fed. Rep. of Germany.5Present address: Lion Valley Vineyards, Cornelius, Oregon, U.S.A.4Supp0rted by the US Department of Energy, contract DE-FC05-85ER250000.3Supported by the US Department of Energy, contract DE-FG05-92ER40742.2On leave from Universitat Autonoma de Barcelona, Barcelona, Spain.lSupported by the US Department of Energy, contract DE-AC02-76ER00881.°Supported by the UK Science and Engineering Research Council.9Supported by the Danish Natural Science Research Council.BSupported by the National Science Foundation ofCl1ina.7Supported by CICYT, Spain.°Now at Parallax Solutions Limited, Univ. of Warwick Science Park, Coventry, CV4 7EZ, U.K.5Also Istituto di Cosmo-Geofisica del C.N.R., Torino, Italy.°A]so Istituto di F isica Generale, Universita di Torino, Torino, Italy.3'Now at Harvard University, Cambridge, MA 02138, U.S.A.Deceased.
1Now at CERN, 1211 Geneva 23, Switzerland.
Department of Physics, University of Wisconsin, Madison, WI 53706, USA OCR Output
F.V. Weber,1 E. Wicklund,38 Sau Lan Wu, X. Wu, J.M. Yamartino, M. Zheng, G. ZobernigY. Saadi, M. Schmitt, I. Scott, V. Sharma, D. Strom,M. Takashima,J.D. Turk, A.M. Walsh,
36 37
Y.S. Gao, J. Grahl, J.L. Harton, O.J. Hayes, H. Hu, R.C. Jared,34 D. Muller,35 J.M. Nachtman, Y.B. Pan,L. Bellantoni, A. Caldwell,31 D. Cinabro,32 J.S. C0nway,24 D.F. Cowen,33 Z. Feng, D.P.S. Ferguson,
Experimental Elementary Particle Physics, University of Washington, WA 98195 Seattle, U.S.A.
J. Rothberg, S. Wasserbaech
Dipartimento di Fisica, Université di Trieste e INFN Sezione di Trieste, 34127 Trieste, Italy
L. Bosisio, R. Della Marina, G. Giannini, B. Gobbo, L. Pitis, F. Ragusaz
Fachbereich Physik, Universitat Siegen, 57068 Siegen, Fed. Rep. ofGermany1
F. Rivera,26 P. Saraiva, U. Schafer, L. SmolikA. Bohrer, S. Brandt, G. Cowan, E. Feigl, G. Gillessen, C. Grupen, G. Lutters, J. Minguet—Rodriguez,
Department of Physics, University ofSheHield, Sheffield S3 7RH, United Kingdom]
A. Beddall, C.N. Booth, S. Cartwright, F. Combley, I. Dawson, A. Koksal, C. Rankin, L.F. Thompson
Institute for Particle Physics, University of California at Santa Cruz, Santa Cruz, CA 95064, USA2
R.P. Johnson, A.M. Litke, G. Taylor, J. Wear
CEA, DAPNIA/Service de Physique des Particules, CE-Saclay, 91191 Giiisur- Yvette Cedex, Francel
J.-P. Schuller, J. Schwindling, D. Si Mohand, B. VallageJ.C. Lottin, P. Micolon, J. Pascual, P. Perez, J. Rander, J .·F. Renardy, A. Rosowsky, A. Roussarie,L. Gosset, J. Heitzmann, M. Jacquemet, A. Joudon, W. Kozanecki, E. Langon, M.C. Lemaire, E. Locci,D. Bederede, R. Bernard, E. Beuville, B. Bloch-Devaux, P. Colas, H. Desportes, H. Duarte, S. Emery,
KingdomlParticle Physics Dept., Rutherford Appleton Laboratory, Chilton, Didcot, Oxon OX11 OQX, United
J.C. Thompson, A.W. TuckerV. Bertin, J. Bizzell, D.R. Botterill, R.W. Cliift, T.R. Edgecock, S. Haywood, M. Edwards, P.R. Norton,
OEX, United KingdomlDepartment of Physics, Royal Holloway &: Bedford New College, University of London, Surrey TVV 20
I.S. Quazi, J.A. StrongA.P. Betteridge, Y. Gao, M.G. Green, B.J. Green, D.L. Johnson, P.V. March, T. Medcalf, Ll.M. Mir,
Italy
Dipartimento di Fisica dell’Universita, INFN Sezione di Pisa, e Scuola Normale Superiore, 56010 Pisa,P. Spagnolo, J. Steinberger, R. Tenchini,21 G. Tonelli,27 G. Triggiani, C. Vannini, P.G. Verdini, J. WalshA. Lusiani, P.S. Marrocchesi, A. Messineo, G. Pagani, G. Pierazzini, A. Profeti, G. Rizzo, G. Sanguinetti,I. Ferrante, F. Fidecaro, F. Forti, A. Giassi, M.A. Giorgi, A. Gregorio, F. Ligabue, R. Lorenzini,C. Bradaschia, G. Calderini, M. Carpinelli, C. Cerri, M.A. Ciocci, V. Ciulli, R. Dell’Orso, R. Fantechi,D. Abbaneo, C. Avanzini, G. Bagliesi, G. Batignani, A. Bechini, F. Bosi, U. Bottigli, C. Bozzi,
France OCR Output
Laboratoire de l’Accélérateur Linéaire, Université de Paris-Sud, INQPS-CNRS, 91405 Orsay Cedex,I. Videau
F. Le Diberder, J. Lefrancois, A.-M. Lutz, G. Musolino, H.J. Park, J.—P. Richer, M.—H. Schune, J.-J.Veillet,M. Davier, M. Dialinas, A. Ducorps, L. Duflot, J.-F. Grivaz, Ph. Heusse, P. Janot, Ph. Jean, D.W. Kim}9J.-N. Albert, R. Alemany, C. Arnault, R. Bernier, J. Boucrot, O. Callot, R. Chase, A. Cordier,
Max-Planck-Institut fiir Physik, Werner-Heisenberg-Institut, 80805 Miinchen, Fed. Rep. ofGermany1
P. Weissbach, G. Wolf
R. Settles, H. Seywerd, H. Stieg, U. Stiegler, U. Stierlin,2 R. St. Denis, L. Striider, G. Waltermann,H. Kroha, J. Lauber, G. Liitjens, G. Lutz, W. Manner, H.-G. Moser, R. Richter, J. Schroder, A.S. Schwarz,B. Dehning, H. Dietl, F. Dydak,2l H. Fischer, A.W. Halley, D. Hauff, P. Holl, K. Jakobs, W. Kothhuber,I. Abt, K. Ackermann, S. Adlung, R. Assmann, C. Bauer, H. Becker, W. Blum, D. Brown, P. Cattaneo,2
France
Centre de Physique des Particules, Faculté des Sciences de Luminy, INQP3—CNR.S, 13288 Marseille,
Y. Gally. D. Nicod, P. Payre, L. Roos, D. Rousseau, P. Schwemling, M. TalbyA.M. Bencheikh, C. Benchouk, M. Billaut, A. Bonissent, D. Calvet, J. Carr, C. Diaconu, F. Etienne,
Institut fzir Physik, Universitat Mainz, 55099 Mainz, Fed. Rep. of Germanyl
S.M. Walther, R. Wanke, B. Wolf
L.A.T. Bauerdick,39 A. Gal1a,A.M. Greene, K. Kleinknecht, J. Raab, B. Renk, H.-G. Sander, H. Schmidt,
Department of Physics, University of Lancaster, Lancaster LA1 4YB, United Kingdoml
A. Patel, T. Sloan, S.W. Snow, E.P. WhelanC.K. Bowdery, T.J. Brodbeck, A.J. Finch, F. Foster, G. Hughes, D. Jackson, N.R. Keemer, M. Nuttall,
Institut fair Experimentalphysik, Universitat Innsbruck, 6020 Innsbruck, Austrial
P. Girtler, D. Kuhn, G. Rudolph, R. Vogl
Department of Physics, Imperial College, London SW7 2BZ, United Kingdoml
G. San Martin, J.K. Sedgbeer, A.G. WrightJ.F. Hassard, N. Konstantinidis, D.G. Miller, L. Moneta, A. Moutoussi, J. Nash, D.G. Payne, D.R. Price,G.J. Barber, R. Beuselinck, D.M. Binnie, W. Cameron, M. Cattaneo, D.J. Colling, D.N. Gentry,
Institut fiir Hochenergiephysik, Universitat Heidelberg, 69120 Heidelberg, Fed. Rep. ofGermany1
H. Stenzel, K. Tittel, M. WunschJ. Krause, Y. Maumary,1 M. Panter,46 A. Putzer,21 B. Rensch, M. Schmidt, K. Schmitt, A. Stahl,3U. Becker, B. Brandl, O. Braun, R. Geiges,45 C. Geweniger, P. Hanke, V. Hepp, W. Heyde,2 E.E. Kluge,
Department of Physics and Astronomy, University of Glasgow, Glasgow G12 8QQ, United Kingdoml
J.M. Scarr, K. Smith, M.G. Smith, A.S. Thompson, S. Thorn, R.M. TurnbullP. Colrain, I. ten Have, I.G. Knowles, J.G. Lynch, W. Maitland, W.T. Morton, C. Raine, P. Reeves,
Laboratori Nazionali dell ’INF N (LNF -INF N), 00044 Frascati, Italy
F. Murtas, G.P. Murtas, M. Pepe-Altarelli, P. Picchi, S. Salomone, M. SantoniM. Carletti, F. Cerutti, V. Chiarella, G. Corradi, B. Dulach, G. Felici, P. Laurelli, G. Mannocchi,M. Anelli, A. Antonelli, A. Balla, G. Bencivenni, G. Bologna,4 R. Bonini, F. Bossi, P. Campana, G. Capon,
4052, USA mtSupercomputer Computations Research Institute, Florida State University, Tallahassee, FL 32306
M. Corden, M. Delfino,12 C. Georgiopoulos, D.E. Jaffe, D. Levinthall
Dipartimento di Fisica, Universita di Firenze, INFN Sezione di Firenze, 50125 Firenze, Italy
E. Focardi, G. Parrini, E. Scarlini
Department of Physics, University of Edinburgh, Edinburgh EH9 3JZ, United Kingdoml OCR Output
D.J. Candlin, A.J. Main, M.I. Parsons, E. Veitch
Palaiseau Cedex, FranceLaboratoire de Physique Nucléaire et des Hautes Energies, Ecole Polytechnique, INQP3-CNRS, 91128
P. Poilleux, A. Rougé, C. Roy, M. Rumpf, R. Tanaka, A. Valassi, M. Verderi, H. Videau, C. VioletJ. Doublet, G. Fouque, C. Lemoine, P. Matricon, M. Maubras, R. Morano, J.-Y. Parey, L. Passalacqua,M. Bercher, U. Berthon, A. Blondel, G. Bonneaud, J.C. Brient, P. Bourdon, A. Busata, M. Cerutti,
Nuclear Research Center Demokritos (NRCD), Athens, Greece
A. Kyriakis, E. Simopoulou, I. Siotis, A. Vayaki, K. Zachariadou
Niels Bohr Institute, 2100 Copenhagen, Denmarkg
A. Lindahl, B. Madsen, R. Mellerud, B.S. Nilsson, G. PetersenH. Bertelsen, T. Fearnley, F. Hansen, J.B. Hansen, J.D. Hansen, J.R. Hansen, P.H. Hansen, S.D. Johnson,
63177 Aubiére, FranceLaboratoire de Physique Corpusculaire, Université Blaise Pascal, INQP3-CNRS, C1ermont·Ferrand,
F. Podlyski, J. Proriol, F. SaadiA. Falvard, P. Gay, C. Guicheney, P. Henrard, J. Jousset, B. Michel, J—C. Montret, D. Pallin, P. Perret,Z. Ajaltouni, M. Bardadin-Otwinowska, A. Barres, C. Boyer, M. Brossard, R. Chadelas, F. Daudon,
European Laboratory for Particle Physics (CERN), 1211 Geneva 23, Switzerland
W. Wiedenmanri, T. Wildish, W. Witzeling, J. WotschackW. Tejessy, I.R. Tomalin, R. Veenhof, A. Venturi, H. Verweij, H. Wachsmuth, H. Wahl, S. Wheeler,4Ruden, M. Saich,6 J.—C. Santiard, P. Schilly, D. Schlatter, M. Schmelling, G. Stefanini, H. Taureg,J.~F. Pusztaszeri, F. Ranjard, J. Richstein,43 W. Richter, L. Rolandi, H. Rotscheidt, W. vonA. Miotto, R. Miquel, P. Palazzi, J.R. Pater, P. Perrodo, R. Pintus, L. Pregernig, M. Price,C. Markou, E.B. Martin, P. Mato,,J.-M. Maugain, J. May, H. Meinhard, V. Mertens,1 A. Minten,A. Lacourt, P. Lazeyras, I. Lehraus, B. Lofstedt, T. Lohse,42 D. Liitze,3° M. Maggi, A. Marchioro,J. Harvey, B. Ivesdal, R. Jacobsen, P. Jarron, B. Jost, M. Kasemann,39 G. Kellner, J. Knobloch,G. Ganis, C. Gay,3 R. Geiges, M. Girone, C. Graab,41 R. Grabit, J. Griffith, R. Grub, R. Hagelberg,P. Comas, P. Coyle, H. Drevermann, A. Engelhardt, M. Ferro—Luzzi, L. Foa, R.W. Forty, M. Frank,H. Albrecht,39 A. Ball, R. Benetta, F. Bird,37 E. Blucher,4° G. Bonvicini, J. Boudreau,25 T. Charity,
Institute of High-Energy Physics, Academia Sinica, Beijing, The People’s Republic of Chinag
Y. Chai, D. Huang, X. Huang, J. Lin, T. Wang, Y. Xie, D. Xu, R. Xu, J. Zhang, L. Zhang, W. Zhao
Dipartimento di Fisica, INFN Sezione di Bari, 70126 Bari, Italy
F. Romano, F. Ruggieri, G. Selvaggi, L. Silvestris, P. Tempesta, G. ZitoN. Marinelli, A. Mastrogiacomo, S. Natali, V. Negro, S. Nuzzo, M. Papagni, C. Pinto, A. Ranieri, G. Raso,F. Chiumarulo, A. Clemente, D. Creanza, M. de Palma, A. Farilla, R. Ferorelli, G. Iaselli, G. Maggi,
SpainInstitut de F isica d ’Altes Energies, Universitat Autonoma de Barcelona, 08193 Bellaterra (Barcelona),
A. Pascual, J.A. Perlas, F. Sanchez F. Teubert,V, Gaitan, Ll. Garrido,2'3 M. Martinez, T. Mattis0n,29 S. Orteu, A. Pacheco, C. Padilla, F. Palla,F. Ai·iztizabal,.__M. Chmeissani, J .M. Crespo, I. Efthymiopoulos, E. Fernandez, M. Fernandez-Bosman,
Laboratoire de Physique des Particules (LAPP), INQP3-CNRS, 74019 Annecy-le—Vieux Cedex, France
B. PietrzykD. Buskulic, D. Casper, I. De Bonis, D. Decamp, P. Ghez, C. Goy, J.—P. Lees, M.—N. Minard, P. Odier,
The ALEPH Collaboration
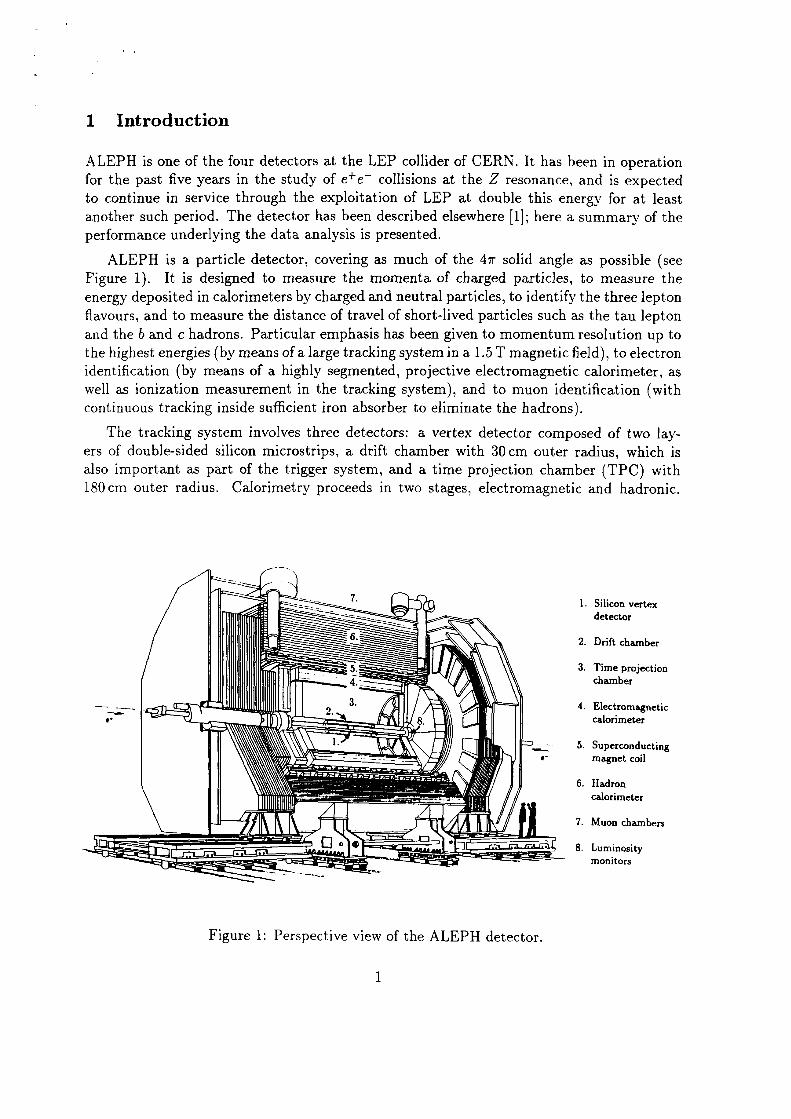
Figure lz Perspective view of the ALEPH detector.
.__?___"- •·.
monitors OCR Output
LuminosityD as
Muon chambers
calorimeter
Hadron
magnet coilSuperconducting
calorimeterElectromagnetic
ti chamberTime projection
Drift chamber
detector
Silicon vertexno 7.
180 cm outer radius. Calorimetry proceeds in two stages, electromagnetic and hadronic.also important as part of the trigger system, and a time projection chamber (TPC) withers of double-sided silicon microstrips, a drift chamber with 30 cm outer radius, which is
The tracking system involves three detectors: a vertex detector composed of two lay
continuous tracking inside sumcient iron absorber to eliminate the hadrons).well as ionization measurement in the tracking system), and to muon identification (withidentification (by means of a highly segmented, projective electromagnetic calorimeter, asthe highest energies (by means of a large tracking system in a 1.5 T magnetic Held), to electronand the b and c hadrons. Particular emphasis has been given to momentum resolution up toflavours, and to measure the distance of travel of short—lived particles such as the tau leptonenergy deposited in calorimeters by charged and neutral particles, to identify the three leptonFigure 1). It is designed to measure the rnomenta of charged particles, to measure the
ALEPH is a particle detector, covering as much of the 47r solid angle as possible (see
performance underlying the data analysis is presented.another such period. The detector has been described elsewhere [1]; here a summary of theto continue in service through the exploitation of LEP at double this energy for at leastfor the past five years in the study of e+e` collisions at the Z resonance, and is expectedALEPH is one of the four detectors at the LEP collider of CERN. It has been in operation
1 Introduction
by comparing the rates for one or both of the triggers firing. OCR Outputfor hadronic Z decays, with an uncertainty of less than 0.01%, which has been determinedtrack triggers. The combination of these triggers has an efficiency of greater than 99.99%
Hadronic Z decays are collected using two main triggers, the Total—energy and Muon
triggers.
be obtained as well as providing cross-checks for verifying the efficiency of the individualsimplicity of the trigger logic and the redundancy allows trigger efficiencies near 100% to
The system relies on multiple triggers being delivered for each physics channel. The
Two track segments back-to-back in the drift chamber (Back-to-hack trigger).
is sensitive to muons and, with lower efficiency, to hadrons.calorimeter, so requiring a certain penetration depth (Muon-track trigger). This triggerTrack segments in the drift chamber in coincidence with hits in a module of the hadron
of the energy deposit of a muon in the electromagnetic calorimeter.track trigger). The threshold is set to 200 MeV, which corresponds to less than 50%module of the electromagnetic calorimeter to which the track is pointing (ElectronTrack segments in the drift chamber in coincidence with an energy deposit in the
6 GeV in the barrel, ~ 3 GeV in either end—cap, or ~ 1.5 GeV in both end—caps.Energy deposits in the electromagnetic calorimeter (Total-energy trigger), demanding
use of four approaches to derive trigger signals:demand precise measurements of cross-sections. The ALEPH trigger system is based on theUnderstanding the emciency of the trigger is crucial in many of the analyses at LEP which
2 Trigger performance
measurement of luminosity is covered in Section 11.applied in Section 10 to the global description of events, using energy flow, and finally theelectrons, muons, photons and neutral pions, and V°’s. These features of the detector aremance in Section 5. The subsequent sections describe particle identification, for respectivelyionization (dE/dx) measurement from the TPC in Section 4, and the calorimeter perforincluding spatial and momentum resolution. This is followed by a description of the specificger of the apparatus is described. Then in Section 3 the tracking performance is discussed,
The presentation is divided as follows: in the next section, the performance of the trig
sten / silicon sandwiches that surround the beam pipe at each end.measurement is the highly segmented luminosity calorimeter, composed of twelve-layer tungsystem of two double—layers of streamer tubes. Finally, important for precise cross—sectionof iron (the magnet return yoke). The whole is surrounded by an additional muon detectionhadron calorimeter is a 23 layer iron / streamer-tube sandwich with total thickness of 120 cmThe electromagnetic calorimeter is a 45 layer lead / proportional-chamber sandwich, and the
nate z. OCR Output
TThe coordinate system used is cylindrical, with radius r, azimuthal angle cp and axial coordi
positions of adjacent strips that have at least three times the mean noise charge; they arestructed in the outer tracking. Hits are reconstructed by averaging the charge-weighted
Vertex detector hits are used to provide additional precision for tracks already recon
given in Referenceperpendicular (rz) to the beam direction} A detailed description ofthe vertex detector islayers being four wafers long. Each wafer has 100 ,um strip readout both parallel (rgb) andaverage radius of 6.5 cm, and the outer layer has 15 wafers with average radius 11.3 cm, bothcoaxial cylinders around the beam pipe. The inner layer has nine wafers in azimuth, withis formed from 96 silicon wafers each of dimensions (5.12 >< 5.12 >< 0.03) cm, arranged in twoClose to the interaction point, tracking is performed by a silicon vertex detector. This device
3.1 Silicon vertex detector
3 Tracking performance
background.0.5 Hz each, and the remainder is accounted for by cosmic rays, noise and beam relatedter contribute 2-3 Hz, Z events (at the peak) and two-photon events contribute about
The trigger rate is typically 4-5 Hz, where Bhabha events in the luminosity calorime
an uncertainty of 0.01 %.downscaled triggers with lower energy thresholds. The overall trigger efficiency is 100 % withThe efficiencies of these triggers are cross-checked against each other, and against similarconstructed using single-arm high threshold triggers, and double-arm low threshold triggers.trigger for these events depends on the total energy deposited in the calorimeter. Triggers are
The luminosity is measured using Bhabha events in the luminosity calorimeter. The
100 % at 1.5 GeV, with an uncertainty of 0.2 %.a single module of the electromagnetic calorimeter. The efficiency of this trigger approacheswith energy ~ 1-2 GeV. The trigger for these events demands a deposit of at least 1 GeV in
In order to study the process e+e' -> l/1.77 it is necessary to trigger on a single photon
leptonic events is limited by statistics to 0.05 %.range \cos0| < 0.9. The knowledge of the uncertainty on the trigger inefficiency for theFor each of the lepton triggers the efficiencies quoted above are for events in the angularelectromagnetic calorimeter, are triggered by the Total-energy trigger with 100 % efiiciency.close to 100% efliciency. Bhabha events, however, which deposit all their energy in the98 % of muon pair events. The same triggers are used to select tau events, again achievingmeasured to be larger than 99.8% and all three of these triggers are present in more thanto-back triggers. The combined efficiency of these triggers is very near to 100 %; the first isredundancy. For muons three triggers are used: the Muon—track, Electron—track, and Back
Leptonic events have a lower multiplicity than hadronic events, and so require larger
The position of the drift chamber relative to the TPC is determined with data. Initial OCR Output
trigger
the standard tracking, but allows the implementation of a three—dimensional first—leve1 trackthe signals at each end of the wires. This has a resolution of a few cm and is not used inalong the beam direction is also determined by measuring the difference in arrival time ofdepends on the drift length in the cell, with an average of 150 pm. The position of tracksbetween 16 and 26 cm, with adjacent layers staggered by half a cell width. The resolutionmeasures the rqb position of a track on eight concentric layers of hexagonal drift cells at radiiThe vertex detector is surrounded by a conventional cylindrical drift chamber [1, 3]. It
3.2 Drift chamber
vertex detector hit resolution in the track fit.
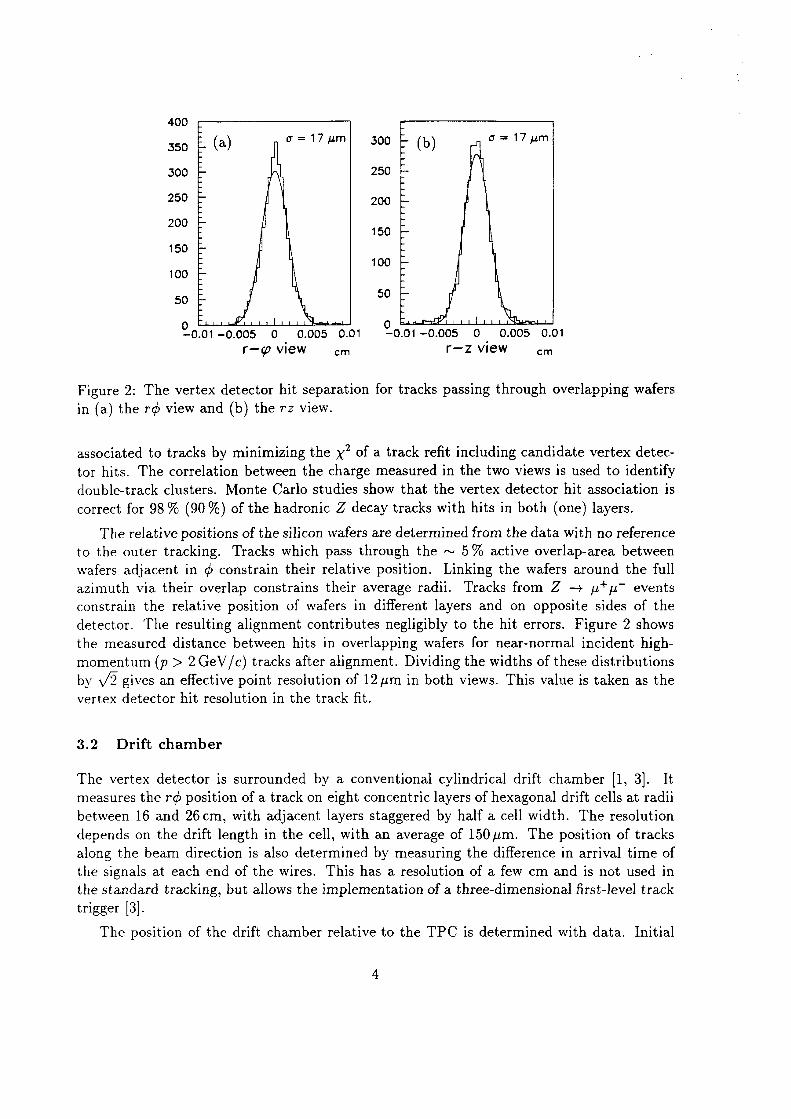
by gives an effective point resolution of 12 pm in both views. This value is taken as themomentum (p > 2 GeV/c) tracks after alignment. Dividing the widths of these distributionsthe measured distance between hits in overlapping wafers for near-normal incident highdetector. The resulting alignment contributes negligibly to the hit errors. Figure 2 showsconstrain the relative position of wafers in different layers and on opposite sides of theazimuth via their overlap constrains their average radii. Tracks from Z —> ,u+y” eventswafers adjacent in gb constrain their relative position. Linking the wafers around the fullto the outer tracking. Tracks which pass through the ~ 5% active overlap—area between
The relative positions of the silicon wafers are determined from the data with no reference
correct for 98 % (90 %) of the hadronic Z decay tracks with hits in both (one) layers.double—track clusters. Monte Carlo studies show that the vertex detector hit association is
tor hits. The correlation between the charge measured in the two views is used to identifyassociated to tracks by minimizing the X2 of a track reiit including candidate vertex detec
in (a) the rq5 view and (b) the rz view.Figure 2: The vertex detector hit separation for tracks passing through overlapping wafers
r—g0 view Cm r-Z VIEW Cm
;0.01 -0.005 0 0.005 0.01 -0.01 -0.005 0 0.005 0.01
so50
100
100
150
150200
200250
300 250
350 mU=17;.LmI 3OOE(b) '_n¤=17y,m400
and the segments are connected to make tracks by requiring consistency with a helix hypothOCR OutputTracks are reconstructed starting in the TPC. Nearby hits are linked to form track segments,
3.4 Track reconstruction
calculate the coordinate errors in the track fit.
wires. The measured dependence of the resolution has been parametrized and is used toresolution depends on the drift length and the orientation of the track relative to pads andaz = 740 pm for tracks with polar angles within 10° of perpendicular to the beams. Themeasured with leptonic Z decays for isolated coordinates. The longitudinal resolution is
After all corrections an overall azimuthal coordinate resolution of 0,,,; = 173 pm [4] is
measurements from the laser system.reconstructed in the TPC to that observed in the vertex detector, and also by comparingevent reconstruction. The method is regularly monitored by comparing the track polar anglevelocity change is determined and updated on a run—by-run basis in a precursor to the fullfrom hadronic Z events in the two halves of the TPC come from the same origin. The driftThis time difference is constant, so the drift velocity can be set by requiring that the tracksthe TPC gas and the time difference between the beam crossing and the start of digitization.
For the measurement of z coordinates one needs to know the drift velocity of electrons in
drift-field distortions with the laser system can be found in Referencereconstructed laser tracks in the TPC. A detailed description of the methods to calibratetermined from a magnetic field map, as measured in 1987 [1], and from the straightness ofend-plates. Distortions due to inhomogeneities of the magnetic and electric fields are deedge of systematic distortions of the tracks during the drift of their ionization towards the
The quality of the track reconstruction in the TPC depends critically on precise knowl
detectors.
track segments fitted in the individual sectors and track segments fitted in the inner trackingplanes are determined by minimizing the azimuthal and longitudinal deviations betweenconstrained to the beam energy in the fit. The positions of each sector in the rd> and rzevents from the process Z —> p+;f, where the radially outgoing muons have their momentum
The relative alignment of the 18 sectors on each end·plate is determined with two—track
cathode pads arranged in 21 concentric circles.by a system of proportional wire chambers (known as sectors), read out using segmentedtracks at radii between 30 and 180 cm. The ionization charge is recorded at two end—platesThe TPC [1, 4] provides 21 three·dimensi0nal space-point measurements for fully contained
3.3 Time projection chamber
extrapolated from the TPC into the drift chamber.minimizing the residuals between the measured hits and the expected hit positions of tracksto the TPC are then measured with tracks from the processes Z —> ;.i+;i‘ and Z -> qq , bysurvey data. The three translational alignment parameters and the three Euler angles relativevalues of the alignment constants are determined with the help of cosmic ray tracks and
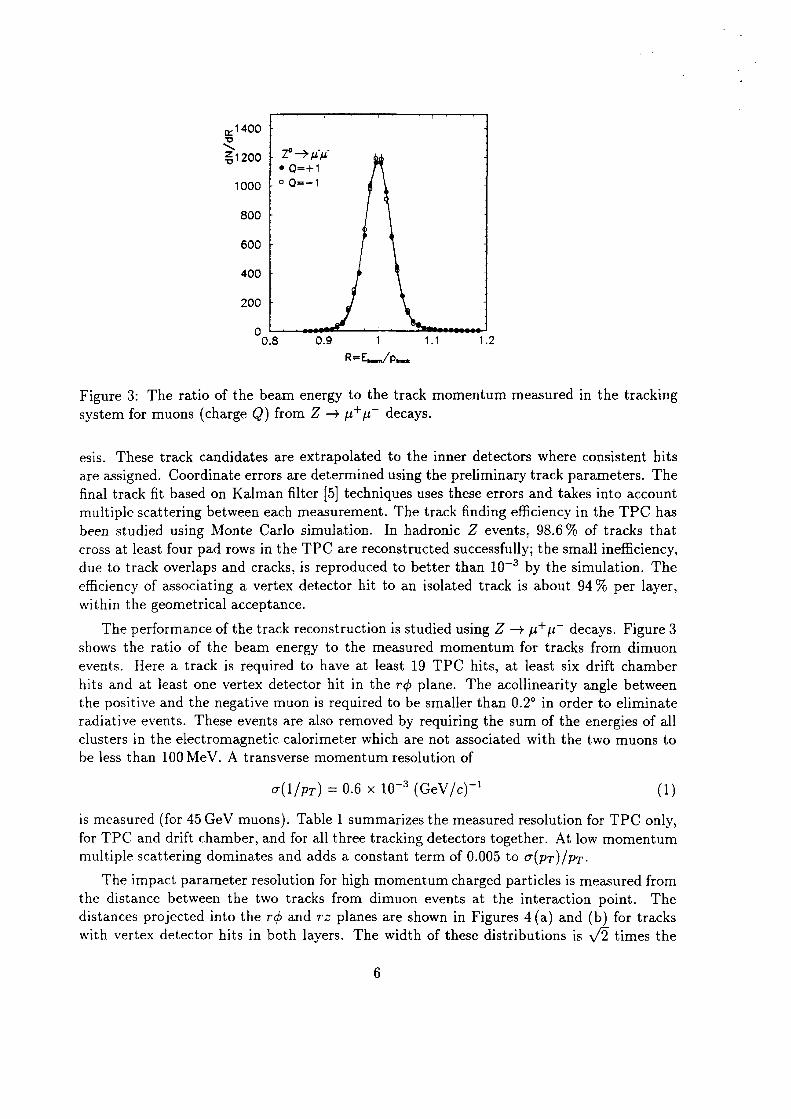
with vertex detector hits in both layers. The width of these distributions is y/5 times the OCR Outputdistances projected into the rqb and rz planes are shown in Figures 4(a) and (b) for tracksthe distance between the two tracks from dimuon events at the interaction point. The
The impact parameter resolution for high momentum charged particles is measured from
multiple scattering dominates and adds a constant term of 0.005 to 0(pT)/pgp.for TPC and drift chamber, and for all three tracking detectors together. At low momentumis measured (for 45 GeV muons). Table 1 summarizes the measured resolution for TPC only,
(1)0(1/pT) = 0.6 ><10`3(GeV/c)`
be less than 100 MeV. A transverse momentum resolution of
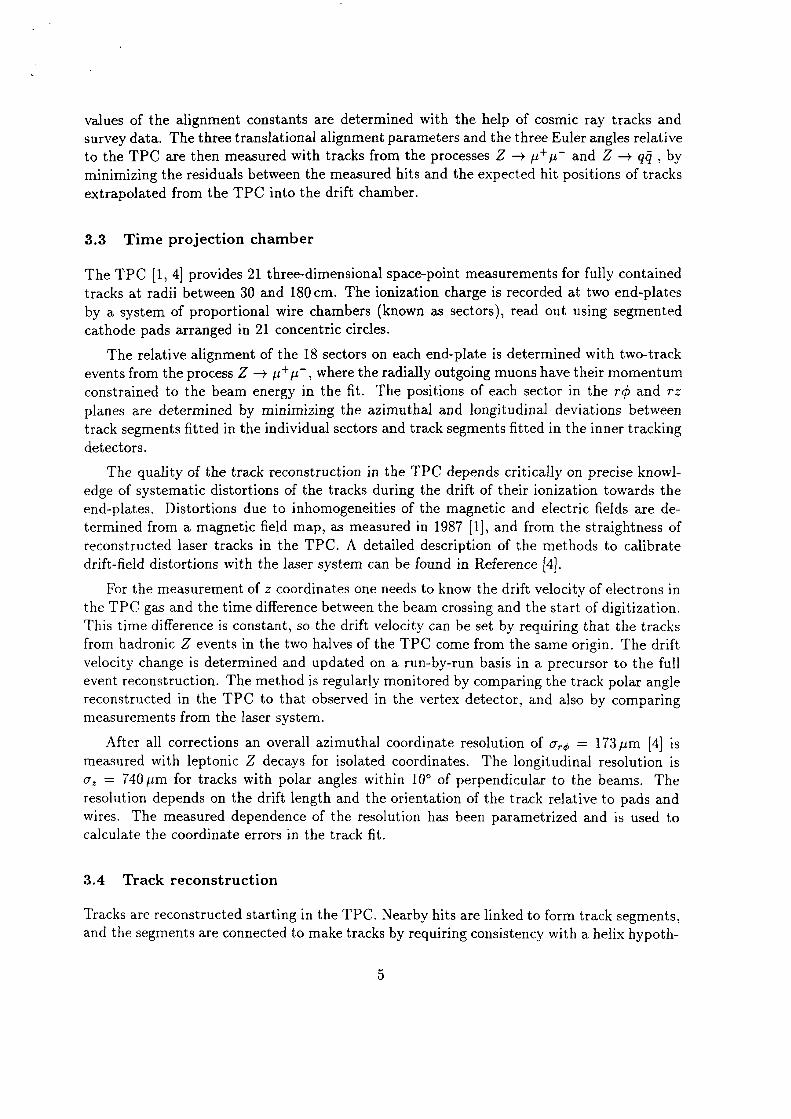
clusters in the electromagnetic calorimeter which are not associated with the two muons toradiative events. These events are also removed by requiring the sum of the energies of allthe positive and the negative muon is required to be smaller than 0.2° in order to eliminatehits and at least one vertex detector hit in the rgb plane. The acollinearity angle betweenevents. Here a track is required to have at least 19 TPC hits, at least six drift chambershows the ratio of the beam energy to the measured momentum for tracks from dimuon
The performance of the track reconstruction is studied using Z -> p1' p` decays. Figure 3
within the geometrical acceptance.efficiency of associating a vertex detector hit to an isolated track is about 94% per layer,due to track overlaps and cracks, is reproduced to better than 10'3 by the simulation. Thecross at least four pad rows in the TPC are reconstructed successfully; the small inefficiency,been studied using Monte Carlo simulation. In hadronic Z events, 98.6% of tracks thatmultiple scattering between each measurement. The track finding efficiency in the TPC hasfinal track fit based on Kalman filter [5] techniques uses these errors and takes into accountare assigned. Coordinate errors are determined using the preliminary track parameters. Theesis. These track candidates are extrapolated to the inner detectors where consistent hits
system for muons (charge from Z —> ;1+;f decays.Figure 3: The ratio of the beam energy to the track momentum measured in the tracking
R=E...../¤....
0.8 O.9 1 1.1 1.2
200
400
600
800
1000 ° O=—1
’ O=+1@1 200 Z0_)#.#.
O:1 400
23 I 28+ vertex detector I 0.6 >< 10' OCR Output
107 I 808-I— drift chamber 0.8 >< 10`3
TPC 310 I 8081.2 >< 10‘3
Detector a(1/py) (GeV/c)°1 I r;15(;.1m) I rz (pm)Transverse momentum I Impact parameter
of including the detectors indicated in the fit.Table 1: Momentum and impact parameter resolution; the successive rows show the effect
2 ( )ci = 25 + Lt ¤( ) um MGEV/c)-195 pm
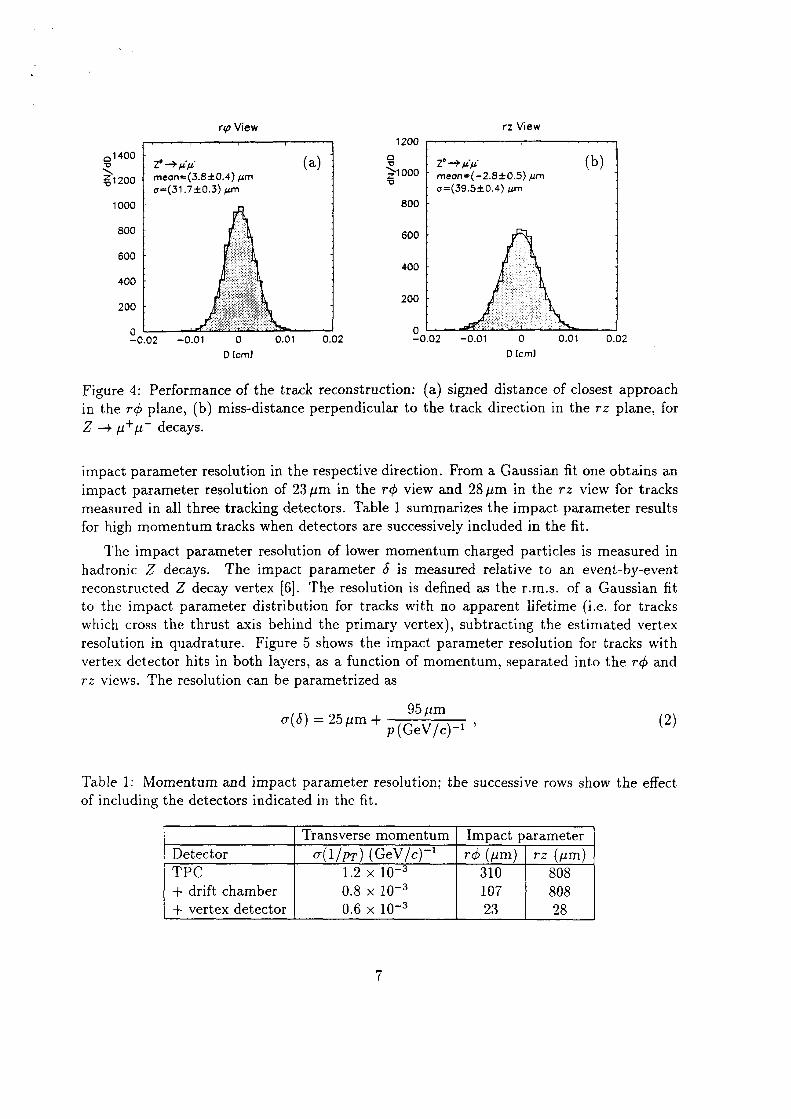
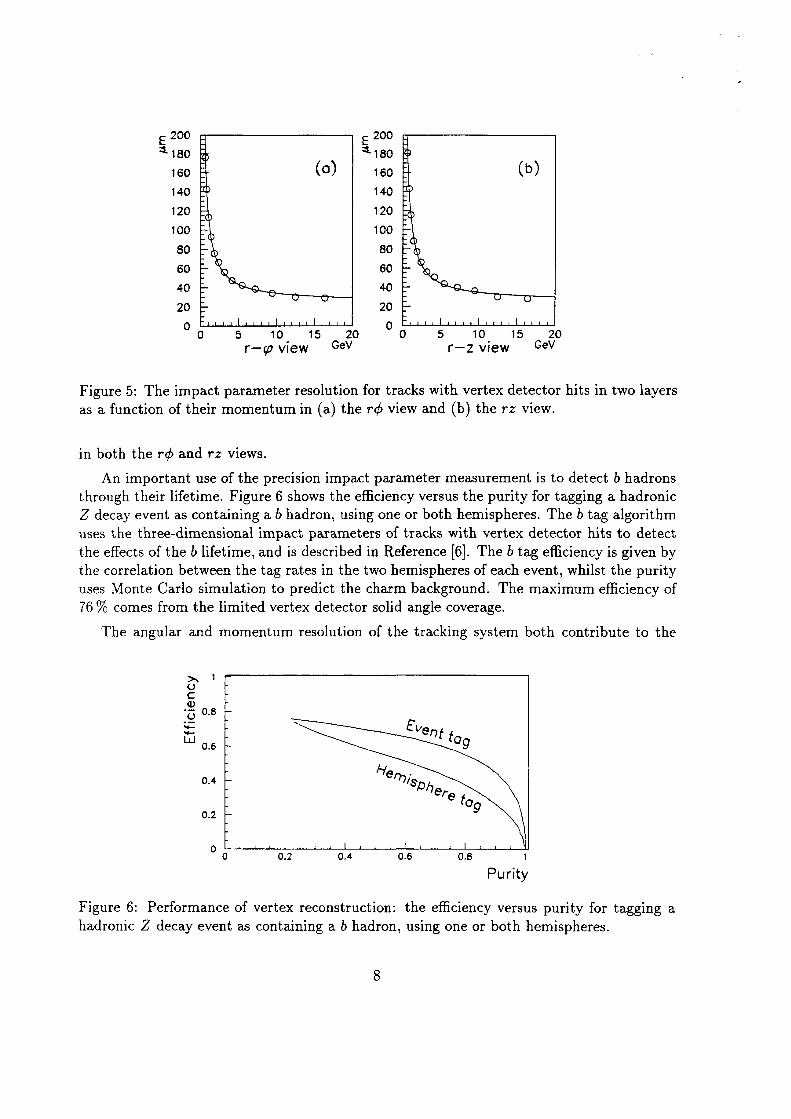
rz views. The resolution can be parametrized asvertex detector hits in both layers, as a function of momentum, separated into the rgb andresolution in quadrature. Figure 5 shows the impact parameter resolution for tracks withwhich cross the thrust axis behind the primary vertex), subtracting the estimated vertexto the impact parameter distribution for tracks with no apparent lifetime (i.e. for tracksreconstructed Z decay vertex The resolution is defined as the r.m.s. of a Gaussian fithadronic Z decays. The impact parameter 6 is measured relative to an event—by-event
The impact parameter resolution of lower momentum charged particles is measured in
for high momentum tracks when detectors are successively included in the fit.measured in all three tracking detectors. Table 1 summarizes the impact parameter resultsimpact parameter resolution of 23 pm in the rqb view and 28 pm in the rz view for tracksimpact parameter resolution in the respective direction. From a Gaussian fit one obtains an
Z —+ ;1'*`;i' decays.in the rq5 plane, (b) miss-distance perpendicular to the track direction in the rz plane, forFigure 4: Performance of the track reconstruction: (a) signed distance of closest approach
Diem] Diem]
;0.02 -0.01 0 0.01 0.02 -0.02 -0.01 0 0.01 0.02
200
400
400
600
600800
1000 800
¤=(31 .710.3) pm ¤=(39.5i0.4) pm$1200 me¤n=(3.8d:0.4) pm mecn=(—2.8¢O.5) ,um\ 21000
Z°é ;.4,'p' Z°+p.`y,'(3,)O1400
1 200
w View rz View
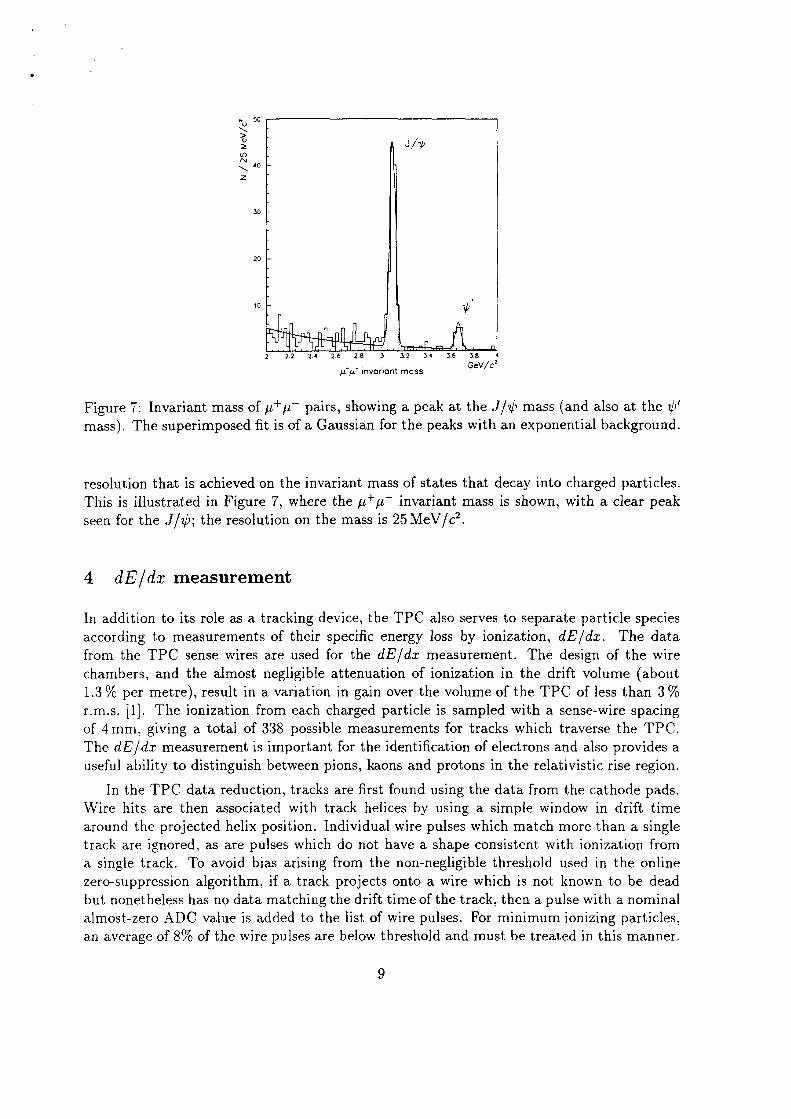
hadronic Z decay event as containing a b hadron, using one or both hemispheres. OCR OutputFigure 6: Performance of vertex reconstruction: the efficiency versus purity for tagging a
Purity
0 0.2 0.4 0.6 0.8 1
0.2
. phen_ 04 Hg . 07 _I
0.6 {O9EL/gn \ f
0.8
The angular and momentum resolution of the tracking system both contribute to the
76 % comes from the limited vertex detector solid angle coverage.uses Monte Carlo simulation to predict the charm background. The maximum efficiency ofthe correlation between the tag rates in the two hemispheres of each event, whilst the puritythe effects of the b lifetime, and is described in Reference The b tag efHciency is given byuses the three—dimensional impact parameters of tracks with vertex detector hits to detectZ decay event as containing a b hadron, using one or both hemispheres. The b tag algorithmthrough their lifetime. Figure 6 shows the efficiency versus the purity for tagging a hadronic
An important use of the precision impact parameter measurement is to detect b hadrons
in both the r¢ and rz views.
as a function of their momentum in (a) the r¢ view and (b) the rz view.Figure 5: The impact parameter resolution for tracks with vertex detector hits in two layers
r-qa view G°V r-z view G°V0 5 10 15 20 ‘ 0 5 10 15 20
20 20
40 40
60 60
80 80
100 100
120 120
140 140
160 (b)(¤) I 160*1601180E 200E 200
an average of 8% of the wire pulses are below threshold and must be treated in this manner. OCR Outputalmost—zero ADC value is added to the list of wire pulses. For minimum ionizing particles,but nonetheless has no data matching the drift time of the track, then a pulse with a nominalzero—suppression algorithm, if a track projects onto a wire which is not known to be deada single track. To avoid bias arising from the non-negligible threshold used in the onlinetrack are ignored, as are pulses which do not have a shape consistent with ionization fromaround the projected helix position. Individual wire pulses which match more than a singleWire hits are then associated with track helices by using a simple window in drift time
In the TPC data reduction, tracks are first found using the data from the cathode pads.
useful ability to distinguish between pions, kaons and protons in the relativistic rise region.The dE/da: measurement is important for the identification of electrons and also provides aof 4mm, giving a total of 338 possible measurements for tracks which traverse the TPC.r.m.s. The ionization from each charged particle is sampled with a sense—wire spacing1.3 % per metre), result in a variation in gain over the volume of the TPC of less than 3 %chambers, and the almost negligible attenuation of ionization in the drift volume (aboutfrom the TPC sense wires are used for the dE/dsc measurement. The design of the wireaccording to measurements of their specific energy loss by ionization, dE/da:. The dataIn addition to its role as a tracking device, the TPC also serves to separate particle species
4 dE/da: measurement
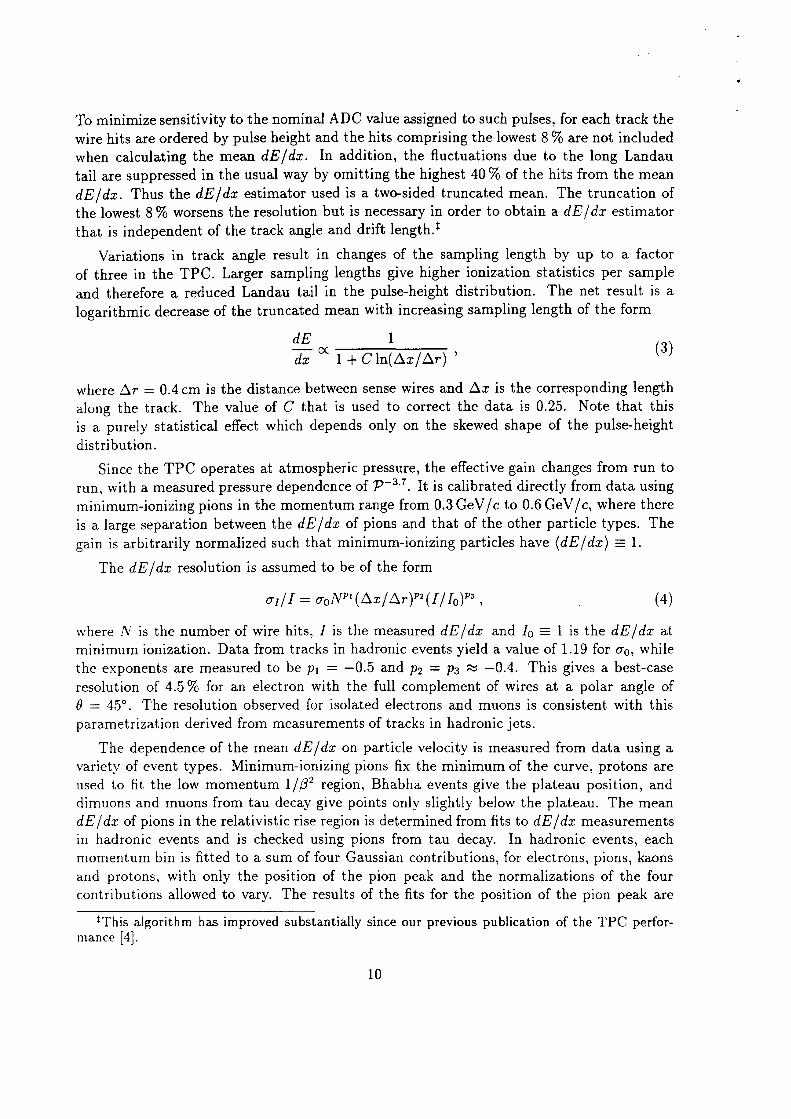
seen for the J/gb; the resolution on the mass is 25 MeV/cz.This is illustrated in Figure 7, where the ;r+;1' invariant mass is shown, with a clear peakresolution that is achieved on the invariant mass of states that decay into charged particles.
mass). The superimposed fit is of a Gaussian for the peaks with an exponential background.Figure 7: Invariant mass of p+;i` pairs, showing a peak at the J/di mass (and also at the gb'
y.`;[ invariant mass SEV/C2 2.2 2.4 2.6 2.8 5 3.2 3,4 3.6 5.B ;
\ 40
J/ 1//
no 50
10 OCR Output
mance
*This algorithm has improved substantially since our previous publication of the TPC perfor
contributions allowed to vary. The results of the Hts for the position of the pion peak areand protons, with only the position of the pion peak and the normalizations of the fourmomentum bin is fitted to a sum of four Gaussian contributions, for electrons, pions, kaonsin hadronic events and is checked using pions from tau decay. In hadronic events, eachdE/dx of pions in the relativistic rise region is determined from fits to dE/dx measurementsdimuons and muons from tau decay give points only slightly below the plateau. The meanused to fit the low momentum l/B2 region, Bhabha events give the plateau position, andvariety of event types. Minimum—ionizing pions fix the minimum of the curve, protons are
The dependence of the mean dE/da: on particle velocity is measured from data using a
parametrization derived from measurements of tracks in hadronic jets.
9 : 45°. The resolution observed for isolated electrons and muons is consistent with this
resolution of 4.5% for an electron with the full complement of wires at a polar angle ofthe exponents are measured to be pl = -0.5 and pg = P3 M -0.4. This gives a best—caseminimum ionization. Data from tracks in hadronic events yield a value of 1.19 for 00, whilewhere N is the number of wire hits, I is the measured dE/dx and Ig E 1 is the dE/do: at
0;/I : a0N"‘(Ax/Ar)"’(I/I0)"3 , (4)
The dE/dsc resolution is assumed to be of the form
gain is arbitrarily normalized such that minimum—ionizing particles have (dE/dx) E 1.is a large separation between the dE/da: of pions and that of the other particle types. Theminimum—ionizing pions in the momentum range from 0.3 GeV/ c to 0.6 GeV/ c, where thererun, with a measured pressure dependence of 'P`3‘7. It is calibrated directly from data using
Since the TPC operates at atmospheric pressure, the effective gain changes from run to
distribution.
is a purely statistical effect which depends only on the skewed shape of the pulse-heightalong the track. The value of C that is used to correct the data is 0.25. Note that thiswhere Ar = 0.4 cm is the distance between sense wires and Az is the corresponding length
da: W 1+ C1n(Ax/Ar)<3>
dB
logarithmic decrease of the truncated mean with increasing sampling length of the formand therefore a reduced Landau tail in the pulse-height distribution. The net result is aof three in the TPC. Larger sampling lengths give higher ionization statistics per sample
Variations in track angle result in changes of the sampling length by up to a factor
that is independent of the track angle and drift length.the lowest 8 % worsens the resolution but is necessary in order to obtain a dE/dsc estimatordE/da:. Thus the dE/da: estimator used is a two-sided truncated mean. The truncation oftail are suppressed in the usual way by omitting the highest 40 % of the hits from the meanwhen calculating the mean dE/dx. In addition, the fluctuations due to the long Landauwire hits are ordered by pulse height and the hits comprising the lowest 8 % are not includedTo minimize sensitivity to the nominal ADC value assigned to such pulses, for each track the
11 OCR Output
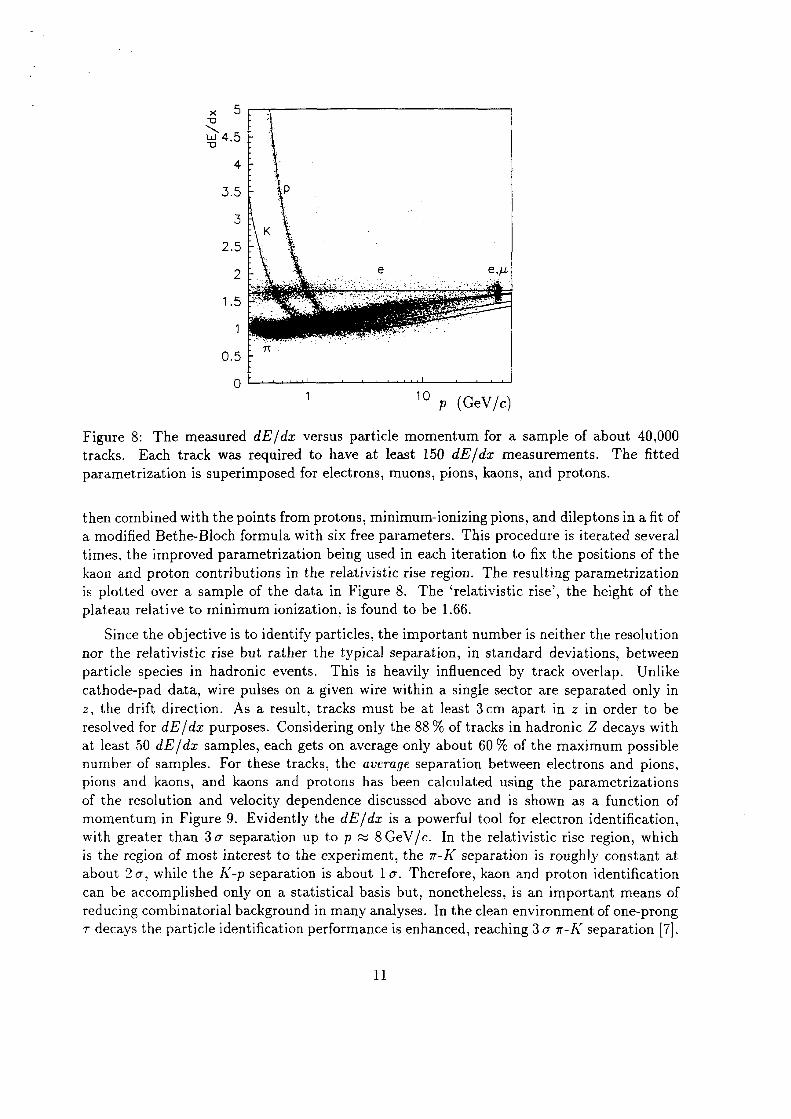
T decays the particle identification performance is enhanced, reaching 3 0 rr-K separationreducing combinatorial background in many analyses. In the clean environment of one-prongcan be accomplished only on a statistical basis but, nonetheless, is an important means ofabout 2 0, while the K—p separation is about 10. Therefore, kaon and proton identificationis the region of most interest to the experiment, the rr-K separation is roughly constant atwith greater than 30 separation up to p z 8GeV/c. In the relativistic rise region, whichmomentum in Figure 9. Evidently the dE/dz is a powerful tool for electron identification,of the resolution and velocity dependence discussed above and is shown as a function ofpions and kaons, and kaons and protons has been calculated using the parametrizationsnumber of samples. For these tracks, the average separation between electrons and pions,at least 50 dE/dx samples, each gets on average only about 60 % of the maximum possibleresolved for dE/dx purposes. Considering only the 88 % of tracks in hadronic Z decays withz, the drift direction. As a result, tracks must be at least 3cm apart in z in order to becathode-pad data, wire pulses on a given wire within a single sector are separated only inparticle species in hadronic events. This is heavily influenced by track overlap. Unlikenor the relativistic rise but rather the typical separation, in standard deviations, between
Since the objective is to identify particles, the important number is neither the resolution
plateau relative to minimum ionization, is found to be 1.66.is plotted over a sample of the data in Figure 8. The ‘relativistic rise’, the height of thekaon and proton contributions in the relativistic rise region. The resulting parametrizationtimes, the improved parametrization being used in each iteration to fix the positions of thea modified Bethe-Bloch formula with six free parameters. This procedure is iterated severalthen combined with the points from protons, minimum-ionizing pions, and dileptons in a fit of
parametrization is superimposed for electrons, muons, pions, kaons, and protons.tracks. Each track was required to have at least 150 dE/dx measurements. The fittedFigure 8: The measured dE/dx versus particle momentum for a sample of about 40,000
p (asv/C)*0
0.5 E "
1.5 ._·=‘ ri
2.5
5.5 P ip
Lu`4.5
X 5
12 OCR Output
associated to an Fe55 source. The peak of the Fe55 source is used to monitor the gain; theFor each module the gas gain is monitored by a small single-wire proportional chamber
trigger.
planes of each module, providing redundancy in the energy measurement and a low—noiseof photons, electrons and neutral pions. ln addition, signals are also available from the wireaverage granularity of 0.9°>< 0.9°; this fine segmentation is important in the identificationrespectively to (4, 9,9) radiation lengths. There are 74,000 such towers, corresponding to anpoint; each tower is read out in three segments in depth, known as storeys, correspondingpads with dimensions ~ (30 >< 30) mm, arranged to form towers pointing to the interactionradiation lengths. The energy and position of each shower is read out using small cathodeangle of 30°. The modules have 45 lead/wire—chamber layers, with a total thickness of 22end by an end-cap. These are each divided into 12 modules, each covering an azimuthalThe electromagnetic calorimeter is formed of a barrel surrounding the TPC, closed at each
5.1 Electromagnetic calorimeter
tion 10.
hadronic showers, using both calorimeters in an energy-flow algorithm, is discussed in Secof its response; the second part is devoted to the hadron calorimeter. The performance forcerning its energy and spatial resolution for electromagnetic objects, as well as the uniformityThe first part of this section is devoted to the electromagnetic calorimeter performance con
5 Calorimeter performance
computed using all tracks in hadronic Z decays which have at least 50 dE/dx measurements.Figure 9: The average dE/dz separation in standard deviations between particle types,
Momentum (GeV/c)1 5 9 13 17
·K—p separation
·· vv-K separation
e—1r separation
13 OCR Output
tion is plotted in Figure 10 (b) as a function of polar angle, and shows the degradation ofa(E)/E : 0.178/\/E/GeV @0.019. For electrons from Bhabha events the energy resoluwhere a linear sum is used as it gives the best fit; using a quadratic form would give
E ,/E/GeV(5)0(E) 0.18 —-- = ————— + 0.009
corresponding fitted resolution ismentum or beam energy, is shown in Figure 10 (a) as a function of the electron energy. The
The energy resolution, determined by comparing the measured energy to the track mo
1.5 % at lower energy.these effects the precision on the module intercalibration is better than 0.3 % at 45 GeV andcorrected using test—beam results, ECO,. = E >< (1 -I— 0.00078E/GeV). After accounting forradiation lengths. In addition the non—linearity of the calorimeter response to electrons isthe calorimeter, and the leakage of electromagnetic showers not fully contained in the 22losses due to the storey threshold, the ionization losses for charged particles before enteringhave in common at least a storey edge or corner. The recorded energy is corrected for energygathers in a single object, or ‘cluster’, all individual storeys above a 30 MeV threshold thatand Bhabha events for 45 GeV. The basic information used is the output of an algorithm thatthe 1 to 10 GeV energy range, Z —~> 1·+1·‘ (·r —-> eu?) to cover the 10 to 30 GeV energy range,range from 1 to 45 GeV. These electrons originate from the reactions e+e` —> e+e‘e+e' for
The energy calibration procedure uses electrons from different sources covering the energy
variation a stability of better than 0.3 % is reached.circuit system providing a nearly constant pressure. After correcting for the measured gainamplitude of the gain variation is limited to 2-3% over a year as the gas is in a closed
(b) dependence on polar angle for electrons from Z —> e+e' decays.Figure 10: Energy resolution of the electromagnetic calorimeter; (a) dependence on energy,
0 (degrees)1/\/E (sev-1/2)zcscacsosorusosc
0 0.1 0.2 0..3 0.4 0.5 0.6 0.7 O.! 0,9 1
0.010.05
0.02
0.05Eu` 0.1:
¥+ -+—+-+-+-+—+—+—+
0.2 _ I Wt + .
0.25 0.05
(b)(a)0.3 0.06
14 OCR Output
electromagnetic calorimeter towers.projective towers with a typical tower coverage of 3.7°>< 3.7°, corresponding to 4 >< 4 of the36 modules, 24 in the barrel and 6 in each end—cap, and is read out capacitatively in 4788giving a total of 7.2 interaction lengths at 90 degrees. The calorimeter is constructed fromsystem. It consists of 23 layers of plastic streamer tubes separated by 5cm thick iron slabs,calorimeter, to measure hadronic energy deposits, and it is part of the muon identificationThe hadron calorimeter serves two purposes. It is used, together with the electromagnetic
5.2 Hadron calorimeter
O’g_¢ = (2.5/\/E/GeV + 0.25) mrad.of the tower coordinates; after applying this correction the angular resolution obtained isity being comparable to the electron shower size. It is corrected by a periodic functionis shown in Figure 11. The observed ‘S-shape’ effect is due to the calorimeter granularthe expected value obtained using the extrapolation of electron tracks in Bhabha eventsof the polar and azimuthal angle of individual storeys in the cluster. The deviation from
The polar and azimuthal angles of a shower are calculated by an energy-weighted mean
correction the energy resolution is degraded by about 30 % in the overlap region.to showers in that region, evaluated from test-beam results in a comparable set·up. Afterof modules and cables. To compensate for these energy losses, special corrections are maderadiation lengths, and in addition there is more uninstrumented material due to end—platesbarrel and end-cap modules. In that region the total thickness decreases, reaching only 1640° in polar angle is the overlap region, where the electromagnetic shower develops into bothto the edge of a module is greater, and the resolution is slightly degraded; the region aroundthe resolution in two regions of the detector: at small polar angle the fraction of events close
determined by extrapolating Bhabha tracks into the calorimeter.Figure 11: Barycentre reconstruction in the O angle as a function of the hit coordinate 00,
0 — 00 (fad)
:0.005-0.00+-0.003-0.002-0.001 0 0.0010.002 0.003 0.004 0.005
¤.¤l1I.l¤¤.·
·DDU¤¤_ U DDD D _0.002·¤D¤D ··¤E¤¤·uumn ,0.004
·¤DD··¤¤DD¤D D ¤ D .0.006
. ummm.
. ¤ . Ug .g¤ u ¤0.008
¤U··· Q ¤¤0.01 . ¤QD¤
- ul;-DD ·
0.012 ¤¤¤Q.mE.
.D¤¤.
0.014 ¤¤Q¤¤·· DDQ ¤¤·—¤ D D ¤
¤¤¤¤·0.016
15
E \/E/GeV(6) OCR Output
0(E) 0.85
resolution of the hadron calorimeter for pions at normal incidence issingle-prong tau decays, as shown in Figure 13 for two momentum intervals. The energyThe correctness of the calibration for hadronic showers has been checked using hadrons fromclusters per hadronic event. Figure 12 shows the energy distribution for muons from Z decay.the electromagnetic calorimeter described in the previous section, yielding an average of 9
The tower information is reconstructed in the form of clusters, in a similar fashion to
independent of energy in the range of interest for this experiment.have been calculated with a simulation tuned on test-beam data, and turn out to be roughlychange in sampling frequency and streamer production rate. The equalization coefficientsand at low angle; the second is to suppress the angular dependence of the signal, due to thecorrect for the energy loss in cracks between modules, in the barrel—endcap overlap regionof a 90 degree tower, without dead zones. The equalization has two purposes: the first is tothe calorimeter modules. The tower responses are equalized in order to reproduce the signalthe hadronic shower measurement, while hadronic Z decays are employed to intercalibrate
The 45 GeV muons produced in Z —> p+,u` decays are used to set the energy scale for
10 % due to pressure and temperature changes have been observed over a year.measures variations in the calibration with a precision of about 0.4%; variations of up todependence of the calorimeter calibration is followed by a gas monitoring system [8] whichdescribed in Section 10. Trigger signals are derived from the wires of the tubes. The timeof muons, described in Section 7 and, together with the towers, in the energy—flow algorithm,ing a two-dimensional projection of the energy deposition. This is used in the identification
In addition a digital (yes or no) signal is recorded for each of the 1 cm wide tubes, provid
Z -—> p+p‘ events.Figure 12: Distribution of the energy measured in the hadron calorimeter for muons from
E (GeV)
0 5 10 1 5 20 25
100
200
300
400
500 + Doto
____ MC600
700
16 OCR Output
larity is designed to provide good e-rr separation in jets. Both the compactness of electroThe electromagnetic calorimeter has been described in the previous section. lts granu
isolated wire hits.
electrons. To ensure a reliable measurement of RI, tracks are required to have at least 50where the dE/dx resolution 0; was defined in Section 4. This is normally distributed for
(7)I- I R; = Athat expected for an electron (I ),measuring specific ionization, RI, is calculated by comparing the measured dE/dx, I, toThe dE/dx is measured for each track in the TPC, as described in Section 4. An estimator
6.1 Electron identification estimators
to be measured using data, over a large part of the acceptance.calorimeter at high momentum. The redundancy allows the performance of each estimatordE/da: is more effective at low momentum, and the shape of showers in the electromagneticmally distributed estimators, on which cuts are applied to select electron candidates. Theand the expected shape of the shower. The basic information is expressed in terms of nordeposition measured in the electromagnetic calorimeter, compared to the track momentumments, the dE/dx measurement from the TPC (described in Section 4) and the energyElectron identification is performed using two independent and complementary measure
6 Electron identification
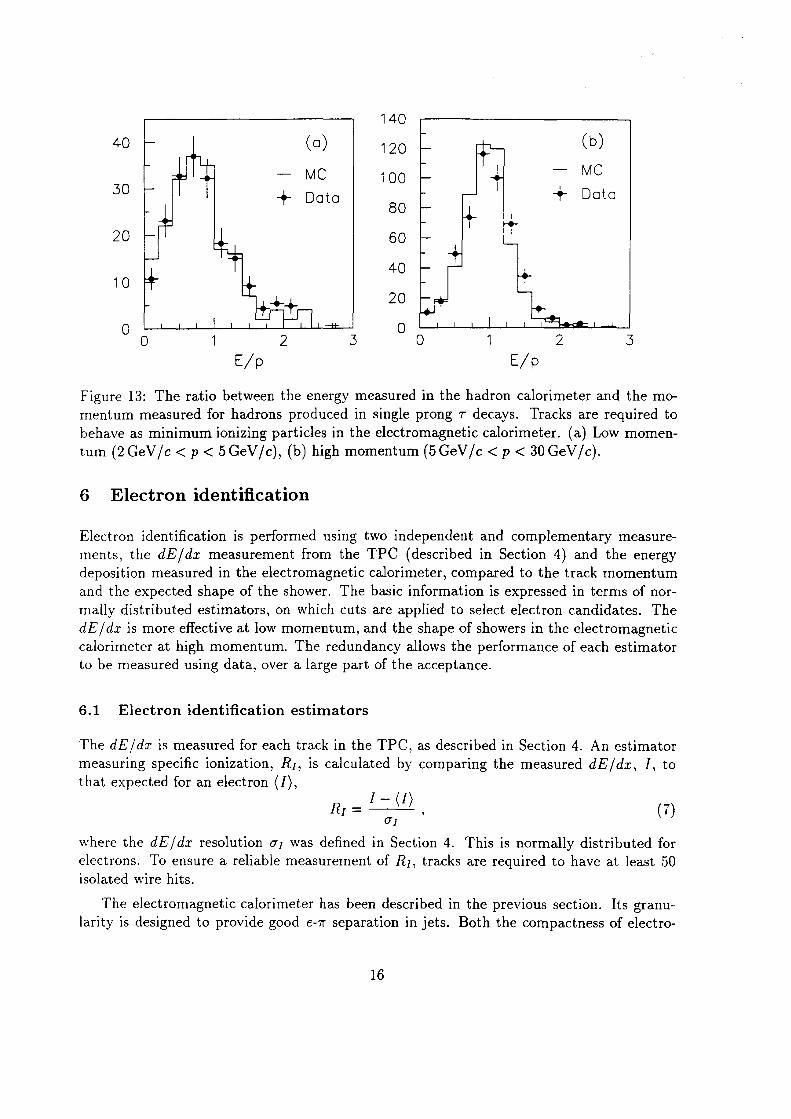
turn (2 GeV/c < p < 5GeV/c), (b) high momentum (5 GeV/c < p < 30 GeV/c).behave as minimum ionizing particles in the electromagnetic calorimeter. (a) Low momenmentum measured for hadrons produced in single prong T decays. Tracks are required toFigure 13: The ratio between the energy measured in the hadron calorimeter and the mo
E/p E/p
3 0
20
TO
40
6020
D t O O I 80 + D0t050Mc | 100 MC
40 (0) I 120 Cb)
l 4O
17 OCR Output
lower multiplicity leptonic decays, discussed below in Section 7.3.hadronic Z decays. Much higher efficiency and discriminating power can be obtained forThe electron identification performance is described here in the jet environment typical of
6.2 Electron identification in hadronic jets
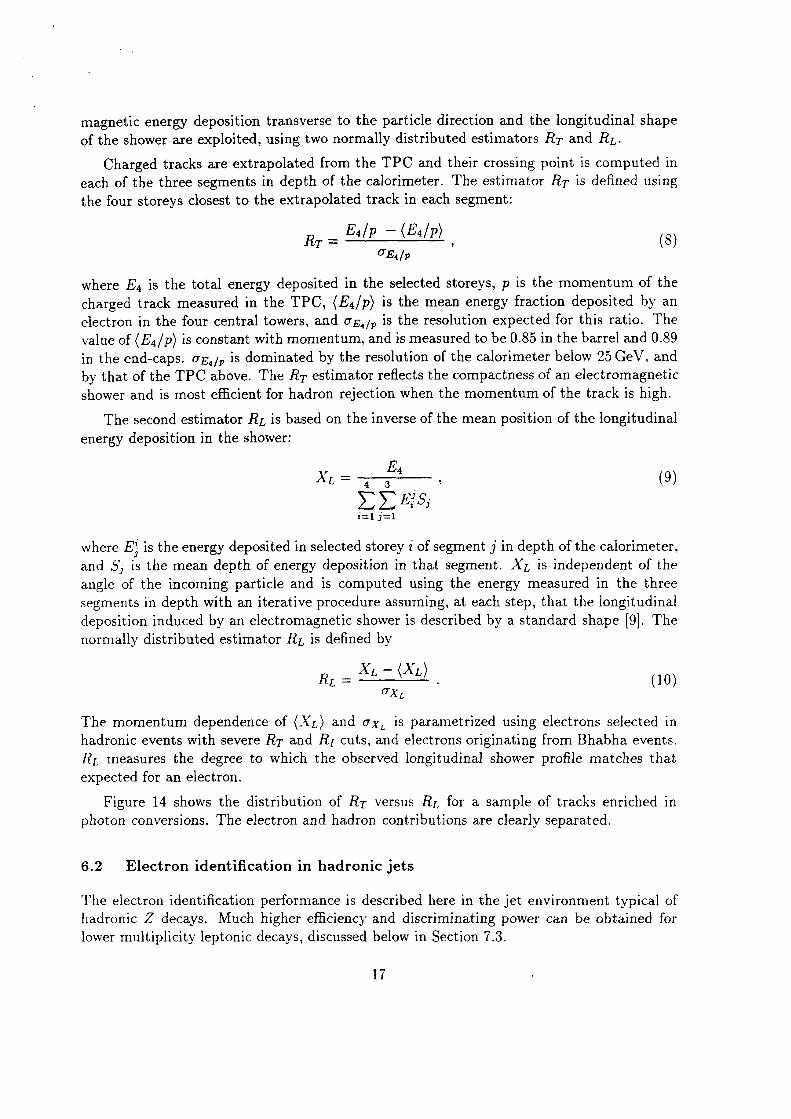
photon conversions. The electron and hadron contributions are clearly separated.Figure 14 shows the distribution of RT versus RL for a sample of tracks enriched in
expected for an electron.RL measures the degree to which the observed longitudinal shower profile matches thathadronic events with severe RT and RT cuts, and electrons originating from Bhabha events.The momentum dependence of (XL) and UXL is parametrized using electrons selected in
UXLRL : (10)
X — X L < Ll
normally distributed estimator RL is defined bydeposition induced by an electromagnetic shower is described by a standard shape Thesegments in depth with an iterative procedure assuming, at each step, that the longitudinalangle of the incoming particle and is computed using the energy measured in the threeand Sj is the mean depth of energy deposition in that segment. XL is independent of thewhere is the energy deposited in selected storey i of segment j in depth of the calorimeter,
i=1 j=1
EineL Z TT" » (9)
energy deposition in the shower:The second estimator RL is based on the inverse of the mean position of the longitudinal
shower and is most efficient for hadron rejection when the momentum of the track is high.by that of the TPC above. The RT estimator reflects the compactness of an electromagneticin the end-caps. UE4/p is dominated by the resolution of the calorimeter below 25 GeV, andvalue of (E.,/p) is constant with momentum, and is measured to be 0.85 in the barrel and 0.89electron in the four central towers, and UE,/,, is the resolution expected for this ratio. Thecharged track measured in the TPC, (E4/p) is the mean energy fraction deposited by anwhere E., is the total energy deposited in the selected storeys, p is the momentum of the
UE4/PRT I is
E /p — E /p 4 ( 4 1
the four storeys closest to the extrapolated track in each segment:each of the three segments in depth of the calorimeter. The estimator RT is defined using
Charged tracks are extrapolated from the TPC and their crossing point is computed in
of the shower are exploited, using two normally distributed estimators RT and RL.magnetic energy deposition transverse to the particle direction and the longitudinal shape
18 OCR Output
mean efficiency is 0.785 zh 0.006.overlap and end—cap regions, due to the relatively larger size of cracks in the end-caps. Theexpected from the definition of the estimators. There is a decrease in the efficiency in thea transverse momentum dependence of the electron identification efficiency is observed, asis measured with respect to p, pT_ and 9 of the track. No evidence for a momentum orcuts to the other track in the pair. The efficiency of the identification by the calorimeterof 98% is obtained by applying additional calorimeter and/or dE/dx electron identificationdetector, drift chamber and inner wall of the TPC. From this sample an electron purityfrom data using the e+e` pairs produced by photon materialization in the beam pipe, vertex
The electron identification efficiency using the calorimeter alone is directly measured
more than 50 wire hits, and is found to be 0.834 :l; 0.002.measured precisely from data by counting the fraction of all electron candidates which givetransverse momentum of the electron relative to its associated jet) and 0. The efficiency isment of at least 50 isolated wire hits, for which there is a strong dependence on p, p _L (the
For the electron identification with dE/dx the main source of inefficiency is the require
found in Reference [10].some analyses, in particular for b physics, and more details about the methods used can be
A detailed understanding of the electron identification performance is very important for
additional energy from a bremsstrahlung photon.on the RT estimator because the four central towers associated to an electron can containThey achieve good hadron rejection with a limited efficiency loss. No upper cut is appliedlowing cuts are applied to the estimators: RT > -2.5, -1.8 < RL < 3.0, and -1.6 < RT.
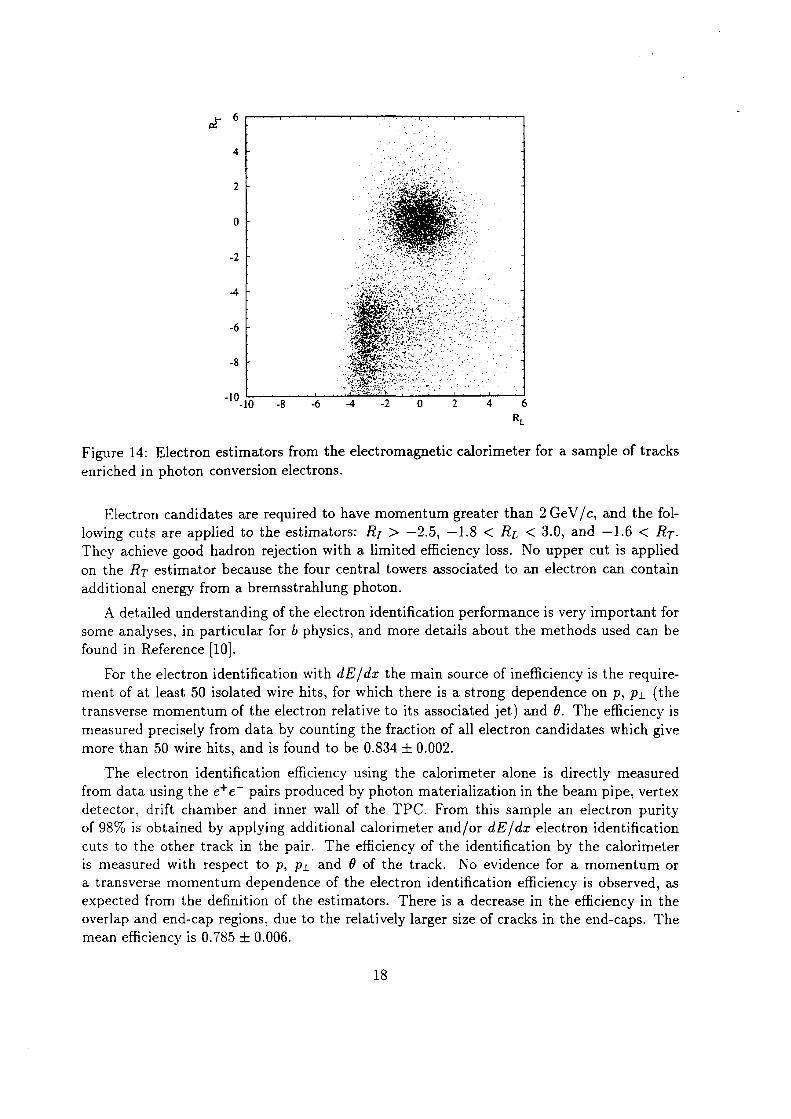
Electron candidates are required to have momentum greater than 2 GeV / c, and the fol
enriched in photon conversion electrons.Figure 14: Electron estimators from the electromagnetic calorimeter for a sample of tracks
-10 -8 -6 -4 -2 0 2 4 6-10
V" `1>*.g:'·=..¤_»gi·n~.7l2}Z-· ` `
>-‘ . . _ .,,.4 Y-:.1·_`·.i·‘<; ;·r$·· - —'
~»vw 2 -n•'=-' ,5: {Tw?. ..¤H`Tx·: M_5.,£. ;*¤ti‘·= .
,; ;:.g_{2*. _·¤;:f•l,1:_,;;j¤,‘ Q! `;.;·€., _ l ‘;§»·* 2 " 2*-·
; .,ZT; it T-_·;;q· 32-». ‘ A‘_». tif ..1 ‘’`‘ Q
~=¤·<· . :4 4: : ` H:yr?I?I~5. 1 5 "Y:v‘¥3;x·;»`;:5 ~¥?*!{·rG·‘\—F··-Y"ix-·$? '.-.. ~.-·· . * r·.é;.;-.4:-‘ .>.‘r·+‘·
-:;-- » ...1. - ‘ {`*'
. .:;z:s»:; »é=. *¤·r1;f?*&.·¤! >." ..;>;.;-g 2,;..-.4, ,.$A·t;·;. :-;.3 AP" ·z·R.`£ V-·¢*‘ ", ’°·; —;·%,¥*‘ *'$:"1 '.; }·*I¥;"
. ,‘? 1*-*1* é»·z\¤‘*·‘ rf `”'*-’¢‘;‘ ~A·‘:`*"`_;z sff·:—»€¢
eve; V `,_ {§Q'‘*·` ` ‘·‘=`‘`° _,,;g;_;;.».:. .— z ¤»$><§·
19 OCR Output
uncertainty due to multiple scattering. A calorimeter plane is said to be expected to fire ifaround the extrapolated track, with a width of three times the estimated extrapolationinto account a detailed magnetic field map and estimated energy losses. A ‘road’ is opened
Tracks are extrapolated (as if they were a muon) through the calorimeter material taking
the whole depth of the calorimeter.the digital readout (described in Section 5.2) to check whether particles penetrate throughtogether with the muon chamber information. Muon identification in the calorimeter usesMuons are identified by making use of the tracking capabilities of the hadron calorimeter,
7 Muon identification
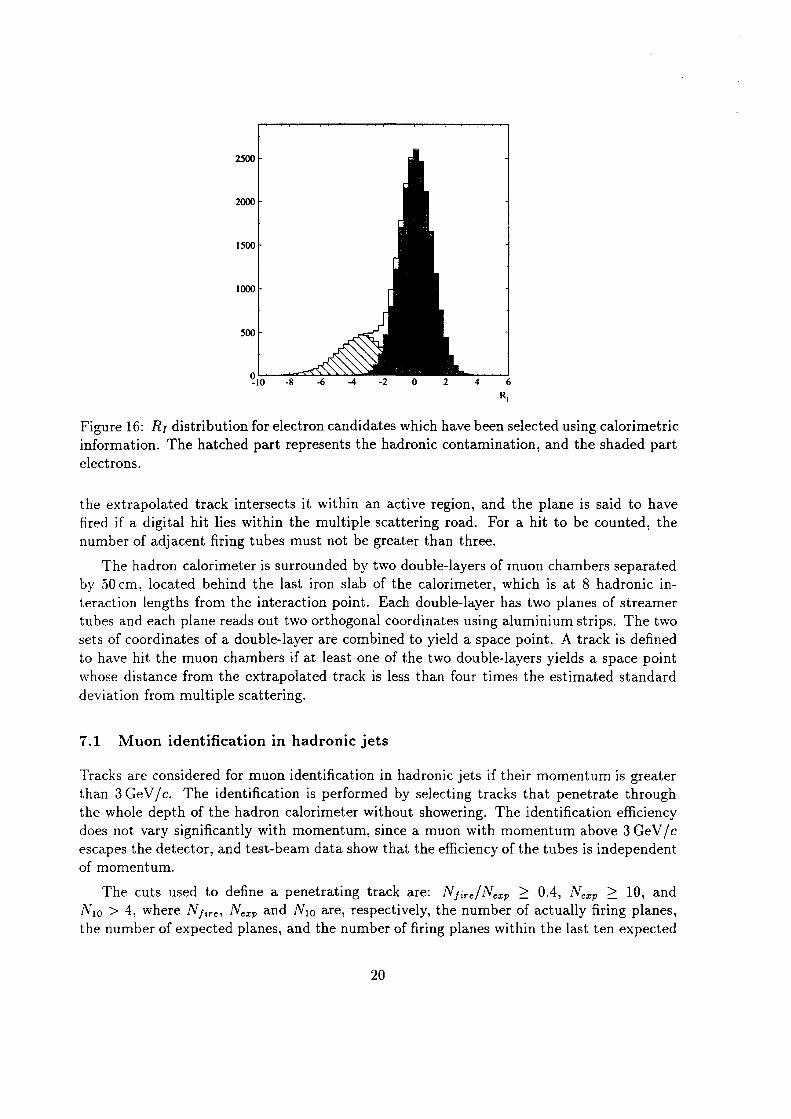
dE/dx cut (R; > -2.5) is included this value becomes (0.95 :l: 0.03) >< 10`a hadron as an electron is calculated. The mean value is (3.44 i 0.05) >< 10`3, and if thedistributions the hadronic contamination is estimated, and the probability of misidentifying
which is taken from tracks which are selected as hadrons in the calorimeter. From these two
the shape of the electrons in this sample, and a contribution from hadrons, the shape ofwhich are measured from the data as a function of p and pl: a fitted Gaussian which giveshave been selected using the calorimeter is shown in Figure 16. It is the sum of two parts,from dE/dx and from the calorimeter. The R; distribution for electron candidates that
The purity of the electron sample is determined from a comparison of the information
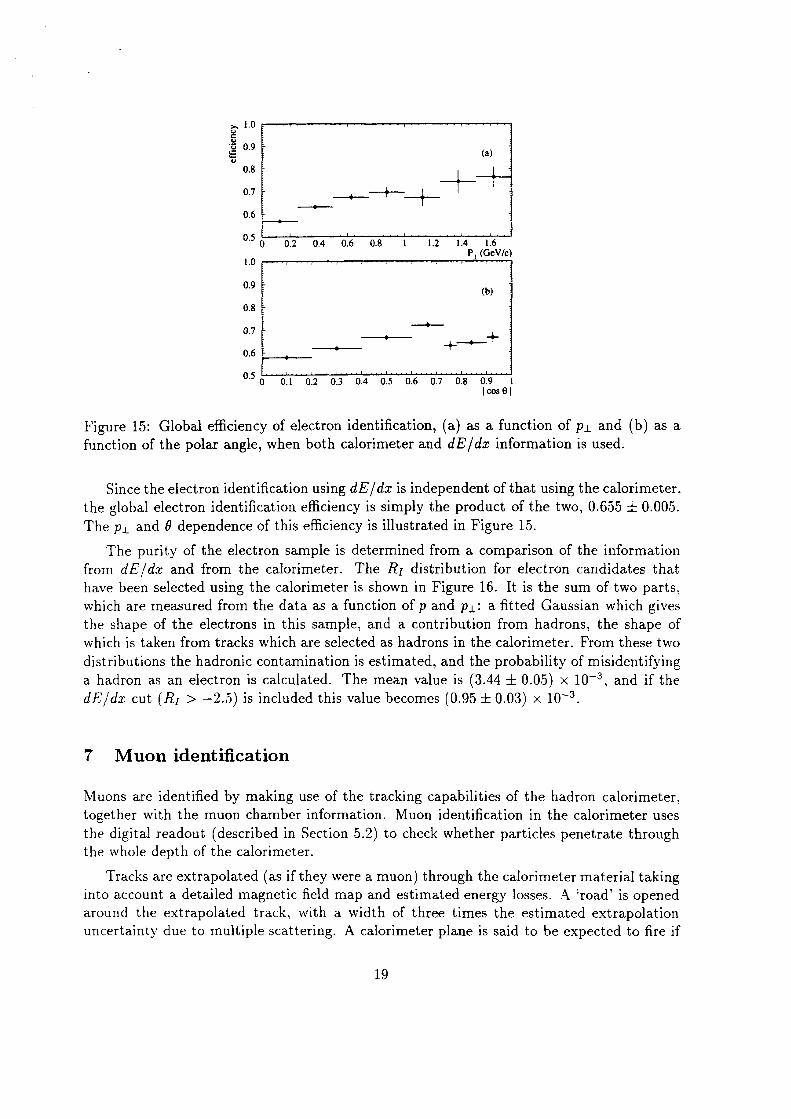
The p _L and 9 dependence of this efliciency is illustrated in Figure 15.the global electron identification efficiency is simply the product of the two, 0.655 :l: 0.005.
Since the electron identification using dE/dx is independent of that using the calorimeter,
function of the polar angle, when both calorimeter and dE/dx information is used.Figure 15: Global efficiency of electron identification, (a) as a function of p L and (b) as a
|c0s6|0 0.1 0.2 0.3 0.4 0.5 0.6 0.7 0.8 0.9 1
0.5
0.6F , ""*‘_
O.7
0.8
(b)0.9
1.0P_L(GeV/c)
O 0.2 0.4 0.6 0.8 l 1.2 1.4 1.60'5
0.6;
0.7 —-+-—
0.8
(a)0.9
>. 1.0
20 OCR Output
the number of expected planes, and the number of firing planes within the last ten expectedNIO > 4, where N fm., Nm, and Nw are, respectively, the number of actually firing planes,
The cuts used to define a penetrating track are: NM,/Nm, 2 0.4, Nm, 2 10, and
of momentum.
escapes the detector, and test-beam data show that the efficiency of the tubes is independentdoes not vary significantly with momentum, since a muon with momentum above 3 GeV/ cthe whole depth of the hadron calorimeter without showering. The identincation efficiencythan 3GeV/ c. The identification is performed by selecting tracks that penetrate throughTracks are considered for muon identification in hadronic jets if their momentum is greater
7.1 Muon identification in hadronic jets
deviation from multiple scattering.
whose distance from the extrapolated track is less than four times the estimated standardto have hit the muon chambers if at least one of the two double-layers yields a space pointsets of coordinates of a double—layer are combined to yield a space point. A track is definedtubes and each plane reads out two orthogonal coordinates using aluminium strips. The twoteraction lengths from the interaction point. Each double—layer has two planes of streamerby 50 cm, located behind the last iron slab of the calorimeter, which is at 8 hadronic in—
The hadron calorimeter is surrounded by two double-layers of muon chambers separated
number of adjacent firing tubes must not be greater than three.fired if a digital hit lies within the multiple scattering road. For a hit to be counted, thethe extrapolated track intersects it within an active region, and the plane is said to have
electrons.
information. The hatched part represents the hadronic contamination, and the shaded partFigure 16: R; distribution for electron candidates which have been selected using calorimetric
im -a 45 .4 -2 0 2 4 6
500
1000
1500
2000
2500
21 OCR Output
simulation, using Z -> ,u+,u` events that have been selected by requiring the presence ofThe hadron calorimeter plane efficiency is mapped in detail in the ALEPH Monte Carlo
7.2 Muon identification performance
chosen. The fraction of prompt muons lost due to this algorithm is about 0.4 %.exactly the same muon chamber hits, the one with the minimum hit—to-track distance ischambers with their two-dimensional points resolve the ambiguity; when both tracks sharecommon hits and both are identified as muons, a choice has to be made. Usually the muonoverlap, and the same hit can be associated to more than one track. When two tracks haveis only in one projection, the multiple scattering ‘roads’ opened around different tracks can
Due to the high track multiplicity inside a jet and the fact that the calorimeter tracking
passed through all the iron.the one-dimensional strips in the calorimeter, and also to the demand that the particle hasciated. This is due to the two-dimensional nature of the muon chamber hits, compared toassociated to a muon chamber hit, only about 20% of the misidentiiied hadrons are asso
dicts that while about 94 % of the muons which have been identified in the calorimeter are
calorimeter criteria, is powerful for background rejection. The Monte Carlo simulation preThe requirement of the associated hits in the muon chambers, in addition to the hadron
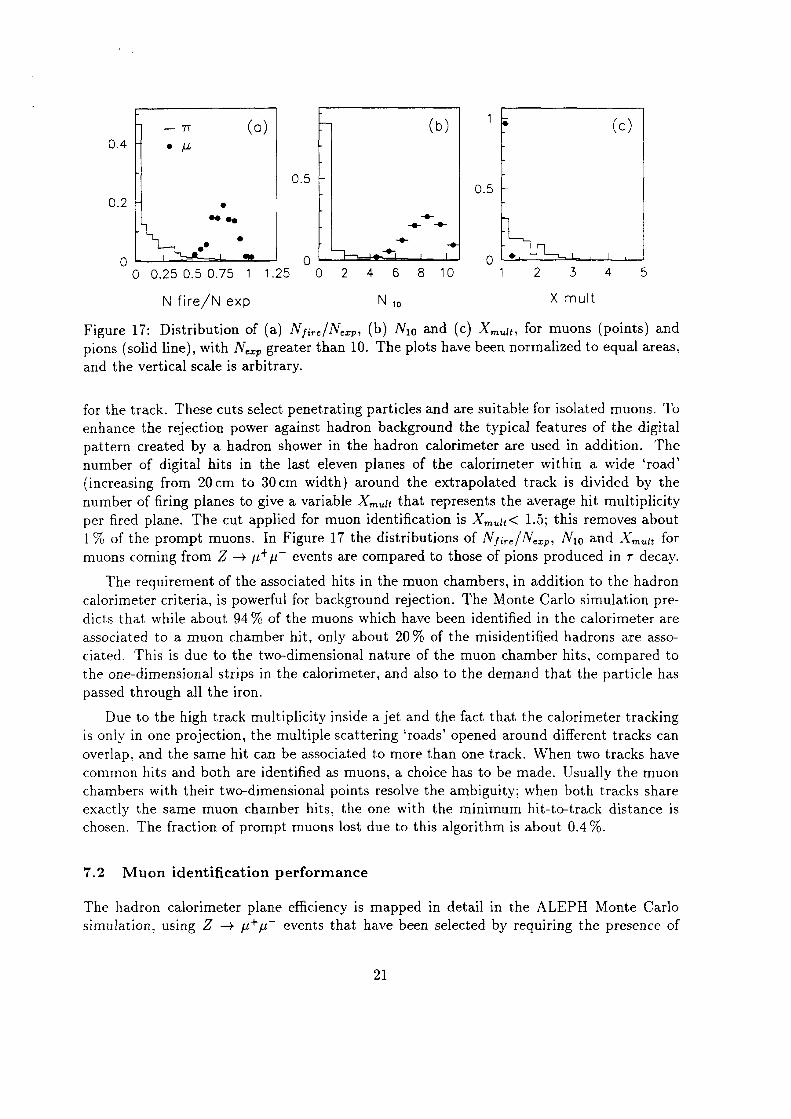
muons coming from Z —> p+p“ events are compared to those of pions produced in ·r decay.1% of the prompt muons. In Figure 17 the distributions of Nfm/New, Nw and Xmul, forper fired plane. The cut applied for muon identification is X,.,,.,;,< 1.5; this removes aboutnumber of firing planes to give a variable Xmuit that represents the average hit multiplicity(increasing from 20cm to 30 cm width) around the extrapolated track is divided by thenumber of digital hits in the last eleven planes of the calorimeter within a wide ‘road’pattern created by a hadron shower in the hadron calorimeter are used in addition. Theenhance the rejection power against hadron background the typical features of the digitalfor the track. These cuts select penetrating particles and are suitable for isolated muons. To
and the vertical scale is arbitrary.pions (solid line), with Nm, greater than 10. The plots have been normalized to equal areas,Figure 17: Distribution of (a) NMC/Ncxp, (b) Nlg and (c) Xmuu, for muons (points) and
N ,0N fire/N exp X mult
0 0.25 0.50.75 1 1.25 0 2 4 6 8 10 1 2 3 4 5
-•- _•OO ••
O.2
O.5O.5
0.4 H • [J,— it <¤) (b) (C)
22 OCR Output
shows that high efficiencies and low misidentiiication rates can be simultaneously achieved.The present performance, given in Table 2 for particles in the 2—45 GeV/ c momentum range,multiplicity). The principle of the method and some early results are given in Reference [11].shower width and penetration, both using the tube readout) and the muon chambers (hitticle type from dE/dsc, electromagnetic calorimeter (RT, RL), hadron calorimeter (averageconstruction of a full likelihood using distributions of discriminating variables for each parmethods can be used. In T decays, the dominant one—prong topology (86%) allows theVV hen charged particles are well isolated from other particles, more optimized identification
7.3 Charged particle identification in T decays
within the TPC volume.
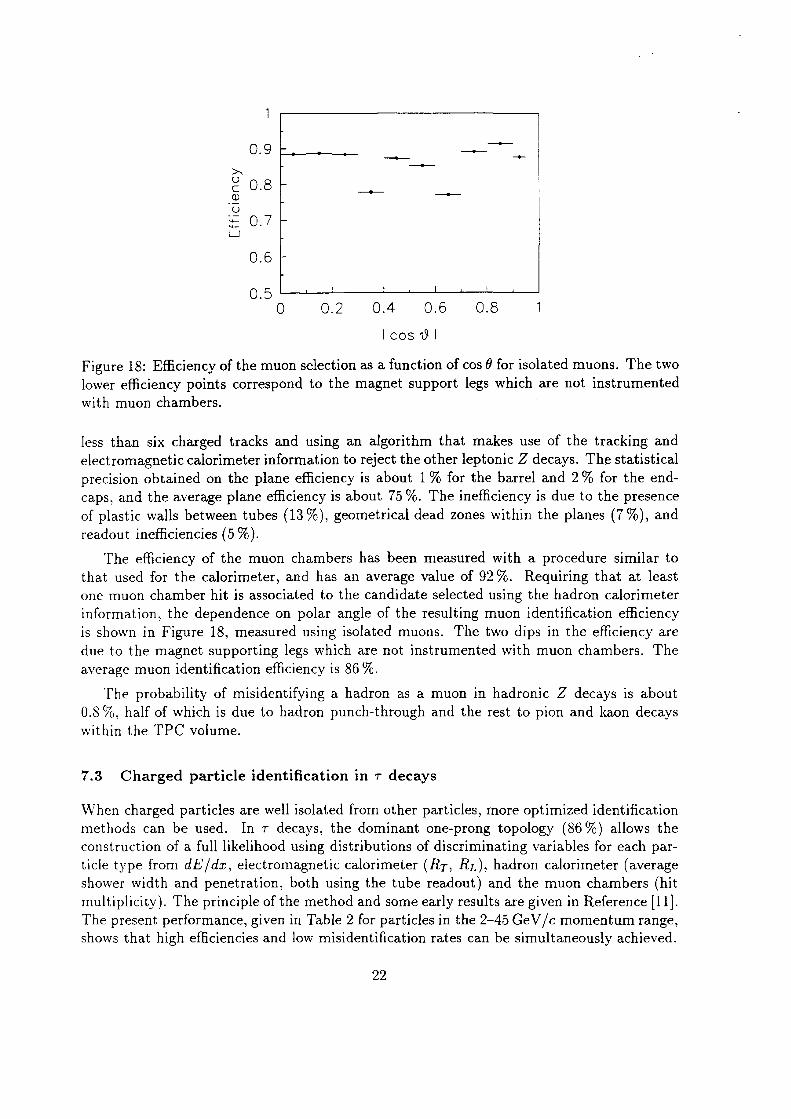
0.8%, half of which is due to hadron punch-through and the rest to pion and kaon decaysThe probability of misidentifying a hadron as a muon in hadronic Z decays is about
average muon identification efficiency is 86 %.due to the magnet supporting legs which are not instrumented with muon chambers. Theis shown in Figure 18, measured using isolated muons. The two dips in the efficiency areinformation, the dependence on polar angle of the resulting muon identification efficiencyone muon chamber hit is associated to the candidate selected using the hadron calorimeterthat used for the calorimeter, and has an average value of 92%. Requiring that at least
The efficiency of the muon chambers has been measured with a procedure similar to
readout inefficiencies (5 %).of plastic walls between tubes (13 %), geometrical dead zones within the planes (7%), andcaps, and the average plane efficiency is about 75 %. The inefficiency is due to the presenceprecision obtained on the plane efficiency is about 1% for the barrel and 2% for the endelectromagnetic calorimeter information to reject the other leptonic Z decays. The statisticalless than six charged tracks and using an algorithm that makes use of the tracking and
with muon chambers.
lower efficiency points correspond to the magnet support legs which are not instrumentedFigure 18: Efficiency of the muon selection as a function of cos 6 for isolated muons. The two
cos v5
0 0.2 0.4 0.6 0.8 10.5
0.6
0.7
___ _•_0.8
0.9 f;_,_...._,_ ____
23 OCR Output
clustering effects, the photon energy is computed from the energy collected in the four centralIn order to reduce the sensitivity of the energy measurement to hadronic background and
parametrization of the S—shape curve described in Section 5.1.storey centre. This position is corrected for the finite size of the calorimeter cells using theis given by the cluster barycentre i.e. the energy—weighted mean of the coordinates of each
The position of a photon impact point is computed in two steps. A first approximation
of less than 2cm from the cluster barycenter.their energy is greater than 0.25 GeV and if there is no charged track impact at a distanceprevious segment. The clusters found by the algorithm are retained as candidate photons ifin depth but then, when processing a storey, the algorithm looks first for a neighbour in theface. The same procedure is then applied to the storeys of the second and third segmentsof the calorimeter two storeys are considered neighbours only when they share a commonadvantage of the compact nature of electromagnetic showers and of the projective geometrycluster. Other storeys are assigned to the cluster of their highest energy neighbour. To takethe order of decreasing energy. A storey without a more energetic neighbour defines a newThe storeys of the first segment in depth of the electromagnetic calorimeter are scanned in
8.1 Photon identification
to the same photon.have a compact arrangement and most of them share a face with another storey associatedthat, unlike the cell patterns of hadronic clusters, storeys receiving energy from a photonshowers generally start in the first segment in depth of the electromagnetic calorimeter andand is applied to the clusters defined in Section 5.1. It uses the facts that electromagneticto identify and reconstruct photons and rr°’s which is better adapted to hadronic Z decaysenergy from photons and hadronic interactions. Consequently a method has been devisedHowever, the clustering algorithm described in Section 5.1 builds big clusters, often mergingresolution to be achieved for photons and Tr°’s up to the highest energies available at LEP.The three—dimensional segmentation of the electromagnetic calorimeter allows a good spatial
8 Photon and Tr° identification
hadron I 0.40 I 0.54 I 98.52
< 0.01 I 99.46 I 0.87
99.60 l < 0.01 I 0.61Identified l e [ {1 [ hadron
True particle type
u-pairs, ·y·y—induced lepton-pairs and pions from hadronic T decays using T0 tagging).perimental results from samples of tagged particles from well-identified processes (Bhabhas,The quoted efficiencies (in %), obtained from a Monte Carlo simulation, agree well with exTable 2: Identification matrix from a likelihood method used in the analysis of T decays.
24 OCR Output
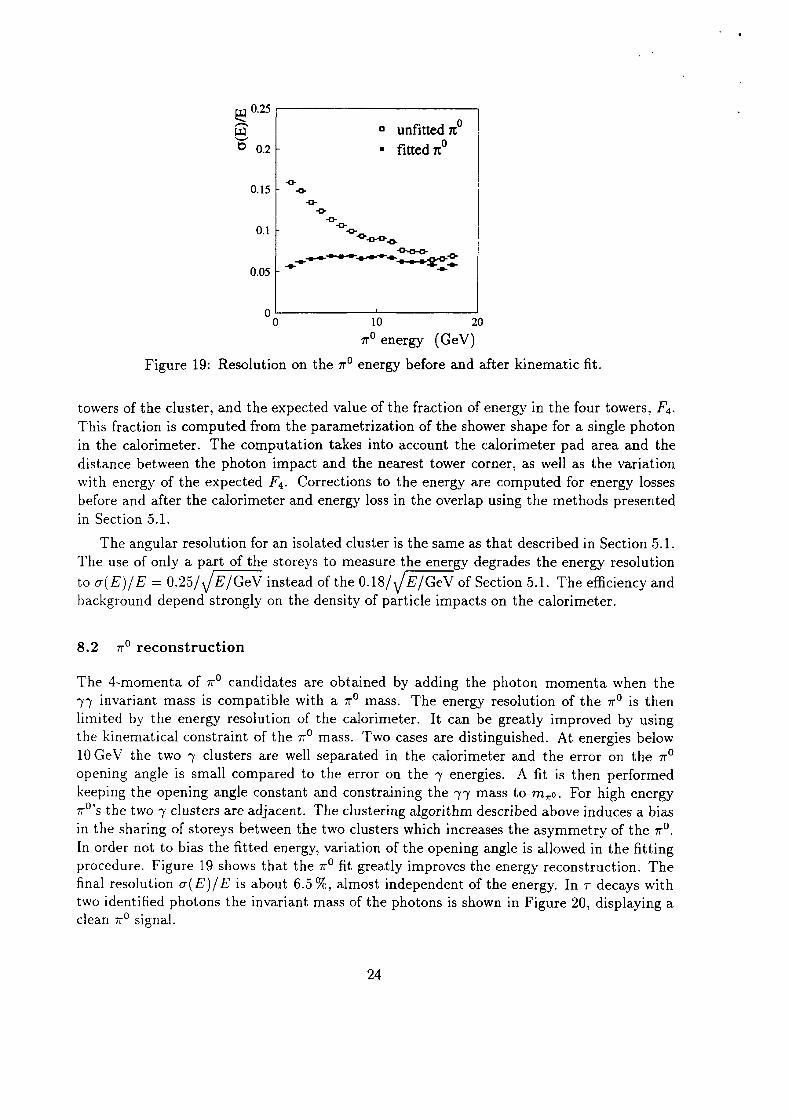
clean vr° signal.two identified photons the invariant mass of the photons is shown in Figure 20, displaying afinal resolution a(E)/E is about 6.5 %, almost independent of the energy. In ·r decays withprocedure. Figure 19 shows that the 11*0 fit greatly improves the energy reconstruction. TheIn order not to bias the Htted energy, variation of the opening angle is allowed in the fittingin the sharing of storeys between the two clusters which increases the asymmetry of the rr°rr°`s the two 7 clusters are adjacent. The clustering algorithm described above induces a biaskeeping the opening angle constant and constraining the 77 mass to m,,¤. For high energyopening angle is small compared to the error on the 7 energies. A fit is then performed10 GeV the two 7 clusters are well separated in the calorimeter and the error on the 7TOthe kinematical constraint of the 71*0 mass. Two cases are distinguished. At energies belowlimited by the energy resolution of the calorimeter. It can be greatly improved by using77 invariant mass is compatible with a rr° mass. The energy resolution of the rr° is thenThe 4—momenta of rr° candidates are obtained by adding the photon momenta when the
8.2 wu reconstruction
background depend strongly on the density of particle impacts on the calorimeter.to 0(E)/E = 0.25/\/E/GeV instead of the 0.18/\/E/GeV of Section 5.1. The efficiency andThe use of only a part of the storeys to measure the energy degrades the energy resolution
The angular resolution for an isolated cluster is the same as that described in Section 5.1.
in Section 5.1.
before and after the calorimeter and energy loss in the overlap using the methods presentedwith energy of the expected F4. Corrections to the energy are computed for energy lossesdistance between the photon impact and the nearest tower corner, as well as the variationin the calorimeter. The computation takes into account the calorimeter pad area and theThis fraction is computed from the parametrization of the shower shape for a single photontowers of the cluster, and the expected value of the fraction of energy in the four towers, F4.
Figure 19: Resolution on the 'JTO energy before and after kinematic fit.
11*0 energy (GeV)10 20
*0.05 1 *
_¤_'¤}¤_-D.0.1
0.15 1 A}
tittedn¤ 0.2
untitted rr
0.25
25 OCR Output
Figure 21: Selection efficiency for rr°’s in hadronic events, with resolved photons.
vr° energy (GeV)0 10 20 30
0.2
0.4P ¤
E ¤°¤.3 ) ¤¤¤°¤¤¤>_O.6
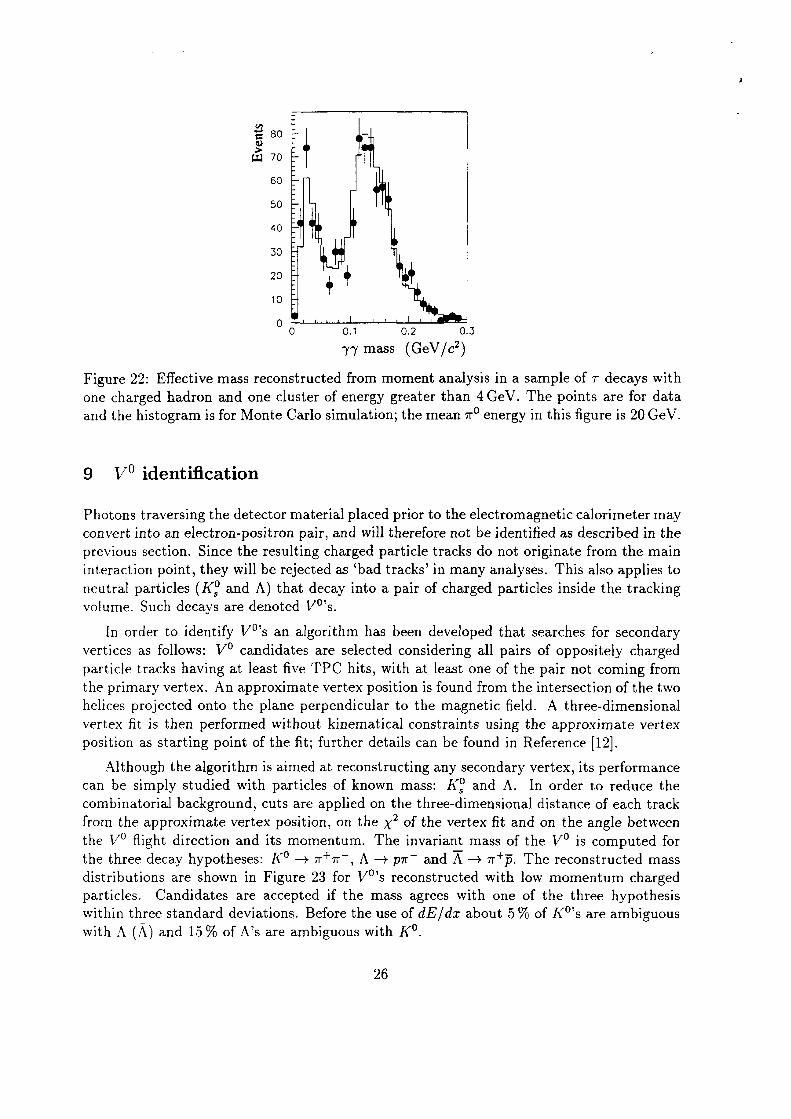
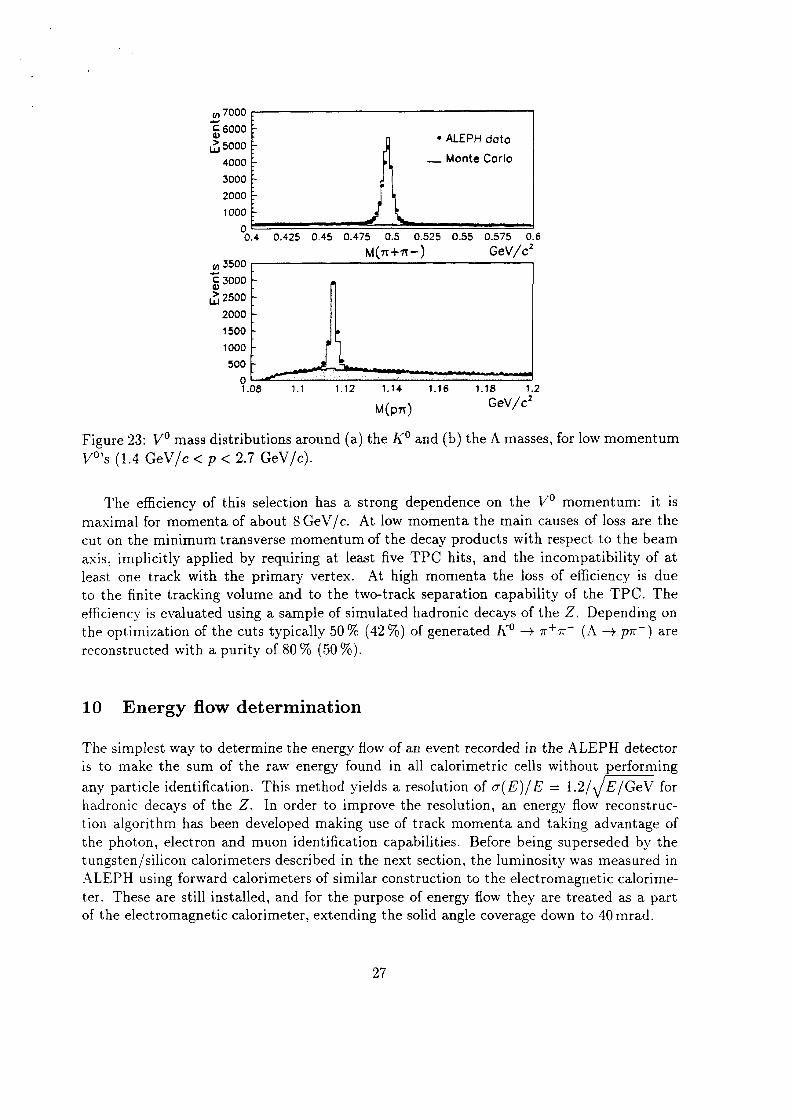
unresolved high energy clusters.displays a broad 11*0 peak and shows that the method allows a check of the 71*0 hypothesis for7 momenta and compute their effective mass. The effective mass spectrum of Figure 22two photons, by using moments up to the third order it is possible to reconstruct the twotwo dimensional energy distribution are computed. Assuming that the cluster contains onlyenergy in the calorimeter. To extract it, energy weighted moments Zi E.x?/ Zi Ei of the10 GeV. Further information is contained in the distribution, within a single cluster, of theergy. The probability to resolve a rr° into two 7 clusters decreases for energies greater than
Figure 21 shows the r1·° selection efficiency in hadronic events as a function of the en—
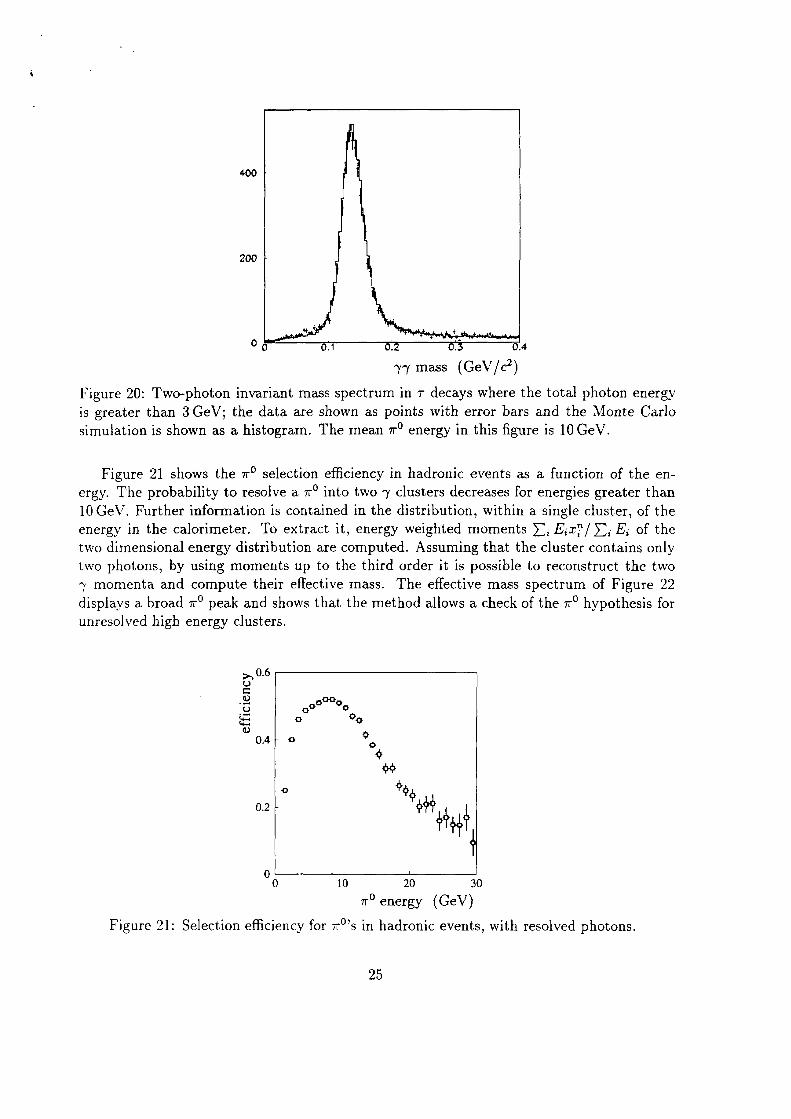
simulation is shown as a histogram. The mean 11*0 energy in this figure is 10 GeV.is greater than 3GeV; the data are shown as points with error bars and the Monte CarloFigure 20: Two—photon invariant mass spectrum in T decays where the total photon energy
77 mass (GeV/cz)
0.4
j.#i..t.•..4$
200
400
26 OCR Output
with A (A) and 15% of A’s are ambiguous with K0within three standard deviations. Before the use of dE/dx about 5 % of Kms are ambiguousparticles. Candidates are accepted if the mass agrees with one of the three hypothesisdistributions are shown in Figure 23 for V°’s reconstructed with low momentum chargedthe three decay hypotheses: K0 —> 7r'*'rr‘, A —> p·rr" and A ——> 11*+5. The reconstructed massthe v° flight direction and its momentum. The invariant mass of the V0 is computed forfrom the approximate vertex position, on the X2 of the vertex fit and on the angle betweencombinatorial background, cuts are applied on the three-dimensional distance of each trackcan be simply studied with particles of known mass: KE and A. In order to reduce the
Although the algorithm is aimed at reconstructing any secondary vertex, its performance
position as starting point of the fit; further details can be found in Reference [12].vertex fit is then performed without kinematica] constraints using the approximate vertexhelices projected onto the plane perpendicular to the magnetic field. A three—dimensionalthe primary vertex. An approximate vertex position is found from the intersection of the twoparticle tracks having at least five TPC hits, with at least one of the pair not coming fromvertices as follows: V0 candidates are selected considering all pairs of oppositely charged
In order to identify V°’s an algorithm has been developed that searches for secondary
volume. Such decays are denoted V°’s.neutral particles (KE and A) that decay into a pair of charged particles inside the trackinginteraction point, they will be rejected as ‘bad tracks’ in many analyses. This also applies toprevious section. Since the resulting charged particle tracks do not originate from the mainconvert into an electron-positron pair, and will therefore not be identified as described in thePhotons traversing the detector material placed prior to the electromagnetic calorimeter may
9 VU identification
and the histogram is for Monte Carlo simulation; the mean no energy in this figure is 20 GeV.one charged hadron and one cluster of energy greater than 4GeV. The points are for dataFigure 22: Effective mass reconstructed from moment analysis in a sample of T decays with
77 mass (GeV/c2)0 0.1 0.2 0.5
10 H Q20
30
40
50
60
BO 70
27 OCR Output
of the electromagnetic calorimeter, extending the solid angle coverage down to 40 mrad.ter. These are still installed, and for the purpose of energy flow they are treated as a partALEPH using forward calorimeters of similar construction to the electromagnetic calorimetungsten/silicon calorimeters described in the next section, the luminosity was measured inthe photon, electron and muon identiHcation capabilities. Before being superseded by thetion algorithm has been developed making use of track momenta and taking advantage ofhadronic decays of the Z. ln order to improve the resolution, an energy flow reconstrucany particle identification. This method yields a resolution of 0(E)/E : 1.2/\/E/GeV foris to make the sum of the raw energy found in all calorimetric cells without performingThe simplest way to determine the energy flow of an event recorded in the ALEPH detector
10 Energy flow determination
reconstructed with a purity of 80 % (50%).the optimization of the cuts typically 50 % (42 %) of generated K0 —-> 7'|’+7T— (A ——> pn`) areefficiency is evaluated using a sample of simulated hadronic decays of the Z. Depending onto the Hnite tracking volume and to the two-track separation capability of the TPC. Theleast one track with the primary vertex. At high momenta the loss of efficiency is dueaxis, implicitly applied by requiring at least five TPC hits, and the incompatibility of atcut on the minimum transverse momentum of the decay products with respect to the beammaximal for momenta of about 8GeV/c. At low momenta the main causes of loss are the
The efficiency of this selection has a strong dependence on the V0 momentum: it is
V°’s (1.4 GeV/c < p < 2.7 GeV/c).Figure 23: V0 mass distributions around (a) the K0 and (b) the A masses, for low momentum
MOM) 2 GeV/ c1.08 1.1 1.12 1.14 1.16 1,18 1.2
500
1000
1500
2000
[,250053000
,,,3500M(·rr+1r—) GeV/cz
0.4 0.425 0.45 0.475 0.5 0.525 0.55 0.575 0.5
1000
2000
3000
4000 ... Monte CorloLf,5000
• ALEPH doto5 SOOO
,,,7000
28 OCR Output
electromagnetic energy.ference is assumed to come from a bremsstrahlung photon, and is counted as neutraland the track momentum is larger than three times the expected resolution, this difelectromagnetic calorimeter towers. If the difference between this calorimeter energymoved from the calorimeter object, together with the energy contained in the associatedThe charged particle tracks identified as electrons, as described in Section 6, are re
energy assuming they are pions.to a reconstructed V0, within the tolerances presented above, are counted as chargedAll the charged particle tracks coming from the nominal interaction point or belonging
formed. Each calorimeter object is then processed using the following steps.and groups of topologically connected tracks and clusters (called ‘calorimeter objects°) are
After the cleaning the charged particle tracks are extrapolated to the calorimeters.,
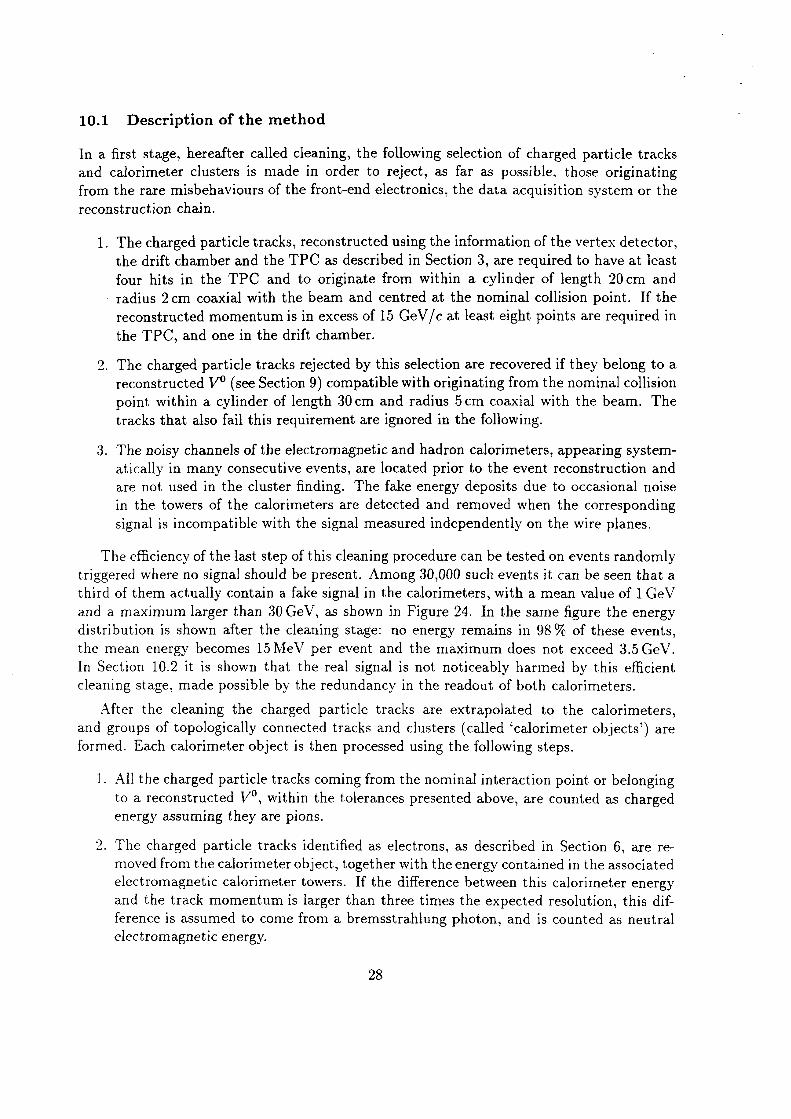
cleaning stage, made possible by the redundancy in the readout of both calorimeters.In Section 10.2 it is shown that the real signal is not noticeably harmed by this emcientthe mean energy becomes 15MeV per event and the maximum does not exceed 3.5 GeV.distribution is shown after the cleaning stage: no energy remains in 98% of these events,and a maximum larger than 30 GeV, as shown in Figure 24. In the same figure the energythird of them actually contain a fake signal in the calorimeters, with a mean value of 1 GeVtriggered where no signal should be present. Among 30,000 such events it can be seen that a
The efficiency of the last step of this cleaning procedure can be tested on events randomly
signal is incompatible with the signal measured independently on the wire planes.in the towers of the calorimeters are detected and removed when the correspondingare not used in the cluster finding. The fake energy deposits due to occasional noiseatically in many consecutive events, are located prior to the event reconstruction andThe noisy channels of the electromagnetic and hadron calorimeters, appearing system
tracks that also fail this requirement are ignored in the following.point within a cylinder of length 30 cm and radius 5cm coaxial with the beam. Thereconstructed V0 (see Section 9) compatible with originating from the nominal collisionThe charged particle tracks rejected by this selection are recovered if they belong to a
the TPC, and one in the drift chamber.reconstructed momentum is in excess of 15 GeV / c at least eight points are required inradius 2cm coaxial with the beam and centred at the nominal collision point. If thefour hits in the TPC and to originate from within a cylinder of length 20cm andthe drift chamber and the TPC as described in Section 3, are required to have at leastThe charged particle tracks, reconstructed using the information of the vertex detector,
reconstruction chain.
from the rare misbehaviours of the front—end electronics, the data acquisition system or theand calorimeter clusters is made in order to reject, as far as possible, those originatingIn a First stage, hereafter called cleaning, the following selection of charged particle tracks
10.1 Description of the method
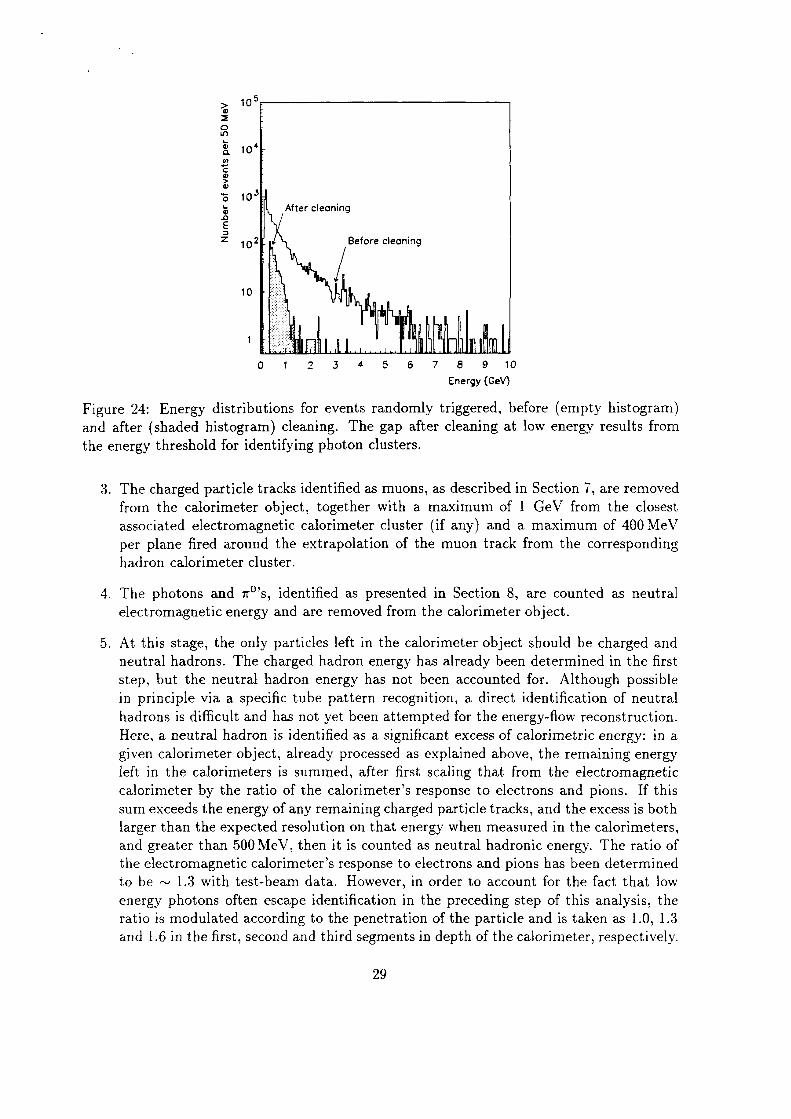
29 OCR Output
and 1.6 in the first, second and third segments in depth of the calorimeter, respectively.ratio is modulated according to the penetration of the particle and is taken as 1.0, 1.3energy photons often escape identification in the preceding step of this analysis, theto be ~ 1.3 with test—beam data. However, in order to account for the fact that lowthe electromagnetic calorimeter’s response to electrons and pions has been determinedand greater than 500 MeV, then it is counted as neutral hadronic energy. The ratio oflarger than the expected resolution on that energy when measured in the calorimeters,sum exceeds the energy of any remaining charged particle tracks, and the excess is bothcalorimeter by the ratio of the calorimeter’s response to electrons and pions. If thisleft in the calorimeters is summed, after first scaling that from the electromagneticgiven calorimeter object, already processed as explained above, the remaining energyHere, a neutral hadron is identified as a significant excess of calorimetric energy: in ahadrons is difficult and has not yet been attempted for the energy—fiow reconstruction.in principle via a specific tube pattern recognition, a direct identification of neutralstep, but the neutral hadron energy has not been accounted for. Although possibleneutral hadrons. The charged hadron energy has already been determined in the firstAt this stage, the only particles left in the calorimeter object should be charged and
electromagnetic energy and are removed from the calorimeter object.The photons and rr°’s, identified as presented in Section 8, are counted as neutral
hadron calorimeter cluster.
per plane fired around the extrapolation of the muon track from the correspondingassociated electromagnetic calorimeter cluster (if any) and a maximum of 400 MeVfrom the calorimeter object, together with a maximum of 1 GeV from the closestThe charged particle tracks identified as muons, as described in Section 7, are removed
the energy threshold for identifying photon clusters.and after (shaded histogram) cleaning. The gap after cleaning at low energy results fromFigure 24: Energy distributions for events randomly triggered, before (empty histogram)
Energy (GeV)
O 1 2 .3 4 5 6 7 8 9 10
102 Before cleaning
After cleaning10**
10*
105
30 OCR Output
dash—dotted line in Figure 25.from e+e”—> T+T_ events and from 77 collisions. These two criteria are indicated by ato a selection efficiency of 99.6 % with a residual contamination smaller than 0.4 % comingrequiring at least 15 energy—flow objects and an invariant mass in excess of 30 GeV/cz leadssimple way to efficiently separate hadronic events from dilepton events and 77 collisions:events containing at least two charged particles. As a first application, this provides a verytotal invariant mass is shown as a function of the number of energy-flow objects for all thein Figure 25, obtained with data taken at the Z peak. In this figure the distribution of theA qualitative impression of the performance of the energy—flow reconstruction can be seen
10.2 Performance of the reconstruction
but they should be detected indirectly by the presence of missing energy in the event.produced by the collision. Since the neutrinos escape undetected, they cannot be in the listlist is expected to be a close representation of the reality, i.e. of the stable particles actuallyclusters found in the luminosity monitor, where no particle identification is available. Thisin the following, characterized by their energies and momenta. To this list are added all theflow objects’ (electrons, muons, photons, charged or neutral hadrons), also called particles
This is repeated for all the calorimeter objects of the event and results in a set of ‘energy
have been truncated.
charged particle tracks, from part of the 1992 ALEPH data. The two low—multiplicity peaksFigure 25: Invariant mass versus number of particles for all the events with at least two
/ · so Os ju, O 70 mbef j 80 NU5° P¤'f‘°`°5
406372020 so°Zs~ 40
0 10bf, 60
°¢r 8042 100
120
1 000
2000
3000 events' ~‘ 4 Hcprc
4000
5000
' ·' 4 e' cl
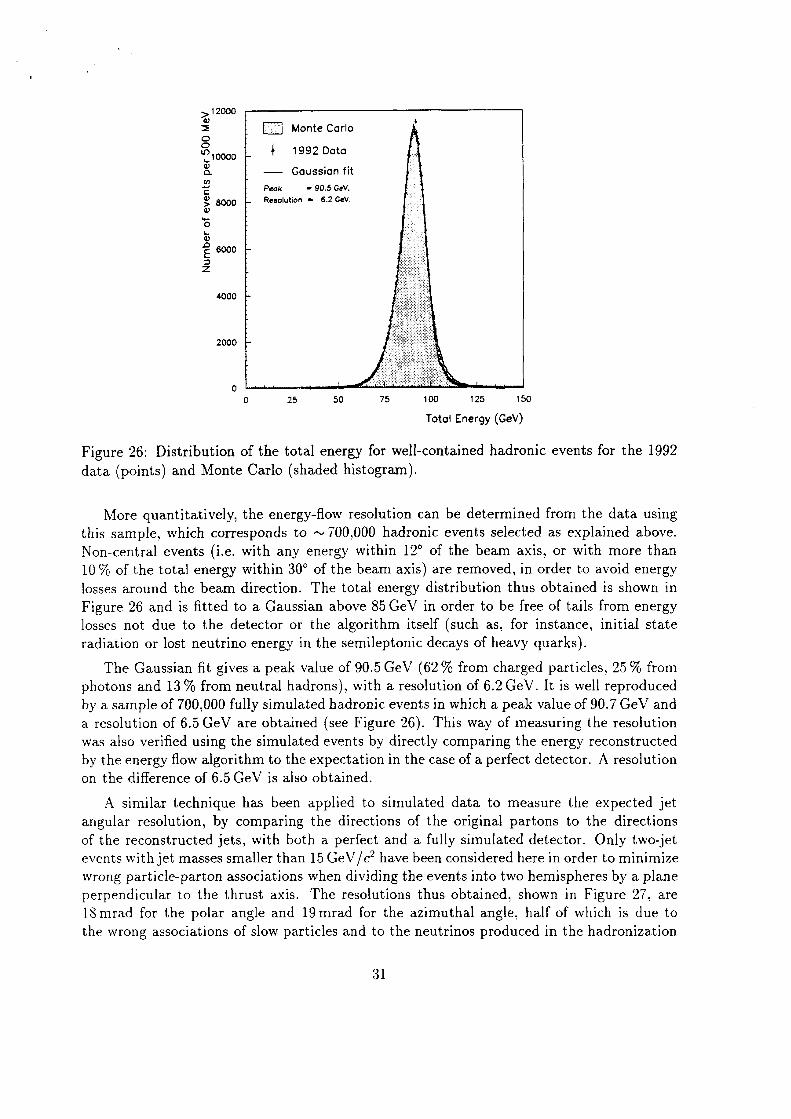
31 OCR Output
the wrong associations of slow particles and to the neutrinos produced in the hadronization18mrad for the polar angle and 19 mrad for the azimuthal angle, half of which is due toperpendicular to the thrust axis. The resolutions thus obtained, shown in Figure 27, arewrong particle-parton associations when dividing the events into two hemispheres by a planeevents with jet masses smaller than 15 GeV/c2 have been considered here in order to minimizeof the reconstructed jets, with both a perfect and a fully simulated detector. Only two-jetangular resolution, by comparing the directions of the original partons to the directions
A similar technique has been applied to simulated data to measure the expected jet
on the difference of 6.5 GeV is also obtained.
by the energy flow algorithm to the expectation in the case of a perfect detector. A resolutionwas also verified using the simulated events by directly comparing the energy reconstructeda resolution of 6.5 GeV are obtained (see Figure 26). This way of measuring the resolutionby a sample of 700,000 fully simulated hadronic events in which a peak value of 90.7 GeV andphotons and 13% from neutral hadrons), with a resolution of 6.2 GeV. It is well reproduced
The Gaussian fit gives a peak value of 90.5 GeV (62 % from charged particles, 25 % from
radiation or lost neutrino energy in the semileptonic decays of heavy quarks).losses not due to the detector or the algorithm itself (such as, for instance, initial stateFigure 26 and is fitted to a Gaussian above 85 GeV in order to be free of tails from energylosses around the beam direction. The total energy distribution thus obtained is shown in10 % of the total energy within 30° of the beam axis) are removed, in order to avoid energyNon—central events (i.e. with any energy within 12° of the beam axis, or with more thanthis sample, which corresponds to ~700,000 hadronic events selected as explained above.
More quantitatively, the energy-flow resolution can be determined from the data using
data (points) and Monte Carlo (shaded histogram).Figure 26: Distribution of the total energy for well-contained hadronic events for the 1992
Totol Energy (GeV)
0 25 so vs 100 12s 190
2000
4000
E 6000
K BOOD Resolution - 6.2 GeV.
Peak - 90.5 GeV,
Gcussicn fit
[ 1 0000{ 1992 Dm
E] Monte Carlo> 1 2000
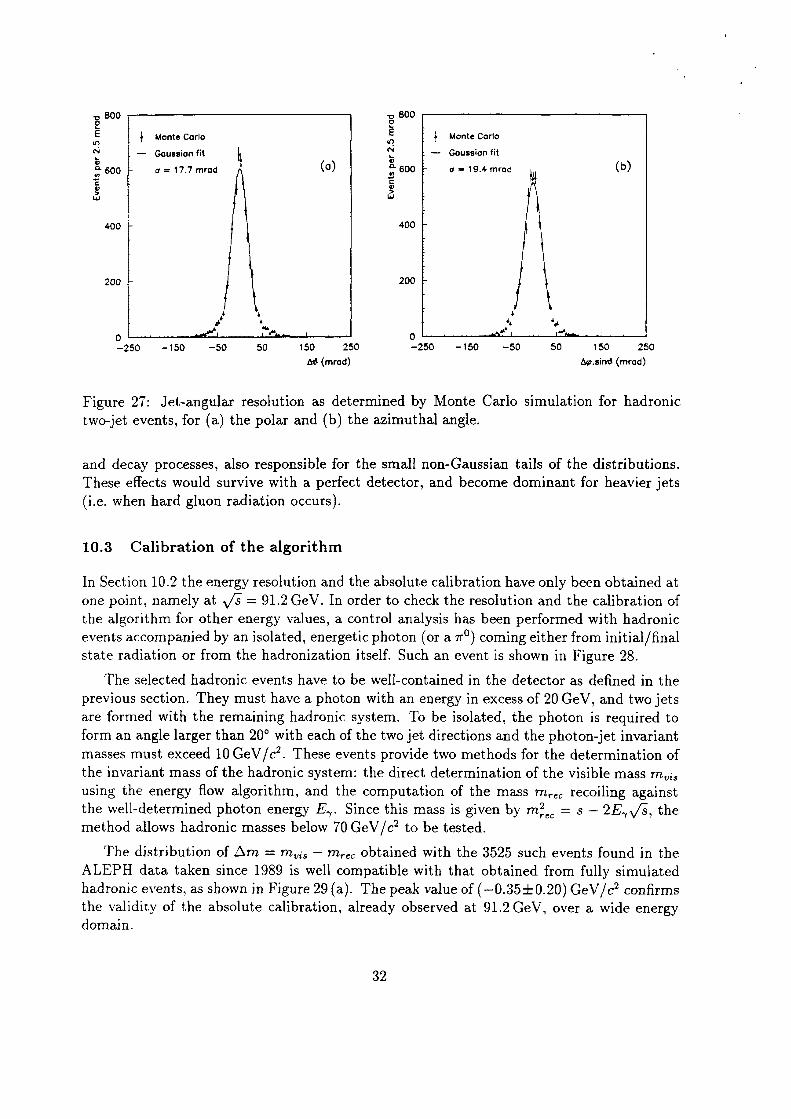
32 OCR Output
domain.
the validity of the absolute calibration, already observed at 91.2 GeV, over a wide energyhadronic events, as shown in Figure 29 (a). The peak value of (-0.35:}:0.20) GeV/cz confirmsALEPH data taken since 1989 is well compatible with that obtained from fully simulated
The distribution of Am = 771,,;, —- m,,C obtained with the 3525 such events found in the
method allows hadronic masses below 70 GeV / c2 to be tested.the well—determined photon energy E,. Since this mass is given by misc = .s — 215],4/E, theusing the energy flow algorithm, and the computation of the mass mm, recoiling againstthe invariant mass of the hadronic system: the direct determination of the visible mass mmmasses must exceed 10 GeV / cz. These events provide two methods for the determination ofform an angle larger than 20° with each of the two jet directions and the photon-jet invariantare formed with the remaining hadronic system. To be isolated, the photon is required toprevious section. They must have a photon with an energy in excess of 20 GeV, and two jets
The selected hadronic events have to be well-contained in the detector as defined in the
state radiation or from the hadronization itself. Such an event is shown in Figure 28.events accompanied by an isolated, energetic photon (or a 11*0) coming either from initial/ finalthe algorithm for other energy values, a control analysis has been performed with hadronicone point, namely at \/E = 91.2 GeV. In order to check the resolution and the calibration ofIn Section 10.2 the energy resolution and the absolute calibration have only been obtained at
10.3 Calibration of the algorithm
(i.e. when hard gluon radiation occurs).These effects would survive with a perfect detector, and become dominant for heavier jetsand decay processes, also responsible for the small non-Gaussian tails of the distributions.
two—jet events, for (a) the polar and (b) the azimuthal angle.Figure 27: Jet-angular resolution as determined by Monte Carlo simulation for hadronic
A19 (mrad) A¢.sin1! (mrad)
-250 -150 -50 50 150 250 -250 -150 -50 50 150 250
I-, ,|•*An ‘| i I fn. *4 *»} a
200 200
400 400
§s00 ¤ = 17.7 mrcd (0)(¤) I j} 500 l- ¤ -10.4 mrad‘;‘ - Gaussian Ht l I; l — Gaussian fit5 [ l Monte CarloIS j l Monte Carlo
U 500 ¤ 800
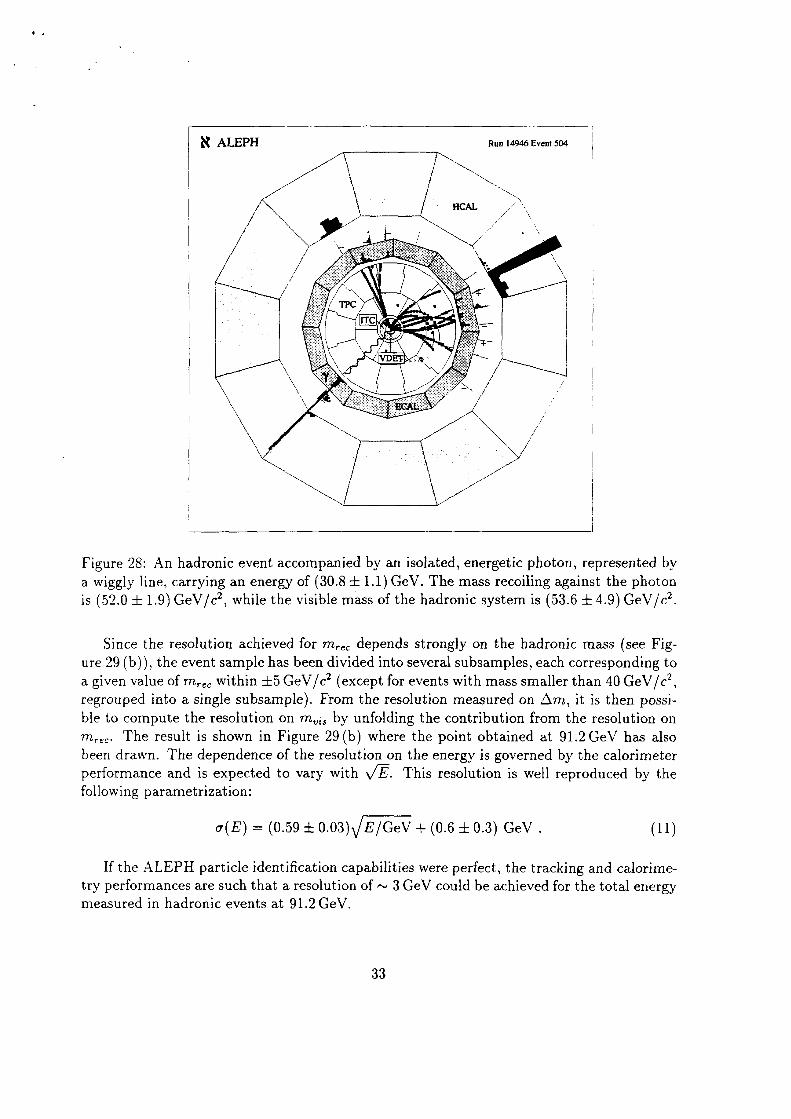
33 OCR Output
measured in hadronic events at 91.2 GeV.
try performances are such that a resolution of ~ 3 GeV could be achieved for the total energyIf the ALEPH particle identification capabilities were perfect, the tracking and calorime
a(E) = (0.59 :1; 0.03)\/E/GeV + (0.6 ;k 0.3) GeV
following parametrization:performance and is expected to vary with This resolution is well reproduced by thebeen drawn. The dependence of the resolution on the energy is governed by the calorimetermm. The result is shown in Figure 29 (b) where the point obtained at 91.2 GeV has alsoble to compute the resolution on mm by unfolding the contribution from the resolution onregrouped into a single subsample). From the resolution measured on Am, it is then possia given value of mm within ;l;5 GeV/cz (except for events with mass smaller than 40 GeV/cg,ure 29 (b)), the event sample has been divided into several subsamples, each corresponding to
Since the resolution achieved for mrec depends strongly on the hadronic mass (see Fig
is (52.0 :1: 1.9) GeV/cz, while the visible mass of the hadronic system is (53.6 :1; 4.9) GeV/cza wiggly line, carrying an energy of (30.8 ;l; 1.1) GeV. The mass recoiling against the photonFigure 28: An hadronic event accompanied by an isolated, energetic photon, represented by
nc
TPC
V _;?;_:_;__ , ..
nw. ./ / x
Run I4946 Evcm$04N ALEPH
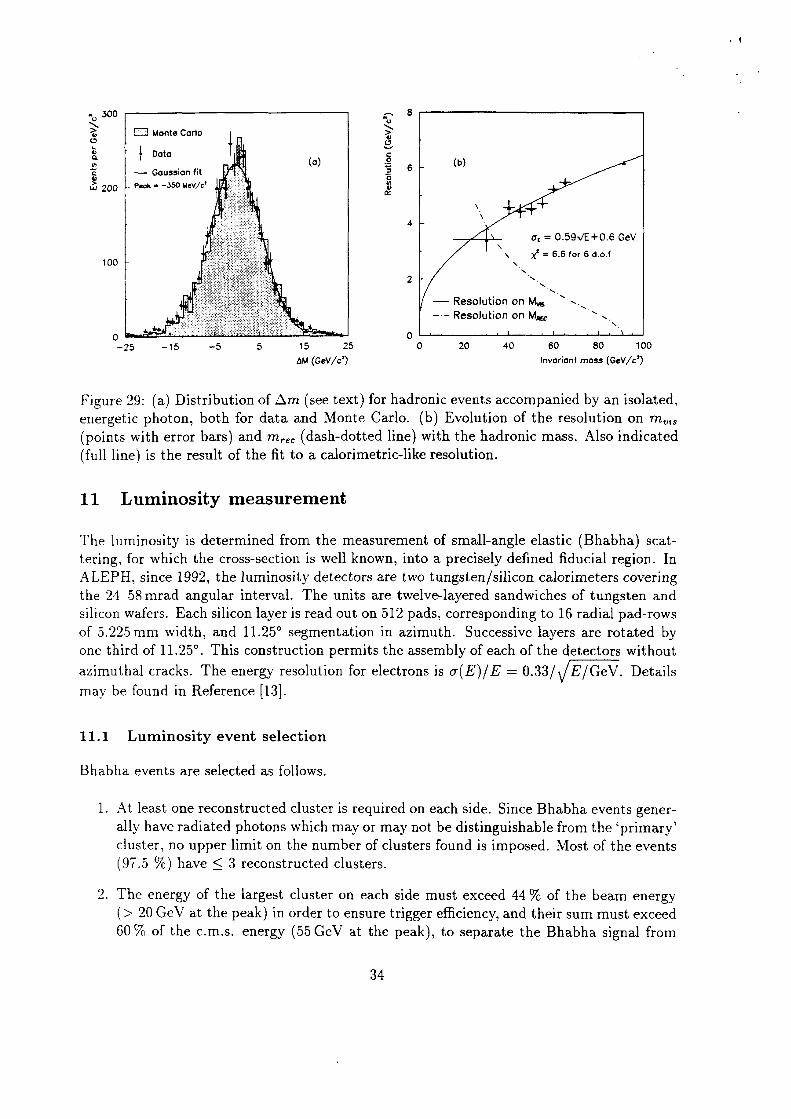
34 OCR Output
60 % of the c.m.s. energy (55 GeV at the peak), to separate the Bhabha signal from(> 20 GeV at the peak) in order to ensure trigger efficiency, and their sum must exceedThe energy of the largest cluster on each side must exceed 44 % of the beam energy
(97.5 %) have § 3 reconstructed clusters.cluster, no upper limit on the number of clusters found is imposed. Most of the eventsally have radiated photons which may or may not be distinguishable from the ‘primary’At least one reconstructed cluster is required on each side. Since Bhabha events gener
Bhabha events are selected as follows.
11.1 Luminosity event selection
may be found in Reference [13].azimuthal cracks. The energy resolution for electrons is 0(E)/E = 0.33/\/E/GeV. Detailsone third of 11.25°. This construction permits the assembly of each of the detectors withoutof 5.225mm width, and 11.25° segmentation in azimuth. Successive layers are rotated bysilicon wafers. Each silicon layer is read out on 512 pads, corresponding to 16 radial pad—rowsthe 24-58 mrad angular interval. The units are twelve—layered sandwiches of tungsten andALEPH, since 1992, the luminosity detectors are two tungsten / silicon calorimeters coveringtering, for which the cross-section is well known, into a precisely defined fiducial region. InThe luminosity is determined from the measurement of small-angle elastic (Bhabha) scat
11 Luminosity measurement
(full line) is the result of the tit to a calorimetric·like resolution.(points with error bars) and mm; (dash-dotted line) with the hadronic mass. Also indicatedenergetic photon, both for data and Monte Carlo. (b) Evolution of the resolution on mmFigure 29: (a) Distribution of Am (see text) for hadronic events accompanied by an isolated,
AM (GeV/c') Invoriont moss (GeV/c')
-25 -15 -5 5 15 25 0 20 40 60 80 100
Resolution on Mm `·\-A;;.A
Resolution on Mu, `·~
100\ xi = 5.6 for 6 d.o.f
at = O.59`/E+O.6 GeV
\ -l- E1"
LZ 200 Peak • -350 MeV/c'E —- Gcussicn fit
6 I' (U)(¤)
g` E Monte Ccrlcl + :’ Dctc ° +-0 300
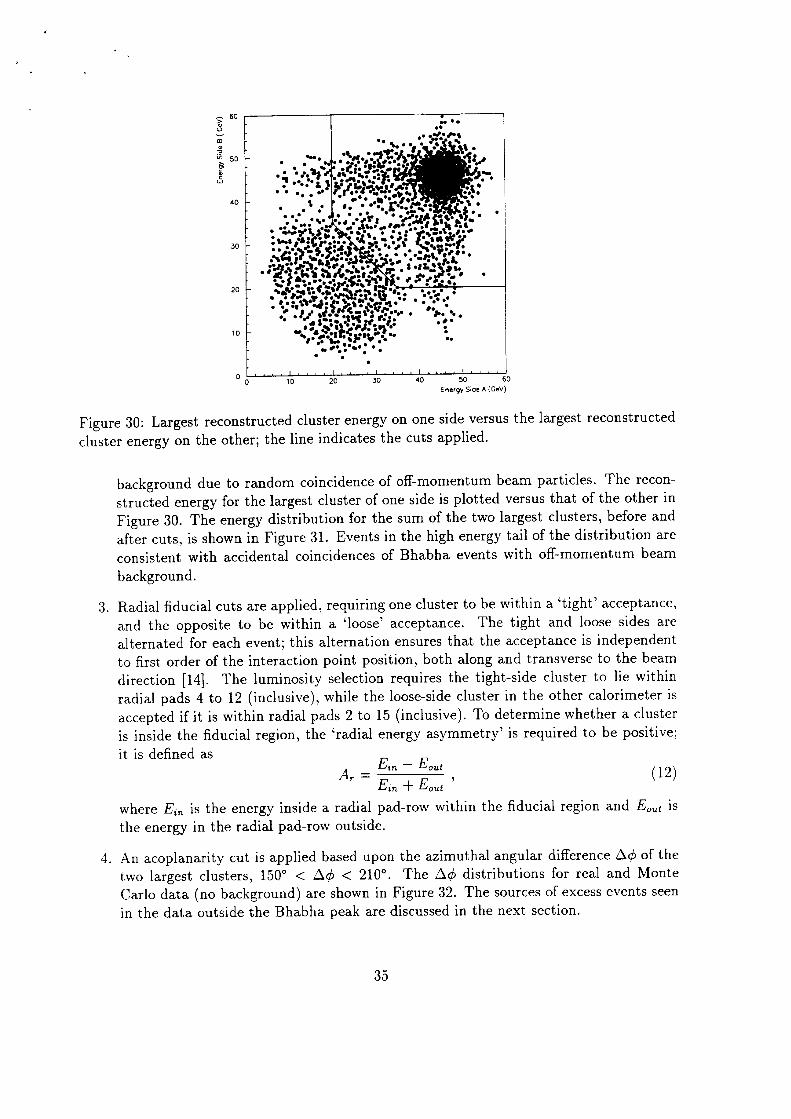
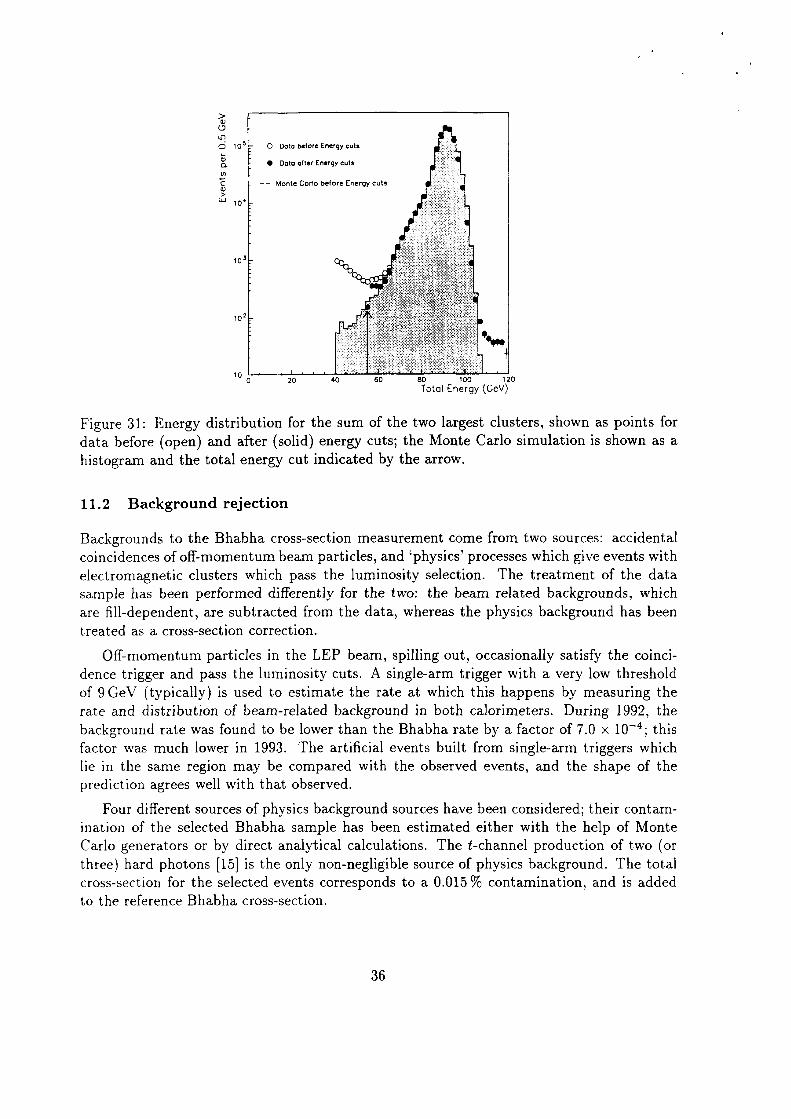
36 OCR Output
to the reference Bhabha cross—section.
cross-section for the selected events corresponds to a 0.015% contamination, and is addedthree) hard photons [15] is the only non—negligible source of physics background. The totalCarlo generators or by direct analytical calculations. The t—channel production of two (orination of the selected Bhabha sample has been estimated either with the help of Monte
Four different sources of physics background sources have been considered; their contam
prediction agrees well with that observed.lie in the same region may be compared with the observed events, and the shape of thefactor was much lower in 1993. The artificial events built from single—arm triggers whichbackground rate was found to be lower than the Bhabha rate by a factor of 7.0 >< 10`4; thisrate and distribution of beam-related background in both calorimeters. During 1992, theof 9GeV (typically) is used to estimate the rate at which this happens by measuring thedence trigger and pass the luminosity cuts. A single—arm trigger with a very low threshold
Off-momentum particles in the LEP beam, spilling out, occasionally satisfy the coinci
treated as a cross-section correction.
are fill-dependent, are subtracted from the data, whereas the physics background has beensample has been performed differently for the two: the beam related backgrounds, whichelectromagnetic clusters which pass the luminosity selection. The treatment of the datacoincidences of off-momentum beam particles, and ‘physics’ processes which give events withBackgrounds to the Bhabha cross—section measurement come from two sources: accidental
11.2 Background rejection
histogram and the total energy cut indicated by the arrow.data before (open) and after (solid) energy cuts; the Monte Carlo simulation is shown as aFigure 31: Energy distribution for the sum of the two largest clusters, shown as points for
Total Energy (GeV)¤ zo 40 so an me 1zc
" " -:;%:.52; .‘:i5iZ=‘=E‘i2··:ia·.
*¤’
,Vi; ··:,
QQ)*03
1 0 ‘
—— Monte Carlo before Energy cul:
¤_ } O Data utter Energy cms
OCR OutputO \O°b O D¤t¤ before Energy cm;
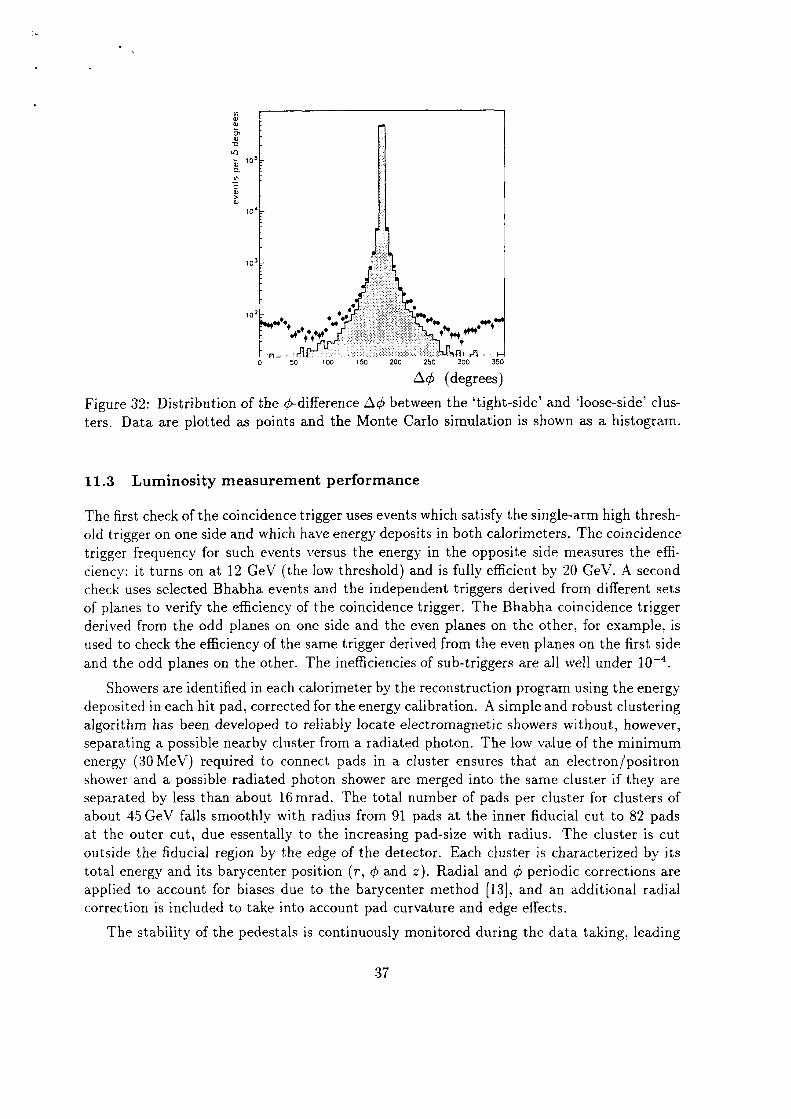
37 OCR Output
The stability of the pedestals is continuously monitored during the data taking, leading
correction is included to take into account pad curvature and edge effects.applied to account for biases due to the barycenter method [13], and an additional radialtotal energy and its barycenter position (T, cb and z). Radial and gb periodic corrections areoutside the fiducial region by the edge of the detector. Each cluster is characterized by itsat the outer cut, due essentally to the increasing pad-size with radius. The cluster is cutabout 45 GeV falls smoothly with radius from 91 pads at the inner fiducial cut to 82 padsseparated by less than about 16 mrad. The total number of pads per cluster for clusters ofshower and a possible radiated photon shower are merged into the same cluster if they areenergy (30 MeV) required to connect pads in a cluster ensures that an electron/positronseparating a possible nearby cluster from a radiated photon. The low value of the minimumalgorithm has been developed to reliably locate electromagnetic showers without, however,deposited in each hit pad, corrected for the energy calibration. A simple and robust clustering
Showers are identified in each calorimeter by the reconstruction program using the energy
and the odd planes on the other. The inefficiencies of sub-triggers are all well under 10`used to check the efficiency of the same trigger derived from the even planes on the first sidederived from the odd planes on one side and the even planes on the other, for example, isof planes to verify the efficiency of the coincidence trigger. The Bhabha coincidence triggercheck uses selected Bhabha events and the independent triggers derived from different setsciency: it turns on at 12 GeV (the low threshold) and is fully efficient by 20 GeV. A secondtrigger frequency for such events versus the energy in the opposite side measures the effiold trigger on one side and which have energy deposits in both calorimeters. The coincidenceThe first check of the coincidence trigger uses events which satisfy the single—arm high thresh
11.3 Luminosity measurement performance
ters. Data are plotted as points and the Monte Carlo simulation is shown as a histogram.Figure 32: Distribution of the Q5-difference Ac;5 between the ‘tight—side’ and “loose—side’ clus
Ani (degrees)0 so uoc 150 20c zso 100 :50
H1 J} A»n.. — 'ru
+4 +++¢ 9 ••5¢ *
wz •.°,} ‘;V. EL3
10*
10*
¤1O GJ
38 OCR Output
member states thank CERN for its hospitality.support in constructing and maintaining the ALEPH experiment. Those of us from nonIt is a pleasure to thank the technical personnel of the collaborating institutions for their
Acknowledgements
errors are small in the measurements of physical quantities at LEP.but turns out to be adequate. These features have led to a detector for which the systematicefficiency over 97% of the solid angle. Hadron (rr, K, p) identification was not emphasizedThe resulting performance shows excellent multiparticle—detection and lepton—identificationvia a large detector in 1.5T magnetic field, and on precision luminosity determination.hermetic coverage for the tracking and calorimetry, on accurate vertexing, on good trackingthe conception of ALEPH, emphasis was placed on high three—dimensional granularity andALEPH is a detector designed for e+e` physics up to 200 GeV centre—of-mass energy. During
12 Conclusion
of the Monte Carlo shower parametrization.support ring, uncertainty in the value of the z separation of the calorimeters, and the fidelity0.09 %, shared between several sources including thermal expansion of the silicon—detectorsection. The experimental precision in the 1992 luminosity measurement is estimated to bethe luminosity selection cuts, after background subtraction, and acm is the corrected crossintegrated luminosity is given by N Bhabha / acm, where N ghabha is the number of events passingmissing Z—exchange contributions (+0.061%), as evaluated from other generators [17]. TheIt must be corrected for the t—channel two hard-photon background (+0.015%), and the
The accepted Bhabha cross—section is determined using the BHLUMI generator [16].
the inner radius. The radial resolution on the fiducial cut is 12 pm.is about 150 pm and the azimuthal resolution varies from 0.2° at the outer radius to 0.3° atto accept a modest resolution in gb. The average resolution on the radial barycenter positionperformance as the radial cut does not rely on it, and the acoplanarity cut is wide enough
The spatial resolution on the barycenter position is not of prime importance in the
energy resolution of 4.9 % is achieved.r and gb. Taking into account detector effects not seen by the calibration procedure a final45 GeV showers from 6.2% to 5.5%, with a uniform energy response over the detector ingains obtained from the electronic calibration improves the resolution for fully containedmeasured. A fitting procedure is applied giving net residuals below 0.7%. Applying thechannels (simultaneously for all the amplifiers). Both gain and inter—channel crosstalk aremeasuring the response of each amplifier channel; this is achieved by pulsing individualto a fill·to—fill drift of less than 2MeV. The pad-to-pad energy calibration is obtained by
39 OCR Output
EA. Berends, R. Kleiss and W. Hollik, Nucl. Phys. B 304 (1988) 712.M. Béhm, A. Denner and W. Hollik, Nucl. Phys. B 304 (1988) 687;UT]
S. Jadach and B.F.L. Ward, Phys. Rev. D 40 (1989) 3582.S. Jadach et al., Comput. Phys. Commun. 70 (1992) 305;S. Jadach ct al., Phys. Lett. B 268 (1991) 253;[16]
EA. Berends and R. Kleiss, Nucl. Phys. B 186 (1981) 22.[15]
J.F. Crawford ct al., Nucl. Instr. Meth. A 127 (1975) 173.G. Barbiellini at al., Atti Accad. Naz. Lincei 44 (1968) 233;[14]
ALEPH’, to be published in Nucl. Instr. Meth. A.D. Bédérede et al., ‘SICAL: a high precision silicon—tungsten luminosity calorimeter for{13]
CERN—PPE/94-74, submitted to Z. Phys. C.[12] . Buskulic et al., (ALEPH Collab.), ‘Production of KO and A in hadronic Z decays’,
U1] . Decamp et al., (ALEPH Collab.), Z. Phys. C 54 (1992) 211.
[10] . Buskulic et al., (ALEPH Collab.), Nucl. Instr. Meth. A 346 (1994) 461.
[9] . Longo and I. Sestili, Nucl. Instr. Meth. A 128 (1987) 283.
[8] . Messineo et al., Nucl. Instr. Meth. A 320 (1992) 177.
[7] . Buskulic et al., (ALEPH Collab.), Phys. Lett. B 332 (1994) 209.
[6] . Buskulic ct al., (ALEPH Collab.), Phys. Lett. B 313 (1993) 535.
[5} . Fruhwirth, HEPHY—PUB 503/87 (1987).
{4] W.B. Atwood ct al., Nucl. Instr. Meth. A 306 (1991) 446.
[3} G.J. Barber et al., Nucl. Instr. Meth. A 279 (1989) 212.
tions on nuclear science, v.NS 39(4—5) (1992) Vol. 1, p. 438.[2] G. Batignani ct al., 1991 IEEE Nuclear Science Symposium, Santa Fe, IEEE transac
[1] D. Decamp ct al., (ALEPH Collab.), Nucl. Instr. Meth. A 294 (1990) 121.
References