Embed Size (px)
Citation preview
The Alberta Soil Moisture and Drought Risk Management
Model
Alberta AgricultureEdmonton

Model History:
• Initiated in early 1990’s -through funding from the Nat Christie Foundation
• Primary FORTRAN development (1992-1995) by:– Dr. Wolé Akinremi and Dr. Sean McGinn – Dr. Allan Bar
• Fortran to SAS conversion: Keith Toogood• Testing, enhancements and validation: Ralph Wright,
Dr. Zahid Qureshi

Model overviewBased upon the Versatile Soil Moisture Budget (Baier and Robertson (1966)
- Relatively simple and operational! - Medium textured soil with four layers, each 300 mm thick - Computes soil moisture, ET, drought indices, etc… for 4418
Townships
Soils and crop data
MaximumTemperature
MinimumTemperature Precipitation
Daily ClimateData
OtherInputs
10 km grid of 45 years daily Climactic
averages
More than 35 other constants, and arrays
Township Centers lat. and long.
Soil WaterHolding Capacity
(AWHC)
Crop (wheat, Pasture)
development stages
Plant Available Soil water
(PAW)

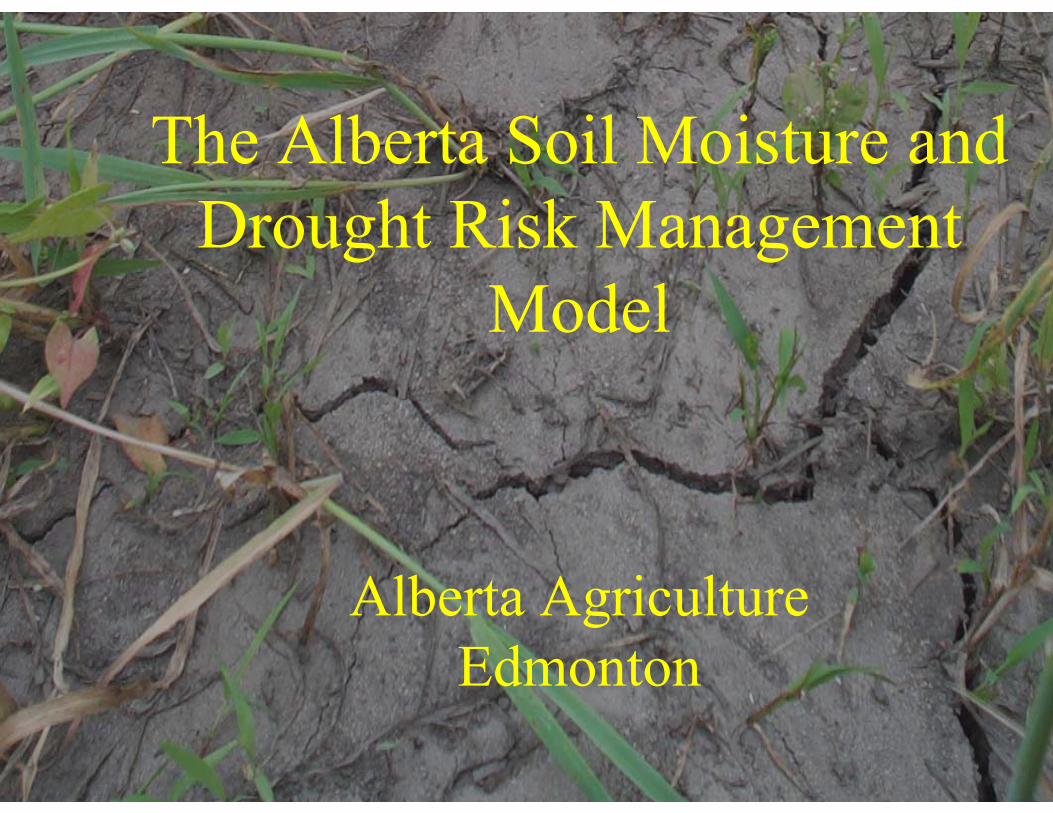
A simplified root zone water balance accounting for soil water interring, leaving and remaining within the root zone
Root zone

Root zone soil water balance
)()( 1111111 −−−−−−− ++++−+= iiiiiiii AETleachsublRosnoBlopptθθ
iθ
1−iθ
1−ippt
1−isnoBlo
1−iRo
1−ileach
1−iAET
= Today’s soil moisture at the beginning of the day, mm
= Available soil moisture at the beginning of previous day,mm
= 24-hour total precipitation at the end of previous day, mm
= 24-hour snow blown out of snow pack previous day, mm
= Water lost due to runoff, mm
= Water lost below rooting zone, mm
= Water used by plants at the end of previous day, mm
subl = sublimation of snow pack

Soil water balance (by township)
Compute daily root zone soil
Water balanceAkinremi et al. 1996
SeedingDate
Bair et al. 1979
Crop StageBair et al. 1979
Harvest DateAkinremi et al. 1996
Daily PotentialEvapotranspiration
Priestly Taylor 1972
Soil Temp.(EPIC)
Akinremi et al. 1996
RunoffFrozen: Ash et al. 1992
Unfrozen: USDA SCS 1972
ActualEvapotranspiration
Bair et al. 1979
Saturated FlowAdapted from
Ritchie and Otter 1985
Snow MeltMcKay 1964
Modified by Wright
Unsaturated FlowAdapted from
Ritchie and Otter 1985
PrecipitationRain or Snow?
(Wright)
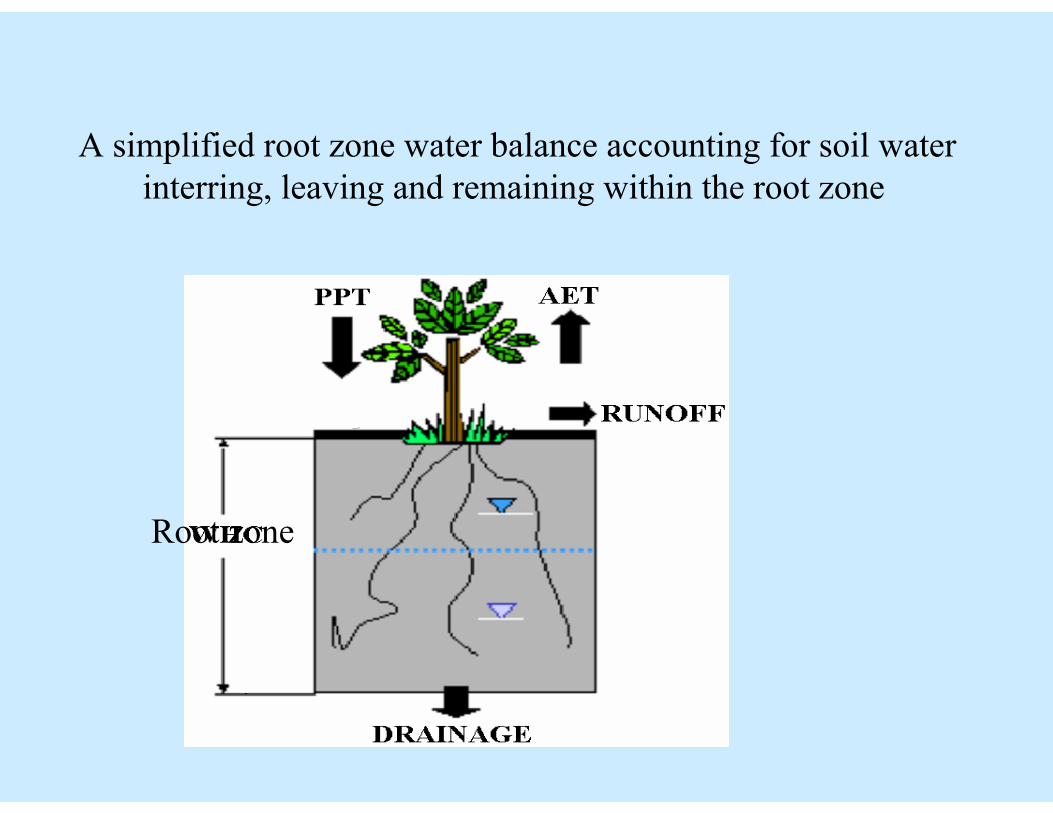
Effective Precipitation (Ppte)• The amount of precipitation available for
soil moisture storage and plant use
Effective Precipitation
leachsublORsnoBlopptPpte −−−−=
Where: ppt = precipitation snoBlo = snow blown off of field = 0.7*ppt RO = runoff from field subl = sublimation of snow pack leach = leaching of soil water below 120 cm
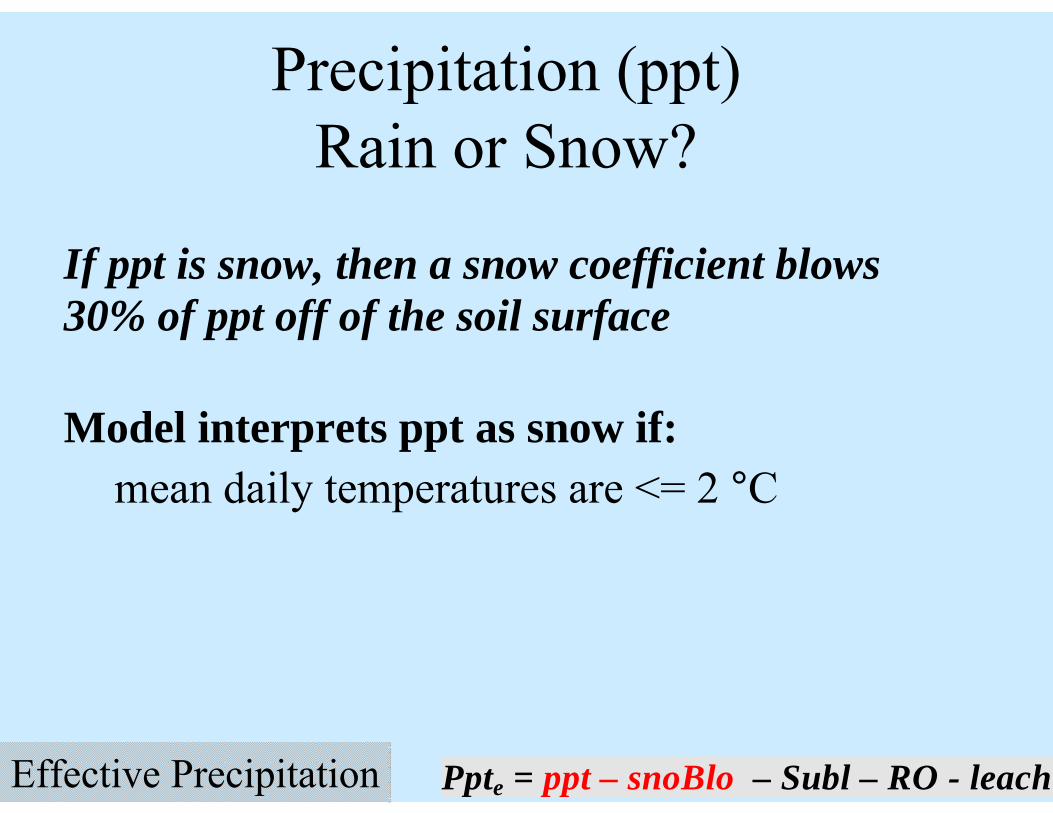
Precipitation (ppt)Rain or Snow?
If ppt is snow, then a snow coefficient blows 30% of ppt off of the soil surface Model interprets ppt as snow if:
mean daily temperatures are <= 2 °C
Effective Precipitation Ppte = ppt – snoBlo – Subl – RO - leach
Modification to McKay (1964) Snow Melt-
Temperature Curves
• Used Snow melt runoff data from Field Scale catchments
• 14 Site years of data across 11 sites– Snow pack measurements– Runoff measurements
• Brute force attack to adjust Mckay• Verified against EC snow pack data
(Boolean)
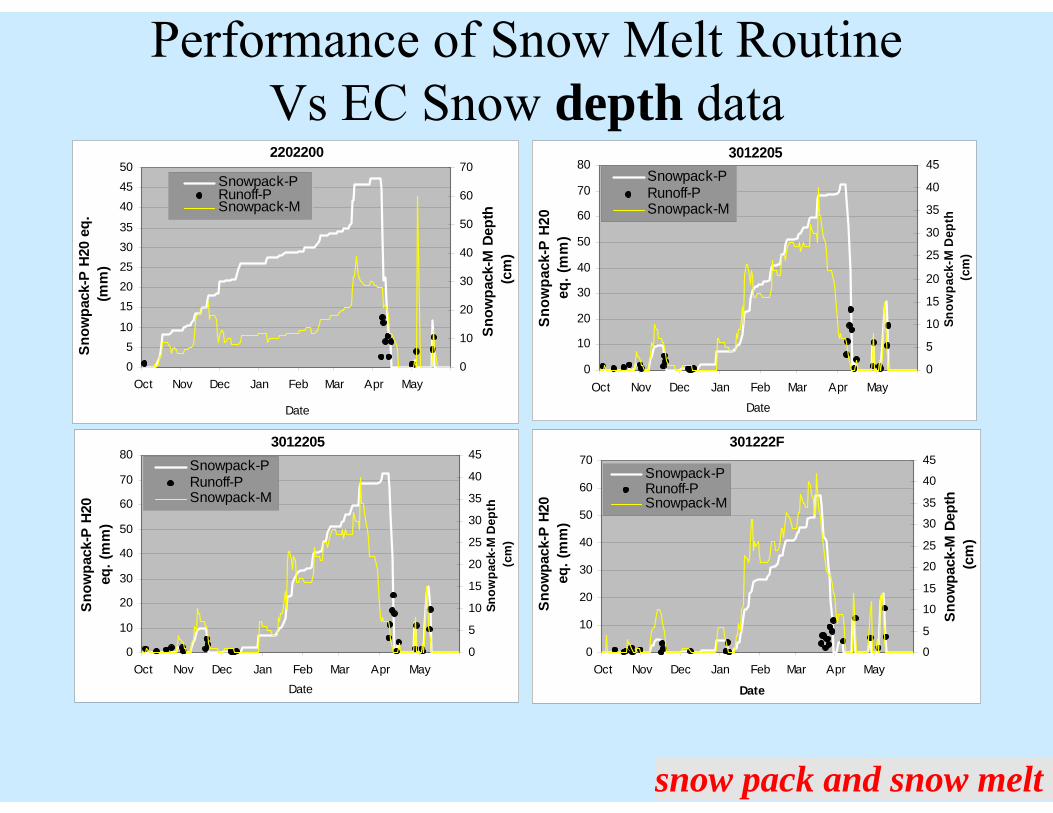
Performance of Snow Melt RoutineVs EC Snow depth data
301222F
0
10
20
30
40
50
60
70
Oct Nov Dec Jan Feb Mar Apr May
Sno
wpa
ck-P
H20
eq
. (m
m)
0
5
10
15
20
25
30
35
40
45
Date
Snow
pack
-M D
epth
(c
m)
Snowpack-PRunoff-PSnowpack-M
3012205
0
10
20
30
40
50
60
70
80
Oct Nov Dec Jan Feb Mar Apr MayDate
Snow
pack
-P H
20
eq. (
mm
)
0
5
10
15
20
25
30
35
40
45
Snow
pack
-M D
epth
(c
m)
Snowpack-PRunoff-PSnowpack-M
2202200
05
10
1520253035
404550
Oct Nov Dec Jan Feb Mar Apr May
Date
Snow
pack
-P H
20 e
q.
(mm
)
0
10
20
30
40
50
60
70
Sno
wpa
ck-M
Dep
th
(cm
)
Snowpack-PRunoff-PSnowpack-M
3012205
0
10
20
30
40
50
60
70
80
Oct Nov Dec Jan Feb Mar Apr MayDate
Sno
wpa
ck-P
H20
eq
. (m
m)
0
5
10
15
20
25
30
35
40
45
Snow
pack
-M D
epth
(c
m)
Snowpack-PRunoff-PSnowpack-M
snow pack and snow melt

Runoff on Frozen soilsSnow Melt and/or Rain
Ash et al, 1992
Where:
Surface water = rain + snow melt drainage out of the snow pack
Rain = precipitation if: mean temperature is > 2 °C
AWHC
PWP
PAW1
1
PAWsurface water AWHCRunoff = ×
Effective Precipitation
Computed using PAW and AWHC in first soil layer
Ppte = ppt – snoBlo – Subl – RO - leach

Computing Curve Numbers When Soil Water Content is < FC
Depth Weighting Factors
wf(1) = 0.953
wf(2) = 0.0595
wf(3) = 0.00372
wf(4) = 0.000232
As cn ↑ runoff potential ↑
ii
i
PAWcnpd cnpd WfAWHC
⎛ ⎞= + ×⎜ ⎟
⎝ ⎠
For each soil layer (i= 1 to 4)
Next soil layer (i)
Effective Precipitation
)805.91(63 −+= cnpdcn
Ppte = ppt – snoBlo – Subl – RO - leach

Wheat crop development stages
SeedingDate
Bair et al. 1979
Crop StageRobertson 1968
Harvest DateAkinremi et al. 1996
2) Jointing
1) Emergence
3) Heading
4) Soft Dough
5) Ripening

Pasture Growth Stages
Dormancy Break End of March
Start of Active growth When 5 Consec days Tmean >= 5oC
Completion of Active growth When CGDD = 400oC
Start of Dormancy When Sun hours < 13.50
Start of Flowering When Sun hours = 15.50
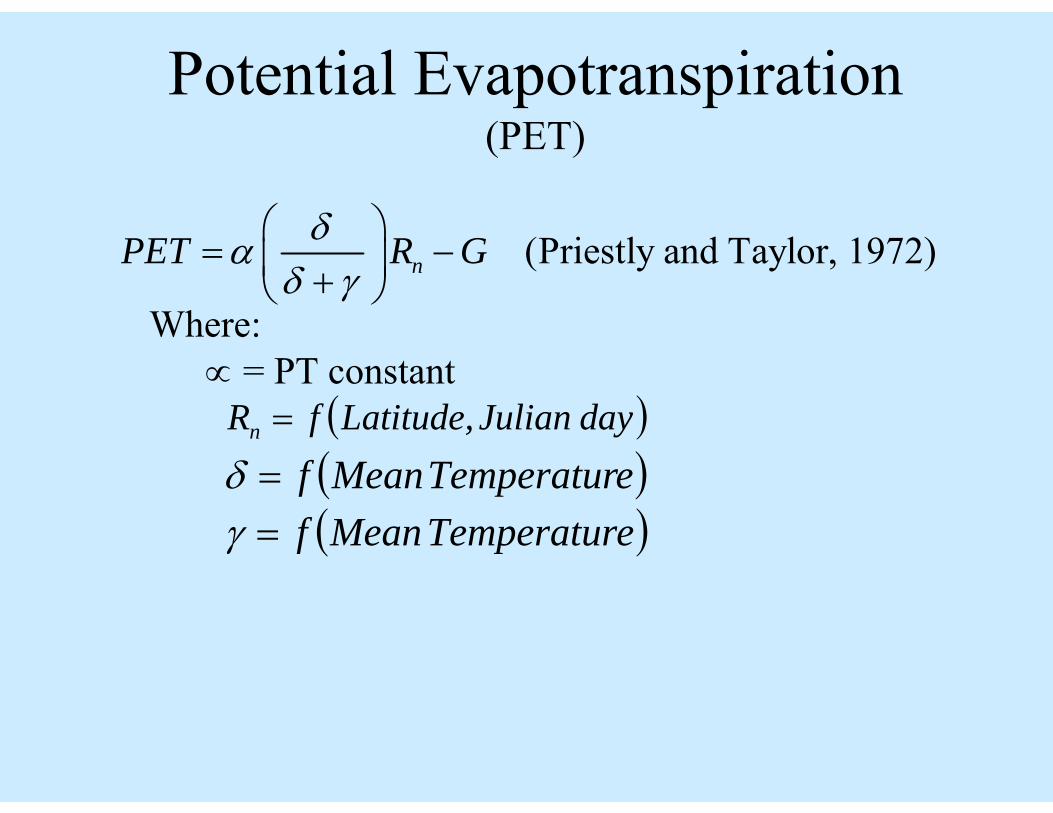
(Priestly and Taylor, 1972)nPET R Gδαδ γ⎛ ⎞
= −⎜ ⎟+⎝ ⎠Where: ∝ = PT constant ( )day JulianLatitude,fRn =
( )eTemperatur Meanf=δ
( )eTemperatur Meanf=γ
Potential Evapotranspiration(PET)

Actual Evapotranspiration (AET)
Computations for each soil layer (i= layer)
Where: Drying Curve = ratio of AET/PET as a function of
PAW/AWHC COF = crop root extraction coefficients whose
value is dependant on crop stage and water content
PET = potential evapotranspiration
⎟⎟⎠
⎞⎜⎜⎝
⎛×××= PETCOF
AWHCPAWfAET i
i
ii iCurve Drying
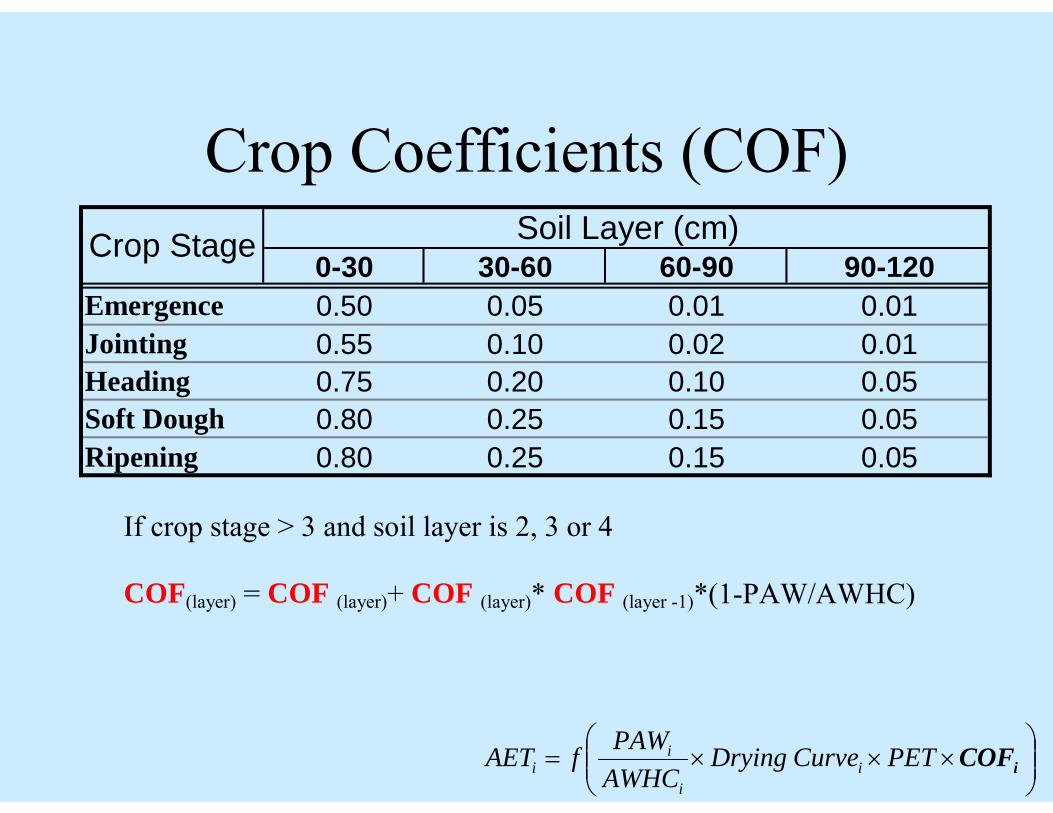
Crop Coefficients (COF)0-30 30-60 60-90 90-120
Emergence 0.50 0.05 0.01 0.01Jointing 0.55 0.10 0.02 0.01Heading 0.75 0.20 0.10 0.05Soft Dough 0.80 0.25 0.15 0.05Ripening 0.80 0.25 0.15 0.05
Soil Layer (cm)Crop Stage
If crop stage > 3 and soil layer is 2, 3 or 4 COF(layer) = COF (layer)+ COF (layer)* COF (layer -1)*(1-PAW/AWHC)
⎟⎟⎠
⎞⎜⎜⎝
⎛×××= iCOFPETCurve Drying
AWHCPAWfAET i
i
ii
Validation and Testing
• Spring and fall soil moisture maps are produced annually, as far back as 1982

Average Spring Soil Moisture
y = 1.01x - 3.86R2 = 0.79
0
20
40
60
80
100
120
140
160
0 20 40 60 80 100 120 140
Mapped Average Spring SM
Pred
icte
d A
vera
ge S
prin
g SM
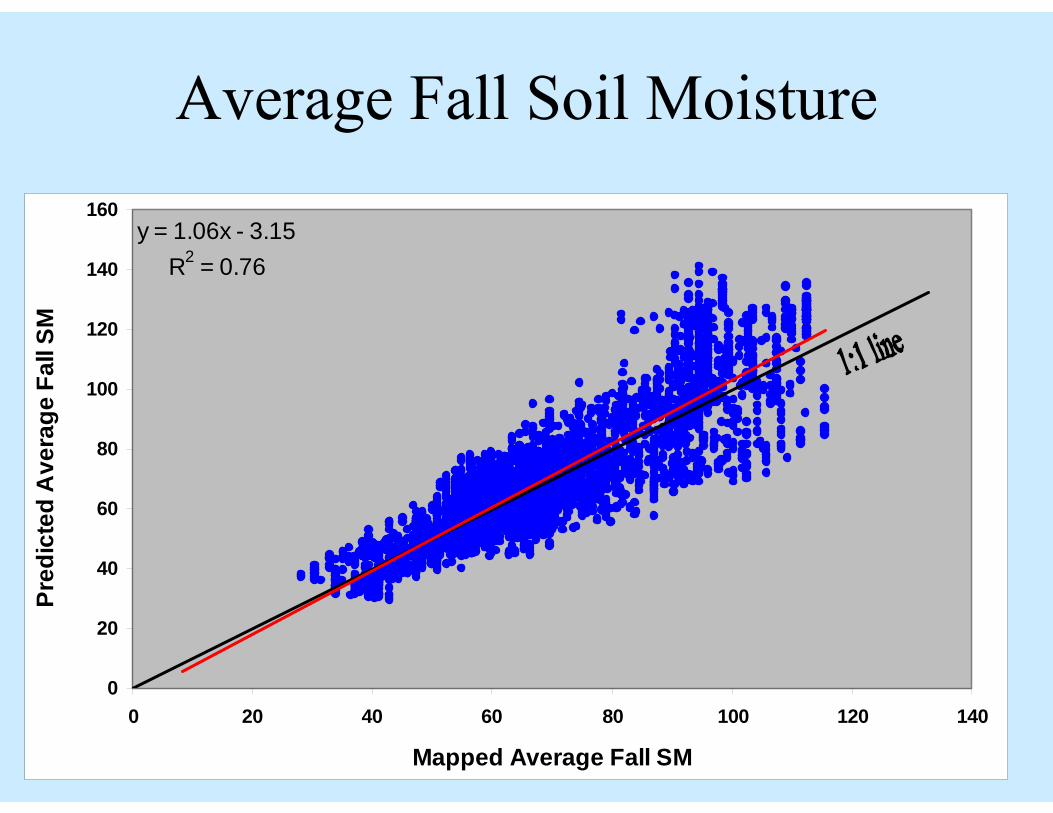
Average Fall Soil Moisture
y = 1.06x - 3.15R2 = 0.76
0
20
40
60
80
100
120
140
160
0 20 40 60 80 100 120 140
Mapped Average Fall SM
Pred
icte
d A
vera
ge F
all S
M

Modeling Soil Moisture in Pasture fields

Model Validation on Pasture fields Near Two Hills
0
25
50
75
100
125
150
175
200
225
250
7-Jun-05
7-Jul-05
7-Aug-05
7-Sep-05
7-Oct-05
7-Nov-05
7-Dec-05
7-Jan-06
7-Feb-06
7-Mar-06
7-Apr-06
7-May-06
7-Jun-06
Date
Soil
Moi
stur
e (m
m)
0
5
10
15
20
25
30
35
Prec
ipita
tion
(mm
)
prcpSimulatedMeasured
Over Winter
(5 km from Station)
(average of 10 measurements)

Model Validation on Pasture fields Near Killiam
0
20
40
60
80
100
120
140
160
180
1-May-06
1-Jun-06
1-Jul-06
1-Aug-06
1-Sep-06
1-Oct-06
1-Nov-06
1-Dec-06
1-Jan-07
1-Feb-07
1-Mar-07
1-Apr-07
1-May-07
Dates
Soil
Moi
stur
e (m
m)
0
5
10
15
20
25
Prec
ipita
tion
(mm
)
prcpSimulatedMeasured
Over Winter
At Killiam AGDM station
(average of 10 measurements)

Model testing and validation at AGDM stations
• Weather stations are outfitted with soil moisture sensors at three depths (Theta Probe ML2X) from Delta-T Device Ltd. and temperature sensors.

Soil and Air Temp. OLIV-AGDM 2006
-25
-15
-5
5
15
25
35
01-J
an-0
6
15-J
an-0
6
29-J
an-0
6
12-F
eb-0
6
26-F
eb-0
6
12-M
ar-0
6
26-M
ar-0
6
09-A
pr-0
6
23-A
pr-0
6
07-M
ay-0
6
21-M
ay-0
6
04-J
un-0
6
18-J
un-0
6
02-J
ul-0
6
16-J
ul-0
6
30-J
ul-0
6
13-A
ug-0
6
27-A
ug-0
6
10-S
ep-0
6
24-S
ep-0
6
Date
Soil
Tem
pera
ture
-25
-15
-5
5
15
25
35
Air
Tem
pera
ture
5 cm 20 cm 50 cm 100 cm Air temp
Soil Moisture and Prcp. OLIV-AGDM 2006
10
15
20
25
30
35
40
45
01-J
an-0
6
31-J
an-0
6
02-M
ar-0
6
01-A
pr-0
6
01-M
ay-0
6
31-M
ay-0
6
30-J
un-0
6
30-J
ul-0
6
29-A
ug-0
6
28-S
ep-0
6
Date
Soil
Moi
stur
e ((
mm
)
0
5
10
15
20
25
30
Prec
ip (m
m)
Prcp 5 cm 20 cm 50 cm 100 cm
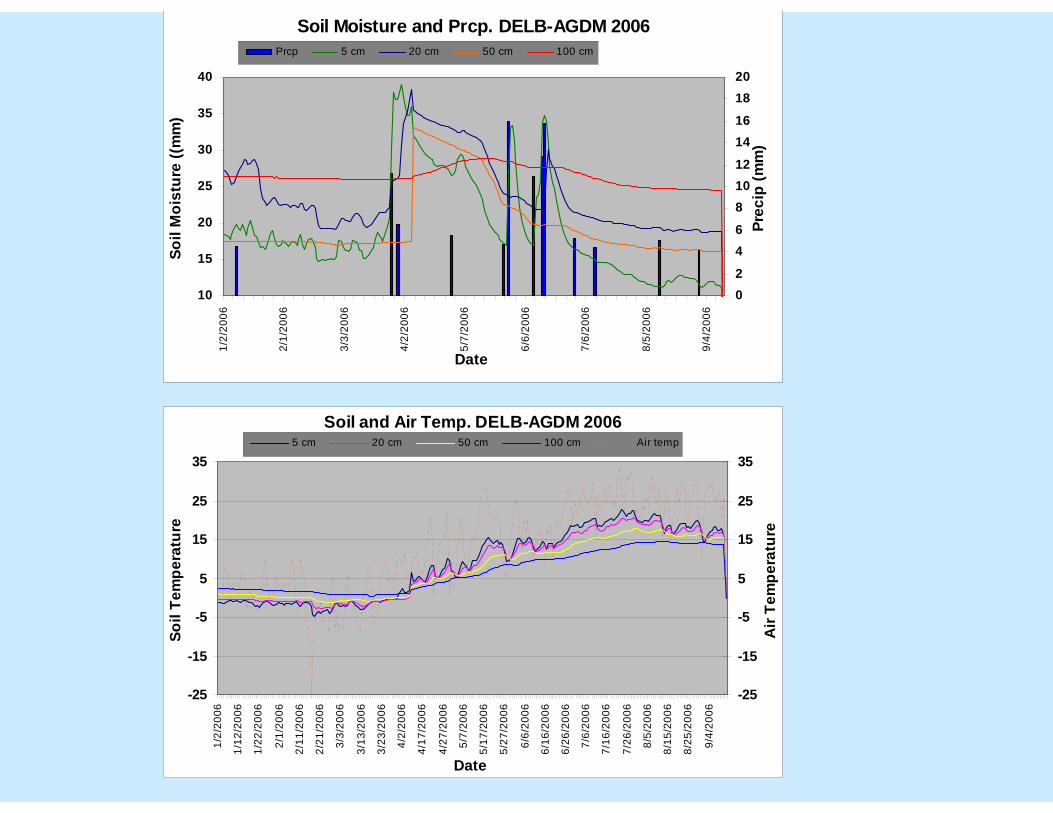
Soil Moisture and Prcp. DELB-AGDM 2006
10
15
20
25
30
35
40
1/2/
2006
2/1/
2006
3/3/
2006
4/2/
2006
5/7/
2006
6/6/
2006
7/6/
2006
8/5/
2006
9/4/
2006
Date
Soil
Moi
stur
e ((
mm
)
02
46
81012
1416
1820
Prec
ip (m
m)
Prcp 5 cm 20 cm 50 cm 100 cm
Soil and Air Temp. DELB-AGDM 2006
-25
-15
-5
5
15
25
35
1/2/
2006
1/12
/200
6
1/22
/200
6
2/1/
2006
2/11
/200
6
2/21
/200
6
3/3/
2006
3/13
/200
6
3/23
/200
6
4/2/
2006
4/17
/200
6
4/27
/200
6
5/7/
2006
5/17
/200
6
5/27
/200
6
6/6/
2006
6/16
/200
6
6/26
/200
6
7/6/
2006
7/16
/200
6
7/26
/200
6
8/5/
2006
8/15
/200
6
8/25
/200
6
9/4/
2006
Date
Soil
Tem
pera
ture
-25
-15
-5
5
15
25
35
Air
Tem
pera
ture
5 cm 20 cm 50 cm 100 cm Air temp
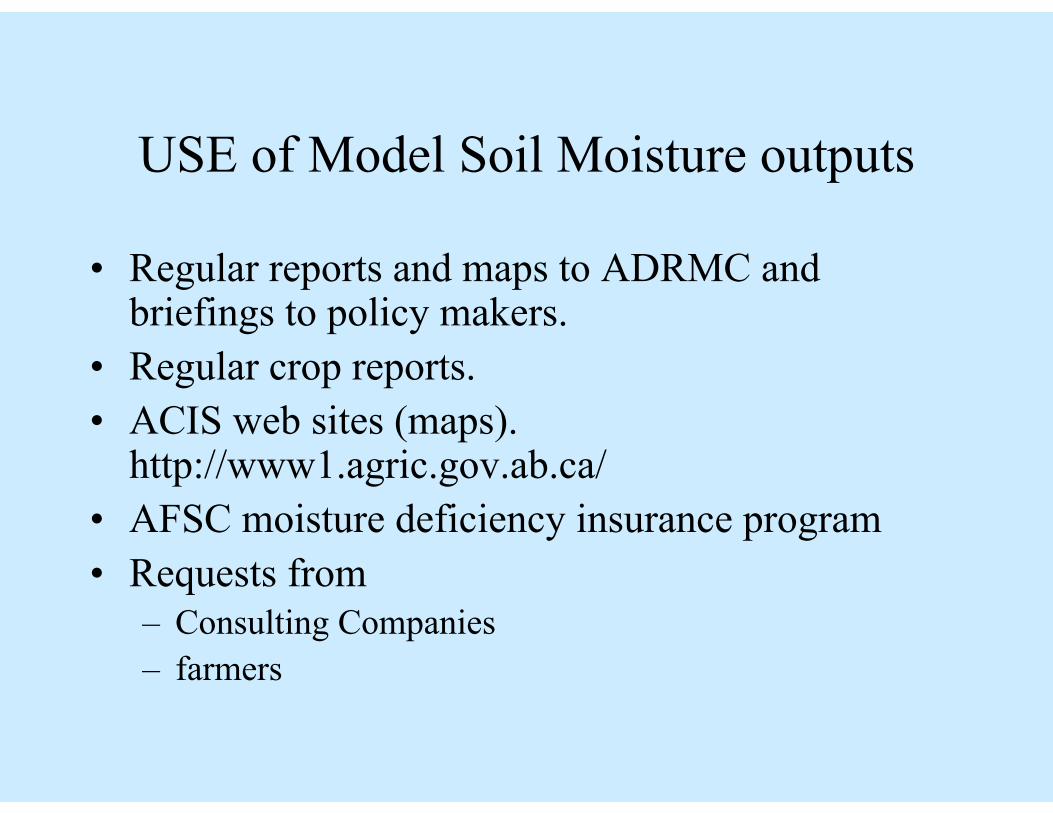
USE of Model Soil Moisture outputs
• Regular reports and maps to ADRMC and briefings to policy makers.
• Regular crop reports.• ACIS web sites (maps).
http://www1.agric.gov.ab.ca/• AFSC moisture deficiency insurance program• Requests from
– Consulting Companies– farmers
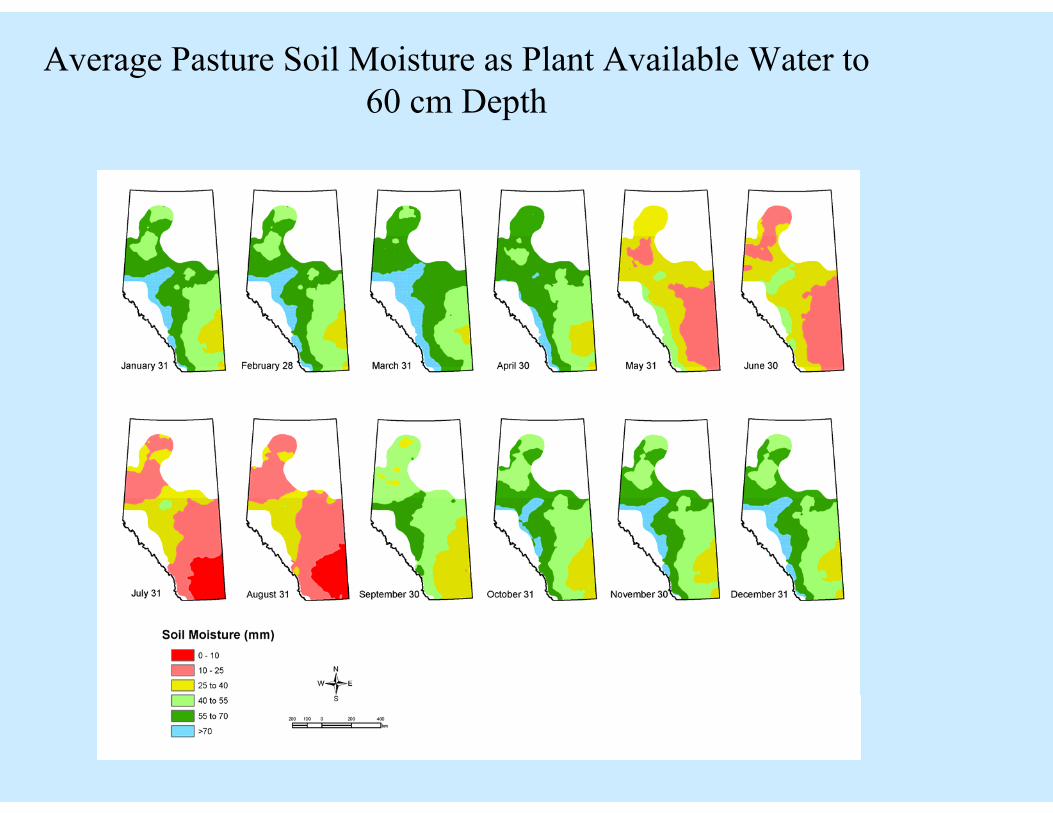
Average Pasture Soil Moisture as Plant Available Water to 60 cm Depth

Thank You!
Questions?


![Description of future drought indices in Virginia · Modified Palmer Drought Severity Index (MPDSI, [5]), which were based on SWAToutputs such as soil moisture, runoff, and evapotranspiration](https://img.pdfslide.us/doc/110x75/5eccbf7ca0af283cb5770f8f/description-of-future-drought-indices-in-virginia-modiied-palmer-drought-severity.jpg)