Embed Size (px)
Citation preview

The Alberta GPI:Economy, GDP, and Trade
by
Mark Anielski
March 2002

The Alberta GPI Accounts: Economy, GDP, and Trade
The Pembina Institute, page ii
About the Pembina InstituteThe Pembina Institute is an independent, citizen-based organization involved in environmentaleducation, research, public policy development and corporate environmental managementservices. Its mandate is to research, develop, and promote policies and programs that lead toenvironmental protection, resource conservation, and environmentally sound and sustainableresource management. Incorporated in 1985, the Institute’s main office is in Drayton Valley,Alberta with additional offices in Calgary and Ottawa, and research associates in Edmonton,Toronto, Saskatoon, Vancouver and other locations across Canada. The Institute’s mission is toimplement holistic and practical solutions for a sustainable world.
The Green Economics Program is dedicated to designing and implementing practical, street-smarteconomic tools that would reorient society back to the original meaning of the word“economy”—the care and management of the wealth of the household. By developing new toolsfor measuring the true wealth or well-being of nations, we can help guide Canadians andAlbertans to a sustainable future.
For more information on the Pembina Institute’s work, please visit our website at www.pembina.org,or contact:
The Pembina InstituteBox 7558
Drayton Valley, AB T7A 1S7tel: 780-542-6272 fax: 780-542-6464
e-mail: [email protected]
About this ReportThis is one of 28 reports that provide the background for the Genuine Progress Indicators (GPI)System of Sustainable Well-being Accounts. It explains how we derived the index that wasearlier published in “Sustainability Trends 2000: The Genuine Progress Statement for Alberta,1961 to 1999.” The research for this report was completed near the end of 2000. The appendicesprovide further background and explanation of our methodology; additional details can beobtained by contacting the authors. Appendix A includes a list of all GPI background reports.
This report examines the overall “economic” health of Alberta’s economy from 1961 to 1999 asreflected in the provincial economic accounts from which the GDP is derived. The reportexamines the trends in GDP, personal consumption expenditures, business investmentexpenditures, government expenditures and the balance of trade (exports and imports). Criticalissues important to economic well-being are examined including trends in GDP compared topersonal consumption expenditures which can then be compared to other indicators such asdisposable income and debt. The fundamental building block of the GPI Income Statement ispersonal consumption expenditures. The nature of consumption and the importance in definingwell-being examined. Fundamental questions about the nature, sustainability, and trade (mostlyexports) in produced (built), financial, natural and human capital or wealth are examined. Also,the changes in the contribution of various sectors to economic growth examined, in particular thechanges in the contribution of the oil and gas, forestry, agriculture, manufacturing and serviceindustries are reviewed. Finally, the diversity of the economy is examined to address fundamentalquestions about whether Alberta’s economy is more resilient and diverse today than it was in the1970s before the oil boom began and led to economic bonanza.
Copyright © 2002 The Pembina Institute ISBN 0-921719-

The Alberta GPI Accounts: Economy, GDP, and Trade
The Pembina Institute, page iii
About the AuthorMark Anielski is Director of the Green Economics team, and has considerable experience inpublic policy analysis including natural resource, energy, royalty and fiscal policy issues in boththe public (Alberta Government) and private (GPC – Government Policy Consultants) sector. Healso serves as Senior Fellow to the U.S. economic policy think-tank Redefining Progress inOakland, California and authored the 1999 U.S. GPI report with journalist Jonathan Rowe. Hecurrently advises the National Round Table on Economy and the Environment’s SustainableDevelopment Indicator Steering Committee on the development of indicators for measuringsustainability in Canada. Mark teaches business and the environment in the University ofAlberta’s School of Business. His expertise is varied and broad including accounting forsustainable development, natural resource accounting, public policy analysis, business planningand performance measurement. Mark pioneered the development of natural capital accounts forAlberta’s timber, oil, gas, coal and other natural capital as well as having experience in thedevelopment of performance measurement systems, land use planning and non-market resourcevaluation, royalty policy analysis (forestry, oil and gas), and analysis of subsidies for bothgovernment and private forestry, energy and financial service industries. He holds a Mastersdegree in forest economics, plus bachelor degrees in economics and forestry.
Acknowledgements and DisclaimerThe author thanks Gary Howe with Alberta Treasury, and Hans Messinger of Statistics Canadafor their guidance and advice in understanding national income accounting and the GDPmethodologies. Gary was particularly helpful in providing historical GDP and provincial accountsdata that made possible a time series from 1961 to 1999 for the economic GPI accounts. Theauthor would also like to thank Dr. Clive Hamilton at the Australian Institute who providedguidance on the treatment of government expenditures in the monetary GPI accounts based on hiswork on the Australian GPI.
The high quality of the data compiled by Statistics Canada and the opportunity to use this dataenabled us to undertake a much more thorough analysis than would otherwise have been possible.Finally, the Pembina Institute appreciates the vision of Western Economic Diversification insupporting this project – the first of its kind for Alberta, if not internationally.
The contents of this report are the responsibility of the Pembina Institute and do not necessarilyreflect the views and opinions of those who are acknowledged above or the opinions or positionsof Western Economic Diversification who helped fund the research.
We have made every effort to ensure the accuracy of the information contained in this documentat the time of writing. However, the author advises that he cannot guarantee that the informationprovided is complete or accurate and that any person relying on this publication does so at theirown risk. Given the broad scope of the project and time constraints, it has not been possible tosubmit the entire report for peer review. The material should thus be viewed as preliminary andwe welcome suggestions for improvements that can be incorporated in any later edition of thework.

The Alberta GPI Accounts: Economy, GDP, and Trade
The Pembina Institute, page iv
Contents1 EXECUTIVE SUMMARY ................................................................................................................... 1
1.1 Economic Growth in Alberta: How Much?........................................................................ 11.2 So What? .............................................................................................................................. 2
2 GDP: MEASURE OF PROSPERITY?............................................................................................... 42.1 Shortcomings of the GDP.................................................................................................... 5
3 UNFINISHED ECONOMIC BUSINESS............................................................................................ 74 SUSTAINABLE INCOME ................................................................................................................... 95 PERSONAL CONSUMPTION EXPENDITURES AS THE GPI CORNERSTONE ................ 106 ALBERTA ECONOMIC GROWTH…UNPRECEDENTED....................................................... 117 MORE GROWTH OF WHAT?......................................................................................................... 138 PUBLIC (GOVERNMENT) CONSUMPTION EXPENDITURES.............................................. 14
8.1 Introduction........................................................................................................................ 148.2 Methodologies for Treatment of Government Expenditures ........................................... 158.3 Government Expenditures in the Alberta GPI.................................................................. 188.4 Government Spending and GDP....................................................................................... 19
9 BUSINESS SPENDING....................................................................................................................... 2310 TRADE – EXPORTS AND IMPORTS............................................................................................. 2511 ECONOMIC DIVERSIFICATION AND RESOURCE DEPENDENCE.................................... 2812 MORE GROWTH? OF WHAT?....................................................................................................... 3413 SO WHAT? ........................................................................................................................................... 34REFERENCES................................................................................................................................................... 35APPENDIX A. LIST OF ALBERTA GPI BACKGROUND REPORTS....................................... 3736APPENDIX B: GDP, TRADE BALANCE AND ECONOMIC DIVERSIFICATION INDEX
DATA ........................................................................................................................................ 3936
Figures and Tables
Figure 1: Alberta’s Total GDP and GDP per capita (1998$), 1961 to 1999 ..................................... 11Figure 2: Contribution to Alberta’s GDP, per capita (1998$), 1961 to 1999 .................................... 13Figure 3: Government Expenditures on Goods, Services and Capital Formation in Alberta’s GDP
Accounts and Percent Contribution to Alberta’s GDP, 1961 to 1999 ....................................... 20Figure 4: Alberta Government Spending (1998$) per capita, 1983 to 1999
(2000-2002 forecast) ................................................................................................................... 21Figure 5: Total Alberta Government Spending per Albertan, 1998 dollars, 1983 to 2001
(Forecast) ..................................................................................................................................... 21Figure 6: Alberta Business Expenditures on Fixed Capital versus GDP, 1998$ millions, 1961 to
1999.............................................................................................................................................. 23Figure 7: Alberta’s Exports versus Imports, 1998 dollars, 1961 to 1999 .......................................... 26Figure 8: Alberta’s Balance of Trade (Exports less Imports versus Oil and Gas Sales, 1998$),
1961 to 1999 ................................................................................................................................ 26Figure 9: Alberta’s Exports, Percentage of Total Exports Contribution by Each Industry or
Commodity Group, 1961 to 1999. .............................................................................................. 28Figure 10: Alberta Economic Diversification Index (EDI) 1971 to 1999 ......................................... 30Figure 11: Ratios of Percent of GDP by Sector of Alberta and Canada, 1971 to 1999 .................... 30Figure 12: Percent Contribution to Alberta’s GDP by Sector, 1971, 1981, 1991, 1999................... 31

The Alberta GPI Accounts: Economy, GDP, and Trade
The Pembina Institute, page v
Figure 13: Economic Diversification: Alberta’s GDP by Industry, 1998 dollars, 1961-1999.......... 32Figure 14: Contribution of Resource-Dependent, Manufacturing and Construction, and Services
Industries to Alberta’s GDP in 1971, 1981, 1991 and 1999 ...................................................... 33
Table 1: Alberta’s Gross Domestic Product, Total 1998 $ millions, and 1998$ per capita, 1961-1999.............................................................................................................................................. 12
Table 2: Alberta Government Expenditures that would be included in the GPI Income Statement,1999-2000 Expenditures.............................................................................................................. 18
Table 3: Percentage Contribution to Alberta’s GDP by Sector or Industry....................................... 31Table 4: Sector Growth (percentage) since 1971................................................................................ 34Table 5: Alberta Gross Domestic Product per capita, Trade Balance (Exports less Imports by
value per capita), and Economic Diversification Index. ........................................................ 3936

The Alberta GPI Accounts: Economy, GDP, and Trade
The Pembina Institute, page 1
1 Executive Summary
1.1 Economic Growth in Alberta: How Much?Alberta’s Gross Domestic Product(GDP) has grown 401 percent since1961 (in 1998$), or 126 percent perAlbertan. According to these figures,we are spending more money than atany time in history. In 1961,Alberta’s GDP was $21,887-million,or $16,395 per capita (1998$); in1999, the GDP was $109,708-million, or $37,005 per capita(1998$). In current dollars, Alberta’sGDP per capita in 1999 was $39,005;this was 1.22 times higher than theCanadian average of $31,414 percapita.
The figure below shows trends intotal Alberta GDP and GDP percapita in constant 1998 dollars. Economic growth generally continued, with some downturns in1981-1983 and 1988-1992. Economic growth was highest in the 1970s when the GDP grew by anaverage 8.7 percent per annum. The 1980s had the slowest GDP growth at 2.2 percent per annum.The 1990s showed a resurgence of growth, averaging an annual growth of 4.9 percent per annumup until 1999.
Total Alberta GDP and GDP per Person, 1961 to 1999
0
20,000
40,000
60,000
80,000
100,000
120,000
1961 1966 1971 1976 1981 1986 1991 1996
GD
P, m
illion
s 19
98$
-
5,000
10,000
15,000
20,000
25,000
30,000
35,000
40,000 G
DP
per p
erso
n, 1
998$
/per
son
Alberta GDP $ millions, 1998$ Alberta GDP per capita $1998/person
Source: Alberta Economic Accounts, Alberta Treasury
Noteworthy• Alberta’s Gross Domestic Product (GDP) has grown 401
percent since 1961.• We are spending more money than any time in history.• Alberta’s GDP per capita in 1999 was $39,005 and was
1.22 times higher than the Canadian average of $31,414per capita.
• The most important component of GDP is the personalconsumption expenditures by Alberta households.
• GDP is an inadequate measure of the overall economic,social and environmental well-being of the households,communities, business, government and the environment.
• The GDP fails account for environmental costs.• The GDP fails to account for the value of unpaid work
(parenting, eldercare and volunteerism).• The GDP does not distinguish between expenditure that
contributes to the well-being of society and expenditurethat detracts from it.

The Alberta GPI Accounts: Economy, GDP, and Trade
The Pembina Institute, page 2
1.2 So What?The figure below shows GDP as an index over time where the highest level of GDP over thestudy period equals 100. The value of the GDP in Alberta in 1999 was $109,708-million. As anindex, GDP in Alberta in 1999 ranked 100 on a scale of 0 to 100 where 100 is the highest level ofGDP that occurred from 1961 to 1999.
While the GDP is a useful measure of the gross expenditures or income of an economy, it is aninadequate measure of the overall economic, social and environmental well-being of households,communities, business, government and the environment. Alberta’s GDP fails to account for thefull costs of depleting oil and gas resource inventories, ecological degradation, air pollution, andmany social costs such as crime and automobile crashes. The GDP does not account for unpaidwork such as volunteerism, parenting and eldercare, nor does it discriminate betweenexpenditures that society might regard as regrettable and as detracting from well-being. The GDPsimply adds these up as part of the economic growth statistic. Finally, GDP does not account forinequitable sharing of the benefits of economic growth – income and wealth. Thus, wheneconomists and policy makers focus only on the GDP to measure economic health and to guideeconomic policy, they violate the spirit of the word “economy” by failing to measure the genuinewell-being and management of Alberta’s households and the natural environment.
Economic Growth Index: Where are we today?
-
10
20
30
40
50
60
70
80
90
100
1960 1965 1970 1975 1980 1985 1990 1995 2000
GD
P In
dex,
ben
chm
ark
year
=10
0
Economic Growth
More Economic Growth
Less Economic Growth
The Alberta GPI Accounts: Economy, GDP, and Trade
The Pembina Institute, page 3
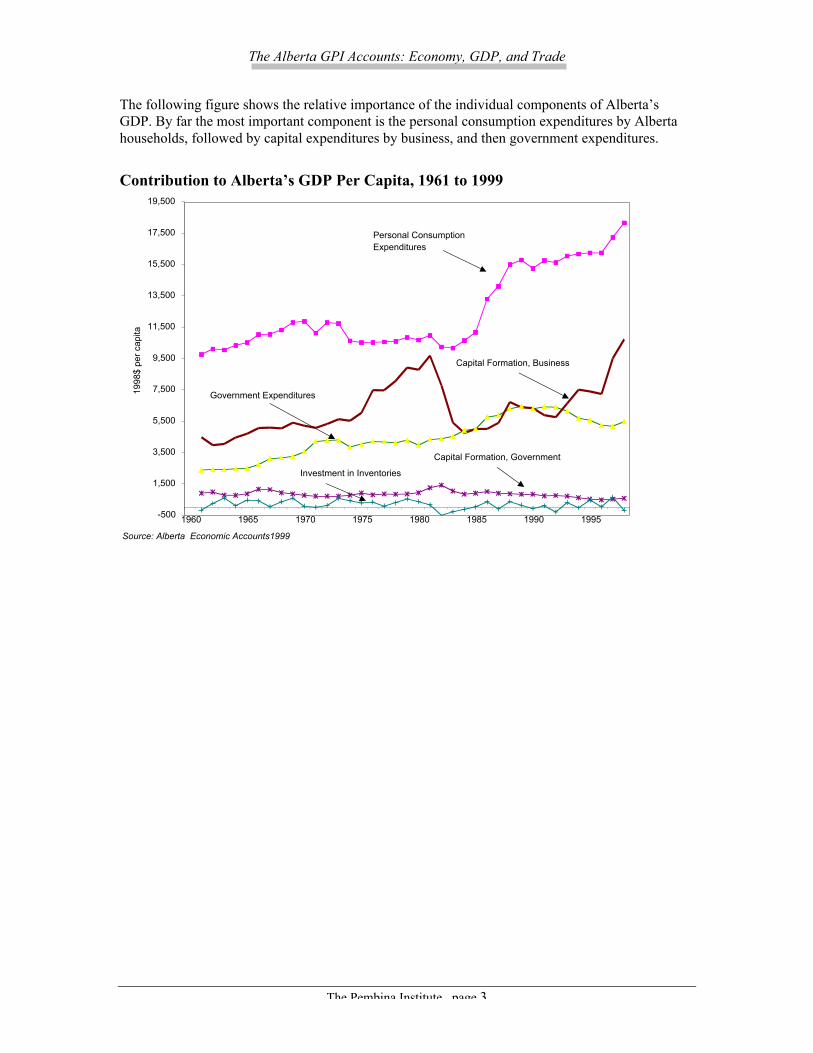
The following figure shows the relative importance of the individual components of Alberta’sGDP. By far the most important component is the personal consumption expenditures by Albertahouseholds, followed by capital expenditures by business, and then government expenditures.
Contribution to Alberta’s GDP Per Capita, 1961 to 1999
-500
1,500
3,500
5,500
7,500
9,500
11,500
13,500
15,500
17,500
19,500
1960 1965 1970 1975 1980 1985 1990 1995
1998
$ pe
r cap
ita
Personal Consumption Expenditures
Capital Formation, Business
Capital Formation, Government Investment in Inventories
Government Expenditures
Source: Alberta Economic Accounts1999
The Alberta GPI Accounts: Economy, GDP, and Trade
The Pembina Institute, page 4
2 GDP: Measure of Prosperity?The gross domestic product (or GDP) is the traditional measure of economic prosperity and is thebasis for the economic growth figures that appear in the media. We have grown used to hearingeconomic growth forecasts that project another robust year of two to five percent growth in GDP.We automatically assume that more growth is inherently better and that stagnant and negativeGDP growth is bad. Few of us understand what economic growth and the GDP really mean andhow they are measured.
The GDP can be expressed on the basis of expenditure or income.1 Based on expenditures, it iscalculated as follows (the figures in brackets represent the percent contribution to Alberta’s GDPby each component):
GDP = personal consumption expenditures (of households) (48.2%)+ government expenditures (14.1%)+ government investment in fixed capital (1.7%)+ business investment in fixed capital (26.0%)+ investment in inventories (0.7%)+ exports of goods and services (+ 53.3%)- imports of goods and services (- 44.6%) (for a net trade balance contribution of +8.7%)
The GDP is the sum total of all monetary transactions of households, businesses and governmentsin the economy – the total money value of goods and services exchanged and consumed. TheGDP is a good measure of monetary wealth and financial well-being but a poor measure of theoverall well-being of the people, households, communities and the environment of a nation.
According to the GDP metric, the more we produce, the more we consume, the more money thatchanges hands, and the more money we make, the more GDP grows. Growth, expressed in termsof GDP, is automatically assumed to be good and to reflect genuine prosperity. But does it?
The GDP for the nation and provinces is calculated by Statistics Canada and is drawn from thenational income accounts. Alberta Treasury also maintains provincial economic accounts fromwhich the Alberta GDP and other economic indicators are derived. The Alberta EconomicAccounts from 1961 to 1999, augmented with Statistics Canada data, were used in the AlbertaGPI accounts.
The fundamental issue examined in the Alberta GPI accounting project is the sustainability of 40or more years of steady economic growth in Alberta, as measured by the GDP and the Albertaeconomic accounts. We were interested in constructing a more holistic perspective on oureconomic growth paradigm by explicitly accounting for what costs and benefits contribute toeconomic growth. Which benefits are not being counted and which costs (that contribute to GDPgrowth) are in fact regrettable social, human or environmental costs or depreciation costs ofhuman, social and natural capital?
1 GPI, on the other hand, uses both expenditure-based GDP and national income accounts.

The Alberta GPI Accounts: Economy, GDP, and Trade
The Pembina Institute, page 5
2.1 Shortcomings of the GDPThere is a growing consensus that the GDP and other economic measures of prosperity areinadequate measures of well-being, sustainability and quality of life of nations. The shortcomingsof the GDP bear repeating. The GDP measures the total money value of market goods andservices exchanged in a community or nation. It does a good job of accounting for all the moneychanging hands from one year to the next but provides little insight into changes in the trueeconomic condition of households. By adding up the monetary transactions in an economy andcalling this progress or prosperity obscures an honest accounting of our quality of life and thestate of the environment.
Former Senator Robert Kennedy, in 1968, summed up the shortcomings of the GNP/GDP:
“The Gross National Product [and GDP] includes air pollution and advertisingfor cigarettes, and ambulances to clear our highways of carnage. It counts special locks forour doors, and jails for the people who break them. GNP includes the destruction of theredwoods and the death of Lake Superior. It grows with the production of napalm and missilesand nuclear warheads... And if GNP includes all this, there is much that it does notcomprehend. It does not allow for the health of our families, the quality of their education, orthe joy of their play. It is indifferent to the decency of our factories and the safety of ourstreets alike. It does not include the beauty of our poetry or the strength of our marriages, orthe intelligence of our public debate or the integrity of our public officials... GNP measuresneither our wit nor our courage, neither our wisdom nor our learning, neither our compassionnor our devotion to our country. It measures everything, in short, except that which makes lifeworthwhile.”1
For more than 50 years the GDP and the national system of income accounts have been used byvirtually every nation as the basis for measuring their economic prosperity. When the WorldBank compares national incomes per capita, it uses the GDP figures per capita; so does the UN inits indicator of income and economic health of economies – the Human Development Index.
The GDP and national income accounts in general, embody many shortcomings that the GPIaccounting framework seeks to address, namely:
1) The GDP fails to distinguish between the full costs and benefits of economic activity.It regards every expenditure as an addition to well-being, regardless of its purposeand impact. By this reasoning, an economic hero is a terminal cancer patient goingthrough an expensive divorce, whose car is totaled in a twenty-car pile-up. Also, thecosts of cleaning up after an environmental calamity, such as the Montreal ice storm,boosts provincial and national GDP figures alike. The economic villain, according tothe GDP, is the healthy person in a solid marriage who cooks at home, walks to workand doesn’t smoke or gamble.
2) The GDP ignores and excludes the functions of the household that lie outside therealm of monetary exchange. GDP excludes the value of the time spent at unpaidhousework, childcare, eldercare, volunteer work and leisure. In the GDP figures,these expenditures of life-energy (time) count for nothing, even though they are vitalto our well-being and quality of life. Yet purchases of daycare for our children,house-cleaning services, and eldercare services from the marketplace increase theGDP. Paradoxically, the cannibalizing of our time and quality of life actuallyincreases economic growth, as measured by the GDP. GDP growth since the 1960smight actually have occurred because those who had been contributing unpaid work

The Alberta GPI Accounts: Economy, GDP, and Trade
The Pembina Institute, page 6
(women in particular) sought paid work, and the household management services thatthey had been performing without pay were replaced by paid services from otherworkers. While economic growth is observed in this situation, there may have beenno real increase in the well-being and quality of life of households because peoplenow have less quality time with their families and friends.
3) The GDP does not account for the value and depreciation of natural resources and theenvironment required to sustain current and future economic well-being. Inventoriesof natural resources and the value of natural resources and environmental servicescount for nothing in the GDP and national income accounts. The GDP ignores thelong-term costs of environmental degradation, focusing only on the presentconsumption of natural capital. The GDP counts the depletion of natural resources ascurrent income rather than as the liquidation of an asset. Most companies would beout of business if they did not account for the depreciation of their assets. Thus,treating natural capital in this manner violates both basic accounting principles andcommon sense. Furthermore, when the depreciation of natural capital is ignored, themarket receives the wrong signal – that investment in sustaining renewable naturalresources is unimportant. Ignoring the depreciation of non-renewable naturalresources (oil, gas, coal) also violates basic accounting principles for treatment ofassets. Not reinvesting some of the revenues from a finite, non-renewable resourceasset into savings or into alternative, sustainable forms of capital will alsocompromise the incomes of future generations.
4) The GDP ignores totally the distribution of income, the social costs of inequality, andpoverty. Changes in GDP are insensitive to income inequality, poverty and thedistribution of personal consumption and wealth. A rising GDP may obscure who isbenefiting most from economic growth. We often assume that if an economy isgetting bigger, all households are benefiting equally.
5) The GDP contains regrettable intermediate expenditures that do not necessarilycontribute to economic well-being. For example, costs related to crime, autoaccidents, commuting, and spending on divorce lawyers may be viewed as regrettableexpenditures even though they add to the GDP. Government spending, termed“intermediate expenditures,” such as military spending, environmental protection,and spending on prisons may also be viewed as regrettable.
6) The GDP includes expenditures on education, health care, social services andenvironmental protection that do not necessarily reflect the outcomes or returns oninvestment from such expenditures. Such outcomes might include physical well-being (e.g., life expectancy), intellectual and labour market skills, educationalattainment, and the quality of the environment.
7) The GDP does not directly measure the benefits of investment in household, publicand social capital. Social capital includes the investments in the health and wellnessof communities, social institutions, and democratic processes.
The Alberta GPI Accounts: Economy, GDP, and Trade
The Pembina Institute, page 7
3 Unfinished Economic BusinessSimon Küznets, the U.S. economist who pioneered the development of national incomeaccounting and the GDP/GNP metrics in the 1950s, following from the work of John MaynardKeynes and Sir Richard Stone, remarked:
“The welfare of a nation can scarcely be inferred from a measurement of national income asdefined (by the GDP) ….Goals for more growth should specify of what and for what.”2
That is to say, we seek answers to the question: “If GDP is up, is that necessarily good if otherhuman, social and natural capital indicators are down?”
Küznets went so far as to recommend the eventual construction of a single bottom line fornational well-being as if foreshadowing the eventual attempts beginning with Tobin andNordhausand Tobin Nordhaus (1971) and advancing with the Index for Sustainable Economic Welfare in1989, and the Genuine Progress Indicator in 1994. Küznets (1965) noted:
“It does seem to me, however, that as customary national income estimates and analysis areextended, and as their coverage includes more and more countries that differ markedly intheir industrial structure and form of social organization, investigators interested inquantitative comparisons will have to take greater cognizance of the aspects of economic andsocial life that do not now enter national income measurement; and that national incomeconcepts will have to be either modified or partly abandoned, in favour of more inclusivemeasures, less dependent on the appraisals of the market system… The eventual solutionwould obviously lie in devising a single yardstick that could then be applied to both types ofeconomies – a yardstick that would perhaps lie outside the different economic and socialinstitutions and be grounded in experimental science (of nutrition, warmth, health, shelter,etc.)3
Was Küznets foreshadowing the Alberta GPI Accounting framework?
While Küznets presented this important challenge to economists 50 years ago, moderneconomists have sustained that challenge. John Kenneth Galbraith, in a 1999 public address,noted that the most important “unfinished business” issues for economics [as we approach thenew millennium] include: the shortcomings of GNP/GDP as an economic measure, economicinstability (cycles of boom and bust), and poverty and income inequality.4 Galbraith said:
“There is a major flaw in measuring the quality and achievement of life by the total ofeconomic production – (GNP/GDP) – the total of everything we produce and everything wedo for money.”
Galbraith echoes the words of Küznets by noting that measures such as GNP override andobscure deeper and more important aspects of economic life, failing to “take sufficient account ofthe value and enjoyment of what is produced.”
Herman Daly, Professor at the University of Maryland School of Public Affairs, former senioreconomist at the World Bank, and co-founder of the International Society for EcologicalEconomics has been one of the most important voices for raising awareness of the shortcomingsof modern economics and redefining our notion of economic progress and measurement ofsustainable well-being. Daly (1996: 111-112) states:
“Economic development as it is currently understood and measured is neither sustainable fora long future nor generalizable to all presently living people….the macroeconomic activity of

The Alberta GPI Accounts: Economy, GDP, and Trade
The Pembina Institute, page 8
national economic growth does not conceive of having an optimum extent…GNP is aconflation of costs, benefits and changes in accumulation, and is no better a guide todetermine the optimum level of economic activity than the stock of gold bullion.”
Daly (1996: 113) suggests that instead of one income account (that is, the GNP/GDP), nationsshould adopt:
1) a benefit account to measure the value of services yielded by all accumulations;2) a cost account to measure the value of depletion, pollution and those kinds of labour that
are irksome; and3) capital accounts; that is, an inventory of the accumulation of stocks and funds (produced
and natural capital, and ecosystem infrastructure) and their ownership distribution.
We have adopted Daly’s model, in part, for the Alberta GPI accounting framework.
The challenges of these visionary economists are as relevant today as they were in the 1950s. Yet,until recently, few efforts had been made to modify or improve the measurement system andeconomic prosperity indicators that every nation uses as a basis of measuring the health of theeconomy. Indeed we argue that economics is more focused on money-related accounting than onmeasuring the genuine well-being or condition of households of the nation. It is time to reorientboth macro- and micro-economic analysis toward stewardship of the household, the community,society and the environment. The Alberta GPI accounting system offers a new, elegant andpragmatic approach designed to do just that.
The Alberta GPI Accounts: Economy, GDP, and Trade
The Pembina Institute, page 9
4 Sustainable IncomeMost economists will agree with the standard definition of income by Hicks (1946):
Income is the maximum amount an individual can consume during a period and remain aswell off at the end of the period as at the beginning.
Statistics Canada defines the income of a nation or province as “the amount it (nation) cancollectively spend during a period without depleting the capital base (or wealth) upon which itrelies to generate this income.”5
Given our clarification that wealth encompasses more than financial capital and includes natural,social, human and built capital, we can extend the definition of income to the notion ofsustainable income – that is, living off the “interest” of natural, human, social and built(produced) capital without compromising the integrity or productivity of the stock of capital toproduce products and services in the future as they are today.
This has led to the economic interpretation of sustainable development by Bartelmus (1990) as:
Economic sustainable development is development that generates non-declining per capitanational income by replacing or conserving the sources of that income; that is, the stocks ofproduced and natural capital.
GPI Accounting is consistent with this wider definition of income, capital and wealth. Thus thetraditional definition of income, which generally applies to financial capital, is congruent with thenotion of sustaining the services (interest) from the current and future stock of living andproduced capital. The orientation is on stewardship or management of all capital for sustainedbenefits and mitigation of risks or liabilities to future streams or flows of benefits.
Measuring sustainable income requires an assessment of the condition and monetary valuation ofthe stock of all capital, as well as an account of the physical quantity, quality and monetary valueof the flow of goods and services derived from this capital. This is essentially what GPIaccounting accomplishes both at the macro level of the economy or community, and at the microlevel of the organization (firm, household, individual).

The Alberta GPI Accounts: Economy, GDP, and Trade
The Pembina Institute, page 10
5 Personal Consumption Expenditures as the GPICornerstone
Since personal consumption is the largest component of GDP, this presumed correlation betweenconsumption and well-being is the conceptual starting point for those who use GDP as a measureof economic progress. To be conservative and contemporary, the GPI implicitly accepts thatpremise. The U.S. and Australian GPI analyses begin with personal consumption expenditures asthe starting point for deriving a GPI net sustainable income line to compare against the GDP,based on the idea that the expenditures on goods and services by households are a first ordermeasure of economic welfare.
The GPI Income Statement uses gross personal consumption expenditures as the basis on which aseries of unaccounted-for human, social, produced, financial and natural capital benefits and costsis used to derive a sustainable income estimate for Alberta. The primary driver of Alberta’s GDPis personal consumption expenditures by households, which accounted for 48 percent of 1999GDP (compared to 60 percent in 1961). From 1961 to 1999, personal consumption expendituresin real dollars have increased 305.6 percent, or 82.6 percent on a per capita basis (real 1998dollars) for an annualized per capita, real growth rate of 2.2 percent. Compared with the U.S.where personal consumption expenditures make up roughly 65 percent of U.S. GDP, spending byhouseholds is less important given the importance of the petroleum and other industries (mostlyexport-based) to Alberta’s economy, plus the importance of government spending.
Thus the GPI is already strongly biased upwards because personal consumption expenditureshave risen at approximately the same rate as GDP. Much of what we count as personalconsumption may not represent genuine development of the quality of the lives of households atall, but instead account for the circulation of money in an economy chasing goods and servicesthat most households do not actually require beyond some basic level.
There is little doubt that the consumption of the many goods and services we purchase does addto the quality of our lives, particularly for those who lack enough calories or adequate health careor shelter. But beyond the level of basic necessities for food, clothing, shelter and health, thequestion of increasing consumption of “luxury” items such as cigarettes, recreational toys,gadgets, processed foods and restaurant meals becomes more complex and even questionable.Indeed, the potential exists to be consuming manufactured goods and services that are in fact so“processed” that they may actually diminish our physical well-being. Furthermore, a society maybe exporting much of its surplus natural and human capital at rates that could also diminish long-term sustainable well-being. Much of this excess consumption may diminish the natural capacityof our environment and natural resources to sustain our demands for more consumption.

The Alberta GPI Accounts: Economy, GDP, and Trade
The Pembina Institute, page 11
6 Alberta Economic Growth…UnprecedentedBetween 1961 and 1999, Alberta’s economy, as measured by real (1998$) GDP grew by 401percent – an average of 10.5 percent per annum over almost 40 years. On a per capita basis,Alberta’s GDP grew 126 percent while the average annual rate of real (1998$) GDP growth percapita growth was 2.2 percent from 1961 to 1999. According to these figures we are better offthan at any time in our history, producing and consuming more and spending more money in theprocess. The GDP growth figures suggest we are better off, but are we missing something in thislimited view of well-being?
In 1961, Alberta’s GDP was $21,887-million or $16,395 per capita (1998$); in 1999, the GDPwas $109,708 million or $37,005 per capita (1998$). In current dollars, Alberta’s GDP per capitain 1999 was $39,005 – 1.22 times higher than the Canadian average of $31,414 per capita.
If Alberta were a country, it would have ranked 18th out of 163 countries in 1997 with GDP atUS$20,900 (World Bank 1999, Statistics Canada 1999).67 In purchasing power parity, Canadaranks 11th, while Alberta ranks 6th in the world. Alberta’s GDP per capita expressed in US dollarsfor 1998 is approximately $25,411 or 91 percent of U.S. GDP per capita of $27,939.8
Figure 1 and Table 1 show the trends in total Alberta GDP and GDP per capita in terms ofconstant 1998 dollars. Economic growth continues over time with some downturns in 1981-1983and 1988-1992. Economic growth was highest in the 1970s when the GDP grew by an average8.7 percent per annum. The 1980s had the slowest GDP growth at 2.2 percent per annum. The1990s showed a resurgence, averaging 4.9 percent per annum up until 1999 (all figures expressedin 1998 dollars).
Figure 1: Alberta’s Total GDP and GDP per capita (1998$), 1961 to 1999
0
20,000
40,000
60,000
80,000
100,000
120,000
1961 1966 1971 1976 1981 1986 1991 1996
GD
P, m
illio
ns 1
998$
-
5,000
10,000
15,000
20,000
25,000
30,000
35,000
40,000
GD
P p
er p
erso
n, 1
998$
/per
son
Alberta GDP $ millions, 1998$
Alberta GDP per capita$1998/person
Source: Alberta Economic Accounts, Alberta Treasury

The Alberta GPI Accounts: Economy, GDP, and Trade
The Pembina Institute, page 12
Table 1: Alberta’s Gross Domestic Product, Total 1998$ millions, and 1998$ percapita, 1961 to 1999ALBERTA GROSS DOMESTIC PRODUCT, 1961-1999
YEAR TOTAL PER PERSON(million 1998 dollars) (1998 dollars)
1961 21,887 16,395 1962 23,075 16,806 1963 24,286 17,261 1964 25,345 17,712 1965 26,736 18,426 1966 28,645 19,553 1967 29,000 19,424 1968 29,935 19,604 1969 31,492 20,161 1970 33,273 20,835 1971 34,920 20,964 1972 37,546 22,163 1973 41,133 23,841 1974 44,565 25,399 1975 45,461 25,135 1976 46,592 24,925 1977 49,541 25,436 1978 53,124 26,276 1979 59,484 28,358 1980 62,373 28,449 1981 68,004 29,642 1982 64,311 27,156 1983 61,328 25,656 1984 63,534 26,583 1985 65,617 27,307 1986 66,837 27,495 1987 69,391 28,492 1988 75,684 30,832 1989 75,735 30,345 1990 76,163 29,896 1991 77,264 29,802 1992 78,338 29,737 1993 85,564 32,038 1994 90,116 33,316 1995 93,479 34,118 1996 95,430 34,319 1997 103,495 36,478 1998 105,927 36,440 1999 109,708 37,005
SOURCES: Alberta Treasury, Economic Accounts, various issuesPopulation statistics are from Statistics Canada1998 dollars estimated using the Alberta GDP Implicit Price Index
The Alberta GPI Accounts: Economy, GDP, and Trade
The Pembina Institute, page 13
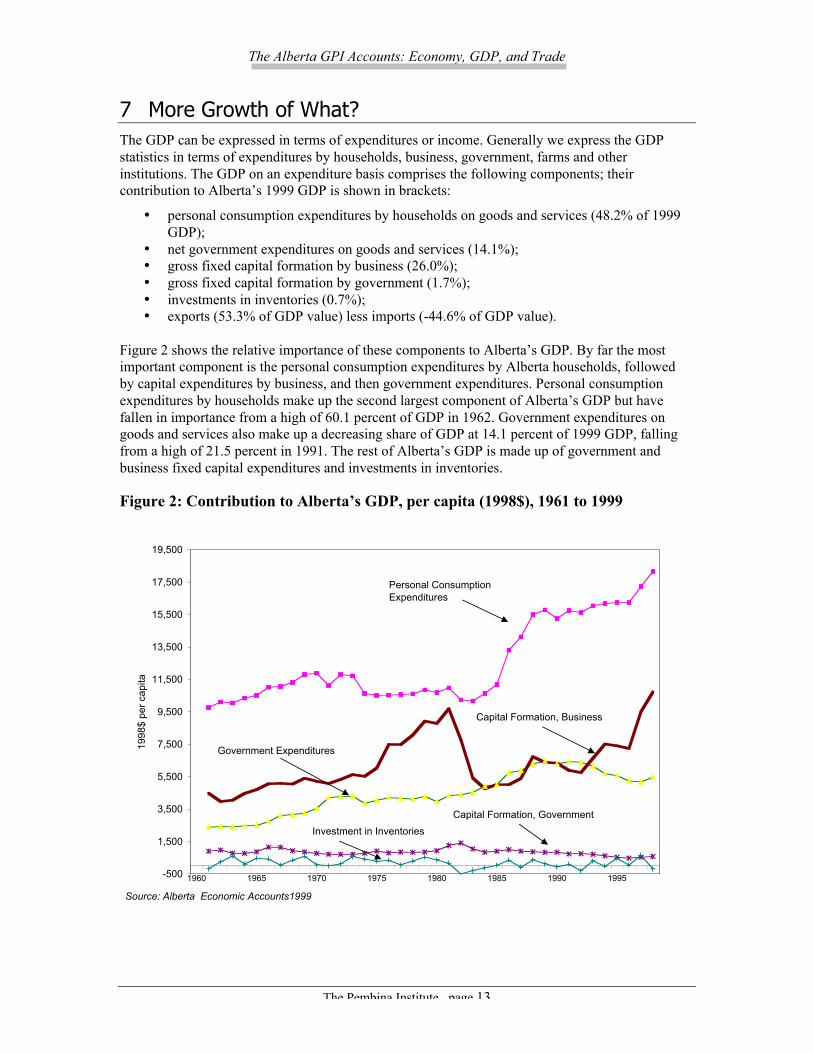
7 More Growth of What?The GDP can be expressed in terms of expenditures or income. Generally we express the GDPstatistics in terms of expenditures by households, business, government, farms and otherinstitutions. The GDP on an expenditure basis comprises the following components; theircontribution to Alberta’s 1999 GDP is shown in brackets:
• personal consumption expenditures by households on goods and services (48.2% of 1999GDP);
• net government expenditures on goods and services (14.1%);• gross fixed capital formation by business (26.0%);• gross fixed capital formation by government (1.7%);• investments in inventories (0.7%);• exports (53.3% of GDP value) less imports (-44.6% of GDP value).
Figure 2 shows the relative importance of these components to Alberta’s GDP. By far the mostimportant component is the personal consumption expenditures by Alberta households, followedby capital expenditures by business, and then government expenditures. Personal consumptionexpenditures by households make up the second largest component of Alberta’s GDP but havefallen in importance from a high of 60.1 percent of GDP in 1962. Government expenditures ongoods and services also make up a decreasing share of GDP at 14.1 percent of 1999 GDP, fallingfrom a high of 21.5 percent in 1991. The rest of Alberta’s GDP is made up of government andbusiness fixed capital expenditures and investments in inventories.
Figure 2: Contribution to Alberta’s GDP, per capita (1998$), 1961 to 1999
-500
1,500
3,500
5,500
7,500
9,500
11,500
13,500
15,500
17,500
19,500
1960 1965 1970 1975 1980 1985 1990 1995
1998
$ pe
r cap
ita
Personal ConsumptionExpenditures
Capital Formation, Business
Capital Formation, GovernmentInvestment in Inventories
Government Expenditures
Source: Alberta Economic Accounts1999

The Alberta GPI Accounts: Economy, GDP, and Trade
The Pembina Institute, page 14
8 Public (Government) Consumption Expenditures
8.1 IntroductionAll government expenditures on goods, services and capital are included in the GDP and innational and provincial economic accounts without distinguishing between those expendituresthat contribute to genuine improvements in well-being and those that are defensive, or regrettable.GPI Accounting attempts to make a clear distinction between public (that is, government)consumption expenditures that improve well-being of society and the environment and those thatmerely compensate for damage or erosion to human, social, and environmental capital.
Deciding which government expenditures genuinely contribute to well-being can be difficult andfraught with philosophical challenges. Drawing from the earlier work by Cobb and DalyDaly andCobb (1989), Cobb and Cobb (1994), and more recently Hamilton and Denniss (2000), we candevelop some guidelines for distinguishing between regrettable expenditures and those that aregenuine contributions to welfare. A wider forum in which to debate and refine such guidelines ismuch needed. But in the absence of broadly accepted value “screens” to guide us in the AlbertaGPI accounting project, we have proposed some guidelines that we hope will open up the publicdebate about what constitutes an improvement over current practices, which do not nowdiscriminate between expenditures.
Attributing changes in social, human, economic-financial, and environmental capital conditionsto government expenditures is the key challenge in GPI accounting. Attribution analysis is madepossible with the GPI accounting framework, allowing decision makers to compare trends in thecondition of human, social, economic, and natural capital with government expenditures todiscern correlations. GPI accounting would allow decision makers to have a more informeddebate about the full costs and benefits of government spending as they relate specifically tosocial, human, environmental and economic well-being outcomes. For example, is increasedspending on health and education improving human health and raising levels of intellectual orknowledge capital? Are environmental expenditures rising as a result of a degraded environmentor unsustainable resource use?
This challenge raises some fundamental issues such as:
• Should all health care and education spending be considered as a positive investment inhuman capital and genuine well-being? Should we not distinguish between healthexpenditures that may be viewed as regrettable expenditures that would not have beennecessary had it not been for the consequences of unhealthy lifestyles, stress, accidents, adegraded environment and other declining social, economic and environmentalconditions, which are captured in the GPI accounts?
• Should expenditures on justice, the environment, and social services be considered asregrettable since they relate to pollution, mitigation against unsustainable resource use,social degradation and crime and violence?
If the answer to these questions is yes, then such expenditures should be presumably be excludedfrom the GPI sustainable income statement for the nation or province.
The Alberta GPI Accounts: Economy, GDP, and Trade
The Pembina Institute, page 15
8.2 Methodologies for Treatment of Government ExpendituresDespite years of analysis and academic debate, no clear consensus has emerged on how to dealwith government or public expenditures in economic well-being accounting such as the GPIaccounting work. The original U.S. GPI, which uses only personal consumption expenditures (aportion of total GDP and economic accounts) as its fundamental building block, treats all publicor government expenditures, except for the value of services to persons generated by streets andhighways, as intermediate (defensive, protective or regrettable) in nature thus excluding themfrom the GPI estimates of economic well-being. Private spending on health and education areincluded in the U.S. GPI estimates through inclusion in personal consumption expenditures whilepublic spending is ignored. The Alberta GPI accounts attempt to consider both public and privateexpenditures in their contribution to overall economic well-being.
Prior to the U.S. GPI work by Redefining Progress, Daly and John Cobb Jr(1994) inr. andHerman Daly in For the Common Good (1994) developed the Index for Sustainable EconomicWelfare, providing some guidance to treatment of government expenditures. With the exceptionof a portion of expenditures on health and education, they exclude government expenditures.They argue that, “government program [expenditures] does not add much to net welfare asprevent the deterioration of well-being by maintaining security.”9 They also argue thatexpenditures on public utilities, such as sewage, utilities and transit provide services for a fee justas private businesses do and thus already show up in personal consumption expenditures byhouseholds. They only identify the value of streets and highways as a government expenditurethat contributes to economic well-being since such services could theoretically be offered throughthe market. They exclude most government expenditures with the argument that “increases ingovernment spending and real increases in welfare are tenuous because of the difficulty ofmeasuring the demand for the kinds of services that government offers.”
Cobb and Daly and Cobb (1994) count only 50 percent of public spending on advanced or highereducation and health expenditures by government as a contribution to welfare and thus proposeadding them to personal consumption. They consider that the other 50 percent of higher educationis neither consumption nor investment but rather defensive spending, contributing little toproductivity gains. They argue that, “People attend school because for most the failure to attendwould mean falling behind in the competition for diplomas and degrees that confer higherincomes on their recipients.” (Cobb and Daly, 1994: p. 468). They also argue that one-half ofpost-secondary education is pure consumption in that “it is sought for its own sake rather than toserve another purpose.” While there is little doubt that post-secondary education spending doeshelp to built up intellectual and knowledge capital in society, we concur with Daly and Cobb’sargument that some of this consumption by households is simply being done to “keep up with theintellectual capital of the Joneses.”
The original work by Nordhaus and Tobin (1970) in the 1970s on the Measure of EconomicWelfare considers all public and private health and education spending as positive investments inhuman capital, treating the change in the net spending as in investment in human capital.2Nordhaus and Tobin estimate the value of education spending invested in the labour force as theaverage cost per student multiplied by the average number of years of educational attainment perindividual in the labour force. They also estimate the value of health spending as the cumulatedpublic and private spending on health reduced by an annual exponential and arbitrary
2 Some issues are raised as to why health spending on the elderly should be included since the elderly mayno longer contribute to the labour market and thus to traditional accounts of economic well-being.

The Alberta GPI Accounts: Economy, GDP, and Trade
The Pembina Institute, page 16
depreciation rate of 20 percent. U.S. economist Robert Eisner developed a Total Income Systemof Accounts that included only 50 percent of health expenditures as a rough estimate, to excludehealth expenditures for the retired or elderly population. He considered some elements such ashealth and education spending as positive contributions to economic well-being.
In the most recent Australian GPI, Hamilton and Denniss (2000) divides public sectorexpenditures (both operating and capital expenditures) into two categories in the Australian GPIaccounting work:
• general government services, defence, public order and safety, education, health, socialsecurity; and
• welfare, housing and community amenities, recreation and culture, transport andcommunication, and other.
Because some part of recurrent expenditures comprises transfer payments, these are excludedfrom GDP.
The fundamental questions to be asked when choosing which public consumption expenditures toinclude in contributions to economic well-being are:
• Was the decision to increase spending in a given public program area made to increasethe level of well-being in society (non-defensive expenditures); or
• Were the expenditures defensive in nature; that is, made to offset declining levels of well-being in human, social, and environmental capital?
While these questions may be difficult if not impossible to answer with consensus, somereasonable positions can be explored. As a general rule, we must first decide whether publicexpenditures are:
a) non-defensive, adding to welfare;b) defensive (off-setting welfare loses or erosion of human, social and natural capital); orc) investments in capital.
We include only those expenditures that are non-defensive consumption spending in the GPIincome statement. Public expenditures that are made to offset declines in capital values areexcluded, as are investments in capital, per se. The GPI accounting system distinguishes betweenconsumption expenditures (and value of services from capital) and investments in capital stocks.Part, none or all of public consumption expenditures are included in the GPI Income Statementwhile investments in human, social and natural capital stocks are excluded; this is consistent withaccounting practices.
For the Alberta GPI, we have adopted the rules of Hamilton (2000):
1. Defence, public order and safety (justice), environmental protection, and socialsecurity (social services): We assumed that 25 percent of spending in these categories(Alberta has no defence spending) contribute to advancing well-being rather than offsetincreasing insecurity. Many of these expenditures would not have been made if societywere peaceful, law-abiding and socially-just, and the economy provided full employmentand an adequate living wage.
2. Housing and community amenities: These expenditures are not included because theyhave already been included as part of the estimates of the Value of Services from PublicInfrastructure (see GPI report on Public Infrastructure).

The Alberta GPI Accounts: Economy, GDP, and Trade
The Pembina Institute, page 17
3. Transport and communication: Fifty percent of spending on transport andcommunications is included as consumption in the GPI accounts as positive additions towell-being. This may create some double counting given that the estimates of the value ofpublic infrastructure (including the value of services from roads and highways) arealready counted.
4. Public education: Because public education spending is an investment in humanintellectual capital, all of these expenditures are excluded from the GPI IncomeStatement. In principle, we should not simply count the expenditures but rather the valueof services received from the stock of human intellectual capital that has been developedthrough public education spending.
5. Public health: While it is difficult to distinguish between health expenditures that aredefensive rather than non-defensive, like Hamilton (2000), we assume that 50 percent ofhealth expenditures are defensive in nature (excluded from GPI) and 50 percentcontribute to genuine improved well-being.
6. Recreation and culture: These are considered fully consumptive, non-defensiveexpenditures and included in their entirety in the GPI Income Statement.
7. General government services: These include all other government expenditurecategories including expenditures on tax collection (Treasury), policy advice and otherservices essential for government operations. We assume that 50 percent of generalgovernment services make a positive contribution to welfare rather than mitigatingagainst declining conditions, and are thus added to the GPI).
8. Debt Charges: Debt repayment expenditures are excluded from the GPI IncomeStatement assuming that they are defensive or regrettable in nature, and perhaps a resultof fiscal imprudence.

The Alberta GPI Accounts: Economy, GDP, and Trade
The Pembina Institute, page 18
8.3 Government Expenditures in the Alberta GPIApplying the Australian GPI rules to Alberta government spending in 1999-2000, we canestimate how much of public consumption expenditures contribute to genuine improvements inwelfare and well-being and which are defensive in nature.
Table 2 illustrates Alberta Government expenditures for 1999-2000, based on the AlbertaGovernment’s Budget 2000. :
Table 2: Alberta Government Expenditures that would be included in the GPIIncome Statement, 1999-2000 Expenditures
Based on the Alberta Government expenditures for 1999-2000, roughly 45.6 percent ($7,380-million of a total expenditure of $16,184-million) would be included in the GPI IncomeStatement as positive, non-defensive government consumption spending that contributes toimproved welfare of Albertans. The rest of the expenditures of $8,804-million would beconsidered either defensive or regrettable expenditures, or investments in human, social, andnatural capital that should be excluded from the GPI Income Statement.
Given the absence of resources to complete a longitudinal analysis of Alberta Governmentexpenditures using the 1999-2000 expenditure categories and the Hamilton (2000) guidelines, we
Alberta Government Expenditures 1999-2000Budget 2000, $ millions
Expenditures
Amount included in GPI Income Statement
GPI Accounting
Rule$ millions $ millions
Health and Wellness 5,166 2,583 50%Learning (Education) 4,078 2,039 50%Infrastructure 1,306 653 50%Debt servicing costs 1,090 - 0%Human Resources & Employment 988 494 50%Treasury 662 331 50%Agriculture, Food and Rural Development 556 278 50%Children's Services 468 117 25%Justice 406 102 25%Community Development (culture) 348 348 100%Environment 317 79 25%Gaming 179 - 0Innovation and Science 163 163 100%Resource development 140 35 25%Municipal Affairs 132 66 50%Economic Development 51 25.5 50%Government Services 46 23 50%Legislative Assembly 41 20.5 50%International and Intergovernmental Relations 34 17 50%Executive Council 13 6.5 50%
Totals 16,184 7,380 45.6%
Source: Alberta Government, Budget 2000

The Alberta GPI Accounts: Economy, GDP, and Trade
The Pembina Institute, page 19
were unable to calculate the full benefits of public consumption expenditures by the AlbertaGovernment in the GPI accounts. However, our estimates based on 1999-2000 governmentexpenditures suggest that the total GPI net sustainable income figure for 1999 would be adjustedupwards by roughly $7,390-million or $2,489 per capita
In future GPI accounting work we would ideally wish to construct an analysis of non-defensiveexpenditure dating back to 1961. This would require considerable and careful work.
While this is an arbitrary exercise and short list, it illustrates the potential application of GPIaccounting in terms of considering the benefits to well-being that arise from public consumptionexpenditures.
8.4 Government Spending and GDPGovernment spending on goods, services and fixed capital formation all contribute to the GDPand economic growth. The Alberta economic accounts provide data on total government (alllevels of government in Alberta) net current expenditures on goods and services and ongovernment net fixed capital formation. The GPI accounts consider the trends in both currentexpenditures on goods and services and on fixed capital formation. Government expenditures ongoods and services are far greater than spending on fixed capital, representing roughly 89 percentof total government expenditures. Government spending on fixed capital formation is lessimportant to GDP, contributing $1,862-million (1998$) in 1999, or 1.7 percent of GDP.
Historically government spending on net current expenditures on goods and services hascontributed significantly to Alberta’s GDP, ranging from 15.8 percent of GDP in 1999 (the lowestrate in 40 years) to 24.6 percent in 1986. In 1999, total government spending totaled $17,318-million (1998$), or 15.8 percent of Alberta’s GDP. Real per capita net government expendituresin 1999 was $5,957 per capita (1998$), a decrease from 1998 levels of $6,109 per capita (1998$).The maximum level of total government expenditures was $7,409 per capita in 1989.
Figure 3 shows the trend in government spending (1998$) by all governments. Total spendingincreased in real and per capita terms steadily from $4,380-million ($3,379 per capita, 1998$) in1961 to a peak of $18,859-million in 1992 ($7,274 per capita, 1998$). The highest rate of percapita government spending was in 1989 at $7,409 per capita (1998$). However, since 1992government expenditures have declined in total dollars and in percentage of GDP. As apercentage of Alberta’s GDP, government spending has declined to an all-time low of 15.8percent; in 1961, government spending was 20.0 percent of GDP and reached a high of 24.6percent in 1986.

The Alberta GPI Accounts: Economy, GDP, and Trade
The Pembina Institute, page 20
Figure 3: Government Expenditures on Goods, Services and Capital Formation inAlberta’s GDP Accounts and Percent Contribution to Alberta’s GDP, 1961 to 1999
8.4.1 Alberta Government SpendingTurning specifically to expenditures drawn from Alberta Government budget documents,between 1983 and 1999,10 real per capita spending has been declining since 1992, includinggovernment budget forecasts to 2002-2003. Figure 4 shows the trends in total real (1998$)government spending per Albertan, while figure 5 shows spending on health, basic and advancededucation, and all other program expenditures on a per capita basis (1998$). Total Albertagovernment spending increased from $5,350 per Albertan (1998$) in 1983 to a peak of $6,490 in1992. By 1999, Alberta government spending had fallen 19.2 percent from its 1992 high to$5,245. By 2002, the Alberta Government forecasts that its spending will decline even further to$4,582 per capita, representing a significant 29.4 percent decrease in real per capita spending.
-
2,000
4,000
6,000
8,000
10,000
12,000
14,000
16,000
18,000
20,000
1961 1966 1971 1976 1981 1986 1991 1996
Alb
erta
Gov
ernm
ent C
urre
nt a
nd C
apita
l Exp
endi
ture
s (1
998$
)
0.0%
5.0%
10.0%
15.0%
20.0%
25.0%
30.0%
Gov
ernm
ent E
xpen
ditu
res
as %
of A
lber
ta G
DP
Total Government Expenditures% of Alberta GDP
Source: Alberta Public Accounts, 1999, Alberta Treasury, 1971-1999

The Alberta GPI Accounts: Economy, GDP, and Trade
The Pembina Institute, page 21
Figure 4: Alberta Government Spending (1998$) per capita, 1983 to 1999(2000-2002 forecast)
Figure 5 clearly shows that other Alberta government portfolios (including environment, justice,transportation and utilizes and other ministries) suffered the greatest reductions in real spendingper capita.
Figure 5: Total Alberta Government Spending per Albertan, 1998 dollars, 1983 to2001 (Forecast)
-
1,000
2,000
3,000
4,000
5,000
6,000
7,000
1983 1985 1987 1989 1991 1993 1995 1997 1999 2001
tota
l Alb
erta
Gov
ernm
ent S
pend
ing,
199
8 do
llars
per
Alb
erta
n
Source: Alberta Government, Budget 2000, p. 61, Historical Consolidated Fiscal Summary
-
500.00
1,000.00
1,500.00
2,000.00
2,500.00
3,000.00
3,500.00
1983 1985 1987 1989 1991 1993 1995 1997 1999 2001
Albe
rta G
over
nmen
t Pro
gram
Spe
ndin
g 19
98 d
olla
rs p
er c
apita Health
Basic and advanced educationSocial ServicesOther program expensesDebt servicing costs

The Alberta GPI Accounts: Economy, GDP, and Trade
The Pembina Institute, page 22
Real spending on health care rose from $1,250 per Albertan in 1983, peaking at $1,735 perAlbertan in 1992 and falling to $1,694 in 1999. The Alberta Government’s 2000 Budget forecastsreal per capita health care spending to decrease slightly to $1,627, a reduction of 6.2 percent fromthe high in 1992.
Education spending on basic and advanced education increased from $1,206 per Albertan in 1983to a maximum of $1,608 in 1993. By 1999, spending had fallen 8.9 percent from the 1993 high to$1,495 per Albertan. Forecasts to 2002 suggest that education spending per capita in real dollarswill fall to $1,426, a decline of 11.3 percent from the 1993 high.
Spending on social services increased from $452 per capita (1998$) in 1983 to a peak of $757 in1992, then falling to $537 in 1999, for a 29.1 percent decrease from 1992. By 2002, socialservices expenditures per capita are forecast to reach a low of $507, for a 33.1 percent reductionfrom 1992 levels.
The greatest reduction in government spending has been in other government ministries (such asenvironment, agriculture and food, justice, transportation and utilities and others). Whilespending rose from $2,441 per capita (1998$) in 1983 to a high of $2,940 in 1985, by 1999,spending in this category had declined 48.3 percent to $1,519 per capita (1998$) and is forecast todecline even further to $1,108 per capita by 2002 representing a 62.3 percent drop since 1985.
The good news is that debt servicing costs have continued to decline with debt reduction effortsof the Alberta Government, falling from a high of $670 per capital (1998$) in 1994 to $333 percapita in 1999. By 2002, debt servicing costs are expected to reach $255 per capita for a 62percent decrease from 1994. While this trend should be celebrated, debt servicing costs are stillhigher than the low of $78 per capita in 1983.

The Alberta GPI Accounts: Economy, GDP, and Trade
The Pembina Institute, page 23
9 Business SpendingThe GDP and economic accounts include spending or investment by businesses on fixed capitalformation. As a rule, spending by business is not considered to contribute to the economic well-being of households. Most of the economic benefits attributed to business activities are alreadycaptured in personal consumption expenditures by individuals and households. Thus we must becareful to avoid double counting and double attribution of expenditures to economic welfare.
The Australian GPI deducts for the value of advertising by business as a contribution to genuinewell-being (see www.gpionline.net). While acknowledging the importance of information andproduct awareness, 50 percent of advertising expenditures are deducted as an allowance for thecost of increased prices caused by advertising that provides no meaningful information and maydo harm through disinformation or visual noise.
A lack of data precludes an adjustment of advertising expenditures in the Alberta GPI. Althoughno portion of business spending is considered in the GPI Income Statement, this may be open fordebate, as some investments (such as those for research and development) should be consideredas potential contributions to overall societal well-being.
Spending on fixed capital by Alberta business far exceeds the contribution by all governmentspending and is second in importance to only exports (53.3 percent of 1999 GDP) and personalconsumption expenditures (48.2 percent of 1999 GDP). In addition, spending on inventories bybusiness are contributions by industry to GDP. These fluctuate from negative to positive figuresdepending on the year, and in 1999 such spending contributed $790-million or 0.7 percent to1999 GDP.
In 1999, business investment in fixed capital totaled $28,554-million (1998$), an increase of 378percent over 1961 at $5,975-million (1998$). The real rate of increase in fixed capital investmentaveraged 8.3 percent from 1961 to 1999. Fixed capital investment represented 26.0 percent ofAlberta’s GDP in 1999 and varied from 17.9 percent of GDP in 1984 to 32.7 percent in 1981.Figure 6 shows the trend in business fixed capital investment.
Figure 6: Alberta Business Expenditures on Fixed Capital versus GDP, 1998$
0
20000
40000
60000
80000
100000
120000
1960 1965 1970 1975 1980 1985 1990 1995
1998
$ m
illio
ns
Total GDP(Expenditure Based) at Market Prices
Gross Fixed Capital Formation Business
Alberta Economic Accounts 1999

The Alberta GPI Accounts: Economy, GDP, and Trade
The Pembina Institute, page 24
millions, 1961 to 1999

The Alberta GPI Accounts: Economy, GDP, and Trade
The Pembina Institute, page 25
10 Trade – Exports and ImportsAlberta’s economic prosperity is highly dependent on the trade of capital assets, primarily theexport of natural capital – oil, gas, coal, timber, and agricultural products. In 1999, over 53percent of the value of Alberta’s GDP resulted from exports of all forms of capital; this wasbalanced by imports, which as a negative deduction in GDP calculations, made up almost 45percent of Alberta’s 1999 GDP value.
The Alberta economy would not be as prosperous had it not been for the endowment of naturalcapital stocks, in particular non-renewable fossil fuel resources, most of which is exported toCanadian, U.S. and other international markets for financial returns. Natural capital has been thefoundation for the growth in Alberta’s economy over the past 40 or more years, with a smallercontribution from the value of produced capital as well as increasing exports of intellectual orknowledge capital. However, Alberta remains highly dependent on natural capital exports. Thus,a clear understanding of the condition of natural capital and the environment (which providesnatural resources and environmental services) is critical to determining whether or not Albertacan continue to benefit from natural capital exports.
To achieve long-term sustainable well-being, we must balance the domestic needs for natural,human, social and produced capital with the economic paradigm of exporting a portion ofdomestic capital stocks for short- to medium-term monetary gains. In most cases, Alberta’snatural capital (petroleum products, agricultural products, forest products) far exceeds its currentdomestic requirements. Nevertheless, sustainability and stewardship of wealth for current andfuture generations requires that we ask some fundamental questions:
a) How much of our capital, over and above that required to meet our current basic needs,demands or wants, are we willing to export for monetary gains?
b) How much of our natural capital should we be setting aside, reserve or save for futuregenerations?
c) Are there thresholds to the export of natural capital stocks where we acknowledge thatexporting any more could lead to the erosion of ecological integrity, the depletion ofnatural capital, and the erosion of human and social capital?
d) What environmental and social costs are Albertans willing to accept for the short-andmedium-term financial benefits of exporting of our surplus wealth to other markets andcommunities?
The GPI accounts can help answer these questions with evidence of the stocks, flows andexport/imports of all forms of capital.
The monetary value of exports to the Alberta economy represented 53.3 percent of Alberta’sGDP in 1999. Exports have been as high as 59.8 percent of the GDP in 1974 and as low as 45.0percent of GDP in 1969 (see Figure 7). In 1961, the value of exports totaled $9,673-million (in1998$), growing to $58,510-million (in 1998$) in 1999, an increase of 463 percent. In the 1990s,the value of exports grew 60 percent (to 1999). Most exports are in the form of natural capital(oil, gas, coal, agricultural products, and forest products), and trade in services (human capital)contributes the most to our economic growth
Exports are offset by imports, however, as the value of imports in 1999 represented -44.6 percentof Alberta’s GDP.

The Alberta GPI Accounts: Economy, GDP, and Trade
The Pembina Institute, page 26
Figure 7: Alberta’s Exports versus Imports, 1998 dollars, 1961 to 1999
The balance of trade (export value minus import value) improved from an all-time low, negativetrade balance of - $3,048-million (1998$) in 1969 to an all-time high trade surplus of $14,463-million (1998$) in 1996. In 1999, Alberta’s trade surplus was $10,041-million (1998$).
Figure 7 also reveals an interesting trend: that imports have increased over time in almost perfectunison with exports. This balance of trade tells us something about our capacity as a people andsociety to achieve sustainability and self-sufficiency at a personal, household and societal level.The graph shows that the more of our natural resources and human capital we export, the morewe spend on imports. The question is how sustainable and at what risk is our economy with thisheavy reliance on exports of natural capital stocks? How sustainable are the natural resources thatfuel exports? How much of our natural capital “comparative advantage” should we be exportingbeyond a level of self-sufficiency that meets current and future generational needs for naturalresources? These are complex issues but important in a discussion of sustainability and well-being.
The importance of oil and gas exports and refined petroleum products is apparent whencomparing Alberta’s balance of trade with the value of petroleum shipments (Figure 8). Much ofthis export value comes from oil and gas exports to the U.S. and the rest of Canada, which havegrown 612 percent since 1962 to $20,454-million in sales in 1998.11
Figure 8: Alberta’s Balance of Trade (Exports less Imports versus Oil and GasSales, 1998$), 1961 to 1999
(60,000)
(40,000)
(20,000)
-
20,000
40,000
60,000
80,000
1961 1966 1971 1976 1981 1986 1991 1996
Source: Alberta Economic Accounts 1999
Exports
Imports

The Alberta GPI Accounts: Economy, GDP, and Trade
The Pembina Institute, page 27
Despite diversification of the economy, minerals (oil, gas, coal, and petroleum products) stillmake up the lion’s share of Alberta’s exports (see Figure 9). In 1999, mineral exports comprised39.6 percent of the value of total exports (current dollars) compared to 23.9 percent of exports in1961 and 40.0 percent of exports in 1971, the onset of Alberta’s oil and gas boom. At the peak ofoil and gas importance in 1983, mineral resources made up 60 percent of Alberta’s exports; thusit could be argued that we have become less reliant on mineral exports for trade. However, muchof the decline in the importance of oil and gas exports since 1983 is due to the 1985 collapse inoil prices. It took until 1999 for oil and gas prices to again rival the peaks in 1983 to 1984.
The most important mineral resource is natural gas, which in 1999 made up 20.1 percent ofAlberta’s export value; this was followed by oil, which made up 16.4 percent of exports(compared to 44.1 percent of 1974 exports). Manufactured exports as a percentage of totalexports have not changed much since 1961; in 1961, they made up 26.3 percent of exports and in1999, manufactured goods made up 31.1 percent of exports. Export of services has ironicallydeclined in relative importance since 1961, contributing 25.8 percent of exports in 1999compared with 29.8 percent in 1961.
(5,000)
-
5,000
10,000
15,000
20,000
25,000
30,000
1961 1966 1971 1976 1981 1986 1991 1996
1998
$ m
illio
ns
Trade BalanceValue of Oil and Gas Producer Sales
Source: Alberta Economic Accounts and Canadian Assoc. of Petroleum Producers, Statistical Handbook

The Alberta GPI Accounts: Economy, GDP, and Trade
The Pembina Institute, page 28
Figure 9: Alberta’s Exports, Percentage of Total Exports Contribution by EachIndustry or Commodity Group, 1961 to 1999.
11 Economic Diversification and Resource DependenceAlberta’s economy has long depended on primary, natural capital-intensive industries –agriculture, oil and gas, coal, and the forestry industry. Was Alberta’s economy more diversifiedin 1999 than it was in the early 1970s before the oil boom? Are we less or more dependent onnatural capital as the basis of economic prosperity?
Diversification of the province’s economy does not necessarily have positive implications for thewell-being of citizens. However, an economy with a more diverse base is healthier, more resilientand thus more sustainable than one that depends on a single sector or cluster of sectors.
Economic diversity can be measured by the relative distribution of the value to GDP of varioussectors in the economy. We developed an Economic Diversification Index for Alberta based onthe work by economist Frank Hachman (1971) , Bureau of Business and Economic Research,University of Utah, Salt Lake City (December 8, 1994). The Hachman Index measures howclosely the employment distribution of a state or region resembles that of a nation. The value ofthe index ranges from zero (where the two are least similar) to one (where the state’s industrialsectors, expressed in terms of labour, are most similar to that of the nation). Given the assumptionthat the nation’s economy is diversified, a larger value of the Hachman Index relative to thenation means that a subject region is more diversified (and therefore less specialized).
Our Economic Diversification Index is based on a concept similar to the Hachman Index exceptthat we compare the distribution of GDP by sector for Alberta with that of the nation.12 Weconstruct the Diversification Index by comparing the percentage share of GDP of each sector inthe Alberta economy (based on provincial economic account statistics) with the percentage share
0.0%
10.0%
20.0%
30.0%
40.0%
50.0%
60.0%
70.0%
1961 1966 1971 1976 1981 1986 1991 1996
Animals Grains Minerals Manufacturing Services (2)
Source: Alberta Economic Accounts 1999, Table 16
The Alberta GPI Accounts: Economy, GDP, and Trade
The Pembina Institute, page 29
of GDP by the same sectors in the Canadian economy. We assume that the national distributionor share of GDP by industry or sector represents the optimum diversification of the economy.
The Hachman Index can then be converted to an index between 0 and 100 for purposes ofcreating the GPI indicator accounts and composite GPI indices. We assumed that the benchmarkfor economic diversity would have Alberta’s economy match the diversity of the overallCanadian economy and distribution of GDP by sector. For example, the share of GDP bymanufacturing industries in 1999 in Alberta is 11.2 percent of Alberta’s GDP and 18.1 percent ofCanada’s GDP making the index of diversification for the manufacturing sector the ratio of 11.2percent / 18.1 percent = 0.62. A ratio of 1.00 suggests a provincial economy as diverse as thenation’s; a ratio less than 1.00 suggests an economy less dependent on that sector; an indexgreater than 1.0 suggests an economy more dependent on that sector than the national average.We then calculate an index for each of the sectors reported in the Alberta and national economicaccounts, and sum all the indices, equally weighted, to yield a composite EconomicDiversification Index (EDI). This index requires more development and refinement.
Our examination of Alberta’s diversification began with 1971, an important benchmark year inAlberta’s history just before the 1973 OPEC oil crisis that ushered in Alberta’s petroleum boom.The results of our EDI calculations reveal an interesting trend (see Figure 10). In 1971, theAlberta economy was more diversified, relative to the Canadian economy than at any time since.The EDI was 0.59 in 1971 then fell to a low of 0.07 in the mid-1980s. In the 1990s, the EDI rose,reaching 0.34 in 1995 but falling again in 1999 to 0.23 as the oil and gas sector began topredominate once more.
The EDI reflects the economic cycles in Alberta’s economy. Even in the 1990s, while theeconomy has diversified into other intellectual-capital-intensive sectors, the economy remainsdependent on natural capital, drawing heavily from non-renewable natural resources such as oil,natural gas, and coal and the many secondary industries that service this primary industry.

The Alberta GPI Accounts: Economy, GDP, and Trade
The Pembina Institute, page 30
Figure 10: Alberta Economic Diversification Index (EDI) 1971 to 1999
The predominance of Alberta’s petroleum economy is shown most dramatically in Figure 11. Theratio of the percentage share of GDP by sectors in the Alberta economy is compared with thepercentage share of GDP for the same sectors in the Canadian economy. This figure shows justhow dominant the oil and gas sector is in Alberta’s economy relative to the national economy.
Figure 11: Ratios of Percent of GDP by Sector of Alberta and Canada, 1971 to 1999Another way of assessing diversification of the economy is to examine the relative distribution of
-
5.00
10.00
15.00
20.00
25.00
1971 1973
1975 1977
1979 1981
1983 1985
1987 1989
1991 1993
1995 1997
1999
Agriculture
Fishing & Trapping
Forestry (Logging)
Mining, Petroluem, Natural Gas
Manufacturing
Construction
Transporation, Communication, Utlities
Wholesale Trade
Retail Trade
Finance and Insurance
Real Estate Operators & Insurance Agents
Business Services
Government Services
Educational Services
Health and Social Services
Accommodation, Food & BeverageServices Other Services
Economic Diversification Index
-
0.10
0.20
0.30
0.40
0.50
0.60
0.70
1971 1976 1981 1986 1991 1996
Eco
nom
ic D
iver
sific
atio
n In
dex
(ED
I) w
here
1.0
0 is
opt
imum
div
ersi
ficat
ion

The Alberta GPI Accounts: Economy, GDP, and Trade
The Pembina Institute, page 31
GDP by industry or sector over time. Table 2 shows the change in the relative contribution ofeach sector or industry to Alberta’s GDP comparing 1971, 1981, 1991 and 1999.
Table 3: Percentage Contribution to Alberta’s GDP by Sector or IndustrySector 1971 1981 1991 1999Petroleum, Refining and Mining 19.6% 32.1% 19.0% 20.4%
Public (education, health, social) and Government Services 16.8% 10.8% 16.4% 12.1%
Finance, Insurance, Real Estate and Business Services, and Other Services 15.3% 16.0% 24.0% 25.9%
Construction 10.2% 12.6% 6.9% 7.0%
Transportation, Storage and Communication 10.1% 6.9% 7.4% 8.1%
Agriculture, Food, Beverage, Fishing 7.3% 5.0% 4.1% 3.6%
Manufacturing 4.2% 4.1% 4.9% 6.7%
Utilities 3.0% 2.3% 3.3% 2.1%
Accommodation, Food and Beverage Services 2.4% 2.1% 2.6% 2.4%
Forestry and Mining 1.1% 0.9% 1.1% 1.9%
Source: Alberta Economic Accounts 1999, Alberta Treasury
This chart can also be expressed graphically (Figure 12) showing the contribution of each sectorto Alberta’s GDP. One could argue that Alberta’s economy was most diverse in 1971 when noone sector dominated (that is, exceeded 20 percent of GDP).
Figure 12: Percent Contribution to Alberta’s GDP by Sector, 1971, 1981, 1991, 1999
0.0%
5.0%
10.0%
15.0%
20.0%
25.0%
30.0%
35.0%
1971 1981 1991 1999
Petroleum, Refining & Mining
Public (education, health, social) andGovernment ServicesFinance, Insurance, Real Estate andBusiness Services, and Other Services Construction
Transportation, Storage &CommunicationAgriculture,Food, Beverage, Fishing
Manufacturing
Utilities
Accommodation, Food & BeverageServicesForestry & Mining
Source: Alberta Economic Acounts, 1999

The Alberta GPI Accounts: Economy, GDP, and Trade
The Pembina Institute, page 32
Figure 13 shows a dramatic change over time in Alberta’s economy since 1971. In 1971,Alberta’s economy was relatively diverse with no single industry sector dominating the GDP. Thepetroleum, mining and petroleum refining industries contributed $6,543-million (1998$) or 19.6percent of Alberta’s economy, followed by the public sector (government, health, education,social services) at $5,608-million (16.8 percent of GDP), and financial, insurance and otherbusiness services at $5,106-million (15.3 percent of GDP). By 1984, the petroleum sectordominated Alberta’s economy at $25,415-million (1998$) or 37.6 percent of GDP, but by 1999the petroleum sector had declined to 20.4 percent of GDP, or $21,878-million, exceeded by thefinancial, insurance and other business services sector..
Figure 13: Economic Diversification: Alberta’s GDP by Industry, 1998 dollars,1961-1999
The sector comprising financial services, real estate and other business services has shown themost dramatic increase in contribution to Alberta’s GDP, rising from $5,106-million (1998$), or15.3 percent of GDP, to the dominant position in Alberta’s economy in 1999 at $27,890-million(1998$), or 25.9 percent of GDP. The manufacturing sector (excluding petroleum refining, foodand beverage, and wood and pulp and allied industries, which are included with respectiveindustry clusters) is also important to diversification, but it has increased only marginally inimportance from 6.2 percent of GDP in 1971 to 8.2 percent in 1999.
In 1999, the most important sectors in Alberta’s economy (expressed in 1998$) were:
1. Financial Services, Real Estate and Other Business services ($27,890-million, or 25.9percent of GDP);
2. Petroleum Industries ($21,878-million, or 20.4 percent of GDP);3. Public Sector (Health, Education, Social Services) and Government Services ($13,016-
-
5,000
10,000
15,000
20,000
25,000
30,000
1971 1976 1981 1986 1991 1996
$ 19
98 m
illio
ns
Agriculture,Food, Beverage, Fishing
Forest Industries
Petroleum, Refining & Mining
Manufacturing
Construction
Transportation, Storage &Communication
Utilities
Retail and Wholesale Trade
Accommodation, Food & BeverageServices
Finance, Insurance, Real Estate andBusiness Services, and Other Services
Public (education, health, social) andGovernment Services
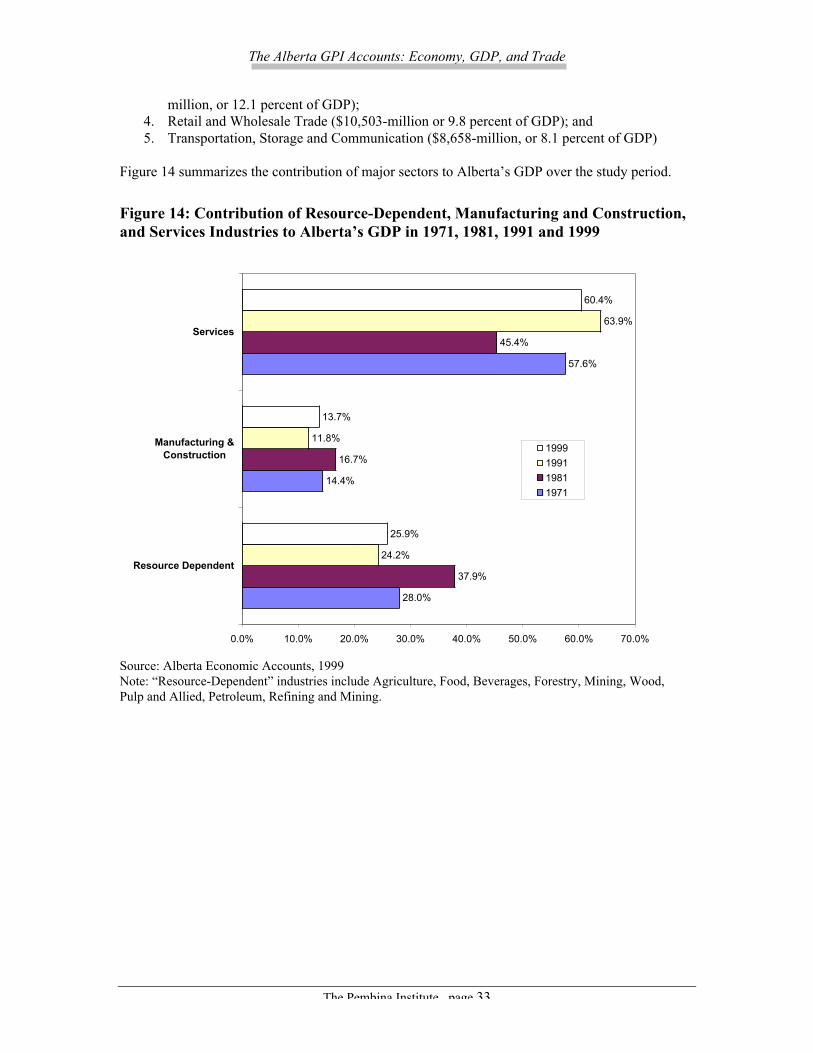
The Alberta GPI Accounts: Economy, GDP, and Trade
The Pembina Institute, page 33
million, or 12.1 percent of GDP);4. Retail and Wholesale Trade ($10,503-million or 9.8 percent of GDP); and5. Transportation, Storage and Communication ($8,658-million, or 8.1 percent of GDP)
Figure 14 summarizes the contribution of major sectors to Alberta’s GDP over the study period.
Figure 14: Contribution of Resource-Dependent, Manufacturing and Construction,and Services Industries to Alberta’s GDP in 1971, 1981, 1991 and 1999
Source: Alberta Economic Accounts, 1999Note: “Resource-Dependent” industries include Agriculture, Food, Beverages, Forestry, Mining, Wood,Pulp and Allied, Petroleum, Refining and Mining.
28.0%
14.4%
57.6%
37.9%
16.7%
45.4%
24.2%
11.8%
63.9%
25.9%
13.7%
60.4%
0.0% 10.0% 20.0% 30.0% 40.0% 50.0% 60.0% 70.0%
Resource Dependent
Manufacturing &Construction
Services
1999 1991 1981 1971

The Alberta GPI Accounts: Economy, GDP, and Trade
The Pembina Institute, page 34
12 More Growth? Of What?Simon Küznets challenged us to continually ask that calls for “more economic growth define ofwhat and for what.” When we examine the Alberta evidence over the past 40 years, the sectorsshowing the most growth since 1971 include the financial services (banking, investment),insurance and real estate sector, forest industries, manufacturing and petroleum refining (seeTable 4).
Table 4: Sector Growth (percentage) since 1971Growth in Sectors% growth 1971 to 1999 (constant 1998$)
Finance, Insurance, Real Estate and Business Services 446%Forest Industries 445%Manufacturing 421%Petroleum, Refining and Mining 234%Accommodation, Food and Beverage Services 224%Retail and Wholesale Trade 215%Transportation, Storage and Communication 157%Public (education, health, social) and Government Services 132%Utilities 131%Construction 121%Agriculture, Food, Beverage, Fishing 59%
Source: Alberta Economic Accounts 1999
As Figure 14 has shown, Alberta’s economy was only slightly less dependent on resource-basedindustries in 1999 (25.9 percent of GDP) than it was in 1971 (28.0 percent of GDP). Theimportance of the service and knowledge-based economy has grown only marginally inimportance from 57.6 percent of the GDP in 1971 to 60.4 percent in 1999.
13 So What?Is Alberta’s economy healthier and more diverse than in 1971? Are we on the verge of a new eraof economic prosperity? That depends on your perspective. One could argue that Alberta’seconomy was no more diverse in 1999 than in 1971 and was at least as dependent on naturalcapital consumption. This may come to a surprise to those who focus only on the improvement ineconomic diversity since the petroleum industry boom in 1984/85 when oil prices were thehighest in history. While the increasing contribution of service industries to Alberta’s economy isa welcome sign of increasing economic diversity and health, it is also clear that Alberta’sprosperity remains reliant on natural capital extraction (oil, gas, coal, agriculture, timber). Exactlyhow dependent the service industries are on resource-based sectors is difficult to determine. Wecould examine the multiplier impact of each dollar of resource-dependent GDP on serviceindustries. This could range anywhere from 1.0 to 2.0 times resource-dependent GDP. Themanufacturing sector, a key contributor to economic diversification, has shown a healthy 421percent increase in growth since 1971 even though it still makes up a relatively small proportionof Alberta’s economy at 6.7 percent of GDP. While the desired future is a knowledge-basedeconomy it appears that at least in the foreseeable future Alberta’s economy will continue todepend on oil, gas, agriculture and timber, and thus we must be concerned with the sustainabilityand health of natural capital.

The Alberta GPI Accounts: Economy, GDP, and Trade
The Pembina Institute, page 35
References
Alberta Government. 2000. Alberta Economic Accounts for 1999. Alberta Treasury, November2000.
Alberta Government. 2000. Budget 2000. Edmonton.
Bartelmus, Peter. 1990. Environmentally Sound Sustainable Development: A ConceptualFramework, United Nations Statistical Office working paper.
Canadian Association of Petroleum Producers. “Statistical Handbook” for 1998.
Daly, H. 1996. Beyond Economic Growth: The Economics of Sustainable Development. BeaconPress. Boston.
Daly, H. and J. B. Cobb. 1994. For the Common Good: redirecting the economy towardcommunity, the environment, and a sustainable future, 2nd edition. Beacon Press, Boston. (firstedition published in 1989)Cobb, Jr. John and Herman Daly. 1994. For the Common Good.
Cobb, C. and Cobb, J. 1994. The Green National Product: A Proposed Index of SustainableEconomic Welfare (University of Americas Press: Maryland).
Hachman, F. 1971. “Diversification and the Utah Economy,” excerpt from the 1995 UtahEconomic Report to the Governor, pages 207-213
Hamilton, C. 1997. An Australian Index of Sustainable Economic Welfare. Paper presented forthe Measuring National Progress Conference, Academy of Science, Canberra, July 4, 1997.
Hamilton, C. 2000. The Australian GPI. The Australia Institute (available online atwww.gpionline.net)
Hamilton, C. and R. Denniss. 2000. Tracking Well-being in Australia, The Genuine ProgressIndicator 2000. The Australia Institute. Number 35. December 2000.
Hicks, J.R. 1946. Value and Capital, 2nd ed., Oxford University Press. Oxford
Kennedy, Robert. “Recapturing America’s moral vision,” March 18, 1968 in RFK: CollectedSpeeches, Viking Press, 1993.
Küznets, Simon. 1965. “Towards a Theory of Economic Growth,” Economic Growth andStructure (New York, W.W. Norton & Co., 1965.
William D. Nordhaus & James Tobin, 1971. "Is Growth Obsolete?," Cowles FoundationDiscussion Papers 319, Cowles Foundation, Yale University
Statistics Canada. 1997. Econnections: Linking the Environment and the Economy; Concepts,Sources and Methods of the Canadian System of Environmental and Resource Accounts. NationalAccounts and Environment Division, System of National Accounts, Statistics Canada, Cat. No.16-505-GPE.

The Alberta GPI Accounts: Economy, GDP, and Trade
The Pembina Institute, page 36
MISSING:
Tobin and Nordhaus (or Nordhaus and Tobin??)Cobb and CobbHamilton

The Alberta GPI Accounts: Economy, GDP, and Trade
The Pembina Institute, page 37
Appendix A. List of Alberta GPI Background ReportsA series of Alberta GPI background reports accompanies the Alberta Sustainability Trends 2000report and this report. These documents are being released in late 2001 and early 2002 and will beavailable on the Pembina Institute’s website at www.pembina.org.
Alberta GPI Background Reports and Sustainability Indicators
GPI Background Reports GPI Accounts Covered by Report
1. Economy, GDP, and Trade • Economic growth (GDP)• Economic diversity• Trade
2. Personal Consumption Expenditures,Disposable Income and Savings
• Disposable income• Personal expenditures• Taxes• Savings rate
3. Money, Debt, Assets and Net Worth • Household debt4. Income Inequality, Poverty and Living Wages • Income distribution
• Poverty5. Household and Public Infrastructure • Public infrastructure
• Household infrastructure6. Employment • Weekly wage rate
• Unemployment• Underemployment
7. Transportation • Transportation expenditures8. Time Use • Paid work time
• Household work• Parenting and eldercare• Free time• Volunteerism• Commuting time
9. Human Health and Wellness • Life expectancy• Premature mortality• Infant mortality• Obesity
10. Suicide • Suicide11. Substance Abuse; Alcohol, Drugs andTobacco
• Drug use (youth)
12. Auto Crashes and Injuries • Auto crashes13. Family Breakdown • Divorce14. Crime • Crime15. Gambling • Problem gambling16. Democracy • Voter participation17. Intellectual Capital and EducationalAttainment
• Educational attainment
18. Energy (Oil, Gas, Coal and Renewable) • Oil and gas reserve life• Oilsands reserve life
19. Agriculture • Agricultural sustainability20. Forests • Timber sustainability
• Forest fragmentation21. Parks and Wilderness • Parks and wilderness22. Fish and Wildlife • Fish and wildlife23. Wetlands and Peatlands • Wetlands

The Alberta GPI Accounts: Economy, GDP, and Trade
The Pembina Institute, page 38
GPI Background Reports GPI Accounts Covered by Report
• Peatlands24. Water Resource and Quality • Water quality25. Energy Use Intensity, Greenhouse GasEmissions and Air Quality
• Energy use intensity• Air quality-related emissions• Greenhouse gas emissions
26. Carbon Budget • Carbon budget deficit27. Municipal and Hazardous Waste • Hazardous waste
• Landfill waste28. Ecological Footprint • Ecological footprint

The Alberta GPI Accounts: Economy, GDP, and Trade
The Pembina Institute, page 39
Appendix B: GDP, Trade Balance and EconomicDiversification Index Data
Alberta Gross Domestic Product per capita, Trade Balance (Exports less Imports byvalue per capita), and Economic Diversification Index.
Economic Growth (GDP) Trade Balance (Export valueless import value)
Economic Diversification
GDP atmarketprices,expenditurebased (1998$per capita)
GDP Indexwhere maximum(1999=$37,005)= best(100 points)
TradeBalance1998$ percapita
Trade Balanceindex is wheremaximum (1996=$5,284) is bestbenchmark (100points)
EconomicDiversificationIndex, based onHachman Index,closer to onemeans closer toNational average.
EconomicDiversification Index,where 100 is setequal to the level ofdiversification inCanada
1961 16,395 44.31 (393.32) (7.44)1962 16,806 45.42 (596.96) (11.30)1963 17,261 46.65 (205.60) (3.89)1964 17,712 47.86 (296.15) (5.60)1965 18,426 49.79 (560.62) (10.61)1966 19,553 52.84 (695.54) (13.16)1967 19,424 52.49 (1,036.96) (19.62)1968 19,604 52.98 (1,463.28) (27.69)1969 20,161 54.48 (1,951.09) (36.92)1970 20,835 56.30 (522.47) (9.89)1971 20,964 56.65 (60.31) (1.14) 0.59 100.01972 22,163 59.89 133.53 2.53 0.53 89.91973 23,841 64.43 943.00 17.85 0.45 75.21974 25,399 68.64 4,649.40 87.99 0.23 39.11975 25,135 67.92 3,604.91 68.22 0.17 28.51976 24,925 67.36 1,954.85 36.99 0.16 26.61977 25,436 68.74 2,002.94 37.91 0.13 21.81978 26,276 71.01 2,130.37 40.32 0.13 22.71979 28,358 76.63 3,172.72 60.04 0.12 21.01980 28,449 76.88 3,962.68 74.99 0.10 17.21981 29,642 80.10 2,993.59 56.65 0.09 15.51982 27,156 73.38 3,297.52 62.40 0.08 13.31983 25,656 69.33 4,096.34 77.52 0.07 11.41984 26,583 71.83 4,985.30 94.35 0.07 11.51985 27,307 73.79 4,844.74 91.69 0.07 11.71986 27,495 74.30 1,630.00 30.85 0.17 28.61987 28,492 77.00 1,911.67 36.18 0.17 29.11988 30,832 83.32 878.23 16.62 0.27 46.21989 30,345 82.00 900.99 17.05 0.27 46.21990 29,896 80.79 1,416.03 26.80 0.22 36.31991 29,802 80.54 1,472.98 27.88 0.34 56.81992 29,737 80.36 1,984.91 37.56 0.32 53.41993 32,038 86.58 2,441.20 46.20 0.29 48.81994 33,316 90.03 3,482.36 65.90 0.29 48.21995 34,118 92.20 4,169.71 78.91 0.34 58.01996 34,319 92.74 5,284.10 100.00 0.22 36.71997 36,478 98.58 3,900.53 73.82 0.22 37.81998 36,440 98.47 2,256.38 42.70 0.29 49.41999 37,005 100.00 3,219.35 60.93 0.23 38.5Source: Alberta Economic Accounts, 1999
Table 3 Gross Domestic Product,expenditure based (for 1971-1999),Other data is from special run ofhistorical economic accounts 1961-1999 based on Statistics Canada data.
Alberta Economic Accounts 1999.Table 3 Gross Domestic Productexpenditure based, for 1971-1999.Other data is from special run ofhistorical economic accounts 1961-1999 based on Statistics Canada data.
Derived by authors by comparing GDP by sectorof Alberta with GDP by sector for Canada

The Alberta GPI Accounts: Economy, GDP, and Trade
The Pembina Institute, page 40
Endnotes 1 Kennedy, Robert (1968). “Recapturing America’s Moral Vision,” March 18, 1968, in RFK: CollectedSpeeches, Viking Press, 1993.2 In The New Republic, October 20, 19623 Simon Küznets, “Towards a Theory of Economic Growth,” Economic Growth and Structure (New York,W.W. Norton & Co., 1965).4 Review of John Kenneth Galbraith’s address to the Frank M. Engle Lecture in Economic Security at theAmerican College in Bryn Mawr, Pennsylvania in May 1999, appeared in the August 2, 1999 issue of theIMF Survey.5 Statistics Canada. 1997. Econnections: Linking the Environment and the Economy. Concepts, Sourcesand Methods of the Canadian System of Environmental and Resource Accounts. National Accounts andEnvironment Division, System of National Accounts, Statistics Canada, Cat. No. 16-505-GPE., p. 10-11.6 World Bank. 1999. GNP per capita 1997, Atlas method. Downloaded fromwww.worldbank.org/data/databytopic/gnppc97.pdf7 Statistics Canada. 1999. Economic indicators and gross domestic product - Canada. Downloaded fromwww.statcan.ca8 U.S. figures are from Redefining Progress (www.rprogress.org), U.S. GPI 1999 results and from Anielski,Mark and Jonathan Rowe. 1999. The U.S. 1998 GPI (Genuine Progress Indicator) Update. RedefiningProgress, San Francisco. http://www.rprogress.org/pubs/gpi1999/gpi1999.html9 Cobb, Jr. John and Herman Daly. 1994. For the Common Good, p. 467.10 More detailed historical analysis the pre-dates 1983 could be conducted in future GPI accountinganalysis.11 Canadian Association of Petroleum Producers “Statistical Handbook” for 1998.12 The Hachman Index is based on comparing the share of employment by sector or industry of any givenstate to the national average. Hachman, a professor of economics, applied his methodology for comparingUtah’s economy and diversification with the U.S. national average. Source: “Diversification and the UtahEconomy,” an article excerpted from the 1995 Utah Economic Report to the Governor, pages 207-213.The index is calculated as the inverse of the difference between the share of a states employment (EMP) insector/industry j in year t less the share of U.S. employment in industry j in year t, all square and divided bythe share of sector j of Canada’s GDP in year t, as per the following formula: 1/DIVRt = _j ((EMPStatejt –EMP USjt)
2)/ USUSjt