Embed Size (px)
Citation preview
The Aid Effectiveness Agenda:
The benefits of going ahead
Final Report
September 2011
This Project is funded by the European Commission
Project implemented by …………………
Experts
Arne Lennart BIGSTEN
Jean Philippe PLATTEAU
Sven TENGSTAM
FRAMEWORK CONTRACT COMMISSION 2007 Lot Nr 4
Contract Nr 2010/256898
The Aid Effectiveness Agenda: The benefits of going ahead
Final Report - Contract nr. 2010/256898 Page 2 of 169
The contents of this publication are the sole responsibility of the
consultants and can in no way be taken to reflect the views of the
European Union
The Aid Effectiveness Agenda: The benefits of going ahead
Final Report - Contract nr. 2010/256898 Page 3 of 169
Table of Contents
Acknowledgements ............................................................................................................................. 5
List of Acronyms and abbreviations ................................................................................................... 6
Executive summary ............................................................................................................................. 8
1. Background and purpose .......................................................................................................... 14
2. Structure of the analysis........................................................................................................... 16
2.1. The tasks.............................................................................................................................. 17
2.2. Outline of the report.............................................................................................................. 18
3. Review of the aid effectiveness literature............................................................................... 20
3.1. The benefits of coordination .................................................................................................. 20
3.2. Aid, governance, and growth ................................................................................................. 26
4. Aid coordination: A conceptual framework ............................................................................. 32
4.1. A simple framework to analyze the effects of aid coordination ................................................. 32
4.2. Big and small countries.......................................................................................................... 36
4.3. Additional considerations: internalizing the cost-savings of the recipient countries and widening the coordination space ....................................................................................................................... 37
5. Studies of the effects of the Paris agenda............................................................................... 43
5.1. Earlier studies ....................................................................................................................... 43
5.2. Case study: Coordination of aid efforts in Mali ........................................................................ 50
5.3. Concluding remarks............................................................................................................... 52
6. Scope of the Paris agenda ........................................................................................................ 53
7. The transaction cost savings effects of coordinating EU aid.................................................. 61
7.1. Introduction.......................................................................................................................... 61
7.2. Earlier estimates of transaction cost savings ........................................................................... 61
7.3. Our approach........................................................................................................................ 64
7.4. Concluding remarks............................................................................................................... 70
8. The benefits of untying EU aid ................................................................................................. 75
9. The benefits of reducing the unpredictability and volatility of EU aid .................................. 86
9.1. Summary of the findings of the first study (and its methodology)................................................... 86
9.2. Evaluation of Kharas (2008) methodology and our estimations using an..................89_Toc305163272
9.3. Caveats on the methodology........................................................................................................ 95
10. Effects of the Paris agenda measures on the growth of recipients ................................. 116
10.1. Estimation strategy and variables......................................................................................... 116
10.2. Empirical estimates of the growth equation .......................................................................... 117
10.3. Impacts of PD measures...................................................................................................... 120
10.4. Estimation of potential effects of PD measures on growth...................................................... 120
10.5. Alternative estimation of potential effects on growth ............................................................. 122
The Aid Effectiveness Agenda: The benefits of going ahead
Final Report - Contract nr. 2010/256898 Page 4 of 169
10.6. Summing up ....................................................................................................................... 123
11. Effects of EU coordination of country allocation of aid .................................................... 127
11.1. Introduction........................................................................................................................ 127
11.2. Political constraints on coordination...................................................................................... 127
11.3. Relative agency efficiency.................................................................................................... 128
11.4. Gains from coordinating the country allocation of EU aid ....................................................... 130
11.5. Feasible reallocations?......................................................................................................... 136
12. Overall effect of an EU implementation of the Paris Declaration .................................... 138
13. In search of an optimal aid system for the EU .................................................................. 140
13.1. Introduction........................................................................................................................ 140
13.2. Implied policy changes ........................................................................................................ 140
13.3. The role of the Commission in EU aid coordination................................................................ 142
References ....................................................................................................................................... 144
Appendix A1: Mali case study......................................................................................................... 150
Conclusion ....................................................................................................................................... 166
Annexe 1: Positionnement des PTF................................................................................................ 168
Bibliographie ................................................................................................................................... 169
Liste des personnes interviewées .................................................................................................. 169
The Aid Effectiveness Agenda: The benefits of going ahead
Final Report - Contract nr. 2010/256898 Page 5 of 169
Acknowledgements
This study was undertaken at the initiative of the European Commission (Directorate General for Development and Cooperation – EuropeAid) and the Unit A3 (responsible for Coherence of EU Policies for Development and EU Aid Effectiveness) has been implementating the project. We have benefited greatly from the continued support and advice from our counterparts at DEVCO-A3, Sibylle Tepper, Cornelius Hacking, from Vincent Grimaud, Mehtab Currey, Alex Gerbrandij, and Marcus Theobald. We have also benefited from useful comments and suggestions from Nicoletta Merlo (DEVCO A1), Jonathan Beynon (DEVCO A2), Franco Conzato (DEVCO B1), Catherine Pravin (DEVCO B2), Stacey Vickers (DEVCO B4), and Maria Lamin (EEAS). We would also like to thank the representatives of Member States who participated in the Brussels seminar on a draft version of the report for very useful comments.
We are furthermore very grateful to the help we have received from the staff at DAC. We would like to thank Suzanne Steensen (Economist, Aid Architecture and Financing), Hubert De Milly (Senior Policy Advisor), Sara Fyson (Policy Advisor), Robin Ogilvy (Policy Analyst), Silvia Guizzardi (Policy Analyst, Capacity Development), and James Hradsky (Senior Coordinator for Capacity Development). We would like to give special thanks to Fredrik Eriksson (Statistical Policy Analyst) for help in sorting out a whole range of aid data issues.
We have also received valuable inputs from people in various aid agencies and institutions. We would here like to mention Jan Cedergren, Swedish Foreign Office, Lena Ingelstam, Anders Gerdin, Helena Reuterswärd, Per Knutsson, and Joakim Molander of Sida, Paolo Craviolatti and Declan Magee, DFID, Robert Keller, SADEV, and Niels Dabelsteain, DIIS. Very special thanks go to Gani Aldashev for all his inputs and in particular with regard to the section on aid predictability. We are also very grateful to Anne-Caroline Burnet for help with the case study and all the people in Mali who were interviewed for our case study (see the list in Appendix A1).
A final thank goes to our colleagues at the universities of Namur and Gothenburg for their help and insightful comments on our work, and to Daniela Milici and Filippo Ghezzi of SOGES who coordinated the work.
The consultants are solely responsible for the study, its contents and findings,
Gothenburg, September 2011
Arne Bigsten
The Aid Effectiveness Agenda: The benefits of going ahead
Final Report - Contract nr. 2010/256898 Page 6 of 169
List of Acronyms and abbreviations
AAA Accra Agenda of Action
AF Associated financing
AIDS Acquired immune deficiency syndrome
AMC Advance market commitments
BRM Bilateral reputation mechanism
CPA Country programmable aid
COM Commission of the EU
CRS Creditor Reporting System
DAC Development Advisory Committee
DFID Department for international Development (UK)
DG Directorate–General
EU European Union
GBS General Budget support
GDP Gross domestic product
GEF Global Environment Facility Trust Fund
GMM General Method of Moments
HDI Human Development Index
IMF International Monetary Fund
IBRD International Bank for Reconstruction and Development
IDA International Development Association
IFC International Finance Corporation
JASZ Joint Assistance Strategy for Zambia
MAR Multilateral Aid Review (of DFID)
MIGA Multilateral Investment Guarantee Agency
MRM Multilateral reputation mechanism
NGO Non-governmental organization
ODA Overseas development assistance
OECD Organization of Economic Cooperation and Development
OLS Ordinary Least Squares
PA Paris agenda
PBA Programme Based Approaches
PD Paris Declaration
PPP Public Private Partnership
SADEV Swedish Agency for Development Evaluation
SBS Sectoral Budget Support
Sida Swedish International Development Cooperation Agency
TA Technical assistance
The Aid Effectiveness Agenda: The benefits of going ahead
Final Report - Contract nr. 2010/256898 Page 7 of 169
UK United Kingdom
UN United Nations
USA United States of America
USD US dollars ($)
WDI World Development Indicators
WGI World Bank Governance Indicators
The Aid Effectiveness Agenda: The benefits of going ahead
Final Report - Contract nr. 2010/256898 Page 8 of 169
Executive summary
The purpose of this study is to estimate the gains that can be made in terms of aid effectiveness by the implementation of the commitments of the Paris Declaration (PD) and the Accra Agenda for Action (AAA) by the EU and its member states. The focus is on reforms which are under the exclusive influence of the EU including the member states, and which relate to the relationships between public authorities.
The structure of the empirical analysis is basically to estimate potential transaction costs savings and then to add indirect growth effects of the implementation of Paris agenda (Paris Declaration + Accra Agenda of Action) measures. By adding these two types of effects we obtain our primary measure of the gains from the full implementation by the EU of the Paris agenda. However, we add a discussion about the potential gains in terms of the poverty reduction effect that could be achieved through the coordination of EU donors’ country allocation of aid. Since this estimate is more hypothetical we report that separately.
We review the academic literature in two dimensions. We first discuss the literature on the benefits of coordination, which generally uses the principal-agent framework. This literature argues that elite capture may be unavoidable yet can be mitigated provided that some form of conditionality is applied to the recipient countries. We conclude from this literature a number of benefits can be generated by aid coordination: Aid coordination allows donors to economize on transaction costs, and it allows a relaxing on the pressure exerted on scarce resources within the recipient governments. There would be gains if one could set up a specialized agency or mechanism able to collect more information about the governance characteristics of the potential recipients, and to circulate information about fraudulent behaviour. Aid coordination allows for a more effective implementation of conditionalities.
Secondly, we review the literature on the growth effects of aid. Although it has not been possible to establish unquestionable relationships it seems clear that aid can contribute to development. However, there are results which show that when aid to a country exceeds a certain share of GDP the effect on growth declines. If one wants to increase aid in such a situation one has to consider how this could best be done. It is for example administratively demanding to channel aid in the form of projects, which require a lot of detailed decisions and steering. It therefore seems reasonable to use more general forms of aid or channel it through alternative channels. The two main conclusions from this literature that are relevant to us are that general forms of aid often seem preferable, and that there are aggregate declining returns to scale in aid.
Then we present our own theoretical framework for the analysis of aid coordination. When analyzing the social profitability of aid coordination, we must consider the potential costs and benefits involved. The benefits for the donor countries consist of (i) the cost savings and (ii) the greater effectiveness with which they can achieve their development objectives in the beneficiary countries. The former, cost savings effect of better aid coordination, are expected to result from a substantial reduction in the individually borne transaction costs in the aid delivery process. The latter, the governance effect of aid coordination, is expected to follow from improvements in the governance of recipient countries as a result of more effective implementation of conditionalities and better monitoring of aid uses, on the one hand, and higher levels of ownership and transparency, on the other hand. The costs entailed by coordination efforts, essentially consist of (iii) the loss of national sovereignty and the diminished ability to pursue national objectives through aid programs. We label them the political costs of aid coordination.
We first look at the governance effect as a conditionality mechanism. It is clear that the larger the information-pooling group, the stronger is the pressure exerted upon the recipient country. The same point can be made with regard to ownership and transparency. It can be argued that the incentive for a recipient country to define its own priorities in a clear manner is enhanced when it negotiates with donor countries as a group rather than separately with each of them. Transparency is likewise improved when more donor countries share information and act cohesively to prompt the recipient country to precise and publicize its objectives and the results achieved as a result of aid efforts. We may conveniently conceptualize the
The Aid Effectiveness Agenda: The benefits of going ahead
Final Report - Contract nr. 2010/256898 Page 9 of 169
benefits of all the indirect governance effects of development aid − increased levels of corruption control, ownership, and transparency − as the effectiveness with which poverty is being alleviated in the recipient countries.
Our theoretical analysis shows that intensification of aid coordination efforts may (1°) reduce the transaction costs borne by each individual donor country; (2°) enhance aid effectiveness in the sense of better reaching the donor’s objectives in the recipient countries; (3°) entail a political cost in the form of a loss of national autonomy. There is thus a trade-off between considerations related to aid coordination benefits – the direct, cost-saving effects and the indirect, governance effects − and considerations related to the political cost that accompanies aid coordination effor ts. How the equilibrium level of coordination will be set depends on the countries’ preferences regarding their political independence and the weight they attach to poverty reduction in developing countries. When aid is coordinated and a measure of political control is thereby foregone, the amount of effective aid increases. The trade-off between self-interest and poverty reduction may vary between countries. Generally big countries tend to assign much greater weight to considerations of political sovereignty and control than smaller ones, if only because they are more able to design strategies that serve their own national interests.
Recent evaluations of the Paris Declaration and the Accra Agenda for Action have been able to provide useful information about how far the implementation of the Paris agenda has gone, but they have not provided quantitative estimates of the effects. Our study is an attempt to estimate the gains that could follow a full implementation of the Paris agenda by the European Union.
The study covers bilateral aid from the 27 EU countries plus their aid through the Commission. The Paris agenda is focused on issues relating to country programmable aid, and this category is focused in the computations done. The rest of ODA is consists of non-relevant bilateral aid plus non-EU multilateral aid. The estimates are done for 2009.
Savings on aid transaction costs is a key part of the Paris agenda, and our first computations estimate the savings that can potentially be made in administrative costs on the EU donor side. Earlier estimates suffer from some weaknesses, so this study has chosen a new approach to the estimation. To get a full coverage of all transaction costs of the European donors we start from comprehensive information from the donors on all their administrative costs and evaluate how much of this cost donors could save by concentrating activities. We do the quantitative analysis in two steps. We first scale down the administrative cost by reducing the number of partner countries. We estimate the percentage reduction in administrative costs following a reduction in the number of recipients, while keeping the overall aid budget constant and not changing the composition of the aid flow, that is the mix of projects and programmes. To be able to do this we need an estimate of the economies of scale in aid delivery, and we derive this with the help of regression analysis. We assume that the number of partner countries for the average donor is reduced by 37 or 37% (one standard deviation). This would reduce the administrative costs by 20%. For the EU including member countries this would a little less than €500 million in 2009 prices.
In the second step we reduce costs further by changing aid modalities. We investigate how much money that can be saved by shifting money from projects to programmes. This gives an extra cost saving on top of the effect of country concentration. We estimate the required amount of aid that goes from bilaterals as project support that needs to be shifted to programme support to meet the target of the Paris declaration in this regard. The target of the Paris agenda is to increase the share of flows going through programme based approaches to 66 %, which we interpret to mean that 66 % of CPA is to go through PBAs. Our estimate is that programme aid on average only costs 33.5% of project aid in donor administration costs. If we increase the proportion of CPA that is PBA from the actual level for 2009 of 43.7% to 66%, the administrative costs related to CPA will be lowered by 21 % or close to €300 million.
About 29 % of CPA is technical assistance, and this is not included in our computation for two reasons. First, we can reach the 66 % target by only shifting from projects to programmes. And there is a bigger saving
The Aid Effectiveness Agenda: The benefits of going ahead
Final Report - Contract nr. 2010/256898 Page 10 of 169
from shifting from projects to programmes than shifting from TA to programmes. Secondly, it is less clear that it is as feasible to shift this type of aid into programmes. In total the savings from the two steps would in the range of €700 million.
The second major Paris agenda component we estimate is the cost of the tying of aid. This cost is equal to the reduction in the value of resources transferred caused by restrictions on their use. To compute this cost we use two parameters, the amount of EU aid that is tied and the cost increase associated with tying. Our estimate is that 18.4% of fully tied aid is lost relative to what the same amount could have bought if it had been untied. (We do not compute the cost of partially tied aid, which means that we underestimate the costs.) We make estimates separately for non-technical assistance and technical assistance. The cost increases are about €400 million for each. The total cost of EU aid tying is thus around €800 million.
The third component we investigate is the cost of the unpredictability and volatility of aid. The problem with volatile aid is that it makes policy making in the recipient countries much harder, and forces the countries to be very conservative in deciding on the allocation of funds. There are also potentially negative effects on recipient institutions. The calculation should take into account both the direct beneficial effects on public finances, as well as the indirect effects operating via better institutions. We apply the methodology of Kharas (2008), who constructed a measure of loss associated with volatility, using insights from finance theory. Given that higher volatility is considered to have negative consequences for the partner country and thus being undesirable, the partner country would be willing to receive lower flows of aid in exchange for lower volatility of its aid portfolio. One can then calculate the certainty equivalent of aid flows to any partner country: it is the lowest amount of aid that the country would agree on receiving if this aid were given to it with certainty. It must be noted, however, that not all volatility is necessarily bad. In particular, humanitarian aid, by its nature, is volatile. More generally, any component of aid that acts as insurance will exhibit volatility that might be welfare-increasing. To adjust for this we use only the component of aid for which we know that volatility is bad, namely the country programmable aid. Analytically, the calculation of the deadweight loss of volatility is made using a formula derived on the basis of the Capital Asset Pricing Model. We can then compute the deadweight loss per dollar of CPA. The average (unweighted) estimate of this variable for the EU is as high as 15 cents per dollar of CPA. We then compute average annual deadweight loss associated with EU aid volatility. Our estimate of the benefits of reducing the volatility of EU aid for 2009 is in the range of €1700 million.
Apart from these cost reducing effects of the implementation of the Paris agenda, we have also sought to estimate indirect effects on institutions and growth of the recipients that follow from changes in the aid relationship. We run a reduced form aid-growth regression, where we add the effects of aid modalities directly into the equation. We confine the analysis to the period 2000-2009, partly for data reasons, but also because it seems appropriate to focus on the period since the turn of the millennium. This is a period with more stability and better development (at least in Africa) than the earlier decades, and data for this period should say more about current aid practices than data for earlier decade.
We do a pooled OLS growth-regression, where we explained recipient country growth by standard variables including aid and aid squared, plus Paris declaration variables. The central independent variables are three PD indicators, namely aid fragmentation (CPA/GDP per number of donors giving CPA), general budget support share (GBS/GDP), and tied aid share (tied aid/GDP). We control for initial education level, initial investment level, initial log GDP per capita, initial log population, lagged aid (ODA/GDP), lagged aid squared, and time dummies. We run a set of regressions, where the explanatory variables are lagged one to four years. Only one of the indicators has a robustly statistically significant (over the different lagging alternatives) effect on growth, and that is budget support/GDP. We use the estimate from the regression that uses the average of 4 years lags as independent variables to simulate the impact on growth. We assume that donors increase the share of aid given as budget support increases by 11% (one standard deviation). The result of this simulation is that the aggregate GDP level of recipients the following year can be increased by €1800 million. This number is fairly large, and reflects the fact that everything that has an effect on growth will matter a lot. But this effect was always going to be difficult given the difficult econometric issues involved. So this is measured with low precision and is our must uncertain estimate.
The Aid Effectiveness Agenda: The benefits of going ahead
Final Report - Contract nr. 2010/256898 Page 11 of 169
This amount cannot directly be compared with the yearly cost savings discussed elsewhere. The cost savings can (potentially) be translated (one-to-one) into higher aid volumes, while the government in the partner country cannot directly control all the extra income. However, higher GDP is part of long-run development and increases the tax base. This type of effect does not have the same risk of causing corruption as aid flows.
There has been a concern about the “aid orphans”, so the next dimension we consider is what can be gained by changing the inter-country allocation of aid. We investigate what gains the EU could achieve if it chose to jointly seek to optimize the allocation of its aid across countries with the single aim to maximize the aggregate poverty reduction effect. This is an attempt to measure how much that could be gained if all donors completely ignored the above mentioned political costs of coordination. In this experiment we only consider country programmable aid. We find that about $19 billion of EU aid out of $27 billion should be reallocated. Aid would be concentrated in only 20 countries. The reallocation would lead to a modest increase of poverty among the donor darlings and a large decline in poverty in the orphan countries. The estimated net gain from the reallocation is in the range of €7,800 million, after we have adjusted the estimates for differences in the quality of governance. This estimate must be seen as an upper limit as to what can be achieved.
One must then ask why the actual allocation is so far from the “optimal” allocation. Obviously EU donors have other aims apart from the maximization of global poverty reduction. They want to be present in a broader range of countries for economic and political reasons, which mean that there are political constraints on the reallocation our analysis suggests. Coordination could be organised in the form of Commission aid or by coordination of bilaterals, but irrespective of what form the coordination would take, there remains strong political restrictions on what can be achieved. According to the donor quality study of Birdsall and Kharas (2010) the Commission now seems to be better adjusted to the Paris agenda than most of the bilaterals, which suggests that it could contribute. So coordination can take different forms, but the extent of coordination will in the end depend on the political goals of the participating countries.
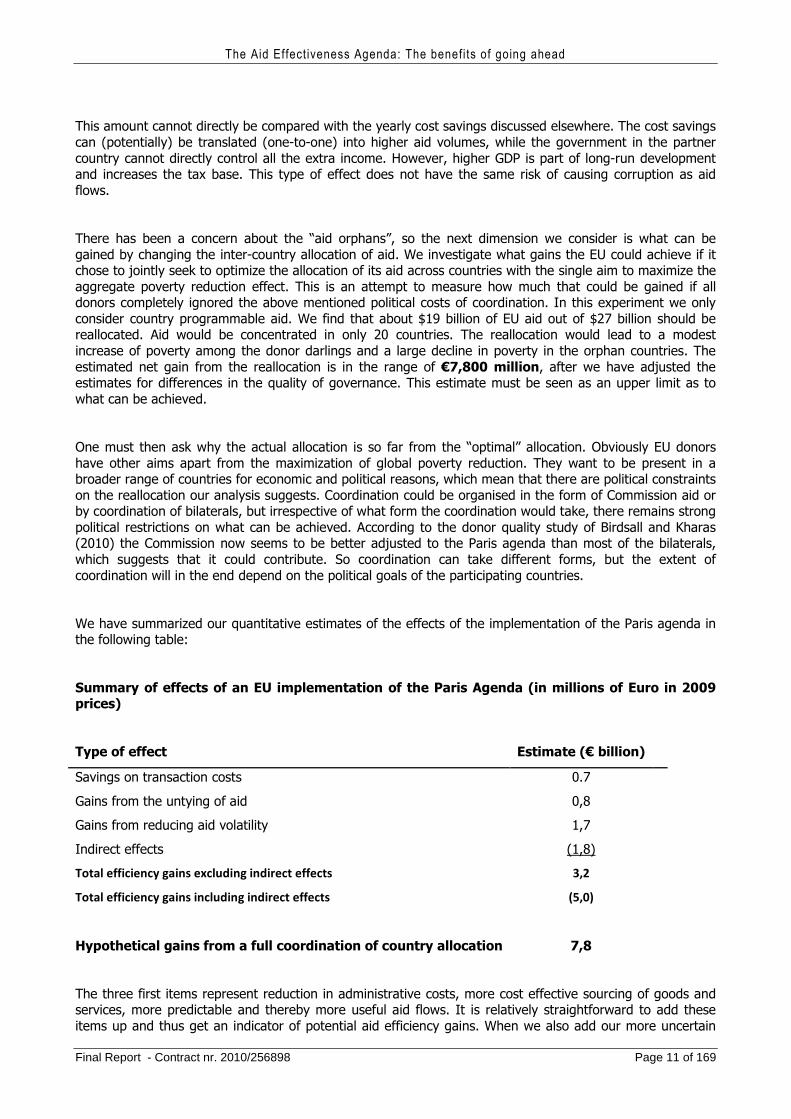
We have summarized our quantitative estimates of the effects of the implementation of the Paris agenda in the following table:
Summary of effects of an EU implementation of the Paris Agenda (in millions of Euro in 2009 prices)
Type of effect Estimate (€ billion)
Savings on transaction costs 0.7
Gains from the untying of aid 0,8
Gains from reducing aid volatility 1,7
Indirect effects (1,8)
Total efficiency gains excluding indirect effects
Total efficiency gains including indirect effects
3,2
(5,0)
Hypothetical gains from a full coordination of country allocation 7,8
The three first items represent reduction in administrative costs, more cost effective sourcing of goods and services, more predictable and thereby more useful aid flows. It is relatively straightforward to add these items up and thus get an indicator of potential aid efficiency gains. When we also add our more uncertain
The Aid Effectiveness Agenda: The benefits of going ahead
Final Report - Contract nr. 2010/256898 Page 12 of 169
estimate of the indirect effect in recipient countries our estimate of what the gains from an ambitious application by the EU of these dimensions of the Paris agenda would have been for 2009 is about €5 billion.
We have also estimated how large a gain that could be achieved by a full coordination of the country allocation of EU aid with the single aim of poverty reduction. Our estimate is that such a full-scale reallocation would give a net gain of over €7 billion, even after we have adjusted for country differences in the quality of governance. We show this item separately, since we think that the political support for such a dramatic change in country allocation is not there. The fact that aid is not allocated in this way indicates that donors have also other aims than poverty reduction.
In the final chapter we draw some general policy conclusions. We first note that the results of our analysis are in line with the general perspective of the Paris Declaration. Our contribution is that we assess the magnitude of the benefits that different changes could imply. With regard to harmonisation we show that major cost savings can be achieved if donors concentrate their aid efforts to fewer countries and to more general forms of aid transfers, e.g. General Budget Support. There may be political constraints on such a change, since it would mean that major countries would have to abandon certain countries, while they may feel that they have a political interest in showing presence there. To focus aid on more general forms of aid may be politically easier, but donors are reluctant to go for general forms of aid when they are uncertain about the quality of the governance of the recipients. The second aspect of harmonization which we consider is the coordination of the country allocation of aid. A coordinated EU country allocation would yield a huge benefit (in terms of poverty reduction), but such a reallocation would have high “political costs”. On the list of countries that would benefit from the reallocation are countries which are neither major economic partners of the EU, nor have strong strategic value. We do not expect that EU countries would be willing to make the full adjustment.
The second major area for continued reforms relates to Ownership and Alignment. We have estimated the benefits from shifting to more general forms of aid, such as General Budget Support. When seeking to channel resources through a government it makes sense to see to it that it is integrated with the regular system, even if that increases the risk of misappropriation. It is important for sustainable development that aid helps build a viable governance structure, and that is not done by using parallel structures. The other dimension that is relevant here relates to the untying of aid. This is unproblematic and it is hard to find any strong arguments against it. The argument against untying would be that tying benefit donors themselves and reduces their cost of the aid transfer.
The value of predictability of aid has been computed with the help of a theoretically advanced model requiring a large set of assumption, but it seems certain that the estimates pick up a problem that is highly relevant. That recipients will benefit greatly from more stable aid flows is not in dispute. The challenge here relates to the issue of what is required for donors to be able and willing to guarantee stable aid flows. First, there are the constraints implied by domestic budget procedures at home. Second, there may be unexpected revelations of bad governance or corruption in the partner countries, and then donors would then like to adjust their aid stance. Thus, they may be reluctant to enter into contracts that cannot be changed. So in the end there are major gains to be had if aid is more predictable, but to make aid contracts longer they may need to have some conditions specifying what should be done in case there is inappropriate partner behaviour.
When it comes to the issue of improving mutual accountability, transparency and learning we do not have any estimates that pick up this effect separately, but these aspects are interrelated to the themes we have already covered. Accountability and transparency should be there on both sides of the transactions, but presumably it is a greater concern with regard to recipient countries. Transparency is clearly a necessary ingredient in the governance set-up if the donors are to be willing to provide more general forms of aid, that is accept a higher degree of ownership (which we have implied is a good thing). It is essential that the budget processes are transparent and that it is possible to follow the money flows to the final beneficiaries.
The Aid Effectiveness Agenda: The benefits of going ahead
Final Report - Contract nr. 2010/256898 Page 13 of 169
We have not provided any quantitative estimate of the value of reduced conditionalities. But we have argued that one should apply some form of conditionality to the recipient countries where there is a risk that leaders exploit private information and that a number of benefits can be generated in this context by aid coordination. Aid coordination can allow for a more effective implementation of conditionalities and in a format that reduces the transaction costs involved also on the recipient government side.
The final question is what form the further implementation of the Paris agenda within the EU should take and in particular what role the Commission should play relative to the member countries. Our estimates suggest that much could be gained by coordinating aid between the EU Commission and member countries. One obvious way to bring about increased coordination would be to increase the role of the Commission. This can be increased in two ways. Either the member countries can decide to channel more of their aid through the Commission, or it can provide tighter coordination of the aid of the EU member states.
We have noted that a large effect could be achieved with a coordination of country allocation, and that does not require channelling resources through the Commission (even if that would be one way of doing it). It would be enough if countries jointly decide about the country allocation of their aid.
Increased predictability is much harder to organize in a decentralized fashion, since all countries have their own political and budgetary processes. This would be more easily handled if aid was channelled through the Commission, since there would then be essentially only one process to stabilize.
The third dimension which is the untying of aid does not require coordination. It is just a matter of doing it. But peer pressure, through the Commission, OECD/DAC or otherwise, could help the process.
Finally, reduction in transaction costs should be easier within one structure, but it would be politically very radical change to channel all aid through the Commission. So for the time being it seems more realistic to move step by step and try to strengthen processes of joint programming and policy coordination. Much remains to be done in terms of implementing the Paris agenda, and we have noted that there is even a certain PA fatigue among the bilaterals. So the political costs remain a severe brake on closer coordination.
The Aid Effectiveness Agenda: The benefits of going ahead
Final Report - Contract nr. 2010/256898 Page 14 of 169
1. Background and purpose
The Terms of Reference of this study states that “the Paris Declaration (PD) explicitly makes a commitment to eliminate duplication of efforts and rationalise donor activities to make them as cost-effective as possible. This should be done by way of increasing partner country ownership, achieving a better donor harmonisation and alignment with the partner country's development strategy, managing for results as well as focusing on mutual accountability. Both donors and partner countries would benefit from increased effectiveness.”
While taking for granted that, under the Lisbon treaty, development continues to be a field, wherein the EU and its member states can and will have individual policies, effective coordination of aid programmes is a legal obligation for the Union and its Member States. Article 210 of the Lisbon treaty states: "In order to promote the complementarity and efficiency of their action, the Union and the Member States shall coordinate their policies on development cooperation and shall consult each other on their aid programmes including in international organisations and during international conferences". The importance of aid coordination with other donors has also been enshrined in the European Consensus on Development1, the Code of Conduct on Division of Labour2 and the Operational Framework3 based on the international aid effectiveness agenda (Paris Declaration and Accra Agenda for Action)4.
To give economic meaning to the legal obligation, it is important to attach a price tag to uncoordinated and parallel approaches (such as designing individual strategies instead of joint ones, individual monitoring and evaluation instead of joint ones etc.). A better understanding of the costs of foregone reforms, and the potential gains to be made from implementing reforms, could constitute a powerful incentive towards moving the aid effectiveness agenda forward. If it is shown that the fragmented "business-as-usual" way of development aid is associated with substantial costs, more donors may find it in their interest to move towards making their aid more effective, streamlined and cost-efficient. In doing so, more resources would conceivably be available for the fight against poverty.
The purpose of this study is to estimate the gains that can be made in terms of aid effectiveness by the implementation of the commitments of the Accra Agenda for Action (AAA) and the Paris Declaration (PD) by the EU and its member states. The study considers both "aid agency effectiveness" (a la Birdsall and Kharas, 2010) and “aid policy effectiveness”. This means that the assessment refers not only to the effectiveness of the individual agencies, but also to the costs of parallel development policy making of European governments and agencies.
A previous study commissioned by the EU (European Commission, 2009) addressed the topic and sought to quantify the gains to be had by coordinating EU donor activities and implementing the Paris Declaration and the Accra Agenda for Action. The study estimated that efficiency gains in the range €3-6 billion a year could be made. However, the cost concepts were rather narrow and the empirical estimates were crude. The aim here is to seek to seek to advance and update the discussion and to take a broader economic view of the issues. Our aim is both to think through the conceptual problems involved and to take quantification further.
1 European Commission (2006). The European Consensus on Development, 2006C 46/01). 2 Council Conclusions of 15 May 2007 on "EU Code of Conduct on Complementarity and Division of Labour in Development Policy", doc. 9090/07 3 Council conclusions of 17 November 2009 on an Operational Framework on Aid Effectiveness, doc. 15912/09, and Council Conclusions of 14 June 2010 on Cross-country Division of Labour in Development Aid (doc. 10348/10) 4 http://www.oecd.org/dataoecd/58/16/41202012.pdf
The Aid Effectiveness Agenda: The benefits of going ahead
Final Report - Contract nr. 2010/256898 Page 15 of 169
A recent and very comprehensive study by Birdsall and Kharas (2010) seeks to assess the quality of aid along several dimensions and develop a set of indicators around them. However, no aggregate quantitative estimate of potential savings is made. The present study tries to do precisely that. The overall purpose of this study is to provide an estimate of gains to be made by the full implementation of the commitments of the Accra Agenda for Action and the Paris Declaration by the EU and its member states both at headquarter and field level. So the main challenge here is to find ways to quantify effects.
The ToR specifies that “the focus is to be on gains to be made by reforms implemented by the EU and its member states, i.e. reforms under the exclusive influence of the EU donors' side. Those aspects of the PD and AAA that fall within the exclusive responsibility of partner countries to implement will not be considered here.5 For the same reason, non-EU donors are also excluded from the scope of the study, while it is acknowledged that it would be very valuable to have a global assessment of the economic gains from full AE reforms” The focus is thus on what the EU should do, but when addressing this question it will also be important to take relations to non-EU into account. It is further noted that “civil society activities and cooperation with private foundations represent an important part of the aid delivered in a given country. This exercise will however mainly focus on the relationships between public authorities, while not excluding civil society if data is readily available.”
The focus of the study will be on those issues measured by the Paris Declaration indicators except those which are the exclusive responsibility of the partner countries, issues of division of labour and main aspects of the Accra Agenda for Action. We will conclude with a discussion of which of the proposed reforms would bring the largest gains and draw out the implications of our analysis for the design of the EU aid system.
5 Such aspects include, for instance, indicators 1 and 2 of the Paris Declaration on (see Table 2.1) operational development strategies and on improving country systems.
The Aid Effectiveness Agenda: The benefits of going ahead
Final Report - Contract nr. 2010/256898 Page 16 of 169
2. Structure of the analysis
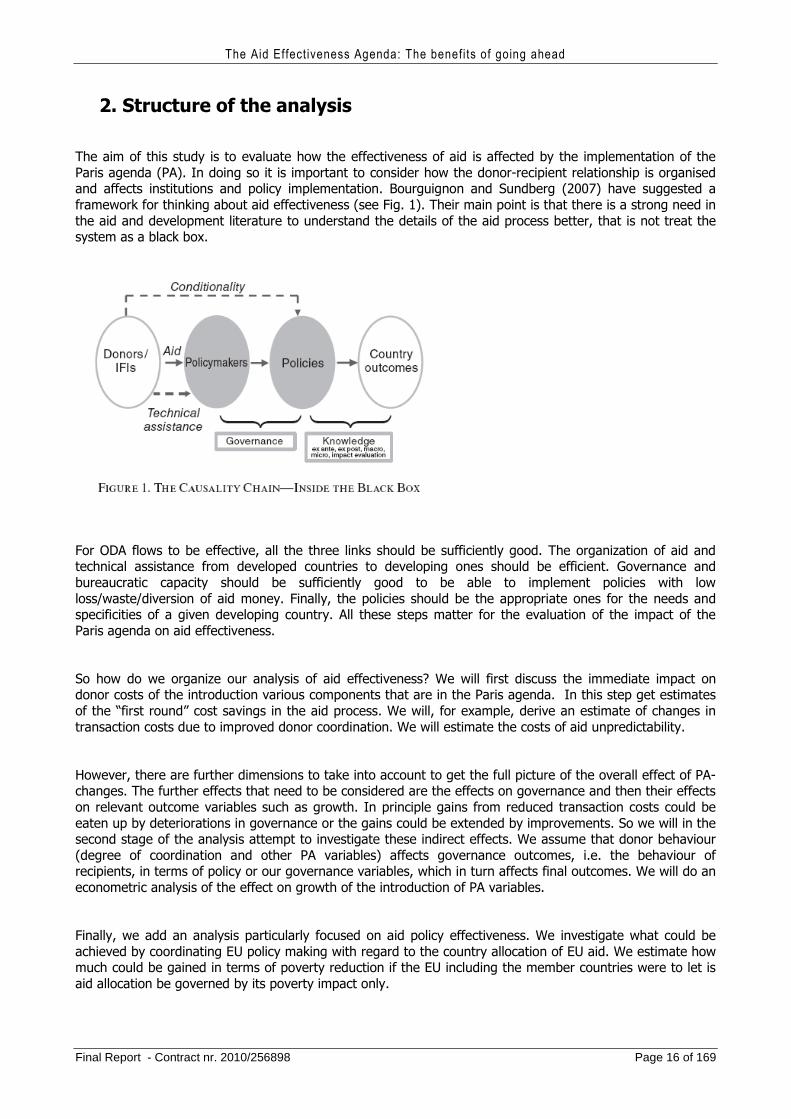
The aim of this study is to evaluate how the effectiveness of aid is affected by the implementation of the Paris agenda (PA). In doing so it is important to consider how the donor-recipient relationship is organised and affects institutions and policy implementation. Bourguignon and Sundberg (2007) have suggested a framework for thinking about aid effectiveness (see Fig. 1). Their main point is that there is a strong need in the aid and development literature to understand the details of the aid process better, that is not treat the system as a black box.
For ODA flows to be effective, all the three links should be sufficiently good. The organization of aid and technical assistance from developed countries to developing ones should be efficient. Governance and bureaucratic capacity should be sufficiently good to be able to implement policies with low loss/waste/diversion of aid money. Finally, the policies should be the appropriate ones for the needs and specificities of a given developing country. All these steps matter for the evaluation of the impact of the Paris agenda on aid effectiveness.
So how do we organize our analysis of aid effectiveness? We will first discuss the immediate impact on donor costs of the introduction various components that are in the Paris agenda. In this step get estimates of the “first round” cost savings in the aid process. We will, for example, derive an estimate of changes in transaction costs due to improved donor coordination. We will estimate the costs of aid unpredictability.
However, there are further dimensions to take into account to get the full picture of the overall effect of PA-changes. The further effects that need to be considered are the effects on governance and then their effects on relevant outcome variables such as growth. In principle gains from reduced transaction costs could be eaten up by deteriorations in governance or the gains could be extended by improvements. So we will in the second stage of the analysis attempt to investigate these indirect effects. We assume that donor behaviour (degree of coordination and other PA variables) affects governance outcomes, i.e. the behaviour of recipients, in terms of policy or our governance variables, which in turn affects final outcomes. We will do an econometric analysis of the effect on growth of the introduction of PA variables.
Finally, we add an analysis particularly focused on aid policy effectiveness. We investigate what could be achieved by coordinating EU policy making with regard to the country allocation of EU aid. We estimate how much could be gained in terms of poverty reduction if the EU including the member countries were to let is aid allocation be governed by its poverty impact only.
The Aid Effectiveness Agenda: The benefits of going ahead
Final Report - Contract nr. 2010/256898 Page 17 of 169
After deriving these estimates of effects, we first add our estimate of the indirect effects of the PA measures to the first-round cost-saving estimates, to get our primary estimate of the total effect of the implementation of the agenda. In other words, we conclude with something like the following: "The estimate for cost-savings of X PA interventions is Y Euro. On the basis of our econometric work, we are able to say that this will also have an additional development outcome effect of Z points of extra growth. Achieving this extra impact without coordination would have cost donors W Euro. Thus, overall, this coordination is giving donors Y+W monetary benefits". It should be noted that there may be trade-offs, where donors can choose to allocate resources in a way that helps foster institutions that are beneficial for the long run but at the expense of short-term growth (which is what we pick up).
Finally, we do an estimate of potential gains from aid policy coordination in terms of the country allocation of aid. The reason for treating this step separately and referring to it as an extension is that the implied reallocation across countries is so radical that we do not see that there would be political backing for such a drastic change.
2.1. The tasks The aims of the Paris Agenda (the Paris Declaration and the Accra Agenda for Action) for donors are to eliminate duplication of efforts and rationalise donor activities to make them as cost-effective as possible. The indictors by which donors measure progress with regard to the Paris Declaration are shown in Table 2.1.
Table 2.1: Indicators of Progress on the Paris Declaration
1. Partners have operational development strategies 2. Reliable country systems 3. Aid flows are aligned on national priorities 4. Strengthen capacity by coordinated support 5. Use of country public financial management systems and procurement systems 6. Strengthen capacity by avoiding parallel implementation structures 7. Aid is more predictable 8. Aid is untied 9. Use of common arrangements and procedures 10. Encourage shared analysis 11. Results-oriented frameworks 12. Mutual accountability
This study seeks to assess the potential effects of the application of the proposals in the Paris Declaration and the Accra Agenda for Action by the EU and its member states. The specific challenge of this study is to provide quantitative estimates of the gains of donor coordination.
The following five tasks were specified in the ToR:
1. Assessing gains to be made from increasing ownership/alignment (fostering institutions)
This dimension is certainly central for long-run development. When aid passes through recipient country institutions as suggested in the Paris agenda it is likely to affect the quality of domestic institutions, which determine the quality of public spending. It is a challenge to put a value on this effect, but we will seek to quantify the indirect effects on growth of improved ownership/alignment due to donor choices. Measurable indicators that could be used here include the extent to which resources are given as GBS or as programmable aid.
The Aid Effectiveness Agenda: The benefits of going ahead
Final Report - Contract nr. 2010/256898 Page 18 of 169
We will also estimate the cost savings to be had from the untying of aid, which gives recipients increased control of over resources.
2. Assessing gains to be made from increasing harmonisation (reducing the administrative burden)
Here we will measure the first round effects of donor coordination in terms of cost savings, which then can be used to increase the real aid flow.
We will also consider the effects of a better coordination of the country allocation of aid, which is a more ambitious effort of joint policy optimization.
3. Assessing gains to be made from improving mutual accountability (transparency and learning)
We are not able to separate out the effect on development outcomes of improved transparency and learning, but this effect is picked up by our aggregate estimates of harmonisation and reduction in transaction costs.
4. Assessing gains to be made from improving predictability (AAA)
The uncertainty and unpredictability of aid flows complicates policy making of recipient governments a lot, and thereby makes the use of aid resources less efficient. This is one of the major dimensions that we address, and we undertake an extensive qualitative analysis of the costs of fluctuations in EU aid.
5. Assessing gains to be made from reduced conditionalities (AAA)
We are not able to come up with a quantitative estimate of the gains that would follow from reduced conditionalities, but we provide an extensive theoretical discussion of the issues at hand. We then draw qualitative policy conclusions on the basis of this analysis.
2.2. Outline of the report
After having sketched how our analysis relates to the tasks specified in the Terms of Reference, we now describe the structure of the rest of the report. We start with reviews of the relevant literature in Chapter 3. We first review the literature relating the key issue of the Paris agenda, namely coordination of aid, and then the literature on the link between aid, governance, and growth in the recipient countries. This is what we refer to as indirect effects. Chapter 4 presents the theoretical framework for the analysis of the effects of aid coordination and conditionality. Chapter 5 presents our review of previous analyses of the impact of the Paris agenda.
Before we do our computations we discuss briefly, in Chapter 6, the scope of the Paris agenda that is what types of ODA that are affected by the PA and therefore should be included in our analysis. The aid dimension that is relevant for this discussion is the way that donors organize aid delivery.
One of the five main categories in the Paris Declaration is Harmonisation, which is intended to reduce the transaction costs of aid. This relates to how aid is transferred and is analyzed in Chapter 7. Another key
The Aid Effectiveness Agenda: The benefits of going ahead
Final Report - Contract nr. 2010/256898 Page 19 of 169
dimension of the PA relates to the untying of aid, which is discussed in Chapter 8. A separate issue relating to donor behaviour is the “predictability” of aid flows. This is identified as one of the key dimensions in the AAA, and we do a separate analysis of this in Chapter 9. Adding up these effects we get our estimate of potential cost savings or first round effects.
The ability of countries to achieve sustainable development depends on social structures, institutions and policies, geography, and available resources. How effectively resources are used depends on the character of institutions, policy making, and policy implementation within states, which may be referred to as domestic governance.6 We seek to measure the indirect effects at the recipient side with an econometric analysis of the effects of the introduction of PA measures on economic growth (Chapter 10). This picks up the effects of ownership/alignment as well as the effects of transparency and learning.
In Chapter 11 we make an estimate of how much one could gain in terms of poverty reduction focus by coordinating country allocation choices with the EU. In Chapter 12 we sum up the results of our estimations. Finally, in Chapter 13 we discuss the issues about European state aid relating to the efficiency of policy making among donors including the Commission, while we tentatively discuss how the European aid system should be organized.
6 Kaufmann et al. (2009, p. 6) define governance as “the traditions and institutions by which authority in a country is exercised. This includes the process by which governments are selected, monitored and replaced; the capacity of the government to effectively formulate and implement sound policies; and the respect of citizens and the state for the institutions that govern economic and social interactions among them”.
The Aid Effectiveness Agenda: The benefits of going ahead
Final Report - Contract nr. 2010/256898 Page 20 of 169
3. Review of the aid effectiveness literature
3.1. The benefits of coordination A useful point of departure when approaching the issue of optimal aid contracts in general, and the role of donor coordination in particular, is to look at the narrow yet inspiring literature that focuses on agency problems and uses the principal-agent framework. It is based on the idea that the donor, conceptualized as the principal, cannot perfectly observe the actions and type of the aid recipient, conceptualized as the agent. Therefore, the recipient may act in ways that do not conform well to the interests of the donor (the so-called moral hazard problem), and the recipient may be of the sort that the donor would have liked to avoid (the so-called adverse selection problem). This literature leads to the conclusion that elite capture is unavoidable yet can be mitigated provided that some form of conditionality is applied to the recipient countries whose leaders exploit private information. Thus, Azam and Laffont (2003) reach the conclusion that, by using the optimal aid contract, “the donor will mitigate, without compensating entirely, the effects of favouritism” (p. 51). 1. The optimal contract, as inferred by Azam and Laffont, specifies that the recipient government will receive an aid amount (which is endogenous) linearly dependent on the level of consumption of the poor that it provides. In other words, the optimal contract provides that the recipient receives a certain amount of aid against the promise to deliver a certain amount of consumption to the poor, and the more they promise to deliver to the poor the more aid they are entitled to receive. Such a rule is considered by the authors as describing in a stylized manner the conditionality mechanism: in their words, “the aid schedule captures in a stylized way the idea of 'tranches' whereby aid is delivered piecemeal as a function of the degree of achievement of the objectives” (p. 35). However, their answer only raises the issue of the recipient’s commitment problem (what if the recipient takes the aid money and does not deliver the agreed-upon consumption to the poor?), and does not elucidate the conditions under which a conditionality mechanism may be effective (when the game is finite). In their paper, the problem is assumed to be solved by just noticing that aid must just be disbursed only after observing the consumption of the poor (p. 52). Azam and Laffont are quite alerted to the adverse selection problem: recipient countries vary in terms of the quality of their governance, and the problem arises from the fact that the donor ignores these quality levels when deciding about aid flows. Their prescription is that the donor should avoid giving aid to the worst-governed countries because this is too ineffective: there is a threshold value of the governance level below which the donor government prefers to keep the money for the consumption of its own citizens to giving it away to the poor in the South, since the latter would anyway get only a small part of it. To improve the situation, that is, to better surmount the adverse selection problem, Azam and Laffont believe that the donor community should be able to rely on a specialized international agency that would collect information about the governance levels of all the potential recipient countries in the South. In this way, the donor governments could more effectively concentrate their efforts on the countries that are better at directing aid to their own poor. The basic problem is not solved, however: the poor in the worst-governed countries are bypassed. Note that the creation of such a specialized agency amounts to an act of donor coordination. 2. Svensson (2000, 2003), another significant contributor to the subject that concerns us here, explicitly looks at conditionality as a way to mitigate the moral hazard problem on the level of opportunistic recipients. He analyzes a two-stage game among two recipient countries and the donor. The two recipients are identical yet subject to independently correlated shocks, so that their ex post situation may differ. The key assumption is that the probability of good states increases monotonically with the amount of reform effort applied by the recipient country. In Svensson’s model (2000), the aid contract thus specifies the amount of aid disbursed as a function of aggregate state (the configuration of the states of nature obtaining in each country) and reform effort. Note that reform effort, the decision variable for the recipient, is assumed to be non-observable. What the author shows is that the second-best contract is a compromise between giving aid to those who most need it and providing optimal incentives. This translates into the following donor’s strategy: in order to induce the recipient to exert higher effort, aid flows in bad states must be lowered and aid flows in good states (more likely to occur when reform effort has been higher) raised (p. 70).
The Aid Effectiveness Agenda: The benefits of going ahead
Final Report - Contract nr. 2010/256898 Page 21 of 169
A noteworthy feature of Svensson’s work is that he believes there exists a serious commitment or time-inconsistency problem on the side of the donor: ex post, once the shock is realized, the donor is tempted to increase disbursements to the country most in need. Anticipation that this will happen in turn affects the recipient’s incentive to carry out politically costly reform policies ex ante (2000, p. 70). As a consequence, donor’s discretion yields lower reform effort (compared to the second-best) but full consumption smoothing. Hence the author’s attempt to look after other mechanisms that may possibly mitigate the donor’s commitment problem: tied project aid, delegation to an agency with low poverty aversion, competition between recipient countries for a given amount of aid (Svensson, 2000, 2003). The second solution corresponds again to an act of aid coordination. The idea is that since the donor’s time inconsistency is caused by its sensitivity to poverty, −it forgets its promise to sanction a country that has much poverty but most likely because of its bad governance−, a way out of the dilemma consists of delegating the aid allocation decisions to a specialized agency that has a low aversion to poverty and is, therefore, less vulnerable to the time inconsistency problem. 3. In a recent paper, Bourguignon and Platteau (2011) have explicitly modelled the trade-off between needs and governance, adopting a one donor-two-recipient-country framework. Unlike what is assumed in Svensson, but in accordance with Azam and Laffont, they assume that recipient countries are heterogeneous in terms of governance (aversion to poverty, in Azam and Laffont’s setup). But countries also differ in the extent of their needs (income levels) and population sizes, adding new dimensions to the problem. Moreover, the donor does not only allocate a given amount of money between recipient countries, but also make decisions regarding the monitoring precision and the severity of punishments meted out to poor performers. They thus go beyond Svensson’s simple dichotomy between perfectly observable and totally unobservable recipients’ efforts. Because the donor is now able to influence the quality of governance in each recipient country, through monitoring and punishment, the aid allocation problem looks different. Indeed, instead of leaving aside the worst-governed countries which also happen to be the poorest, the donor may choose to concentrate its monitoring efforts on precisely these countries in order to keep them on board. If monitoring and punishment efforts can thus be tailored to each recipient country, the donor can allocate aid to all of them, and aid will be directed at lower costs to the best-governed recipient countries. If, on the other hand, monitoring and punishment efforts are set uniformly across countries, it is now the best-governed countries that are likely to be ejected out of the aid programme. It is interesting to note that the conclusions reached by Bourguignon and Platteau lend support to the prescription given in Collier’s Bottom Billion (2007): monitoring expenses should be concentrated on the fragile states which are most in need of foreign aid, precisely because monitoring is less effective in these countries. 4. In another recent paper, Gaspart and Platteau (2011) use a one donor-one-recipient framework so as to probe into the conditionality mechanism considered as a means of inducing opportunistic local elites to give more attention to the poor. The mechanism is modelled as a dynamic game in which the donor disburses successive tranches of aid money conditional on reasonable performances by the elite who are in charge of receiving and channelling the external funds. As expected, the leader’s opportunism is mitigated, not completely eliminated. Unlike Azam and Laffont, but like Svensson, Gaspart and Platteau assume that the total amount of aid available is given. However, the abundance or scarcity of aid funds is implicitly introduced through a parameter that measures the cost of access to aid funds for the donor. Another key parameter is the cost of re-allocating aid money if a project fails. In their framework, project’s failure is understood as the actual detection of embezzlement by the aid intermediary. Like in Bourguignon and Platteau, they therefore use a fraud detection function (the leader’s decision is imperfectly observable) and a punishment mechanism (the leader and community are deprived of subsequent aid tranches if the former is caught). A third feature of their model deserves to be mentioned. Instead of the two-agent framework used in the aforementioned papers, they study the problem of aid effectiveness in a three-agent framework. Besides the donor and the recipient (the intermediary), the poor appear as a player in the aid game and, in the absence of elite’s altruism, their role is critical to make the conditionality mechanism possible when the aid game is of finite duration. While the donor and the intermediary or the local leader play a non-cooperative game together, the leader and the grassroots play cooperatively according to the logic of a bargaining game. Because the latter game involves a ‘social game’ of indefinite duration (based on some sort of patron-client relationship), their model better fits decentralized aid programs than aid schemes channelled through central governments.
The Aid Effectiveness Agenda: The benefits of going ahead
Final Report - Contract nr. 2010/256898 Page 22 of 169
Their central conclusion is nevertheless quite challenging: contrary to what immediate intuition suggests, cheaper aid is detrimental to the poor in the sense that the share of aid funds embezzled by the local leader is then higher. This is because, when aid becomes cheaper, the donor’s incentive to monitor local elites is being weakened. However, what happens to the absolute amount of aid reaching the poor is less clear. Another central conclusion is less challenging: a lower cost of redirecting aid funds causes the leader to better take care of the interests of the poor. Indeed, when the donor can rather easily re-allocate its aid money from a failing project/area to a new one, the elite adopt a more circumspect behaviour so as not to be detected by the donor’s monitoring efforts. To see the role of aid coordination in the above framework, we proceed in several steps, following Platteau (2004). The comparative static of Gaspart and Platteau’s model suggests that acute competition is an unambiguously regrettable feature of the aid environment. By driving aid agencies to disburse funds quickly in order to prevent rival agencies from de-stabilizing a particular aid supply relationship, and by increasing the cost of recycling funds in the event of fraud detection, acute competition causes the share of aid funds appropriated by local intermediaries to increase at the expense of the intended beneficiaries. In other words, intermediaries can skilfully play on inter-agency competition since they know both that aid agencies are keen to find partners through whom to channel their aid budget, and that this budget is more or less tied to the initially chosen project or community.
It is also evident that the emergence of exit options following the multiplication of aid agencies has the effect of raising the share that local elites are allowed to appropriate at equilibrium, that is, the share that will deter them from pursuing a shifting strategy. A shifting strategy is a strategy whereby the local elite do not care about staying with the same agency over the whole course of the aid project because they are ready, if caught cheating, to shift to another agency and start cheating again. What is at work here is a so-called bilateral reputation mechanism (BRM): if caught embezzling funds, a local elite are punished only by the aid agency that has actually provided the funds embezzled.
There are apparently two ways whereby the ‘elite capture’ problem can be mitigated. Reducing competition through concentration of aid supply in the hands of fewer agencies is the first way. Indeed, by diminishing the exit options available to local intermediaries, especially if aid agencies are geographically specialized, such concentration in the market for aid would have the same effect as a reduction in the aggregate supply of aid. The presence of scale economies in the technology of fraud detection when projects are geographically concentrated would constitute an additional advantage of this first solution. The second solution consists of a coordination mechanism whereby aid agencies would mutually inform each other about fraudulent acts committed by intermediaries7. If such a device, known as a multilateral reputation mechanism (MRM), is apparently more feasible than reducing competition, it is not devoid of serious practical difficulties as is evident from the discussion below.
The MRM has been documented by Greif (1989, 1994) with respect to relationships between traders (see also Platteau 2000: Chap. 6; Aoki 2001: Chap. 4). Applied to our problem, the mechanism would work as follows. Operating within a repeated-game framework, a donor agency would adopt the strategy whereby its grants money to a country or area, but only provided that it is not known to have cheated another agency some time in the past. If money is thus disbursed and the benefiting country is later found to have cheated the agency, the latter dutifully reports the fraud and communicates the name of the fraudulent country to the other members of the donor community. Before embezzling funds, a country’s elite or government would thus be incited to think twice because by cheating today it would spoil its reputation for future interactions with the whole donor community. The multilateral reputation strategy can be shown to be an equilibrium strategy. That is, if a government expects every donor agency to adopt such a strategy, its interest is to share the aid fund equitably among the intended project beneficiaries. Knowing that reaction, the interest of all donor agencies is to cling to the multilateral reputation strategy. Honest behaviour therefore gets established as a (Nash) equilibrium.
7 For a discussion of alternative coordination mechanisms, such as codes of conduct, ombudsmen, social auditing and accreditations, see Ebrahim 2003: 819-24.
The Aid Effectiveness Agenda: The benefits of going ahead
Final Report - Contract nr. 2010/256898 Page 23 of 169
There are several problems with the MRM, however.8 The first one stems from the fact that the information conditions that must be fulfilled for it to work are extremely stringent: information must circulate perfectly between donor agencies. This is unlikely to be the case in reality, because they are in large numbers, scattered around the developed world, and very heterogeneous in terms of several key characteristics (size, ideology, methods, time horizon, etc.). These are hardly ideal conditions for a dense information network to exist. None the less, aid coordination appears feasible within a more restricted circle of donors, and it is here that the European Union could play a useful leadership role, all the more so because it represents a huge size in the international aid flows.
Is the establishment of a private third party charged with centralizing information (as suggested, for example, in the Law Merchant system analyzed by Milgrom, North, and Weingast (1990) the solution to the problem caused by the costliness of generating and communicating information? Such a system can effectively work only if donors have an incentive to detect fraud and report fraudulent experiences to the third party, so that the black list of dubious intermediaries or countries in its hand is exhaustive and regularly updated (otherwise, donors would not be induced to consult it). Yet, in so far as the detection and reporting of a fraud once it has occurred entails costs but brings no benefits to the individual agency which has been cheated, such an incentive does not exist. Unless, of course, donor agencies are so genuinely committed to the cause of poverty relief that they are not concerned about whether poverty is reduced by themselves or by another aid agency (the critical argument of a donor’s utility function is then the extent of general poverty relief rather than the relief accomplished by its own efforts). In terms of the framework to be developed in the next section, this means that donor countries would give priority to the poverty-reduction objective relative to national prestige and independence.
To create the adequate incentive, the third party should be able to exercise pressure on the detected fraudulent leader so as to make it return the stolen money. A provision that unless a donor makes appropriate queries with the third party about the reliability of its current partner, it will not be entitled to use the system to obtain compensation would also make it in the interest of donors to query about past dealings of the aid recipient considered before disbursing money. As a result, so the theory goes, the threat against potential recipients would be effective and, if caught, a fraudulent government would be prompted to comply with the third party by returning the money stolen (so that its name is removed from the black list). This said, Milgrom, North and Weingast have nevertheless shown that honesty will be established as a (symmetric sequential) equilibrium under the above mechanism only if a number of conditions are met, in particular, the cost of information query, the cost of appeal to the third party, and the cost for the latter to recover the stolen money from fraudulent local country elite, ought not to be too high. Unfortunately, these assumptions are likely to be violated in the case under concern, especially because the headquarters of aid agencies are located at great distances from one another, and all kinds of information are costly to acquire, including evidence of fraud in the opaque context of alien cultural environments. The mechanism is therefore not self-enforcing. But, again, the condition is more likely to be satisfied if a group of donor countries like those of the European Union coordinate their efforts in the above sense.
A second problem lies in the fact that local elites or governments may not be actually concerned with preserving their reputation because their time horizon is short and they could be quite happy with running away with the money stolen from one single project. In other words, the payoff from dishonest behaviour is so large compared to the payoff from honest behaviour that honesty cannot be induced at equilibrium.
Finally, one key actor has been missing from the foregoing discussion, namely the ultimate purveyors of funds from whom donor agencies obtain their financial resources. They are taxpayers for national and international organizations, or taxpayers and the general public mobilized in fund-raising campaigns for NGOs. These ultimate purveyors of funds create a further link in the game, giving rise to a new space of strategic relationships between donor agencies and themselves. A serious dysfunctioning of the MRM arises if donors
8 We ignore the awkward problem that, in order to counter the elite’ temptation to embezzle funds, donors should in theory give them a flow payment or rent each period, and this flow should be at least equal to the interest on the one-off embezzlement of stock they could carry out!
The Aid Effectiveness Agenda: The benefits of going ahead
Final Report - Contract nr. 2010/256898 Page 24 of 169
expect their ultimate sponsors to react negatively to news of embezzlement in their projects, for instance, through revocation of funds (Ebrahim 2003: 818). In these circumstances, a donor organization has no incentive to report the acts of malfeasance detected in its projects. This is because it may entertain the hope that other agencies would candidly reveal their own bad experiences, or because it fears that, if it would convey the information, others might not have done it and would then exploit the situation in their own advantage. That the above risk is real is evident from the atmosphere of secrecy that surrounds the activities of many donor organizations, including NGOs. To reduce such a risk, there is no way out of improving the general public’s understanding of aid delivery processes and the possibility of failures, so that honest donors which openly admit of cases of cheating are not unfairly sanctioned to the benefit of more opportunistic ones.
Central funding bureaucracies (such as the European Union or the Cooperation administrations of national governments), rather than the scattered contributors to fund-raising campaigns organized by NGOs, could apparently help tame the opportunism of local elites through indirect measures aimed at donor agencies. One way of achieving coordination would consist of introducing a rating of donor or aid agencies that would be systematically used by these bureaucracies to decide which agencies deserve to be financially supported. But, again, things do not look simple once the question of the yardstick on which to base the rating is raised. Resorting to measures of outputs, such as improvements in the levels of living of the poor inside the communities chosen, is an ideal procedure but is likely be too costly to be feasible, especially in the case of NGOs with their typically diverse and long-term objectives (see Edwards and Hulme 1996; Ebrahim 2003). Moreover, such measures could introduce biases in the selection of communities or countries by the rated agencies. As a matter of fact, the latter would be induced to choose communities/countries in which poverty can be more easily reduced for other reasons than the prevailing power structure (e.g., easy accessibility).
The above discussion suggests another, more feasible criterion, namely the disbursement and monitoring procedures used by donor agencies, as well as the duration of their aid projects. In this perspective, self-reported cases of fraud detection could be considered as indirect evidence of the effectiveness of monitoring activities rather than as signs of failure. Not only are such characteristics rather easy to observe, but they also offer the advantage of not creating perverse incentives for the rated agencies.9 The need for a proper evaluation of aid agencies is all the more pressing as, side by side with serious agencies, there exist careless organizations that do not implement sequential disbursement mechanisms with a view to inducing local elites to better take the interests of the poor into account. Such organizations tend to disburse funds quickly either because they do not have a proper understanding of the one-period game being thus played10, or because they are not single-mindedly pursuing the objective of poverty alleviation. (For example, in spite of all their pro-poor rhetoric, they are also concerned with reproducing themselves as job- and income-providing organizations in the West). Their presence further complicates the problem of ‘elite capture’ not only because it has the effect of increasing the exit options available to local intermediaries but also because it makes the establishment of a MRM among all donor agencies impossible. In fact, in the same way that “bad money chases good money”, the operation of these opportunistic aid agencies risks driving ‘good’ agencies out of business or, else, it will force them to relax or altogether give up their gradual and conditional disbursement procedures. Indeed, if offered the choice, local elites will normally prefer to work with ‘bad’ agencies. And if the latter are numerous enough, ‘good’ agencies will not be able to attract partner communities unless they soften their approach to aid disbursement. 5. The literature that is evidently most appropriate to deal with the issue of aid coordination is the one based on a framework in which several donors and one recipient country interact, such as in Torsvik (2005) and Knack and Rahman (2007). The latter examine how alignment of incentives is affected by the presence of multiple donors that independently provide aid to a poor country. Let us now see in more detail the results that are achieved in these two papers. In Knack and Rahman, attention is focused on the problem of staff recruitment by donors in the recipient countries. Each donor is assumed to maximize the poverty reducing impact of its own projects, and project success is assumed to increase at a decreasing rate with the
9 This is the opposite of evaluations that reward success while punishing failure since those encourage NGOs to exaggerate successes and to refrain from revealing failures (Edwards and Hulme 1996: 189). 10 Imperfect knowledge of the game typically arises when aid agencies tend to underestimate the leverage of the local elite within the group, or to overestimate their degree of altruism as a result of the elite’s cunning ability to deceive them or of their own naivety.
The Aid Effectiveness Agenda: The benefits of going ahead
Final Report - Contract nr. 2010/256898 Page 25 of 169
amount of skilled local staff time dedicated to the project. The authors are then able to compare the optimal level of administrator time devoted to each project when maximization takes place individually with the optimal level when donors seek to jointly maximize the poverty reduction impact of their projects. The central result is the following: the number of administrators who need to be hired declines when the concern of a particular donor for the success of the projects of other donors increases. In other words, lack of coordination leads to excessive donor recruitment of administrators, thus causing unnecessary stress on the demand for scarce (staff) resources in the recipient countries. As for Torsvik, he considers a group of rich countries that independently provide aid to a poor country, and how incentive alignment is affected by the presence of multiple donors when poverty reduction in a recipient country is at stake. Like in Azam and Laffont (2003), the donors’ utility function is comprised of two elements: consumption of their own citizens and consumption of the poor in the recipient country in the South. The latter element reflects their altruism or aversion to poverty wherever it occurs. Since there are several donors, poverty alleviation in the poor country becomes a public good: if one donor provides aid, it has a positive effect on the welfare of all the other donors. As is typical in such situations, non-cooperation between the donors leads to an undersupply of aid. Cooperation or coordination between donors is therefore desirable to bring total aid amount closer to its social optimum. The next question addressed by Torsvik is how foreign aid affects policy in the recipient country. In this country, the utility function of the government has two elements: consumption of the rich and consumption of the poor. It is shown that, if the donors can use enforceable conditional aid contracts to influence the recipient’s policy, they are always better off with coordination than without it. But, in reality, Torsvik believes, the donor-recipient relationship cannot be properly represented with the help of a principal-agent model, and is better viewed as a non-contractible relationship. The key question becomes whether the recipient government can exploit the poverty aversion of the donors to its own advantage, extracting a rent from the situation. Clearly, this government has an incentive to reduce domestic transfers from the rich to the poor when aid for the poor is externally provided, thus giving rise to a crowding-out problem. When enforceable contracts are not available, how does donor coordination affects domestic support for the poor in the recipient country? Torsvik investigates this question by considering two different interaction regimes. First, if the donors do not face a Samaritan dilemma and all of them make simultaneously moves in a non-cooperative game-theoretic setup, donor cooperation has the effect of not only increasing foreign support but also increasing crowding-out. The incomes of the poor increase when donors coordinate their efforts and provide more aid than before, but it is not obvious that the utility of the donors increases as well. This is because their utility is negatively affected by the fall in the consumption of their own citizens, while the positive effect of the increased consumption of the poor in the recipient country, which is not optimal as a result of the crowding-out problem, may be insufficient to compensate the negative effect. In order that donor coordination proves beneficial from the donors’ viewpoint, the government of the recipient country must have enough aversion to poverty to limit the crowding-out problem. If that is not the case, this government will take too much advantage of the donors’ generosity, and the crowding-out problem will be serious causing a fall in the donors’ utility. Alternatively, in a Samaritan dilemma, donors are unable to commit not to help the poor because of their strong aversion to poverty (see above the work of Svensson). The recipient country anticipates and plays upon their knowledge of the donors’ weakness: it reduces its support for its own poor in order to trigger more aid. The donors then act as Stackelberg-followers. In such a setup, donor coordination would again lead to increased aid flows, but not necessarily to more crowding-out. As a consequence, it might be beneficial for donors to cooperate when facing a Samaritan dilemma even if the recipient government puts a low priority on the welfare of the poor. In other words, and this is far from a trivial result, donor coordination is better able to compel recipient governments to take care of the interests of the poor when the donors are unable to commit not to help the poor (so that the game is played sequentially) than when this is not the case (and the game is played simultaneously). This amounts to saying that donor coordination is more helpful when the donors are weaker in their position vis-à-vis the recipient country. Let us sum up. When the recipient country’s government shares the goals of the donors (it is equally averse to poverty), aid coordination is unambiguously beneficial. In the opposite case of diverging interests, however, coordination is not necessarily beneficial if contracts cannot be effectively used to align the interests of the recipient country with those of the donors.
The Aid Effectiveness Agenda: The benefits of going ahead
Final Report - Contract nr. 2010/256898 Page 26 of 169
6. It is noteworthy that in all the above-reviewed literature little or no space is devoted to the transaction cost benefits of aid coordination. This is not because they are deemed to be unimportant but because they are easily understood and do not necessitate the use of rather sophisticated analytical apparatuses. This said, it is important to make two distinctions when addressing the problem of transaction costs. The first distinction concerns the level at which the benefits are reaped, that of the donor or the recipient country, while the second distinction concerns the question as to whether the benefits are in cash or in kind. Benefits are in cash if, for example, coordination allows donor or recipient countries to economize on air flight and hotel expenses because countries can be represented as a group at meetings or aid events instead of each of them having to send their national representatives. If the money thus saved can be earmarked for poverty reduction programmes, the benefits of aid coordination take on the form of increased aid budget. On the other hand, benefits are in kind if aid coordination allows donors and recipient aid administrations to free staff resources. In the case where these newly available resources are used to improve the preparation, monitoring and evaluation of aid projects and programmes, aid coordination will enhance aid effectiveness. But if they are re-directed to other purposes, no effect will be felt at the level of aid programmes. The point could be made that the recipient countries, if aid was better coordinated, could absorb more aid than before thanks to the newly freed staff and other resources. Such an argument should be taken with some caution, however. Recipient countries, particularly those which are relatively badly governed, have a tendency to accept all the aid on offer even though they may not be able to screen and absorb it effectively. Therefore, the easing of resource constraints as a result of better aid coordination is more likely to cause a better utilization of existing aid flows than an increase in these flows. 7. Summing Up. The above review has highlighted a number of benefits that can be generated by aid coordination:
- Aid coordination allows donors to economize on transaction costs, whether they take on the form of money or in kind expenses. - Aid coordination allows a relaxing on the pressure exerted on scarce resources (e.g., staff and administrator resources) that enter as inputs into the aid delivery process within the recipient countries themselves. - Aid coordination could play a positive role if it puts into place a specialized agency or mechanism able to collect more information about the governance characteristics of the potential recipient countries or areas, and to circulate information about fraudulent behavior among donor members. - Aid coordination allows for a more effective implementation of conditionalities to the extent that it results in identical conditions applied uniformly by the donor countries. - Aid coordination could improve aid effectiveness performances if it takes the form of delegation of aid allocation decisions to a specialized agency that has less poverty aversion or is less subject to ‘budget pressure’ than the donor members. The latter’s commitment problem could then be more easily surmounted.
3.2. Aid, governance, and growth
There is a large macro literature on aid and growth, but it has not generated very clear results. This is maybe not surprising in a situation, where aid is given also to achieve goals other than growth. It is also given for poverty reduction or improvements in health and education, as emergency assistance in crises situations or to achieve political or strategic goals, and these interventions are not necessarily growth enhancing. But the effects can of course also be weak because projects and programmes are not working well. In any case it is clear that the links between aid and final results are complex (Bourguignon and Sundberg, 2007).
When it comes to understanding the determinants of growth there is by now a fairly broad consensus in the research community (Hall and Jones, 1999, Kaufmann et al, 1999, Rodrik et al., 2004) that successful
The Aid Effectiveness Agenda: The benefits of going ahead
Final Report - Contract nr. 2010/256898 Page 27 of 169
development depends fundamentally on policies and institutions.11 The explanation of Acemoglu et al. (2001, 2002) is that countries that are rich today are those that had institutions protecting property rights and thus generating a good environment for private investment at the time of the industrial revolution, and therefore could seize the opportunity to industrialize. Besley and Persson (2010) argue that “state capacity” in a broad sense is the key determinant of whether a country can achieve an economic take-off and improve the welfare of its citizens. The listing of the institutional requirements for growth by Rodrik (2000) is representative of the literature on the determinants of development. He argues that sustained economic growth requires institutions that create markets (secure property rights), regulate markets goods, services, labour, and assets (deal with market failures), stabilize markets (fiscal and monetary institutions), and that legitimize markets (protects against idiosyncratic shocks: social security systems and conflict management).
It is not yet very well understood why institutional reforms are successful in some instances but fail in others. The character of institutions and incentives are of course highly path dependent in that they depend on the history of the country (Platteau, 2009). Directly transplanting institutional frameworks from other countries can be problematic, and each country needs to shape institutions in accordance with local circumstances (Rodrik, 2007). From this follows that attempts by donors and international organizations to push for reforms without support from the local leadership can be fruitless, or even counterproductive. An intervention may, for example, force a change in some government policy that seems desirable, at the same time as it undermines the legitimacy of the government as a policy maker.
Aid is increasingly allocated to improve the quality of the public institutions of recipient countries or capacity building. Is this effective, or can there be an aid-institutions paradox? Many argue that political institutions in Africa are poorly suited to promote development because of neo-patrimonial tendencies. There is a risk of private appropriation of state resources for political ends. Elites have acted in a predatory fashion to stay in power. Can aid inflows even be a disincentive to state transformation?
One very important question is whether foreign aid reduces tax collection efforts? Tax effort literature presumes that aid tends to reduce the tax share. Econometric evidence seems to suggest that countries with poor institutions (high corruption) tend to suffer more, but some case studies even find a positive relation instead.
The policy question here is how interventions should be designed to help build effective institutions rather than undercut incentives for good public governance. Can increasing amounts of aid be spent without negative institutional effects? Should aid money be used for other things than traditional types of aid? Maybe one can think about the scope for using aid resources for collective goods such as AIDS, tropical diseases and new crops.
11 There is a range of quality of government indictors that are available, but the most widely used is probably the World Bank Governance Indicators (WGI). This comprises six sub-indices Voice and Accountability, Political Stability and Violence, Government Effectiveness, Rule of Law, Regulatory Quality, and Control of Corruption (See discussion in Kaufmann et al., 2009, Thomas, 2009, .and Kurtz and Shrank, 2007). The WGI is in total made up of 340 variables and covers 212 countries starting in 1996. Annually it is only available from 2002. There is a debate as to how well one can relate quality of governance with outcomes variables. Kurz and Schrank (2007) are concerned about the direction of causality between institutions and growth, and also that perceptions about the quality of governance may be affected by economic conditions. Thomas (2009) is critical against the construction of the WGI and that the data are not fully consistent over time. However, the QoG Institute (2010) has made a study for the EU on quality of governance in Europe and it has compared the quality of alternative indicators for the purpose. They find that the WGI is the best index available empirically and conceptually, although they decide to use only four of the six sub-indices (dropping Political Stability and Violence and Regulatory Quality). So we conclude that it is hard to find an alternative that is clearly better for our purposes than the WGI. The composite index covers many dimensions of governance, and one may alternatively consider using sub-indices.
The Aid Effectiveness Agenda: The benefits of going ahead
Final Report - Contract nr. 2010/256898 Page 28 of 169
Obviously, much of the effect of aid on growth goes via governance variables, but the bulk of research on aid and growth has used reduced form regressions for the analysis. This empirical macro literature has struggled with a series of difficult issues. Should one look at short or long run? How should one handle the endogeneity problems in the aid-growth relationship? How should one control for specific country effects? The regular project evaluation literature suffers from similar problems, but this also needs to deal with the issue of aid fungibility. It is therefore hard to know what value a marginal aid Euro creates. We here give a brief summary of what the macro literature has shown about the link between aid and growth.
The aid relationship consists of resource flows, technical assistance, policy advice and conditions. The character of the relations between the donors and the recipients is important for the effects of aid. The issue of conditions related to aid has been extensively discussed, and the current trend towards increased ownership and the implementation of the Paris agenda, partly reflect dissatisfaction with what has been achieved with the help of the conditions that the multilateral organizations used in relation to the structural adjustment programmes during the 1980s and 1990s (Svensson, 2006, Bigsten, 2007).
Aid affects growth by providing resources which can be invested (or consumed), and it affects the behaviour of the recipient governments. An important question has been to what extent foreign donors really can influence policies and institutions in an effective way through aid flows and conditions. The policy implementation in Africa is hindered by both the lack of skills and lack of incentives to do the right things. For policy reforms to be credible and sustainable they should be based on a democratic process and be supervised by agents of restraint.
The question “does aid work” has many interpretations. One can look at impacts on human development, poverty, politics, democracy etc. But since high per capita incomes are related to high standards of living growth is certainly one important dimension to investigate. To achieve growth countries need to save and invest and have good policies. To answer the question “does aid work” many researchers have therefore investigated if aid increases savings, investments and if it affects policies. The problem has been to find a good approach to identify the effects of aid. To be able to come up with a credible answer you require a credible counterfactual. How had the development been without the aid? This is a tough question to answer.
Analyses of individual projects have often found results to be good. Early macro studies started from the Harrod-Domar model, where the focus is on savings and investments. The focus was then on the computation of financing gaps, that is the shortage of savings required to achieve the planned investment level. According to the review of Arndt et al. (2009) most of the macro studies from this time showed aid to have positive growth effects. However, in a well-known paper Boone (1996) failed to find any significant effect of aid on growth. Burnside and Dollar (2000) found (by interacting the aid variable with a variable for the quality of policy) that there was no generally positive effect of aid on growth, but that there was a significantly positive effect when the policy environment was good. Dalgaard, Hansen and Tarp (2004) also found that aid is differently effective in different policy environments, but that the relationship was more complex than what Burnside and Dollar had assumed. They found positive effects on growth also where policies were bad. Dalgaard et al. found that the introduction of non-linearity in the regression (aid squared) functioned better than Burnside and Dollar's interaction term. Easterly et al. (2004) found that the results did not hold when the data set was extended. A conclusion from a comparison of these and other estimates is that the results tended to be fragile, and for example Roodman (2007) concluded from his review that it was hard to come up with strong results.
A more recent study by Rajan and Subramanian (2008) use advanced econometric techniques. They departed from the much use GMM methods and instead used external instruments and looked at the effects over long periods of time. Their instrumenting strategy is based on donor behaviour and they used colonial characteristics and relative population sizes of donors and recipients and their interactions as instruments to estimate the aid flows of each donor. These are then aggregated over all donors for each country. Then the effect on average growth over a long period is estimated with controls for other growth determinants. They get a positive but not significant sign on the aid variable, and they found that this result held for a range of robustness tests.
The Aid Effectiveness Agenda: The benefits of going ahead
Final Report - Contract nr. 2010/256898 Page 29 of 169
Arndt et al. (2009) use a treatment effects method to analyse aid impacts. They find that the average effect of treatment is positive both for 1970-2000 and 1960-2000. Their conclusion is that the average long-term growth elasticity of the share of aid in GDP is in the span 0.10 to 0.25. They argue that this result combined with the results from micro- and meso-level studies gives a convincing picture of aid as having a positive growth effect.
Some studies have tried to separate different types of aid, which seems reasonable. An excellent study which disaggregates aid is Clemens, Radelet and Bhavani (2004). They focus on one category consisting of budget and balance of payments support plus investments in infrastructure, agriculture and industry, which are expected to have effects on growth also in the short term. They find significantly positive growth effects for this type of aid. Aid for things like health and education can be expected to have a long-term effect on growth, but they are hard to identify in this type of regressions.
Annen and Kosempel (2009) disaggregate growth into TA and Non-TA in a growth regression. They find that the effect of TA is significantly positive, while the effect of other aid is insignificant. Their argument is that TA increases GDP via human capital production. However, they find that the effect of TA declines as donor fragmentation increases. And the effect is dramatic. If donor fragmentation is zero an increase in TA by 50 dollars per capita increases the growth rate by 3 percentage points, which falls to zero if donor fragmentation is average.
Also Minou and Reddy (2009) argue that one reason that has made it hard to find significant relations between aid and growth is that studies use total aid as the explanatory variable. Therefore they try to divide aid into development aid and non-development aid. They hypothesize that aid from large countries tend to be driven by strategic interests to a higher degree than aid from small countries. They find that there is support in the literature for this presumption. They test different selections of countries to be included in the analysis. The narrowest definition includes only the Nordics and the Netherlands. At the next level they also include Austria, Canada, Ireland, Luxembourg and Switzerland, or alternatively Belgium, France, Ireland, Switzerland and the UK. They also have a category for multilateral aid, which they assume to be governed by strategic interests to a smaller degree than the aid from large countries. Then they run regressions in line with those of Rajan and Subramanian (2008), but use their own aid definition. First they do cross-country regressions with assumptions of very long lags, that is the period between the time when aid is disbursed and when it has an effect on growth. They look at average growth 1990-2000 as explained by aid according to their definitions in the period 1960-1990. They find strong positive effects of aid on growth of bilateral aid from the first two groups of countries and a somewhat weaker effect from the third group. Effects of multilateral aid are positive but not significant.
They admit, however, that one needs to be cautious when it comes to the various results from their cross-section regressions. Particularly one could be concerned that the lagged explanatory variable may be a proxy for non-observed country-specific factors. To get around this problem they do panel regressions on five-year intervals. Again they find that aid from the first two categories is significantly positive with a lag. A one per cent increase of aid increases growth by 0.2 percentage points after five years and 0.7 to 1.1 percentage points after 25 years. They discuss whether aid only works during certain periods or in certain policy regimes, but they do not find any strong support for this. Neither do they find that the countries that these donors had had particular luck when it comes to country choice.
They draw the conclusion that aid defined in their fashion has a strong and robust effect on growth in the recipient countries in the long run. You could envisage that aid affects growth by building up infrastructure, creates human capital and develop organizations. They do not discuss in any detail why aid from certain countries seems to have a positive growth effect or what characteristics determine this outcome. You could assume that certain types of aid matter or that is transferred in a certain way, or that aid that is given without having to take strategic interests into account works better.
The Aid Effectiveness Agenda: The benefits of going ahead
Final Report - Contract nr. 2010/256898 Page 30 of 169
Easterly (2006) concludes from his reading of the macro literature that it is hard to support development from the outside, even if he also thinks that some positive things can be done with aid. Easterly is critical of the aid apparatus. He makes a distinction between planners and seekers. His critique is that planners with large plans know too little about what is going on at the grassroots level, and therefore the right plan is to have no plan at all! Easterly argues that donors start from the wrong question. The question should not be what is required to eliminate poverty, but instead one should ask (as the seekers do) what is required to help poor people. He wants to get away from grand visions and approaches, but maybe he makes too subtle a distinction here. Easterly argues that the planners do not search for the interventions that really help the poor, but this is a doubtful proposition. This is what almost everybody in the aid business is trying to do – although with varying success. He further argues that it is counterproductive to set up targets for implementation. This is also hard to see. Another of Easterly’s arguments is that it is an illusion to believe that the West can transform complex countries with a completely different history and culture to its own mirror-image. Here he has a point, of course. The purpose of European aid has in practice been to try to convert developing countries to something that is similar to Europe.
Easterly wants to give the seekers at the grassroots level more money and manpower. However, it is not self-evident that for example small NGO projects have larger effects on poverty than regular aid. Easterly certainly has a point when he argues that you do not necessarily have to collaborate with governments to help poor people. Donors could experiment more. Aid money could, for example, be used to set up a development bank, which then could act independently of the government and be part of the civil society. It could then for example put pressure on the government to behave correctly against business. To establish such a project one would not require excessive coordination with the authorities.
Easterly (2009) develops his critical views on how the aid process works, and one main point is that there is lack of learning in aid. His is critical against high flying ambitions in development assistance, that is the desire to support radical and comprehensive changes to whole systems.
Easterly acknowledges that emergence of impact evaluation has improved evaluation quality, but the most important thing according to Easterly is that they have shifted the focus towards a one step at a time mindset and that donors should evaluate each step before proceeding further. But he also says that it seems as if the promising beginning has petered out. He argues that researcher do heroic extrapolations from results based on very small samples in special environments and without having any behavioural model as a basis for their conclusions. They are also dogmatic and unwilling to accept other sources of results such as standard econometric studies or case studies or stylized facts and at least some results from cross-section analyses.
Easterly (2009) admits that the results of analyses of large programmes will never be definitive, but he argues that the results clearly have been below expectations. He believes that this is the reason for the escalation of intervention ambitions. When you don’t get the expected results you add another dimension. Aid to Africa has over time addressed greater and greater problems all the way up the full scale reconstruction of whole countries or to the creation of peace where there has been civil war. Easterly thinks that donors should be more modest and humble in their ambitions and if they were reduced donors could do more good. He argues that there have been too high hopes as to what can be achieved through interventions from abroad, and maybe also an underestimation of what poor countries can achieve on its the basis of its own strength.
However, when Easterly is trying to become more concrete he actually becomes rather conventional. He wants to give the poor of the world access to a series of good things like vaccine, education, fertilizers, and clean water, which is well in line with what aid has been doing since it started. He then goes on to argue that all aid should not go to projects, but that donors should also try to spread knowledge about how one gets markets to work or reforms the public sector. Also these suggestions are mainstream. He wants all projects to be evaluated, and that one then should draw conclusions on the basis of the results of these evaluations. He emphasizes repeatedly that donors should not have a great plan, but try to create space for the seekers. It is not completely clear how that one should achieve these things. Somewhere someone has
The Aid Effectiveness Agenda: The benefits of going ahead
Final Report - Contract nr. 2010/256898 Page 31 of 169
to take decisions in some organized fashion. He further argues very strongly that one should try to make sure that there is a feedback mechanism from the poor to the donors, but this is not all that easy to fix either. His main point is that poverty can only be eliminated if poor people and societies help themselves and borrow institutions and ideas from the West when it suits them. At the same time aid should be used to help the extremely poor and that should be enough.
Summing up
It must be admitted that it has not been possible to establish unquestionable relationships between aid and growth from macro studies, at the same time as micro studies seem to suggest that it often works. Still, it seems clear that aid can at least contribute to development, although there are results which show that when aid to a country exceeds a certain share of GDP the growth effect declines. The reason for this may be that the government through which one tries to channel aid is either inefficient or corrupt. If one want to increase aid in such a situation one may have to consider how this could best be done. It is for example administratively demanding to channel aid in project form that requires a lot of detailed decisions and steering. It therefore seems reasonable to use more general forms or alternatively to channel aid outside the state apparatus. The two main conclusions we draw from this literature are thus that general forms of aid are preferable when channelled to governments and that there are declining returns to scale of aid. We will do our own analysis about the effect of aid modalities a la the Paris Declaration (Chapter 10).
The Aid Effectiveness Agenda: The benefits of going ahead
Final Report - Contract nr. 2010/256898 Page 32 of 169
4. Aid coordination: A conceptual framework
4.1. A simple framework to analyze the effects of aid coordination
When analyzing the social profitability of aid coordination, several dimensions must be taken into consideration which correspond to the potential costs and benefits involved. The benefits for the donor countries consist of (i) cost savings and (ii) the greater effectiveness with which they can achieve their development objectives in the beneficiary countries. The former, cost savings effect of better aid coordination, are expected to result from a substantial reduction in the individually borne transaction costs accompanying the various steps involved in the aid delivery process: exploratory missions, negotiations, delivery, monitoring, follow up, and evaluation. They are often the consequence of scale and scope economies reaped at these various stages. As for the latter, more indirect benefits, they are expected to follow from improvements in the governance of recipient countries as a result of more effective implementation of conditionalities and better monitoring of aid uses, on the one hand, and higher levels of ownership and transparency, on the other hand. We will therefore refer to these benefits as the governance effect of aid coordination. Turning now to the costs entailed by coordination efforts, they essentially consist of (iii) the loss of national sovereignty and the diminished ability to pursue national objectives through aid programs. We label them the political costs of aid coordination.
The governance effect deserves some more attention since it is a less apparent benefit of better aid coordination than transaction cost savings. The underlying idea becomes clear as soon as one realizes that governance can be conceived as a public good. To begin with, we look at this issue through the viewpoint of a conditionality mechanism. If a country is alone in imposing conditions aimed at improving the governance of a recipient country, the benefit from conditionality is likely to be small because the recipient country will be easily able to circumvent these conditions by turning to other, more lenient donor countries. Under such circumstances, the cost of conditionality will most probably exceed the benefit for the conditionality-imposing country which will therefore forsake its strategy. To overcome that obstacle, there must obviously be a sufficiently large group of donor countries willing to engage in the governance-improving process, thus lending it a collective character.
To illustrate how additional contributors to the conditionality process increase the effectiveness of the mechanism, consider the so-called Multilateral Reputation Mechanism (MRM). When the recipient country violates some conditions accompanying aid provision, the MRM ensures that information about rule violation is transmitted among members of the information-pooling group. These will then be able to react, say by suspending aid to the wayward country or imposing some form of biting sanction. The larger the information-pooling group the stronger the governance-improving pressure exerted upon the recipient country. Or, in the other way around, the larger this group and the more extended the MRM, the fewer the possibilities for the recipient country to escape toward another donor uninformed or unconcerned about failing governance.
In fact, the conditionality mechanism resembles a coordination game in the sense that there exists a critical threshold of players beyond which it becomes individually profitable for each participating player to bear the cost of collective action or contribution to the public good. All that is needed is that the individual benefit increases with the number of contributors: if the cost of individual contribution is constant, there will necessarily be a critical number of contributors such that the individual benefit starts exceeding the individual cost of participating in the production of the public good, in this case the implementation of a conditionality mechanism.
Precisely the same point can be made in regard of ownership and transparency, two critical dimensions of the Paris agenda. It can indeed be argued that the incentive for a recipient country to define its own priorities in a clear manner is enhanced when it negotiates with donor countries as a group rather than separately with each of them. This is because, in the latter eventuality, there is a great temptation to tailor development objectives to the perceived preferences of each donor so as to extract maximum rents. When,
The Aid Effectiveness Agenda: The benefits of going ahead
Final Report - Contract nr. 2010/256898 Page 33 of 169
on the other hand, a sufficiently large group of donor countries deals with the recipient country and invites it to define its development priorities and strategies, the latter is better induced to achieve internal consistency in the process of defining these priorities and objectives. Transparency is likewise improved when more donor countries share information and act cohesively to prompt the recipient country to precise and publicize its objectives and the results achieved as a result of aid efforts. We may conveniently conceptualize the benefits of all the indirect governance effects of development aid, −increased levels of corruption control, ownership, and transparency− as the effectiveness with which poverty is being alleviated in the recipient countries. This means that the poor are better targeted and/or that the designed policies are more effective in achieving their aims.
Unfortunately, the aforementioned benefits in terms of ownership and transparency should not be taken as automatically granted. For example, we may not exclude the possibility that donors will be perceived as “ganging up” to pre-determine country strategies with the result that country ownership on the part of the recipient government is negatively affected. Moreover, better accountability mechanisms between donors and recipient-partner governments may possibly undermine the domestic accountability of the latter, if there is the feeling that responsibility for the strategy and for its possible failures rests mainly on the coordinating donors. These remarks actually show that for donor coordination to yield the positive governance effects assumed in this report and in the reasoning below, careful thought ought to be given to the modalities of aid coordination and the precise design of the donors’ intervention.
Let us now illustrate the above argument with the help of a simple framework. Assume that there are N players and implementing aid coordination (the public good) yields individual benefits to each member of the group equal to b(m), where m stands for the number of voluntary contributors. Each contributor incurs a fixed cost of c units and, therefore, the total cost for the group is equal to cxm. The choice facing player i can then be represented as in Figure 1 below. Assume that the returns to the provision of the public good are positive, in the sense that the individual benefit b(m) always increases with m: δb(m)/δm > 0.12 This appears to be a natural assumption to make when the coordination problem is about coordinating aid efforts. To begin with, let us also assume the existence of increasing returns to scale in the provision of the public good (the coordination benefits in this instance) over the whole range of possible participants: δ2b(m)/δm2 > 0. We further and crucially assume that b(1) - c < 0, implying that, if no other country imposes conditionality, a particular country will never find it profitable to do it alone. This said, there exists a critical number of countries, m*, such that b(m*) – c > b(m*-1), or c < b(m*) - b(m*-1): once a certain number of other players agree to contribute to the governance-improving effort through conditionality, a particular country has an incentive to follow suit since the cost of individual contribution is less than the marginal individual benefit of that contribution. In other words, as long as at least m* other players contribute, a particular country prefers to join the collective effort to free riding.
In such a game, there are two possible (Nash) equilibria (in pure strategies): no coordination takes place or every country agrees to join a coordination scheme. The two possibilities arise because we are in a so-called Assurance Game. As a matter of fact, if a particular country expects that no other country will join the aid coordinating effort, it will not contribute either, yet if it expects that a sufficiently large number of other countries are ready to contribute, it will also contribute, and this corresponds to the efficient outcome.
It must be pointed out that the same coordination mechanism as that highlighted above is at work for transaction cost savings: the more numerous the countries who participate in the process of aid coordination the smaller the transaction costs borne individually by each of them.
Figure 1: Payoffs to players in a coordination game
12 It is immaterial whether the returns are increasing or decreasing (whether the second derivative is positive or negative) as long as the first derivative is always positive.
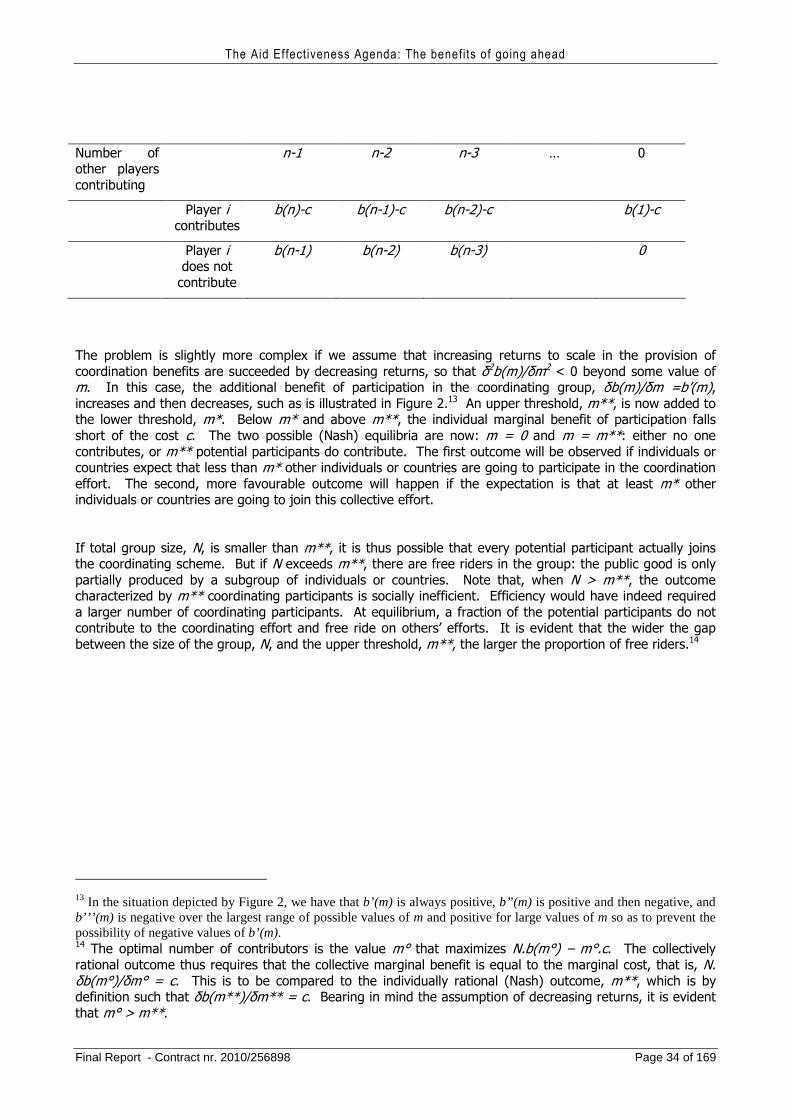
The Aid Effectiveness Agenda: The benefits of going ahead
Final Report - Contract nr. 2010/256898 Page 34 of 169
The problem is slightly more complex if we assume that increasing returns to scale in the provision of coordination benefits are succeeded by decreasing returns, so that δ2b(m)/δm2 < 0 beyond some value of m. In this case, the additional benefit of participation in the coordinating group, δb(m)/δm =b’(m), increases and then decreases, such as is illustrated in Figure 2.13 An upper threshold, m**, is now added to the lower threshold, m*. Below m* and above m**, the individual marginal benefit of participation falls short of the cost c. The two possible (Nash) equilibria are now: m = 0 and m = m**: either no one contributes, or m** potential participants do contribute. The first outcome will be observed if individuals or countries expect that less than m* other individuals or countries are going to participate in the coordination effort. The second, more favourable outcome will happen if the expectation is that at least m* other individuals or countries are going to join this collective effort.
If total group size, N, is smaller than m**, it is thus possible that every potential participant actually joins the coordinating scheme. But if N exceeds m**, there are free riders in the group: the public good is only partially produced by a subgroup of individuals or countries. Note that, when N > m**, the outcome characterized by m** coordinating participants is socially inefficient. Efficiency would have indeed required a larger number of coordinating participants. At equilibrium, a fraction of the potential participants do not contribute to the coordinating effort and free ride on others’ efforts. It is evident that the wider the gap between the size of the group, N, and the upper threshold, m**, the larger the proportion of free riders.14
13 In the situation depicted by Figure 2, we have that b’(m) is always positive, b”(m) is positive and then negative, and b’’’(m) is negative over the largest range of possible values of m and positive for large values of m so as to prevent the possibility of negative values of b’(m). 14 The optimal number of contributors is the value m° that maximizes N.b(m°) – m°.c. The collectively rational outcome thus requires that the collective marginal benefit is equal to the marginal cost, that is, N. δb(m°)/δm° = c. This is to be compared to the individually rational (Nash) outcome, m**, which is by definition such that δb(m**)/δm** = c. Bearing in mind the assumption of decreasing returns, it is evident that m° > m**.
Number of other players contributing
n-1 n-2 n-3 … 0
Player i contributes
b(n)-c b(n-1)-c b(n-2)-c b(1)-c
Player i does not
contribute
b(n-1) b(n-2) b(n-3) 0
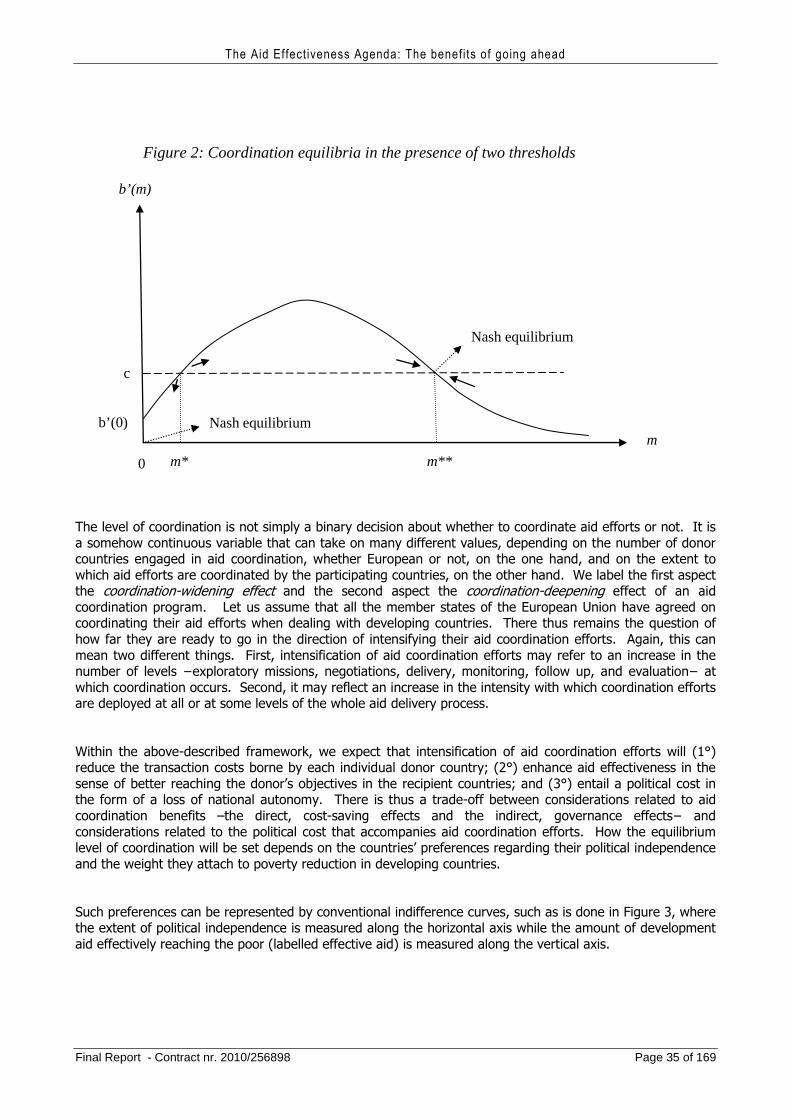
The Aid Effectiveness Agenda: The benefits of going ahead
Final Report - Contract nr. 2010/256898 Page 35 of 169
The level of coordination is not simply a binary decision about whether to coordinate aid efforts or not. It is a somehow continuous variable that can take on many different values, depending on the number of donor countries engaged in aid coordination, whether European or not, on the one hand, and on the extent to which aid efforts are coordinated by the participating countries, on the other hand. We label the first aspect the coordination-widening effect and the second aspect the coordination-deepening effect of an aid coordination program. Let us assume that all the member states of the European Union have agreed on coordinating their aid efforts when dealing with developing countries. There thus remains the question of how far they are ready to go in the direction of intensifying their aid coordination efforts. Again, this can mean two different things. First, intensification of aid coordination efforts may refer to an increase in the number of levels −exploratory missions, negotiations, delivery, monitoring, follow up, and evaluation− at which coordination occurs. Second, it may reflect an increase in the intensity with which coordination efforts are deployed at all or at some levels of the whole aid delivery process.
Within the above-described framework, we expect that intensification of aid coordination efforts will (1°) reduce the transaction costs borne by each individual donor country; (2°) enhance aid effectiveness in the sense of better reaching the donor’s objectives in the recipient countries; and (3°) entail a political cost in the form of a loss of national autonomy. There is thus a trade-off between considerations related to aid coordination benefits –the direct, cost-saving effects and the indirect, governance effects− and considerations related to the political cost that accompanies aid coordination efforts. How the equilibrium level of coordination will be set depends on the countries’ preferences regarding their political independence and the weight they attach to poverty reduction in developing countries.
Such preferences can be represented by conventional indifference curves, such as is done in Figure 3, where the extent of political independence is measured along the horizontal axis while the amount of development aid effectively reaching the poor (labelled effective aid) is measured along the vertical axis.
Figure 2: Coordination equilibria in the presence of two thresholds
m** m*
c
m
b’(m)
Nash equilibrium
Nash equilibrium
0
b’(0)
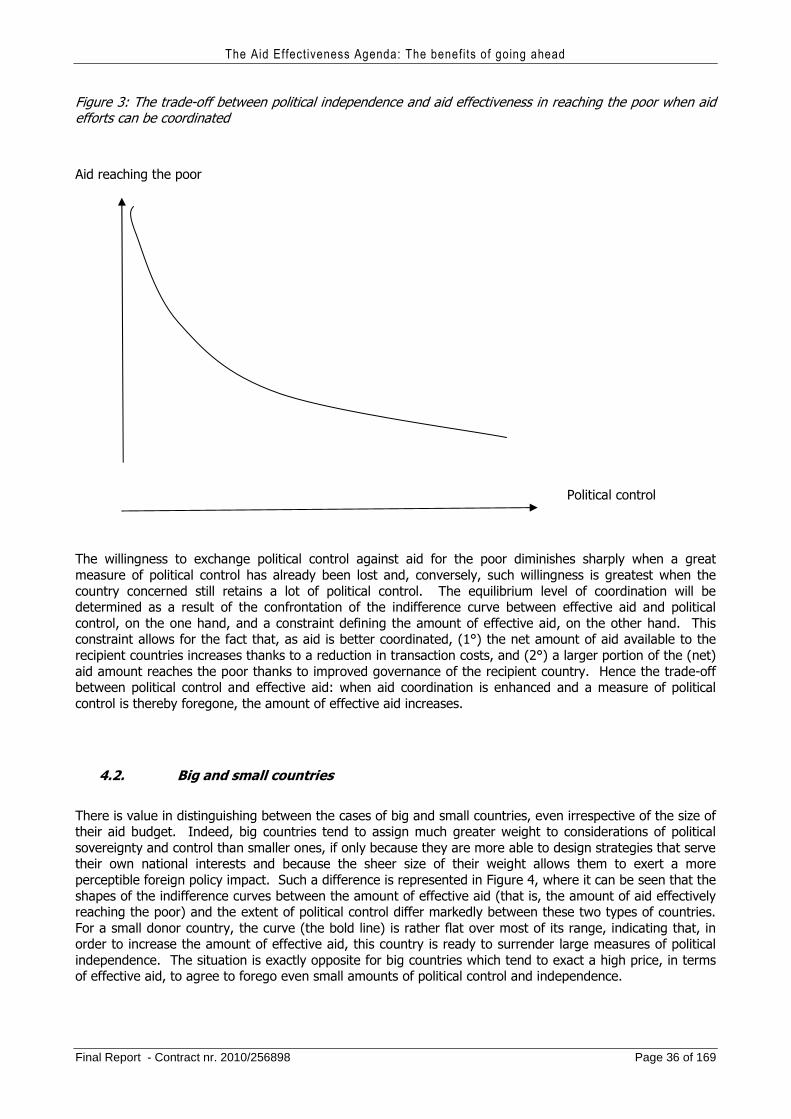
The Aid Effectiveness Agenda: The benefits of going ahead
Final Report - Contract nr. 2010/256898 Page 36 of 169
Figure 3: The trade-off between political independence and aid effectiveness in reaching the poor when aid efforts can be coordinated
Aid reaching the poor
Political control
The willingness to exchange political control against aid for the poor diminishes sharply when a great measure of political control has already been lost and, conversely, such willingness is greatest when the country concerned still retains a lot of political control. The equilibrium level of coordination will be determined as a result of the confrontation of the indifference curve between effective aid and political control, on the one hand, and a constraint defining the amount of effective aid, on the other hand. This constraint allows for the fact that, as aid is better coordinated, (1°) the net amount of aid available to the recipient countries increases thanks to a reduction in transaction costs, and (2°) a larger portion of the (net) aid amount reaches the poor thanks to improved governance of the recipient country. Hence the trade-off between political control and effective aid: when aid coordination is enhanced and a measure of political control is thereby foregone, the amount of effective aid increases.
4.2. Big and small countries
There is value in distinguishing between the cases of big and small countries, even irrespective of the size of their aid budget. Indeed, big countries tend to assign much greater weight to considerations of political sovereignty and control than smaller ones, if only because they are more able to design strategies that serve their own national interests and because the sheer size of their weight allows them to exert a more perceptible foreign policy impact. Such a difference is represented in Figure 4, where it can be seen that the shapes of the indifference curves between the amount of effective aid (that is, the amount of aid effectively reaching the poor) and the extent of political control differ markedly between these two types of countries. For a small donor country, the curve (the bold line) is rather flat over most of its range, indicating that, in order to increase the amount of effective aid, this country is ready to surrender large measures of political independence. The situation is exactly opposite for big countries which tend to exact a high price, in terms of effective aid, to agree to forego even small amounts of political control and independence.
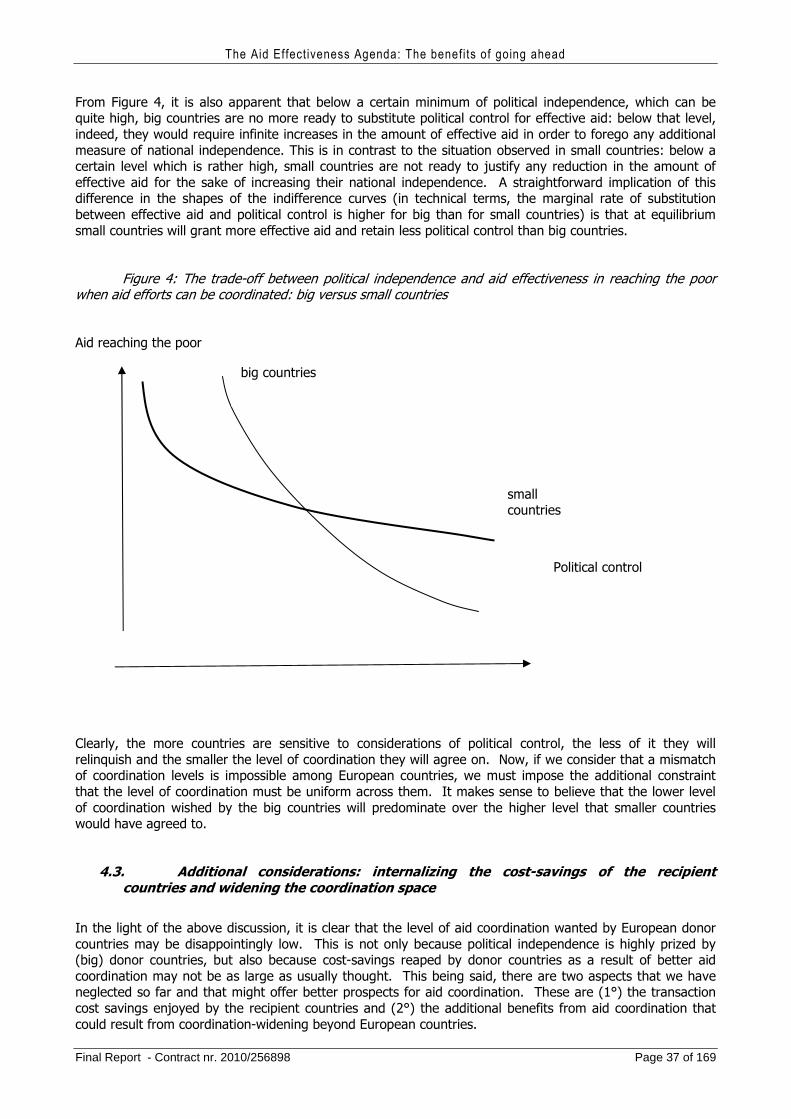
The Aid Effectiveness Agenda: The benefits of going ahead
Final Report - Contract nr. 2010/256898 Page 37 of 169
From Figure 4, it is also apparent that below a certain minimum of political independence, which can be quite high, big countries are no more ready to substitute political control for effective aid: below that level, indeed, they would require infinite increases in the amount of effective aid in order to forego any additional measure of national independence. This is in contrast to the situation observed in small countries: below a certain level which is rather high, small countries are not ready to justify any reduction in the amount of effective aid for the sake of increasing their national independence. A straightforward implication of this difference in the shapes of the indifference curves (in technical terms, the marginal rate of substitution between effective aid and political control is higher for big than for small countries) is that at equilibrium small countries will grant more effective aid and retain less political control than big countries.
Figure 4: The trade-off between political independence and aid effectiveness in reaching the poor when aid efforts can be coordinated: big versus small countries
Aid reaching the poor
Political control
Clearly, the more countries are sensitive to considerations of political control, the less of it they will relinquish and the smaller the level of coordination they will agree on. Now, if we consider that a mismatch of coordination levels is impossible among European countries, we must impose the additional constraint that the level of coordination must be uniform across them. It makes sense to believe that the lower level of coordination wished by the big countries will predominate over the higher level that smaller countries would have agreed to.
4.3. Additional considerations: internalizing the cost-savings of the recipient countries and widening the coordination space
In the light of the above discussion, it is clear that the level of aid coordination wanted by European donor countries may be disappointingly low. This is not only because political independence is highly prized by (big) donor countries, but also because cost-savings reaped by donor countries as a result of better aid coordination may not be as large as usually thought. This being said, there are two aspects that we have neglected so far and that might offer better prospects for aid coordination. These are (1°) the transaction cost savings enjoyed by the recipient countries and (2°) the additional benefits from aid coordination that could result from coordination-widening beyond European countries.
small countries
big countries
The Aid Effectiveness Agenda: The benefits of going ahead
Final Report - Contract nr. 2010/256898 Page 38 of 169
To begin with, two kinds of cost-savings are expected to follow from aid coordination by donor countries: those that accrue to the donor countries themselves, and those that accrue to the recipient countries. If donor countries internalize the latter in their cost-benefit calculus, aid coordination will appear more profitable to them. This is all the more so as, given the scarcity of high-level staff personnel in poor countries, such cost-savings are especially valuable. It is true that there are also disadvantages caused by intensified aid coordination for the recipient country. In particular, a loss of sovereignty or ‘ownership’ is suffered as a result of the more rigorous implementation of conditionalities by coordinated donors. This is actually the analogue of the loss of political independence endured by donor countries. We nevertheless choose to ignore this aspect on the ground that it does not necessarily serve the interests of the poor who are the target of development aid. On the contrary, it is presumed that the more rigorous implementation of aid coordination works in favour of the poor, through effects on governance, ownership, and transparency.
There is then the issue of the widening of the coordination space through the addition of non-European donor countries operating in the same recipient countries as the European countries. If there are increasing returns to the provision of coordination, we expect that such widening will bring additional benefits to the donor countries participating in the coordination scheme. Because of the emergence of new donor countries (China, Saudi Arabia, Brazil, etc.) or organizations (private foundations), European countries now hold a diminishing part of the aid share in many developing countries and, therefore, these additional benefits must actually be quite significant. They ought not to be over-estimated, however. As a matter of fact, the assumption of increasing returns is likely to be over-optimistic as far as some big new actors in the “aid market” are concerned. Instead of the Assurance Game posited above, the game with external aid donor agencies may resemble a Prisoner’s Dilemma. This means that such agencies may be better off free riding on the coordination efforts of other donors than joining these efforts to reduce transaction costs and improve conditionality. The reason may lie in geo-strategic considerations, in the priority given to the objective of acquiring a large part of the local “aid market” thanks to more lenient conditions, in the short-term horizon of the donor, or in a poor understanding of the advantages of aid coordination.15
In the latter part of this analysis, we present a simple formalization of the whole argument so as to bring the underlying formal apparatus to light. This part can be skipped by the readers rebuffed by the use of algebra, yet they should keep in mind the main policy implications that can be drawn from the exercise, which are summarized in Proposition 1 below.
Proposition 1: The incentive to coordinate aid efforts increases (1°) when a country can rely on more fellow donor countries to form a coordinating club, (2°) when it has a smaller aid budget, and (3°) when it has a stronger preference for poverty reduction compared to considerations of national sovereignty and prestige.
While the first and third effects do not require elucidation, the second one means that countries with smaller aid budgets are more interested in aid coordination. This is because the transaction costs of aid delivery represent a larger share of their budgets so that one unit of cost savings obtained through aid coordination has a higher value for them.
Note that, in the model discussed below, we abstract away from all strategic interactions internal to the European Union. We indeed assume that as a corporate body the EU has succeeded in persuading all
15 In a recent article of The Economist, we thus read that “many African leaders have embraced the Chinese, especially when offered vast loans for infrastructure projects. By contrast, the leaders say, Western governments these days offer little more than lectures on good governance”. Yet, it would seem that “growing numbers of Africans are turning against the saviours from the East”, in part because the Chinese too often indulge in corrupt practices in collusion with local officials and inspectors (Leader “Rumble in the jungle”, April 23rd-29th 2011).
The Aid Effectiveness Agenda: The benefits of going ahead
Final Report - Contract nr. 2010/256898 Page 39 of 169
member states to participate in an aid-coordinating scheme. States may nevertheless choose the level of intensity with which they will coordinate their aid efforts with those of the other member states. Because we also make the simplifying assumption that all member states are identical, there is nevertheless a unique optimal intensity of aid coordination. Given the practical importance of heterogeneity of member states, we will briefly discuss, after presenting the base model, the case of aid coordination when countries have different characteristics. Here, the main lesson is that stated in Proposition 2.
Proposition 2: If an association of countries such as the European Union chooses to align its aid coordination effort on the basis of its bigger member states, which are less inclined to coordinate in view of their larger aid budgets and their stronger preference for the preservation of national sovereignty, it is possible that aid effectiveness (measured by the proportion of aid reaching the poor) will be lower than if aid coordination efforts were limited to the subgroup of comparatively small countries. However, it is likely that the total absolute amount of aid accruing to the poor will be larger under the first scenario, thus giving rise to a trade-off between governance quality and poverty reduction.
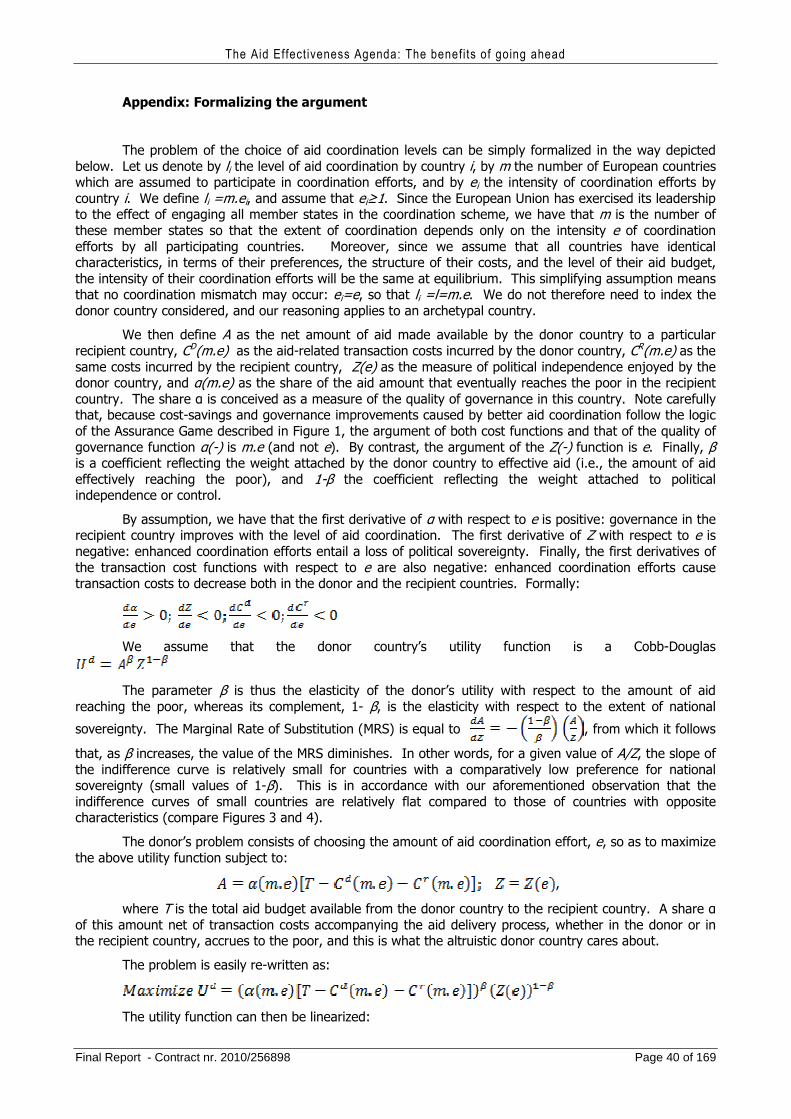
The Aid Effectiveness Agenda: The benefits of going ahead
Final Report - Contract nr. 2010/256898 Page 40 of 169
Appendix: Formalizing the argument
The problem of the choice of aid coordination levels can be simply formalized in the way depicted below. Let us denote by li the level of aid coordination by country i, by m the number of European countries which are assumed to participate in coordination efforts, and by ei the intensity of coordination efforts by country i. We define li =m.ei, and assume that ei≥1. Since the European Union has exercised its leadership to the effect of engaging all member states in the coordination scheme, we have that m is the number of these member states so that the extent of coordination depends only on the intensity e of coordination efforts by all participating countries. Moreover, since we assume that all countries have identical characteristics, in terms of their preferences, the structure of their costs, and the level of their aid budget, the intensity of their coordination efforts will be the same at equilibrium. This simplifying assumption means that no coordination mismatch may occur: ei=e, so that li =l=m.e. We do not therefore need to index the donor country considered, and our reasoning applies to an archetypal country.
We then define A as the net amount of aid made available by the donor country to a particular recipient country, CD(m.e) as the aid-related transaction costs incurred by the donor country, CR(m.e) as the same costs incurred by the recipient country, Z(e) as the measure of political independence enjoyed by the donor country, and α(m.e) as the share of the aid amount that eventually reaches the poor in the recipient country. The share α is conceived as a measure of the quality of governance in this country. Note carefully that, because cost-savings and governance improvements caused by better aid coordination follow the logic of the Assurance Game described in Figure 1, the argument of both cost functions and that of the quality of governance function α(-) is m.e (and not e). By contrast, the argument of the Z(-) function is e. Finally, β is a coefficient reflecting the weight attached by the donor country to effective aid (i.e., the amount of aid effectively reaching the poor), and 1-β the coefficient reflecting the weight attached to political independence or control.
By assumption, we have that the first derivative of α with respect to e is positive: governance in the recipient country improves with the level of aid coordination. The first derivative of Z with respect to e is negative: enhanced coordination efforts entail a loss of political sovereignty. Finally, the first derivatives of the transaction cost functions with respect to e are also negative: enhanced coordination efforts cause transaction costs to decrease both in the donor and the recipient countries. Formally:
We assume that the donor country’s utility function is a Cobb-Douglas
The parameter β is thus the elasticity of the donor’s utility with respect to the amount of aid reaching the poor, whereas its complement, 1- β, is the elasticity with respect to the extent of national
sovereignty. The Marginal Rate of Substitution (MRS) is equal to , from which it follows
that, as β increases, the value of the MRS diminishes. In other words, for a given value of A/Z, the slope of the indifference curve is relatively small for countries with a comparatively low preference for national sovereignty (small values of 1-β). This is in accordance with our aforementioned observation that the indifference curves of small countries are relatively flat compared to those of countries with opposite characteristics (compare Figures 3 and 4).
The donor’s problem consists of choosing the amount of aid coordination effort, e, so as to maximize the above utility function subject to:
,
where T is the total aid budget available from the donor country to the recipient country. A share α of this amount net of transaction costs accompanying the aid delivery process, whether in the donor or in the recipient country, accrues to the poor, and this is what the altruistic donor country cares about.
The problem is easily re-written as:
The utility function can then be linearized:
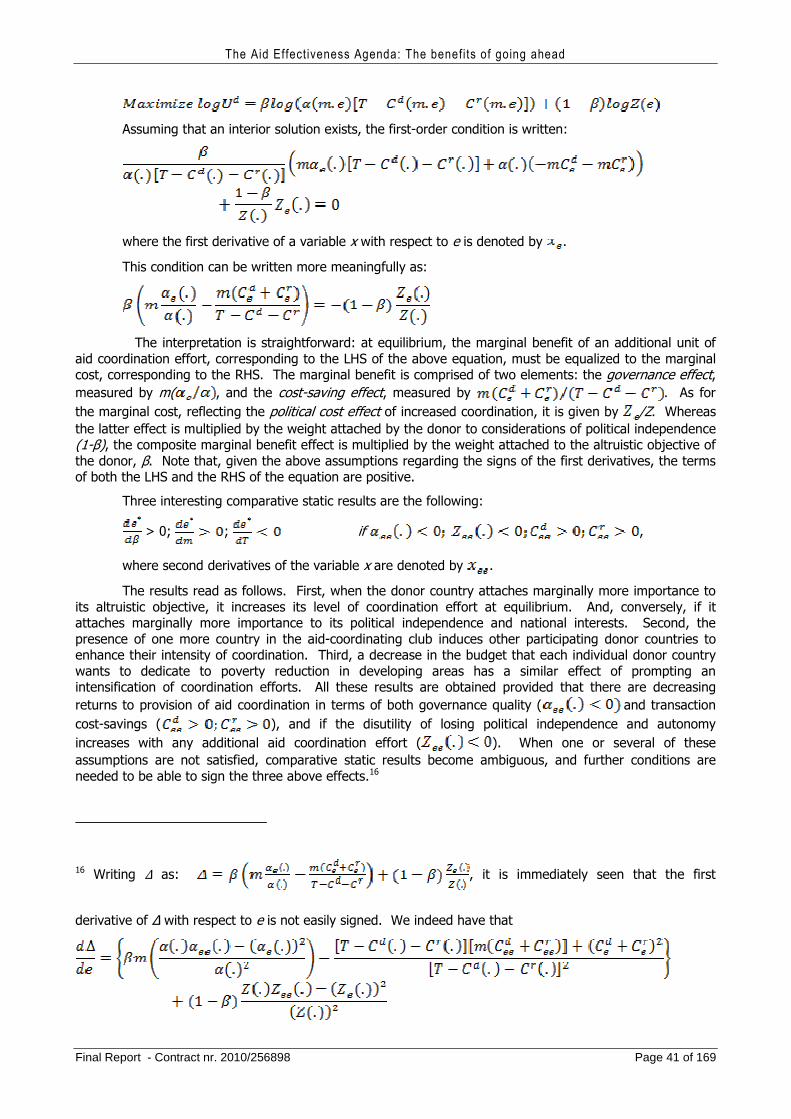
The Aid Effectiveness Agenda: The benefits of going ahead
Final Report - Contract nr. 2010/256898 Page 41 of 169
Assuming that an interior solution exists, the first-order condition is written:
where the first derivative of a variable x with respect to e is denoted by .
This condition can be written more meaningfully as:
The interpretation is straightforward: at equilibrium, the marginal benefit of an additional unit of aid coordination effort, corresponding to the LHS of the above equation, must be equalized to the marginal cost, corresponding to the RHS. The marginal benefit is comprised of two elements: the governance effect, measured by m( , and the cost-saving effect, measured by . As for the marginal cost, reflecting the political cost effect of increased coordination, it is given by /Z. Whereas the latter effect is multiplied by the weight attached by the donor to considerations of political independence (1-β), the composite marginal benefit effect is multiplied by the weight attached to the altruistic objective of the donor, β. Note that, given the above assumptions regarding the signs of the first derivatives, the terms of both the LHS and the RHS of the equation are positive.
Three interesting comparative static results are the following:
> 0; ; if ,
where second derivatives of the variable x are denoted by .
The results read as follows. First, when the donor country attaches marginally more importance to its altruistic objective, it increases its level of coordination effort at equilibrium. And, conversely, if it attaches marginally more importance to its political independence and national interests. Second, the presence of one more country in the aid-coordinating club induces other participating donor countries to enhance their intensity of coordination. Third, a decrease in the budget that each individual donor country wants to dedicate to poverty reduction in developing areas has a similar effect of prompting an intensification of coordination efforts. All these results are obtained provided that there are decreasing returns to provision of aid coordination in terms of both governance quality ( and transaction cost-savings ( ), and if the disutility of losing political independence and autonomy increases with any additional aid coordination effort ( ). When one or several of these assumptions are not satisfied, comparative static results become ambiguous, and further conditions are needed to be able to sign the three above effects.16
16 Writing Δ as: , it is immediately seen that the first
derivative of ∆ with respect to e is not easily signed. We indeed have that
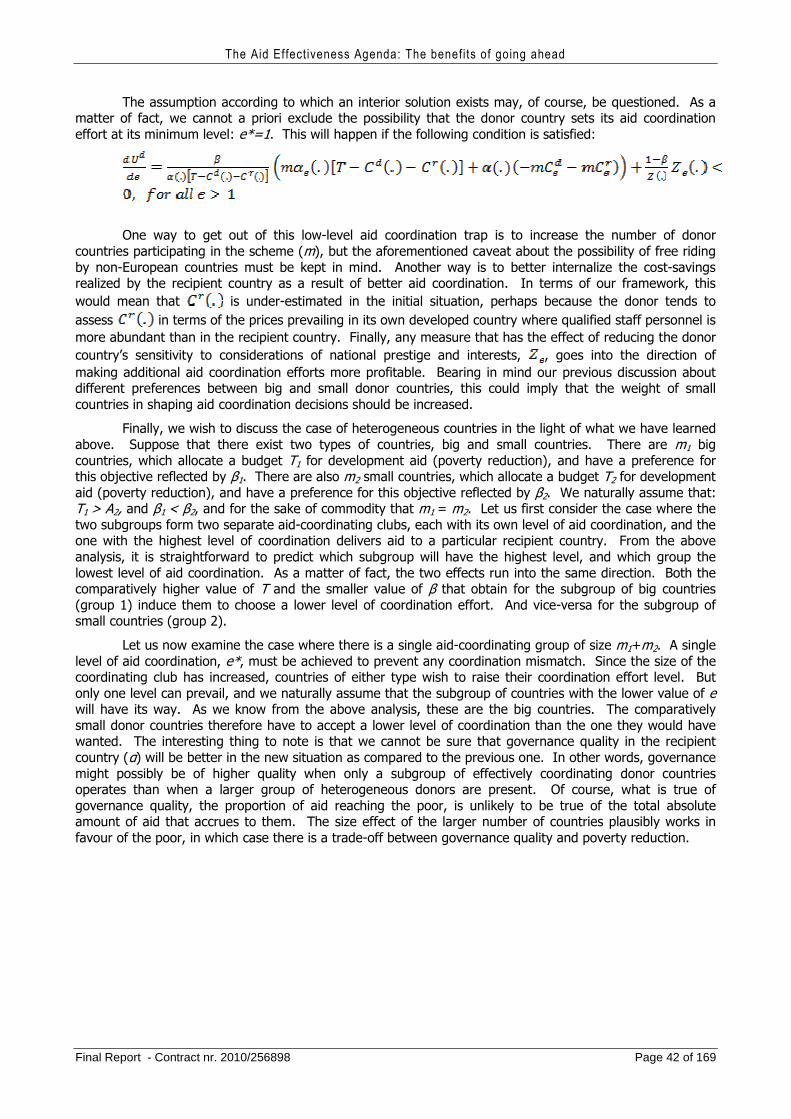
The Aid Effectiveness Agenda: The benefits of going ahead
Final Report - Contract nr. 2010/256898 Page 42 of 169
The assumption according to which an interior solution exists may, of course, be questioned. As a matter of fact, we cannot a priori exclude the possibility that the donor country sets its aid coordination effort at its minimum level: e*=1. This will happen if the following condition is satisfied:
One way to get out of this low-level aid coordination trap is to increase the number of donor countries participating in the scheme (m), but the aforementioned caveat about the possibility of free riding by non-European countries must be kept in mind. Another way is to better internalize the cost-savings realized by the recipient country as a result of better aid coordination. In terms of our framework, this would mean that is under-estimated in the initial situation, perhaps because the donor tends to assess in terms of the prices prevailing in its own developed country where qualified staff personnel is more abundant than in the recipient country. Finally, any measure that has the effect of reducing the donor country’s sensitivity to considerations of national prestige and interests, , goes into the direction of making additional aid coordination efforts more profitable. Bearing in mind our previous discussion about different preferences between big and small donor countries, this could imply that the weight of small countries in shaping aid coordination decisions should be increased.
Finally, we wish to discuss the case of heterogeneous countries in the light of what we have learned above. Suppose that there exist two types of countries, big and small countries. There are m1 big countries, which allocate a budget T1 for development aid (poverty reduction), and have a preference for this objective reflected by β1. There are also m2 small countries, which allocate a budget T2 for development aid (poverty reduction), and have a preference for this objective reflected by β2. We naturally assume that: T1 > A2, and β1 < β2, and for the sake of commodity that m1 = m2. Let us first consider the case where the two subgroups form two separate aid-coordinating clubs, each with its own level of aid coordination, and the one with the highest level of coordination delivers aid to a particular recipient country. From the above analysis, it is straightforward to predict which subgroup will have the highest level, and which group the lowest level of aid coordination. As a matter of fact, the two effects run into the same direction. Both the comparatively higher value of T and the smaller value of β that obtain for the subgroup of big countries (group 1) induce them to choose a lower level of coordination effort. And vice-versa for the subgroup of small countries (group 2).
Let us now examine the case where there is a single aid-coordinating group of size m1+m2. A single level of aid coordination, e*, must be achieved to prevent any coordination mismatch. Since the size of the coordinating club has increased, countries of either type wish to raise their coordination effort level. But only one level can prevail, and we naturally assume that the subgroup of countries with the lower value of e will have its way. As we know from the above analysis, these are the big countries. The comparatively small donor countries therefore have to accept a lower level of coordination than the one they would have wanted. The interesting thing to note is that we cannot be sure that governance quality in the recipient country (α) will be better in the new situation as compared to the previous one. In other words, governance might possibly be of higher quality when only a subgroup of effectively coordinating donor countries operates than when a larger group of heterogeneous donors are present. Of course, what is true of governance quality, the proportion of aid reaching the poor, is unlikely to be true of the total absolute amount of aid that accrues to them. The size effect of the larger number of countries plausibly works in favour of the poor, in which case there is a trade-off between governance quality and poverty reduction.
The Aid Effectiveness Agenda: The benefits of going ahead
Final Report - Contract nr. 2010/256898 Page 43 of 169
5. Studies of the effects of the Paris agenda
5.1. Earlier studies
Also the previous EU-study of aid effectiveness (EC, 2009) had as its target to identify and measure costs associated with ineffective and fragmented aid and potential savings in such transaction costs from the implementation of the aid effectiveness agenda of the EU and member states. The study looked at the costs associated with donor proliferation, fragmentation of the aid programmes, tied aid, volatility and lack of predictability in aid flows, and shortcomings in the donors’ use of country public procurement systems.
The approach to country ownership followed was threefold: (1) Identify quantitative and qualitative costs associated with ineffective aid both to EU donors and to partner countries; (2) to elaborate specific examples where aid effectiveness principles have been applied; (3) to extrapolate and illustrate the savings potential of fully applying aid effectiveness principles to EU bilateral aid worldwide.
The conclusions of the report were as follows:
1. The report concludes that there is lack of good information to estimate the costs and benefits of using different aid modalities. Therefore the estimates of savings are only indicative.
2. There is a crude estimate of the effect of increased consolidation of programmes and projects, use of joint financing arrangements, delegated cooperation and agreed division of labour. It is estimated that this could save €200 to €500 Million per year.
3. The study provides an estimate of the costs of fragmentation of aid. It is estimated that the average costs (staff time and consultants) for design, formulation, appraisal and approval of new projects (€22,000 per year) to be between € 90000 and € 140000. The total cost of the EU would then be €1.9 to €3.0 billion per year. The saving will depend on how far the number of projects can be reduced.17
4. It is argued that the pattern of aid delivery puts a high burden on recipient governments. There are no specific estimates of the costs, due to the lack of information.
5. One of the components identified is the cost of tied aid relative to untied aid. They refer to estimates available in the literature indicting that tying of aid increases costs in the range 15-30 %. Given the extent of tied it is estimated that a complete removal of tied aid, ceteris paribus, could save €500 million per year.
6. The main item in terms of potential savings identified in the study is related to the volatility and predictability of aid. The study estimates (tentatively) that this reduces the value of aid by 8-20%.18 This suggests that there could be a saving of €2 to €4 billion per year.
7. The study discusses the importance of the use of country systems and government ownership, but it is concluded that they cannot provide any estimate the magnitude of this saving.
The report concludes that the EU could improve aid in mainly two main areas, namely by improving aid predictability and to have a better inter-country division of labour. It is concluded that the total savings could be in the range €3-6 billion, although it is not clear from the report exactly how the adding up of components was done.
17 A key area in the discussion is the costs of donor proliferation, that there are too many donors per country. This leads to attaching costs, costs of country representation, costs of development cooperation staff, office administrative, financial, transport and maintenance costs, country programme development and management costs, costs for project and programme development, approval, monitoring and evaluation costs, overhead cost such as reimbursements paid to cub-contracted implementing organizations, and expert missions. Djankov et al (2008) provides some evidence which indicates that the presence of multiple donors reduces effectiveness of aid. 18 Kharas (2008) and Arellano et al (2009) have provided some estimates of the savings.
The Aid Effectiveness Agenda: The benefits of going ahead
Final Report - Contract nr. 2010/256898 Page 44 of 169
The study managed to attach numbers to some of the identified impacts of the implementation of the Paris agenda, but it is admittedly hard to come up with precise estimates of the effects. There are many difficult conceptual issues and trade-offs that we discuss further in this study.
There are two approaches to the issue of measuring donor quality. First there are qualitative approaches such as DACs peer review process, which monitors each donor’s aid programme. This also covers parliamentary engagement, public awareness building, policy coherence, organization and management, human resources management and implementation of principles behind the Paris Declaration and the Accra Agenda for Action.
Secondly there are quantitative approaches such as Birdsall and Kharas (2010), who benchmark countries and agencies against each other.19 They look only at country programmable aid (CPA), which means that they exclude humanitarian aid, debt forgiveness, donor administrative costs, refugee support in donor countries, student scholarships in donor countries, food aid, and core financing of NGOs. This means that a sizeable share of ODA is not evaluated, but this is the share of ODA for which the PA and AAA are less relevant.
Birdsall and Kharas studied development agency effectiveness. They look at a vast array of potential data sources20, and eventually chose 30 indicators. The items largely relate to the Paris Declaration and the Accra Agenda for Action, which reflect the current donor consensus on the subject. They do not transform their indices with regressions. The variables contain little information about the views of the recipients and are not adjusted for recipient circumstances. All the 30 variables are converted into standard normal variables (mean zero and variance one) and then they are arithmetically weighted with equal weights.21 Once this is done they group the indices into four categories that they feel are important with regard to the effects of aid on development. They four dimensions with a total of 30 indicators are
1. Maximizing efficiency 2. Fostering institutions 3. Reducing the burden on recipients 4. Transparency and learning
The first dimension seeks to pick up factors that relate to the link between development assistance and poverty-reducing growth. They are trying to measure the likely “development bang for the buck”. They acknowledge that there are some dimensions that they would have liked to include but could not, such as the stability of flows or fragility of states.22 One interesting result that comes out of their analysis of this dimension is that multilaterals generally seem to do better than bilaterals. This dimension is said to correspond to the PD principle “Managing for results”23, but none of the eight indicators are similar to the one PD-Managing for results-indicator (PD11) (see Table 2.1 for a listing of the PD indicators). Some of the indicators are similar to some of the seven PD-Alignment-indicators (PD2-8), but most of the indicators are not similar to any PD-indicator at all.
19 There is also the study by Knack, Rogers, and Eubank (2010). 20 They for example look at the Global integrity index, with more than 300 indicators of public sector accountability, World Bank’s Doing business indicators, with 41 vindicators on the regulatory environment, OECD-DACs Creditor Reporting System; Aid data; Survey of Monitoring of the Paris Declaration; World Bank Aid Effectiveness Review; DAC’s Report on Aid Predictability; World Bank Global Poll; World Value Survey; Afro barometer; Index of Governance Vulnerability; UN National Accounts; IMF World Economic Outlook. 21 This approach is chosen because it makes it possible to treat missing observations. 22 Desai and Kharas (2010) have done some analyses that could be considered. 23 Page 4, table 1.
The Aid Effectiveness Agenda: The benefits of going ahead
Final Report - Contract nr. 2010/256898 Page 45 of 169
The second dimension they discuss we believe to be very important, since the development of institutions is central for long-term development. When aid passes through recipient country institutions it is more likely to be owned by the recipient. Aid can also affect the quality of domestic institutions, which determines the quality of public spending. This is certainly a central part of the Paris agenda. This dimension is said to correspond to the PD principle “Ownership”, but none of the eight indicators are similar to the one PD-Ownership-indicator (PD1). Most of the indicators are similar to the seven PD-Alignment-indicators (PD2-8).
The third dimension tries to pick up reductions in transaction costs, that is cost savings from coordination, division of labour and use of cost-effective aid channels. The items grouped under this heading seem to overlap significantly with category one and they could possibly be considered jointly. This dimension is said to correspond to the PD principles “Alignment” and “Harmonization”, but none of the seven indicators are similar to the seven PD-Alignment-indicators (PD2-8). Some of the indicators are similar to one of the two PD-Harmonization-indicators (PD9-10). Most of the indicators are not similar to any PD-indicator at all.
The fourth dimension measures how well the paper work associated with aid is handled in terms of documentation, reporting etc. These things are probably important, but it is hard to measure the effects on aid effectiveness. We would argue that the relevant dimension of learning for our study is that which relates to institutional development. So we think that this could be merged with the fostering institutions category. This dimension is said to, and does, correspond to the PD principle “Mutual accountability” (PD12).
We conclude from our review of Birdsall and Kharas that the main aid impacts can be investigated along two main dimensions, namely efficiency in the short term (measured as growth, poverty reduction, or human development) and institution building leading to development in the long run.
One of the more ambitious attempts in recent times to get some indication of “value for money” in aid is the Multilateral Aid Review (MAR) done by DFID (2011). This study constructs indicators of donor performance that are aggregated into two dimensions, namely Contributions to development objectives of UK aid and Organizational strength. Information is collected on the various components that comprise these two aggregate indices, but this is then coded on a scale from 1 (unsatisfactory) to 4 (strong). There is some quantitative estimates used, but much of the evaluation relies on more qualitative proxy measures. With estimates on these two dimensions the report can place each multilateral donor in a two-dimensional space. So an agency can in principle do well in one dimension and less well in another one. There is no attempt to weigh the “value” of one dimension against the other.
Donors have just concluded a very extensive operation to evaluate the impact of the Paris agenda involving very many donors and partner countries. As part of the evaluation of the implementation of the Paris Declaration and the Accra Agenda for action donors agreed to undertake a series of evaluations. Eighteen of those are so called Head Quarter studies, and Sweden has done one of those and we take that as an example.
The Swedish evaluation (SADEV, 2010) looks at the quality, efficiency and relevance of actions taken by Sweden. It looks at the implementation of the agenda, but (again) not the effects of the implementation. Therefore this kind of study does not help us answering the question about how much that can be gained from implementing the Paris agenda. The report notes problems with the evaluability of the Paris Declaration. These include that it is comprehensive and complex, that there is a lack of uniform interpretation, and that the indicators identified are hard to measure.
Sweden has a long history of trying to align with the priorities of the recipient countries. Already in the 1970s the slogan was #development on the conditions of the recipient”. The Government Report on global development of 2003 also emphasized ownership and alignment. Sweden was involved in the preparation of the EU Code of Conduct on Complementarity and Division of Labour in Development Policy along similar
The Aid Effectiveness Agenda: The benefits of going ahead
Final Report - Contract nr. 2010/256898 Page 46 of 169
lines. Sweden was also one of the forces behind the EU Operational framework of 2009. So Sweden has been very active in the field.
Sida has stated that it wants to be in the forefront in implementing the Paris Declaration, at the same time the Swedish government demands that Sida reports much more concretely about the results of specifically Swedish aid interventions. There are also ongoing discussions of stricter conditions for budget support and sector programme support. The latter may make alignment and harmonization more complicated. Furthermore, several of the people within Sida complained that harmonization efforts had increased their workload, rather than the reverse, particularly when Sweden function as lead donor (SADEV 2010, p.22-23). The new approaches also require more advanced types of competence.
When it comes to incentives it is found that the most important pressure comes from DACs Monitoring Surveys, while there are no particular incentives at the Sida level .(SADEV 2010, p. 26-27). On the contrary, there are disincentives (p. 28). By harmonizing Swedish aid with other donors’ aid the risks may increase, while the pressure from the government in recent years has been to take fewer risks. It is also considered to be very hard work to coordinate projects. The benefits are long-term and when they appear the staff may have been rotated to other tasks. There were also complaints that the work has become more analytical with less real world contents. Harmonisation takes time and is very laborious (SADEV, 2010, p. 37). For example, Sweden is the lead agents in health in Zambia and the staff spend 80% of the working time on harmonisation activities. Many of the NGOs involved in the sector are not very committed to harmonisation. In a travel report to Sida in 2010 there was mentioning of a certain “Paris Fatigue”.
The conclusion of the Swedish evaluation is that “it is not obvious how implementation of the various components (of the Paris declaration) impacts on the work load of donor countries. A higher degree of alignment, better harmonised aid etc., could be assumed to be labour saving. However, the Paris Declaration has also given rise to a number of new activities, such as strengthening national system for implementation and results reporting, overseeing of budget support, dialogue and negotiation. In respect of harmonization, the very idea has been to ease the burden of the partner countries and place it on the donors.” (p. 49).
This report like other reports that come out of this evaluation process have valuable and interesting information about many aspects of the aid processes, but they are essentially qualitative and do not provide estimates of the costs of not implementing the Paris agenda fully.
There are also a series of 22 partner country studies undertaken. We have looked in greater detail at one example, that of Uganda (2011). The purpose of the study is to evaluate the effects of implementation of the Paris Declaration on aid effectiveness and development results in Uganda. The focus of the study is on the impacts in health, water and agriculture. It is noted that attempts at reforms in the direction of the PD started already before 2005, so it is a bit hard to decide what is due to the PD. Another reason making attribution difficult is the growing influence of non-aid resource flows and growing aid outside the PD framework; much finance remains off budget and off-plan.
The authors note that governance concerns following the 2006 presidential elections reduced aid flows, but still eleven development partners continue to contribute to the joint budget support. A new partnership policy, which is in the pipeline, will include much from the Paris agenda. China is getting more important and it is not a DAC member, which means that information about its aid is not in the public domain. Donors have sought to strengthen coherence through the Joint Budget Support framework and the Joint Assessment Framework. Since the 1990s Uganda has promoted coordination and alignment via joint sector working groups, joint missions, silent partnerships, join analytical work etc
A significant share of aid money remains outside the government system. In the case of health the share has sometimes been above 90%. There are 16 donors in the health sector. In total Uganda collaborates with
The Aid Effectiveness Agenda: The benefits of going ahead
Final Report - Contract nr. 2010/256898 Page 47 of 169
over 40 partners. It has been very difficult to ensure comprehensive participation of the UN in harmonization exercises (p. 34). It is furthermore very hard to get multiyear commitments from the donors, and aid flows remain highly unpredictable. Alignment has mainly come through general and sector budget support instruments (p. 64), but transaction costs remain high. The authors conclude that the impact of PD on aid effectiveness has been mixed. They think it has been more successful in softer areas such as country leadership and ownership.
Again, this is one of several country reports that provide interesting details, but there is nothing in this report that can be quantified and used for our quantitative analysis.
An interesting separate study has been done by Odén and Wohlgemuth (2011), who review the implementation of the Paris agenda in Tanzania, Zambia, and Mozambique, three countries which are among those that have advanced furthest in Sub-Saharan Africa in terms of PA implementation. It is a concern that even for those countries they report considerable problems reported in the functioning of the aid relationship. There has been some progress with regard to harmonization among the donors, but there are increasing problems with regard to the dialogue between the donors and the recipient governments. The focus on the modality of General Budget Support (GBS) has meant that the dialogue has become more political in nature, which may imply a reduction in ownership. There is also increasing pressure from the donors for quick results, since they experience increased pressure from politicians at home for quick and visible results.
Odén and Wohlgemuth (2011, p. 7) report that “ in all three countries the dialogue structure developed has become too complex, leading to problems of capacity and to higher than expected transaction costs.” They also note that there is an increasing tendency among donors to want to micromanage programmes in the various consultation bodies set up. There is a proliferation of working groups in all three countries. Another problem is that some donors do not want to be involved in the process (e.g. the US and the new donors such as China, India and Brazil) as well as the new vertical or global funds, which run their projects essentially outside the government budget system. Project aid is increasing again in e g Tanzania.
Although ownership is a basic principle of the Paris Declaration the authors conclude for the case of Tanzania (2011, p. 9), that ownership is not as it was five years ago. Both parties show less commitment to ownership leading to an increased distrust between the parties. On the government side efforts to take leadership in the different dialogue fora are increasingly being weakened. On the donor side one can see impatience with government’s behaviour.
In Zambia it is noted (p. 14) that “the dialogue architecture which has emerged over the period of the Joint Assistance Strategy for Zambia (JASZ) in response to these weaknesses, often does not respect government processes, and its consultative mechanisms are driven and developed by donors” “There is little evidence that the JASZ has promoted greater country ownership at national level. There is quite a substantial question mark over the leadership of the Zambian government and its capability to influence the decisions of donors.”(p. 16)
In Mozambique there is now 28 working groups, where donors and the government participate. This puts a very high pressure on the government to find people to chair and attend the meeting (p. 20). Due to the hierarchical structure of the government those that participate have difficulties in making deals with the donors. It is noted that the transaction costs still are high and the dialogue structure is complex and demanding. It is estimated that 400 people from the donors and the government are involved in meeting 45 days annually in these working groups (p. 24).
They draw the conclusions that there is weak willingness and capacity of the host governments to take up their leadership role in the PA process, at the same time as there is less willingness from the home consistency of the donors to accept delays due to increased ownership. The dialogue structure has become
The Aid Effectiveness Agenda: The benefits of going ahead
Final Report - Contract nr. 2010/256898 Page 48 of 169
complex and demanding leading to increased transaction costs. They find that there is only slow progress in untying aid, that technical cooperation continues to be donor driven, and that the General Budget Support dialogue structure is very political in nature. They further note that many donors do not participate, and that alignment of procurement principles are difficult to adhere to. They find that harmonisation is the most successfully implemented component. Still, some donors have found it increasingly difficult to hold governments accountable for mismanagement and corrupt practices.
Odén and Wohlgemuth (2011) draw rather pessimistic conclusions with regard to the progress on the implementation of the PA. There is even talk in various groups about a Paris agenda fatigue. This study, like others of this type, provides useful information about progress in implementation, but they do not provide information about how much has been gained or lost due to changes in the extent of PA implementation.
Wood et al. (2011) have produced a synthesis report of the large DAC-evaluation. The evaluation seeks to determine the progress made against 11 intended outcomes as specified in the PD: They find that the PD has made a contribution by strengthening good practices, by contributing to the movement towards the 11 outcomes, and improving the aid partnership. It is also argued that the PD has contributed to the aid volume, which is not an effectiveness dimension as such. One of the main conclusions that emerge is that donor progress has been very uneven. There have been some improvements with regard to the implementation of the Paris agenda, but with regard to the aid effectiveness it summarizes results as follows (p. xiv):
“The Declaration was aimed at improving effectiveness in three areas: the efficiency of aid delivery, the management and use of aid, and better partnerships. Overall, the picture on efficiency gains is mixed, but so far disappointing in relation to the original hopes of rapidly reduced burdens in managing aid. There has been generally little reduction to date in those burdens where Declaration-style cooperation has been applied and even increased loads are noted in a few cases. At the same time, many Declaration-style mechanisms and practices are allowing for a much better overview of aid by the partner country and donors. When matched by sufficiently robust country systems, they have increased the country ability to handle more strategic support, particularly at the sectoral level.
While progress is slow and uneven, the management and use of aid has improved in the countries studied, especially in relation to the pre-Declaration situation, and Declaration-style aid appears to have made significant contributions to that change. Global programmes are found to be still mainly insufficiently integrated with other processes, but in some cases considered to be delivering stronger development results.
In terms of building more inclusive and effective partnerships for development, aggregate standards are rising. The Declaration has placed an explicit focus on aid relationships, and opened up important dialogues about partnerships themselves – between countries and donors, among donors, and with other stakeholders, rather than just the technical or financing aspects of managing aid. A number of clear practical benefits are already being felt.”
It is noted in several places that it is disappointing that there has been no reduction in average burden of aid administration. The report is further concerned that donors are slow to change and generally very risk averse, while partner countries have increasingly taken on the agenda.
There are five key recommendations for the donors from the evaluation, and we discuss their relevance for our discussion one by one:
The first recommendation is to “make the hard political choices and follow through”. The argument is that changes can only be effective if there is political backing of the reform process. It would seem clear that donor governments would be very supportive of the process if there were only benefits associated with it, but as we argued in our analysis above there are also cost associated with relaxing national control of aid processes and allocation decisions. This particularly matters for the larger donors, who are more concerned
The Aid Effectiveness Agenda: The benefits of going ahead
Final Report - Contract nr. 2010/256898 Page 49 of 169
about their political stakes. So we agree that this is an important dimension, but it is less clear as to how donors can be convinced to move down the Paris route. Our study seeks to put a value on the gains from implementing the Paris agenda, and to the extent that this shows to donors that the gains are larger than they have believed, this might tip the balance towards a more positive stance to the process. We don’t know, however, how to convince donors to put less weight on their political goals. This would require a debate among the political parties and the electorate which could change these goals. It is beyond the scope of this study to suggest how such a political process could be supported. Still, our analysis certainly supports this first recommendation.
The second recommendation from the evaluation is to “focus on transparency, mutual accountability, and shared risk management”. This general recommendation is detailed to include “deepening adherence to the principles of country ownership, alignment and harmonization of donor support, and transparency and mutual accountability in tracking and achieving results” This is basically saying that there should be a continuation of the implementation of the agenda. The new feature is that they argue that one should “add shared risk management to this framework of principles of aid”. It is not very clear how this is to be organized, but we agree that there is a concern about how donors seek to manage risk at present. Donors appear to pay strong attention to the risk of failures in interventions, which are holding back the implementation of the PA reforms. We argue that the donors need to take a more realistic stance on the risks in aid managements, and in some way a better handling of this issue would of course have to involve the recipients. However, if the risk that the donors are concerned about is related to the behaviour of the recipient governments, there is a problem here.
The third recommendation is to “centre and reinforce the aid effectiveness effort in countries” to strengthen ownership, transparency and mutual accountability. This is thus about improving the on-going process. The novelty that is proposed is that one should help mutual accountability by allowing countries to call on independent facilitators/rapporteurs to monitor and help steer the process. We do agree that his could help the process as we have argued in the theoretical review.
The fourth recommendation is similar to the previous one. It is suggested that one should “work to extend the aid reform gains to all forms of cooperation”. This is thus again about extending the process more broadly. This is a relevant concern these days when the number of actors in the aid business is increasing fast. We have discussed the case of the Chinese in Mali (see Appendix A1), but there are also many rather large NGOs involved these days. It is an interesting question where they should all be coordinated with the same framework. It may become too huge an operation to coordinate all activities including the NGO. Particularly since the latter are generally not involved in setting conditions for recipient policy there may be advantages to letting them operate outside the aid coordination framework as independents. They could act as part of the civil society to pressure governments for relevant policy changes or accountability. We do think that one need to be a bit careful not to overburden the coordination processes, which many donors already feel are cumbersome.
The fifth recommendation suggests that one need to “reinforce the improved international partnerships in the next phase of reforms”. This is again about extending the structures that are there and making them more efficient. It is noted that this requires transparency.
There is then a set of recommendations for recipient countries, plus some for policy makers in donor countries. The relevant one for us of the latter is the recommendation to “face up to and manage risks honestly, admit failures”. This relates closely to our discussion of donor government behaviour, where we have noted that there is a strong concern not to take risks in aid. This idea about, for example, “corruption free aid” may lead to aid being held back from potentially important but risky areas. This issue is maybe one of the most important areas of discussion when it comes to the future of the Paris Agenda.
Although the report is very rich in detailed information about the aid processes and perceptions about them, there are essentially no numbers in the synthesis report. Results are described by adjectives such as little,
The Aid Effectiveness Agenda: The benefits of going ahead
Final Report - Contract nr. 2010/256898 Page 50 of 169
some, substantial, adequate etc., but there is no way that these can be added up to any numerical estimate of impacts (see results summary in Wood et al., 2011, p, 44). It is noted that the character of the aid partnership has changed over time, but it is not self-evident that it is better. The PA has raised the price of bad practices (shame), but the donors are free to choose to pay that price. There is generally a harsh critique against the donors for not having made more progress with regard to the aims that they have themselves set up. The report is concerned about the efficiency of the process of aid agreements. They propose that the mutual accountability measure needs a matchmaking function, a mediator, who can step in when the partners cannot agree.
The report’s key recommendations are that the aid process should be country led, risks should be managed more honestly, and there should be high-level political commitment to the PA process. At the same time there is some concern that the old agenda may be less relevant in the new aid environment with new players like China and new private initiatives.
5.2. Case study: Coordination of aid efforts in Mali
Mali supplies us with a country case study that is especially worth investigating. As a matter of fact, Mali has been selected by the Committee for Development Aid of the OECD as pilot country to initiate a review of aid effectiveness in 1996. With this purpose in mind, several steps have been taken to reform aid practices and to set up new institutional mechanisms in this country in the subsequent period. In particular, various commissions, groups, and mechanisms have been put into place to facilitate the exchange of information and coordination of aid efforts both between donor agencies and between them and the government of Mali. Harmonization of conditionalities and division of labour among donor agencies, delegation of responsibilities to a leading donor, co-financing arrangements, the fostering of continuous dialogue with the government of Mali so as to allow its leadership in defining objectives and strategies, rationalization of aid delivery procedures, follow-up and evaluation missions, stabilization of aid flows in a multi-year perspective so as to allow more predictable budgetary projections, and improvement of budgetary procedures in the host country to make them more transparent and planning more effective, were among the key objectives to be achieved by the new institutions. The idea of a joint programming became a central plank in the new strategy aimed at supporting, in a coordinated manner, the so-called Strategic Framework for Growth and Poverty Reduction (CSCRP) for the years 2002-2006, 2007-2011, and 2012-2017. Actual coordination rests on three distinct levels: the global, the sectoral, and the sub-sectoral levels, all of them involving different mechanisms and group meetings.
Evaluation of the experience to this date has been carried out by a team of experts and reported in the « Rapport Final - Evaluation nationale de la mise en œuvre de la Déclaration de Paris (phase 2) », Ministère de l’Economie et des Finances (MEF), (2011). Their observations as well as those resulting from our own field interviews during the month of July 2011 suggest a number of interesting lessons that are summarized and discussed below.
There have been unmistakable efforts to share information among donors, particularly between countries of the European Union, and between donors and the government of Mali. This has helped to increase trust between donors and the aid recipient country. On the other hand, despite the numerous institutions and mechanisms created towards fostering harmonization of aid efforts, the results on that level have been essentially disappointing. Central weaknesses are the following:
- The indecisiveness and lack of leadership of the recipient country has weakened the coordination mechanisms: it is the host government, indeed, which is expected to coordinate the aid interventions of all the donor agencies and verify that these interventions match national priorities.
- Dispersion of roles and duplication of structures in charge of the management of aid efforts have remained important.
The Aid Effectiveness Agenda: The benefits of going ahead
Final Report - Contract nr. 2010/256898 Page 51 of 169
- Some donor agencies have refused to align themselves on the new mechanisms. And new donors have been particularly reticent to join the coordination efforts, mainly because their interventions are focused on projects.
- Donors remain unwilling to pool financial resources so as to fund common initiatives. - Donors remain unwilling to reduce parallel structures through which they use to deal with the
local authorities (e.g., diplomatic and political channels). This obviously reduces the transaction cost savings caused by aid coordination.
Some of the above conclusions deserve to be further commented upon. To begin with, it is noticeable that not all European donors appear to be on the same wavelength, thus weakening the potential benefits from aid coordination. The fact of the matter is that some of them (Denmark, Sweden, and the Netherlands) do not really share the approach to development aid of the others (Germany, France, and Belgium) even though they support the Paris Declaration process. They tend to give preference to coordination with non-European countries (such as Canada) which they deem closer to their own aid philosophy. One major point of division among European countries concerns the adequacy of the General Budget Support strategy, meaning that there are different opinions regarding the role of conditionalities. It is interesting to note that GBS stands for less than 10 percent of the whole Public Aid to Development from the EU, whereas Sectoral Budget Support (SBS) represents hardly 2 percent of the same. The budget support approach thus remains well below the expectations of the government of Mali in terms of both the aid amounts and the number of donors involved.
In 2007, the EU adopted a Code of Conduct on the Complementarity and Division of Labour with a view to improving European development cooperation. As our case study of Mali shows, the Code is not easily put into practice because of deep-rooted habits of autonomy on the part of national aid agencies.
Coordination works relatively well at the sub-sectoral level, particularly in the health and education sectors, and it is especially effective when it comes to sharing information and diagnoses about the situation in the host country (and the implementation of the poverty reduction strategy under the aforementioned framework), and to discussing joint approaches to follow up and evaluation. Also appreciated is the work of the Pool Technique, a cell of technical support created by the donors to help them harmonize their aid efforts and prepare their consultations with national authorities. The existence of this mechanism allows a significant reduction of transaction costs for the donors as well as for the host government which can talk with only one interlocutor acting on behalf of all the donors involved.
It remains true, however, that the rationalization of donor missions to the field has barely begun and that parallel units subsist. Thus, 60 such units for the implementation of rural development projects have been recorded for the year 2008, as against 65 in 2006. On the other hand, only 15 percent of the project/programme interventions for rural development were carried out under the aegis of joint programmes in 2009, a figure to be compared to the set objective of 66 percent for 2010. In reality, there is no such thing as a joint basket of donor interventions. Joint missions have not increased either: most donor agencies continue to organize their field missions separately. In addition, too few projects (only 22 of them in 2009, representing 20 percent of the total) have been co-financed by several donors (the proportion was 18 percent in 2008). Finally, 58 percent of the projects/programmes of rural development financed by European agencies were keeping a parallel management unit.
The Delegation of the EU in Mali is relatively strict when it comes to decisions of suspending aid for budget support whenever the outcome indicators prove disappointing. Variable tranches are then not disbursed till the indicators improve or the government takes up measures toward that end. Yet, not all donors feel comfortable with this approach and some of them consider the EU’s policy too harsh. During two consecutive years, the Delegation has thus suspended its aid to Mali and was alone in doing it. Other donor agencies disagreed with the indicators used by the Delegation to make its decision, or with their interpretation or measurement. A more serious problem arises from the fact that disbursement decisions depend on individual decisions made by the donors. In other words, the donors consult with each other to decide whether the agreed-on indicators have been satisfied (and, as we have just seen, even this sort of agreement is not necessarily easy to achieve), but the actual disbursement of the money at stake is left to
The Aid Effectiveness Agenda: The benefits of going ahead
Final Report - Contract nr. 2010/256898 Page 52 of 169
the appreciation of each donor. This lack of coordination about the manner in which non-fulfilment of conditions set by the donors is followed up at the level of actual disbursement decisions is a serious obstacle to effective aid coordination.
Some donors refuse to use national systems and procedures on the ground that they are not compatible with international norms and are unreliable and inefficient. Thus, the share of OECD donors’ aid that follows the national procedures of budgetary implementation, financial monitoring and control was only 30 percent in 2010. This is actually a regression from the figure of 34 percent recorded for the years 2007-2009. Where the situation is clearly better is in the matter of alignment of donor aid on national objectives and priorities: 73 percent of OECD public aid in 2007 was obeying national priorities (the proportion was 60 percent in 2005). Quality of national systems of budgetary planning, financial management and market adjudication is a key aspect conditioning donors’ alignment on them. In 2009, only 37 percent of the development aid allocated to the public sector was properly adjudicated through open calls, as against 45 percent in 2005. In contrast, 40 percent went through the national system of public finance in 2009, as against 29 percent in 2005 and 34 percent in 2007: this increase was essentially caused by the increase in the number of donors practicing budget support.
A last aspect deserves to be elucidated. The involvement of the government of Mali remains weak and its appropriation of the Paris Declaration process is far from satisfactory. The country still lacks a genuine national strategy toward development aid and the government seems unable to conceptualize its own view about national development priorities. It tends to rely on the ideas, proposals and prescriptions coming from the donor agencies without setting them against a list of objectives set by itself in consultation with the local population. It is therefore not surprising that a definition of budgetary ways of meeting objectives is altogether absent. Participation of the private sector and the civil society is entirely achieved through sectoral groups. Communication of information between the government of Mali and the donors is deficient, and information management at the level of the government itself is lacking in many respects. As a result of these weaknesses and the persisting duplication of aid management structures, aid efforts and outcomes remain hardly transparent.
5.3. Concluding remarks
Overall, we think it is fair to say that the discussion of the Paris agenda so far mostly has focused on how to do more and how to do better rather than how much various interventions will improve outcomes. And the key question in this study is to find an answer to the question of how much better it could become if the agenda was implemented. We will have to struggle with the eternal external evaluation challenge of defining a reasonable counterfactual. It may be important to consider the time pattern of outcomes as well. Maybe there is even a J-curve effect of some PA interventions, that is implementation of new systems that may be good for the long run may reduce effectiveness in the short run.
As far as we can tell there is no study that has been able to do anything very precise in terms of quantitative analysis. The previous EU-study (EC, 2009) is the most ambitious attempt so far to put numbers on the potential effects. Our ambition is to provide more comprehensive estimates of potential cost savings and to push the measurement agenda further. We believe that one must also consider the effect of savings from reorganizations and PD changes on outcome variables. Lower administration costs may, for example, lead to a deterioration in the relevant outcome variables (or improvement), which suggests that ignoring this type of effects is very problematic. We continue this discussion in the following chapters.
The Aid Effectiveness Agenda: The benefits of going ahead
Final Report - Contract nr. 2010/256898 Page 53 of 169
6. Scope of the Paris agenda
The aim of this study is to analyze how a “full” implementation of the Paris agenda would affect the effectiveness of aid. In the analyses that have been done (EC, 2009, Birdsall and Kharas, 2010) about the effectiveness of donors the focus has been on country programmable aid, that is the part of ODA that is subject to multi-year programming at the country level. It is certainly relevant to argue that CPA is the part of the aid budget that is most relevant from the perspective of the Paris agenda, but we will in this chapter at least discuss whether one needs to go beyond that part of aid. We start from the complete listing of ODA and consider what the scope of the Paris agenda is, that is what components to include in our further analyses.
According to DAC´s definition CPA “represents a subset of ODA outflows.24 It takes as a starting point data on gross ODA disbursements by recipient but excludes spending which is: (1) inherently unpredictable (humanitarian aid and debt relief); or (2) entails no flows to the recipient country (administration costs, student costs, development awareness and research and refugee spending in donor countries); or (3) is usually not discussed between the main donor agency and recipient governments (food aid, aid from local governments, core funding to NGOs, aid through secondary agencies, ODA equity investments and aid which is not allocable by country). (4) CPA does not net out loan repayments, as these are not usually factored into aid allocation decisions. CPA is therefore a gross concept.”25
In the tables in this chapter we use a slightly broader definition of CPA26, although we will stick to the DAC definition in the later analyses. We start with a broader concept, since we have not eliminated any sub-items in the main aid categories included in Table 6.1, which means that some smaller items excluded by DAC remain in our table. Our CPA measure is calculated as bilateral ODA minus Non-CPA grants (student costs, food aid etc.).27
24 CPA is derived by subtracting non-CPA expenditures (e.g. humanitarian aid, debt relief, administrative costs etc.) from gross ODA figures reported by recipient in the table DAC2a. Non-CPA expenditures are identified in DAC2a (e.g. humanitarian aid is reported as DAC2a column 216) and in the CRS activity database (e.g. using sector/purpose codes, channel codes of delivery, agency codes and/or description fields). The non-CPA flows are: Debt relief (DAC2a: col 212), Re-scheduled debt (DAC2a: col 214), Other forms of debt relief (DAC2a: col 221), Humanitarian aid (DAC2a: col 216), Developmental food aid (DAC2a: col 213), Promotion of development awareness (CRS: purpose code 99820), Imputed student costs (CRS), Administrative costs (CRS: purpose code 91010), Refugees in donor country (CRS: purpose code 93010), Aid from local governments (CRS), Core support to national, international and local NGOs (CRS), Export subsidies (CRS), University subsidies (CRS), Equity investments (CRS: flowcode 19), Aid not from main agencies as notified by the donor (CRS), Aid that is not country or regionally allocable (DAC2a: ODA reported as bilateral unspecified, recipient code 998). 25 Since 2007, CPA data are more robust compared to earlier years due to improved quality in donors' reporting to the CRS activity database. CPA compilation for all non-DAC donors is only partial as these donors do not report detailed expenditures on administrative costs and imputed student costs to the CRS Aid Activity database. CPA may therefore be overestimated. The non-DAC donors concerned are: Chinese Taipei, Cyprus, Czech Republic, Estonia, Hungary, Iceland, Israel, Kuwait, Latvia, Liechtenstein, Lithuania, Poland, Romania, Saudi Arabia, Slovak Republic, Slovenia, Thailand, Turkey and United Arab Emirates. 26 Our approximate estimates of CPA are overestimates. It is the following categories that we might miss-calcify: Aid from local governments, Core support to national, international and local NGOs (some of this is reported as “support to NGOs etc., and that we do not miss, but not all core support are reported like that), Export subsidies, University subsidies, Equity investments, Aid not from main agencies as notified by the donor, Aid that is not country or regionally allocable (reported as bilateral unspecified). 27 CPA is derived by subtracting non-CPA expenditures (e.g. humanitarian aid, debt relief, administrative costs etc.) from gross ODA figures reported by recipient in the table DAC2a. Non-CPA expenditures are identified in DAC2a (e.g. humanitarian aid is reported as DAC2a column 216) and in the CRS activity database (e.g. using sector/purpose codes, channel codes of delivery, agency codes and/or description fields). The non-CPA flows are: Debt relief (DAC2a: col 212), Re-scheduled debt (DAC2a: col 214), Other forms of debt relief (DAC2a: col 221), Humanitarian aid (DAC2a: col 216), Developmental food aid (DAC2a: col 213), Promotion of development awareness (CRS: purpose code 99820), Imputed student costs (CRS), Administrative costs (CRS: purpose
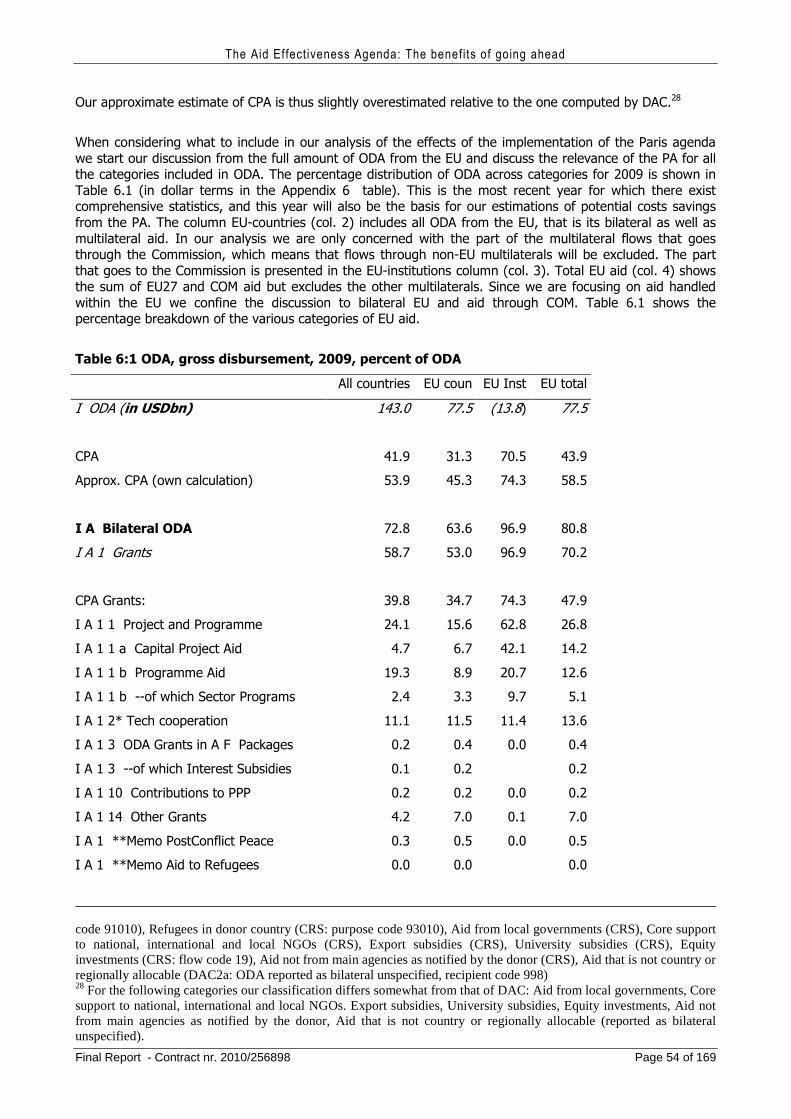
The Aid Effectiveness Agenda: The benefits of going ahead
Final Report - Contract nr. 2010/256898 Page 54 of 169
Our approximate estimate of CPA is thus slightly overestimated relative to the one computed by DAC.28
When considering what to include in our analysis of the effects of the implementation of the Paris agenda we start our discussion from the full amount of ODA from the EU and discuss the relevance of the PA for all the categories included in ODA. The percentage distribution of ODA across categories for 2009 is shown in Table 6.1 (in dollar terms in the Appendix 6 table). This is the most recent year for which there exist comprehensive statistics, and this year will also be the basis for our estimations of potential costs savings from the PA. The column EU-countries (col. 2) includes all ODA from the EU, that is its bilateral as well as multilateral aid. In our analysis we are only concerned with the part of the multilateral flows that goes through the Commission, which means that flows through non-EU multilaterals will be excluded. The part that goes to the Commission is presented in the EU-institutions column (col. 3). Total EU aid (col. 4) shows the sum of EU27 and COM aid but excludes the other multilaterals. Since we are focusing on aid handled within the EU we confine the discussion to bilateral EU and aid through COM. Table 6.1 shows the percentage breakdown of the various categories of EU aid.
Table 6:1 ODA, gross disbursement, 2009, percent of ODA
All countries EU coun EU Inst EU total
I ODA (in USDbn) 143.0 77.5 (13.8) 77.5
CPA 41.9 31.3 70.5 43.9
Approx. CPA (own calculation) 53.9 45.3 74.3 58.5
I A Bilateral ODA 72.8 63.6 96.9 80.8
I A 1 Grants 58.7 53.0 96.9 70.2
CPA Grants: 39.8 34.7 74.3 47.9
I A 1 1 Project and Programme 24.1 15.6 62.8 26.8
I A 1 1 a Capital Project Aid 4.7 6.7 42.1 14.2
I A 1 1 b Programme Aid 19.3 8.9 20.7 12.6
I A 1 1 b --of which Sector Programs 2.4 3.3 9.7 5.1
I A 1 2* Tech cooperation 11.1 11.5 11.4 13.6
I A 1 3 ODA Grants in A F Packages 0.2 0.4 0.0 0.4
I A 1 3 --of which Interest Subsidies 0.1 0.2 0.2
I A 1 10 Contributions to PPP 0.2 0.2 0.0 0.2
I A 1 14 Other Grants 4.2 7.0 0.1 7.0
I A 1 **Memo PostConflict Peace 0.3 0.5 0.0 0.5
I A 1 **Memo Aid to Refugees 0.0 0.0 0.0
code 91010), Refugees in donor country (CRS: purpose code 93010), Aid from local governments (CRS), Core support to national, international and local NGOs (CRS), Export subsidies (CRS), University subsidies (CRS), Equity investments (CRS: flow code 19), Aid not from main agencies as notified by the donor (CRS), Aid that is not country or regionally allocable (DAC2a: ODA reported as bilateral unspecified, recipient code 998) 28 For the following categories our classification differs somewhat from that of DAC: Aid from local governments, Core support to national, international and local NGOs. Export subsidies, University subsidies, Equity investments, Aid not from main agencies as notified by the donor, Aid that is not country or regionally allocable (reported as bilateral unspecified).
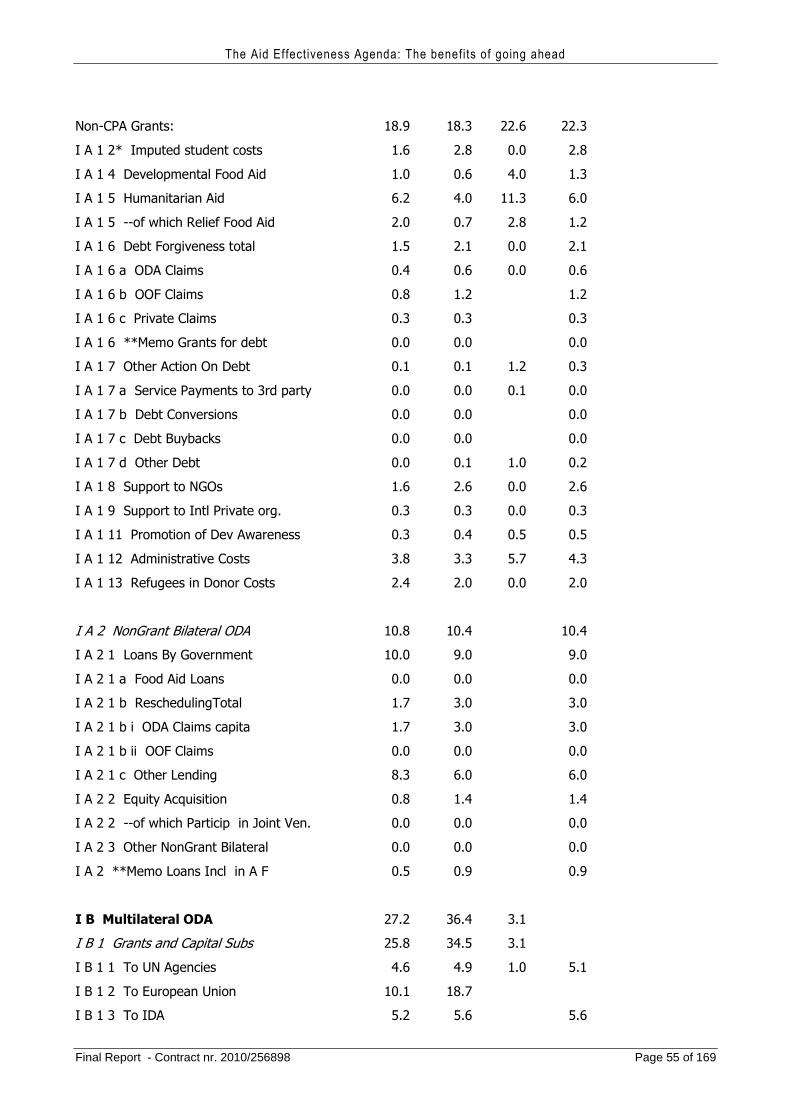
The Aid Effectiveness Agenda: The benefits of going ahead
Final Report - Contract nr. 2010/256898 Page 55 of 169
Non-CPA Grants: 18.9 18.3 22.6 22.3
I A 1 2* Imputed student costs 1.6 2.8 0.0 2.8
I A 1 4 Developmental Food Aid 1.0 0.6 4.0 1.3
I A 1 5 Humanitarian Aid 6.2 4.0 11.3 6.0
I A 1 5 --of which Relief Food Aid 2.0 0.7 2.8 1.2
I A 1 6 Debt Forgiveness total 1.5 2.1 0.0 2.1
I A 1 6 a ODA Claims 0.4 0.6 0.0 0.6
I A 1 6 b OOF Claims 0.8 1.2 1.2
I A 1 6 c Private Claims 0.3 0.3 0.3
I A 1 6 **Memo Grants for debt 0.0 0.0 0.0
I A 1 7 Other Action On Debt 0.1 0.1 1.2 0.3
I A 1 7 a Service Payments to 3rd party 0.0 0.0 0.1 0.0
I A 1 7 b Debt Conversions 0.0 0.0 0.0
I A 1 7 c Debt Buybacks 0.0 0.0 0.0
I A 1 7 d Other Debt 0.0 0.1 1.0 0.2
I A 1 8 Support to NGOs 1.6 2.6 0.0 2.6
I A 1 9 Support to Intl Private org. 0.3 0.3 0.0 0.3
I A 1 11 Promotion of Dev Awareness 0.3 0.4 0.5 0.5
I A 1 12 Administrative Costs 3.8 3.3 5.7 4.3
I A 1 13 Refugees in Donor Costs 2.4 2.0 0.0 2.0
I A 2 NonGrant Bilateral ODA 10.8 10.4 10.4
I A 2 1 Loans By Government 10.0 9.0 9.0
I A 2 1 a Food Aid Loans 0.0 0.0 0.0
I A 2 1 b ReschedulingTotal 1.7 3.0 3.0
I A 2 1 b i ODA Claims capita 1.7 3.0 3.0
I A 2 1 b ii OOF Claims 0.0 0.0 0.0
I A 2 1 c Other Lending 8.3 6.0 6.0
I A 2 2 Equity Acquisition 0.8 1.4 1.4
I A 2 2 --of which Particip in Joint Ven. 0.0 0.0 0.0
I A 2 3 Other NonGrant Bilateral 0.0 0.0 0.0
I A 2 **Memo Loans Incl in A F 0.5 0.9 0.9
I B Multilateral ODA 27.2 36.4 3.1
I B 1 Grants and Capital Subs 25.8 34.5 3.1
I B 1 1 To UN Agencies 4.6 4.9 1.0 5.1
I B 1 2 To European Union 10.1 18.7
I B 1 3 To IDA 5.2 5.6 5.6
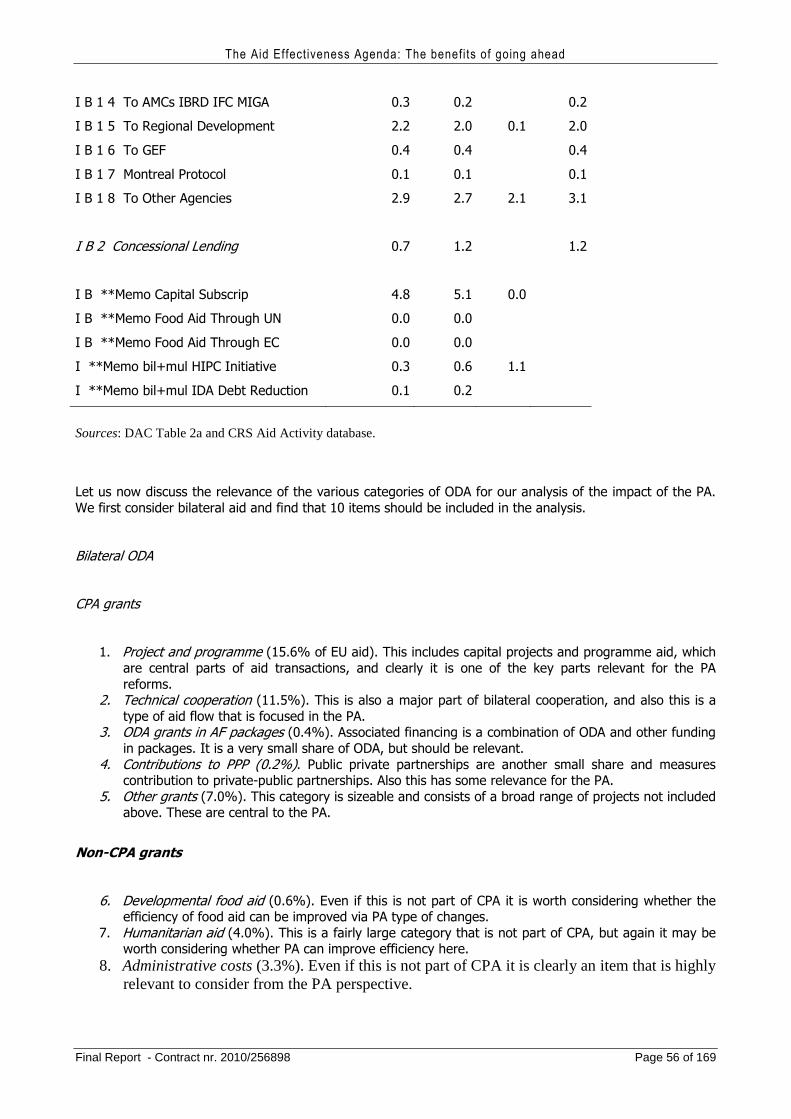
The Aid Effectiveness Agenda: The benefits of going ahead
Final Report - Contract nr. 2010/256898 Page 56 of 169
I B 1 4 To AMCs IBRD IFC MIGA 0.3 0.2 0.2
I B 1 5 To Regional Development 2.2 2.0 0.1 2.0
I B 1 6 To GEF 0.4 0.4 0.4
I B 1 7 Montreal Protocol 0.1 0.1 0.1
I B 1 8 To Other Agencies 2.9 2.7 2.1 3.1
I B 2 Concessional Lending 0.7 1.2 1.2
I B **Memo Capital Subscrip 4.8 5.1 0.0
I B **Memo Food Aid Through UN 0.0 0.0
I B **Memo Food Aid Through EC 0.0 0.0
I **Memo bil+mul HIPC Initiative 0.3 0.6 1.1
I **Memo bil+mul IDA Debt Reduction 0.1 0.2
Sources: DAC Table 2a and CRS Aid Activity database.
Let us now discuss the relevance of the various categories of ODA for our analysis of the impact of the PA. We first consider bilateral aid and find that 10 items should be included in the analysis.
Bilateral ODA
CPA grants
1. Project and programme (15.6% of EU aid). This includes capital projects and programme aid, which are central parts of aid transactions, and clearly it is one of the key parts relevant for the PA reforms.
2. Technical cooperation (11.5%). This is also a major part of bilateral cooperation, and also this is a type of aid flow that is focused in the PA.
3. ODA grants in AF packages (0.4%). Associated financing is a combination of ODA and other funding in packages. It is a very small share of ODA, but should be relevant.
4. Contributions to PPP (0.2%). Public private partnerships are another small share and measures contribution to private-public partnerships. Also this has some relevance for the PA.
5. Other grants (7.0%). This category is sizeable and consists of a broad range of projects not included above. These are central to the PA.
Non-CPA grants
6. Developmental food aid (0.6%). Even if this is not part of CPA it is worth considering whether the efficiency of food aid can be improved via PA type of changes.
7. Humanitarian aid (4.0%). This is a fairly large category that is not part of CPA, but again it may be worth considering whether PA can improve efficiency here.
8. Administrative costs (3.3%). Even if this is not part of CPA it is clearly an item that is highly relevant to consider from the PA perspective.
The Aid Effectiveness Agenda: The benefits of going ahead
Final Report - Contract nr. 2010/256898 Page 57 of 169
Non-Grant Bilateral ODA
9. Loans by government (9.0%).This is part of CPA, but the question is how much can be gained by coordinating this and whether governments are willing to let go of decisions about loans. Still, one may to some extent consider this component as well.
10. Equity acquisition (1.4%). The same arguments apply for this category as the previous one
Thus, in total we find that these ten types of bilateral flows which represent about 53% of EU aid should to be considered with regard to the effects of the implementation of the PA.
Let’s motivate why the other items of ODA are less important from the PA perspective.
Student costs (2.8%). This is costs associated with scholarships and studies in the donor countries, and it does not seem to be relevant from a PA perspective. This is something countries want to do themselves, and there is anyway hard to see any efficiency gains from coordinating this.
Debt forgiveness and other action on debt (2.2%). Here donors coordinate already, and it seems unlikely that individual donor countries would be willing to reduce their say in debt discussions below what it is today. And it is in any case hard to see any substantial savings from further coordination.
Support to NGOs (2.6%). The idea with aid through NGOs is that one shall not use the government channel. Thus, donors have chosen this route for some resources because they believe it to be most appropriate. Whether this way of channelling money is more or less efficient than the direct government to government channel we don’t know, but the PA was not designed to deal with these transfers. So we leave this category out of our analysis.
Support to International Private Organizations (0.3%). This is not part of EU controlled aid.
Promotion of Development Awareness (0.4%). This is money used to inform citizens in donor countries about aid, and this is main a national endeavour. There is very little to be gained by coordinating this internationally.
Refugees in Donor Countries (2.0%). These are costs of supporting refugees in the donor countries, and therefore it is a national undertaking where little can be gained by coordinating internationally.
The items that can be excluded from the analyses make up 10.6% of the aid, which means that the bilateral share of total EU ODA is 63.6%.
Multilateral ODA
Multilateral ODA make up the remaining 36.4% of EU aid. This consists of transfers to primarily the UN agencies, IDA, AMCs, IBRD, IFC, MIGA, Regional development Banks, GEF (Global Global Environment Facility Trust Fund), the Montreal Protocol, plus the COM as well as some concessional lending. The relevant item here from our point of view is transfers to the COM, since this one remains part of EU’s aid operations. The money transferred to the other multilateral organizations is outside the direct control of the COM and European countries, and we these transfers are outside the scope of our study. With regard to the part
The Aid Effectiveness Agenda: The benefits of going ahead
Final Report - Contract nr. 2010/256898 Page 58 of 169
channelled through the COM, however, the same 10 items listed above are potentially relevant for this study.
This aid is shown in the rightmost column in the table. If we do the same computation here as we did for bilateral aid we get the following numbers for the ten categories: Some categories are extremely small.
1. Project and programme (11.2% of EU total ODA).
2. Technical cooperation (2.0%)
3. ODA grants in AF packages (0%)
4. Contributions to PPP ( 0%)
5. Other grants (0.1%).
6. Developmental food aid (0.7%).
7. Humanitarian aid (2.0%)..
8. Administrative costs (1.9%).
9. Loans by government (0%).
10. Equity acquisition (0%).
The total share of EU-COM ODA is 17.0%
Share of EU ODA covered
Thus. in our analysis of the impact of the PA on the aid of the EU including member states we could consider 70% if we include loans and equity acquisition in our discussion. The latter component makes up about 10% of EU aid, but we will not do any analysis of that part. This means that eventually about 60% of EU aid will be covered in some way by our analysis. The remainder of ODA is made of non-relevant bilateral aid plus non-EU multilateral aid. What is done with regard to those in the name of the PA also matters, but it is not included in our analysis. One could of course consider what the implications would be of shifting resources from (or to) these categories, but we do not consider that aspect.
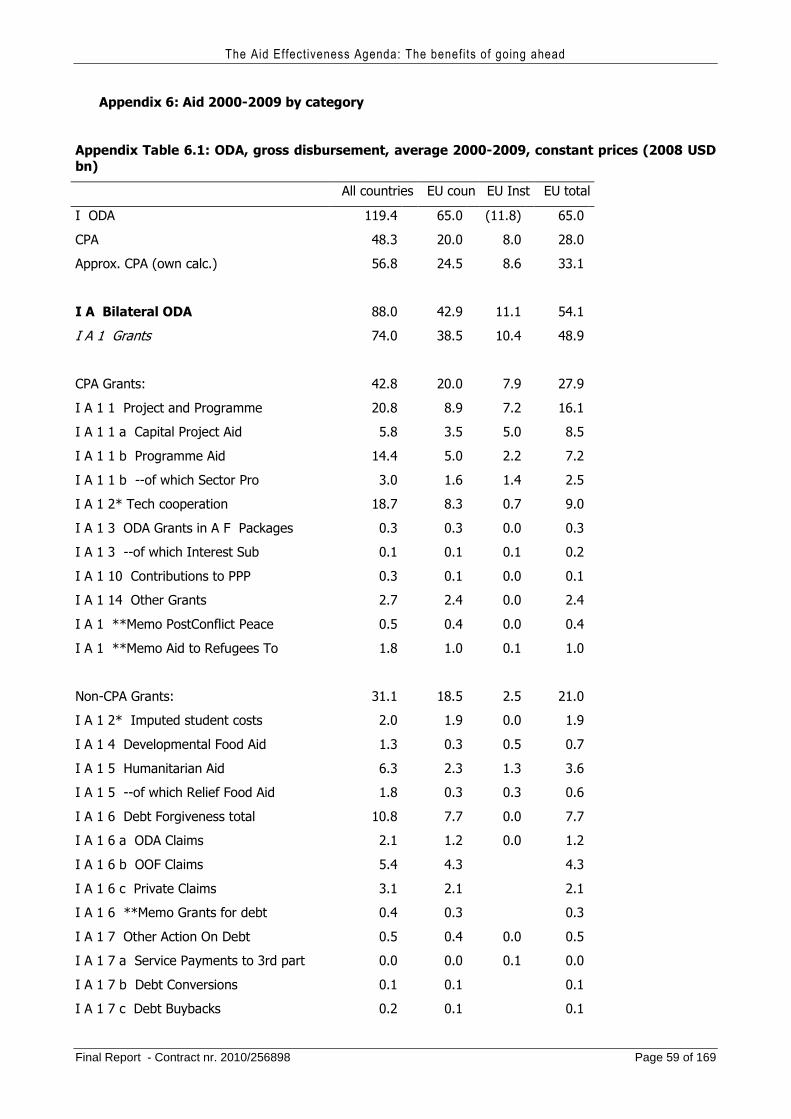
The Aid Effectiveness Agenda: The benefits of going ahead
Final Report - Contract nr. 2010/256898 Page 59 of 169
Appendix 6: Aid 2000-2009 by category
Appendix Table 6.1: ODA, gross disbursement, average 2000-2009, constant prices (2008 USD bn)
All countries EU coun EU Inst EU total
I ODA 119.4 65.0 (11.8) 65.0
CPA 48.3 20.0 8.0 28.0
Approx. CPA (own calc.) 56.8 24.5 8.6 33.1
I A Bilateral ODA 88.0 42.9 11.1 54.1
I A 1 Grants 74.0 38.5 10.4 48.9
CPA Grants: 42.8 20.0 7.9 27.9
I A 1 1 Project and Programme 20.8 8.9 7.2 16.1
I A 1 1 a Capital Project Aid 5.8 3.5 5.0 8.5
I A 1 1 b Programme Aid 14.4 5.0 2.2 7.2
I A 1 1 b --of which Sector Pro 3.0 1.6 1.4 2.5
I A 1 2* Tech cooperation 18.7 8.3 0.7 9.0
I A 1 3 ODA Grants in A F Packages 0.3 0.3 0.0 0.3
I A 1 3 --of which Interest Sub 0.1 0.1 0.1 0.2
I A 1 10 Contributions to PPP 0.3 0.1 0.0 0.1
I A 1 14 Other Grants 2.7 2.4 0.0 2.4
I A 1 **Memo PostConflict Peace 0.5 0.4 0.0 0.4
I A 1 **Memo Aid to Refugees To 1.8 1.0 0.1 1.0
Non-CPA Grants: 31.1 18.5 2.5 21.0
I A 1 2* Imputed student costs 2.0 1.9 0.0 1.9
I A 1 4 Developmental Food Aid 1.3 0.3 0.5 0.7
I A 1 5 Humanitarian Aid 6.3 2.3 1.3 3.6
I A 1 5 --of which Relief Food Aid 1.8 0.3 0.3 0.6
I A 1 6 Debt Forgiveness total 10.8 7.7 0.0 7.7
I A 1 6 a ODA Claims 2.1 1.2 0.0 1.2
I A 1 6 b OOF Claims 5.4 4.3 4.3
I A 1 6 c Private Claims 3.1 2.1 2.1
I A 1 6 **Memo Grants for debt 0.4 0.3 0.3
I A 1 7 Other Action On Debt 0.5 0.4 0.0 0.5
I A 1 7 a Service Payments to 3rd part 0.0 0.0 0.1 0.0
I A 1 7 b Debt Conversions 0.1 0.1 0.1
I A 1 7 c Debt Buybacks 0.2 0.1 0.1
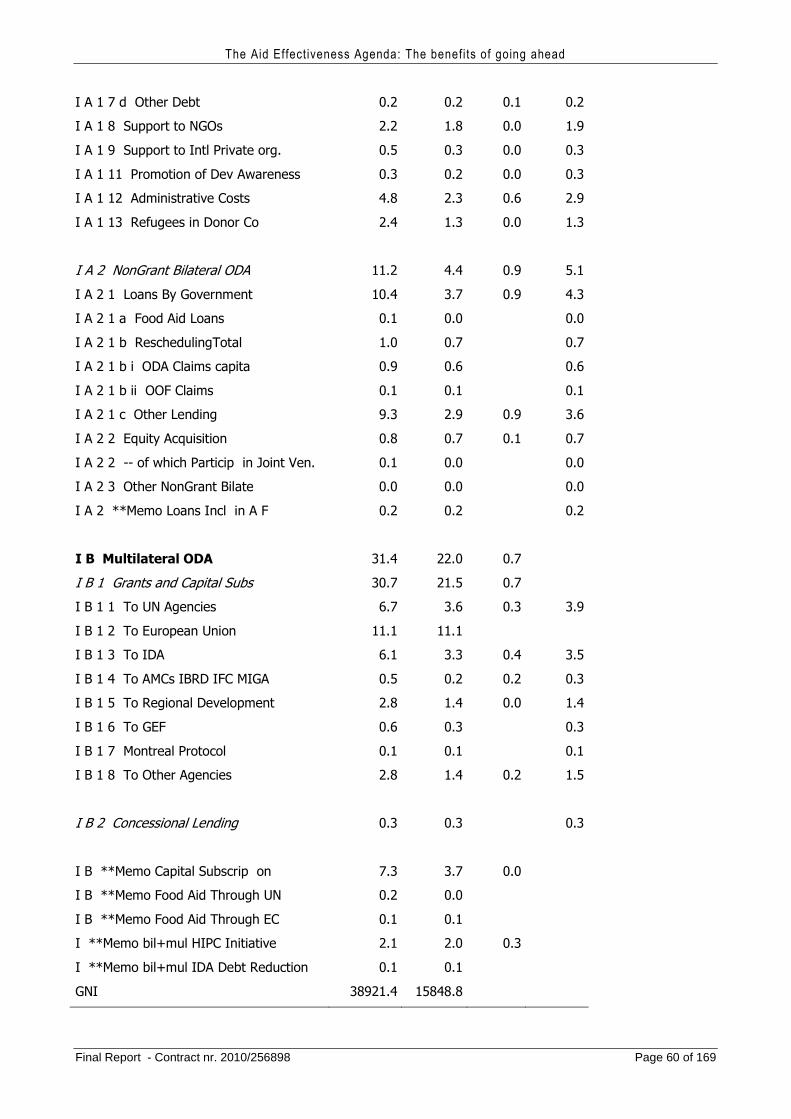
The Aid Effectiveness Agenda: The benefits of going ahead
Final Report - Contract nr. 2010/256898 Page 60 of 169
I A 1 7 d Other Debt 0.2 0.2 0.1 0.2
I A 1 8 Support to NGOs 2.2 1.8 0.0 1.9
I A 1 9 Support to Intl Private org. 0.5 0.3 0.0 0.3
I A 1 11 Promotion of Dev Awareness 0.3 0.2 0.0 0.3
I A 1 12 Administrative Costs 4.8 2.3 0.6 2.9
I A 1 13 Refugees in Donor Co 2.4 1.3 0.0 1.3
I A 2 NonGrant Bilateral ODA 11.2 4.4 0.9 5.1
I A 2 1 Loans By Government 10.4 3.7 0.9 4.3
I A 2 1 a Food Aid Loans 0.1 0.0 0.0
I A 2 1 b ReschedulingTotal 1.0 0.7 0.7
I A 2 1 b i ODA Claims capita 0.9 0.6 0.6
I A 2 1 b ii OOF Claims 0.1 0.1 0.1
I A 2 1 c Other Lending 9.3 2.9 0.9 3.6
I A 2 2 Equity Acquisition 0.8 0.7 0.1 0.7
I A 2 2 -- of which Particip in Joint Ven. 0.1 0.0 0.0
I A 2 3 Other NonGrant Bilate 0.0 0.0 0.0
I A 2 **Memo Loans Incl in A F 0.2 0.2 0.2
I B Multilateral ODA 31.4 22.0 0.7
I B 1 Grants and Capital Subs 30.7 21.5 0.7
I B 1 1 To UN Agencies 6.7 3.6 0.3 3.9
I B 1 2 To European Union 11.1 11.1
I B 1 3 To IDA 6.1 3.3 0.4 3.5
I B 1 4 To AMCs IBRD IFC MIGA 0.5 0.2 0.2 0.3
I B 1 5 To Regional Development 2.8 1.4 0.0 1.4
I B 1 6 To GEF 0.6 0.3 0.3
I B 1 7 Montreal Protocol 0.1 0.1 0.1
I B 1 8 To Other Agencies 2.8 1.4 0.2 1.5
I B 2 Concessional Lending 0.3 0.3 0.3
I B **Memo Capital Subscrip on 7.3 3.7 0.0
I B **Memo Food Aid Through UN 0.2 0.0
I B **Memo Food Aid Through EC 0.1 0.1
I **Memo bil+mul HIPC Initiative 2.1 2.0 0.3
I **Memo bil+mul IDA Debt Reduction 0.1 0.1
GNI 38921.4 15848.8
The Aid Effectiveness Agenda: The benefits of going ahead
Final Report - Contract nr. 2010/256898 Page 61 of 169
7. The transaction cost savings effects of coordinating EU aid
7.1. Introduction
In our analytical framework dealing with aid coordination we discussed the benefits of aid coordination extensively. We identified the role of economies of scale and scope in the aid process. We referred to the benefits of aid coordination as the cost savings effect. This chapter presents our estimates of those savings.
The main debate around aid coordination has been about how to coordinate aid to individual countries (Bigsten, 2006). Since aid activities are often complementary, donors need to coordinate to avoid inefficient aid allocations. How difficult it is to coordinate donors depends on the degree of similarity of their preferences. Donors may have different views on what matters for development, or different national interests. Multilateralism could help reduce the influence of vested interests in the various donor countries (Kanbur, 2000, 2003).
When it comes to the analysis of aid impacts it is important to consider how the donor-recipient relationship is organised and how it affects governance. The question is how the efficiency is affected by reduced administration of aid interventions. Administrative controls are important in some instances – and in particular if aid is given to poorly governed and possibly corrupt countries. It is certainly not possible or appropriate to bring the level of administration to zero, and this is not envisaged here.
Joint evaluations were emphasized in the Accra Agenda for Action in 2008, but already DAC’s Principles for Evaluation of Development Assistance of 1991 emphasized that joint evaluations should be promoted. In the literature there are five sets of reasons given for joint evaluation. They are 1. Overarching policy reasons; 2. Evaluation strategy motives, 3. Developmental motives; 4. Learning motives; 5. Managerial, administrative and financial motives (SADEV 2008, s. 3). Joint evaluations are more costly than individual donor evaluations, but they should still be cheaper than a set of independent evaluations. On the benefit side there may hopefully be better grounded results. The question is, however, if donors trust the evaluations of other agencies. Do they consider the same parameters? If not, the joint evaluation might not be a substitute for individual evaluations.
There is now a proliferation of global public goods facilities including Extractive Industries Transparency Initiative and several ones on climate change. This modality seems like a good way of pooling resources, but do we know whether what the effects of these initiatives are and whether the effect then is better than that of regular aid? They seem to be hard to fit into the PA framework.
7.2. Earlier estimates of transaction cost savings
Cost savings on aid transaction costs is a key part of the Paris agenda, and our first computations relate to this. Although the optimal overhead is not zero, our estimates give an indication about the savings that can potentially be made on administrative costs. The focus in this section is on the short-term or transaction costs of aid on the donor side, while costs and indirect governance effects on the recipient side are dealt with in Chapter 10.
The Aid Effectiveness Agenda: The benefits of going ahead
Final Report - Contract nr. 2010/256898 Page 62 of 169
The transaction costs of aid have been defined as “the costs arising from the preparation, negotiation, implementation and enforcement of agreements for the delivery of ODA” (Brown et al, 2000).29 The definition of transaction costs in the previous study (EC, 2009, p. 8) follows this one and is as follows:
“These are overhead costs associated with programming, identification, preparation, negotiation, agreement, implementation, monitoring and evaluation of aid activities (programmes and projects) including the policies, procedures and diverse donor rules and regulations for managing aid projects and programs, translations and adjustment to divergent fiscal periods. They may be incurred by donor governments, implementing agencies, or partner governments. These costs cover country analytical work carried out in the context of developing country/sector cooperation strategies, impact assessments (e g gender, environment or education) and capacity assessments (public expenditure and financial management system assessments and reviews). Such studies are often undertaken by each donor and can involve significant costs to both donor and partner governments, who are expected to provide information and staff time”
The previous study chose to cover only Country Programmable Aid, since that is intended to provide “a measure of the volume of actual aid to which aid effectiveness principles might be applied.” We agree that this is where most of the administrative costs savings can be made, and will focus on this part of aid when we look at the potential administrative cost savings. Furthermore, food aid and humanitarian aid are not the focus of the Paris agenda, which is another reason not considering them, although there should be some scope for rationalization there as well.
The main problem in identifying potential cost savings is to come up with reasonable estimates as to how much that could be saved by rationalizing aid allocation.30 The previous study (EC, 2009) split transaction costs as follows (p. 14):
“The costs of lack division of labour can be conceptually understood under the headings of donor proliferation and fragmentation of aid. We use the World Bank (2008) definition, which associates “proliferation” with the number of donors providing ODA to a given recipient country and in specific sectors and “fragmentation” with the number of donor-funded activities. Thus proliferation is associated with multiple donor country or sector programmes and fragmentation is associated with the number of aid activities (‘projects’). We look for evidence of the transaction cost impact of joint/pooled financing and/or co-financing instruments such as delegated co-operation (including sub-contracting of implementation to other donor agencies).”
This is one way of approaching the cost estimation, but it is not unproblematic. It is clear from the definitions of aid transactions given above that proliferation has costs both on the donor and recipient sides. The focus in this section is on costs on the EU donor side. This suggests that one should look at the number
29 According to Balugun (2005):the transaction costs of aid consist of
“• administrative costs: They arise from inputs of resources needed for the transaction. Main costs include administrative overheads, in particular staff time
• indirect costs: They result from the impact of the delivery mechanism on the achievement of development goals. Examples of indirect costs are undermining government ownership and policy consistency of ODA and public expenditure more generally; disbursement delays (and possible effects on future commitments), reduced effectiveness (as resources may go to lower priority areas), and overfinancing of capital vis-à-vis recurrent expenditure. It should be noted that most transaction costs here will relate to the degree of alignment of donors with government policy, rather than harmonisation between donors
• opportunity costs: They measure the benefits forgone from alternative applications of the resources consumed in the transaction. For instance, senior officials need to trade off their time between aid management and policy development.” 30 Djankarov et al (2008) and Knack and Rahman (2007) have done some estimates of the effects of proliferation.
The Aid Effectiveness Agenda: The benefits of going ahead
Final Report - Contract nr. 2010/256898 Page 63 of 169
of countries and at the number of activities a donor is involved in, that is start the analysis from the donor side rather than the recipient country side.
We believe that it is natural to break down the costs into donor costs and recipient costs. The recipient costs in turn can be broken down into administrative transaction costs on the one hand and indirect costs or alternative costs as indicated in the breakdown above. At the latter stage we need to measure donor proliferation within a country or in sectors with a country.31 We will for that purpose have to construct measures of donor proliferation or fragmentation which are relevant for the indirect recipient effects of aid. However, what we need here is an approach to deal with the issue from the donors’ point of view. To come up with an estimate of potential donor savings we need to make an assumption about the scope for reduction in the number of partner countries and activities per donor as well as estimates of the cost savings this would imply.
Let us first discuss further how our predecessors (EC, 2009) investigated proliferation. They looked at the number of donor offices in a country. They then discussed how much could be saved by various reductions in donor office presence – say max 3 EU offices. They further looked at the number of expatriates per office, costs of preparing country programmes for priority countries and differentiate costs between priority and non-priority countries, number of missions and studies which increase with the number of donors. There could also be an addition for change in HQ costs.
The resulting estimates for country level donor proliferation were as follows:
1 Duplication of the country programming processes. Joint annual programming exercises could save €100 million per year
2 Duplication of country office/representation. By having fewer offices €100 million per year could be saved.
3 Duplication of missions and studies. Rationalizing these could save €90 million per year.
Then they used CRS data to compute the number of donors present in each sector for all recipient countries. They focused on minor donors, who annually transferred 2.1 billion to sectors. Assuming this could be disbursed through delegated cooperation arrangements and/or JFA administrative costs could be reduced by 5-8%.32 Their estimate of this was €60-100 Million.
Finally, they referred to project fragmentation, where they looked at the costs of starting up new aid activities. They discuss both costs of preparation, and implementation, but estimates focused on the former part since it was considered to be hard to quantify implementation costs. They found that 22000 new projects are started in a year. Each start-up requires on average 4-6 staff months of planning (€40000-60000) and a consultant mission (€50000 – 80000) giving a total cost of per project of €90000-140000. This means that the annual project preparation cost for the EU to start projects was in the range of €1.9-3 billion. If instead these 22000 projects had been consolidated into 5 sector programmes per country (151) there would instead be 755 sector support programmes to start up. Their estimate is that this would cost 0.7 million per programme, giving total costs of €500 million per year. This implies that there would be a saving of equal to the difference between €1.9-3 and €0.5 billion, that is €1.4 – 2.5 billion. This is a very high estimate given that the total reported administrative costs in 2009 are about $3200 million. It also seems large also relative to the estimates for Swedish aid in Sida’s annual report for 2009, which indicates that the amount of labour required in the preparation of a project is about 0.11 man-years with a price tag of about €15,000.
31 E.g. Djankov et al. (2008) constructed an index of global donor proliferation (fragmentation in their terminology). 32 EC (2009) note that when implementation is delegated to multilateral or bilateral agencies OH reimbursements tend to vary between 6 and 12 % of funds for TA. Rates for Financial aid (FA) are around 3-6 %. When delegated to NGOs etc. implementation costs are included in the project costs (and not reported as administrative costs). Normal overheads in TC projects 10-30% of project costs.
The Aid Effectiveness Agenda: The benefits of going ahead
Final Report - Contract nr. 2010/256898 Page 64 of 169
It is not completely clear where these costs are located, but probably they can be regarded as headquarter costs. However, it seems in any case as if headquarter costs related to the supervision and running of existing projects and programmes is not included anywhere. It is also noted that costs for the ending of projects (evaluation and audit) are not very high but hard to come by. It was argued that fewer and larger projects could reduce implementation costs, but no data were provided on the relationship between project/programme size and administrative costs. It is thus a concern that the former estimates are not comprehensive because of the lack of coverage of some administrative cost items. It is also a concern that they seem unrealistically high relative to what is reported by the donors as administrative costs.
We will therefore follow an approach that will include all administrative costs of the donors report (admittedly not perfectly reported) and use an alternative approach to the estimation of investigate how much that budget can be reduced. Our analysis of the indirect effects is presented in Chapter 10.
7.3. Our approach
To get full coverage of all transaction costs of the donors we propose a strategy where we start from comprehensive information from the donors on all their administrative costs and evaluate how much of this cost donors could save by concentrating activities. By doing it like this we can start from existing estimates of administrative costs within the EU. There can be concentration by country and there can be concentration to fewer activities. The challenge is to know how much that can be saved by concentration. We assume that the aid budget will not shrink, which means that the remaining activities will be larger. We don’t think that they can grow in size without some increase in administrative overheads. However, there are clearly economies of scale so the increase is not proportional to the growth of the budget. We will make an econometric estimate of the magnitude of the economics of scale.
The steps in our computation of administrative savings possible for year 2009 are done as follows:
Step 1: We first scale down the administrative cost by reducing the number of partners countries. We estimate the percentage reduction in administrative costs when reducing the number of recipients, while keeping the overall aid budget constant and not changing the composition of the aid flow, that is the mix of projects and programmes. To be able to do this we need an estimate of the economies of scale in aid delivery, and we will derive it with the help of regression analysis.
Step 2: We then reduce costs further by changing the aid modality. We investigate how much money that can be saved by shifting money from projects to programmes. This gives an extra cost saving on top of the effect of country concentration. So we estimate the required amount of aid that goes from bilaterals as project support that needs to be shifted to programme support to meet the target of the Paris declaration in this regard. To get an estimate of how large the cost savings are we need an estimate of the administrative cost reductions such a shift implies. One might here expect that there are also efficiency consequences of a switch from projects to programs. Administrative costs of recipients would probably tend to fall, while leakages of resources might increase. There may also be specific instances where projects should be preferred. However, we cannot be certain about the sign of the aggregate of these excluded effects, and we are not able to incorporate these potential effects in our estimation.
Let us first describe the steps of the calculation in our main case. Than we report the results of some sensitivity analyses.
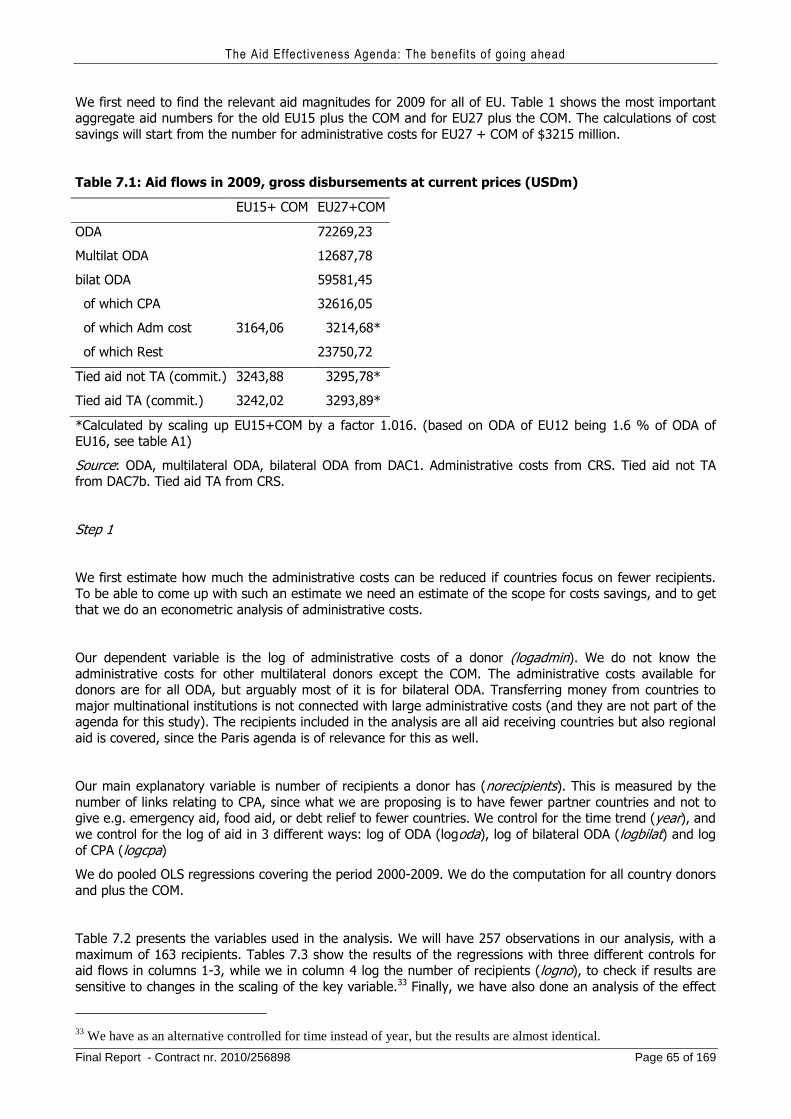
The Aid Effectiveness Agenda: The benefits of going ahead
Final Report - Contract nr. 2010/256898 Page 65 of 169
We first need to find the relevant aid magnitudes for 2009 for all of EU. Table 1 shows the most important aggregate aid numbers for the old EU15 plus the COM and for EU27 plus the COM. The calculations of cost savings will start from the number for administrative costs for EU27 + COM of $3215 million.
Table 7.1: Aid flows in 2009, gross disbursements at current prices (USDm)
EU15+ COM EU27+COM
ODA 72269,23
Multilat ODA 12687,78
bilat ODA 59581,45
of which CPA 32616,05
of which Adm cost 3164,06 3214,68*
of which Rest 23750,72
Tied aid not TA (commit.) 3243,88 3295,78*
Tied aid TA (commit.) 3242,02 3293,89*
*Calculated by scaling up EU15+COM by a factor 1.016. (based on ODA of EU12 being 1.6 % of ODA of EU16, see table A1)
Source: ODA, multilateral ODA, bilateral ODA from DAC1. Administrative costs from CRS. Tied aid not TA from DAC7b. Tied aid TA from CRS.
Step 1
We first estimate how much the administrative costs can be reduced if countries focus on fewer recipients. To be able to come up with such an estimate we need an estimate of the scope for costs savings, and to get that we do an econometric analysis of administrative costs.
Our dependent variable is the log of administrative costs of a donor (logadmin). We do not know the administrative costs for other multilateral donors except the COM. The administrative costs available for donors are for all ODA, but arguably most of it is for bilateral ODA. Transferring money from countries to major multinational institutions is not connected with large administrative costs (and they are not part of the agenda for this study). The recipients included in the analysis are all aid receiving countries but also regional aid is covered, since the Paris agenda is of relevance for this as well.
Our main explanatory variable is number of recipients a donor has (norecipients). This is measured by the number of links relating to CPA, since what we are proposing is to have fewer partner countries and not to give e.g. emergency aid, food aid, or debt relief to fewer countries. We control for the time trend (year), and we control for the log of aid in 3 different ways: log of ODA (logoda), log of bilateral ODA (logbilat) and log of CPA (logcpa)
We do pooled OLS regressions covering the period 2000-2009. We do the computation for all country donors and plus the COM.
Table 7.2 presents the variables used in the analysis. We will have 257 observations in our analysis, with a maximum of 163 recipients. Tables 7.3 show the results of the regressions with three different controls for aid flows in columns 1-3, while we in column 4 log the number of recipients (logno), to check if results are sensitive to changes in the scaling of the key variable.33 Finally, we have also done an analysis of the effect
33 We have as an alternative controlled for time instead of year, but the results are almost identical.
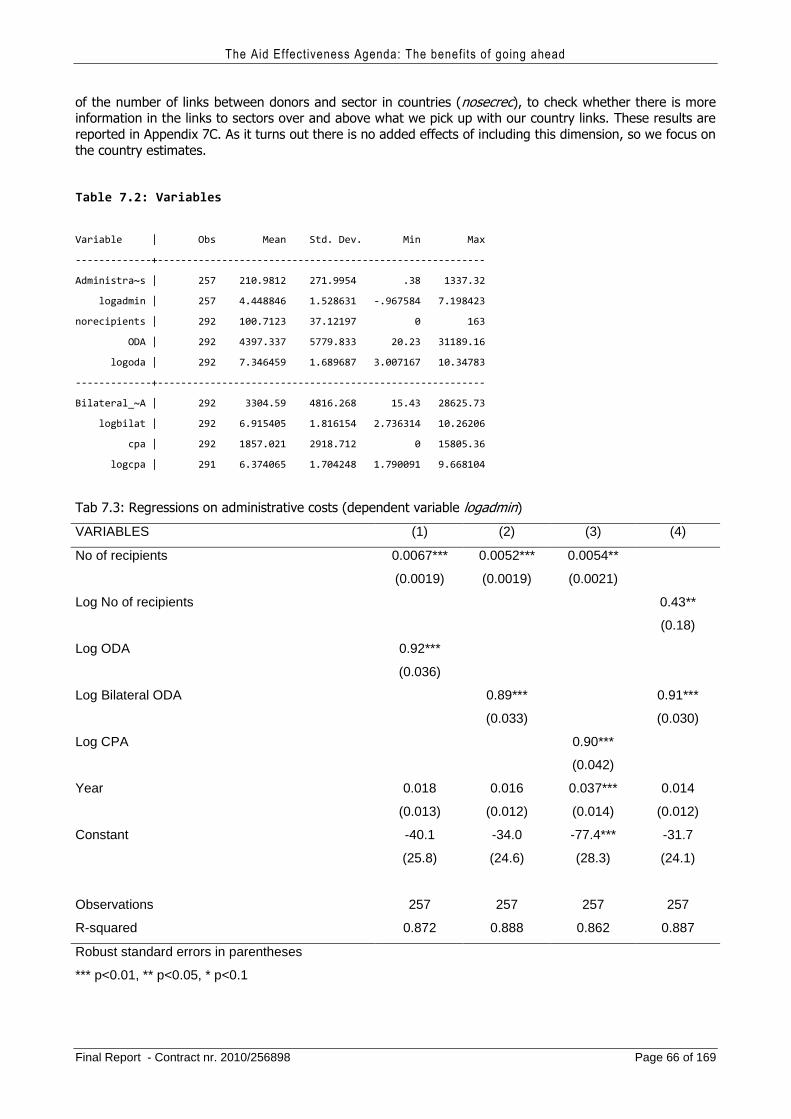
The Aid Effectiveness Agenda: The benefits of going ahead
Final Report - Contract nr. 2010/256898 Page 66 of 169
of the number of links between donors and sector in countries (nosecrec), to check whether there is more information in the links to sectors over and above what we pick up with our country links. These results are reported in Appendix 7C. As it turns out there is no added effects of including this dimension, so we focus on the country estimates.
Table 7.2: Variables
Variable | Obs Mean Std. Dev. Min Max
-------------+--------------------------------------------------------
Administra~s | 257 210.9812 271.9954 .38 1337.32
logadmin | 257 4.448846 1.528631 -.967584 7.198423
norecipients | 292 100.7123 37.12197 0 163
ODA | 292 4397.337 5779.833 20.23 31189.16
logoda | 292 7.346459 1.689687 3.007167 10.34783
-------------+--------------------------------------------------------
Bilateral_~A | 292 3304.59 4816.268 15.43 28625.73
logbilat | 292 6.915405 1.816154 2.736314 10.26206
cpa | 292 1857.021 2918.712 0 15805.36
logcpa | 291 6.374065 1.704248 1.790091 9.668104
Tab 7.3: Regressions on administrative costs (dependent variable logadmin)
VARIABLES (1) (2) (3) (4)
No of recipients 0.0067*** 0.0052*** 0.0054**
(0.0019) (0.0019) (0.0021)
Log No of recipients 0.43**
(0.18)
Log ODA 0.92***
(0.036)
Log Bilateral ODA 0.89*** 0.91***
(0.033) (0.030)
Log CPA 0.90***
(0.042)
Year 0.018 0.016 0.037*** 0.014
(0.013) (0.012) (0.014) (0.012)
Constant -40.1 -34.0 -77.4*** -31.7
(25.8) (24.6) (28.3) (24.1)
Observations 257 257 257 257
R-squared 0.872 0.888 0.862 0.887
Robust standard errors in parentheses
*** p<0.01, ** p<0.05, * p<0.1
The Aid Effectiveness Agenda: The benefits of going ahead
Final Report - Contract nr. 2010/256898 Page 67 of 169
The results of the three major regressions are similar with the coefficient of interest, norecipients, a bit above 0.005. In column 4 we report results of replacing number of recipients with its log. The size of the estimate is in line with the estimates without logarithm on number of recipients, so our results are robust with regard to that change.
The most relevant estimate for us is the one where CPA is used as a control, so we use the value 0.0054 in our computation. The average number of recipient countries in our sample is 100.7 (see Table 7.2), and the question is how large a reduction we should simulate. The Paris Declaration does not provide any target for this. So we follow the tradition in economics and as our main case we test the effect of a reduction in the number of partner countries by one standard deviation, that is 37 countries. This is thus equivalent to a reduction in the number of partners by 37%. The effect of this concentration is that the log of administrative costs decreases by 37*0.0054=0.2. That means that Admin would decreases by about 20 %. Applying this 20% estimate on total EU administrative costs of $3215 million (from Table 7.1), we get a saving of 0.2 * 3215 = $643 Million. This is equivalent to €461 Million in 2009 prices.34
Step 2
Once donors have focused on fewer countries, they can as a second step change the modalities of aid. It is a challenge to get estimates of the price tags of administration for different modalities. We don’t have comprehensive estimates of this, but we have information from the Swedish aid agency Sida. This is a medium sized bilateral donor, which probably can be taken to be rather typical in terms of administrative costs.
Sida undertook a detailed analysis of its administrative costs in 2010, which was presented in the annual report for that year (Sida, 2011). The administrative costs identified were of four types:
1. Preparation of policy strategy and method documents 2. Implementation of strategies for development cooperation 3. Collaborate and advice internationally and nationally 4. Management, steering and support.
The reported cost shares for those four categories were 4.1%, 46.0%, 4.9%, and 44.9% respectively. In 2010 35% of the administrative costs related to aid characterized as programme aid, while as much as 60% of the money was allocated to these programmes. We further note that 61% of administrative costs are related to project aid, which takes 35% of the money. Using this information we can conclude that programme aid per dollar disbursed only costs 33.5% as much as project aid in donor administration costs. General budget support specifically is cheap in terms of administration with a cost of 19.1% relative to the average for project support. Technical assistance accounts for 5 % of the aid and 4 % of the administrative costs. This implies money transferred as TA had a transaction cost of 45.9 % of the costs for a project. Thus, also technical assistance is associated with relatively low administrative costs. If we relate the total administrative cost recorded by Sida of 922 million SEK to total Sida expenditures of 14240 SEK, we find that the average administrative cost was 6.5 % of total expenditures.35
Easterly and Pfutze (2008) collected information from donors about administrative costs. They point out that there are many problems in this work. For example, they note that when it comes to number of agencies one should note that many bilaterals donors have more than one aid agency /but we do not take this into account. They also consider the extra costs associated with what they consider to be ineffective aid channels. They argue that tied aid is nothing more than ill-disguised export promotion and that food aid is in
34 Converting from Dollars to Euro we use the average exchange rate for 2009 according to the American Fed. This was 1.3935 Dollars per Euro. 35 Total personnel costs were 613 million SEK (Sida, 2011, p. 124).
The Aid Effectiveness Agenda: The benefits of going ahead
Final Report - Contract nr. 2010/256898 Page 68 of 169
kind and could generally be bought more cheaply in the market. They also argue that TA is often tied and reflecting donor priorities rather than those of the recipients.
They describe their data on overhead costs as the most novel, but note that this kind of aid data is the least trustworthy. It is hard to get consistent data. They compute the ratio of costs to official development financing (defined as the sum of ODA and non-concessional loans). This indicator takes the entire administrative budget. The estimates they present (their Table 4) indicates that there is a huge variation across countries and multilaterals. The average for bilaterals is 7%. It is noteworthy that the share of administrative costs in their sample of 21 countries is close to our own estimate for Sida, which may indicate that Sida is a rather typical donor. This makes it possible to use the Sida data for our (mainly) bilateral computations. Easterly and Pfutze find that the OH share for multilaterals is 12%. They provide no estimate for the COM, but we could assume that the COM is like an average multilateral in terms of OH costs.
Knack et al (2010) look at the geographic concentration of aid for each donor. They consider aid concentration by sector, average number of sectors receiving aid of each recipient, number of recipients aided by each donor, average size of projects, contribution to multilateral donors, and administrative costs as a share of aid. Knack et al. argue alongside Easterly and others that the share of grants (not loans) in aid is an ambiguous indicator, since there are special problems relating to grants as well. Easterly points to the fact that grants may not require investments that allow later repayment of the loan.
The focus in the Paris Declaration is about shifting to programme based approaches (PBA) from non-PBA, that is projects and technical assistance. What we simulate here is a shift from projects to programmes, while we leave technical assistance aside. The goal set up is to have 66 % of the aid through PBA, so what we look at is a reduction on the project side in favour of programmes.
After reducing the number of recipients in Step 1 the administrative costs remaining in our main case is $2572 million. We now want to consider how much of this that is affected by a shift from non-PBA (projects) to PBA. We first compute how much of these costs are related to CPA, since this is where most of the costs savings will occur. We find that 73.3 % (see Appendix 7Ba) of the administrative costs, that is $1885 million, are related to CPA.
The target of the Paris agenda is to increase the share of flows going through programme based approaches to 66 %. This could possibly be interpreted to mean 66 % of total ODA, but in our estimate here were interpret it to mean that 66 % of CPA is to go through PBA. With the broader interpretation the estimate would of course be larger than what we get here. If we increase the proportion of CPA that is PBA from the actual level for 2009 of 43.7% to 66%, the administrative costs related to CPA will be lowered by 20.9 % (see appendix 7Bb). That is a cost saving of 0.209*1885 = $394 million. This is equivalent to €283 million.
Summing up the results of our two steps we get a total saving on transaction costs of €744 million.
Sensitivity analyses
The results of our main case simulation of course depend on the assumptions made, so we first produce an alternative estimate of the consequences of halving the reduction in the number of countries (Alternative calculation 1). Secondly, we show how the results vary if we let the estimated coefficient of the effect vary within the 95% confidence interval (Alternative calculation 2).
Alternative calculation 1: We consider the effect of only reducing the number of partner countries by half a standard deviation, that is by 19 countries. This is equivalent to a reduction in the number of partners by 19 %. The effect of this concentration is that the log of administrative costs decreases by 19*0.0054=0.103,
The Aid Effectiveness Agenda: The benefits of going ahead
Final Report - Contract nr. 2010/256898 Page 69 of 169
which implies that Admin would decrease by 10.3 %. Applying this estimate on total EU administrative costs of $3215 million (from Table 7.1), we get savings of 0.103 * 3215 = $331 million. This is equivalent to €238 million in 2009 prices.
We then do step 2 in our analysis. After reducing the number of recipients in Step 1 the administrative costs remaining would be 3215-331=2884. We now want to consider how much of this that is affected by a shift from non-PBA (projects) to PBA. We first compute how much of these costs that are related to CPA, since this is where most of the costs savings will occur. We again let 66 % of CPA be transferred as PBA, and by doing the same set of computations as in the base case we here find that we would save 0.209*2114 = $442 million. This is equivalent to €317 million.
Thus, a reduction of the number of partner countries by half a standard deviation while keeping the other assumptions constant would imply a total transaction cost saving of $773 million or €555 million, which is about 75% of the base scenario savings.
Alternative calculation 2: Here we investigate what happens if we let the coefficient measuring the effect of concentration on costs vary within the 95 % confidence interval, which means that it will be in the range from 0.0012 to 0.0096. In this computation we retain the original 37% reduction in the number of partners from the base case. The effect of this concentration is that the log of administrative costs would decrease by between 37*0.0012=0.044 at the lower bound and 37*0.0096=0.355 at the upper bound. This means that the Admin would decrease would be between 4.4 % and 29.9 %36. Applying this estimate on total EU administrative costs of $3215 million (from Table 7.1), we get savings of 4.4 % to 29.9 % * 3215 = 141 (low) – 961 (high). This is equivalent to a span of to €101 - €689 million in 2009 prices.
After reducing the number of recipients in Step 1 the administrative costs remaining would be in the range $2254 (high) – $3074 (low) million. We now repeat the operation from above and find that the cost saving in this case will be in the range of 0.209*1652 (high) – 2253 (low) = $345 (high) – $471 (low) million. This is equivalent €248 - €338 million.
Adding up the results of the two step gives us an estimate of total savings from lowered transaction costs in the range [141 (low, based on the lowest value of the coefficient) – 961 (high)] + [345 (high) – 471 (low)] = $612 (low) – $1306 (high) million. Thus, looking at the 95 % confidence interval for the coefficient of number of recipients we find that the administrative costs saving would be in the range €439 - €937 million in 2009 prices.
Our sensitivity analysis first showed that halving the country concentration while keeping the modality assumptions constant would lead to a reduction in the savings relative to the base scenario by 25 %. Then we showed that keeping the base case country concentration constant, while considering the uncertainty of our predicted coefficient for the effect of concentration on costs, the effect on savings would at the low end be 41 % lower or at the high end 26 % larger than in the base scenario.
Comparing COM and EU15: We have in our analysis treated COM as any other donor, but it may also be of interest to see whether administrative costs differ between the COM and the EU15. We here simply compare average costs per unit of aid delivered. Some variations of these calculations are shown in Table 7.4.
36 Since 0.355 is a large number using the standard approximation would be too unprecise. Therefore we carry out the calculation: e^(-0.355) - 1 = - 0.299.
The Aid Effectiveness Agenda: The benefits of going ahead
Final Report - Contract nr. 2010/256898 Page 70 of 169
Table 7.4: Average administrative costs of COM and EU15 in 2009 (USD millions)
EU15 COM EU15+COM
Admin costs 2401 763 3164
CPA 22885 9485 32370
Bilateral ODA 46187 13024 59211
Admin/bilat ODA 0,052 0,059 0,053
Admin/CPA 0,105 0,080 0,098
Recipient unspec. 6848 595 7443
CPA+recipient unspec. 29733 10080 39813
admin/CAP+ 0,081 0,076 0,079
Source: Tables 7A1, 7A2
We see that administrative costs/bilateral ODA are a bit higher in COM at 5.9 % relative to the EU15 where it is 5.2 %. On the other hand, when looking at costs in relation to CPA (that is, excluding debt relief, humanitarian aid, aid to “recipient unspecified”, and some other posts), COM has 8.0 %, which is lower than EU15’s 10.5 %. This difference may be due to the fact that the COM seems to be better in reporting clearly, since the post “recipient unspecified”, which is excluded from CPA, is much lower for COM than for EU15 (see table 7A2). If we assume that all of “recipient unspecified” should belong to CPA, and therefore include it in CPA, we can construct CPA+. Using this measure the difference is quite small: 7.6 % for COM and 8.1 % for EU15. Thus, these simple computations suggest that the average costs of aid delivery are rather similar for COM and EU15. It does not seem to be the case that the Community is able to exploit its large scale relative to the bilaterals to get lower transaction costs.
7.4. Concluding remarks
It should be noted that as much as 29 % (or $12273 million) of CPA is technical assistance (see appendix 7Bc), and this is not included in our computation. There are two reasons. First, we can reach the 66 % target by only shifting from projects to programmes. And as we have noted there is a bigger saving from shifting from project to programmes than shifting from TA to programmes based on the price tags derived above. Secondly, it is less clear that it is as feasible to shift this type of aid into programmes. However, there should be some scope also here that donors could exploit if there is a political will to do so.
So the total cost savings from lowered transaction costs according to our base estimate would be above €700 million. We have also done some sensitivity analyses to show how sensitive these results are to changes in assumption and the precision of our estimate of the effects of concentration on costs. It is clear that there is a margin of uncertainty around the base prediction, but we still would argue that we have shown that the transaction costs savings are sizeable.
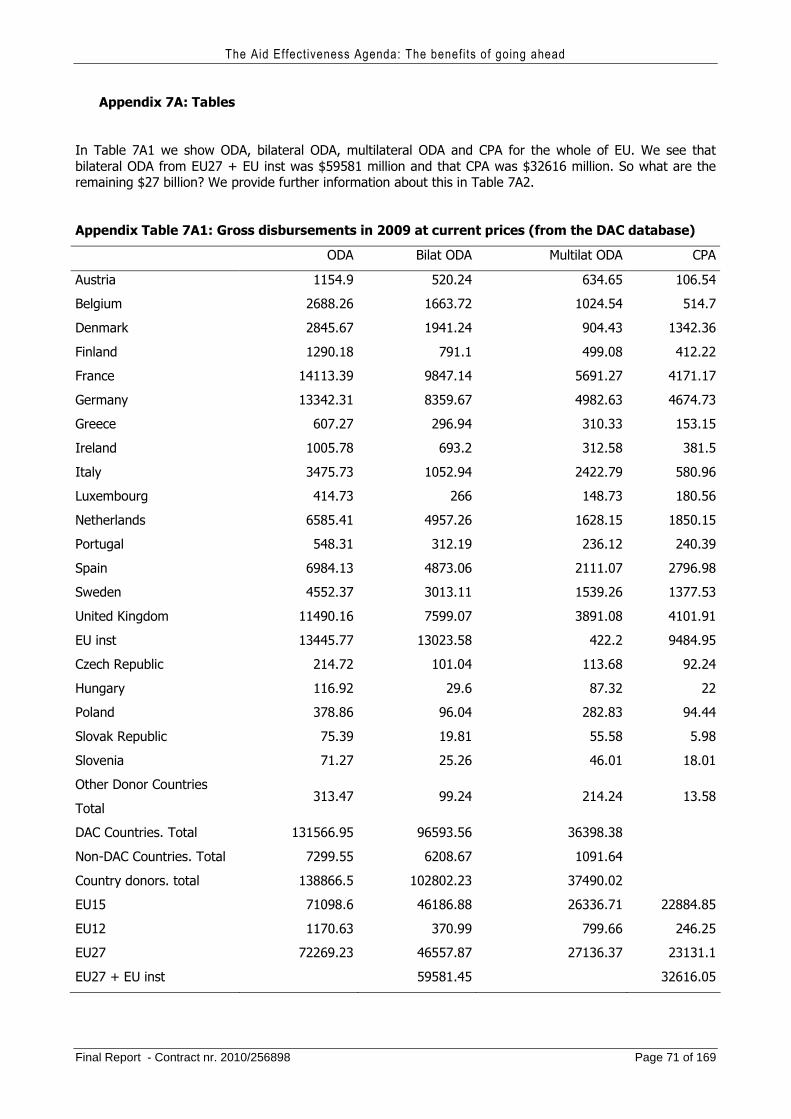
The Aid Effectiveness Agenda: The benefits of going ahead
Final Report - Contract nr. 2010/256898 Page 71 of 169
Appendix 7A: Tables
In Table 7A1 we show ODA, bilateral ODA, multilateral ODA and CPA for the whole of EU. We see that bilateral ODA from EU27 + EU inst was $59581 million and that CPA was $32616 million. So what are the remaining $27 billion? We provide further information about this in Table 7A2.
Appendix Table 7A1: Gross disbursements in 2009 at current prices (from the DAC database)
ODA Bilat ODA Multilat ODA CPA
Austria 1154.9 520.24 634.65 106.54
Belgium 2688.26 1663.72 1024.54 514.7
Denmark 2845.67 1941.24 904.43 1342.36
Finland 1290.18 791.1 499.08 412.22
France 14113.39 9847.14 5691.27 4171.17
Germany 13342.31 8359.67 4982.63 4674.73
Greece 607.27 296.94 310.33 153.15
Ireland 1005.78 693.2 312.58 381.5
Italy 3475.73 1052.94 2422.79 580.96
Luxembourg 414.73 266 148.73 180.56
Netherlands 6585.41 4957.26 1628.15 1850.15
Portugal 548.31 312.19 236.12 240.39
Spain 6984.13 4873.06 2111.07 2796.98
Sweden 4552.37 3013.11 1539.26 1377.53
United Kingdom 11490.16 7599.07 3891.08 4101.91
EU inst 13445.77 13023.58 422.2 9484.95
Czech Republic 214.72 101.04 113.68 92.24
Hungary 116.92 29.6 87.32 22
Poland 378.86 96.04 282.83 94.44
Slovak Republic 75.39 19.81 55.58 5.98
Slovenia 71.27 25.26 46.01 18.01
Other Donor Countries
Total 313.47 99.24 214.24 13.58
DAC Countries. Total 131566.95 96593.56 36398.38
Non-DAC Countries. Total 7299.55 6208.67 1091.64
Country donors. total 138866.5 102802.23 37490.02
EU15 71098.6 46186.88 26336.71 22884.85
EU12 1170.63 370.99 799.66 246.25
EU27 72269.23 46557.87 27136.37 23131.1
EU27 + EU inst 59581.45 32616.05
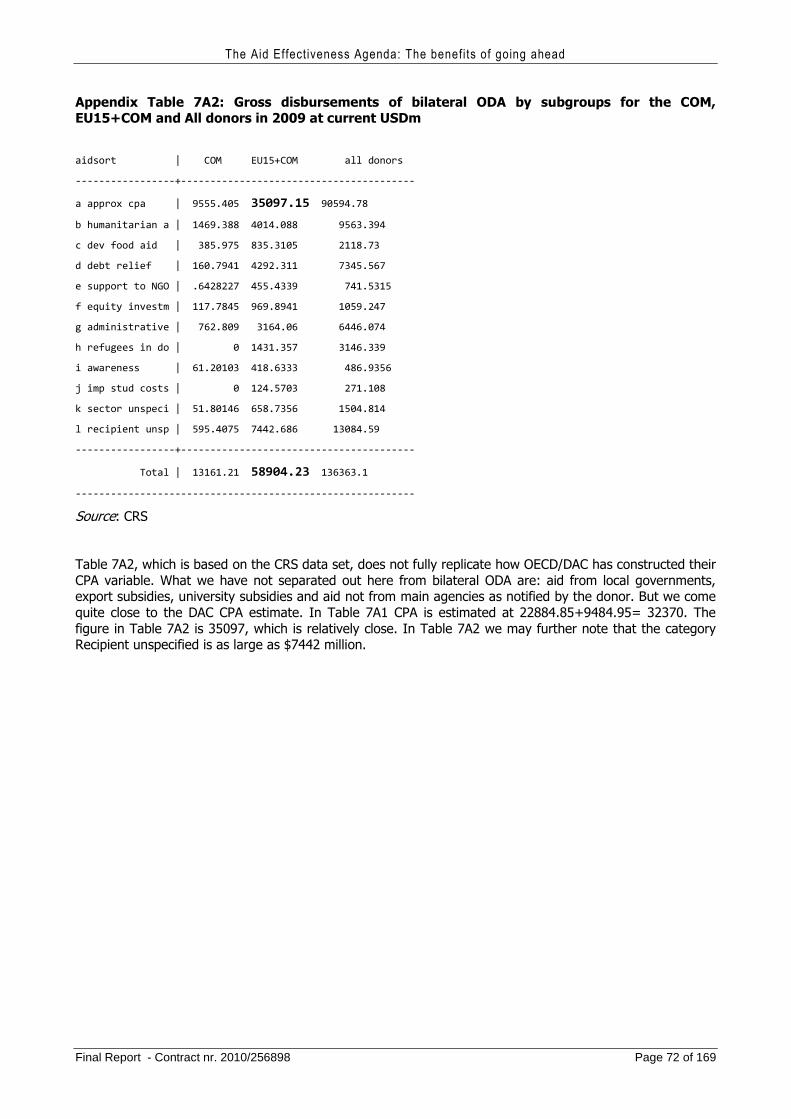
The Aid Effectiveness Agenda: The benefits of going ahead
Final Report - Contract nr. 2010/256898 Page 72 of 169
Appendix Table 7A2: Gross disbursements of bilateral ODA by subgroups for the COM, EU15+COM and All donors in 2009 at current USDm
aidsort | COM EU15+COM all donors
-----------------+----------------------------------------
a approx cpa | 9555.405 35097.15 90594.78
b humanitarian a | 1469.388 4014.088 9563.394
c dev food aid | 385.975 835.3105 2118.73
d debt relief | 160.7941 4292.311 7345.567
e support to NGO | .6428227 455.4339 741.5315
f equity investm | 117.7845 969.8941 1059.247
g administrative | 762.809 3164.06 6446.074
h refugees in do | 0 1431.357 3146.339
i awareness | 61.20103 418.6333 486.9356
j imp stud costs | 0 124.5703 271.108
k sector unspeci | 51.80146 658.7356 1504.814
l recipient unsp | 595.4075 7442.686 13084.59
-----------------+----------------------------------------
Total | 13161.21 58904.23 136363.1
----------------------------------------------------------
Source: CRS
Table 7A2, which is based on the CRS data set, does not fully replicate how OECD/DAC has constructed their CPA variable. What we have not separated out here from bilateral ODA are: aid from local governments, export subsidies, university subsidies and aid not from main agencies as notified by the donor. But we come quite close to the DAC CPA estimate. In Table 7A1 CPA is estimated at 22884.85+9484.95= 32370. The figure in Table 7A2 is 35097, which is relatively close. In Table 7A2 we may further note that the category Recipient unspecified is as large as $7442 million.
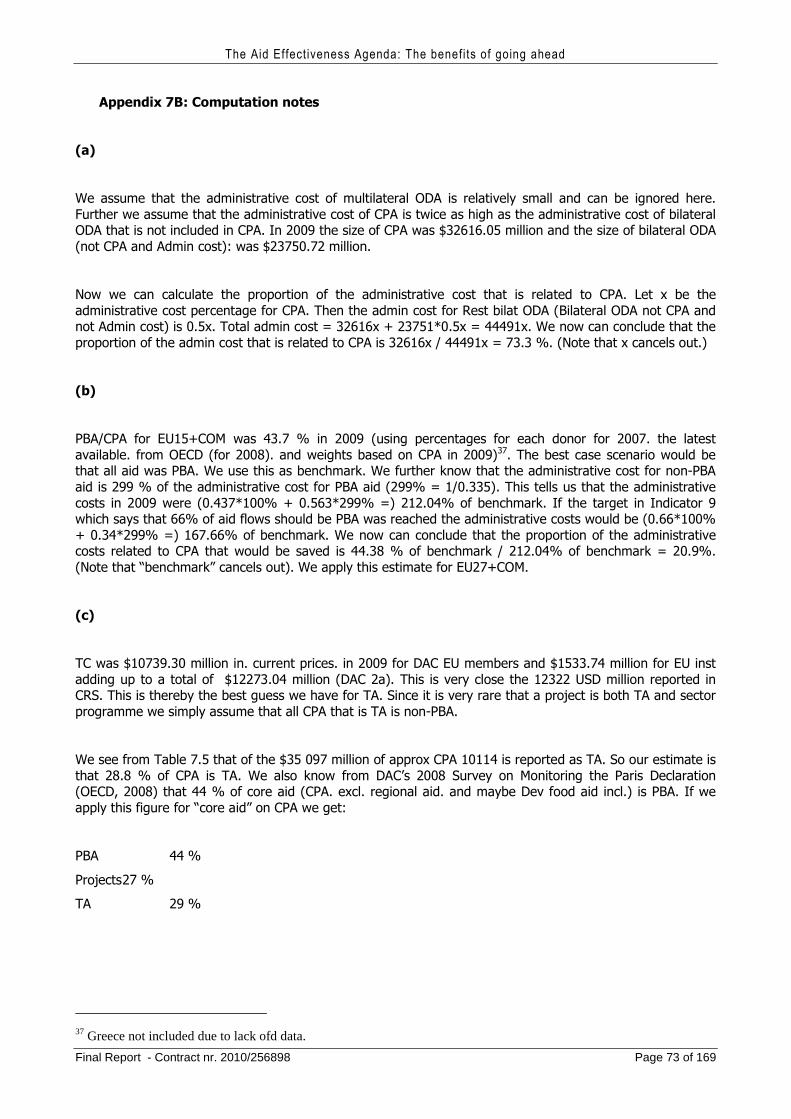
The Aid Effectiveness Agenda: The benefits of going ahead
Final Report - Contract nr. 2010/256898 Page 73 of 169
Appendix 7B: Computation notes
(a)
We assume that the administrative cost of multilateral ODA is relatively small and can be ignored here. Further we assume that the administrative cost of CPA is twice as high as the administrative cost of bilateral ODA that is not included in CPA. In 2009 the size of CPA was $32616.05 million and the size of bilateral ODA (not CPA and Admin cost): was $23750.72 million.
Now we can calculate the proportion of the administrative cost that is related to CPA. Let x be the administrative cost percentage for CPA. Then the admin cost for Rest bilat ODA (Bilateral ODA not CPA and not Admin cost) is 0.5x. Total admin cost = 32616x + 23751*0.5x = 44491x. We now can conclude that the proportion of the admin cost that is related to CPA is 32616x / 44491x = 73.3 %. (Note that x cancels out.)
(b)
PBA/CPA for EU15+COM was 43.7 % in 2009 (using percentages for each donor for 2007. the latest available. from OECD (for 2008). and weights based on CPA in 2009)37. The best case scenario would be that all aid was PBA. We use this as benchmark. We further know that the administrative cost for non-PBA aid is 299 % of the administrative cost for PBA aid (299% = 1/0.335). This tells us that the administrative costs in 2009 were (0.437*100% + 0.563*299% =) 212.04% of benchmark. If the target in Indicator 9 which says that 66% of aid flows should be PBA was reached the administrative costs would be (0.66*100% + 0.34*299% =) 167.66% of benchmark. We now can conclude that the proportion of the administrative costs related to CPA that would be saved is 44.38 % of benchmark / 212.04% of benchmark = 20.9%. (Note that “benchmark” cancels out). We apply this estimate for EU27+COM.
(c)
TC was $10739.30 million in. current prices. in 2009 for DAC EU members and $1533.74 million for EU inst adding up to a total of $12273.04 million (DAC 2a). This is very close the 12322 USD million reported in CRS. This is thereby the best guess we have for TA. Since it is very rare that a project is both TA and sector programme we simply assume that all CPA that is TA is non-PBA.
We see from Table 7.5 that of the $35 097 million of approx CPA 10114 is reported as TA. So our estimate is that 28.8 % of CPA is TA. We also know from DAC’s 2008 Survey on Monitoring the Paris Declaration (OECD, 2008) that 44 % of core aid (CPA. excl. regional aid. and maybe Dev food aid incl.) is PBA. If we apply this figure for “core aid” on CPA we get:
PBA 44 %
Projects 27 %
TA 29 %
37 Greece not included due to lack ofd data.
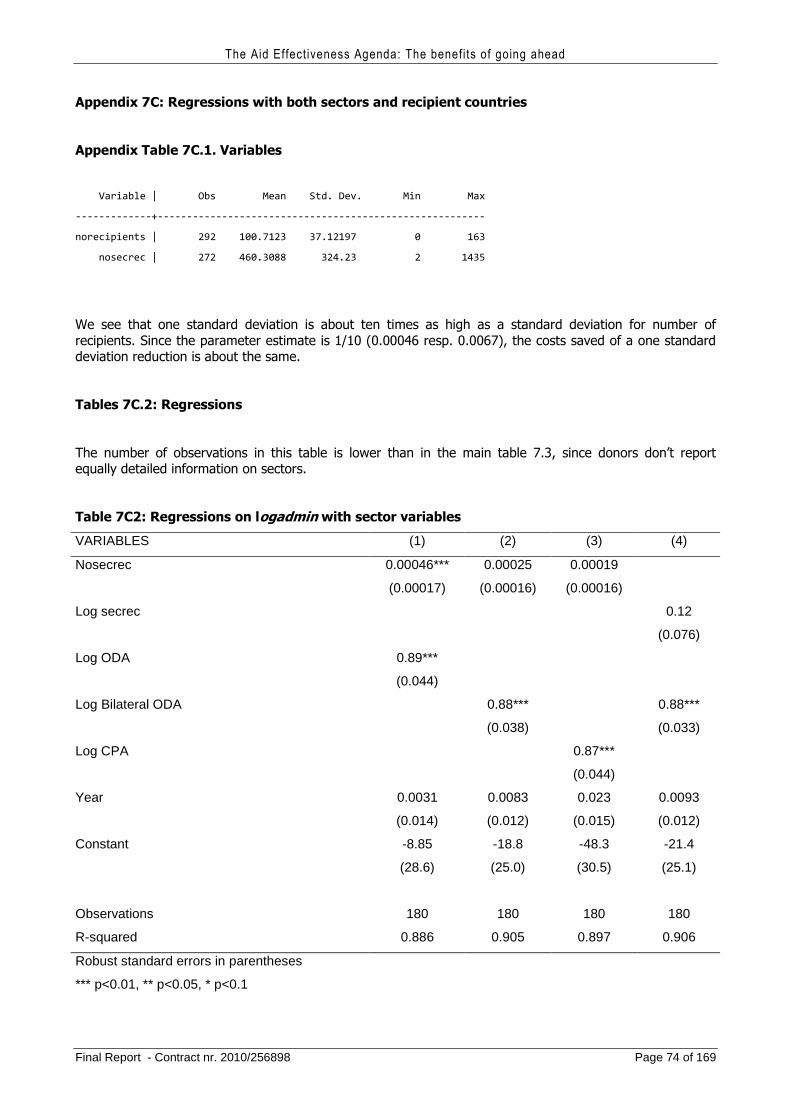
The Aid Effectiveness Agenda: The benefits of going ahead
Final Report - Contract nr. 2010/256898 Page 74 of 169
Appendix 7C: Regressions with both sectors and recipient countries
Appendix Table 7C.1. Variables
Variable | Obs Mean Std. Dev. Min Max
-------------+--------------------------------------------------------
norecipients | 292 100.7123 37.12197 0 163
nosecrec | 272 460.3088 324.23 2 1435
We see that one standard deviation is about ten times as high as a standard deviation for number of recipients. Since the parameter estimate is 1/10 (0.00046 resp. 0.0067), the costs saved of a one standard deviation reduction is about the same.
Tables 7C.2: Regressions
The number of observations in this table is lower than in the main table 7.3, since donors don’t report equally detailed information on sectors.
Table 7C2: Regressions on logadmin with sector variables
VARIABLES (1) (2) (3) (4)
Nosecrec 0.00046*** 0.00025 0.00019
(0.00017) (0.00016) (0.00016)
Log secrec 0.12
(0.076)
Log ODA 0.89***
(0.044)
Log Bilateral ODA 0.88*** 0.88***
(0.038) (0.033)
Log CPA 0.87***
(0.044)
Year 0.0031 0.0083 0.023 0.0093
(0.014) (0.012) (0.015) (0.012)
Constant -8.85 -18.8 -48.3 -21.4
(28.6) (25.0) (30.5) (25.1)
Observations 180 180 180 180
R-squared 0.886 0.905 0.897 0.906
Robust standard errors in parentheses
*** p<0.01, ** p<0.05, * p<0.1
The Aid Effectiveness Agenda: The benefits of going ahead
Final Report - Contract nr. 2010/256898 Page 75 of 169
8. The benefits of untying EU aid
One of the most cost increasing practices of aid donors is the tying of aid, and the elimination of this is also identified as a target in the Paris agenda. DAC (OECD, 2010c) characterizes aid as untied when proceeds from loans and grants are fully and freely available to finance procurement from all OECD countries and substantially all developing countries. Partially untied tied is defined as loans and grants which are tied, contractually or in effect, to procurement of goods and services from a restricted number of countries, which must include substantially all developing countries and can include the donor country. Finally, tied aid all other loans and grants are classified as tied aid, whether they are tied formally or through informal arrangements.
Our task here is to provide an estimate of the potential cost reductions if aid within the EU is untied. To compute this we need two parameters, the amount of EU aid that is tied and the cost increase associated with tying. Since we do our computations for the last year for which we have comprehensive data we need this information for 2009.
The previous EU report (EC, 2009) looked at the year 2007 and found that 10% of EU aid was tied and that the best estimate available for the increased cost was 15-30%. They applied this figure on reported commitments, and arrived at an estimate for the cost of aid tying within EU in the range €400-800 million per year.
Easterly and Pfutze (2008) discuss the extra costs associated with what they consider to be ineffective aid channels. They argue that tied aid is nothing more than ill-disguised export promotion and that food aid is in kind and could generally be bought more cheaply in the market. They argue that TA is often tied and reflecting donor priorities rather than those of the recipients. Also Knack, Rogers and Eubank (2010) look at those aspects when constructing their aid quality indicator and are concerned about the fact that TA is not covered in the DAC data set, although it could to a large degree be considered to be tied. This is not part of the reporting by DAC, and it is argued by OECD (2009c) that donors omit reporting because they want to avoid reporting a large share of tied aid. Still, data on the tying of TA is reported in the CRS data set and we use that.
Clay et al. (2009) provide a comprehensive review of the literature on the impact of tying aid and point out that the studies surveyed invariably conclude that there are welfare losses of tying relative to getting untied aid. There may be a counterargument indicting that the tying makes it possible or interesting for donors to give more aid. Still, in our calculations we will compare with the norm that the donor provides an equal amount of untied resources (which then may overestimate the actual flow effects of an enforced ban on tying),
Food aid is not part of country programmable aid, but this is a form of aid that has been much affected by tying, so we include it in our calculations. This is an area where the development in Europe has been favourable relative to the development in e.g. the USA. There has been a gradual shift from commodity-in-kind food aid towards cash based food assistance. Most of European food aid is now purchased locally or regionally, which is more efficient (Lentz and Barrett, 2008, Gaus et al., 2011). Much of European aid goes through the World Food Programme, and that part is outside the scope of our study. But we will consider the bilateral share of food aid. So this part of European aid does not suffer that much from tying and the gains the elimination of remaining tying is therefore limited.
There are several studies that attempt to estimate the cost to the recipient of tying. There are issues about data availability, the extent of informal tying, and the degree of fungibility and so on. All these difficulties mean that the estimates are only rough approximations. The classical reference is Jepma (1991), who
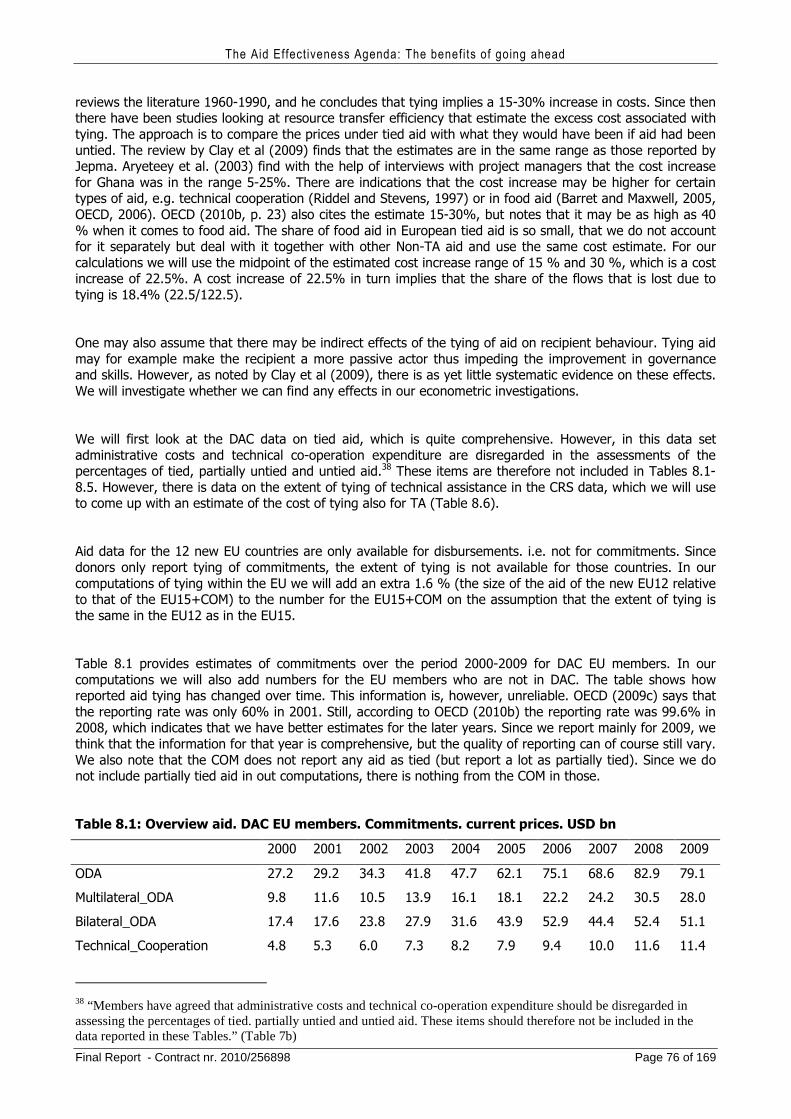
The Aid Effectiveness Agenda: The benefits of going ahead
Final Report - Contract nr. 2010/256898 Page 76 of 169
reviews the literature 1960-1990, and he concludes that tying implies a 15-30% increase in costs. Since then there have been studies looking at resource transfer efficiency that estimate the excess cost associated with tying. The approach is to compare the prices under tied aid with what they would have been if aid had been untied. The review by Clay et al (2009) finds that the estimates are in the same range as those reported by Jepma. Aryeteey et al. (2003) find with the help of interviews with project managers that the cost increase for Ghana was in the range 5-25%. There are indications that the cost increase may be higher for certain types of aid, e.g. technical cooperation (Riddel and Stevens, 1997) or in food aid (Barret and Maxwell, 2005, OECD, 2006). OECD (2010b, p. 23) also cites the estimate 15-30%, but notes that it may be as high as 40 % when it comes to food aid. The share of food aid in European tied aid is so small, that we do not account for it separately but deal with it together with other Non-TA aid and use the same cost estimate. For our calculations we will use the midpoint of the estimated cost increase range of 15 % and 30 %, which is a cost increase of 22.5%. A cost increase of 22.5% in turn implies that the share of the flows that is lost due to tying is 18.4% (22.5/122.5).
One may also assume that there may be indirect effects of the tying of aid on recipient behaviour. Tying aid may for example make the recipient a more passive actor thus impeding the improvement in governance and skills. However, as noted by Clay et al (2009), there is as yet little systematic evidence on these effects. We will investigate whether we can find any effects in our econometric investigations.
We will first look at the DAC data on tied aid, which is quite comprehensive. However, in this data set administrative costs and technical co-operation expenditure are disregarded in the assessments of the percentages of tied, partially untied and untied aid.38 These items are therefore not included in Tables 8.1-8.5. However, there is data on the extent of tying of technical assistance in the CRS data, which we will use to come up with an estimate of the cost of tying also for TA (Table 8.6).
Aid data for the 12 new EU countries are only available for disbursements. i.e. not for commitments. Since donors only report tying of commitments, the extent of tying is not available for those countries. In our computations of tying within the EU we will add an extra 1.6 % (the size of the aid of the new EU12 relative to that of the EU15+COM) to the number for the EU15+COM on the assumption that the extent of tying is the same in the EU12 as in the EU15.
Table 8.1 provides estimates of commitments over the period 2000-2009 for DAC EU members. In our computations we will also add numbers for the EU members who are not in DAC. The table shows how reported aid tying has changed over time. This information is, however, unreliable. OECD (2009c) says that the reporting rate was only 60% in 2001. Still, according to OECD (2010b) the reporting rate was 99.6% in 2008, which indicates that we have better estimates for the later years. Since we report mainly for 2009, we think that the information for that year is comprehensive, but the quality of reporting can of course still vary. We also note that the COM does not report any aid as tied (but report a lot as partially tied). Since we do not include partially tied aid in out computations, there is nothing from the COM in those.
Table 8.1: Overview aid. DAC EU members. Commitments. current prices. USD bn
2000 2001 2002 2003 2004 2005 2006 2007 2008 2009
ODA 27.2 29.2 34.3 41.8 47.7 62.1 75.1 68.6 82.9 79.1
Multilateral_ODA 9.8 11.6 10.5 13.9 16.1 18.1 22.2 24.2 30.5 28.0
Bilateral_ODA 17.4 17.6 23.8 27.9 31.6 43.9 52.9 44.4 52.4 51.1
Technical_Cooperation 4.8 5.3 6.0 7.3 8.2 7.9 9.4 10.0 11.6 11.4
38 “Members have agreed that administrative costs and technical co-operation expenditure should be disregarded in assessing the percentages of tied. partially untied and untied aid. These items should therefore not be included in the data reported in these Tables.” (Table 7b)
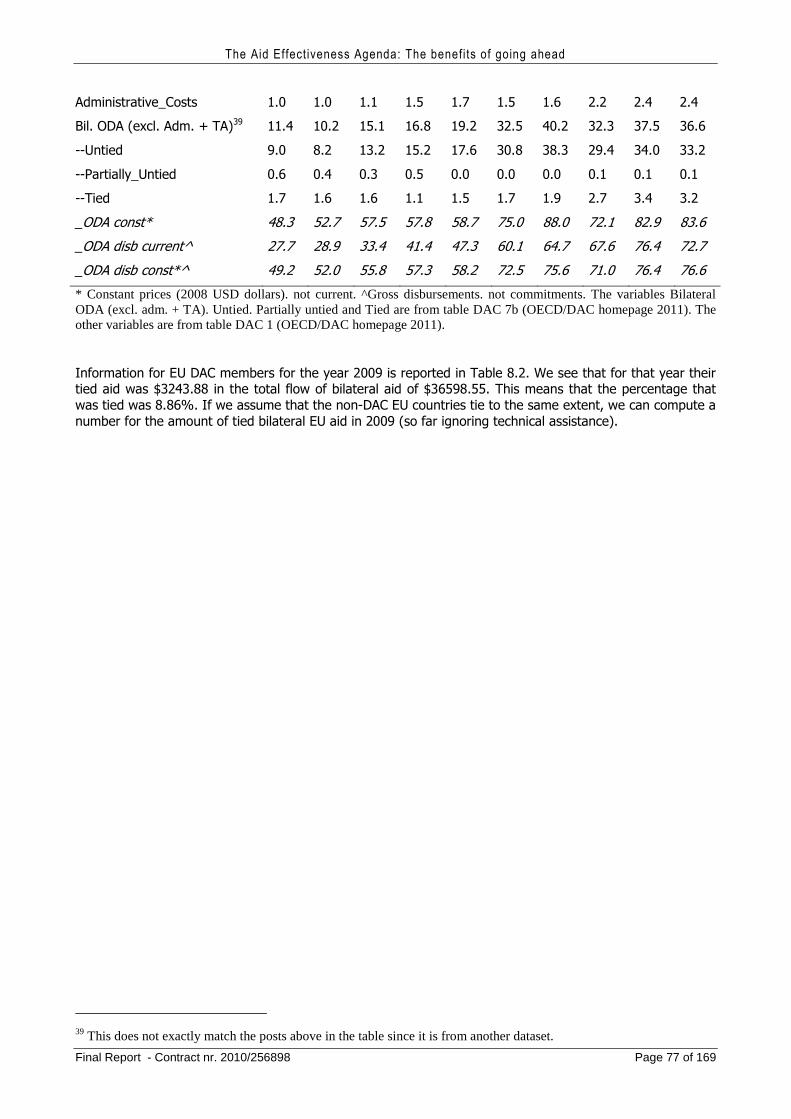
The Aid Effectiveness Agenda: The benefits of going ahead
Final Report - Contract nr. 2010/256898 Page 77 of 169
Administrative_Costs 1.0 1.0 1.1 1.5 1.7 1.5 1.6 2.2 2.4 2.4
Bil. ODA (excl. Adm. + TA)39 11.4 10.2 15.1 16.8 19.2 32.5 40.2 32.3 37.5 36.6
--Untied 9.0 8.2 13.2 15.2 17.6 30.8 38.3 29.4 34.0 33.2
--Partially_Untied 0.6 0.4 0.3 0.5 0.0 0.0 0.0 0.1 0.1 0.1
--Tied 1.7 1.6 1.6 1.1 1.5 1.7 1.9 2.7 3.4 3.2
_ODA const* 48.3 52.7 57.5 57.8 58.7 75.0 88.0 72.1 82.9 83.6
_ODA disb current^ 27.7 28.9 33.4 41.4 47.3 60.1 64.7 67.6 76.4 72.7
_ODA disb const*^ 49.2 52.0 55.8 57.3 58.2 72.5 75.6 71.0 76.4 76.6
* Constant prices (2008 USD dollars). not current. ^Gross disbursements. not commitments. The variables Bilateral ODA (excl. adm. + TA). Untied. Partially untied and Tied are from table DAC 7b (OECD/DAC homepage 2011). The other variables are from table DAC 1 (OECD/DAC homepage 2011).
Information for EU DAC members for the year 2009 is reported in Table 8.2. We see that for that year their tied aid was $3243.88 in the total flow of bilateral aid of $36598.55. This means that the percentage that was tied was 8.86%. If we assume that the non-DAC EU countries tie to the same extent, we can compute a number for the amount of tied bilateral EU aid in 2009 (so far ignoring technical assistance).
39 This does not exactly match the posts above in the table since it is from another dataset.
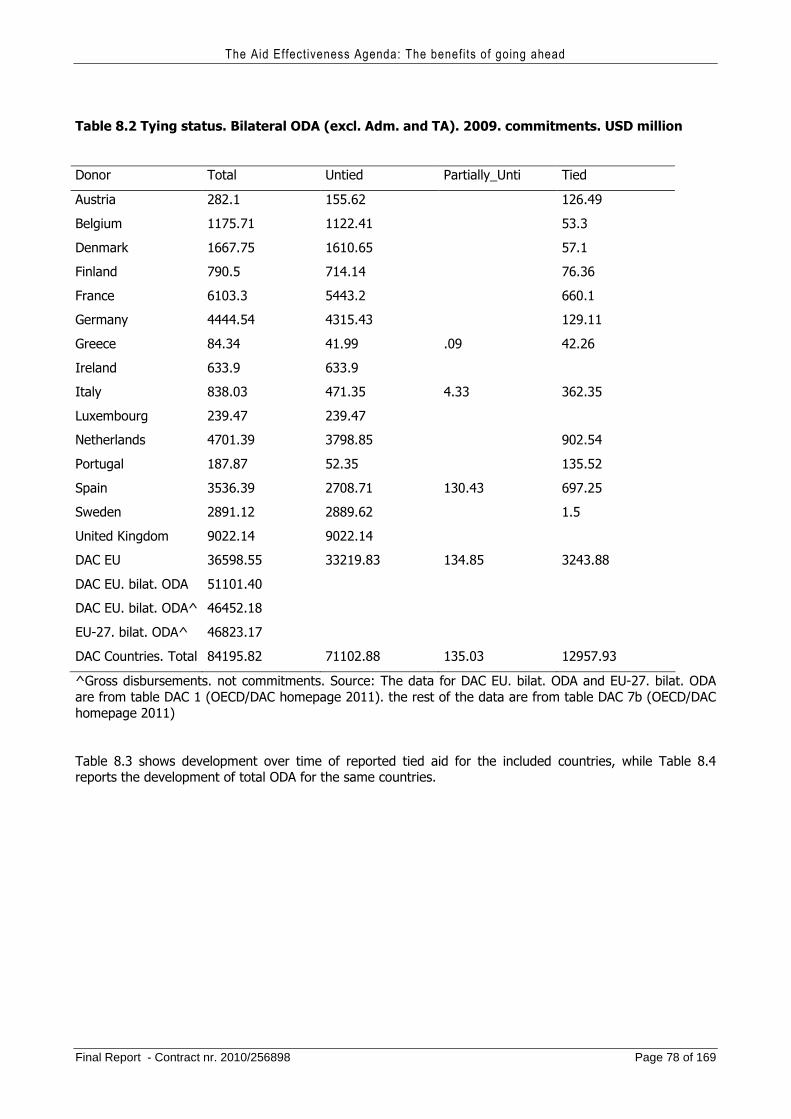
The Aid Effectiveness Agenda: The benefits of going ahead
Final Report - Contract nr. 2010/256898 Page 78 of 169
Table 8.2 Tying status. Bilateral ODA (excl. Adm. and TA). 2009. commitments. USD million
Donor Total Untied Partially_Unti Tied
Austria 282.1 155.62 126.49
Belgium 1175.71 1122.41 53.3
Denmark 1667.75 1610.65 57.1
Finland 790.5 714.14 76.36
France 6103.3 5443.2 660.1
Germany 4444.54 4315.43 129.11
Greece 84.34 41.99 .09 42.26
Ireland 633.9 633.9
Italy 838.03 471.35 4.33 362.35
Luxembourg 239.47 239.47
Netherlands 4701.39 3798.85 902.54
Portugal 187.87 52.35 135.52
Spain 3536.39 2708.71 130.43 697.25
Sweden 2891.12 2889.62 1.5
United Kingdom 9022.14 9022.14
DAC EU 36598.55 33219.83 134.85 3243.88
DAC EU. bilat. ODA 51101.40
DAC EU. bilat. ODA^ 46452.18
EU-27. bilat. ODA^ 46823.17
DAC Countries. Total 84195.82 71102.88 135.03 12957.93
^Gross disbursements. not commitments. Source: The data for DAC EU. bilat. ODA and EU-27. bilat. ODA are from table DAC 1 (OECD/DAC homepage 2011). the rest of the data are from table DAC 7b (OECD/DAC homepage 2011)
Table 8.3 shows development over time of reported tied aid for the included countries, while Table 8.4 reports the development of total ODA for the same countries.
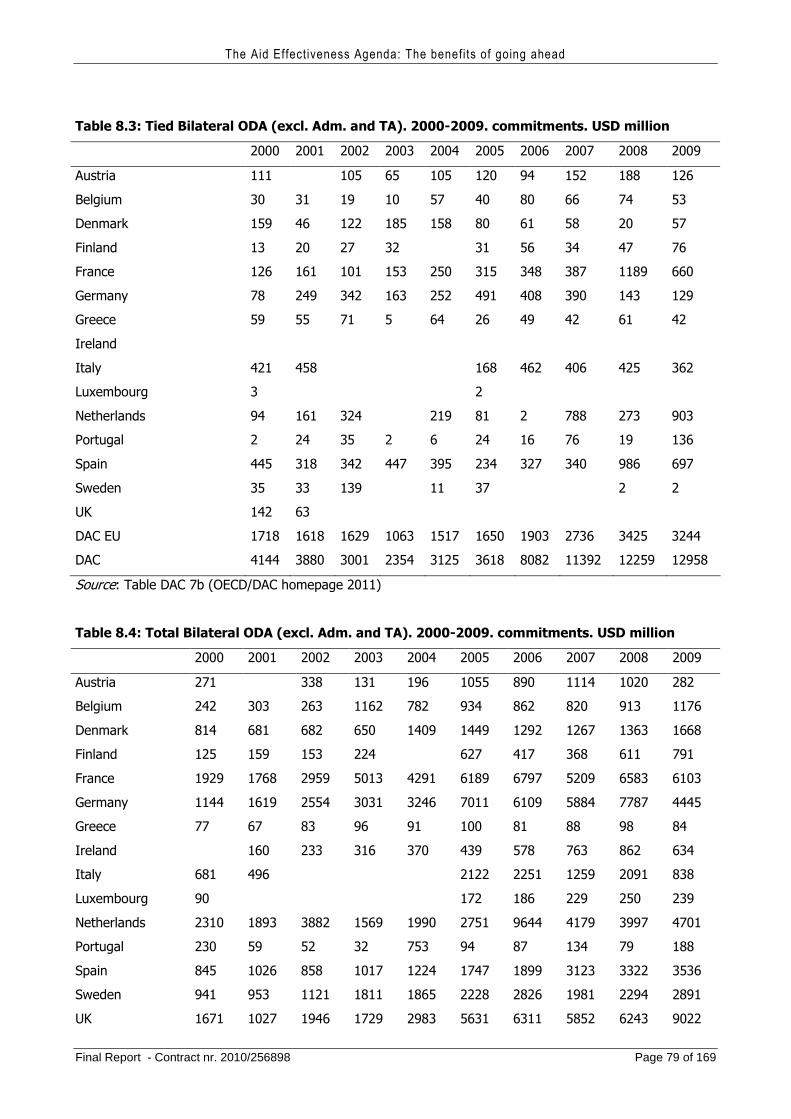
The Aid Effectiveness Agenda: The benefits of going ahead
Final Report - Contract nr. 2010/256898 Page 79 of 169
Table 8.3: Tied Bilateral ODA (excl. Adm. and TA). 2000-2009. commitments. USD million
2000 2001 2002 2003 2004 2005 2006 2007 2008 2009
Austria 111 105 65 105 120 94 152 188 126
Belgium 30 31 19 10 57 40 80 66 74 53
Denmark 159 46 122 185 158 80 61 58 20 57
Finland 13 20 27 32 31 56 34 47 76
France 126 161 101 153 250 315 348 387 1189 660
Germany 78 249 342 163 252 491 408 390 143 129
Greece 59 55 71 5 64 26 49 42 61 42
Ireland
Italy 421 458 168 462 406 425 362
Luxembourg 3 2
Netherlands 94 161 324 219 81 2 788 273 903
Portugal 2 24 35 2 6 24 16 76 19 136
Spain 445 318 342 447 395 234 327 340 986 697
Sweden 35 33 139 11 37 2 2
UK 142 63
DAC EU 1718 1618 1629 1063 1517 1650 1903 2736 3425 3244
DAC 4144 3880 3001 2354 3125 3618 8082 11392 12259 12958
Source: Table DAC 7b (OECD/DAC homepage 2011)
Table 8.4: Total Bilateral ODA (excl. Adm. and TA). 2000-2009. commitments. USD million
2000 2001 2002 2003 2004 2005 2006 2007 2008 2009
Austria 271 338 131 196 1055 890 1114 1020 282
Belgium 242 303 263 1162 782 934 862 820 913 1176
Denmark 814 681 682 650 1409 1449 1292 1267 1363 1668
Finland 125 159 153 224 627 417 368 611 791
France 1929 1768 2959 5013 4291 6189 6797 5209 6583 6103
Germany 1144 1619 2554 3031 3246 7011 6109 5884 7787 4445
Greece 77 67 83 96 91 100 81 88 98 84
Ireland 160 233 316 370 439 578 763 862 634
Italy 681 496 2122 2251 1259 2091 838
Luxembourg 90 172 186 229 250 239
Netherlands 2310 1893 3882 1569 1990 2751 9644 4179 3997 4701
Portugal 230 59 52 32 753 94 87 134 79 188
Spain 845 1026 858 1017 1224 1747 1899 3123 3322 3536
Sweden 941 953 1121 1811 1865 2228 2826 1981 2294 2891
UK 1671 1027 1946 1729 2983 5631 6311 5852 6243 9022
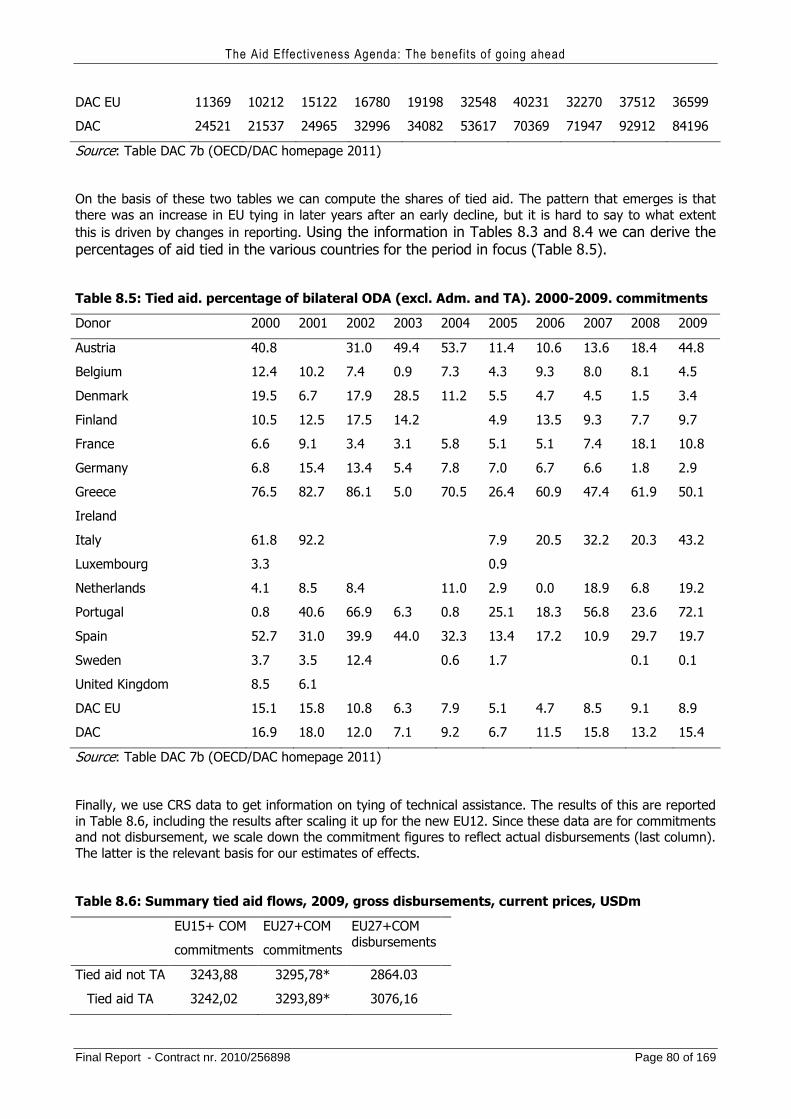
The Aid Effectiveness Agenda: The benefits of going ahead
Final Report - Contract nr. 2010/256898 Page 80 of 169
DAC EU 11369 10212 15122 16780 19198 32548 40231 32270 37512 36599
DAC 24521 21537 24965 32996 34082 53617 70369 71947 92912 84196
Source: Table DAC 7b (OECD/DAC homepage 2011)
On the basis of these two tables we can compute the shares of tied aid. The pattern that emerges is that there was an increase in EU tying in later years after an early decline, but it is hard to say to what extent this is driven by changes in reporting. Using the information in Tables 8.3 and 8.4 we can derive the percentages of aid tied in the various countries for the period in focus (Table 8.5).
Table 8.5: Tied aid. percentage of bilateral ODA (excl. Adm. and TA). 2000-2009. commitments
Donor 2000 2001 2002 2003 2004 2005 2006 2007 2008 2009
Austria 40.8 31.0 49.4 53.7 11.4 10.6 13.6 18.4 44.8
Belgium 12.4 10.2 7.4 0.9 7.3 4.3 9.3 8.0 8.1 4.5
Denmark 19.5 6.7 17.9 28.5 11.2 5.5 4.7 4.5 1.5 3.4
Finland 10.5 12.5 17.5 14.2 4.9 13.5 9.3 7.7 9.7
France 6.6 9.1 3.4 3.1 5.8 5.1 5.1 7.4 18.1 10.8
Germany 6.8 15.4 13.4 5.4 7.8 7.0 6.7 6.6 1.8 2.9
Greece 76.5 82.7 86.1 5.0 70.5 26.4 60.9 47.4 61.9 50.1
Ireland
Italy 61.8 92.2 7.9 20.5 32.2 20.3 43.2
Luxembourg 3.3 0.9
Netherlands 4.1 8.5 8.4 11.0 2.9 0.0 18.9 6.8 19.2
Portugal 0.8 40.6 66.9 6.3 0.8 25.1 18.3 56.8 23.6 72.1
Spain 52.7 31.0 39.9 44.0 32.3 13.4 17.2 10.9 29.7 19.7
Sweden 3.7 3.5 12.4 0.6 1.7 0.1 0.1
United Kingdom 8.5 6.1
DAC EU 15.1 15.8 10.8 6.3 7.9 5.1 4.7 8.5 9.1 8.9
DAC 16.9 18.0 12.0 7.1 9.2 6.7 11.5 15.8 13.2 15.4
Source: Table DAC 7b (OECD/DAC homepage 2011)
Finally, we use CRS data to get information on tying of technical assistance. The results of this are reported in Table 8.6, including the results after scaling it up for the new EU12. Since these data are for commitments and not disbursement, we scale down the commitment figures to reflect actual disbursements (last column). The latter is the relevant basis for our estimates of effects.
Table 8.6: Summary tied aid flows, 2009, gross disbursements, current prices, USDm
EU15+ COM
commitments
EU27+COM
commitments
EU27+COM disbursements
Tied aid not TA 3243,88 3295,78* 2864.03
Tied aid TA 3242,02 3293,89* 3076,16
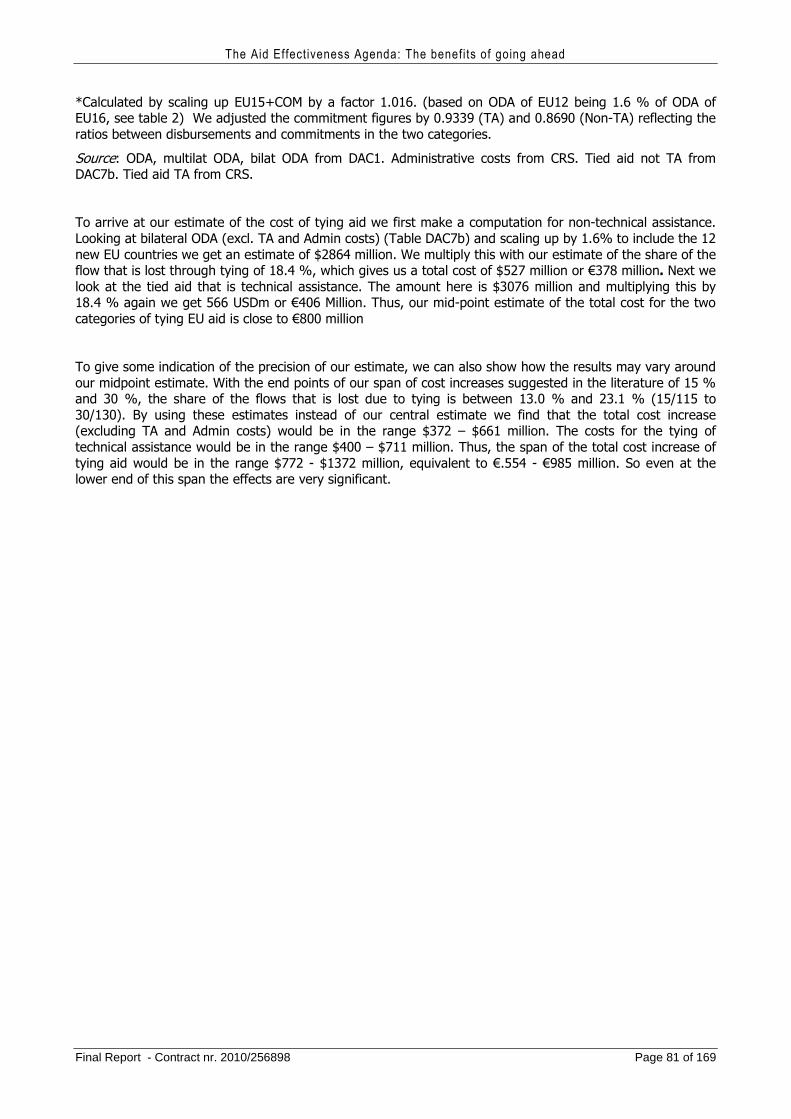
The Aid Effectiveness Agenda: The benefits of going ahead
Final Report - Contract nr. 2010/256898 Page 81 of 169
*Calculated by scaling up EU15+COM by a factor 1.016. (based on ODA of EU12 being 1.6 % of ODA of EU16, see table 2) We adjusted the commitment figures by 0.9339 (TA) and 0.8690 (Non-TA) reflecting the ratios between disbursements and commitments in the two categories.
Source: ODA, multilat ODA, bilat ODA from DAC1. Administrative costs from CRS. Tied aid not TA from DAC7b. Tied aid TA from CRS.
To arrive at our estimate of the cost of tying aid we first make a computation for non-technical assistance. Looking at bilateral ODA (excl. TA and Admin costs) (Table DAC7b) and scaling up by 1.6% to include the 12 new EU countries we get an estimate of $2864 million. We multiply this with our estimate of the share of the flow that is lost through tying of 18.4 %, which gives us a total cost of $527 million or €378 million. Next we look at the tied aid that is technical assistance. The amount here is $3076 million and multiplying this by 18.4 % again we get 566 USDm or €406 Million. Thus, our mid-point estimate of the total cost for the two categories of tying EU aid is close to €800 million
To give some indication of the precision of our estimate, we can also show how the results may vary around our midpoint estimate. With the end points of our span of cost increases suggested in the literature of 15 % and 30 %, the share of the flows that is lost due to tying is between 13.0 % and 23.1 % (15/115 to 30/130). By using these estimates instead of our central estimate we find that the total cost increase (excluding TA and Admin costs) would be in the range $372 – $661 million. The costs for the tying of technical assistance would be in the range $400 – $711 million. Thus, the span of the total cost increase of tying aid would be in the range $772 - $1372 million, equivalent to €.554 - €985 million. So even at the lower end of this span the effects are very significant.
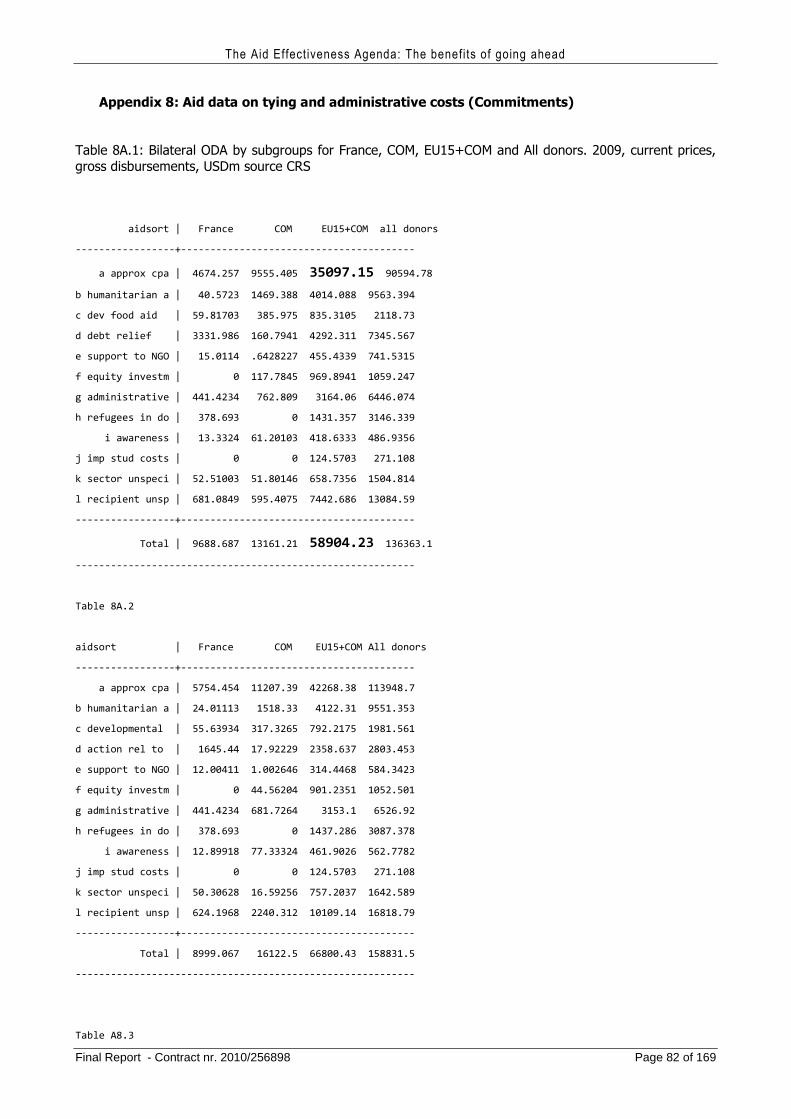
The Aid Effectiveness Agenda: The benefits of going ahead
Final Report - Contract nr. 2010/256898 Page 82 of 169
Appendix 8: Aid data on tying and administrative costs (Commitments)
Table 8A.1: Bilateral ODA by subgroups for France, COM, EU15+COM and All donors. 2009, current prices, gross disbursements, USDm source CRS
aidsort | France COM EU15+COM all donors
-----------------+----------------------------------------
a approx cpa | 4674.257 9555.405 35097.15 90594.78
b humanitarian a | 40.5723 1469.388 4014.088 9563.394
c dev food aid | 59.81703 385.975 835.3105 2118.73
d debt relief | 3331.986 160.7941 4292.311 7345.567
e support to NGO | 15.0114 .6428227 455.4339 741.5315
f equity investm | 0 117.7845 969.8941 1059.247
g administrative | 441.4234 762.809 3164.06 6446.074
h refugees in do | 378.693 0 1431.357 3146.339
i awareness | 13.3324 61.20103 418.6333 486.9356
j imp stud costs | 0 0 124.5703 271.108
k sector unspeci | 52.51003 51.80146 658.7356 1504.814
l recipient unsp | 681.0849 595.4075 7442.686 13084.59
-----------------+----------------------------------------
Total | 9688.687 13161.21 58904.23 136363.1
----------------------------------------------------------
Table 8A.2
aidsort | France COM EU15+COM All donors
-----------------+----------------------------------------
a approx cpa | 5754.454 11207.39 42268.38 113948.7
b humanitarian a | 24.01113 1518.33 4122.31 9551.353
c developmental | 55.63934 317.3265 792.2175 1981.561
d action rel to | 1645.44 17.92229 2358.637 2803.453
e support to NGO | 12.00411 1.002646 314.4468 584.3423
f equity investm | 0 44.56204 901.2351 1052.501
g administrative | 441.4234 681.7264 3153.1 6526.92
h refugees in do | 378.693 0 1437.286 3087.378
i awareness | 12.89918 77.33324 461.9026 562.7782
j imp stud costs | 0 0 124.5703 271.108
k sector unspeci | 50.30628 16.59256 757.2037 1642.589
l recipient unsp | 624.1968 2240.312 10109.14 16818.79
-----------------+----------------------------------------
Total | 8999.067 16122.5 66800.43 158831.5
----------------------------------------------------------
Table A8.3
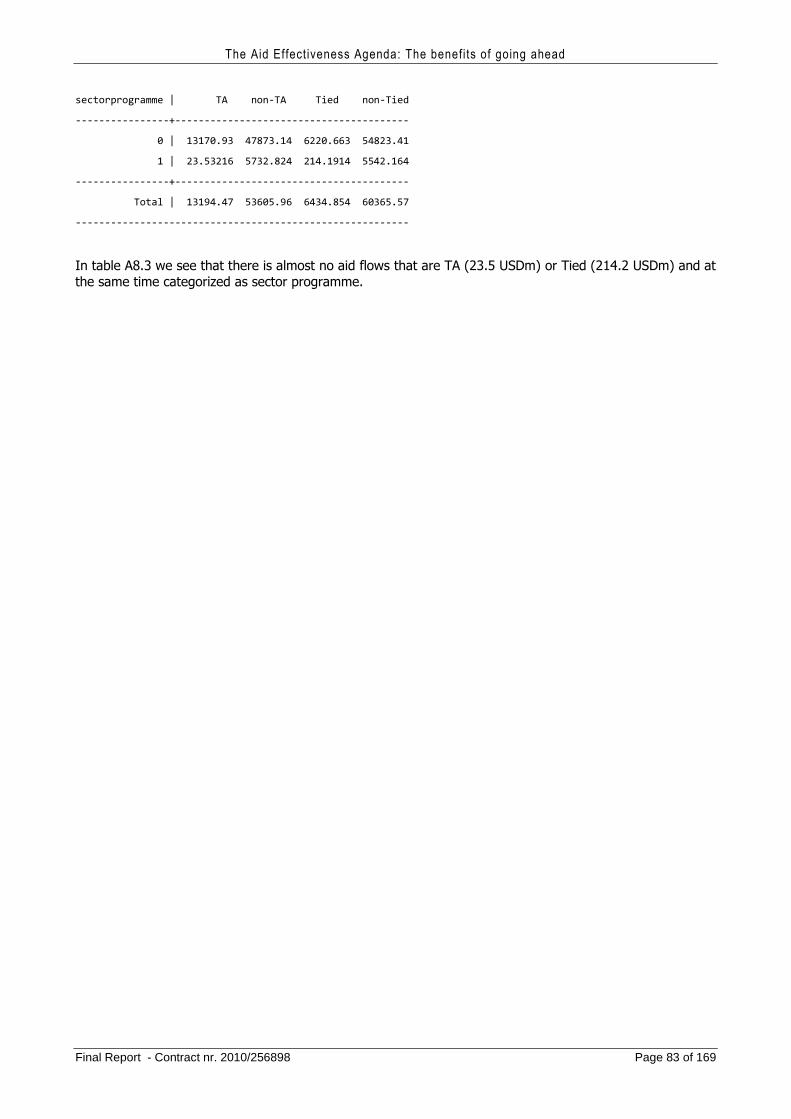
The Aid Effectiveness Agenda: The benefits of going ahead
Final Report - Contract nr. 2010/256898 Page 83 of 169
sectorprogramme | TA non-TA Tied non-Tied
----------------+----------------------------------------
0 | 13170.93 47873.14 6220.663 54823.41
1 | 23.53216 5732.824 214.1914 5542.164
----------------+----------------------------------------
Total | 13194.47 53605.96 6434.854 60365.57
---------------------------------------------------------
In table A8.3 we see that there is almost no aid flows that are TA (23.5 USDm) or Tied (214.2 USDm) and at the same time categorized as sector programme.
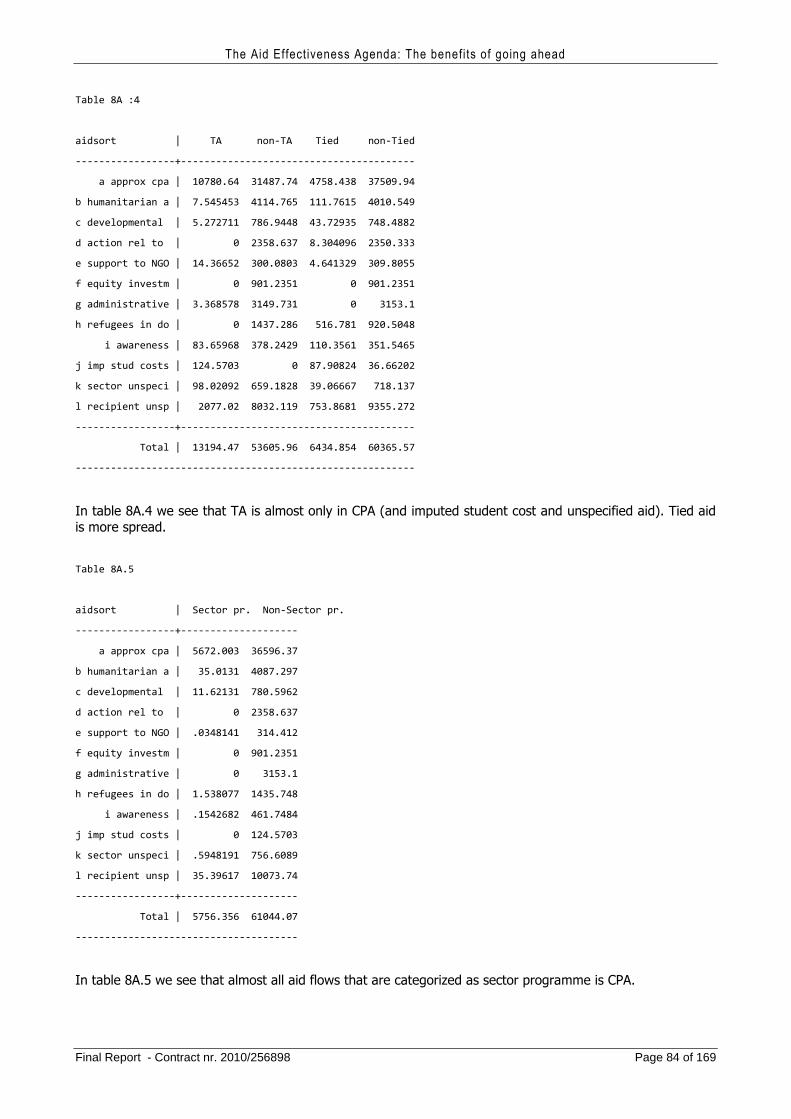
The Aid Effectiveness Agenda: The benefits of going ahead
Final Report - Contract nr. 2010/256898 Page 84 of 169
Table 8A :4
aidsort | TA non-TA Tied non-Tied
-----------------+----------------------------------------
a approx cpa | 10780.64 31487.74 4758.438 37509.94
b humanitarian a | 7.545453 4114.765 111.7615 4010.549
c developmental | 5.272711 786.9448 43.72935 748.4882
d action rel to | 0 2358.637 8.304096 2350.333
e support to NGO | 14.36652 300.0803 4.641329 309.8055
f equity investm | 0 901.2351 0 901.2351
g administrative | 3.368578 3149.731 0 3153.1
h refugees in do | 0 1437.286 516.781 920.5048
i awareness | 83.65968 378.2429 110.3561 351.5465
j imp stud costs | 124.5703 0 87.90824 36.66202
k sector unspeci | 98.02092 659.1828 39.06667 718.137
l recipient unsp | 2077.02 8032.119 753.8681 9355.272
-----------------+----------------------------------------
Total | 13194.47 53605.96 6434.854 60365.57
----------------------------------------------------------
In table 8A.4 we see that TA is almost only in CPA (and imputed student cost and unspecified aid). Tied aid is more spread.
Table 8A.5
aidsort | Sector pr. Non-Sector pr.
-----------------+--------------------
a approx cpa | 5672.003 36596.37
b humanitarian a | 35.0131 4087.297
c developmental | 11.62131 780.5962
d action rel to | 0 2358.637
e support to NGO | .0348141 314.412
f equity investm | 0 901.2351
g administrative | 0 3153.1
h refugees in do | 1.538077 1435.748
i awareness | .1542682 461.7484
j imp stud costs | 0 124.5703
k sector unspeci | .5948191 756.6089
l recipient unsp | 35.39617 10073.74
-----------------+--------------------
Total | 5756.356 61044.07
--------------------------------------
In table 8A.5 we see that almost all aid flows that are categorized as sector programme is CPA.
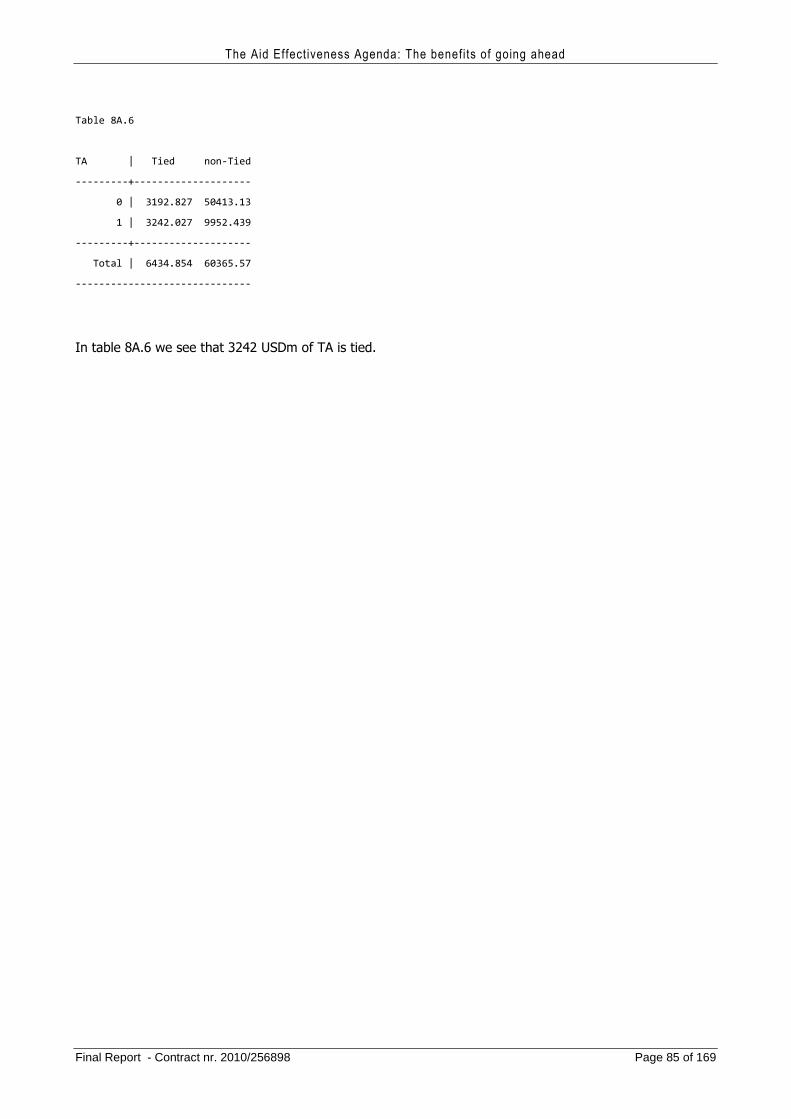
The Aid Effectiveness Agenda: The benefits of going ahead
Final Report - Contract nr. 2010/256898 Page 85 of 169
Table 8A.6
TA | Tied non-Tied
---------+--------------------
0 | 3192.827 50413.13
1 | 3242.027 9952.439
---------+--------------------
Total | 6434.854 60365.57
------------------------------
In table 8A.6 we see that 3242 USDm of TA is tied.
The Aid Effectiveness Agenda: The benefits of going ahead
Final Report - Contract nr. 2010/256898 Page 86 of 169
9. The benefits of reducing the unpredictability and volatility of EU aid
9.1. Summary of the findings of the first study (and its methodology)
Let’s start with the definitions. We use the term unpredictability for the extent to which actual aid disbursements from a donor to a partner country falls short of (or exceeds) the pledged amounts. We use the term volatility to denote the extent to which aid disbursements from a donor to a partner country vary from one year to another.
In theory, it is possible to have all the four combinations: (i) predictable and non-volatile aid (the best-case scenario, from the point of view of the partner country); (ii) unpredictable but non-volatile aid (which occurs, for instance, if the donor country varies regularly the pledged amounts, but ends up delivering always approximately constant amounts of aid); (iii) predictable and volatile aid (the scenario under which the donor country’s pledged amounts vary substantially from one year to another, but the amounts of aid delivered correspond to those pledged); and (iv) unpredictable and volatile aid. In reality, aid disbursements are in most cases both unpredictable and volatile.
Data that is available on predictability of aid flows is highly limited. The main difficulties are two. First, there is no comparable cross-country data on aid amounts pledged. Second, it would be extremely difficult to have such data for a long enough period of time. On the contrary, constructing measures of (realized) volatility of aid flows is relatively easy, both across countries and across time. Moreover, even if there were a possibility to construct such measures for aid predictability, these measures would rely on (unrealistic) hypothesis that partner countries take pledged amounts at face value and do not form more realistic expectations concerning the amounts of aid that would be delivered. Thus, given that there exist no data on the expectations of partner countries concerning aid flows, we will follow the standard currently used in the academic literature and concentrate on volatility of aid (rather than on its unpredictability).
Figure 9.1 illustrates the volatility of total CPA flows from all DAC countries to three partner countries: Mali, Nicaragua, and Ivory Coast. One can easily see that even for partner countries with relatively low volatility of aid (such as Mali and Nicaragua) year-to-year fluctuations can be of the order of $100-$120 million, which makes about one-fifth of their annual aid flows. For countries at the upper end of the volatility spectrum (such as Ivory Coast), these fluctuations can correspond to increases or drops in CPA of over $300 million.
Previous studies show that aid flows to a typical partner country are substantially more volatile than its government revenues, private consumption, and output (Bulir and Hamann 2006, Kharas 2008). This, combined with other shocks to which a developing country is exposed (climate, terms-of-trade, and short-term capital flows) makes the development policy planning of a typical developing country subject to substantial uncertainty.
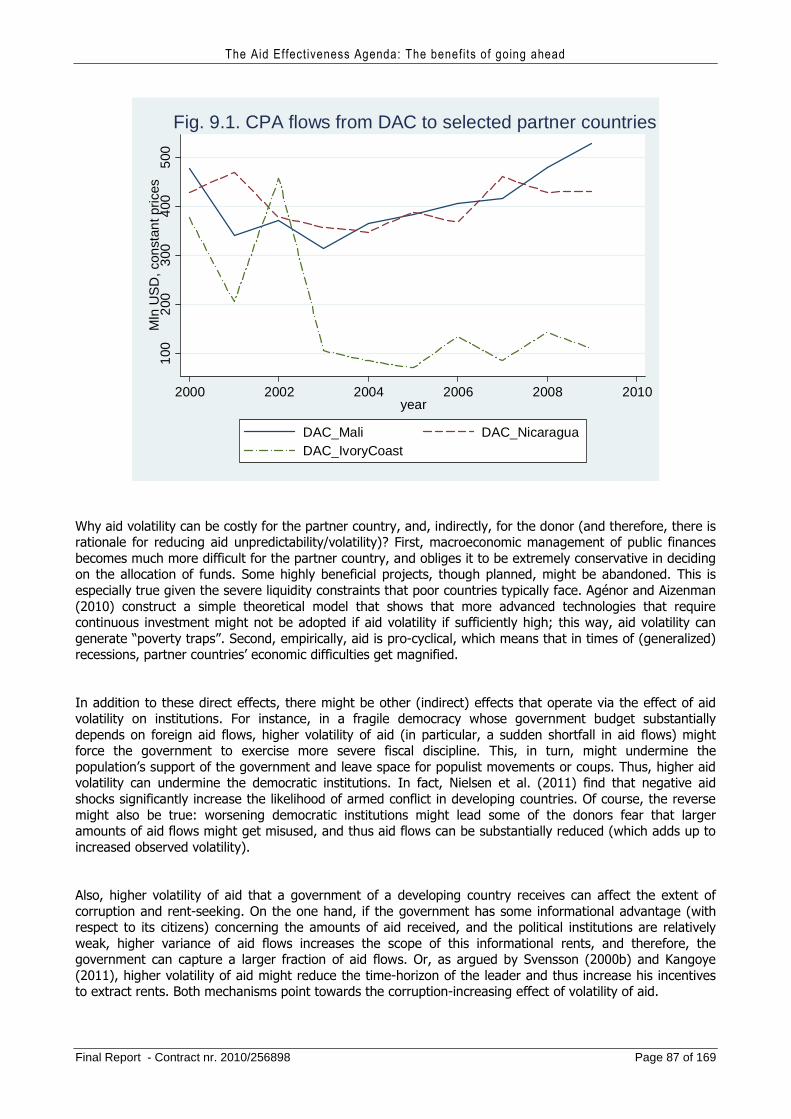
The Aid Effectiveness Agenda: The benefits of going ahead
Final Report - Contract nr. 2010/256898 Page 87 of 169
100
200
300
400
500
Mln
US
D, c
onst
ant p
rices
2000 2002 2004 2006 2008 2010year
DAC_Mali DAC_NicaraguaDAC_IvoryCoast
Fig. 9.1. CPA flows from DAC to selected partner countries
Why aid volatility can be costly for the partner country, and, indirectly, for the donor (and therefore, there is rationale for reducing aid unpredictability/volatility)? First, macroeconomic management of public finances becomes much more difficult for the partner country, and obliges it to be extremely conservative in deciding on the allocation of funds. Some highly beneficial projects, though planned, might be abandoned. This is especially true given the severe liquidity constraints that poor countries typically face. Agénor and Aizenman (2010) construct a simple theoretical model that shows that more advanced technologies that require continuous investment might not be adopted if aid volatility if sufficiently high; this way, aid volatility can generate “poverty traps”. Second, empirically, aid is pro-cyclical, which means that in times of (generalized) recessions, partner countries’ economic difficulties get magnified.
In addition to these direct effects, there might be other (indirect) effects that operate via the effect of aid volatility on institutions. For instance, in a fragile democracy whose government budget substantially depends on foreign aid flows, higher volatility of aid (in particular, a sudden shortfall in aid flows) might force the government to exercise more severe fiscal discipline. This, in turn, might undermine the population’s support of the government and leave space for populist movements or coups. Thus, higher aid volatility can undermine the democratic institutions. In fact, Nielsen et al. (2011) find that negative aid shocks significantly increase the likelihood of armed conflict in developing countries. Of course, the reverse might also be true: worsening democratic institutions might lead some of the donors fear that larger amounts of aid flows might get misused, and thus aid flows can be substantially reduced (which adds up to increased observed volatility).
Also, higher volatility of aid that a government of a developing country receives can affect the extent of corruption and rent-seeking. On the one hand, if the government has some informational advantage (with respect to its citizens) concerning the amounts of aid received, and the political institutions are relatively weak, higher variance of aid flows increases the scope of this informational rents, and therefore, the government can capture a larger fraction of aid flows. Or, as argued by Svensson (2000b) and Kangoye (2011), higher volatility of aid might reduce the time-horizon of the leader and thus increase his incentives to extract rents. Both mechanisms point towards the corruption-increasing effect of volatility of aid.
The Aid Effectiveness Agenda: The benefits of going ahead
Final Report - Contract nr. 2010/256898 Page 88 of 169
Another possible indirect effect operates through higher fragmentation. If aid flows from different donors are imperfectly correlated, a risk-averse partner country government might be willing to reduce its exposure to volatility risk by diversifying its aid sources. However, we know from the discussion in previous chapters that higher fragmentation is harmful for the institutions of the partner country. Thus, this diversification caused by increased aid volatility might come at a cost of worsening institutions because of more fragmentation.
This discussion implies that the calculation of the total benefits of fully implementing the Paris Declaration and the Accra Agenda for Action in what concerns making aid flows fully predictable should take into account both the direct beneficial effects on public finances, as well as the indirect effects operating via better institutions. For the purposes of this study, we should note that the direct estimates that we obtain below thus represent the lower bound of the total benefits of reducing aid volatility.
Quantifying these benefits correctly is a formidable task. The principal methodology that has been used so far is by Kharas (2008). He employs an original way of looking at the volatility in aid flows and constructing a measure of loss associated with volatility, using insights from finance theory. Consider a partner country that received aid from several donor countries, and the flows of aid from each of these donors is volatile. Then, the partner country can be considered as holding a ‘portfolio’ of aid, similar to the portfolio of risky assets held by an investor. Given that higher volatility is considered as having negative consequences for the partner country and thus undesirable, the partner country would be willing to receive lower expected flows of aid in exchange for lower volatility of its aid portfolio. Taking this idea to the extreme, one can calculate the certainty equivalent of aid flows to any partner country: it is the lowest amount of aid that the country would agree on receiving if this aid were given to the partner country with certainty. Finally, the difference between the expected aid flows of a partner country (calculated using realized aid flows) and the certainty equivalent is interpreted as the deadweight loss, i.e. the amount of financial loss to donor countries that could have been avoided if the aid flows to the partner country were certain. The attractive characteristic of this measure is that the deadweight loss can be calculated for aid flows from any sub-set of donors (although the interpretation of the results has some caveats; see below), and the quantification of deadweight loss can be done either in total terms or in per-dollar (per per-euro) terms.
In other words, it is assumed that any partner country would agree on a cut in its (current and uncertain) aid flows in exchange for a fully guaranteed aid flow: the maximum amount of such cut (i.e. the one that would deliver the same benefits, by revealed preference argument) is the potential cost saving associated with making aid flows fully predictable.
Applying this methodology to the DAC data for 177 beneficiary countries between 1970 and 2006, Kharas (2008) estimates that the deadweight loss is between 15 and 20 percent of total aid flows, which amounts to an annual loss of about $16 billion.
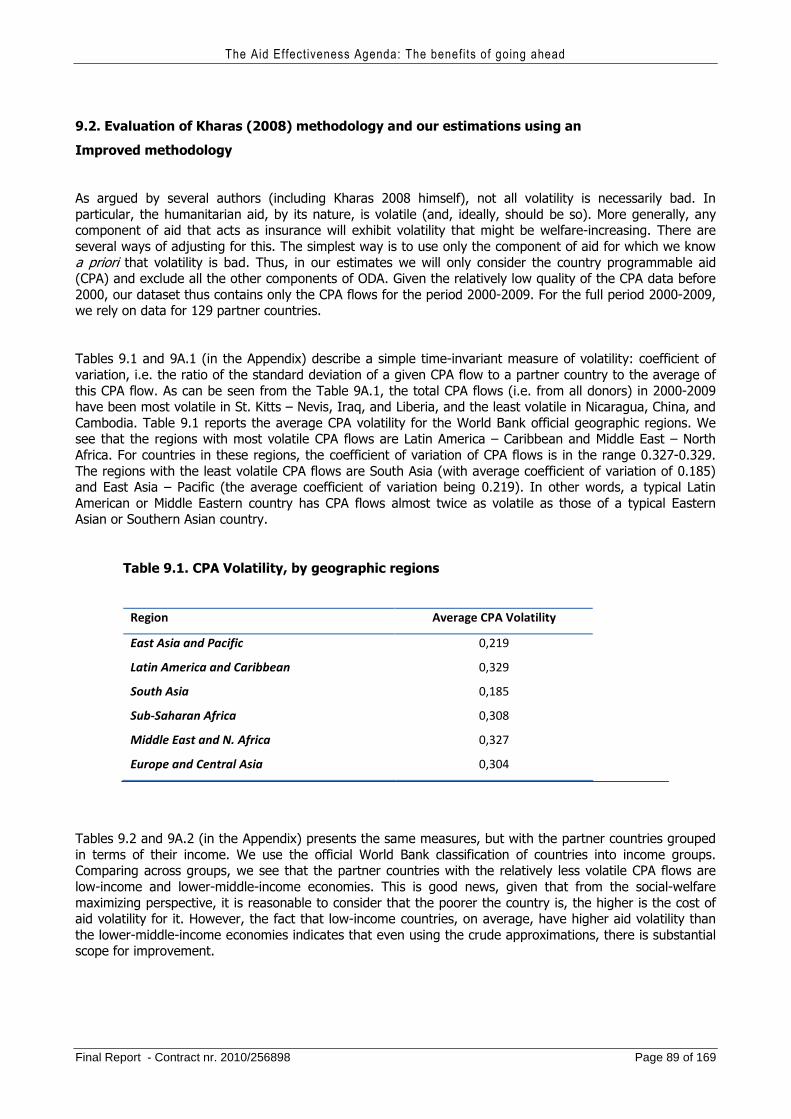
The Aid Effectiveness Agenda: The benefits of going ahead
Final Report - Contract nr. 2010/256898 Page 89 of 169
9.2. Evaluation of Kharas (2008) methodology and our estimations using an
Improved methodology
As argued by several authors (including Kharas 2008 himself), not all volatility is necessarily bad. In particular, the humanitarian aid, by its nature, is volatile (and, ideally, should be so). More generally, any component of aid that acts as insurance will exhibit volatility that might be welfare-increasing. There are several ways of adjusting for this. The simplest way is to use only the component of aid for which we know a priori that volatility is bad. Thus, in our estimates we will only consider the country programmable aid (CPA) and exclude all the other components of ODA. Given the relatively low quality of the CPA data before 2000, our dataset thus contains only the CPA flows for the period 2000-2009. For the full period 2000-2009, we rely on data for 129 partner countries.
Tables 9.1 and 9A.1 (in the Appendix) describe a simple time-invariant measure of volatility: coefficient of variation, i.e. the ratio of the standard deviation of a given CPA flow to a partner country to the average of this CPA flow. As can be seen from the Table 9A.1, the total CPA flows (i.e. from all donors) in 2000-2009 have been most volatile in St. Kitts – Nevis, Iraq, and Liberia, and the least volatile in Nicaragua, China, and Cambodia. Table 9.1 reports the average CPA volatility for the World Bank official geographic regions. We see that the regions with most volatile CPA flows are Latin America – Caribbean and Middle East – North Africa. For countries in these regions, the coefficient of variation of CPA flows is in the range 0.327-0.329. The regions with the least volatile CPA flows are South Asia (with average coefficient of variation of 0.185) and East Asia – Pacific (the average coefficient of variation being 0.219). In other words, a typical Latin American or Middle Eastern country has CPA flows almost twice as volatile as those of a typical Eastern Asian or Southern Asian country.
Table 9.1. CPA Volatility, by geographic regions
Region Average CPA Volatility
East Asia and Pacific 0,219
Latin America and Caribbean 0,329
South Asia 0,185
Sub-Saharan Africa 0,308
Middle East and N. Africa 0,327
Europe and Central Asia 0,304
Tables 9.2 and 9A.2 (in the Appendix) presents the same measures, but with the partner countries grouped in terms of their income. We use the official World Bank classification of countries into income groups. Comparing across groups, we see that the partner countries with the relatively less volatile CPA flows are low-income and lower-middle-income economies. This is good news, given that from the social-welfare maximizing perspective, it is reasonable to consider that the poorer the country is, the higher is the cost of aid volatility for it. However, the fact that low-income countries, on average, have higher aid volatility than the lower-middle-income economies indicates that even using the crude approximations, there is substantial scope for improvement.
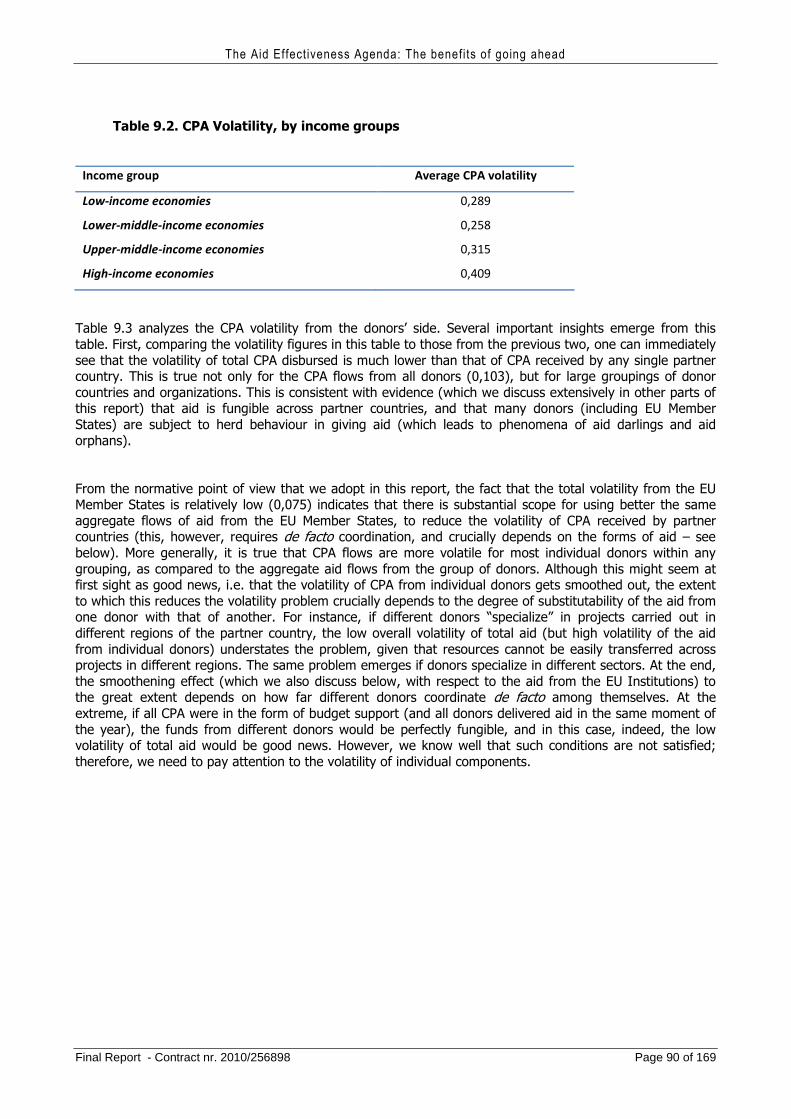
The Aid Effectiveness Agenda: The benefits of going ahead
Final Report - Contract nr. 2010/256898 Page 90 of 169
Table 9.2. CPA Volatility, by income groups
Income group Average CPA volatility
Low-income economies 0,289
Lower-middle-income economies 0,258
Upper-middle-income economies 0,315
High-income economies 0,409
Table 9.3 analyzes the CPA volatility from the donors’ side. Several important insights emerge from this table. First, comparing the volatility figures in this table to those from the previous two, one can immediately see that the volatility of total CPA disbursed is much lower than that of CPA received by any single partner country. This is true not only for the CPA flows from all donors (0,103), but for large groupings of donor countries and organizations. This is consistent with evidence (which we discuss extensively in other parts of this report) that aid is fungible across partner countries, and that many donors (including EU Member States) are subject to herd behaviour in giving aid (which leads to phenomena of aid darlings and aid orphans).
From the normative point of view that we adopt in this report, the fact that the total volatility from the EU Member States is relatively low (0,075) indicates that there is substantial scope for using better the same aggregate flows of aid from the EU Member States, to reduce the volatility of CPA received by partner countries (this, however, requires de facto coordination, and crucially depends on the forms of aid – see below). More generally, it is true that CPA flows are more volatile for most individual donors within any grouping, as compared to the aggregate aid flows from the group of donors. Although this might seem at first sight as good news, i.e. that the volatility of CPA from individual donors gets smoothed out, the extent to which this reduces the volatility problem crucially depends to the degree of substitutability of the aid from one donor with that of another. For instance, if different donors “specialize” in projects carried out in different regions of the partner country, the low overall volatility of total aid (but high volatility of the aid from individual donors) understates the problem, given that resources cannot be easily transferred across projects in different regions. The same problem emerges if donors specialize in different sectors. At the end, the smoothening effect (which we also discuss below, with respect to the aid from the EU Institutions) to the great extent depends on how far different donors coordinate de facto among themselves. At the extreme, if all CPA were in the form of budget support (and all donors delivered aid in the same moment of the year), the funds from different donors would be perfectly fungible, and in this case, indeed, the low volatility of total aid would be good news. However, we know well that such conditions are not satisfied; therefore, we need to pay attention to the volatility of individual components.
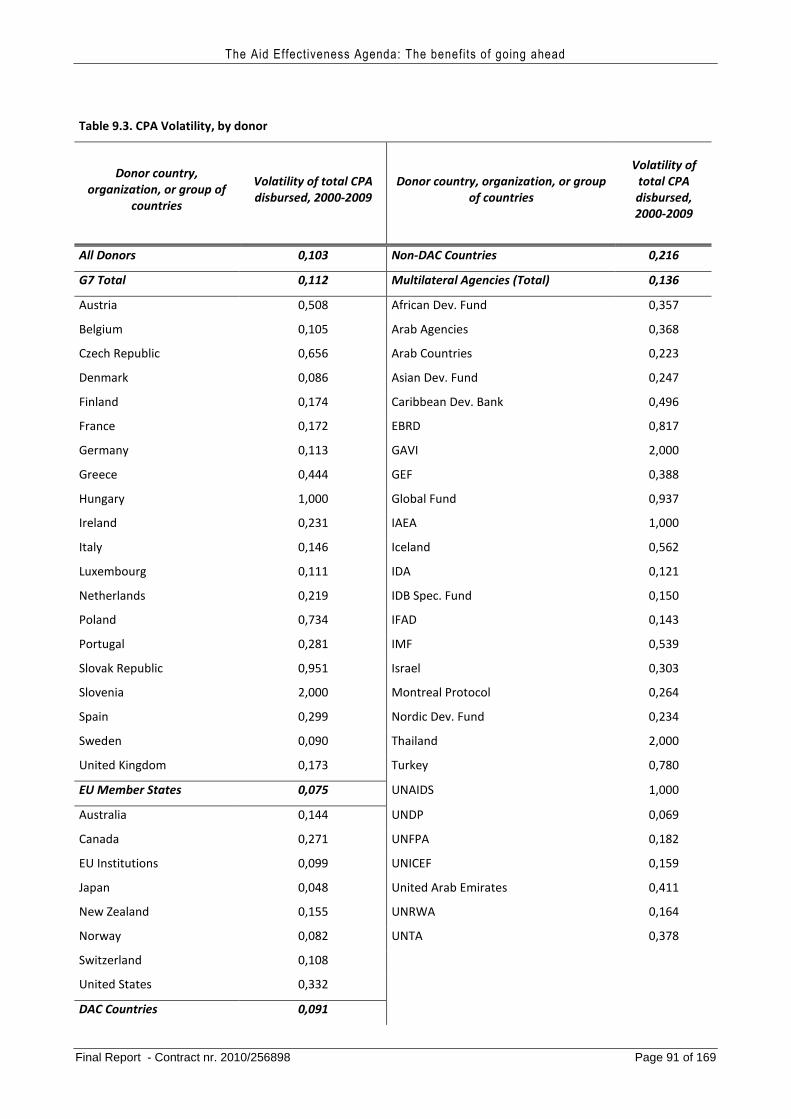
The Aid Effectiveness Agenda: The benefits of going ahead
Final Report - Contract nr. 2010/256898 Page 91 of 169
Table 9.3. CPA Volatility, by donor
Donor country,
organization, or group of
countries
Volatility of total CPA
disbursed, 2000-2009
Donor country, organization, or group
of countries
Volatility of
total CPA
disbursed,
2000-2009
All Donors 0,103 Non-DAC Countries 0,216
G7 Total 0,112 Multilateral Agencies (Total) 0,136
Austria 0,508 African Dev. Fund 0,357
Belgium 0,105 Arab Agencies 0,368
Czech Republic 0,656 Arab Countries 0,223
Denmark 0,086 Asian Dev. Fund 0,247
Finland 0,174 Caribbean Dev. Bank 0,496
France 0,172 EBRD 0,817
Germany 0,113 GAVI 2,000
Greece 0,444 GEF 0,388
Hungary 1,000 Global Fund 0,937
Ireland 0,231 IAEA 1,000
Italy 0,146 Iceland 0,562
Luxembourg 0,111 IDA 0,121
Netherlands 0,219 IDB Spec. Fund 0,150
Poland 0,734 IFAD 0,143
Portugal 0,281 IMF 0,539
Slovak Republic 0,951 Israel 0,303
Slovenia 2,000 Montreal Protocol 0,264
Spain 0,299 Nordic Dev. Fund 0,234
Sweden 0,090 Thailand 2,000
United Kingdom 0,173 Turkey 0,780
EU Member States 0,075 UNAIDS 1,000
Australia 0,144 UNDP 0,069
Canada 0,271 UNFPA 0,182
EU Institutions 0,099 UNICEF 0,159
Japan 0,048 United Arab Emirates 0,411
New Zealand 0,155 UNRWA 0,164
Norway 0,082 UNTA 0,378
Switzerland 0,108
United States 0,332
DAC Countries 0,091
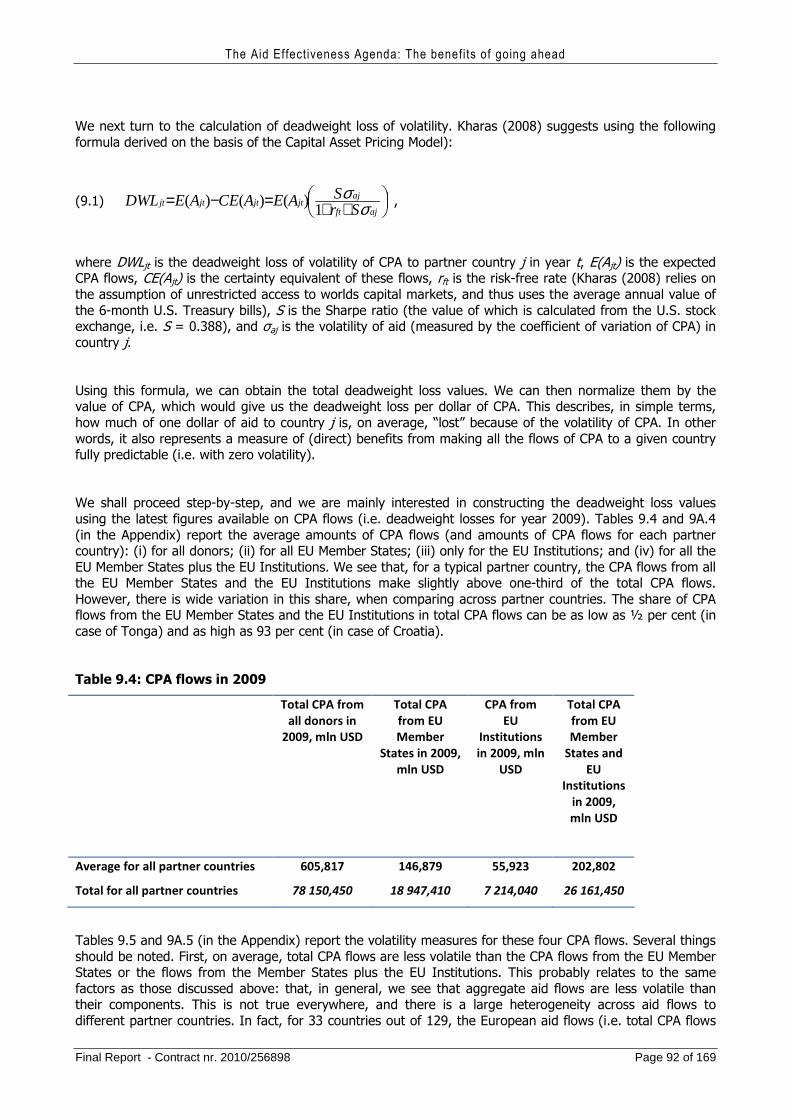
The Aid Effectiveness Agenda: The benefits of going ahead
Final Report - Contract nr. 2010/256898 Page 92 of 169
We next turn to the calculation of deadweight loss of volatility. Kharas (2008) suggests using the following formula derived on the basis of the Capital Asset Pricing Model):
(9.1)
++=−=ajft
ajjtjtjtjt
SrSAEACEAEDWL σ
σ1
)()()( ,
where DWLjt is the deadweight loss of volatility of CPA to partner country j in year t, E(Ajt) is the expected CPA flows, CE(Ajt) is the certainty equivalent of these flows, rft is the risk-free rate (Kharas (2008) relies on the assumption of unrestricted access to worlds capital markets, and thus uses the average annual value of the 6-month U.S. Treasury bills), S is the Sharpe ratio (the value of which is calculated from the U.S. stock exchange, i.e. S = 0.388), and σaj is the volatility of aid (measured by the coefficient of variation of CPA) in country j.
Using this formula, we can obtain the total deadweight loss values. We can then normalize them by the value of CPA, which would give us the deadweight loss per dollar of CPA. This describes, in simple terms, how much of one dollar of aid to country j is, on average, “lost” because of the volatility of CPA. In other words, it also represents a measure of (direct) benefits from making all the flows of CPA to a given country fully predictable (i.e. with zero volatility).
We shall proceed step-by-step, and we are mainly interested in constructing the deadweight loss values using the latest figures available on CPA flows (i.e. deadweight losses for year 2009). Tables 9.4 and 9A.4 (in the Appendix) report the average amounts of CPA flows (and amounts of CPA flows for each partner country): (i) for all donors; (ii) for all EU Member States; (iii) only for the EU Institutions; and (iv) for all the EU Member States plus the EU Institutions. We see that, for a typical partner country, the CPA flows from all the EU Member States and the EU Institutions make slightly above one-third of the total CPA flows. However, there is wide variation in this share, when comparing across partner countries. The share of CPA flows from the EU Member States and the EU Institutions in total CPA flows can be as low as ½ per cent (in case of Tonga) and as high as 93 per cent (in case of Croatia).
Table 9.4: CPA flows in 2009
Total CPA from
all donors in
2009, mln USD
Total CPA
from EU
Member
States in 2009,
mln USD
CPA from
EU
Institutions
in 2009, mln
USD
Total CPA
from EU
Member
States and
EU
Institutions
in 2009,
mln USD
Average for all partner countries 605,817 146,879 55,923 202,802
Total for all partner countries 78 150,450 18 947,410 7 214,040 26 161,450
Tables 9.5 and 9A.5 (in the Appendix) report the volatility measures for these four CPA flows. Several things should be noted. First, on average, total CPA flows are less volatile than the CPA flows from the EU Member States or the flows from the Member States plus the EU Institutions. This probably relates to the same factors as those discussed above: that, in general, we see that aggregate aid flows are less volatile than their components. This is not true everywhere, and there is a large heterogeneity across aid flows to different partner countries. In fact, for 33 countries out of 129, the European aid flows (i.e. total CPA flows
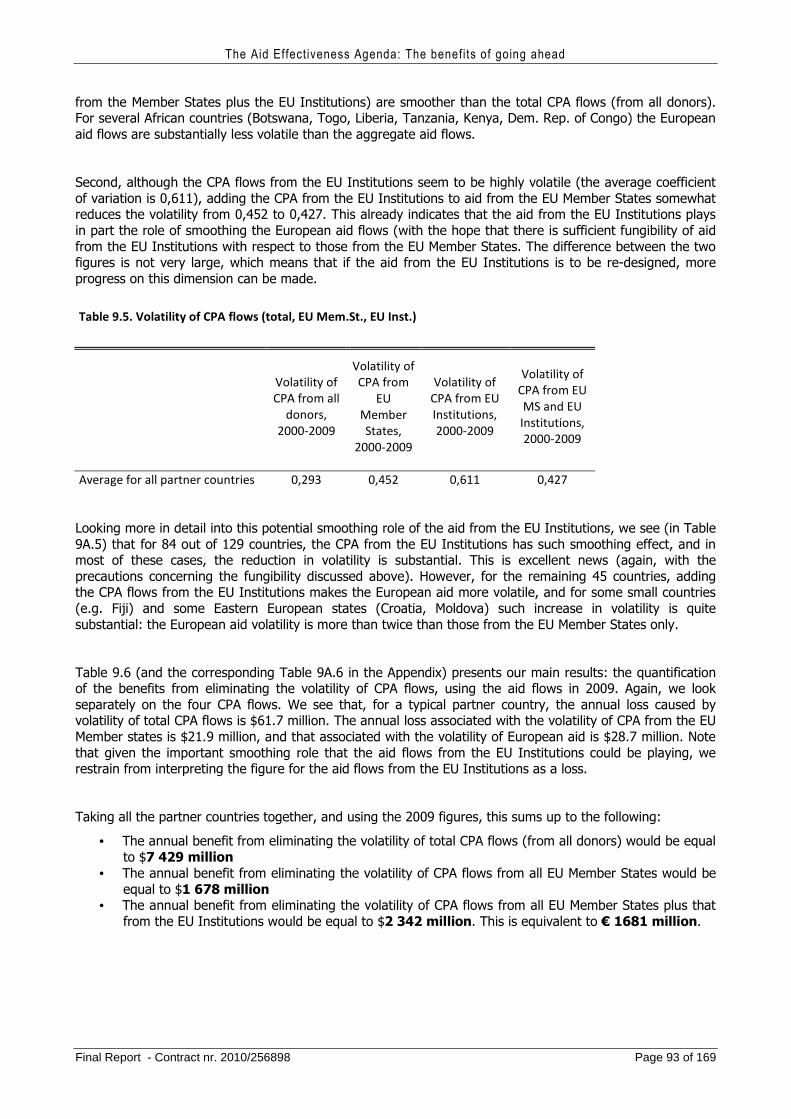
The Aid Effectiveness Agenda: The benefits of going ahead
Final Report - Contract nr. 2010/256898 Page 93 of 169
from the Member States plus the EU Institutions) are smoother than the total CPA flows (from all donors). For several African countries (Botswana, Togo, Liberia, Tanzania, Kenya, Dem. Rep. of Congo) the European aid flows are substantially less volatile than the aggregate aid flows.
Second, although the CPA flows from the EU Institutions seem to be highly volatile (the average coefficient of variation is 0,611), adding the CPA from the EU Institutions to aid from the EU Member States somewhat reduces the volatility from 0,452 to 0,427. This already indicates that the aid from the EU Institutions plays in part the role of smoothing the European aid flows (with the hope that there is sufficient fungibility of aid from the EU Institutions with respect to those from the EU Member States. The difference between the two figures is not very large, which means that if the aid from the EU Institutions is to be re-designed, more progress on this dimension can be made.
Table 9.5. Volatility of CPA flows (total, EU Mem.St., EU Inst.)
Volatility of
CPA from all
donors,
2000-2009
Volatility of
CPA from
EU
Member
States,
2000-2009
Volatility of
CPA from EU
Institutions,
2000-2009
Volatility of
CPA from EU
MS and EU
Institutions,
2000-2009
Average for all partner countries 0,293 0,452 0,611 0,427
Looking more in detail into this potential smoothing role of the aid from the EU Institutions, we see (in Table 9A.5) that for 84 out of 129 countries, the CPA from the EU Institutions has such smoothing effect, and in most of these cases, the reduction in volatility is substantial. This is excellent news (again, with the precautions concerning the fungibility discussed above). However, for the remaining 45 countries, adding the CPA flows from the EU Institutions makes the European aid more volatile, and for some small countries (e.g. Fiji) and some Eastern European states (Croatia, Moldova) such increase in volatility is quite substantial: the European aid volatility is more than twice than those from the EU Member States only.
Table 9.6 (and the corresponding Table 9A.6 in the Appendix) presents our main results: the quantification of the benefits from eliminating the volatility of CPA flows, using the aid flows in 2009. Again, we look separately on the four CPA flows. We see that, for a typical partner country, the annual loss caused by volatility of total CPA flows is $61.7 million. The annual loss associated with the volatility of CPA from the EU Member states is $21.9 million, and that associated with the volatility of European aid is $28.7 million. Note that given the important smoothing role that the aid flows from the EU Institutions could be playing, we restrain from interpreting the figure for the aid flows from the EU Institutions as a loss.
Taking all the partner countries together, and using the 2009 figures, this sums up to the following:
• The annual benefit from eliminating the volatility of total CPA flows (from all donors) would be equal to $7 429 million
• The annual benefit from eliminating the volatility of CPA flows from all EU Member States would be equal to $1 678 million
• The annual benefit from eliminating the volatility of CPA flows from all EU Member States plus that from the EU Institutions would be equal to $2 342 million. This is equivalent to € 1681 million.
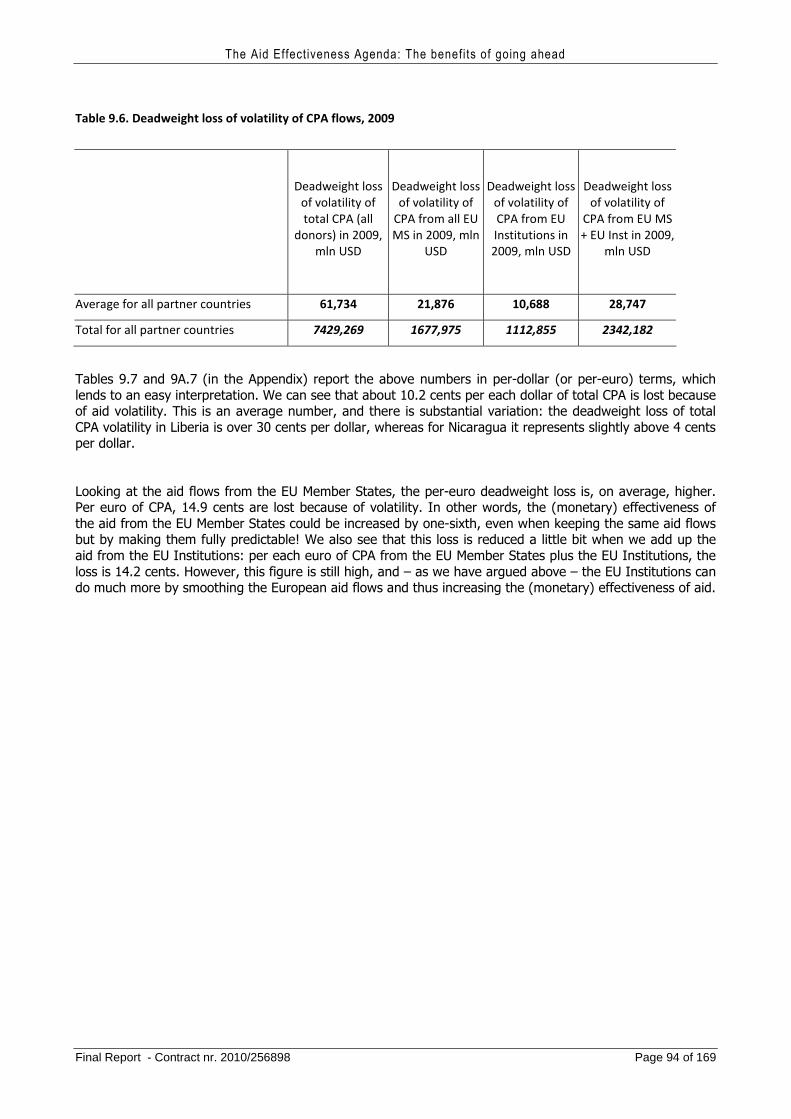
The Aid Effectiveness Agenda: The benefits of going ahead
Final Report - Contract nr. 2010/256898 Page 94 of 169
Table 9.6. Deadweight loss of volatility of CPA flows, 2009
Deadweight loss
of volatility of
total CPA (all
donors) in 2009,
mln USD
Deadweight loss
of volatility of
CPA from all EU
MS in 2009, mln
USD
Deadweight loss
of volatility of
CPA from EU
Institutions in
2009, mln USD
Deadweight loss
of volatility of
CPA from EU MS
+ EU Inst in 2009,
mln USD
Average for all partner countries 61,734 21,876 10,688 28,747
Total for all partner countries 7429,269 1677,975 1112,855 2342,182
Tables 9.7 and 9A.7 (in the Appendix) report the above numbers in per-dollar (or per-euro) terms, which lends to an easy interpretation. We can see that about 10.2 cents per each dollar of total CPA is lost because of aid volatility. This is an average number, and there is substantial variation: the deadweight loss of total CPA volatility in Liberia is over 30 cents per dollar, whereas for Nicaragua it represents slightly above 4 cents per dollar.
Looking at the aid flows from the EU Member States, the per-euro deadweight loss is, on average, higher. Per euro of CPA, 14.9 cents are lost because of volatility. In other words, the (monetary) effectiveness of the aid from the EU Member States could be increased by one-sixth, even when keeping the same aid flows but by making them fully predictable! We also see that this loss is reduced a little bit when we add up the aid from the EU Institutions: per each euro of CPA from the EU Member States plus the EU Institutions, the loss is 14.2 cents. However, this figure is still high, and – as we have argued above – the EU Institutions can do much more by smoothing the European aid flows and thus increasing the (monetary) effectiveness of aid.
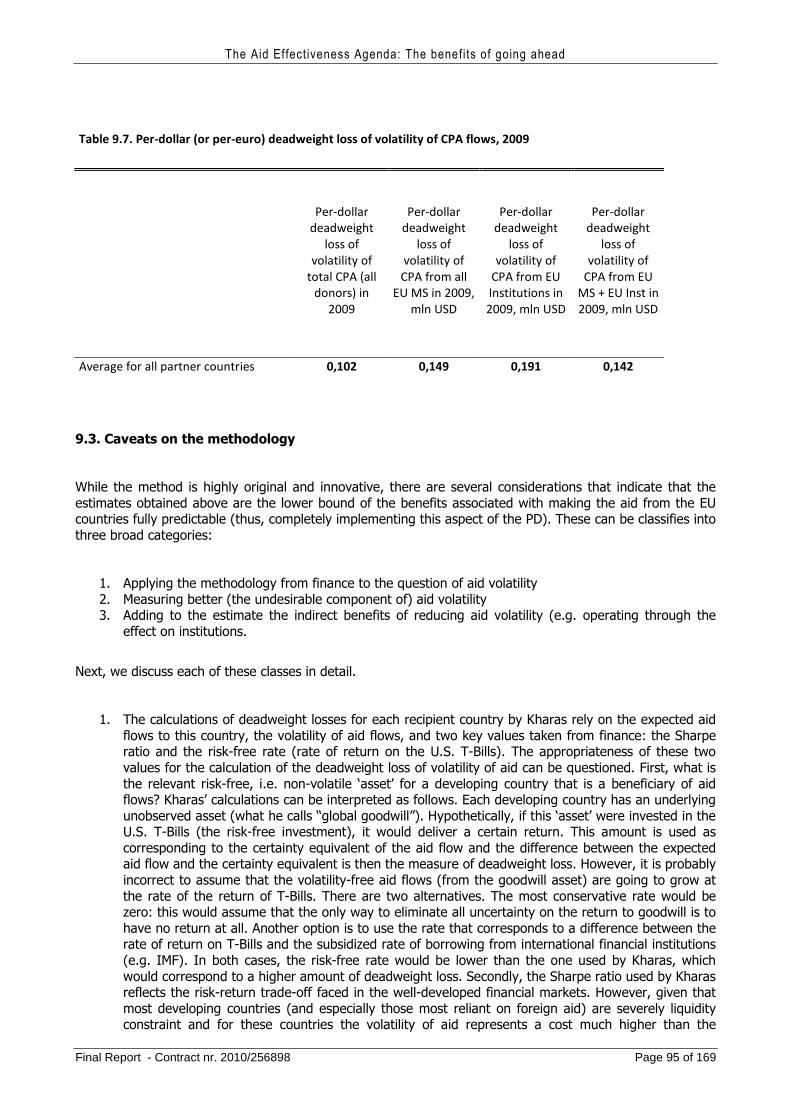
The Aid Effectiveness Agenda: The benefits of going ahead
Final Report - Contract nr. 2010/256898 Page 95 of 169
Table 9.7. Per-dollar (or per-euro) deadweight loss of volatility of CPA flows, 2009
Per-dollar
deadweight
loss of
volatility of
total CPA (all
donors) in
2009
Per-dollar
deadweight
loss of
volatility of
CPA from all
EU MS in 2009,
mln USD
Per-dollar
deadweight
loss of
volatility of
CPA from EU
Institutions in
2009, mln USD
Per-dollar
deadweight
loss of
volatility of
CPA from EU
MS + EU Inst in
2009, mln USD
Average for all partner countries 0,102 0,149 0,191 0,142
9.3. Caveats on the methodology
While the method is highly original and innovative, there are several considerations that indicate that the estimates obtained above are the lower bound of the benefits associated with making the aid from the EU countries fully predictable (thus, completely implementing this aspect of the PD). These can be classifies into three broad categories:
1. Applying the methodology from finance to the question of aid volatility 2. Measuring better (the undesirable component of) aid volatility 3. Adding to the estimate the indirect benefits of reducing aid volatility (e.g. operating through the
effect on institutions.
Next, we discuss each of these classes in detail.
1. The calculations of deadweight losses for each recipient country by Kharas rely on the expected aid flows to this country, the volatility of aid flows, and two key values taken from finance: the Sharpe ratio and the risk-free rate (rate of return on the U.S. T-Bills). The appropriateness of these two values for the calculation of the deadweight loss of volatility of aid can be questioned. First, what is the relevant risk-free, i.e. non-volatile ‘asset’ for a developing country that is a beneficiary of aid flows? Kharas’ calculations can be interpreted as follows. Each developing country has an underlying unobserved asset (what he calls “global goodwill”). Hypothetically, if this ‘asset’ were invested in the U.S. T-Bills (the risk-free investment), it would deliver a certain return. This amount is used as corresponding to the certainty equivalent of the aid flow and the difference between the expected aid flow and the certainty equivalent is then the measure of deadweight loss. However, it is probably incorrect to assume that the volatility-free aid flows (from the goodwill asset) are going to grow at the rate of the return of T-Bills. There are two alternatives. The most conservative rate would be zero: this would assume that the only way to eliminate all uncertainty on the return to goodwill is to have no return at all. Another option is to use the rate that corresponds to a difference between the rate of return on T-Bills and the subsidized rate of borrowing from international financial institutions (e.g. IMF). In both cases, the risk-free rate would be lower than the one used by Kharas, which would correspond to a higher amount of deadweight loss. Secondly, the Sharpe ratio used by Kharas reflects the risk-return trade-off faced in the well-developed financial markets. However, given that most developing countries (and especially those most reliant on foreign aid) are severely liquidity constraint and for these countries the volatility of aid represents a cost much higher than the
The Aid Effectiveness Agenda: The benefits of going ahead
Final Report - Contract nr. 2010/256898 Page 96 of 169
average, it is plausible that for the poorest countries, the Sharpe ratio should be substantially higher. In other words, these countries must be willing to swap the expected amount of aid flows for lower volatility at a much higher rate than 0.38 (the Sharpe ratio used by the author). In this case, for the poorest countries, again, the deadweight loss associated with aid volatility is underestimated.
2. Measuring better (the undesirable component of) aid volatility. If donors are trying to discipline the partner countries by imposing the conditionality of good domestic policies, we are likely to observe some volatility in CPA that can be, at least theoretically, good if such volatility is driven by the disciplining effect. On the other hand, volatility driven by the domestic macroeconomic conditions of donor countries should probably be classified as the bad one. Thus, one way of empirically distinguishing good volatility from the bad one is to instrument the reductions in aid with the macroeconomic variables (e.g. budget deficit) of donor countries. Furthermore, as argued by Desai and Kharas (2010), calculating volatility for each beneficiary country using simply the sample variance is not ideal. An improvement over such measure is to use auto-regressive conditional heteroskedasticity (ARCH) models, borrowed from finance and short-term macroeconomics, for modelling volatility in aid flows. This would allow us to have a time-varying measure of (expected) volatility, from the beneficiary country’s point of view.
3. Finally, the above analysis only considers the direct effect of volatility on the development performance of partner countries. To capture more fully the benefits of implementing this dimension of the Paris Declaration, one should also add to this an estimate for the indirect benefits of reducing aid volatility, in particular the one operating through the effect of reduced volatility on institutions. Some preliminary findings (e.g. Kangoye 2011) find, indeed, that lower volatility is associated with better institutions as measured by the a synthetic corruption index. Moreover, this paper finds that aid dependency is on average associated with less corruption. The causality of such a relationship is not clear-cut, however. It might well be that more aid is given to the better-governed countries (this explains the second association), and, also, given the quality of institutions, such aid given in a more predictable manner (which would explain the first association). Indeed, the recent work by Fielding and Mavrotas (2011) find that the institutional quality of the partner country correlates with the stability of sector aid, but is uncorrelated with the volatility of programme assistance. Clearly, more econometric work needs to be done to discern causality. As noted above, a good way to distinguish the causal effect of volatility would be using instrumental variables techniques.
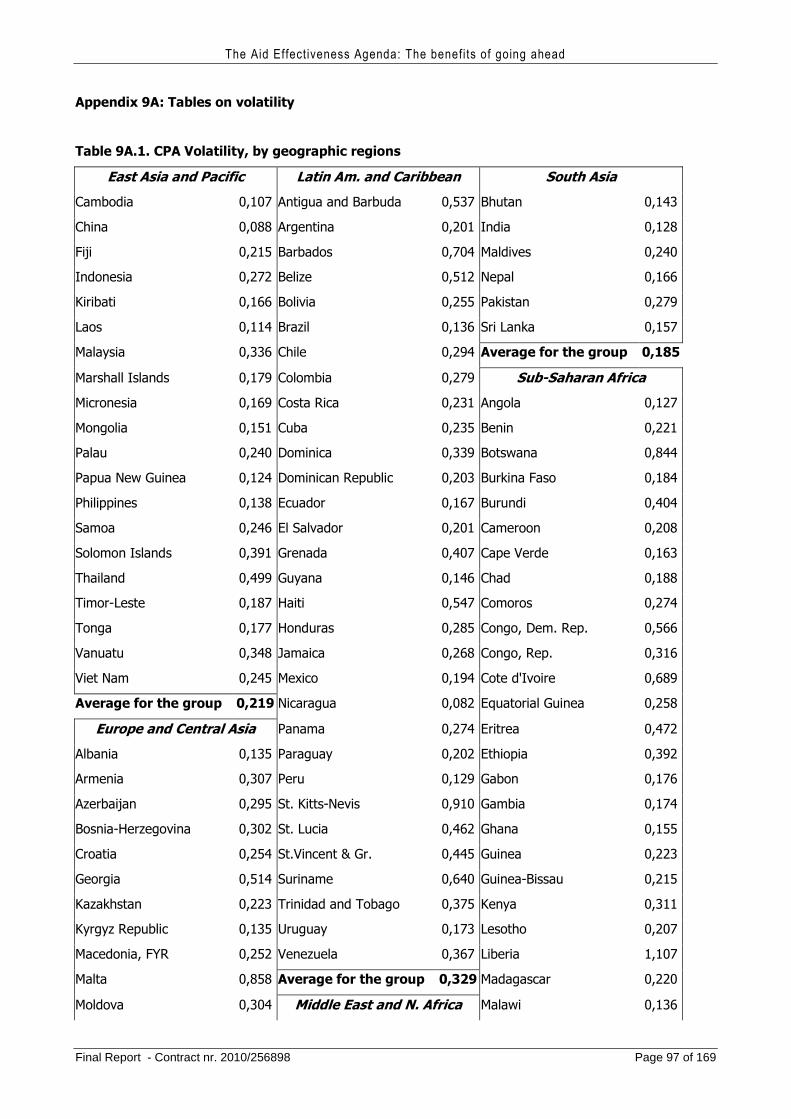
The Aid Effectiveness Agenda: The benefits of going ahead
Final Report - Contract nr. 2010/256898 Page 97 of 169
Appendix 9A: Tables on volatility
Table 9A.1. CPA Volatility, by geographic regions
East Asia and Pacific Latin Am. and Caribbean South Asia
Cambodia 0,107 Antigua and Barbuda 0,537 Bhutan 0,143
China 0,088 Argentina 0,201 India 0,128
Fiji 0,215 Barbados 0,704 Maldives 0,240
Indonesia 0,272 Belize 0,512 Nepal 0,166
Kiribati 0,166 Bolivia 0,255 Pakistan 0,279
Laos 0,114 Brazil 0,136 Sri Lanka 0,157
Malaysia 0,336 Chile 0,294 Average for the group 0,185
Marshall Islands 0,179 Colombia 0,279 Sub-Saharan Africa
Micronesia 0,169 Costa Rica 0,231 Angola 0,127
Mongolia 0,151 Cuba 0,235 Benin 0,221
Palau 0,240 Dominica 0,339 Botswana 0,844
Papua New Guinea 0,124 Dominican Republic 0,203 Burkina Faso 0,184
Philippines 0,138 Ecuador 0,167 Burundi 0,404
Samoa 0,246 El Salvador 0,201 Cameroon 0,208
Solomon Islands 0,391 Grenada 0,407 Cape Verde 0,163
Thailand 0,499 Guyana 0,146 Chad 0,188
Timor-Leste 0,187 Haiti 0,547 Comoros 0,274
Tonga 0,177 Honduras 0,285 Congo, Dem. Rep. 0,566
Vanuatu 0,348 Jamaica 0,268 Congo, Rep. 0,316
Viet Nam 0,245 Mexico 0,194 Cote d'Ivoire 0,689
Average for the group 0,219 Nicaragua 0,082 Equatorial Guinea 0,258
Europe and Central Asia Panama 0,274 Eritrea 0,472
Albania 0,135 Paraguay 0,202 Ethiopia 0,392
Armenia 0,307 Peru 0,129 Gabon 0,176
Azerbaijan 0,295 St. Kitts-Nevis 0,910 Gambia 0,174
Bosnia-Herzegovina 0,302 St. Lucia 0,462 Ghana 0,155
Croatia 0,254 St.Vincent & Gr. 0,445 Guinea 0,223
Georgia 0,514 Suriname 0,640 Guinea-Bissau 0,215
Kazakhstan 0,223 Trinidad and Tobago 0,375 Kenya 0,311
Kyrgyz Republic 0,135 Uruguay 0,173 Lesotho 0,207
Macedonia, FYR 0,252 Venezuela 0,367 Liberia 1,107
Malta 0,858 Average for the group 0,329 Madagascar 0,220
Moldova 0,304 Middle East and N. Africa Malawi 0,136
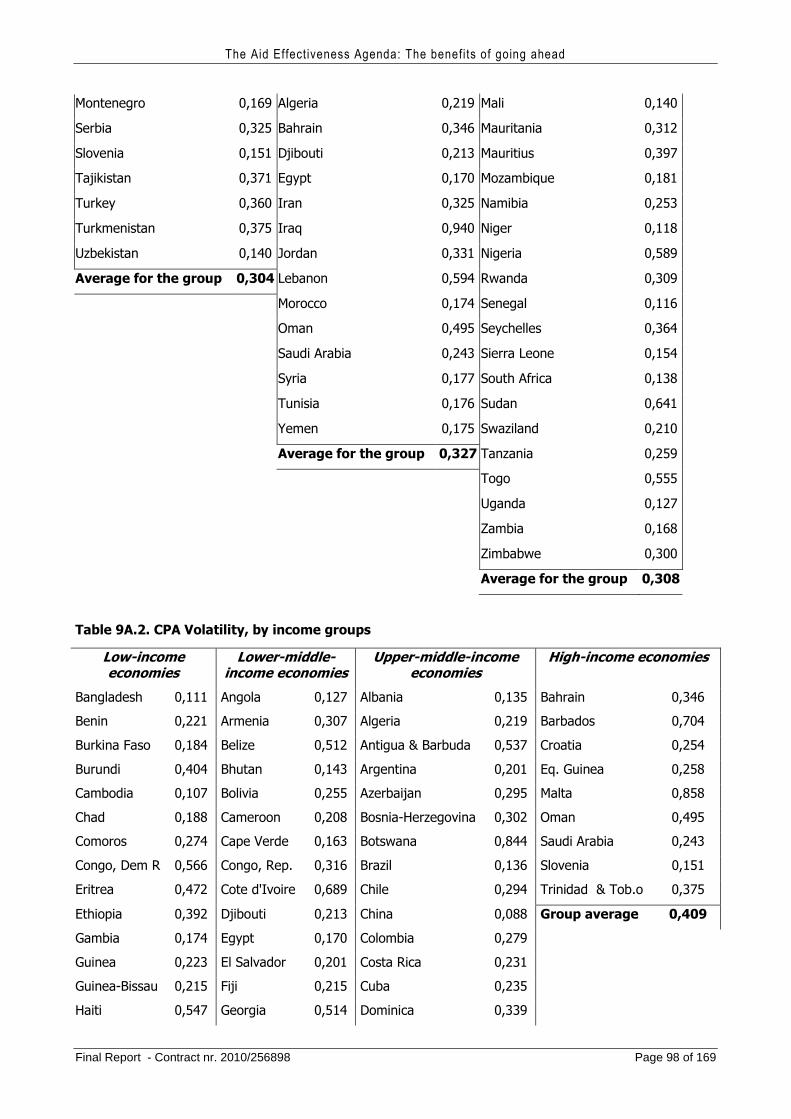
The Aid Effectiveness Agenda: The benefits of going ahead
Final Report - Contract nr. 2010/256898 Page 98 of 169
Montenegro 0,169 Algeria 0,219 Mali 0,140
Serbia 0,325 Bahrain 0,346 Mauritania 0,312
Slovenia 0,151 Djibouti 0,213 Mauritius 0,397
Tajikistan 0,371 Egypt 0,170 Mozambique 0,181
Turkey 0,360 Iran 0,325 Namibia 0,253
Turkmenistan 0,375 Iraq 0,940 Niger 0,118
Uzbekistan 0,140 Jordan 0,331 Nigeria 0,589
Average for the group 0,304 Lebanon 0,594 Rwanda 0,309
Morocco 0,174 Senegal 0,116
Oman 0,495 Seychelles 0,364
Saudi Arabia 0,243 Sierra Leone 0,154
Syria 0,177 South Africa 0,138
Tunisia 0,176 Sudan 0,641
Yemen 0,175 Swaziland 0,210
Average for the group 0,327 Tanzania 0,259
Togo 0,555
Uganda 0,127
Zambia 0,168
Zimbabwe 0,300
Average for the group 0,308
Table 9A.2. CPA Volatility, by income groups
Low-income economies
Lower-middle-income economies
Upper-middle-income economies
High-income economies
Bangladesh 0,111 Angola 0,127 Albania 0,135 Bahrain 0,346
Benin 0,221 Armenia 0,307 Algeria 0,219 Barbados 0,704
Burkina Faso 0,184 Belize 0,512 Antigua & Barbuda 0,537 Croatia 0,254
Burundi 0,404 Bhutan 0,143 Argentina 0,201 Eq. Guinea 0,258
Cambodia 0,107 Bolivia 0,255 Azerbaijan 0,295 Malta 0,858
Chad 0,188 Cameroon 0,208 Bosnia-Herzegovina 0,302 Oman 0,495
Comoros 0,274 Cape Verde 0,163 Botswana 0,844 Saudi Arabia 0,243
Congo, Dem R 0,566 Congo, Rep. 0,316 Brazil 0,136 Slovenia 0,151
Eritrea 0,472 Cote d'Ivoire 0,689 Chile 0,294 Trinidad & Tob.o 0,375
Ethiopia 0,392 Djibouti 0,213 China 0,088 Group average 0,409
Gambia 0,174 Egypt 0,170 Colombia 0,279
Guinea 0,223 El Salvador 0,201 Costa Rica 0,231
Guinea-Bissau 0,215 Fiji 0,215 Cuba 0,235
Haiti 0,547 Georgia 0,514 Dominica 0,339
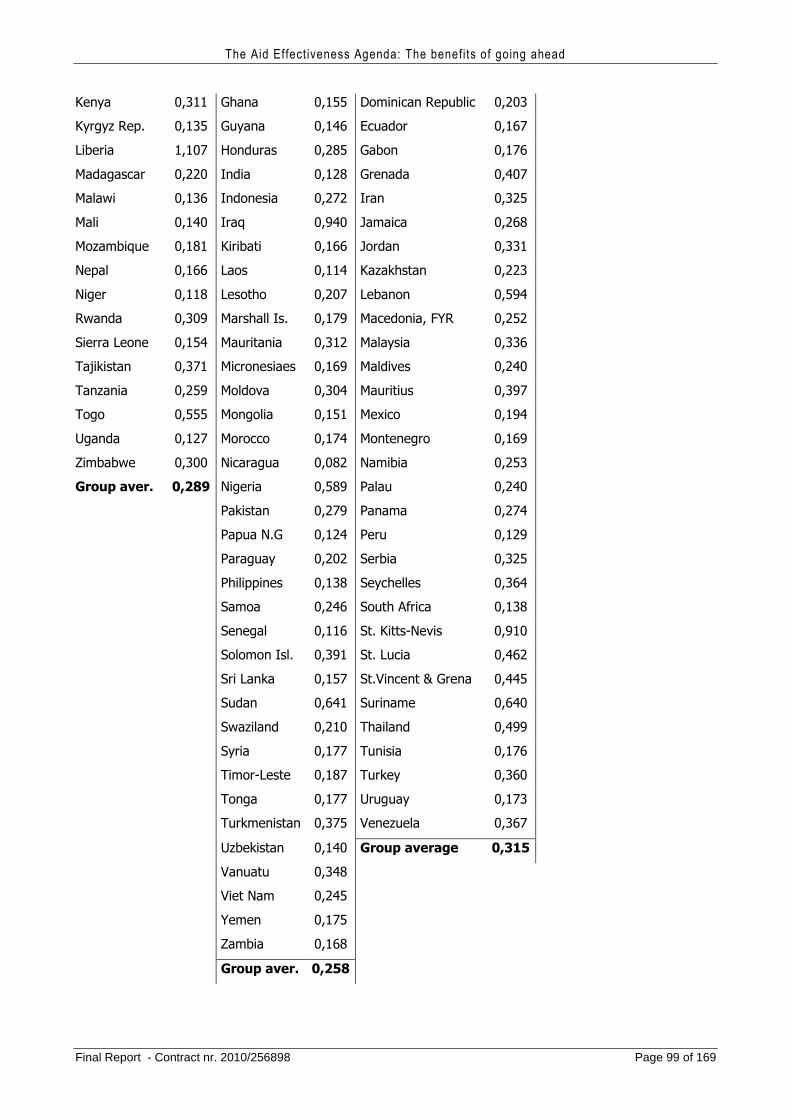
The Aid Effectiveness Agenda: The benefits of going ahead
Final Report - Contract nr. 2010/256898 Page 99 of 169
Kenya 0,311 Ghana 0,155 Dominican Republic 0,203
Kyrgyz Rep. 0,135 Guyana 0,146 Ecuador 0,167
Liberia 1,107 Honduras 0,285 Gabon 0,176
Madagascar 0,220 India 0,128 Grenada 0,407
Malawi 0,136 Indonesia 0,272 Iran 0,325
Mali 0,140 Iraq 0,940 Jamaica 0,268
Mozambique 0,181 Kiribati 0,166 Jordan 0,331
Nepal 0,166 Laos 0,114 Kazakhstan 0,223
Niger 0,118 Lesotho 0,207 Lebanon 0,594
Rwanda 0,309 Marshall Is. 0,179 Macedonia, FYR 0,252
Sierra Leone 0,154 Mauritania 0,312 Malaysia 0,336
Tajikistan 0,371 Micronesiaes 0,169 Maldives 0,240
Tanzania 0,259 Moldova 0,304 Mauritius 0,397
Togo 0,555 Mongolia 0,151 Mexico 0,194
Uganda 0,127 Morocco 0,174 Montenegro 0,169
Zimbabwe 0,300 Nicaragua 0,082 Namibia 0,253
Group aver. 0,289 Nigeria 0,589 Palau 0,240
Pakistan 0,279 Panama 0,274
Papua N.G 0,124 Peru 0,129
Paraguay 0,202 Serbia 0,325
Philippines 0,138 Seychelles 0,364
Samoa 0,246 South Africa 0,138
Senegal 0,116 St. Kitts-Nevis 0,910
Solomon Isl. 0,391 St. Lucia 0,462
Sri Lanka 0,157 St.Vincent & Grena 0,445
Sudan 0,641 Suriname 0,640
Swaziland 0,210 Thailand 0,499
Syria 0,177 Tunisia 0,176
Timor-Leste 0,187 Turkey 0,360
Tonga 0,177 Uruguay 0,173
Turkmenistan 0,375 Venezuela 0,367
Uzbekistan 0,140 Group average 0,315
Vanuatu 0,348
Viet Nam 0,245
Yemen 0,175
Zambia 0,168
Group aver. 0,258
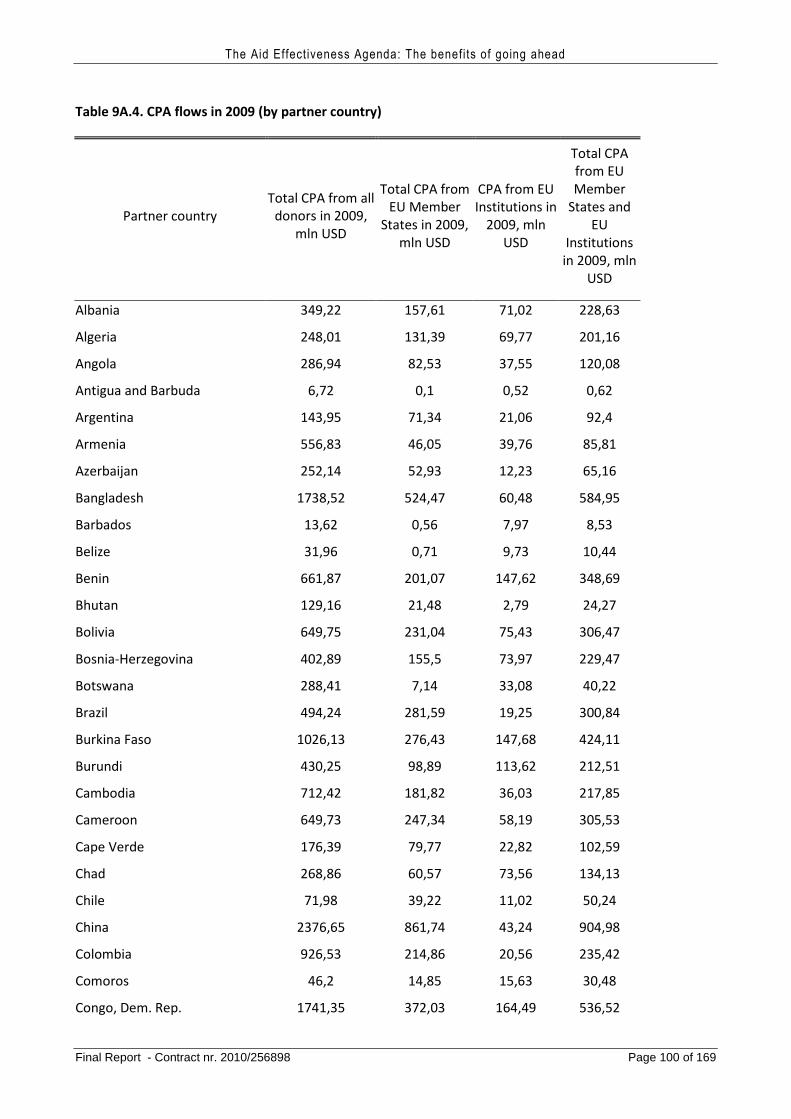
The Aid Effectiveness Agenda: The benefits of going ahead
Final Report - Contract nr. 2010/256898 Page 100 of 169
Table 9A.4. CPA flows in 2009 (by partner country)
Partner country
Total CPA from all
donors in 2009,
mln USD
Total CPA from
EU Member
States in 2009,
mln USD
CPA from EU
Institutions in
2009, mln
USD
Total CPA
from EU
Member
States and
EU
Institutions
in 2009, mln
USD
Albania 349,22 157,61 71,02 228,63
Algeria 248,01 131,39 69,77 201,16
Angola 286,94 82,53 37,55 120,08
Antigua and Barbuda 6,72 0,1 0,52 0,62
Argentina 143,95 71,34 21,06 92,4
Armenia 556,83 46,05 39,76 85,81
Azerbaijan 252,14 52,93 12,23 65,16
Bangladesh 1738,52 524,47 60,48 584,95
Barbados 13,62 0,56 7,97 8,53
Belize 31,96 0,71 9,73 10,44
Benin 661,87 201,07 147,62 348,69
Bhutan 129,16 21,48 2,79 24,27
Bolivia 649,75 231,04 75,43 306,47
Bosnia-Herzegovina 402,89 155,5 73,97 229,47
Botswana 288,41 7,14 33,08 40,22
Brazil 494,24 281,59 19,25 300,84
Burkina Faso 1026,13 276,43 147,68 424,11
Burundi 430,25 98,89 113,62 212,51
Cambodia 712,42 181,82 36,03 217,85
Cameroon 649,73 247,34 58,19 305,53
Cape Verde 176,39 79,77 22,82 102,59
Chad 268,86 60,57 73,56 134,13
Chile 71,98 39,22 11,02 50,24
China 2376,65 861,74 43,24 904,98
Colombia 926,53 214,86 20,56 235,42
Comoros 46,2 14,85 15,63 30,48
Congo, Dem. Rep. 1741,35 372,03 164,49 536,52
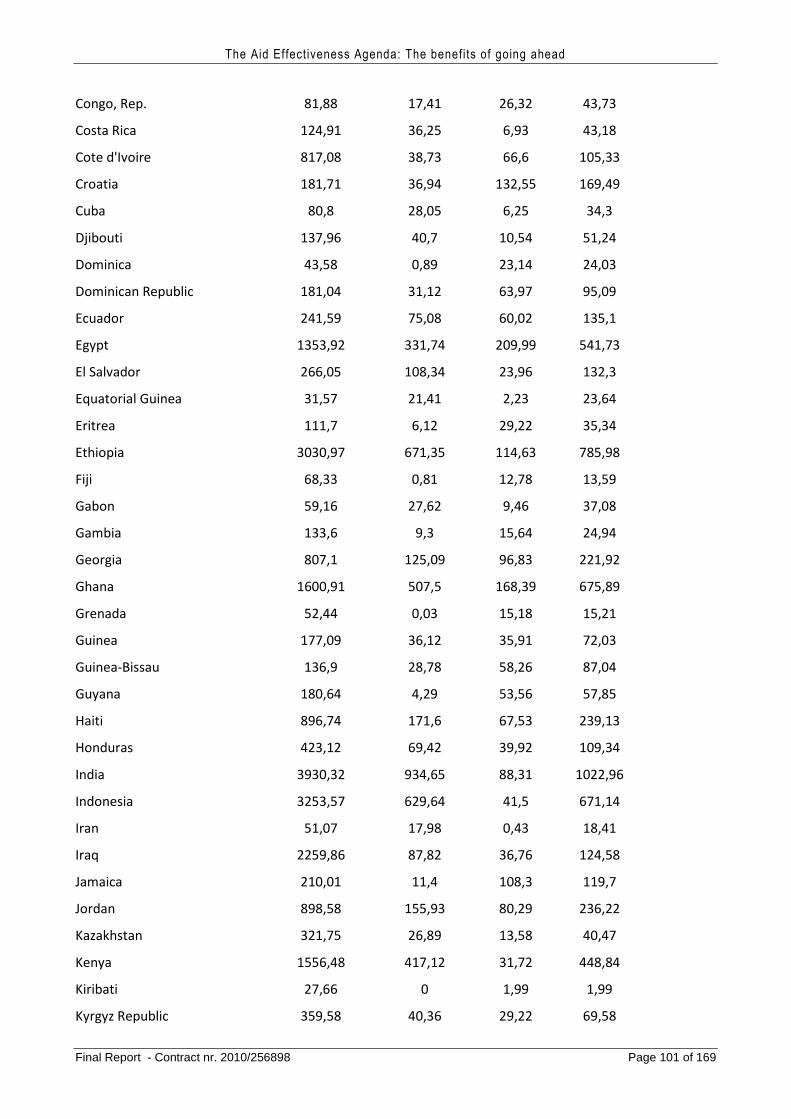
The Aid Effectiveness Agenda: The benefits of going ahead
Final Report - Contract nr. 2010/256898 Page 101 of 169
Congo, Rep. 81,88 17,41 26,32 43,73
Costa Rica 124,91 36,25 6,93 43,18
Cote d'Ivoire 817,08 38,73 66,6 105,33
Croatia 181,71 36,94 132,55 169,49
Cuba 80,8 28,05 6,25 34,3
Djibouti 137,96 40,7 10,54 51,24
Dominica 43,58 0,89 23,14 24,03
Dominican Republic 181,04 31,12 63,97 95,09
Ecuador 241,59 75,08 60,02 135,1
Egypt 1353,92 331,74 209,99 541,73
El Salvador 266,05 108,34 23,96 132,3
Equatorial Guinea 31,57 21,41 2,23 23,64
Eritrea 111,7 6,12 29,22 35,34
Ethiopia 3030,97 671,35 114,63 785,98
Fiji 68,33 0,81 12,78 13,59
Gabon 59,16 27,62 9,46 37,08
Gambia 133,6 9,3 15,64 24,94
Georgia 807,1 125,09 96,83 221,92
Ghana 1600,91 507,5 168,39 675,89
Grenada 52,44 0,03 15,18 15,21
Guinea 177,09 36,12 35,91 72,03
Guinea-Bissau 136,9 28,78 58,26 87,04
Guyana 180,64 4,29 53,56 57,85
Haiti 896,74 171,6 67,53 239,13
Honduras 423,12 69,42 39,92 109,34
India 3930,32 934,65 88,31 1022,96
Indonesia 3253,57 629,64 41,5 671,14
Iran 51,07 17,98 0,43 18,41
Iraq 2259,86 87,82 36,76 124,58
Jamaica 210,01 11,4 108,3 119,7
Jordan 898,58 155,93 80,29 236,22
Kazakhstan 321,75 26,89 13,58 40,47
Kenya 1556,48 417,12 31,72 448,84
Kiribati 27,66 0 1,99 1,99
Kyrgyz Republic 359,58 40,36 29,22 69,58
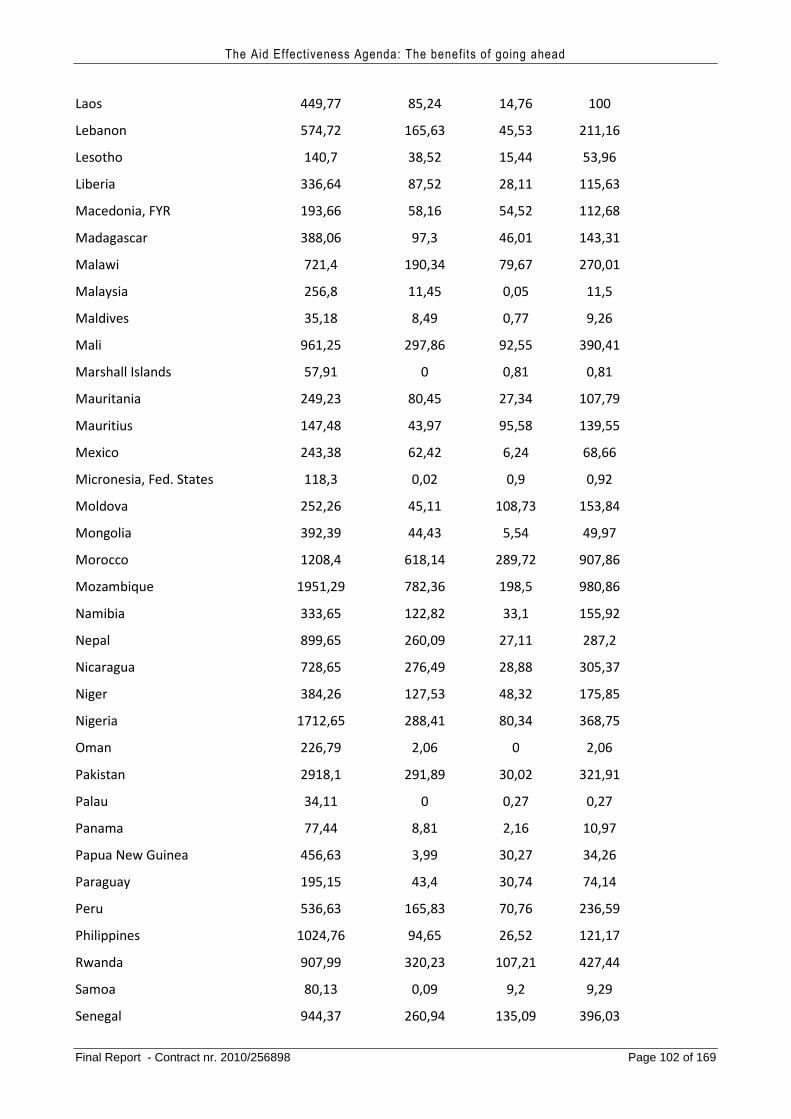
The Aid Effectiveness Agenda: The benefits of going ahead
Final Report - Contract nr. 2010/256898 Page 102 of 169
Laos 449,77 85,24 14,76 100
Lebanon 574,72 165,63 45,53 211,16
Lesotho 140,7 38,52 15,44 53,96
Liberia 336,64 87,52 28,11 115,63
Macedonia, FYR 193,66 58,16 54,52 112,68
Madagascar 388,06 97,3 46,01 143,31
Malawi 721,4 190,34 79,67 270,01
Malaysia 256,8 11,45 0,05 11,5
Maldives 35,18 8,49 0,77 9,26
Mali 961,25 297,86 92,55 390,41
Marshall Islands 57,91 0 0,81 0,81
Mauritania 249,23 80,45 27,34 107,79
Mauritius 147,48 43,97 95,58 139,55
Mexico 243,38 62,42 6,24 68,66
Micronesia, Fed. States 118,3 0,02 0,9 0,92
Moldova 252,26 45,11 108,73 153,84
Mongolia 392,39 44,43 5,54 49,97
Morocco 1208,4 618,14 289,72 907,86
Mozambique 1951,29 782,36 198,5 980,86
Namibia 333,65 122,82 33,1 155,92
Nepal 899,65 260,09 27,11 287,2
Nicaragua 728,65 276,49 28,88 305,37
Niger 384,26 127,53 48,32 175,85
Nigeria 1712,65 288,41 80,34 368,75
Oman 226,79 2,06 0 2,06
Pakistan 2918,1 291,89 30,02 321,91
Palau 34,11 0 0,27 0,27
Panama 77,44 8,81 2,16 10,97
Papua New Guinea 456,63 3,99 30,27 34,26
Paraguay 195,15 43,4 30,74 74,14
Peru 536,63 165,83 70,76 236,59
Philippines 1024,76 94,65 26,52 121,17
Rwanda 907,99 320,23 107,21 427,44
Samoa 80,13 0,09 9,2 9,29
Senegal 944,37 260,94 135,09 396,03
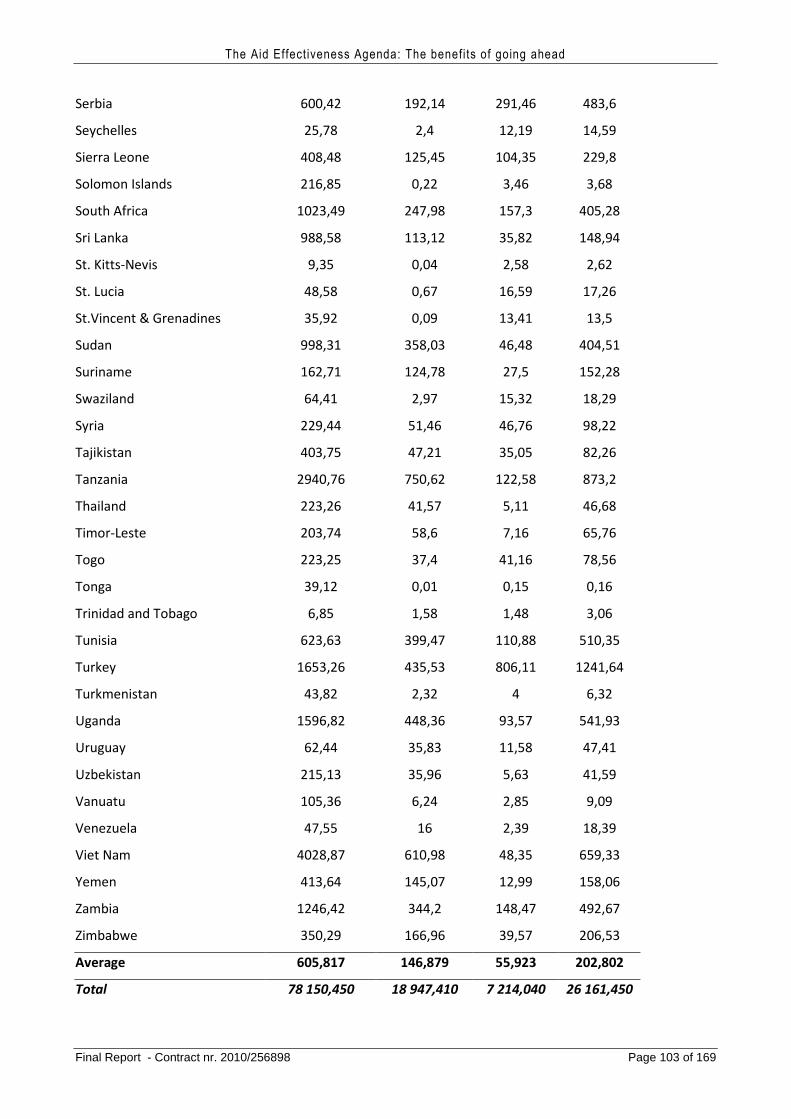
The Aid Effectiveness Agenda: The benefits of going ahead
Final Report - Contract nr. 2010/256898 Page 103 of 169
Serbia 600,42 192,14 291,46 483,6
Seychelles 25,78 2,4 12,19 14,59
Sierra Leone 408,48 125,45 104,35 229,8
Solomon Islands 216,85 0,22 3,46 3,68
South Africa 1023,49 247,98 157,3 405,28
Sri Lanka 988,58 113,12 35,82 148,94
St. Kitts-Nevis 9,35 0,04 2,58 2,62
St. Lucia 48,58 0,67 16,59 17,26
St.Vincent & Grenadines 35,92 0,09 13,41 13,5
Sudan 998,31 358,03 46,48 404,51
Suriname 162,71 124,78 27,5 152,28
Swaziland 64,41 2,97 15,32 18,29
Syria 229,44 51,46 46,76 98,22
Tajikistan 403,75 47,21 35,05 82,26
Tanzania 2940,76 750,62 122,58 873,2
Thailand 223,26 41,57 5,11 46,68
Timor-Leste 203,74 58,6 7,16 65,76
Togo 223,25 37,4 41,16 78,56
Tonga 39,12 0,01 0,15 0,16
Trinidad and Tobago 6,85 1,58 1,48 3,06
Tunisia 623,63 399,47 110,88 510,35
Turkey 1653,26 435,53 806,11 1241,64
Turkmenistan 43,82 2,32 4 6,32
Uganda 1596,82 448,36 93,57 541,93
Uruguay 62,44 35,83 11,58 47,41
Uzbekistan 215,13 35,96 5,63 41,59
Vanuatu 105,36 6,24 2,85 9,09
Venezuela 47,55 16 2,39 18,39
Viet Nam 4028,87 610,98 48,35 659,33
Yemen 413,64 145,07 12,99 158,06
Zambia 1246,42 344,2 148,47 492,67
Zimbabwe 350,29 166,96 39,57 206,53
Average 605,817 146,879 55,923 202,802
Total 78 150,450 18 947,410 7 214,040 26 161,450
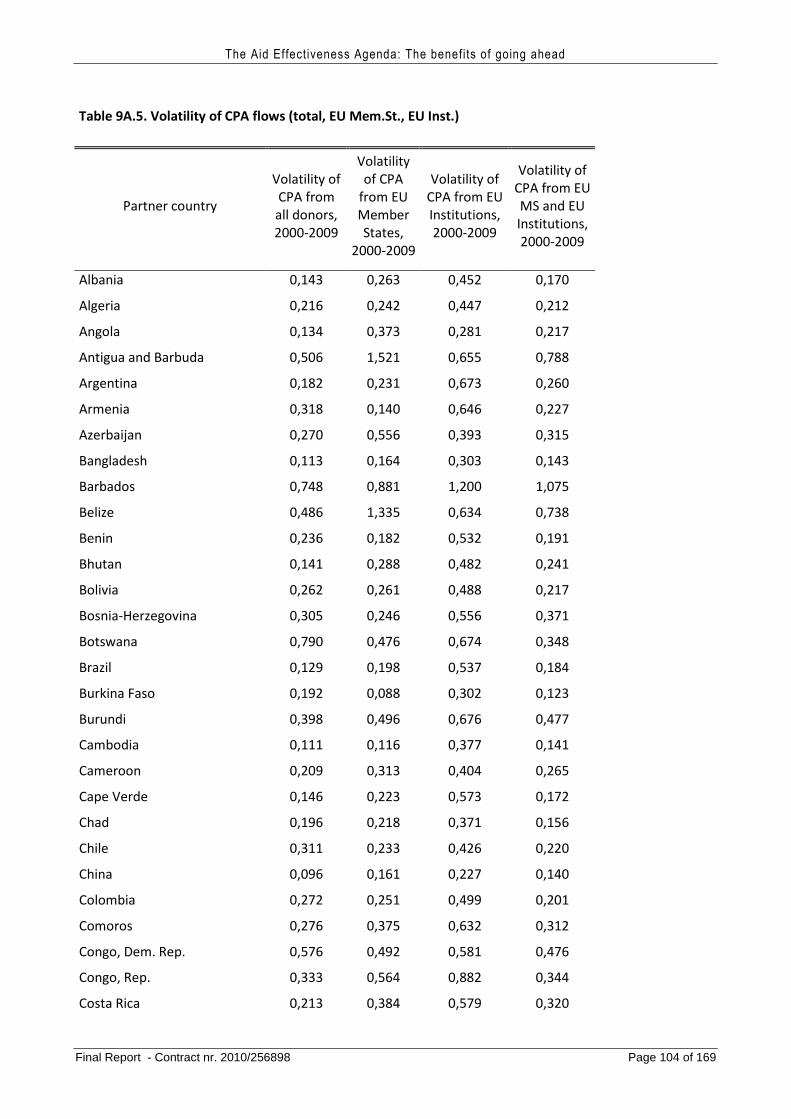
The Aid Effectiveness Agenda: The benefits of going ahead
Final Report - Contract nr. 2010/256898 Page 104 of 169
Table 9A.5. Volatility of CPA flows (total, EU Mem.St., EU Inst.)
Partner country
Volatility of
CPA from
all donors,
2000-2009
Volatility
of CPA
from EU
Member
States,
2000-2009
Volatility of
CPA from EU
Institutions,
2000-2009
Volatility of
CPA from EU
MS and EU
Institutions,
2000-2009
Albania 0,143 0,263 0,452 0,170
Algeria 0,216 0,242 0,447 0,212
Angola 0,134 0,373 0,281 0,217
Antigua and Barbuda 0,506 1,521 0,655 0,788
Argentina 0,182 0,231 0,673 0,260
Armenia 0,318 0,140 0,646 0,227
Azerbaijan 0,270 0,556 0,393 0,315
Bangladesh 0,113 0,164 0,303 0,143
Barbados 0,748 0,881 1,200 1,075
Belize 0,486 1,335 0,634 0,738
Benin 0,236 0,182 0,532 0,191
Bhutan 0,141 0,288 0,482 0,241
Bolivia 0,262 0,261 0,488 0,217
Bosnia-Herzegovina 0,305 0,246 0,556 0,371
Botswana 0,790 0,476 0,674 0,348
Brazil 0,129 0,198 0,537 0,184
Burkina Faso 0,192 0,088 0,302 0,123
Burundi 0,398 0,496 0,676 0,477
Cambodia 0,111 0,116 0,377 0,141
Cameroon 0,209 0,313 0,404 0,265
Cape Verde 0,146 0,223 0,573 0,172
Chad 0,196 0,218 0,371 0,156
Chile 0,311 0,233 0,426 0,220
China 0,096 0,161 0,227 0,140
Colombia 0,272 0,251 0,499 0,201
Comoros 0,276 0,375 0,632 0,312
Congo, Dem. Rep. 0,576 0,492 0,581 0,476
Congo, Rep. 0,333 0,564 0,882 0,344
Costa Rica 0,213 0,384 0,579 0,320
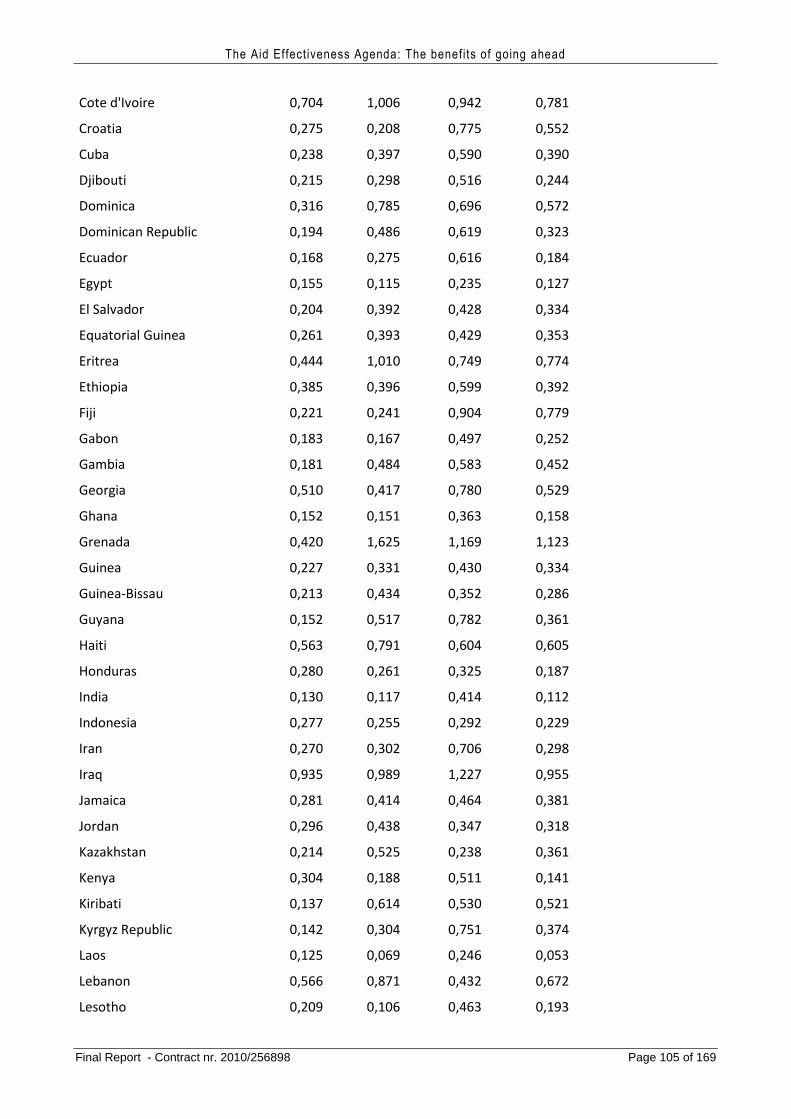
The Aid Effectiveness Agenda: The benefits of going ahead
Final Report - Contract nr. 2010/256898 Page 105 of 169
Cote d'Ivoire 0,704 1,006 0,942 0,781
Croatia 0,275 0,208 0,775 0,552
Cuba 0,238 0,397 0,590 0,390
Djibouti 0,215 0,298 0,516 0,244
Dominica 0,316 0,785 0,696 0,572
Dominican Republic 0,194 0,486 0,619 0,323
Ecuador 0,168 0,275 0,616 0,184
Egypt 0,155 0,115 0,235 0,127
El Salvador 0,204 0,392 0,428 0,334
Equatorial Guinea 0,261 0,393 0,429 0,353
Eritrea 0,444 1,010 0,749 0,774
Ethiopia 0,385 0,396 0,599 0,392
Fiji 0,221 0,241 0,904 0,779
Gabon 0,183 0,167 0,497 0,252
Gambia 0,181 0,484 0,583 0,452
Georgia 0,510 0,417 0,780 0,529
Ghana 0,152 0,151 0,363 0,158
Grenada 0,420 1,625 1,169 1,123
Guinea 0,227 0,331 0,430 0,334
Guinea-Bissau 0,213 0,434 0,352 0,286
Guyana 0,152 0,517 0,782 0,361
Haiti 0,563 0,791 0,604 0,605
Honduras 0,280 0,261 0,325 0,187
India 0,130 0,117 0,414 0,112
Indonesia 0,277 0,255 0,292 0,229
Iran 0,270 0,302 0,706 0,298
Iraq 0,935 0,989 1,227 0,955
Jamaica 0,281 0,414 0,464 0,381
Jordan 0,296 0,438 0,347 0,318
Kazakhstan 0,214 0,525 0,238 0,361
Kenya 0,304 0,188 0,511 0,141
Kiribati 0,137 0,614 0,530 0,521
Kyrgyz Republic 0,142 0,304 0,751 0,374
Laos 0,125 0,069 0,246 0,053
Lebanon 0,566 0,871 0,432 0,672
Lesotho 0,209 0,106 0,463 0,193
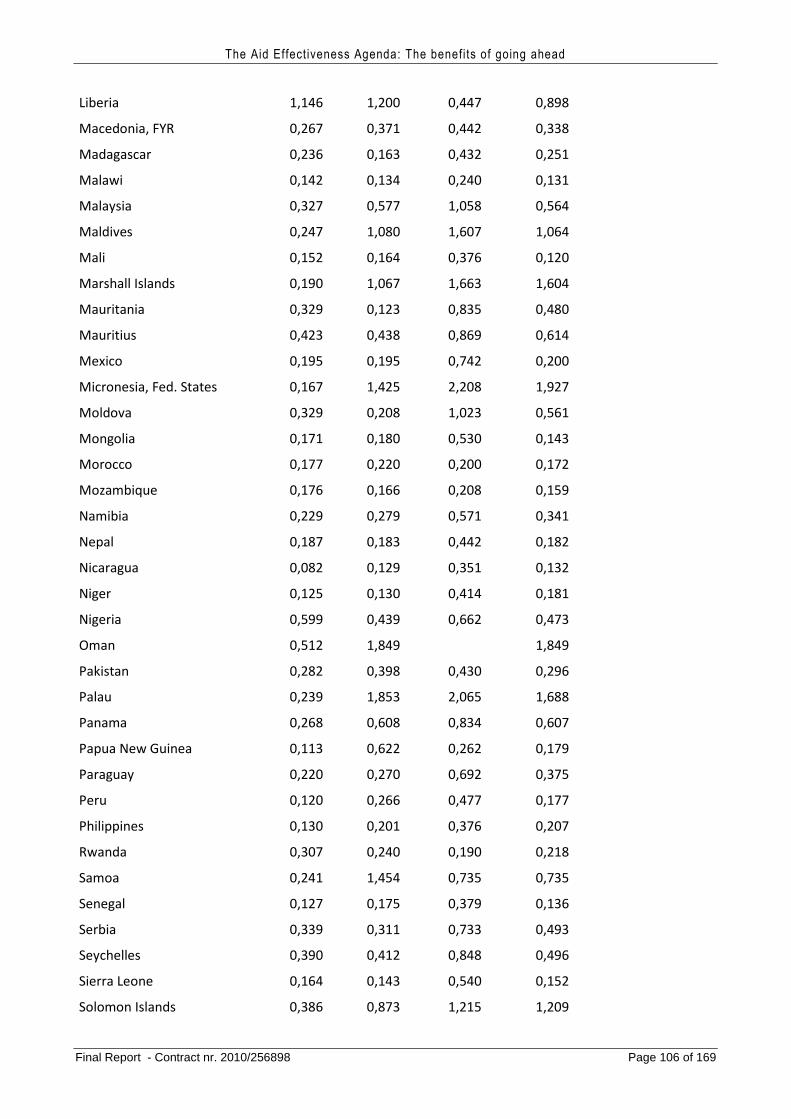
The Aid Effectiveness Agenda: The benefits of going ahead
Final Report - Contract nr. 2010/256898 Page 106 of 169
Liberia 1,146 1,200 0,447 0,898
Macedonia, FYR 0,267 0,371 0,442 0,338
Madagascar 0,236 0,163 0,432 0,251
Malawi 0,142 0,134 0,240 0,131
Malaysia 0,327 0,577 1,058 0,564
Maldives 0,247 1,080 1,607 1,064
Mali 0,152 0,164 0,376 0,120
Marshall Islands 0,190 1,067 1,663 1,604
Mauritania 0,329 0,123 0,835 0,480
Mauritius 0,423 0,438 0,869 0,614
Mexico 0,195 0,195 0,742 0,200
Micronesia, Fed. States 0,167 1,425 2,208 1,927
Moldova 0,329 0,208 1,023 0,561
Mongolia 0,171 0,180 0,530 0,143
Morocco 0,177 0,220 0,200 0,172
Mozambique 0,176 0,166 0,208 0,159
Namibia 0,229 0,279 0,571 0,341
Nepal 0,187 0,183 0,442 0,182
Nicaragua 0,082 0,129 0,351 0,132
Niger 0,125 0,130 0,414 0,181
Nigeria 0,599 0,439 0,662 0,473
Oman 0,512 1,849 1,849
Pakistan 0,282 0,398 0,430 0,296
Palau 0,239 1,853 2,065 1,688
Panama 0,268 0,608 0,834 0,607
Papua New Guinea 0,113 0,622 0,262 0,179
Paraguay 0,220 0,270 0,692 0,375
Peru 0,120 0,266 0,477 0,177
Philippines 0,130 0,201 0,376 0,207
Rwanda 0,307 0,240 0,190 0,218
Samoa 0,241 1,454 0,735 0,735
Senegal 0,127 0,175 0,379 0,136
Serbia 0,339 0,311 0,733 0,493
Seychelles 0,390 0,412 0,848 0,496
Sierra Leone 0,164 0,143 0,540 0,152
Solomon Islands 0,386 0,873 1,215 1,209
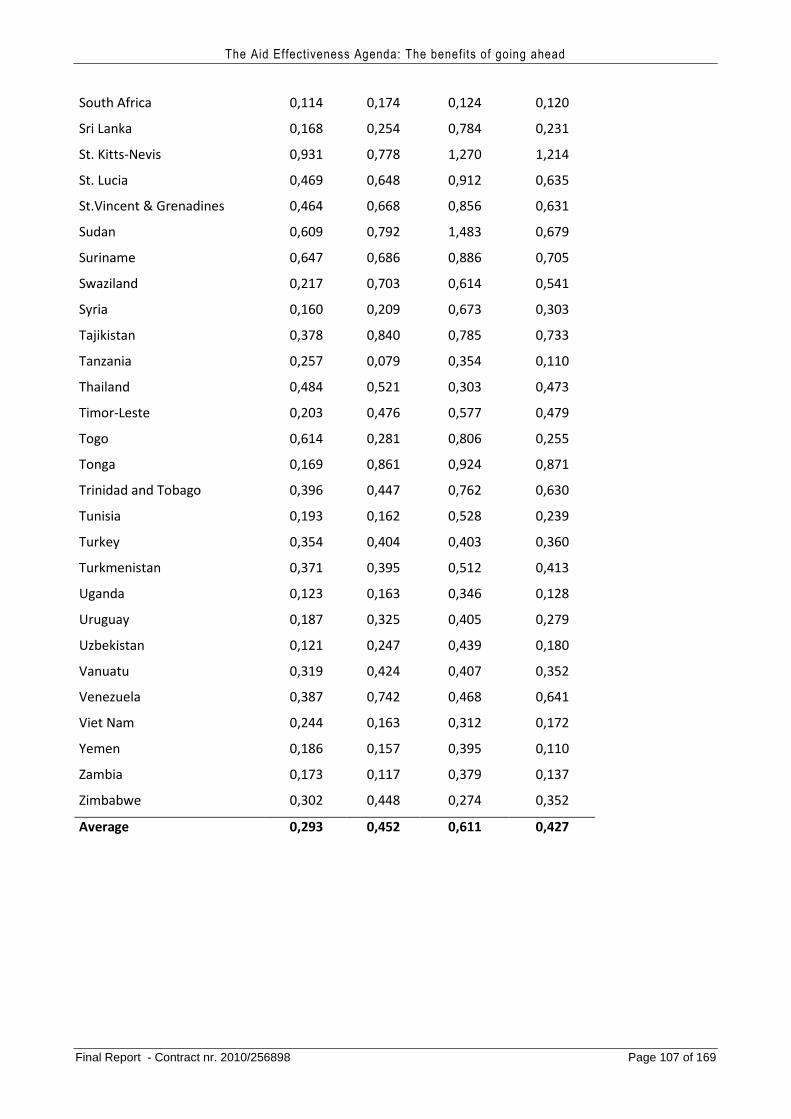
The Aid Effectiveness Agenda: The benefits of going ahead
Final Report - Contract nr. 2010/256898 Page 107 of 169
South Africa 0,114 0,174 0,124 0,120
Sri Lanka 0,168 0,254 0,784 0,231
St. Kitts-Nevis 0,931 0,778 1,270 1,214
St. Lucia 0,469 0,648 0,912 0,635
St.Vincent & Grenadines 0,464 0,668 0,856 0,631
Sudan 0,609 0,792 1,483 0,679
Suriname 0,647 0,686 0,886 0,705
Swaziland 0,217 0,703 0,614 0,541
Syria 0,160 0,209 0,673 0,303
Tajikistan 0,378 0,840 0,785 0,733
Tanzania 0,257 0,079 0,354 0,110
Thailand 0,484 0,521 0,303 0,473
Timor-Leste 0,203 0,476 0,577 0,479
Togo 0,614 0,281 0,806 0,255
Tonga 0,169 0,861 0,924 0,871
Trinidad and Tobago 0,396 0,447 0,762 0,630
Tunisia 0,193 0,162 0,528 0,239
Turkey 0,354 0,404 0,403 0,360
Turkmenistan 0,371 0,395 0,512 0,413
Uganda 0,123 0,163 0,346 0,128
Uruguay 0,187 0,325 0,405 0,279
Uzbekistan 0,121 0,247 0,439 0,180
Vanuatu 0,319 0,424 0,407 0,352
Venezuela 0,387 0,742 0,468 0,641
Viet Nam 0,244 0,163 0,312 0,172
Yemen 0,186 0,157 0,395 0,110
Zambia 0,173 0,117 0,379 0,137
Zimbabwe 0,302 0,448 0,274 0,352
Average 0,293 0,452 0,611 0,427
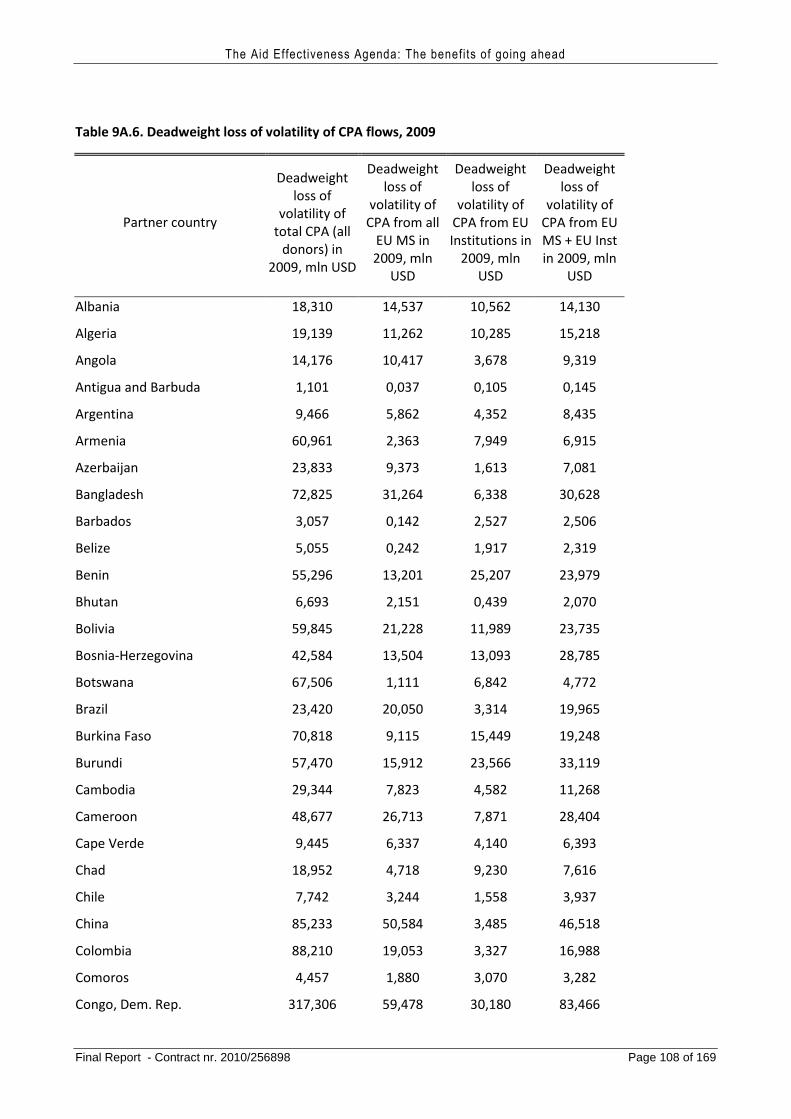
The Aid Effectiveness Agenda: The benefits of going ahead
Final Report - Contract nr. 2010/256898 Page 108 of 169
Table 9A.6. Deadweight loss of volatility of CPA flows, 2009
Partner country
Deadweight
loss of
volatility of
total CPA (all
donors) in
2009, mln USD
Deadweight
loss of
volatility of
CPA from all
EU MS in
2009, mln
USD
Deadweight
loss of
volatility of
CPA from EU
Institutions in
2009, mln
USD
Deadweight
loss of
volatility of
CPA from EU
MS + EU Inst
in 2009, mln
USD
Albania 18,310 14,537 10,562 14,130
Algeria 19,139 11,262 10,285 15,218
Angola 14,176 10,417 3,678 9,319
Antigua and Barbuda 1,101 0,037 0,105 0,145
Argentina 9,466 5,862 4,352 8,435
Armenia 60,961 2,363 7,949 6,915
Azerbaijan 23,833 9,373 1,613 7,081
Bangladesh 72,825 31,264 6,338 30,628
Barbados 3,057 0,142 2,527 2,506
Belize 5,055 0,242 1,917 2,319
Benin 55,296 13,201 25,207 23,979
Bhutan 6,693 2,151 0,439 2,070
Bolivia 59,845 21,228 11,989 23,735
Bosnia-Herzegovina 42,584 13,504 13,093 28,785
Botswana 67,506 1,111 6,842 4,772
Brazil 23,420 20,050 3,314 19,965
Burkina Faso 70,818 9,115 15,449 19,248
Burundi 57,470 15,912 23,566 33,119
Cambodia 29,344 7,823 4,582 11,268
Cameroon 48,677 26,713 7,871 28,404
Cape Verde 9,445 6,337 4,140 6,393
Chad 18,952 4,718 9,230 7,616
Chile 7,742 3,244 1,558 3,937
China 85,233 50,584 3,485 46,518
Colombia 88,210 19,053 3,327 16,988
Comoros 4,457 1,880 3,070 3,282
Congo, Dem. Rep. 317,306 59,478 30,180 83,466
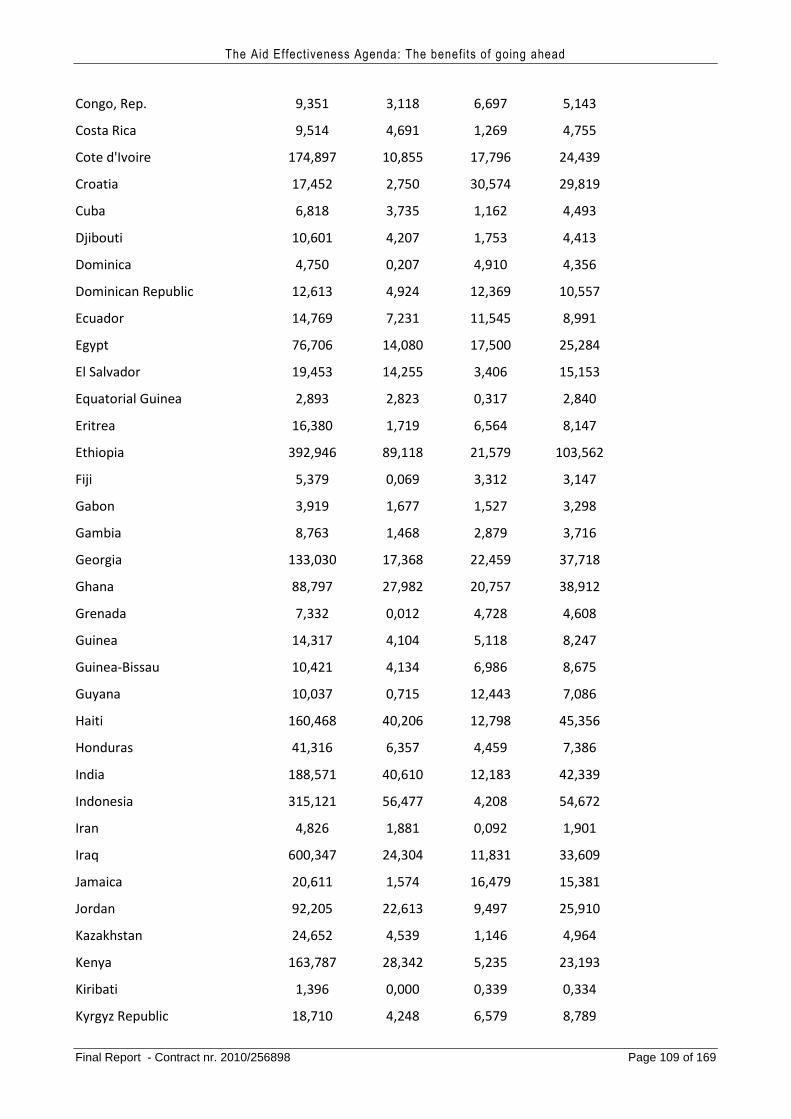
The Aid Effectiveness Agenda: The benefits of going ahead
Final Report - Contract nr. 2010/256898 Page 109 of 169
Congo, Rep. 9,351 3,118 6,697 5,143
Costa Rica 9,514 4,691 1,269 4,755
Cote d'Ivoire 174,897 10,855 17,796 24,439
Croatia 17,452 2,750 30,574 29,819
Cuba 6,818 3,735 1,162 4,493
Djibouti 10,601 4,207 1,753 4,413
Dominica 4,750 0,207 4,910 4,356
Dominican Republic 12,613 4,924 12,369 10,557
Ecuador 14,769 7,231 11,545 8,991
Egypt 76,706 14,080 17,500 25,284
El Salvador 19,453 14,255 3,406 15,153
Equatorial Guinea 2,893 2,823 0,317 2,840
Eritrea 16,380 1,719 6,564 8,147
Ethiopia 392,946 89,118 21,579 103,562
Fiji 5,379 0,069 3,312 3,147
Gabon 3,919 1,677 1,527 3,298
Gambia 8,763 1,468 2,879 3,716
Georgia 133,030 17,368 22,459 37,718
Ghana 88,797 27,982 20,757 38,912
Grenada 7,332 0,012 4,728 4,608
Guinea 14,317 4,104 5,118 8,247
Guinea-Bissau 10,421 4,134 6,986 8,675
Guyana 10,037 0,715 12,443 7,086
Haiti 160,468 40,206 12,798 45,356
Honduras 41,316 6,357 4,459 7,386
India 188,571 40,610 12,183 42,339
Indonesia 315,121 56,477 4,208 54,672
Iran 4,826 1,881 0,092 1,901
Iraq 600,347 24,304 11,831 33,609
Jamaica 20,611 1,574 16,479 15,381
Jordan 92,205 22,613 9,497 25,910
Kazakhstan 24,652 4,539 1,146 4,964
Kenya 163,787 28,342 5,235 23,193
Kiribati 1,396 0,000 0,339 0,334
Kyrgyz Republic 18,710 4,248 6,579 8,789
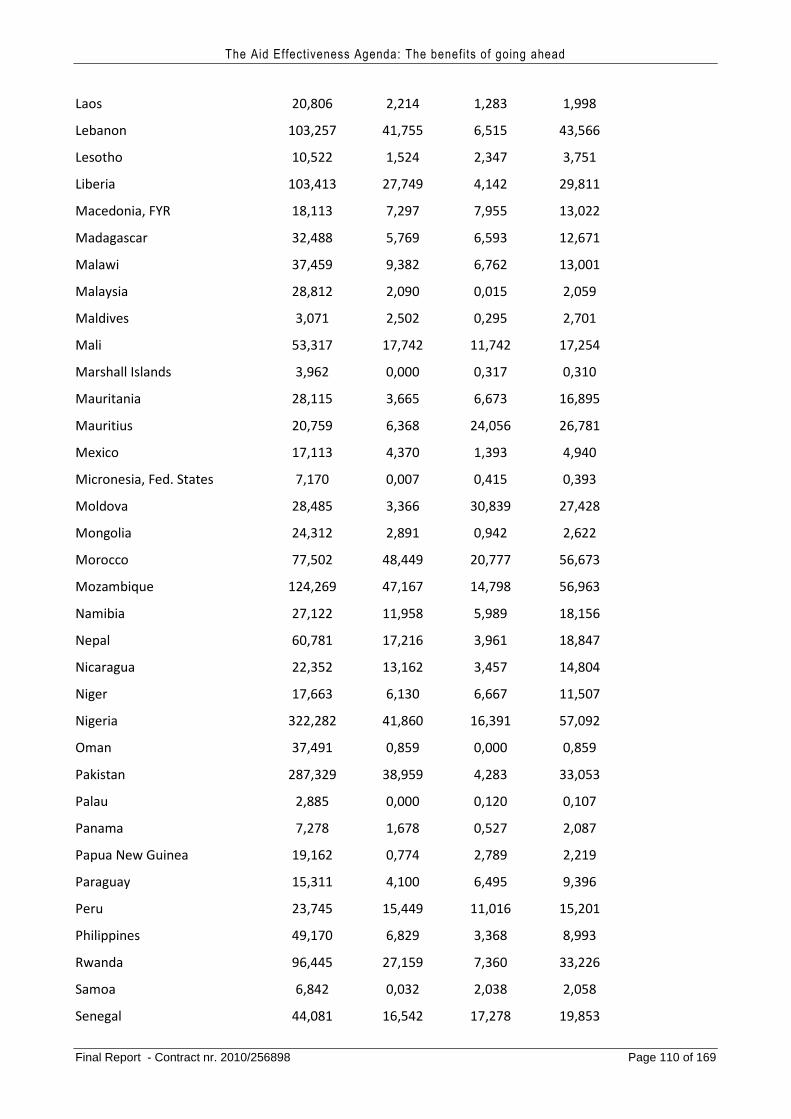
The Aid Effectiveness Agenda: The benefits of going ahead
Final Report - Contract nr. 2010/256898 Page 110 of 169
Laos 20,806 2,214 1,283 1,998
Lebanon 103,257 41,755 6,515 43,566
Lesotho 10,522 1,524 2,347 3,751
Liberia 103,413 27,749 4,142 29,811
Macedonia, FYR 18,113 7,297 7,955 13,022
Madagascar 32,488 5,769 6,593 12,671
Malawi 37,459 9,382 6,762 13,001
Malaysia 28,812 2,090 0,015 2,059
Maldives 3,071 2,502 0,295 2,701
Mali 53,317 17,742 11,742 17,254
Marshall Islands 3,962 0,000 0,317 0,310
Mauritania 28,115 3,665 6,673 16,895
Mauritius 20,759 6,368 24,056 26,781
Mexico 17,113 4,370 1,393 4,940
Micronesia, Fed. States 7,170 0,007 0,415 0,393
Moldova 28,485 3,366 30,839 27,428
Mongolia 24,312 2,891 0,942 2,622
Morocco 77,502 48,449 20,777 56,673
Mozambique 124,269 47,167 14,798 56,963
Namibia 27,122 11,958 5,989 18,156
Nepal 60,781 17,216 3,961 18,847
Nicaragua 22,352 13,162 3,457 14,804
Niger 17,663 6,130 6,667 11,507
Nigeria 322,282 41,860 16,391 57,092
Oman 37,491 0,859 0,000 0,859
Pakistan 287,329 38,959 4,283 33,053
Palau 2,885 0,000 0,120 0,107
Panama 7,278 1,678 0,527 2,087
Papua New Guinea 19,162 0,774 2,789 2,219
Paraguay 15,311 4,100 6,495 9,396
Peru 23,745 15,449 11,016 15,201
Philippines 49,170 6,829 3,368 8,993
Rwanda 96,445 27,159 7,360 33,226
Samoa 6,842 0,032 2,038 2,058
Senegal 44,081 16,542 17,278 19,853
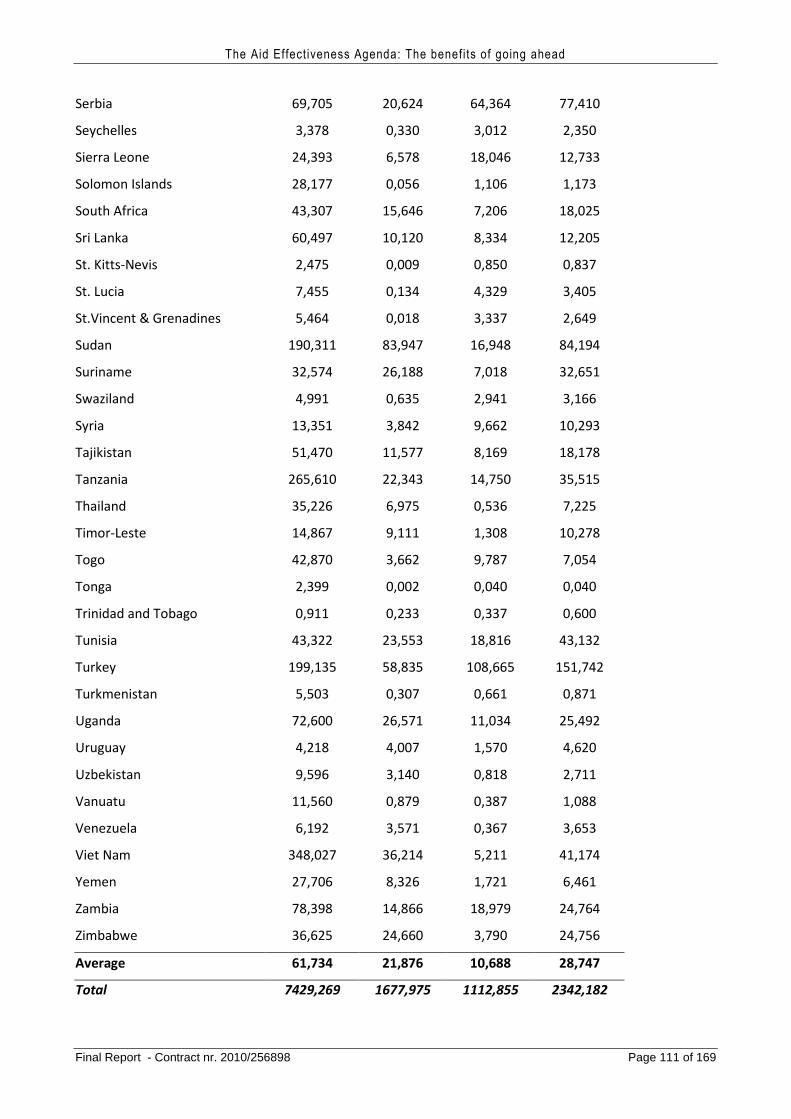
The Aid Effectiveness Agenda: The benefits of going ahead
Final Report - Contract nr. 2010/256898 Page 111 of 169
Serbia 69,705 20,624 64,364 77,410
Seychelles 3,378 0,330 3,012 2,350
Sierra Leone 24,393 6,578 18,046 12,733
Solomon Islands 28,177 0,056 1,106 1,173
South Africa 43,307 15,646 7,206 18,025
Sri Lanka 60,497 10,120 8,334 12,205
St. Kitts-Nevis 2,475 0,009 0,850 0,837
St. Lucia 7,455 0,134 4,329 3,405
St.Vincent & Grenadines 5,464 0,018 3,337 2,649
Sudan 190,311 83,947 16,948 84,194
Suriname 32,574 26,188 7,018 32,651
Swaziland 4,991 0,635 2,941 3,166
Syria 13,351 3,842 9,662 10,293
Tajikistan 51,470 11,577 8,169 18,178
Tanzania 265,610 22,343 14,750 35,515
Thailand 35,226 6,975 0,536 7,225
Timor-Leste 14,867 9,111 1,308 10,278
Togo 42,870 3,662 9,787 7,054
Tonga 2,399 0,002 0,040 0,040
Trinidad and Tobago 0,911 0,233 0,337 0,600
Tunisia 43,322 23,553 18,816 43,132
Turkey 199,135 58,835 108,665 151,742
Turkmenistan 5,503 0,307 0,661 0,871
Uganda 72,600 26,571 11,034 25,492
Uruguay 4,218 4,007 1,570 4,620
Uzbekistan 9,596 3,140 0,818 2,711
Vanuatu 11,560 0,879 0,387 1,088
Venezuela 6,192 3,571 0,367 3,653
Viet Nam 348,027 36,214 5,211 41,174
Yemen 27,706 8,326 1,721 6,461
Zambia 78,398 14,866 18,979 24,764
Zimbabwe 36,625 24,660 3,790 24,756
Average 61,734 21,876 10,688 28,747
Total 7429,269 1677,975 1112,855 2342,182
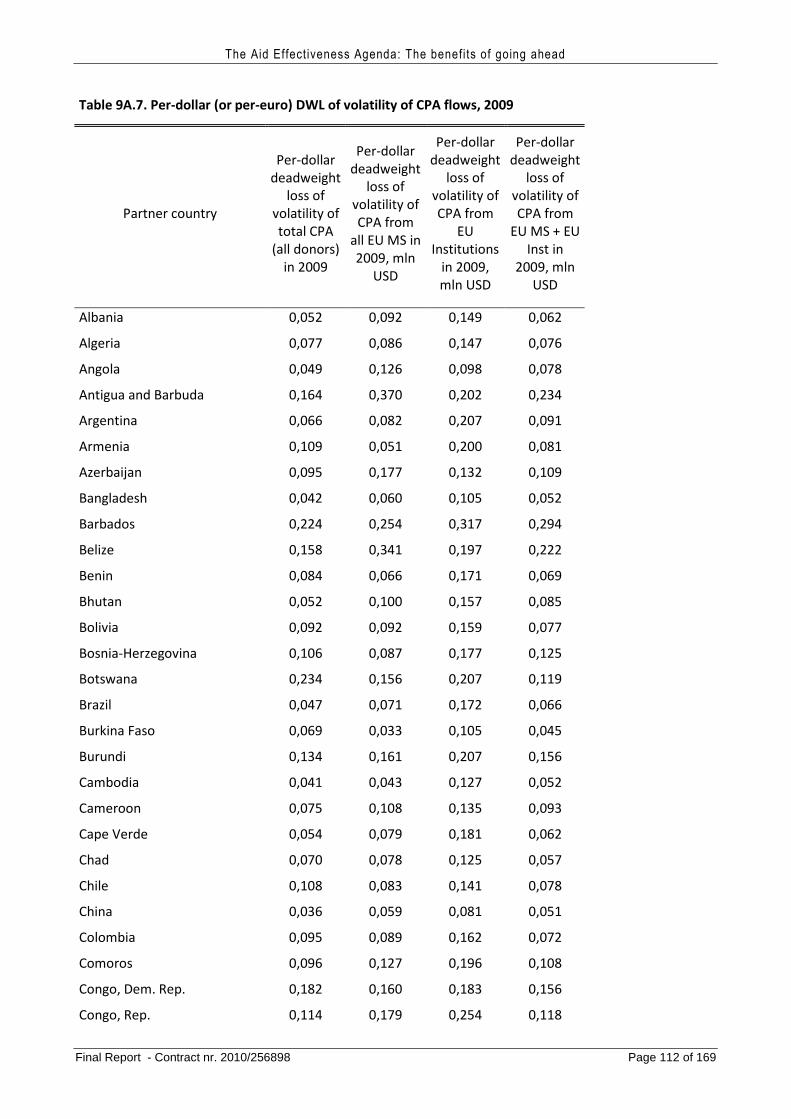
The Aid Effectiveness Agenda: The benefits of going ahead
Final Report - Contract nr. 2010/256898 Page 112 of 169
Table 9A.7. Per-dollar (or per-euro) DWL of volatility of CPA flows, 2009
Partner country
Per-dollar
deadweight
loss of
volatility of
total CPA
(all donors)
in 2009
Per-dollar
deadweight
loss of
volatility of
CPA from
all EU MS in
2009, mln
USD
Per-dollar
deadweight
loss of
volatility of
CPA from
EU
Institutions
in 2009,
mln USD
Per-dollar
deadweight
loss of
volatility of
CPA from
EU MS + EU
Inst in
2009, mln
USD
Albania 0,052 0,092 0,149 0,062
Algeria 0,077 0,086 0,147 0,076
Angola 0,049 0,126 0,098 0,078
Antigua and Barbuda 0,164 0,370 0,202 0,234
Argentina 0,066 0,082 0,207 0,091
Armenia 0,109 0,051 0,200 0,081
Azerbaijan 0,095 0,177 0,132 0,109
Bangladesh 0,042 0,060 0,105 0,052
Barbados 0,224 0,254 0,317 0,294
Belize 0,158 0,341 0,197 0,222
Benin 0,084 0,066 0,171 0,069
Bhutan 0,052 0,100 0,157 0,085
Bolivia 0,092 0,092 0,159 0,077
Bosnia-Herzegovina 0,106 0,087 0,177 0,125
Botswana 0,234 0,156 0,207 0,119
Brazil 0,047 0,071 0,172 0,066
Burkina Faso 0,069 0,033 0,105 0,045
Burundi 0,134 0,161 0,207 0,156
Cambodia 0,041 0,043 0,127 0,052
Cameroon 0,075 0,108 0,135 0,093
Cape Verde 0,054 0,079 0,181 0,062
Chad 0,070 0,078 0,125 0,057
Chile 0,108 0,083 0,141 0,078
China 0,036 0,059 0,081 0,051
Colombia 0,095 0,089 0,162 0,072
Comoros 0,096 0,127 0,196 0,108
Congo, Dem. Rep. 0,182 0,160 0,183 0,156
Congo, Rep. 0,114 0,179 0,254 0,118
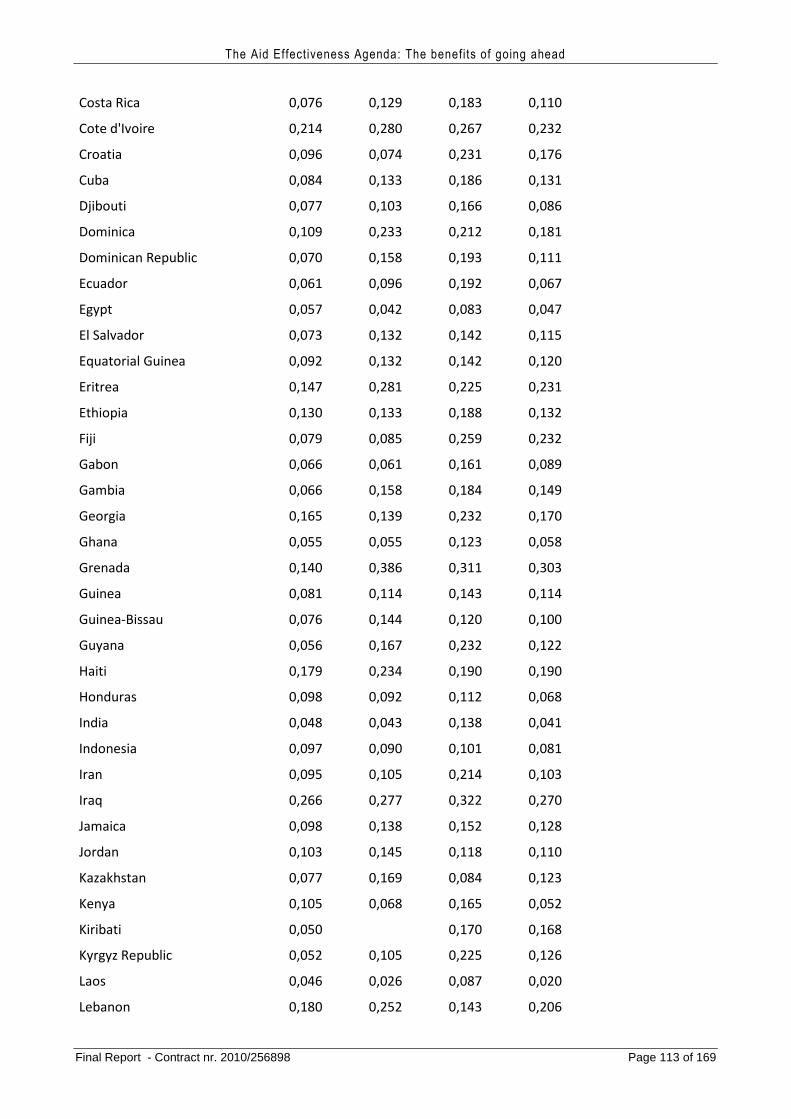
The Aid Effectiveness Agenda: The benefits of going ahead
Final Report - Contract nr. 2010/256898 Page 113 of 169
Costa Rica 0,076 0,129 0,183 0,110
Cote d'Ivoire 0,214 0,280 0,267 0,232
Croatia 0,096 0,074 0,231 0,176
Cuba 0,084 0,133 0,186 0,131
Djibouti 0,077 0,103 0,166 0,086
Dominica 0,109 0,233 0,212 0,181
Dominican Republic 0,070 0,158 0,193 0,111
Ecuador 0,061 0,096 0,192 0,067
Egypt 0,057 0,042 0,083 0,047
El Salvador 0,073 0,132 0,142 0,115
Equatorial Guinea 0,092 0,132 0,142 0,120
Eritrea 0,147 0,281 0,225 0,231
Ethiopia 0,130 0,133 0,188 0,132
Fiji 0,079 0,085 0,259 0,232
Gabon 0,066 0,061 0,161 0,089
Gambia 0,066 0,158 0,184 0,149
Georgia 0,165 0,139 0,232 0,170
Ghana 0,055 0,055 0,123 0,058
Grenada 0,140 0,386 0,311 0,303
Guinea 0,081 0,114 0,143 0,114
Guinea-Bissau 0,076 0,144 0,120 0,100
Guyana 0,056 0,167 0,232 0,122
Haiti 0,179 0,234 0,190 0,190
Honduras 0,098 0,092 0,112 0,068
India 0,048 0,043 0,138 0,041
Indonesia 0,097 0,090 0,101 0,081
Iran 0,095 0,105 0,214 0,103
Iraq 0,266 0,277 0,322 0,270
Jamaica 0,098 0,138 0,152 0,128
Jordan 0,103 0,145 0,118 0,110
Kazakhstan 0,077 0,169 0,084 0,123
Kenya 0,105 0,068 0,165 0,052
Kiribati 0,050 0,170 0,168
Kyrgyz Republic 0,052 0,105 0,225 0,126
Laos 0,046 0,026 0,087 0,020
Lebanon 0,180 0,252 0,143 0,206
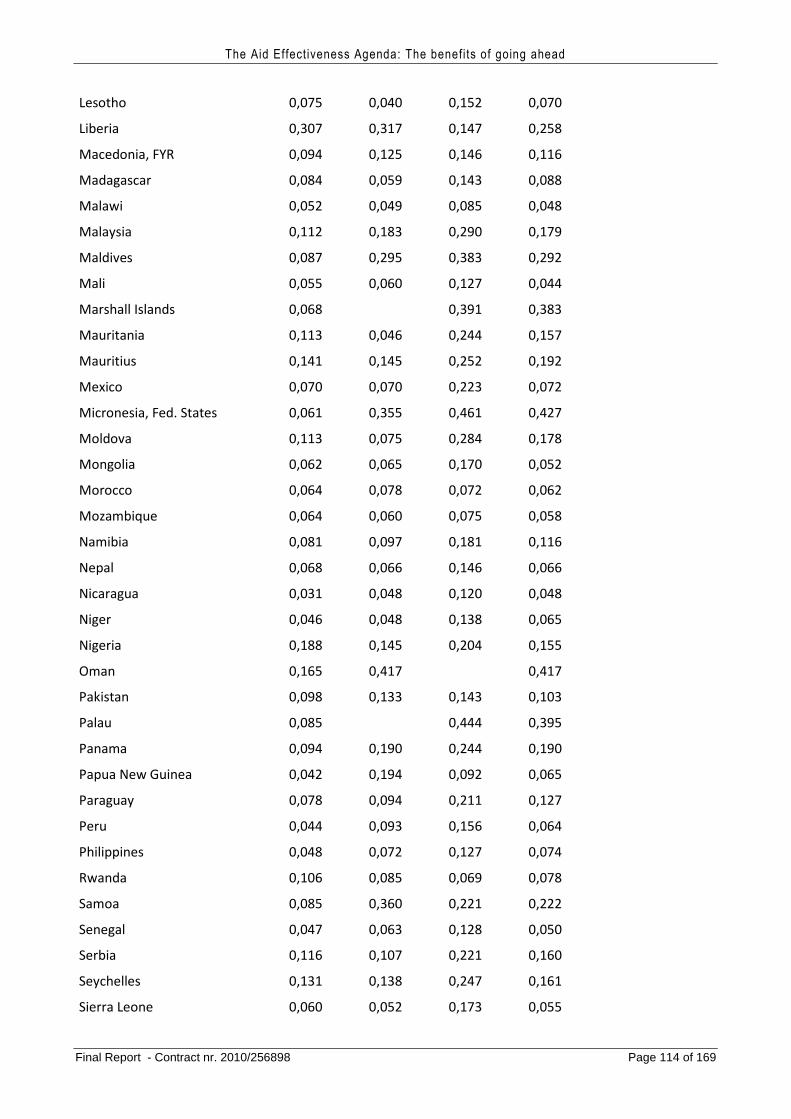
The Aid Effectiveness Agenda: The benefits of going ahead
Final Report - Contract nr. 2010/256898 Page 114 of 169
Lesotho 0,075 0,040 0,152 0,070
Liberia 0,307 0,317 0,147 0,258
Macedonia, FYR 0,094 0,125 0,146 0,116
Madagascar 0,084 0,059 0,143 0,088
Malawi 0,052 0,049 0,085 0,048
Malaysia 0,112 0,183 0,290 0,179
Maldives 0,087 0,295 0,383 0,292
Mali 0,055 0,060 0,127 0,044
Marshall Islands 0,068 0,391 0,383
Mauritania 0,113 0,046 0,244 0,157
Mauritius 0,141 0,145 0,252 0,192
Mexico 0,070 0,070 0,223 0,072
Micronesia, Fed. States 0,061 0,355 0,461 0,427
Moldova 0,113 0,075 0,284 0,178
Mongolia 0,062 0,065 0,170 0,052
Morocco 0,064 0,078 0,072 0,062
Mozambique 0,064 0,060 0,075 0,058
Namibia 0,081 0,097 0,181 0,116
Nepal 0,068 0,066 0,146 0,066
Nicaragua 0,031 0,048 0,120 0,048
Niger 0,046 0,048 0,138 0,065
Nigeria 0,188 0,145 0,204 0,155
Oman 0,165 0,417 0,417
Pakistan 0,098 0,133 0,143 0,103
Palau 0,085 0,444 0,395
Panama 0,094 0,190 0,244 0,190
Papua New Guinea 0,042 0,194 0,092 0,065
Paraguay 0,078 0,094 0,211 0,127
Peru 0,044 0,093 0,156 0,064
Philippines 0,048 0,072 0,127 0,074
Rwanda 0,106 0,085 0,069 0,078
Samoa 0,085 0,360 0,221 0,222
Senegal 0,047 0,063 0,128 0,050
Serbia 0,116 0,107 0,221 0,160
Seychelles 0,131 0,138 0,247 0,161
Sierra Leone 0,060 0,052 0,173 0,055
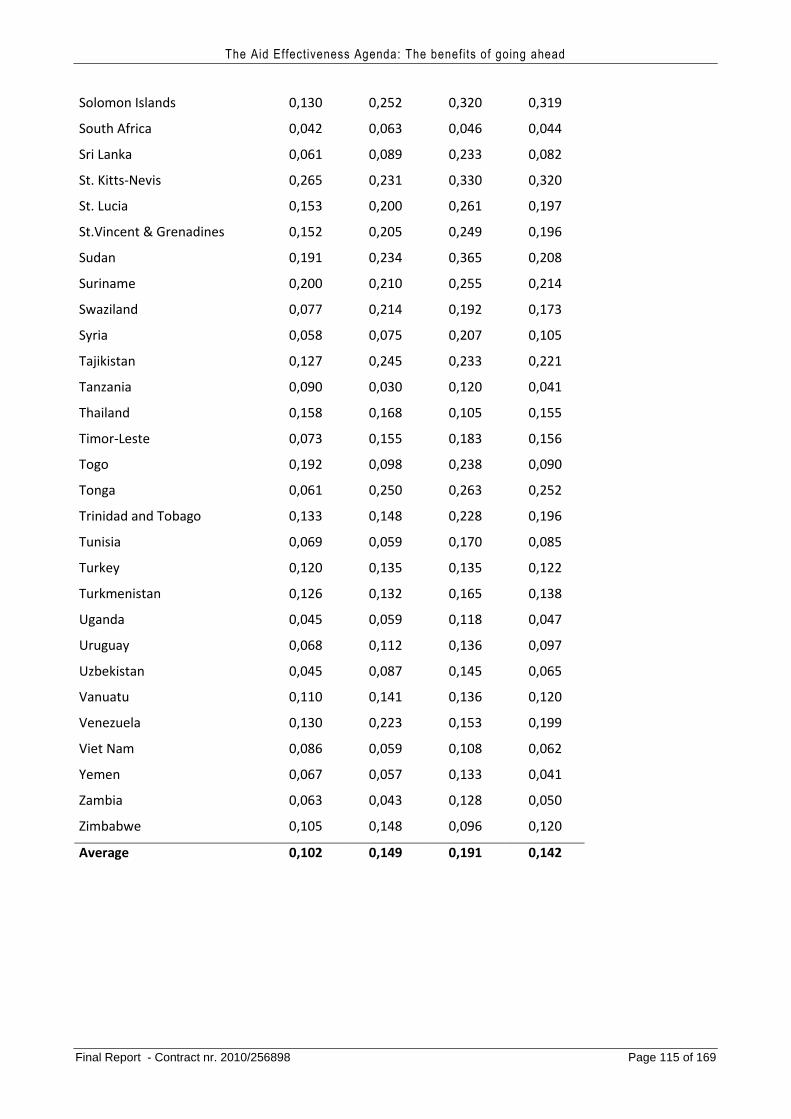
The Aid Effectiveness Agenda: The benefits of going ahead
Final Report - Contract nr. 2010/256898 Page 115 of 169
Solomon Islands 0,130 0,252 0,320 0,319
South Africa 0,042 0,063 0,046 0,044
Sri Lanka 0,061 0,089 0,233 0,082
St. Kitts-Nevis 0,265 0,231 0,330 0,320
St. Lucia 0,153 0,200 0,261 0,197
St.Vincent & Grenadines 0,152 0,205 0,249 0,196
Sudan 0,191 0,234 0,365 0,208
Suriname 0,200 0,210 0,255 0,214
Swaziland 0,077 0,214 0,192 0,173
Syria 0,058 0,075 0,207 0,105
Tajikistan 0,127 0,245 0,233 0,221
Tanzania 0,090 0,030 0,120 0,041
Thailand 0,158 0,168 0,105 0,155
Timor-Leste 0,073 0,155 0,183 0,156
Togo 0,192 0,098 0,238 0,090
Tonga 0,061 0,250 0,263 0,252
Trinidad and Tobago 0,133 0,148 0,228 0,196
Tunisia 0,069 0,059 0,170 0,085
Turkey 0,120 0,135 0,135 0,122
Turkmenistan 0,126 0,132 0,165 0,138
Uganda 0,045 0,059 0,118 0,047
Uruguay 0,068 0,112 0,136 0,097
Uzbekistan 0,045 0,087 0,145 0,065
Vanuatu 0,110 0,141 0,136 0,120
Venezuela 0,130 0,223 0,153 0,199
Viet Nam 0,086 0,059 0,108 0,062
Yemen 0,067 0,057 0,133 0,041
Zambia 0,063 0,043 0,128 0,050
Zimbabwe 0,105 0,148 0,096 0,120
Average 0,102 0,149 0,191 0,142
The Aid Effectiveness Agenda: The benefits of going ahead
Final Report - Contract nr. 2010/256898 Page 116 of 169
10. Effects of the Paris agenda measures on the growth of recipients
For our attempt to estimate the indirect impact of the Paris agenda we take our starting point from the aid-growth literature. We could in principle have attempted to do a two-stage estimation, where we first estimate the effects on governance and then insert the estimated governance effects in a standard aid and growth equation. However, we chose to do a reduced form estimation, where we add the effects of aid modalities directly into the growth equation to be estimated.
For some of our variables we use DAC estimates of country programmable aid (CPA), which is what is relevant from the point of view of the Paris agenda. CPA data are available for the period 2000-2009 only. This limitation restricts the effectiveness of econometric estimation, but we would argue that it is appropriate to focus on the period since the turn of the millennium, since this is a period with more stability and better development (at least in Africa) than the earlier decades, which saw SAPs being implemented with moderate success, falling terms of trade etc. There may thus have been a break in the relationship between aid and development in the late 1990s, so to focus on the recent period seems relevant for us.
Apart from having a direct cost saving effect, the PA measures are expected to have positive effects on institutions and growth. We try to estimate these effects using cross-country growth regressions. As noted in our review the aid-growth literature is much about endogeneity and instruments (see e.g. Bazzi and Clemens, 2009, and Roodman, 2008). However, to our knowledge there are no valid and strong instruments for the PA indicators such as tied aid status, fragmentation etc, and we are therefore not implementing any instrumentation strategy. This means that our results have to be interpreted with caution, and one has to think about in what direction the bias might be.
Further, many of the effects of aid on growth will probably not show up until after many years. Arndt et al. (2010) discuss this issue and point out that changes in education move only slowly the aggregate level of education, which influences growth. Improved health may take even longer to translate into growth. Ashraf et al. (2008) and Acemoglu and Johnson (2007) find that increases in life expectancy begin to have a positive effect on incomes after about a 35 year lag. It probably also takes time for decreased aid fragmentation to translate into better institutions, and for these improved institutions to translate into higher growth. To the extent that some effects come only many years after the intervention our estimates using annual data would tend to underestimate the overall growth effect.
10.1. Estimation strategy and variables
We will do a pooled OLS regression as follows:
(10.1) Growth=f(standard variables including aid and aid squared, plus PD dimensions that we want to consider such as aid as budget support etc.)
Variables
The dependent variable is annual growth of per capita income.
The central independent variables are three different measures of PD indicators:
The Aid Effectiveness Agenda: The benefits of going ahead
Final Report - Contract nr. 2010/256898 Page 117 of 169
- Aid fragmentation (CPA/GDP per number of donors giving CPA, constructed from CPA data from OECD/DAC, the DAC database)
- General budget support per GDP (GBS/GDP from OECD/DAC, the CRS database) - Tied aid per GDP (tied aid/GDP, commitments, from OECD/DAC the CRS database)
We follow the mainstream growth literature and control for
- initial education level (gross enrolment in secondary school from WDI) - initial investment level (physical capital formation in percent of GDP from WDI) - initial log GDP per capita (log GDP per capita, PPP, from WDI). - initial log population (WDI).
We also control for
- lagged aid (ODA/GDP from OECD/DAC) - aid squared - time dummies.
For initial income levels we use PPP adjusted numbers as is standard in the literature. To construct the share variables used in the regressions we use current USD prices.
10.2. Empirical estimates of the growth equation
We run a pooled OLS. The explanatory variables are lagged in different ways. Four different estimations are tested. In the first the explanatory variables are simply lagged one year. This means that e.g. tying status of aid 2005 is supposed to have an effect on growth between 2005 and 2006. In the second estimation the explanatory variable is the average of the one year lagged and the two year lagged variables. This means that e.g. the average tying status of aid 2004 and 2005 is supposed to have an effect on growth between 2005 and 2006. And so on up to the fourth estimation, where the explanatory variables are the average of the last four years. This approach used to try to take into account, at least to some extent, that there may be considerable time lags in the effects of applying the PD indicators.
The results of the regressions are reported in Table 10.1. The estimated coefficients are then used to compute the effects of PA reforms. We note that we only get statistically significant results with regard to the GBS/GDP, while the other two PA-variables are statistically insignificant.
The results are not opposite to our expectations or what earlier empirical studies have found, i.e. none of our coefficients are statistically significant “wrong”. The control variables for the initial situation are generally as one would expect and statistically significant. The parameter estimation of aid is statistically insignificant. This is probably due to the multicolinearity with the PA variables. To get the estimated effect of e.g. more GBS one has to add the parameter of GBS to the parameter of aid. One then sees that there are reasonable values within the confidence interval. The same can be said about the estimated effect of less tied aid, and of the estimated effect of more of aid that is neither GBS, nor tied.
The parameter for aid squared is not statistically significant. We expected this to be statistically significant and negative. The insignificance in our regressions could be due to a quite small sample size in time, 10 years, but it still means that our regressions are imprecise, even though there are reasonable values within the confidence intervals. Still, we fail to get statistical significance in several cases, which means that one need to be aware of the fact that our estimates are imprecise.
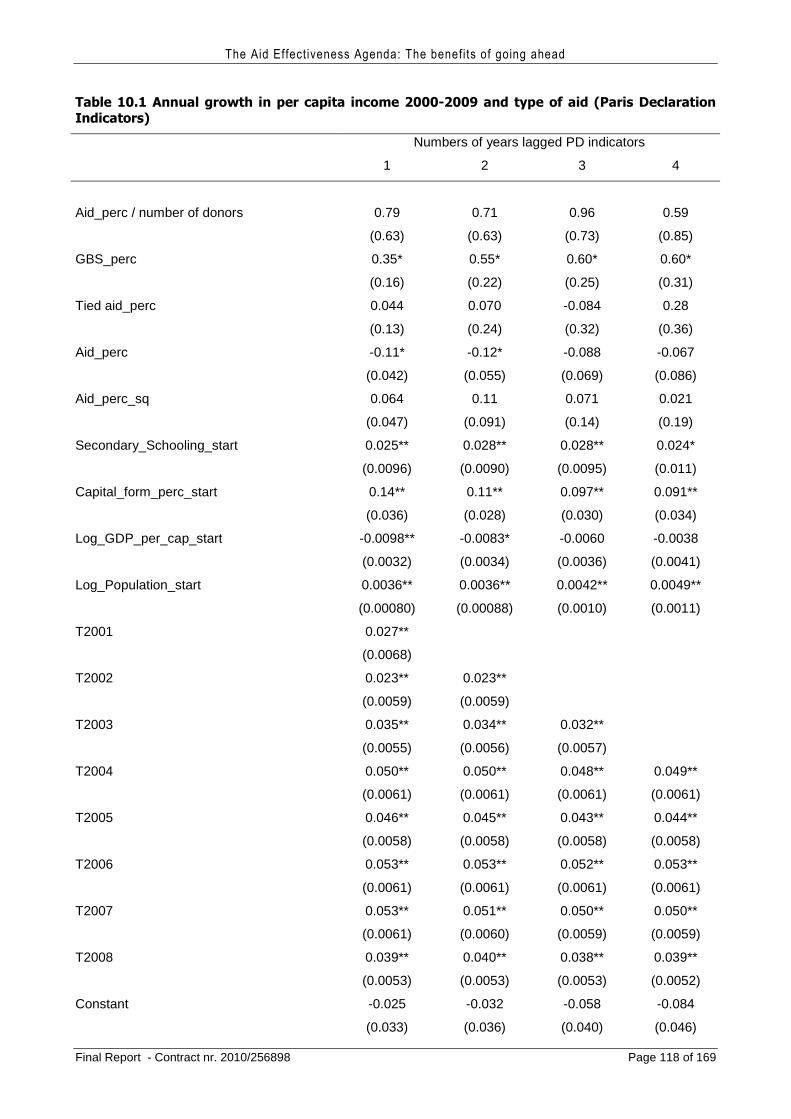
The Aid Effectiveness Agenda: The benefits of going ahead
Final Report - Contract nr. 2010/256898 Page 118 of 169
Table 10.1 Annual growth in per capita income 2000-2009 and type of aid (Paris Declaration Indicators)
Numbers of years lagged PD indicators
1 2 3 4
Aid_perc / number of donors 0.79 0.71 0.96 0.59
(0.63) (0.63) (0.73) (0.85)
GBS_perc 0.35* 0.55* 0.60* 0.60*
(0.16) (0.22) (0.25) (0.31)
Tied aid_perc 0.044 0.070 -0.084 0.28
(0.13) (0.24) (0.32) (0.36)
Aid_perc -0.11* -0.12* -0.088 -0.067
(0.042) (0.055) (0.069) (0.086)
Aid_perc_sq 0.064 0.11 0.071 0.021
(0.047) (0.091) (0.14) (0.19)
Secondary_Schooling_start 0.025** 0.028** 0.028** 0.024*
(0.0096) (0.0090) (0.0095) (0.011)
Capital_form_perc_start 0.14** 0.11** 0.097** 0.091**
(0.036) (0.028) (0.030) (0.034)
Log_GDP_per_cap_start -0.0098** -0.0083* -0.0060 -0.0038
(0.0032) (0.0034) (0.0036) (0.0041)
Log_Population_start 0.0036** 0.0036** 0.0042** 0.0049**
(0.00080) (0.00088) (0.0010) (0.0011)
T2001 0.027**
(0.0068)
T2002 0.023** 0.023**
(0.0059) (0.0059)
T2003 0.035** 0.034** 0.032**
(0.0055) (0.0056) (0.0057)
T2004 0.050** 0.050** 0.048** 0.049**
(0.0061) (0.0061) (0.0061) (0.0061)
T2005 0.046** 0.045** 0.043** 0.044**
(0.0058) (0.0058) (0.0058) (0.0058)
T2006 0.053** 0.053** 0.052** 0.053**
(0.0061) (0.0061) (0.0061) (0.0061)
T2007 0.053** 0.051** 0.050** 0.050**
(0.0061) (0.0060) (0.0059) (0.0059)
T2008 0.039** 0.040** 0.038** 0.039**
(0.0053) (0.0053) (0.0053) (0.0052)
Constant -0.025 -0.032 -0.058 -0.084
(0.033) (0.036) (0.040) (0.046)
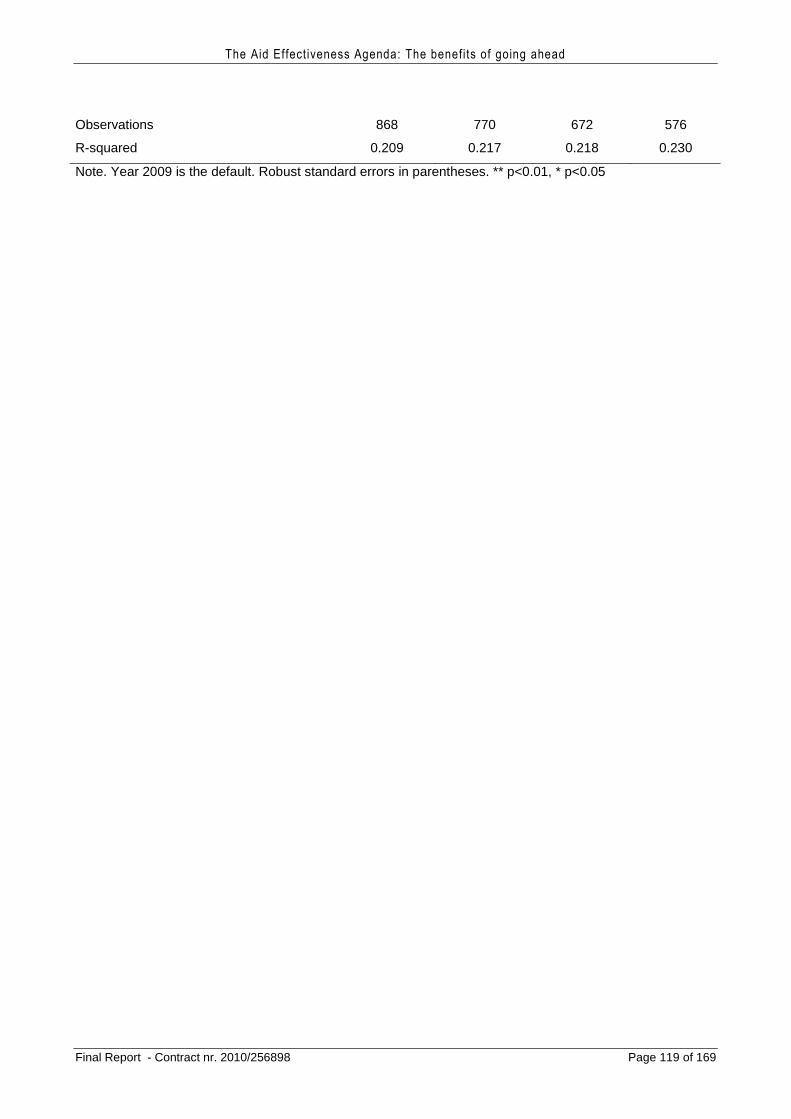
The Aid Effectiveness Agenda: The benefits of going ahead
Final Report - Contract nr. 2010/256898 Page 119 of 169
Observations 868 770 672 576
R-squared 0.209 0.217 0.218 0.230
Note. Year 2009 is the default. Robust standard errors in parentheses. ** p<0.01, * p<0.05
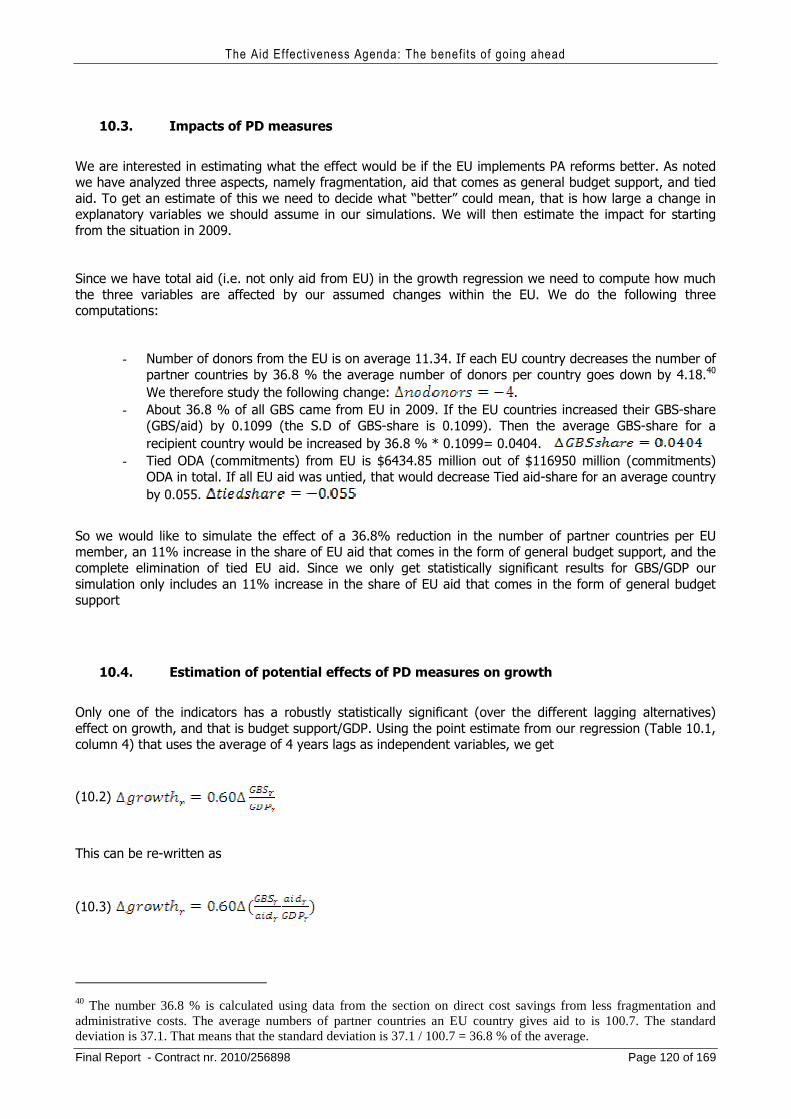
The Aid Effectiveness Agenda: The benefits of going ahead
Final Report - Contract nr. 2010/256898 Page 120 of 169
10.3. Impacts of PD measures
We are interested in estimating what the effect would be if the EU implements PA reforms better. As noted we have analyzed three aspects, namely fragmentation, aid that comes as general budget support, and tied aid. To get an estimate of this we need to decide what “better” could mean, that is how large a change in explanatory variables we should assume in our simulations. We will then estimate the impact for starting from the situation in 2009.
Since we have total aid (i.e. not only aid from EU) in the growth regression we need to compute how much the three variables are affected by our assumed changes within the EU. We do the following three computations:
- Number of donors from the EU is on average 11.34. If each EU country decreases the number of partner countries by 36.8 % the average number of donors per country goes down by 4.18.40 We therefore study the following change: .
- About 36.8 % of all GBS came from EU in 2009. If the EU countries increased their GBS-share (GBS/aid) by 0.1099 (the S.D of GBS-share is 0.1099). Then the average GBS-share for a recipient country would be increased by 36.8 % * 0.1099= 0.0404.
- Tied ODA (commitments) from EU is $6434.85 million out of $116950 million (commitments) ODA in total. If all EU aid was untied, that would decrease Tied aid-share for an average country by 0.055.
So we would like to simulate the effect of a 36.8% reduction in the number of partner countries per EU member, an 11% increase in the share of EU aid that comes in the form of general budget support, and the complete elimination of tied EU aid. Since we only get statistically significant results for GBS/GDP our simulation only includes an 11% increase in the share of EU aid that comes in the form of general budget support
10.4. Estimation of potential effects of PD measures on growth
Only one of the indicators has a robustly statistically significant (over the different lagging alternatives) effect on growth, and that is budget support/GDP. Using the point estimate from our regression (Table 10.1, column 4) that uses the average of 4 years lags as independent variables, we get
(10.2)
This can be re-written as
(10.3)
40 The number 36.8 % is calculated using data from the section on direct cost savings from less fragmentation and administrative costs. The average numbers of partner countries an EU country gives aid to is 100.7. The standard deviation is 37.1. That means that the standard deviation is 37.1 / 100.7 = 36.8 % of the average.
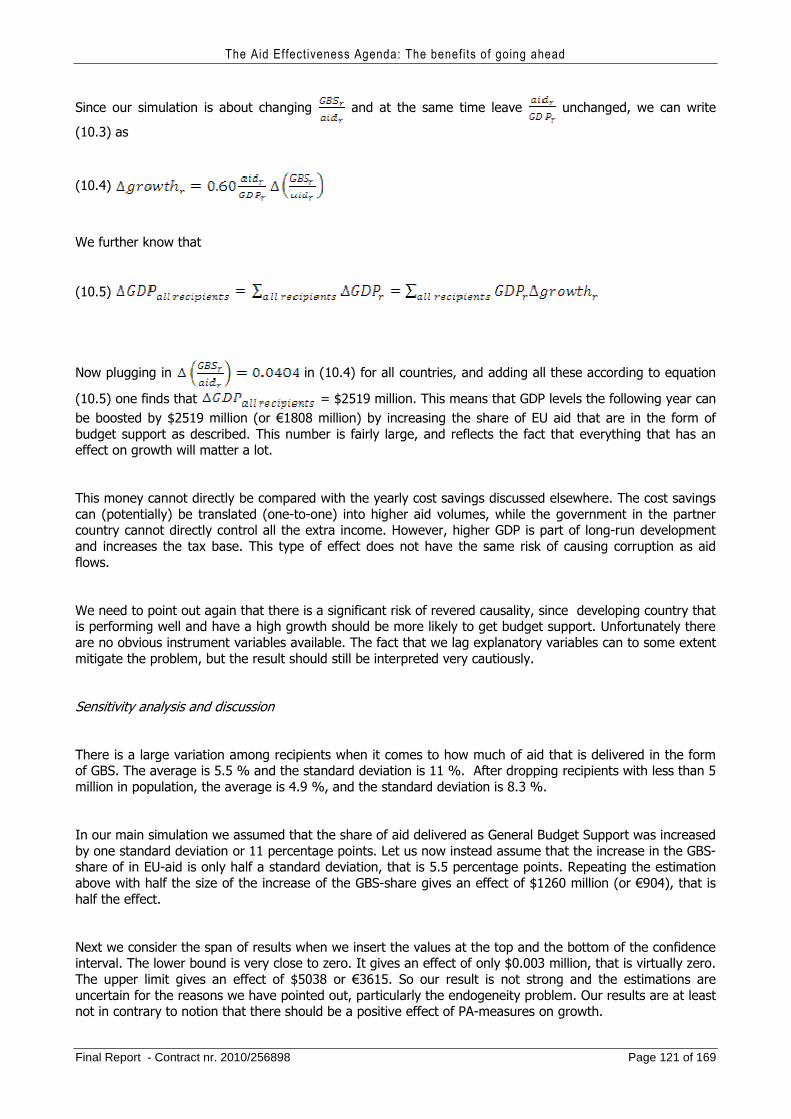
The Aid Effectiveness Agenda: The benefits of going ahead
Final Report - Contract nr. 2010/256898 Page 121 of 169
Since our simulation is about changing and at the same time leave unchanged, we can write
(10.3) as
(10.4)
We further know that
(10.5)
Now plugging in in (10.4) for all countries, and adding all these according to equation
(10.5) one finds that = $2519 million. This means that GDP levels the following year can be boosted by $2519 million (or €1808 million) by increasing the share of EU aid that are in the form of budget support as described. This number is fairly large, and reflects the fact that everything that has an effect on growth will matter a lot.
This money cannot directly be compared with the yearly cost savings discussed elsewhere. The cost savings can (potentially) be translated (one-to-one) into higher aid volumes, while the government in the partner country cannot directly control all the extra income. However, higher GDP is part of long-run development and increases the tax base. This type of effect does not have the same risk of causing corruption as aid flows.
We need to point out again that there is a significant risk of revered causality, since developing country that is performing well and have a high growth should be more likely to get budget support. Unfortunately there are no obvious instrument variables available. The fact that we lag explanatory variables can to some extent mitigate the problem, but the result should still be interpreted very cautiously.
Sensitivity analysis and discussion
There is a large variation among recipients when it comes to how much of aid that is delivered in the form of GBS. The average is 5.5 % and the standard deviation is 11 %. After dropping recipients with less than 5 million in population, the average is 4.9 %, and the standard deviation is 8.3 %.
In our main simulation we assumed that the share of aid delivered as General Budget Support was increased by one standard deviation or 11 percentage points. Let us now instead assume that the increase in the GBS-share of in EU-aid is only half a standard deviation, that is 5.5 percentage points. Repeating the estimation above with half the size of the increase of the GBS-share gives an effect of $1260 million (or €904), that is half the effect.
Next we consider the span of results when we insert the values at the top and the bottom of the confidence interval. The lower bound is very close to zero. It gives an effect of only $0.003 million, that is virtually zero. The upper limit gives an effect of $5038 or €3615. So our result is not strong and the estimations are uncertain for the reasons we have pointed out, particularly the endogeneity problem. Our results are at least not in contrary to notion that there should be a positive effect of PA-measures on growth.
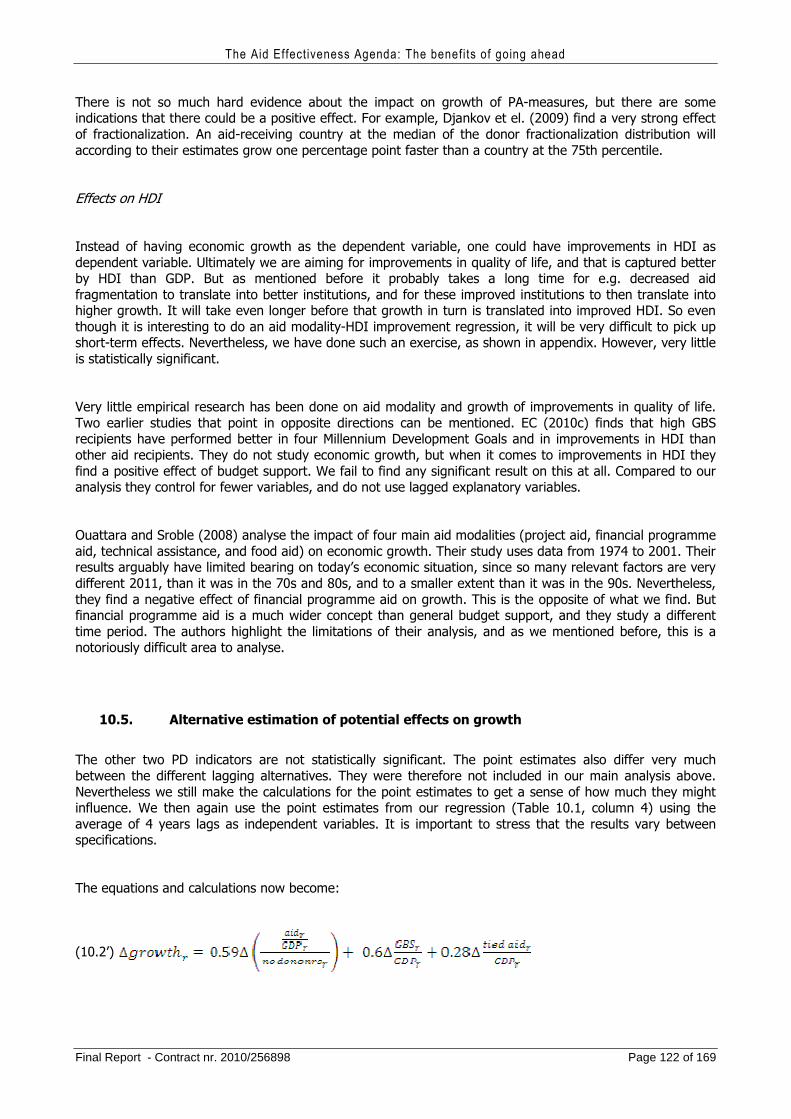
The Aid Effectiveness Agenda: The benefits of going ahead
Final Report - Contract nr. 2010/256898 Page 122 of 169
There is not so much hard evidence about the impact on growth of PA-measures, but there are some indications that there could be a positive effect. For example, Djankov et el. (2009) find a very strong effect of fractionalization. An aid-receiving country at the median of the donor fractionalization distribution will according to their estimates grow one percentage point faster than a country at the 75th percentile.
Effects on HDI
Instead of having economic growth as the dependent variable, one could have improvements in HDI as dependent variable. Ultimately we are aiming for improvements in quality of life, and that is captured better by HDI than GDP. But as mentioned before it probably takes a long time for e.g. decreased aid fragmentation to translate into better institutions, and for these improved institutions to then translate into higher growth. It will take even longer before that growth in turn is translated into improved HDI. So even though it is interesting to do an aid modality-HDI improvement regression, it will be very difficult to pick up short-term effects. Nevertheless, we have done such an exercise, as shown in appendix. However, very little is statistically significant.
Very little empirical research has been done on aid modality and growth of improvements in quality of life. Two earlier studies that point in opposite directions can be mentioned. EC (2010c) finds that high GBS recipients have performed better in four Millennium Development Goals and in improvements in HDI than other aid recipients. They do not study economic growth, but when it comes to improvements in HDI they find a positive effect of budget support. We fail to find any significant result on this at all. Compared to our analysis they control for fewer variables, and do not use lagged explanatory variables.
Ouattara and Sroble (2008) analyse the impact of four main aid modalities (project aid, financial programme aid, technical assistance, and food aid) on economic growth. Their study uses data from 1974 to 2001. Their results arguably have limited bearing on today’s economic situation, since so many relevant factors are very different 2011, than it was in the 70s and 80s, and to a smaller extent than it was in the 90s. Nevertheless, they find a negative effect of financial programme aid on growth. This is the opposite of what we find. But financial programme aid is a much wider concept than general budget support, and they study a different time period. The authors highlight the limitations of their analysis, and as we mentioned before, this is a notoriously difficult area to analyse.
10.5. Alternative estimation of potential effects on growth
The other two PD indicators are not statistically significant. The point estimates also differ very much between the different lagging alternatives. They were therefore not included in our main analysis above. Nevertheless we still make the calculations for the point estimates to get a sense of how much they might influence. We then again use the point estimates from our regression (Table 10.1, column 4) using the average of 4 years lags as independent variables. It is important to stress that the results vary between specifications.
The equations and calculations now become:
(10.2’)
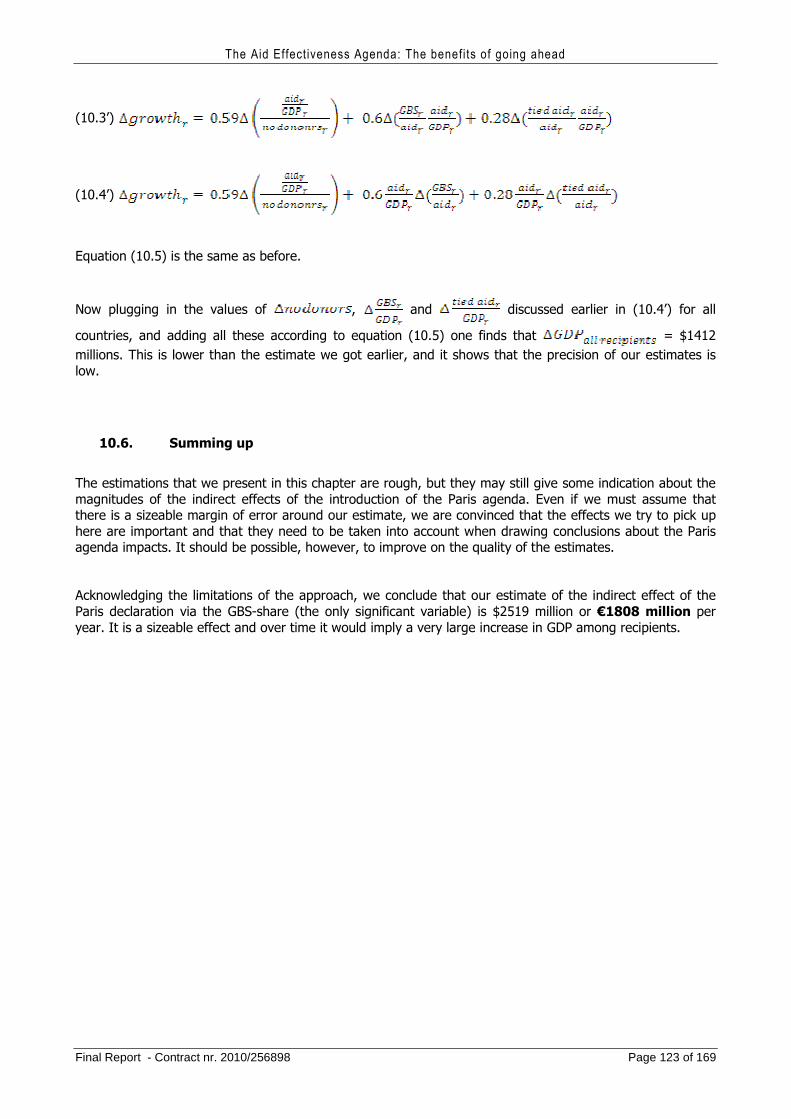
The Aid Effectiveness Agenda: The benefits of going ahead
Final Report - Contract nr. 2010/256898 Page 123 of 169
(10.3’)
(10.4’)
Equation (10.5) is the same as before.
Now plugging in the values of , and discussed earlier in (10.4’) for all
countries, and adding all these according to equation (10.5) one finds that = $1412 millions. This is lower than the estimate we got earlier, and it shows that the precision of our estimates is low.
10.6. Summing up
The estimations that we present in this chapter are rough, but they may still give some indication about the magnitudes of the indirect effects of the introduction of the Paris agenda. Even if we must assume that there is a sizeable margin of error around our estimate, we are convinced that the effects we try to pick up here are important and that they need to be taken into account when drawing conclusions about the Paris agenda impacts. It should be possible, however, to improve on the quality of the estimates.
Acknowledging the limitations of the approach, we conclude that our estimate of the indirect effect of the Paris declaration via the GBS-share (the only significant variable) is $2519 million or €1808 million per year. It is a sizeable effect and over time it would imply a very large increase in GDP among recipients.
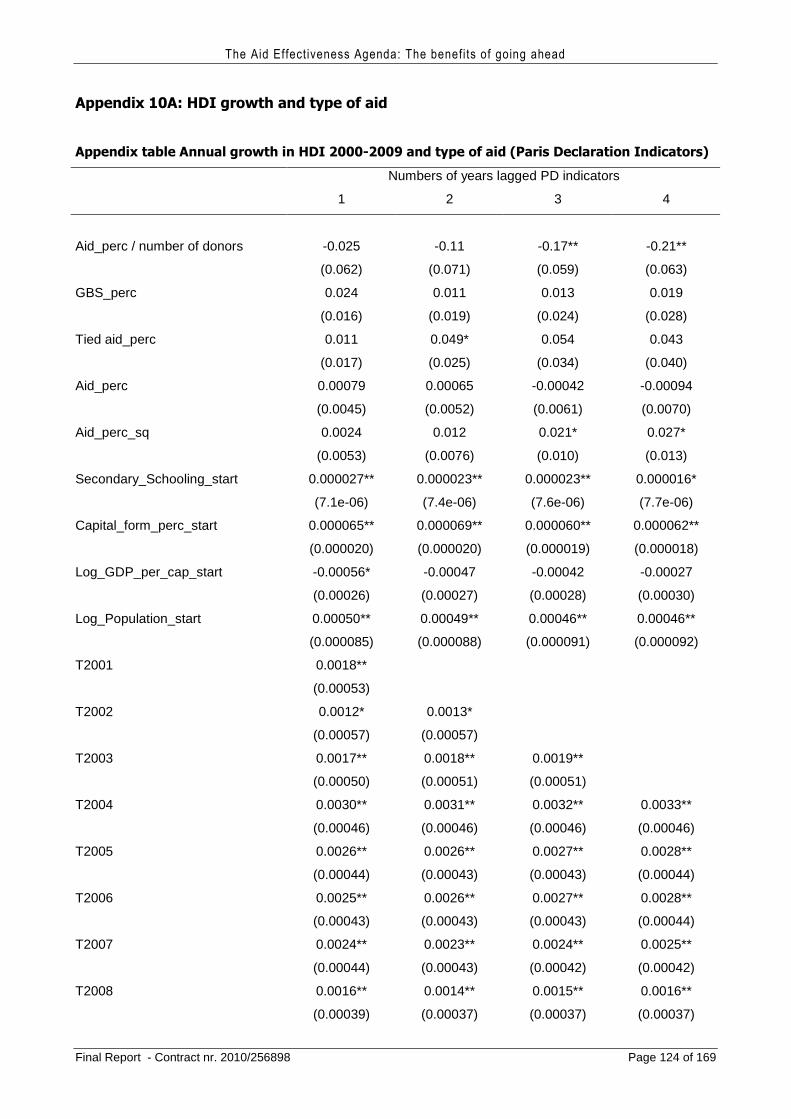
The Aid Effectiveness Agenda: The benefits of going ahead
Final Report - Contract nr. 2010/256898 Page 124 of 169
Appendix 10A: HDI growth and type of aid
Appendix table Annual growth in HDI 2000-2009 and type of aid (Paris Declaration Indicators)
Numbers of years lagged PD indicators
1 2 3 4
Aid_perc / number of donors -0.025 -0.11 -0.17** -0.21**
(0.062) (0.071) (0.059) (0.063)
GBS_perc 0.024 0.011 0.013 0.019
(0.016) (0.019) (0.024) (0.028)
Tied aid_perc 0.011 0.049* 0.054 0.043
(0.017) (0.025) (0.034) (0.040)
Aid_perc 0.00079 0.00065 -0.00042 -0.00094
(0.0045) (0.0052) (0.0061) (0.0070)
Aid_perc_sq 0.0024 0.012 0.021* 0.027*
(0.0053) (0.0076) (0.010) (0.013)
Secondary_Schooling_start 0.000027** 0.000023** 0.000023** 0.000016*
(7.1e-06) (7.4e-06) (7.6e-06) (7.7e-06)
Capital_form_perc_start 0.000065** 0.000069** 0.000060** 0.000062**
(0.000020) (0.000020) (0.000019) (0.000018)
Log_GDP_per_cap_start -0.00056* -0.00047 -0.00042 -0.00027
(0.00026) (0.00027) (0.00028) (0.00030)
Log_Population_start 0.00050** 0.00049** 0.00046** 0.00046**
(0.000085) (0.000088) (0.000091) (0.000092)
T2001 0.0018**
(0.00053)
T2002 0.0012* 0.0013*
(0.00057) (0.00057)
T2003 0.0017** 0.0018** 0.0019**
(0.00050) (0.00051) (0.00051)
T2004 0.0030** 0.0031** 0.0032** 0.0033**
(0.00046) (0.00046) (0.00046) (0.00046)
T2005 0.0026** 0.0026** 0.0027** 0.0028**
(0.00044) (0.00043) (0.00043) (0.00044)
T2006 0.0025** 0.0026** 0.0027** 0.0028**
(0.00043) (0.00043) (0.00043) (0.00044)
T2007 0.0024** 0.0023** 0.0024** 0.0025**
(0.00044) (0.00043) (0.00042) (0.00042)
T2008 0.0016** 0.0014** 0.0015** 0.0016**
(0.00039) (0.00037) (0.00037) (0.00037)
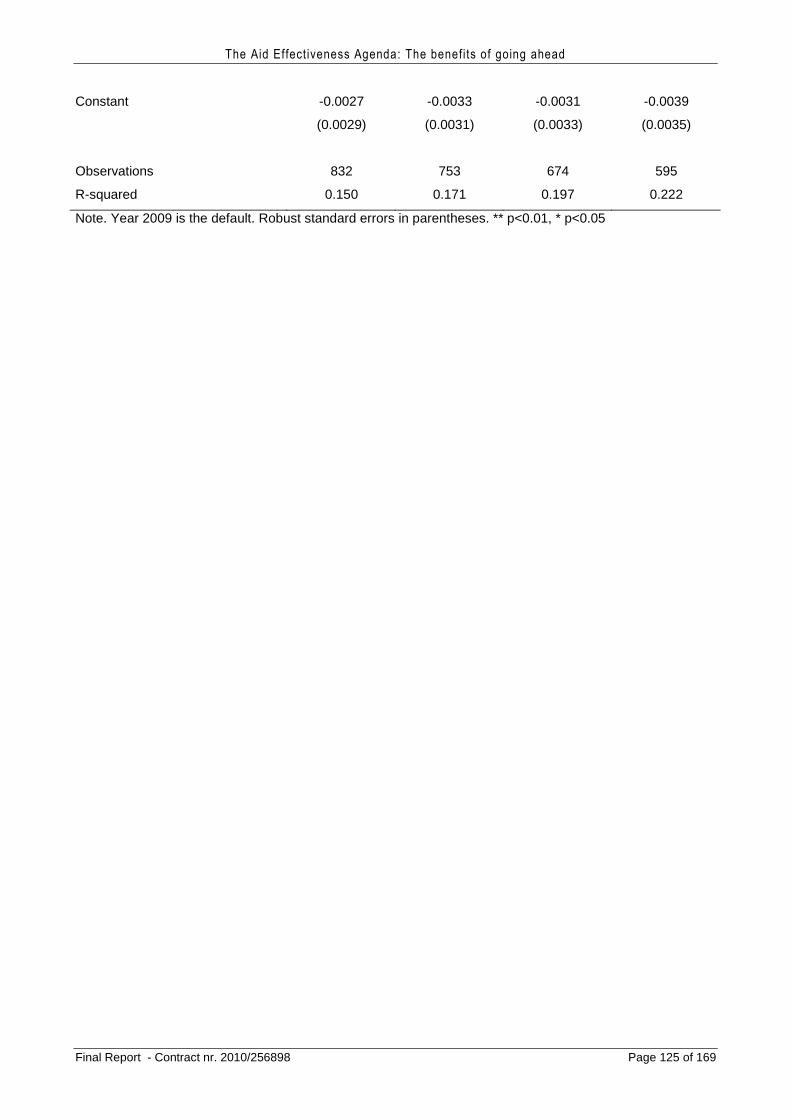
The Aid Effectiveness Agenda: The benefits of going ahead
Final Report - Contract nr. 2010/256898 Page 125 of 169
Constant -0.0027 -0.0033 -0.0031 -0.0039
(0.0029) (0.0031) (0.0033) (0.0035)
Observations 832 753 674 595
R-squared 0.150 0.171 0.197 0.222
Note. Year 2009 is the default. Robust standard errors in parentheses. ** p<0.01, * p<0.05
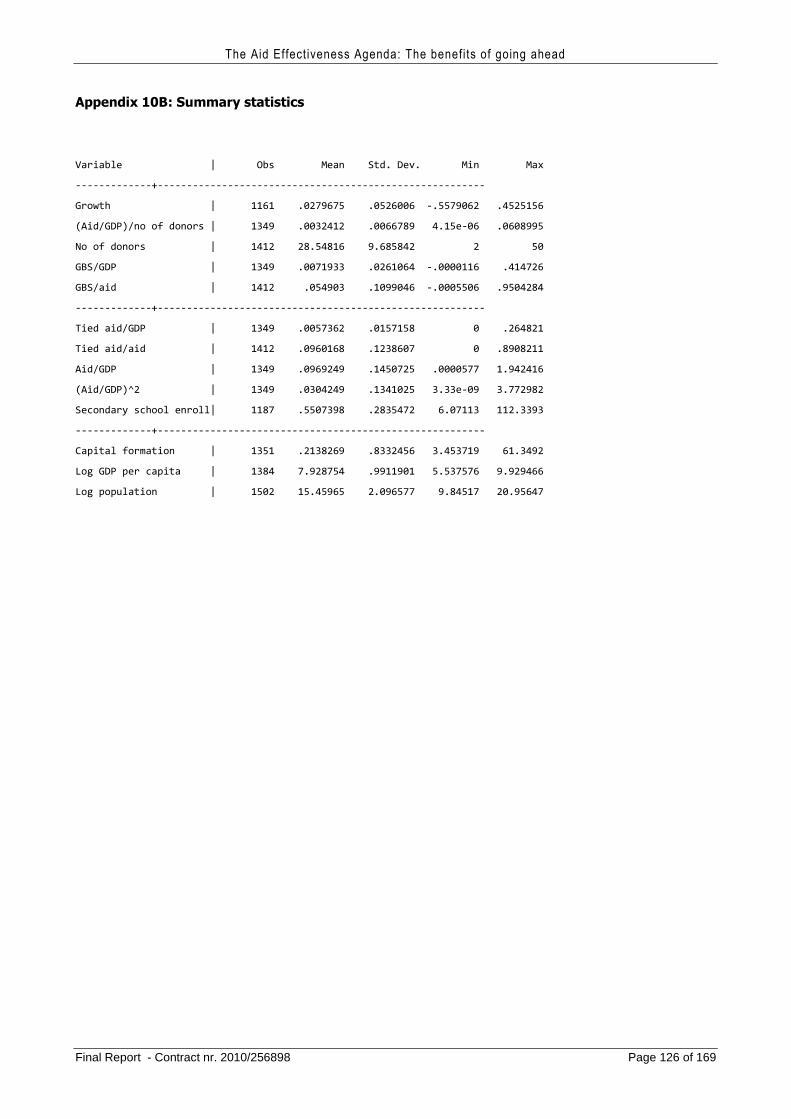
The Aid Effectiveness Agenda: The benefits of going ahead
Final Report - Contract nr. 2010/256898 Page 126 of 169
Appendix 10B: Summary statistics
Variable | Obs Mean Std. Dev. Min Max
-------------+--------------------------------------------------------
Growth | 1161 .0279675 .0526006 -.5579062 .4525156
(Aid/GDP)/no of donors | 1349 .0032412 .0066789 4.15e-06 .0608995
No of donors | 1412 28.54816 9.685842 2 50
GBS/GDP | 1349 .0071933 .0261064 -.0000116 .414726
GBS/aid | 1412 .054903 .1099046 -.0005506 .9504284
-------------+--------------------------------------------------------
Tied aid/GDP | 1349 .0057362 .0157158 0 .264821
Tied aid/aid | 1412 .0960168 .1238607 0 .8908211
Aid/GDP | 1349 .0969249 .1450725 .0000577 1.942416
(Aid/GDP)^2 | 1349 .0304249 .1341025 3.33e-09 3.772982
Secondary school enroll| 1187 .5507398 .2835472 6.07113 112.3393
-------------+--------------------------------------------------------
Capital formation | 1351 .2138269 .8332456 3.453719 61.3492
Log GDP per capita | 1384 7.928754 .9911901 5.537576 9.929466
Log population | 1502 15.45965 2.096577 9.84517 20.95647
The Aid Effectiveness Agenda: The benefits of going ahead
Final Report - Contract nr. 2010/256898 Page 127 of 169
11. Effects of EU coordination of country allocation of aid
11.1. Introduction
One of the tasks of this study is to discuss costs associated with aid policy making within the EU and the costs of parallel policy making. We note that developing and donor countries state in the AAA that they will seek to improve “the complementarity of donors’ efforts and the division of labour among donors, including through improved allocation of resources within sectors, within countries, and across countries.” (AAA, point 17; our italics). It is further stated in the same paragraph that “we will work to address the issue of countries that receive insufficient aid” (AAA, point 17d). So the issue of country allocation of aid is certainly high on the Paris agenda.
In our theoretical framework we identified the trade-off for European governments between aid efficiency and politics. We argued that improved aid coordination would be efficiency enhancing, but that it was at the same time associated with political costs. We referred to this in our theoretical framework as political costs of aid coordination. Thus, even if there are costs in terms of lower aid efficiency, the member governments may prefer bilateral aid relationships. In this chapter we first discuss the political costs and constraints on coordination of the country allocation of aid, possible efficiency arguments against coordination, and then we compute the gains that could be won in case these obstacles were overcome and the whole of the EU jointly sought a country allocation of aid that gives maximum poverty reduction. This exercise is done to illustrate what could hypothetically be gained from an optimization of the country allocation (with a very simple goal function).
11.2. Political constraints on coordination
It is clearly the case that political decision makers need to report results of their use of the tax-payers’ money to be able to maintain support for the activity. For example, it is noted in the Swedish PA evaluation (SADEV, 2010, p.44) that there is “a demand by Government on Sida to be in a position to show results in relation to specific Swedish support.” In a review the OECD notes that “Sweden’s field staffs face a delicate balancing act: promoting partner ownership and alignment whilst demanding reports on results to meet head office requirements” (OECD, 2009a, p. 69). Sida has also become more risk averse and is unwilling to risk of being exposed to corruption in the recipient system. “Weak systems to align with and a high risk of corruption have influenced Swedish readiness to provide general budget support.” (p. 47). This increases the reluctance to relax bilateral control of aid flows. And this mood and pattern of behaviour is quite widespread among donors, as was pointed out in the large DAC-evaluation (Wood et al., 2011). There is no point in arguing that governments should not be concerned about their voters and the domestic policy agenda, but we can still discuss the potential costs associated with it. The individual governments may have their own agendas that they want to pursue, or simply feel that they need to be able to report to their principals, the tax payers, what has been achieved.
We furthermore pointed out in our theoretical analysis that it is likely that larger countries are more willing to sacrifice efficiency for political control. This would suggest that countries like France and the UK would be even more inclined to go their own way than smaller donors. This should mean that these donors allocate a smaller share to the EU Commission and to multilaterals in general. One would assume that the aid allocation of larger countries across countries is relatively more dependent on their own political interest than altruistic motives than is the case for smaller countries.
The Aid Effectiveness Agenda: The benefits of going ahead
Final Report - Contract nr. 2010/256898 Page 128 of 169
It is hard to put a monetary value on the political costs, so we have to confine ourselves to a discussion of the issues. We can give some indications about the magnitude of the challenges the EU is facing if it is to be able to reap the efficiency gains from the implementation of the Paris agenda. Here we discuss whether we can see from the country allocation choices of various EU governments reflect political priorities or efficiency concerns.
One dimension where EU aid coordination could help aid efficiency is with regard to the optimal allocation of aid resources across countries. This could entail coordination: of Commission activities, between the COM and the bilateral activities of EU member states, and with the non-EU development community.
Aid allocation may be influenced by donor self-interest, recipient needs, and recipient merit. Self-interest may be either geo-political or commercial. The use of aid tying is one example of own commercial interests influencing aid allocation. The development motive is first and foremost the altruistic desire to help the poor, while merit indicators are related to governance. We have argued that less national controls of the aid budget may have political costs, and that is what we have referred to as political costs. What we will discuss in this section is whether political interests govern aid allocation of the EU countries.
The most comprehensive and classical analyses of country aid allocation has been done by Berthélemy. The most striking result of his analyses of country allocation of aid is that neither recipient needs nor recipient merits seem to play any significant role in the allocation of Commission aid (Berthélemy, 2006b, p.16). Instead special relationships developed between the Commission and the ACP countries since the 1970s have a significant influence. He also notes that the Commission aid allocation is influenced by British commercial interests. These results indicate that the allocation of Commission aid could be better allocated if the aim is development and poverty reduction. It thus seems as if the Commission (at least during the period covered in this study which is before the PA) lets political motives steer aid allocation to a rather higher degree. For other multilaterals recipients’ needs play a major role, while merits do not. On the whole bilaterals and non-COM multilaterals behave very similarly. Still, commercial interests influence also the bilateral allocation of aid, particularly for the large countries of France and Italy (Berthélemy, 2006b, p 11). This review indicates that there is a whole range of motives other than poverty reduction that come into play when it comes to the allocation of aid.
11.3. Relative agency efficiency
The previous section indicated that EU donors often have been unwilling to pay the political price of adhering to the Paris agenda – at least when it comes to the country allocation of aid. But we can also look at the adherence of donor agencies to the Paris agenda by using the relative rankings of aid institutions done by Birdsall and Kharas (2010). Their rankings are based on 30 indicators, largely drawn from the Paris agenda, and they should therefore be relevant.
The structure of their analysis was discussed already in Chapter 2. They aggregated their indicators into four dimensions, namely 1) Maximizing efficiency, 2) Fostering institutions, 3) Reducing burden, and 4) Transparency and learning. They only had cross-section information so we cannot say anything about changes over time on the basis of this study, but here we are interested in looking at the quality variation among EU donors and between them and the rest. They did not feel that they should aggregate it all into an overall index, so they presented the results for the four dimensions separately (see their Table 54, p. 25). But to get some feel for where the COM and the EU bilaterals rank generally in terms of aid quality in terms of these kinds of indicators we have simply added up the four indicators for the donor covered in the table and that gave us some crude numbers (Table 11.1). We will not expose these numbers to any statistical analysis, but we can at least draw some tentative conclusions on the basis of the table.
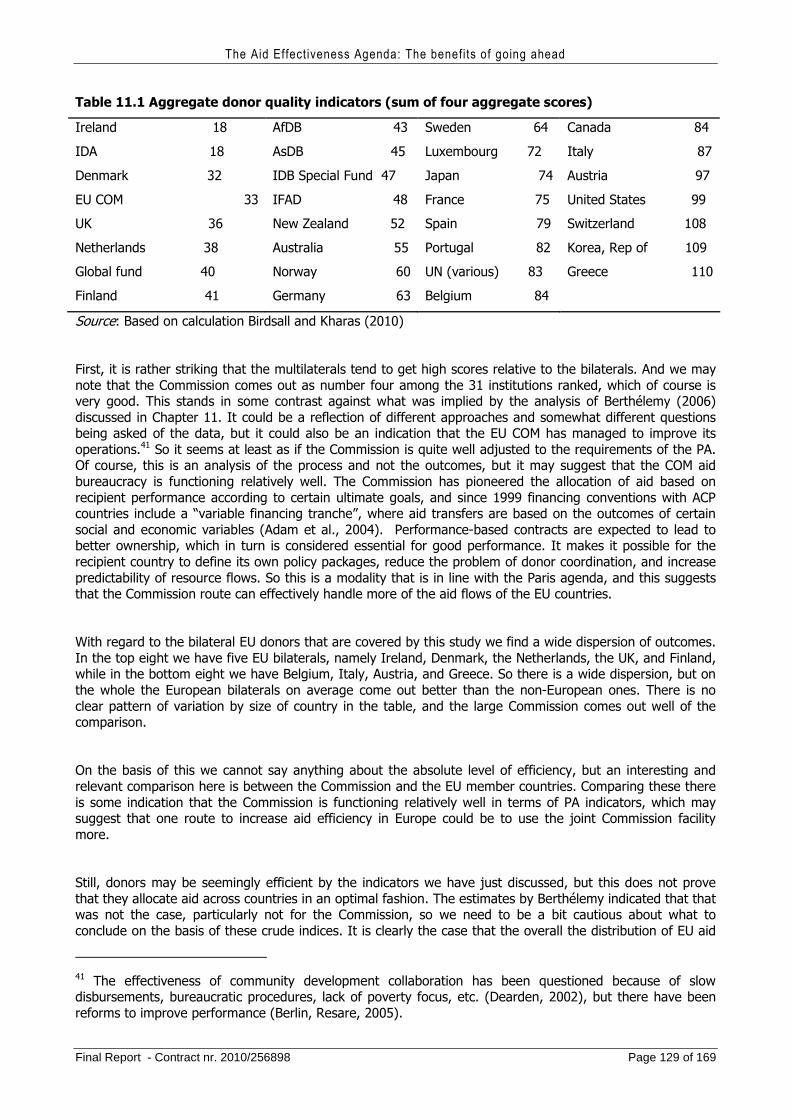
The Aid Effectiveness Agenda: The benefits of going ahead
Final Report - Contract nr. 2010/256898 Page 129 of 169
Table 11.1 Aggregate donor quality indicators (sum of four aggregate scores)
Ireland 18 AfDB 43 Sweden 64 Canada 84
IDA 18 AsDB 45 Luxembourg 72 Italy 87
Denmark 32 IDB Special Fund 47 Japan 74 Austria 97
EU COM 33 IFAD 48 France 75 United States 99
UK 36 New Zealand 52 Spain 79 Switzerland 108
Netherlands 38 Australia 55 Portugal 82 Korea, Rep of 109
Global fund 40 Norway 60 UN (various) 83 Greece 110
Finland 41 Germany 63 Belgium 84
Source: Based on calculation Birdsall and Kharas (2010)
First, it is rather striking that the multilaterals tend to get high scores relative to the bilaterals. And we may note that the Commission comes out as number four among the 31 institutions ranked, which of course is very good. This stands in some contrast against what was implied by the analysis of Berthélemy (2006) discussed in Chapter 11. It could be a reflection of different approaches and somewhat different questions being asked of the data, but it could also be an indication that the EU COM has managed to improve its operations.41 So it seems at least as if the Commission is quite well adjusted to the requirements of the PA. Of course, this is an analysis of the process and not the outcomes, but it may suggest that the COM aid bureaucracy is functioning relatively well. The Commission has pioneered the allocation of aid based on recipient performance according to certain ultimate goals, and since 1999 financing conventions with ACP countries include a “variable financing tranche”, where aid transfers are based on the outcomes of certain social and economic variables (Adam et al., 2004). Performance-based contracts are expected to lead to better ownership, which in turn is considered essential for good performance. It makes it possible for the recipient country to define its own policy packages, reduce the problem of donor coordination, and increase predictability of resource flows. So this is a modality that is in line with the Paris agenda, and this suggests that the Commission route can effectively handle more of the aid flows of the EU countries.
With regard to the bilateral EU donors that are covered by this study we find a wide dispersion of outcomes. In the top eight we have five EU bilaterals, namely Ireland, Denmark, the Netherlands, the UK, and Finland, while in the bottom eight we have Belgium, Italy, Austria, and Greece. So there is a wide dispersion, but on the whole the European bilaterals on average come out better than the non-European ones. There is no clear pattern of variation by size of country in the table, and the large Commission comes out well of the comparison.
On the basis of this we cannot say anything about the absolute level of efficiency, but an interesting and relevant comparison here is between the Commission and the EU member countries. Comparing these there is some indication that the Commission is functioning relatively well in terms of PA indicators, which may suggest that one route to increase aid efficiency in Europe could be to use the joint Commission facility more.
Still, donors may be seemingly efficient by the indicators we have just discussed, but this does not prove that they allocate aid across countries in an optimal fashion. The estimates by Berthélemy indicated that that was not the case, particularly not for the Commission, so we need to be a bit cautious about what to conclude on the basis of these crude indices. It is clearly the case that the overall the distribution of EU aid
41 The effectiveness of community development collaboration has been questioned because of slow disbursements, bureaucratic procedures, lack of poverty focus, etc. (Dearden, 2002), but there have been reforms to improve performance (Berlin, Resare, 2005).
The Aid Effectiveness Agenda: The benefits of going ahead
Final Report - Contract nr. 2010/256898 Page 130 of 169
across recipient countries is not particularly focused on the poorest countries, since country choices are not coordinated and because country choice is often a very political choice. Thus, one would assume that much can be gained if 'aid orphans' got more aid with the help of a coordinated country allocation of aid. Next we seek to estimate the gains from an optimal country allocation of EU aid.
11.4. Gains from coordinating the country allocation of EU aid
We now investigate what gains the EU could achieve if it chose to jointly seek to optimize the allocation of its aid across countries with the aim to maximize the poverty reduction effect. The though experiment we undertake is that EU27 + the Commission reallocate its aid to maximize poverty reduction. The reallocation is not the same as the one that would have resulted from an optimization involving all donors. (For example, in the EU simulation the allocation for Mozambique is reduced, while it would have increased if all donors had been involved in the reallocation. When only the EU resources are reallocated they are only enough to increase allocation to a smaller group of “orphans” than if the aid of all donors was reallocated.) To simplify the computations we first ignore that the levels of governance may differ between orphans and darlings, but we return to this issue after having completed the first stage reallocation. We will see that the governance on average is worse among the orphans, and that we therefore have to scale down our first round estimate of the gains.
So let us now look at the first stage optimization. In this experiment we only consider country programmable aid, which is the part of aid that is in focus in the Paris agenda. Emergency aid and the like cannot be allocated according to the rule we apply here. In Table 7.1 we see that total CPA from EU27+COM was $32 616 million in 2009. Excluding regional aid and aid to some countries that could not be included due to lack of data on income (mainly the Palestinian Administrative Areas and Mayotte, see Appendix 11), we are left with $27 300 million to allocate optimally. We then compute how much aid needs to be reallocated from darlings to orphans.
In this reallocation we need to take into account that aid has decreasing returns with regard to its share of GDP. The aid saturation point (the point at which the positive impact of aid falls to zero) is assumed to be when aid/GDP (PPP) = 10 %. This level is based on the average estimate of 30% for all aid in nominal dollars in the studies surveyed by Clemens and Radelet (2003). This estimate is first scaled down to 20 %, since we only consider CPA and not all aid. It is then scaled down further to 10 %, since we use PPP-figures for GDP/capita.42
We expand the approach of Collier and Dollar (2002). For country i we let be population, be GDP per capita, be aid/GDP, be headcount poverty, be growth and be the income elasticity of headcount poverty. Like Collier and Dollar we assume that , thus that the elasticity is the same in all countries. This is clearly not the case43, but since we only want to find the aggregate effect the use of the simplification should be acceptable. The objective function of donors is to allocate aid among countries so as to
Max poverty reduction (11.1)
If we for the moment consider only interior solutions, the first order conditions for a maximum are
42 We use PPP-adjusted figures, since we let poverty be a function of GDP/capita, see expression (11.4). This simplification should be more correct when using PPP-figures than nominal figures. 43 See for example Bigsten and Shimeles (2007) on variation of the elasticity across African countries.

The Aid Effectiveness Agenda: The benefits of going ahead
Final Report - Contract nr. 2010/256898 Page 131 of 169
, (11.2)
where is the shadow value of aid. Assuming (as is standard in the literature, e.g. Collier and Dollar, 2002)
a quadratic relationship between A and G, using 10 % as the saturation point, and letting g denote when
A = 0 it follows that
. (11.3)
Bourguignon (2000) finds an income elasticity of headcount poverty ($1 per day line) of approximately – 2. He also finds that the absolute value of the elasticity is generally smaller in poorer countries, so we use – 1 as a conservative number. This may bias our results downwards somewhat. Now we can write poverty as a function of income and a constant k.
(11.4)
Then (2) – (4) imply
(11.5)
where .
Now we can derive an allocation rule for EU. The aid allocation from the EU to country i, , should be the
aid recommended in (11.5) minus the aid already given to it by non-EU, Obviously aid from EU also must be non-negative, so we now also need to consider corner solutions.
This gives:
(11.6)
We cannot use this allocation rule directly, since we cannot solve for analytically, and we do not know the exact values of g and k. But since the budget condition is
(11.7)
we can numerically solve for (it is 0.000000028724) and then use (11.6) as our allocation rule. Note that there is no need to solve for , or to apply values for , g, or k. It is enough to solve for to be able to derive the optimal allocation.
The Aid Effectiveness Agenda: The benefits of going ahead
Final Report - Contract nr. 2010/256898 Page 132 of 169
We define an “aid orphan” as a country that get less aid from EU than our allocation rule recommends. EU should scale up aid to these countries. Table 11.1 shows data for all orphans, including the increase in EU aid our analysis recommends. We further define an “aid darling” as a country that get more aid from EU than our allocation rule recommends. EU should scale down aid to these countries. Table 11.2 shows detailed information about the most important darlings, and aggregate information for the rest of the darlings, including the decrease in EU aid our analysis recommends.
In Table 11.1 Bangladesh stands out, since our results suggest that as much as $9 288 million should be reallocated to it. If we for some reason decide to exclude Bangladesh from the reallocation, the optimization would give us a new estimate of how much should optimally be reallocated. Approximately $17 billion should then be reallocated, that is considerably more than the $10 016 million allocated to the orphans other than Bangladesh in our main allocation. If we do not reallocate anything to Bangladesh, more money would be available for reallocation to e.g. Tanzania, and new money would now be available for countries previously excluded, e.g. Cambodia.
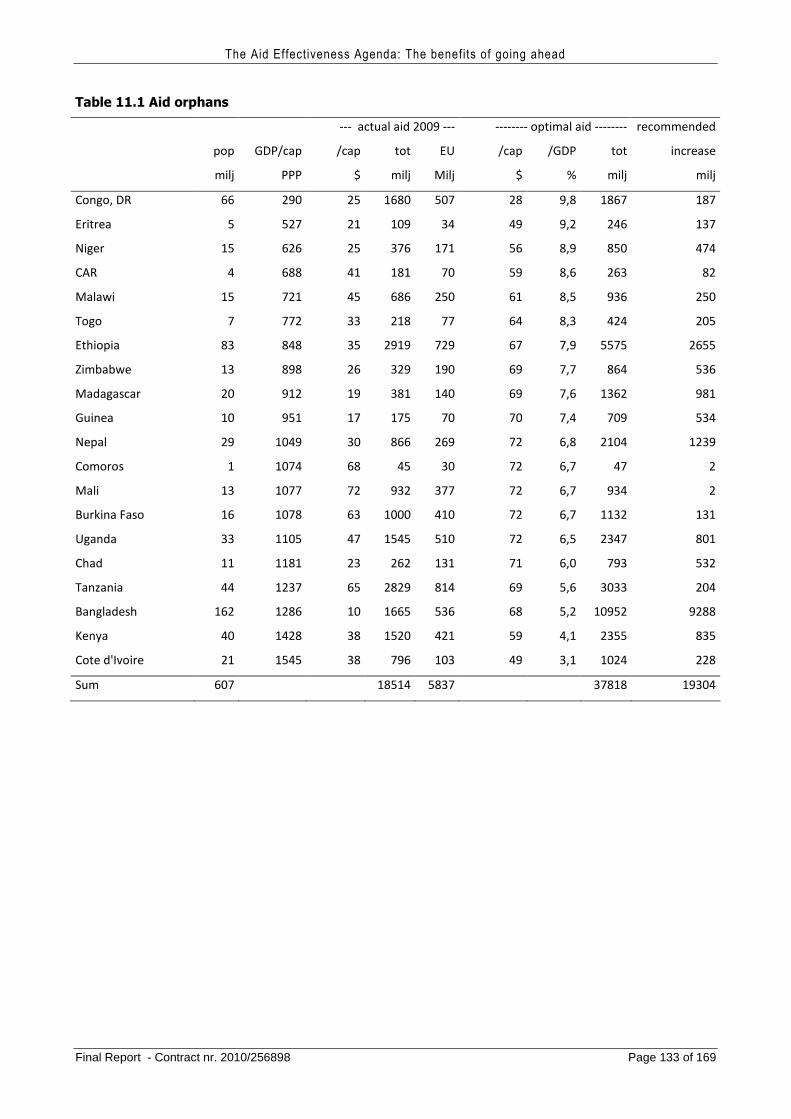
The Aid Effectiveness Agenda: The benefits of going ahead
Final Report - Contract nr. 2010/256898 Page 133 of 169
Table 11.1 Aid orphans
--- actual aid 2009 --- -------- optimal aid -------- recommended
pop GDP/cap /cap tot EU /cap /GDP tot increase
milj PPP $ milj Milj $ % milj milj
Congo, DR 66 290 25 1680 507 28 9,8 1867 187
Eritrea 5 527 21 109 34 49 9,2 246 137
Niger 15 626 25 376 171 56 8,9 850 474
CAR 4 688 41 181 70 59 8,6 263 82
Malawi 15 721 45 686 250 61 8,5 936 250
Togo 7 772 33 218 77 64 8,3 424 205
Ethiopia 83 848 35 2919 729 67 7,9 5575 2655
Zimbabwe 13 898 26 329 190 69 7,7 864 536
Madagascar 20 912 19 381 140 69 7,6 1362 981
Guinea 10 951 17 175 70 70 7,4 709 534
Nepal 29 1049 30 866 269 72 6,8 2104 1239
Comoros 1 1074 68 45 30 72 6,7 47 2
Mali 13 1077 72 932 377 72 6,7 934 2
Burkina Faso 16 1078 63 1000 410 72 6,7 1132 131
Uganda 33 1105 47 1545 510 72 6,5 2347 801
Chad 11 1181 23 262 131 71 6,0 793 532
Tanzania 44 1237 65 2829 814 69 5,6 3033 204
Bangladesh 162 1286 10 1665 536 68 5,2 10952 9288
Kenya 40 1428 38 1520 421 59 4,1 2355 835
Cote d'Ivoire 21 1545 38 796 103 49 3,1 1024 228
Sum 607 18514 5837 37818 19304
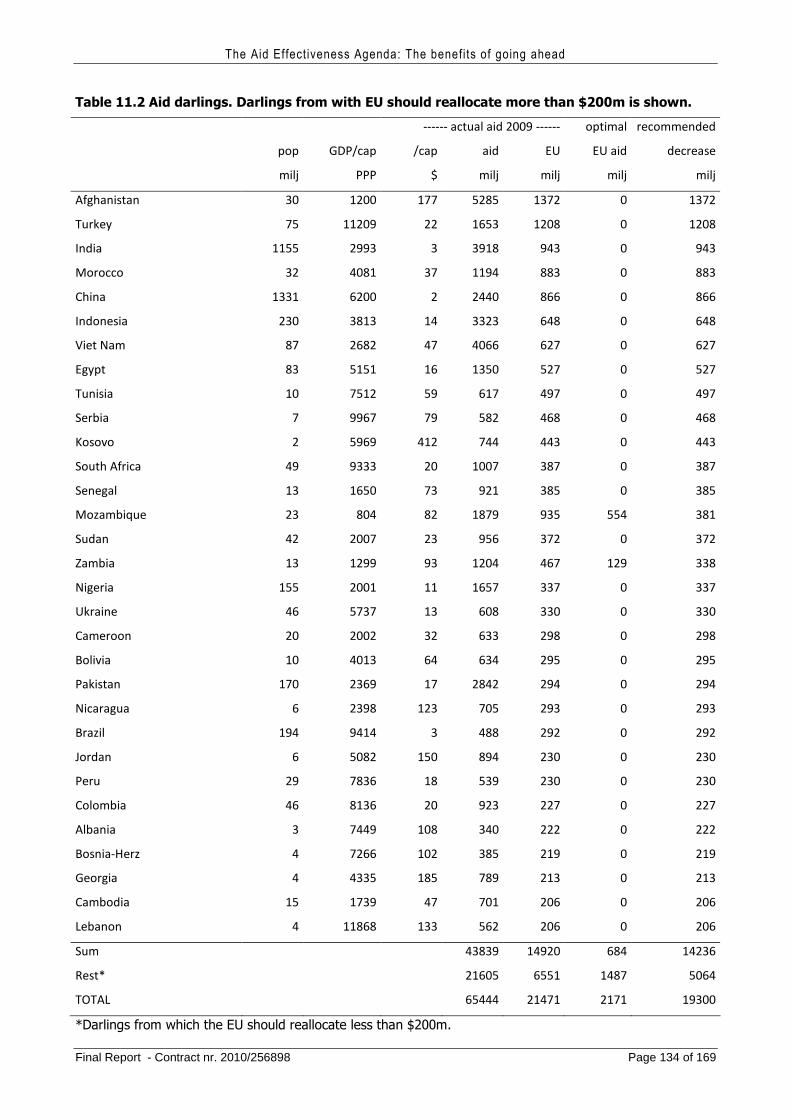
The Aid Effectiveness Agenda: The benefits of going ahead
Final Report - Contract nr. 2010/256898 Page 134 of 169
Table 11.2 Aid darlings. Darlings from with EU should reallocate more than $200m is shown.
------ actual aid 2009 ------ optimal recommended
pop GDP/cap /cap aid EU EU aid decrease
milj PPP $ milj milj milj milj
Afghanistan 30 1200 177 5285 1372 0 1372
Turkey 75 11209 22 1653 1208 0 1208
India 1155 2993 3 3918 943 0 943
Morocco 32 4081 37 1194 883 0 883
China 1331 6200 2 2440 866 0 866
Indonesia 230 3813 14 3323 648 0 648
Viet Nam 87 2682 47 4066 627 0 627
Egypt 83 5151 16 1350 527 0 527
Tunisia 10 7512 59 617 497 0 497
Serbia 7 9967 79 582 468 0 468
Kosovo 2 5969 412 744 443 0 443
South Africa 49 9333 20 1007 387 0 387
Senegal 13 1650 73 921 385 0 385
Mozambique 23 804 82 1879 935 554 381
Sudan 42 2007 23 956 372 0 372
Zambia 13 1299 93 1204 467 129 338
Nigeria 155 2001 11 1657 337 0 337
Ukraine 46 5737 13 608 330 0 330
Cameroon 20 2002 32 633 298 0 298
Bolivia 10 4013 64 634 295 0 295
Pakistan 170 2369 17 2842 294 0 294
Nicaragua 6 2398 123 705 293 0 293
Brazil 194 9414 3 488 292 0 292
Jordan 6 5082 150 894 230 0 230
Peru 29 7836 18 539 230 0 230
Colombia 46 8136 20 923 227 0 227
Albania 3 7449 108 340 222 0 222
Bosnia-Herz 4 7266 102 385 219 0 219
Georgia 4 4335 185 789 213 0 213
Cambodia 15 1739 47 701 206 0 206
Lebanon 4 11868 133 562 206 0 206
Sum 43839 14920 684 14236
Rest* 21605 6551 1487 5064
TOTAL 65444 21471 2171 19300
*Darlings from which the EU should reallocate less than $200m.
The Aid Effectiveness Agenda: The benefits of going ahead
Final Report - Contract nr. 2010/256898 Page 135 of 169
In Tables 11.1 and 11.2 we see that as much as $19 304 million of EU aid (out of $27.3 billion) should be reallocated. The benefit of this is $19 304 million more to the orphans and the cost is that the darlings lose $19 304 million. This shift represents an efficiency gain in terms of poverty reduction (decrease in the number below the poverty line). The poverty reduction effect of a dollar in the darling countries is only 15.2 % of the effect the same dollar would have in the orphan countries.44 If we use the dollars optimally allocated as the norm we can say as follows. The cost is 0.152*19304 = 2934, and thus the net benefit is $19 304 million – $2934 million = $16 370 million. So we conclude that the net gain from reallocation according to the assumptions used so far would be $16 370 million.
However, for this gain to be realized there should not be any difference in the quality of governance between the darlings and the orphans. But there is such a difference! In the sample the weighted average of the governance index (Worldwide Governance Indicators , see Kaufmann et al., 2010) is -5.55 among the orphans and -2.9 among the darlings. The growth effect of the resources shifted to the orphans should thus on average be lower than it would have been if the orphans had had the same quality of governance as the darlings. To adjust for this we first chose to separate out an allocation from the worst governed darlings to the best governed orphans.
As much as $11303 million of the surplus in darling countries comes from countries with an average institutions index of –4.9. This is the “bad darlings”. This money could then be reallocated to the “good orphans” who on average have the same institutions index. The average income per capita (PPP) in these “bad darlings” is 70 % of the average income per capita (PPP) among all darlings. This means that the mean efficiency loss in terms of poverty reduction will be (1/0.70)^2 = 2.04 times the earlier estimate 15.2 % = 31 %. So the efficiency loss is $11303 million * 0.31=$3503 million.
For the remaining $19304 million - $11303 million = $8001 million it is hard to estimate the magnitude of the efficiency loss. But to be on the safe side we assume it to be twice as high, that is 62 %. So the efficiency loss for this category would then be 8001 million * 0.62 = $4961 million.
Summing this up we then finally finds that the total efficiency loss becomes $3503 million + $4961 million = $8464 million. The net benefit then is $19 304 million – $8464 million = $10 840 million. This is equivalent to €7779 million. This is still a large potential gain.
Sensitivity analysis
To give an indication of the sensitivity of our result to changes in assumption we undertake an alternative and more limited experiment.
We note that as much as $11303 million of the surplus in darling countries comes from countries with an average institutions index of –4.9. This is the “bad darlings”. This money could then be reallocated to the “good orphans” who on average have the same institutions index. The average income per capita (PPP) in these “bad darlings” is 70 % of the average income among all darlings. This means that the mean efficiency loss in terms of poverty reduction will be (1/0.70)^2 = 2.04 times the earlier estimate 15.2 % = 31 %. So the efficiency loss is $11303 million * 0.31=$3503 million. In this simulation we abstain from any reallocation of the remaining $19304 million - $11303 million = $8001 million. Summing this up we then finally find that the total efficiency loss becomes $3503 million. The net benefit is then $11303 million – $3503 million = $7800 million. This is equivalent to €5600 million, which still is a large potential gain.
44 If we instead had used – 2 as the income elasticity of headcount poverty the efficiency loss had been as low as 7.8 %.
The Aid Effectiveness Agenda: The benefits of going ahead
Final Report - Contract nr. 2010/256898 Page 136 of 169
11.5. Feasible reallocations?
It is clear from our empirical analysis that there are large gains to be had in terms of poverty reduction by reallocating aid resources according to need. So why have the proposed allocation of donor resources not been achieved. Obviously donors have other aims apart from the maximization of global poverty reduction. They want to be present in a broader range of countries for economic and political reasons, that is there are political constraints on the reallocation our analysis suggests.
A country reallocation of EU aid can be achieved without necessarily channel the resources through the Commission, but then donors have to get together and coordinate their allocations. This may be an easier way of moving on the proposed direction than to shift the resources to the Commission. And then again, for the Commission to achieve the optimal allocation across countries it must have the support of the countries in any case. At present it would seem that the Commission (and thus presumably its principals, the countries) rather is concerned to show a European presence across all countries. So irrespective of what form the coordination would take, there seems to be strong political restrictions on what can be achieved.
We have furthermore noted that donors have become more risk averse and it has become more important for them to transfer resources in ways that make it possible for them to trace their own money. This may limit their desire to allocate aid resources through the Commission. Previously there has also been a sense that the bilateral channels were more efficient than the Commission channels, which would also hold back resource shifts to the Commission. However, in terms of how the aid is organized the Commission (like other multilaterals) now seems to be better adjusted to the Paris agenda than the bilaterals. So far we don’t know whether this is reflected in better impact.
So coordination can take different forms, but the extent of coordination will in the end depend on the political goals of the participating countries. The ideal model we analysed assumed that their only goal is poverty reduction, but this is not their revealed preference. There are also other aims, which will hold back the proposed reallocation.
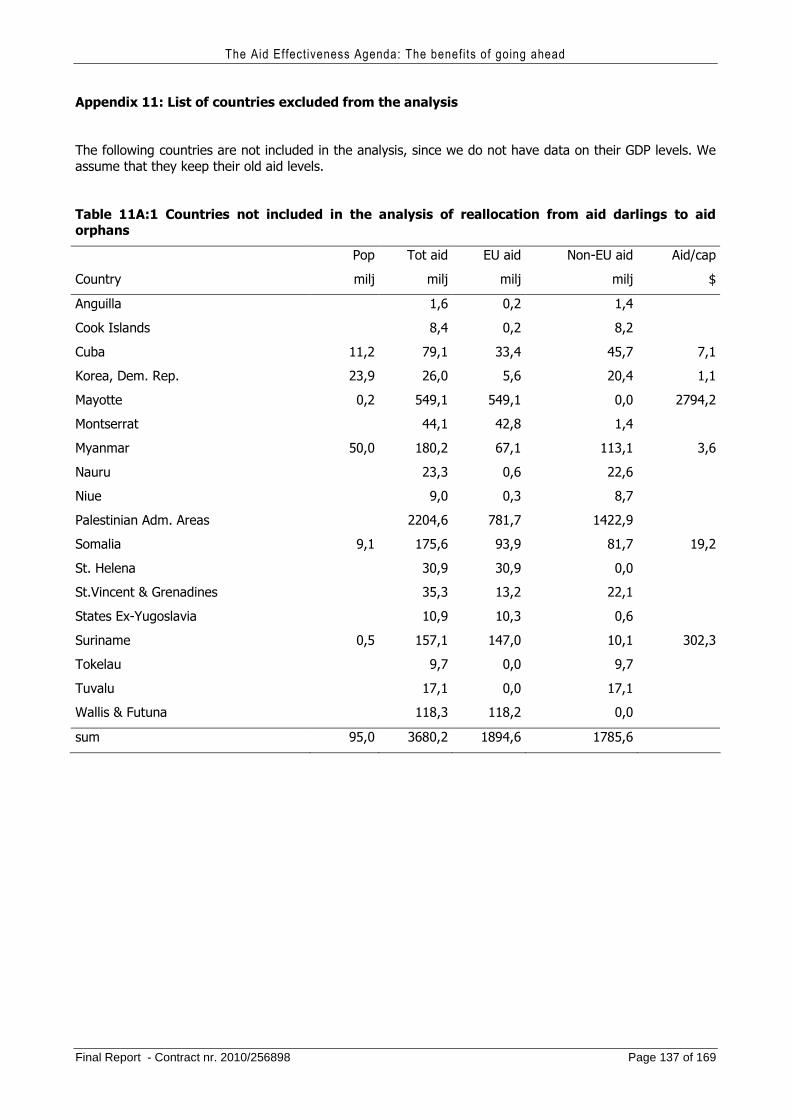
The Aid Effectiveness Agenda: The benefits of going ahead
Final Report - Contract nr. 2010/256898 Page 137 of 169
Appendix 11: List of countries excluded from the analysis
The following countries are not included in the analysis, since we do not have data on their GDP levels. We assume that they keep their old aid levels.
Table 11A:1 Countries not included in the analysis of reallocation from aid darlings to aid orphans
Pop Tot aid EU aid Non-EU aid Aid/cap
Country milj milj milj milj $
Anguilla 1,6 0,2 1,4
Cook Islands 8,4 0,2 8,2
Cuba 11,2 79,1 33,4 45,7 7,1
Korea, Dem. Rep. 23,9 26,0 5,6 20,4 1,1
Mayotte 0,2 549,1 549,1 0,0 2794,2
Montserrat 44,1 42,8 1,4
Myanmar 50,0 180,2 67,1 113,1 3,6
Nauru 23,3 0,6 22,6
Niue 9,0 0,3 8,7
Palestinian Adm. Areas 2204,6 781,7 1422,9
Somalia 9,1 175,6 93,9 81,7 19,2
St. Helena 30,9 30,9 0,0
St.Vincent & Grenadines 35,3 13,2 22,1
States Ex-Yugoslavia 10,9 10,3 0,6
Suriname 0,5 157,1 147,0 10,1 302,3
Tokelau 9,7 0,0 9,7
Tuvalu 17,1 0,0 17,1
Wallis & Futuna 118,3 118,2 0,0
sum 95,0 3680,2 1894,6 1785,6
The Aid Effectiveness Agenda: The benefits of going ahead
Final Report - Contract nr. 2010/256898 Page 138 of 169
12. Overall effect of an EU implementation of the Paris Declaration
The challenging task of this study has been to try to put a value on the full implementation of the Paris agenda by the EU, that is the Commission plus the 27 member countries. In the analysis we have covered bilateral aid from the member countries plus aid through the Commission. The estimates were done for 2009. The areas covered were the following:
Savings on transaction costs: First we measured potential savings on aid transaction costs. We tried to minimize the problems of double-counting in the estimates by starting from the aggregate figures. We thus started from aggregate information from the donors on their administrative costs and evaluated how much of this cost donors could save by concentrating activities. This was done by estimating the cost savings that can be achieved by having fewer partner countries and by shifting aid from projects to programmes. In total the savings from the two steps would according to our estimates be in the range of €700 million (see Chapter 7). This is our combined answer to the second and third questions in Chapter 2 (Assessing gains to be made from increasing harmonisation (reducing the administrative burden, and Assessing gains to be made from improving mutual accountability (transparency and learning)). We cannot separate out the relative importance of these two factors, and there may of course also be other changes undertaken by the donors that drive the results.
Gains from the untying of aid: The second component we estimated is the cost to recipients of the tying of aid by EU donors. We make estimates separately for non-technical assistance and technical assistance. The total cost of EU aid tying is about €800 million (see Chapter 8). This estimate is the first part of the answer to the first question Chapter 2 (Assessing gains to be made from increasing ownership/alignment (fostering institutions)).
Gains from reducing the unpredictability and volatility of aid: Given that higher volatility is expected to have negative consequences for partner countries, it is assumed that they would be willing to receive lower expected flows of aid in exchange for lower volatility of aid. We confine the analysis to country programmable aid, since this is the category for which uncertainly is clearly negative. We estimate for each partner country the lowest amount of aid that it would agree on receiving if this aid were given to it with certainty. By summing up the estimates we obtain an estimate of the total loss for all recipients due to volatility. Our estimate of the benefits of reducing the volatility of EU aid is about €1700 million (see Chapter 9). This is our answer to the fourth question in Chapter 2 (Assessing gains to be made from improving predictability)
Indirect effects on institutions and growth of recipients: The estimates we have done sought to pick up the effects on recipient country growth of changes in the aid according to the Paris Declaration. On this issue it is very hard to come up with precise estimates, so here the results are considerably less certain than for the previous estimations. We find a significant effect of a shift towards General Budget Support, but the effect is estimated with relatively small precision. Still, we think it is reasonable to include an approximate estimate in our study, given the likely importance of these effects. The change we simulate (an 11% increase in the share of GBS in aid flows) would according to our estimates yield an aggregate increase in the GDP of partner countries the first year by an amount in the range of €1800 million (see Chapter 10). Since the estimate is uncertain we put it in parenthesis in our summary table, but this does not mean that we believe that these effects are not important. This estimate is the second part of our answer to the first question Chapter 2 (Assessing gains to be made from increasing ownership/alignment (fostering institutions, and Gains from coordinated country allocation are shown to be potentially very large.
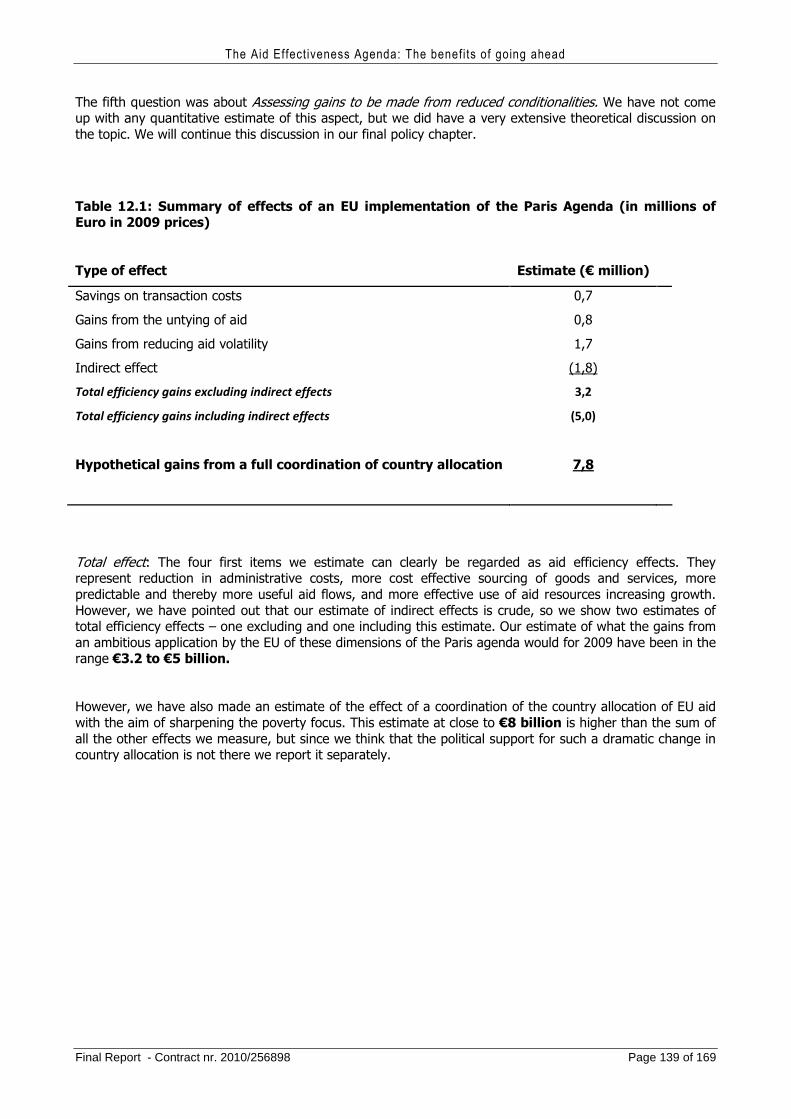
The Aid Effectiveness Agenda: The benefits of going ahead
Final Report - Contract nr. 2010/256898 Page 139 of 169
The fifth question was about Assessing gains to be made from reduced conditionalities. We have not come up with any quantitative estimate of this aspect, but we did have a very extensive theoretical discussion on the topic. We will continue this discussion in our final policy chapter.
Table 12.1: Summary of effects of an EU implementation of the Paris Agenda (in millions of Euro in 2009 prices)
Type of effect Estimate (€ million)
Savings on transaction costs 0,7
Gains from the untying of aid 0,8
Gains from reducing aid volatility 1,7
Indirect effect (1,8)
Total efficiency gains excluding indirect effects
Total efficiency gains including indirect effects
3,2
(5,0)
Hypothetical gains from a full coordination of country allocation 7,8
Total effect: The four first items we estimate can clearly be regarded as aid efficiency effects. They represent reduction in administrative costs, more cost effective sourcing of goods and services, more predictable and thereby more useful aid flows, and more effective use of aid resources increasing growth. However, we have pointed out that our estimate of indirect effects is crude, so we show two estimates of total efficiency effects – one excluding and one including this estimate. Our estimate of what the gains from an ambitious application by the EU of these dimensions of the Paris agenda would for 2009 have been in the range €3.2 to €5 billion.
However, we have also made an estimate of the effect of a coordination of the country allocation of EU aid with the aim of sharpening the poverty focus. This estimate at close to €8 billion is higher than the sum of all the other effects we measure, but since we think that the political support for such a dramatic change in country allocation is not there we report it separately.
The Aid Effectiveness Agenda: The benefits of going ahead
Final Report - Contract nr. 2010/256898 Page 140 of 169
13. In search of an optimal aid system for the EU
13.1. Introduction
In this report we have tried to assess the magnitude of the potential gains from a full implementation of the Paris agenda, that is the Paris Declaration and the Accra Accord for Action. The summary of our estimates in the previous chapter showed that the economic gains would be very substantial. In this chapter we seek to draw out some implications of our analysis. The first one relates to what aid policies should be changed and coordinated. We discuss the relative importance of different policy changes and the political feasibility of the proposed changes. The second question is how this should be organized and in particular what role the Commission should play in the aid activities of the EU.
13.2. Implied policy changes
There has for some years been a fairly widespread agreement among researchers about what good donor practices are, which was reflected in the Paris Declaration and the Accra Agenda for Action. For example, Easterly and Pfutze (2008) discuss what best practice among donors is and how an ideal aid agency should be organized. They identify four dimensions. (1) Specialization measuring the extent to which aid is non-fragmented among too many donors, too many countries, and too many sectors. (2) Selectivity in country choice meaning avoiding corrupt countries and going to poor countries. (3) Ineffective aid channels, which they define as the extent to which aid is tied to political objectives and the extent to which it is food aid or technical assistance. (4) Overhead costs measuring the cost of administering the aid.45 Also Knack, Rogers and Eubank (2010) accept the same consensus view as Easterly and Pfutze (2008) as to what is best practice among donors.46 The recommendations of the recent DAC evaluation (Wood et al., 2011) are also in line with the previous work. That study argues for a deepened adherence to the principles of country ownership, alignment and harmonization of donor support, and transparency and mutual accountability in tracking and achieving results. It suggests that one should add shared risk management to this framework of principles. The results of our analysis are in line with the literature and we do not suggest any major changes in the general perspective of the Paris Declaration. Our contribution is that we assess the magnitude of the benefits that different changes could generate.
The first area that stands out in our analyses is Harmonisation. Under this heading we first show that major cost savings can be achieved if donors concentrate their aid efforts to fewer countries and to more general forms of aid transfers, e.g. General Budget Support. This is an economically credible result. There are some political problems associated with this proposal, since it would mean that major countries would have to abandon certain countries, while they may feel that they have a political interest in showing presence there. One way of at least preserving an EU presence in all countries, while still reducing the number of players in each country, is of course to channel money though the joint channel, that is the EU Commission. To focus the assistance on more general forms of aid may be politically easier than to drop countries but donors may be reluctant to go for general forms of aid when they are uncertain about the quality of governance. Still, it is not self-evident that the quality of governance is less important for project support than general budget support.
45 As far as operating costs go they argue that donors are not very transparent. From their own discussion under these four headings they conclude that they largely agree with the consensus in the literature and among donor as indicated in the Paris Declaration. 46 Knack et al. (2010) look at the following aspects when constructing their aid quality indictor: (1) Aid selectivity or policy and poverty selectivity. (2) Aid alignment with country systems. (3) Aid predictability. (4) Untied aid.
The Aid Effectiveness Agenda: The benefits of going ahead
Final Report - Contract nr. 2010/256898 Page 141 of 169
The second aspect of harmonization concerns the coordination of the country allocation of aid. Here we analyse the scope for achieving more effective poverty reduction by letting the allocation of EU aid be determined wholly by the extent of poverty reduction that could be achieved in different countries. According to our estimates, which take the effect of differences in the quality of governance into account, such a country allocation would imply a huge improvement in poverty reduction results. However, since the proposed allocation has not emerged from the political system of the donors as yet, we must assume that such a reallocation would have high “political costs”. On the list of countries that would benefit from the reallocation we do find countries, which are not major economic partners of the EU, nor have a strong strategic value. Thus, such a reallocation of aid would mean that EU goes all the way to an allocation that is purely altruistic and is not in any way governed by self-interest (apart from the long-term self-interest of eradicating poverty and thereby creating a more stable world). We do not expect that all the EU countries would be willing to make the full adjustment, but we still think it is appropriate to point out what the costs are in terms of poverty reduction foregone of sticking to the current allocation.
The second major area for continued reforms relates to Ownership and Alignment. We have found that there is a positive effect on growth from shifting towards more of general forms of aid, such as General Budget Support. As long as a recipient government pursues a credible policy, donors should continue to seek to align aid to recipient policy. However, when policies are not acceptable donors will want to adjust their aid strategy. They can cease giving aid to the country in question, use non-government channels for aid, or try to change government behaviour with the help of conditions. But when seeking to channel resources through a government it makes sense to see to it that this is integrated within the regular system of government, even if that increases the risk of misappropriation. It is important for sustainable development that aid helps build a viable governance structure, and that is not done by using parallel structures. That donors currently seem less willing to accept the risks of using government structures is a concern.
The other dimension that is relevant here relates to the untying of aid. This is unproblematic and it is hard to find any strong arguments against it. The argument against untying would be that tying benefits donors themselves and reduces their cost of the aid transfer. But they could then instead reduce the aid allocation to an amount equivalent to the extra costs that tying implies. Given that the donors really want to give effectively what they have set aside in their budgets, aid should be untied. The estimates we provide are of course approximate, but there is no doubt that major benefits would be realized. So this recommendation is the least problematic in that respect.
The value of predictability of aid has been computed with the help of a theoretically advanced model requiring a large set of assumption, but it seems certain that the estimates pick up a problem that is highly relevant. Our estimate of the gain from predictability is conservative, and that recipients would benefit greatly from more stable aid flows is not in dispute. The political challenge here rather relates to the issue of what is required for donors to be able and willing to guarantee stable aid flows. On the one hand there are the constraints implied by domestic budget procedures, which mean that there are limitations as to what can be promised. Donors could of course try to make agreements covering several years, but it is not clear for how long such agreements could be entered into in a way that reassures the recipients that the money will be forthcoming. And this leads us to the next problem with regard to the stability of aid flows (the CPA component), and this is the problem that there may be unexpected revelations of bad governance or corruption in the partner countries. The donors would then want to adjust its aid stance, which may be harder if there is a long-term agreement. So in the end there are major gains to be had if aid is more predictable, but to make aid contracts longer one may need to have conditions associated to them specifying what should be done in case there are instances of inappropriate behaviour.
When it comes to the issue of improving mutual accountability, transparency and learning we do not have any estimates that pick up this effect separately, but these aspects are interrelated to the themes we have already covered. Accountability and transparency should be there on both sides of the transactions, but presumably it is a greater concern with regard recipient countries. Transparency is clearly a necessary ingredient in the governance set-up if the donors are to be willing to provide more general forms of aid, that is accept a higher degree of ownership (which we have assumed is a good thing). It is therefore essential that the budget processes are transparent and that it is possible to follow the money flows to the final
The Aid Effectiveness Agenda: The benefits of going ahead
Final Report - Contract nr. 2010/256898 Page 142 of 169
beneficiaries. Given that there is more transparency and accountability, the donors would find it easier to accept more general forms of aid that leave decisions about the use of resources more fully in the hands of the recipient governments. Increased recipient control of the policy making process will also lead to more learning.
This leads us naturally to the final main item, that of conditionality. We have not provided any quantitative estimate of the value of reduced conditionalities, but we have provided an extensive theoretical discussion of the issues relating to conditionality. We argued that one should apply some form of conditionality to recipient countries whose leaders may exploit private information and that a number of benefits can be generated in this context by aid coordination. Donor would be helped if they could put in place a specialized agency or mechanism able to collect information about the governance characteristics of the potential recipients, and to circulate information among donor members. Aid coordination could allow for a more effective implementation of conditionalities and in a format that reduces the transaction costs involved on the recipient government side.
13.3. The role of the Commission in EU aid coordination
The results of our analyses indicate that there is a lot to gain from a full(er) implementation of the Paris agenda.47 The question is what form this should take and in particular what role the Commission should play relative to the member countries.
We have indicated that much can be gained by coordinating aid between the EU Commission and member states. One way to bring about increased coordination would be to increase the role of the Commission. This can be increased in two ways. Either the member countries can decide to channel more of their aid through the Commission, or it can provide tighter coordination of the aid of the EU member states?
We have found that large positive effects in terms of poverty reduction effects could be achieved with a coordination of country allocation, and that does not necessarily require channelling resources through the Commission (even if that would be one way of doing it). It would be enough if countries jointly decide about the country allocation of their aid, and it might seem natural that the negotiations are organized by the Commission.
Increased predictability is much harder to organize in a decentralized fashion, since all the donor countries have their own political and budgetary processes. This would be easier to handle if aid was channelled through the Commission, since there would essentially be one process to try to stabilize. But there are of course also other considerations that countries take into account when they decide on the fraction of their aid that they want to channel through the Commission.
The third dimension which is the untying of aid does not require coordination. It is just a matter of doing it! But peer pressure, e.g. through the Commission, could help to advance the process.
Finally, reductions in transaction costs would probably be easier within one structure, but again the bilateral donors also have other considerations to take into account. Steps to organise a division of labour should anyway be beneficial, and maybe the Commission could be a broker in this process.
47 There is an ongoing debate about the role and importance of coordinated policy making generally within the EU. See Sapir (2007) for a set of analyses.
The Aid Effectiveness Agenda: The benefits of going ahead
Final Report - Contract nr. 2010/256898 Page 143 of 169
Apart from the issues dealt with in this study there, there may sometimes be other reasons for choosing the Commission route rather than the bilateral route. Some types of aid might be better handled for political reasons in a multilateral setting.48 The new Directorate–General responsible for EU development policies is intended to improve policies, enhance policy coherence, and improve implementation and delivery mechanisms.49 In a recent Communication from the Commission it spells out a 12-point EU action-plan in support of the Millennium Development Goals (EC, 2010, 159). In this plan it envisages improved coordination among EU-donors, and specifies the following goal (p. 5):
“Strengthen EU accountability mechanism: based on Member States’ annual action plans and the Commission’s monitoring report, the Council should hold a EUinternal ‘ODA Peer Review’ and report the results to the European Council. These action plans need to outline at least the planned ODA spending for the next budgetary year and estimates for the remaining years until 2015.”
More specifically on aid effectiveness it is stated (p. 6) that
“Progressively bring together the timing of national and EU programming cycles at partner country level by 2013 and use the joint programming framework to share development priorities and objectives in developing countries to avoid duplication and overlap;
– Use the common timing and build upon the joint programming framework to develop European country strategy papers and multi-annual programmes, as has been done by the EU for Haiti, thus meeting our commitment to deliver on aid effectiveness and predictability to partner countries;
– Within the existing Aid Effectiveness Operational Framework, improve EU Division of Labour not just in, but also across recipient countries (notably by ensuring its neutral impact on aid volumes, addressing the orphan's gap issue8, and introducing a systematic process for sharing information); and establish a common EU approach for implementing commitments on mutual accountability and transparency, to be then promoted broadly;
– Encourage other donors – including emerging – to apply the aid effectiveness agenda.”.
This quote suggests that there is an ambition in the Commission to improve coordination, and it is spelled out more or less as an implementation of the PA and the AAA. Even if these steps are taken, there is no guarantee that the proposed structure will function smoothly. The steps proposed are in line with our arguments, but how effective the implementation will be remains to be seen. And we have noted that there is a certain PA fatigue among the bilaterals. So the political costs of reduced donor ownership of their aid policies may remain a severe brake on closer coordination.
48 Key policy areas that are relevant when it comes to policy coherence within the EU include agricultural policy and trade policies, but also policies on climate change, global food security, migration and security are important (EC, 2010, 421).. 49 The Community formulates strategy papers and annual action programmes, on the basis of which it delivers budget support, grants and contracts. The Community assistance priorities are identified in General Strategy Papers such as Country Strategy Papers or Regional Strategy Papers for the ACP countries and other non-EU countries and Regional Strategy papers. Then there are indicative programmes covering several years and Annual Action Programmes for each year. For the period up to 2013 the EC has three set of “geographic” instruments, namely Development Cooperation instrument, European Neighbourhood instrument and the European Development Fund. There are also some thematic instruments focusing on e.g. the MDGs, which supplement the geographically-based EU aid.
The Aid Effectiveness Agenda: The benefits of going ahead
Final Report - Contract nr. 2010/256898 Page 144 of 169
References
Acemoglu, D., S. Johnson and J.A. Robinson (2001). “The Colonial Origins of Comparative Development: An Empirical Investigation.” American Economic Review 91(5): 1369–1401.
Acemoglu, D., S. Johnson and J.A. Robinson (2002), “Reversal of Fortune: Geography and Institutions in the Making of the Modern World Income Distribution”. Quarterly Journal of Economics 117(4): 1231-1294.
Acemoglu, D and S. Johnson (2007), “Disease and development: the effect of life expectancy on economic growth”, Journal of political economy 115 (6): 925-985
Adam, C. et al. (2004), “Performance-Based Conditionality: A European Perspective”, World Development 32(6): 1059-70.
Agénor, P.-R., and J.Aizenman (2010), “Aid Volatility and Poverty Traps”, Journal of Development Economics 91(1): 1-7.
Annen, K. and S. Kosempel (2009), “Foreign Aid, Donor Fragmentation and Economic Growth”, The B.E. Journal of Macroeconomics 9(1): Article 33.
Aoki, Masao. 2001. Toward a Comparative Institutional Analysis. Cambridge, Mssts & London: The MIT Press.
Arndt, C., S. Jones and F. Tarp (2010), “Aid, growth, and development, have we come full circle?”, Journal of globalization and development, Vol 1: Iss. 2, Article 5
Aryeetey, E., Osei, B., and Quartey, P. (2003) Does Tying Aid make it More Costly? A Ghanaian Case Study. Paper presented at the workshop on Quantifying the Impact of Rich Countries’ Policies on Poor Countries, 23–24 October. Washington, D.C., Center for Global Development and the Global Development Network.
Ashraf, Q. H., A. Lester and D. N. Weil (2008), When does improving heath raise GDP?, NBER working paper 14449
Azam, J.P., and J.J. Laffont, (2003), “Contracting for Aid”, Journal of Development Economics, Vol. 70, pp. 25-58.
Balgun, P. (2005), Evaluating Progress Towards harmonisation, DFID Working Paper 15, London.
Barrett, C. B. and Maxwell, D. (2005) Food aid after fifty years. London, Routledge.
Bazzi, Samuel and Michael A. Clemens, 2009, Blunt instruments: a cautionary note on establishing the causes of economic growth, Global centre for development, working paper 2009:171
Berlin, A., Resare, N. (2005), The European Community’s External Actions. A Development Perspective, Sida, Stockholm.
Berthélemy, J.-C. (2006a), “Bilateral Donors’ Interests vs. Recipients’ Development Motives in Aid Allocation: Do All Donors Behave the same?”, Review of Development Economics 10(2): 179-94.
Berthélemy, J.-C. (2006b), “Aid Allocation: Competing Donors’ Behaviour”, Swedish Economic Policy Review, forthcoming.
Besley, T. and T. Persson (2010), “The Origins of State Capacity: Property Rights, Taxation, and Politics”; American Economic Review 99(4): 1218-44.
Bigsten, A. (2006), “Coordination et utilisations des aides”, Revue d'Economie du Developpement, no 2, 2006.
Bigsten, A. (2007), “EU Development Policy: The Way Forward”, i A. Sapir (red.), The Fragmented Power, Bruegel, Brussels
Birdsall, N. and H. Kharas (2010), Quality of Official Development Assistance Assessment, Centre for Global Development, Washington DC.Boone, P. (1996), “Politics and the Effectiveness of Foreign Aid.” European Economic Review, 40(2): 289–329.
The Aid Effectiveness Agenda: The benefits of going ahead
Final Report - Contract nr. 2010/256898 Page 145 of 169
Boltho, A., Tonniolo, G. (2000), “The Assessment of the Twentieth Century – Achievements, Failures, Lessons”, Oxford Review of Economic Policy 15(4): 1-17.
Bourguignon, F. (2000) “The pace of economic growth and poverty reduction”, mimeo, DELTA, Paris
Bourguignon, F. and M. Sundberg (2007) “Aid Effectiveness—Opening the Black Box” American Economic Review, 97(2): 316-321.
Bourguignon, F., and J.P. Platteau (2011). “Aid Effectiveness Revisited: The Trade-Off Between Needs and Governance”, Working Paper, Paris School of Economics and Centre for Research in the Economics of Development (CRED), University of Namur, Belgium.
Brown, A., F. Naschold, T. Conway, and A. Fozzard (2000) Aid Transaction Costs in Viet Nam. Centre for Aid and Public Expenditure (CAPE), Overseas Development Institute, London.
Bulir, A., Hamann, A. (2006) “Volatility of Development Aid: From the Frying Pan into the Fire?,” IMF Working Papers, 06/65.
Burnside, C. and D.. Dollar (2000), “Aid, Policies, and Growth.” American Economic Review, 90(4): 847–68.
Cavalcanti, C. (2007), Reducing the Transaction Costs of Development Assistance: Ghana’s Multi-Donor Budget Support (MDBS) Experience from 2003 to 2007, World Bank Policy Research Working Paper No. 4409, Washington DC.
Clay, E.J., M. Geddes and L. Natali (2009), Untying Aid: Is it working? An Evaluation of the Implementation of the Paris Declaration and of the 2001 DAC Recommendation of Untying ODA to the LDCs, Copenhagen.
Clemens, Michael, and Steven Radelet, 2003, “Absorptive Capacity: How Much Is Too Much,” in Challenging Foreign Aid: A Policymaker's Guide to the Millennium Challenge Account ed. by Steven Radelet (Washington: Center for Global Development).
Clemens, M.A., S. Raddled and R. Bhavnani (2004), “Counting Chickens When They Hatch: The Short-Term Effect of Aid on Growth.” Center for Global Development Working Paper 44.
Collier, P. (2006), “Africa: An Agenda for Decisive Change”, Swedish Economic Policy Review 13(2): 169-204.
Collier, P. (2007). The Bottom Billion –Why the Poorest Countries Are Failing and What Can Be Done About It?, Oxford: Oxford University Press.
Collier, P. and D. Dollar (2002), “Aid Allocation and Poverty Reduction”, European Economic Review 29(11): 1787-1802.
Collier, P. and A. Hoeffler (2004), “Aid Policy and Growth in Post-conflict societies”, European Economic Review 48(5): 1125-45.
Dalgaard, C-J., H. Hansen and F. Tarp (2004). "On The Empirics of Foreign Aid and Growth," Economic Journal 114: F191-F216
Dearden, S. (2002), Does the European Union's Development Policy Have Any Future?, Discussion Paper No 24, European Development Policy study Group, Development Studies Association.
Desai, R.M. and H. Kharas (2010), The Determinants of Aid Volatility, Global Economy and Development Working Paper No 42, Brookings, Washington DC.
DFID (2011), Multilateral Aid Review, Taking Forward the Findings of the UK Multilateral Aid Review, London
Djankov, S. J.G. Montalvo and M. Reynal-Querol (2008), “The Curse of Aid.” Journal of Economic Growth, 13(3): 169–94.
Easterly, W. (2006), The White Man’s Burden. Why the West’s Efforts to Aid the Rest Have Done So Much Ill and So Little Good, The Penguin Press, New York.
Easterly, W. (2007), “Are Aid Agencies Improving?”, Economic Policy, 52: 633–68, 675–78
Easterly, W. (2009), “Can the West Save Africa?”, Journal of Economic Literature 47(2): 373-447.
Easterly, W., R. Levine and D. Roodman (2004). “Aid, Policies, and Growth: Comment.” American Economic Review, 94(3): 774–80.
The Aid Effectiveness Agenda: The benefits of going ahead
Final Report - Contract nr. 2010/256898 Page 146 of 169
Easterly, W. and T. Pfutze (2008); “Where Does the Money Go? Best and Worst Practices in Foreign Aid” Journal of Economic Perspectives, 22(2): 29–52
Ebrahim, Alnoor (2003), “Accountability in Practice: Mechanisms for NGOs.” World Development 31 (5): 813-29.
Edwards, Michael, and David Hulme, eds., (1996). Non-Governmental Organisations –Performance and Accountability: Beyond the Magic Bullet London: Earthscan Publications Ltd.
European Commission (2006), The European Consensus on Development, 2006C 46/01), Brussels.
European Commission (2009), Aid Effectiveness Agenda: Benefits of a European Approach, Brussels.
European Commission-OECD (2006), EU Donor Atlas 2006, vol. 1, Brussels and Paris.
European Parliament, Council, Commission (2006) The European *Consensus on Development, Joint statement by the Council and the representatives of the governments of the Member States meeting with the Council, the European Parliament and the Commission on European Union Development Policy, 24.2.2006
EC (2010), Communication from the Commission to the European Parliament, the Council, The European Economic and Social Committee, and the Committee of the Regions. A twelve-point EU action plan in support of the Millennium Development Goals, Brussels, 21.4.2010 COM(2010)159 final
EC (2010), Commission Staff Working Document. Policy ‘Coherence for development Work Programme 2010-2013, Brussels, 21.4.2010, SEC(2010)421 final
Fielding, D., and G. Mavrotas (2011), The volatility of aid, Working Paper, University of Otago.
Frot, E. and J. Santiso (2010), Crushed Aid: Fragmentation in Sectoral Aid, Working Paper No 284, OECD Development Centre, Paris.
Gaspart, F., and J.P., Platteau (2011), “Is Cheap Aid Good for the Poor?”, Working Paper, Centre for Research in the Economics of Development (CRED), University of Namur, Belgium.
Gaus, A, J. Steets, A. Binder, C.B. Barrett and E.C. Lentz (2011), How to reform the outdated Food Aid Convetnion, Policy Brief No 1, ActionAid.
Government of Uganda (2011), Phase II Implementation of the Paris Declaration in Uganda. Final Report, JIMAT Development Consultants, 3rd of January 2011.
Greif, Avner (1989), “Reputation and Coalitions in Medieval Trade: Evidence on the Maghribi Traders.” Journal of Economic History (49) 4: 857-82.
Greif, Avner (1994), “Cultural Beliefs and the Organization of Society: A Historical and Theoretical Reflection on Collectivist and Individualist Societies.” Journal of Political Economy 102 (5): 912-50.
Hall, R. and C. Jones (1999), ”Why Do Some Countries Produce So Much More Output Than Others?”, Quarterly Journal of Economics 114(1): 83–116.
Hoeffler, A., and V. Outram (2008), Need, Merit or Self-Interest – What Determines the Allocation of Aid?, CSAE Working Paper No 2008-19, Oxford.
Jepma, C. J. (1991) The tying of aid, Paris, OECD
Kanbur, R. (2000), “Aid, conditionality and debt in Africa”, in F. Tarp (ed.), Foreign Aid and Development, Routledge, London and New York.
Kanbur, R. (2003), “The Economics of International Aid”, paper prepared for the Handbook on “The Economics of Giving, Reciprocity, and Altruism”, edited by Serge Christophe-Kolm and Jean Mercier-Ythier, North-Holland.
Kangoye, T. (2011) “Aid and Governance: When Aid Unpredictability Increases Corruption in Recipient Countries,” Working paper, CERDI, University of Auvergne.
Kaufmann, D., A. Kraay, and P. Zoido-Lobatón (1999), “Governance matters”, Working paper no. 2196, World Bank, Washington DC.
The Aid Effectiveness Agenda: The benefits of going ahead
Final Report - Contract nr. 2010/256898 Page 147 of 169
Kaufmann, D., A. Kraay, and M. Mastruzzi (2009), Governance matters VIII: Aggregate and Individual Governance indicators 1996.-2008, Policy Research Working Paper No 4978, World Bank, Washington DC.
Kaufmann, D., A. Kraay, and M. Mastruzzi (2010), The Worldwide Goverannce Indicators. Methodology and Anaytical Issues, Policy Research Working Paper No 5430, World Bank, Washington DC.
Kharas, H. (2008) “Measuring the Cost of Aid Volatility,” Wolfensohn Center for Development, Working Paper No. 3.
Knack, S. (2004), “Does Foreign Aid Promote Democracy?” International Studies Quarterly, 48(1): 251–66.
Knack, S., F.H. Rogers and N. Eubank (2010), “Aid Quality and Donor Rankings”, Policy Research Working Paper 5290, World Bank, Washington DC
Knack, S. and A. Rahman (2007), “Donor Fragmentation and the Bureaucratic Quality in Aid Recipients”, Journal of Development Economics, 93(1): 176-195.
Kurtz, M.J. and A. Shrank (2007), Growth and Governance: Models, Measures and Mechanisms, Journal of Politics, 69(2)
Le Prétoire (2011), “Projet d’appui au développement de la justice (Prodej)”, 14/02/2011, [En ligne], URL : http://www.maliweb.net/category.php?NID=71122
Lentz, E.C. and C.B. Barrett (2008), “Improving Food Aid: What Reforms Would yield the highest Payoff?”, World Development, 36(7): 1152-1172.
Mali APD 2001, « Harmonisation de l’Aide au Mali », URL : http://www.mali-apd.org/
Milgrom, Paul, Douglass North and Barry Weingastn (1990). “The Role of Institutions in the Revival of Trade : The Law Merchant, Private Judges, and the Champagne Fairs.” Economics and Politics 2 (1): 1-23.
Ministère de l’Economie et des Finances (MEF), SG, SHA (2011), “Rapport Final - Evaluation nationale de la mise en œuvre de la Déclaration de Paris (phase 2)”, groupement Bac +/ADERC.
Minoui, C. and S.G. Reddy (2009), Development Aid and Economic Growth: A Positive Long-Run Relation, IMF Working Paper 09/118, Washington DC.
Nielsen, R. A., Findley, M. G., Davis, Z. S., Candland, T. and Nielson, D. L. (2011), “Foreign Aid Shocks as a Cause of Violent Armed Conflict,” American Journal of Political Science 55: 219–232.
Odén, B., Wohlgemuth, L. (2011), Where is the Paris Agenda heading? Changing Relations in Tanzania, Zambia and Mozambique, ECPDM Briefing Note No 21, February
OECD (2006) ‘DAC Recommendation on untying Official Development Assistance to the least developed countries. Amended. Paris.
OECD (2008), Better Aid. 2008 Survey on Monitoring the Paris Declaration. Making Aid More Effective by 2010, Paris.,
OECD (2009a), Sweden: Development Assistance Committee (DAC) Peer review, Paris
OECD (2009b), 2009 OECD Report on the Division of Labour: Addressing Fragmentation and Concentration of Aid Across Countries, Paris
OECD (2009c); Implementation of the 2001 DAC Recommendation on Untying Aid to the LDCs, 2009 Review. Background document to the OECD High-Level meeting of 27-28 May 2009, Paris.
OECD (2010a), Aid Architecture and Financing, 2010 OECD Report on Aid Predictability: Survey of Donors’ Forward Spending Plans 2010-2012. Paris, December 2010.
OECD (2010b), Development Co-Operation Report 2010, DAC, Paris.
OECD (2010c), DAC statistical reporting directive, DAC, Paris.
Riddell, R. C. and Stevens, S. (1997) Evaluation of Commonwealth Fund for Technical Co-operation (CFTC) to Uganda, London: Strategic Planning and Evaluation Unit, Commonwealth Secretariat.
Platteau, Jean-Philippe (2000). Institutions, Social Norms, and Economic Development. London: Harwood Academic Publishers.
The Aid Effectiveness Agenda: The benefits of going ahead
Final Report - Contract nr. 2010/256898 Page 148 of 169
Platteau, J-P: (2004), “Monitoring Elite Capture in Community-Driven Development”, Development and Change, 35(2): 223-46
Platteau, J.P. (2004), “Decentralized Development as a Strategy to Reduce Poverty”?, in: Agence Française de Développement, “Poverty, Inequality and Growth”, Proceedings of the AFD-EUDN Conference, 2003, Paris, pp. 253-330.
Platteau, J-P: (2009), “”Institutional obstacles to African economic Development: State, ethnicity, and custom”, Journal of Economic Behavior & Organization 71(3): 669-89.
Quality of Government Institute (2010), Measuring the Quality of Government and Subnational Variation. Report for the European Commission, Directorate-General Regional Policy, Directorate Development Policy, Prepared by the QoG Institute, University of Gothenburg.
Rajan, R. and A. Subramanian (2008).“Aid and Growth: What Does the Cross-Country Evidence Really Show?” Review of Economics and Statistics, 90(4): 643–65.
Riddell, R. C. and Stevens, S. (1997) Evaluation of Commonwealth Fund for Technical Co-operation (CFTC) to Uganda, London: Strategic Planning and Evaluation Unit, Commonwealth Secretariat.
Rodrik, D. (2000), "Institutions for High-Quality Growth: What They Are and How to Acquire Them," Studies in Comparative International Development 35(3).
Rodrik, D. (2007). One Economics, Many Recipes: Globalization, Institutions, and Economic Growth, Princeton University Press.
Rodrik, D., A. Subramanian and F. Trebbi (2004). “Institutions Rule: The Primacy of Institutions over Geography and Integration in Economic Development”. Journal of Economic Growth 9(2):131-165.
Rogerson, A. (2005) ‘Aid Harmonization and Alignment: Bridging the Gaps between Reality and the Paris Reform Agenda’, Development Policy Review 23(5): 531-52.
Roodman, D. (2007), Macro Aid Effectiveness Research: A Guide for the Perplexed, Working Paper no 134, Centre for Global Development, Washington DC
Roodman, David, 2008, Through the looking glass, and what OLS found there: on growth, foreign aid, and reversed causality, Global centre for development, working paper 2008:137
Roodman, D. (2009), “An Index of Donor Performance”, Centre for Global Development Working Paper 67, Washington DC.
SADEV (2008), Challenges, opportunities and approaches for increasing joint donor programming of evaluations, Survey Report 2008:8, Karlstad, 2008.
SADEV (2010), Evaluation of Sweden’s Implementation of the Paris Declaration, SADEV Report 2010:6
Sapir, A. (Ed.) (2007), The Fragmented Power, Bruegel, Brussels.
Selaya, P. and R. Thiel (2009), “The Impact of Aid on Bureaucratic Quality: Does the Mode of Delivery Matter”, Kiel Working Paper 1494, Kiel Institute for the World Economy, Kiel.
Sida (2011), Sida Årsredovisning 201, Stockholm, p. 185-188.
Svensson, J. (2000a), “When is Foreign Aid Policy Credible? Aid Dependence and Conditionality”, Journal of Development Economics, Vol. 61, N° 1, pp. 61-84.
Svensson, J. (2000b) “Foreign aid and rent-seeking,” Journal of International Economics 51(2): 437-461.
Svensson, J. (2003), “Why Conditional Aid Does Not Work and What Can Be Done About It?” Journal of Development Economics, 70(2): 381–402.
Svensson, J. (2006), “The Institutional Economics of Foreign Aid”, Swedish Economic Policy review 13(2): 115-138.
Tan, C. (2011), The new disciplinary framework: Conditionality, new aid architecture and global economic governance, in Faundez, J. and Tan, C. (eds.), International Law, Economic Globalization and Developing Countries, Edward Elgar, Cheltenham.
Thomas, M. (2009), What Do the Worldwide Governance Indicators Measure?, European Journal of Development Research
The Aid Effectiveness Agenda: The benefits of going ahead
Final Report - Contract nr. 2010/256898 Page 149 of 169
Torsvik, G. (2005), “Foreign Economic Aid: Should Donors Cooperate?”, Journal of Development Economics, Vol. 77, pp. 503-15.
Uganda, Republic of (2011), Phase II Implementation of the Paris Declaration in Uganda. Final Report, JIMAT Development Consultants, 3rd of January 2011.
Wood, B. et al (2011), The Evaluation of the Paris Declaration: Phase 2, Final Report, Copenhagen
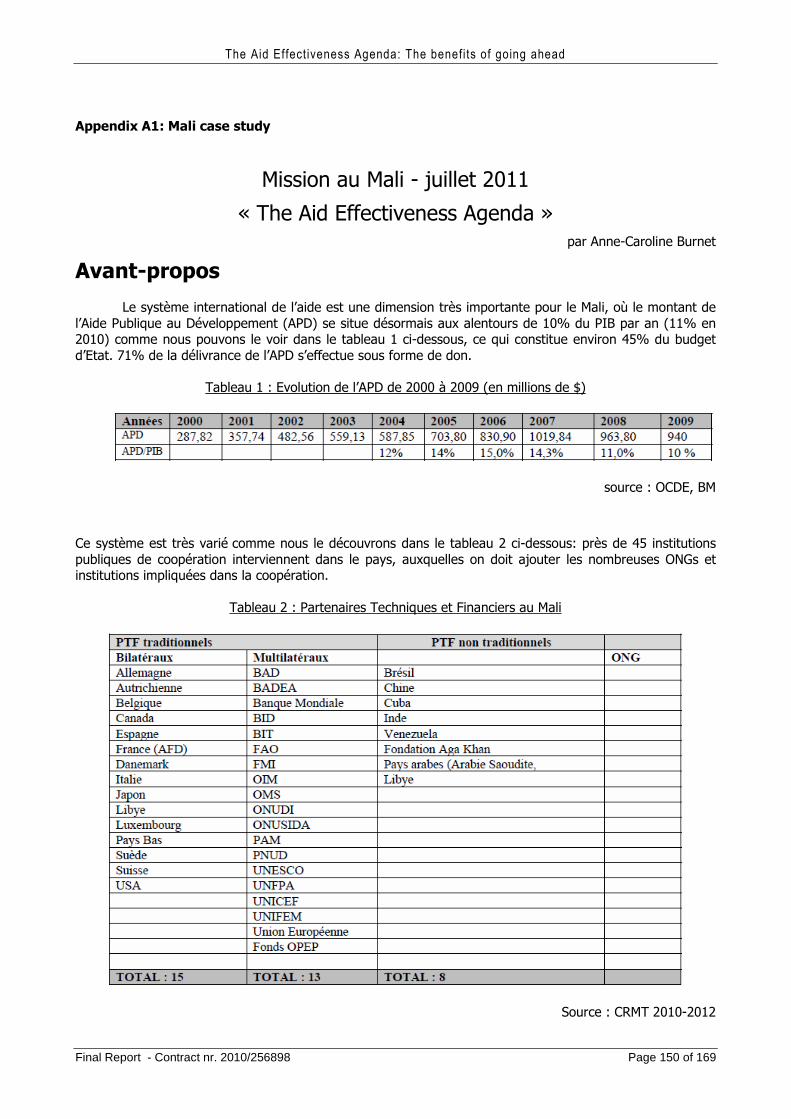
The Aid Effectiveness Agenda: The benefits of going ahead
Final Report - Contract nr. 2010/256898 Page 150 of 169
Appendix A1: Mali case study
Mission au Mali - juillet 2011
« The Aid Effectiveness Agenda » par Anne-Caroline Burnet
Avant-propos
Le système international de l’aide est une dimension très importante pour le Mali, où le montant de l’Aide Publique au Développement (APD) se situe désormais aux alentours de 10% du PIB par an (11% en 2010) comme nous pouvons le voir dans le tableau 1 ci-dessous, ce qui constitue environ 45% du budget d’Etat. 71% de la délivrance de l’APD s’effectue sous forme de don.
Tableau 1 : Evolution de l’APD de 2000 à 2009 (en millions de $)
source : OCDE, BM
Ce système est très varié comme nous le découvrons dans le tableau 2 ci-dessous: près de 45 institutions publiques de coopération interviennent dans le pays, auxquelles on doit ajouter les nombreuses ONGs et institutions impliquées dans la coopération.
Tableau 2 : Partenaires Techniques et Financiers au Mali
Source : CRMT 2010-2012
The Aid Effectiveness Agenda: The benefits of going ahead
Final Report - Contract nr. 2010/256898 Page 151 of 169
8 Etats membres de l’Union Européenne sont donc présents au Mali, en plus de la Délégation de l’Union Européenne. Cette dernière faisait partie des 5 bailleurs principaux en 2009, avec les Etats Unis, la Banque Africaine de Développement, la Banque Mondiale et la Chine.
L’efficacité de l’aide peut malheureusement être affectée par la difficulté de gestion et de coordination d’un tel système, véritables enjeux dépassant les capacités du pays. L’importance numérique des PTF appuyant les stratégies nationales de développement et l’apparition de PTF non traditionnels avec des pratiques jugées plus souples nécessite une réelle capacité de gestion du gouvernement en faveur de ses priorités et intérêts nationaux. Le Mali fait face au défi d’unir les donateurs autour d’une stratégie conjointe et accorde une attention particulière au renforcement des processus de coordination et d’harmonisation entre donateurs afin d’utiliser l’aide de manière plus efficace.
Le pays été sélectionné par le Comité d’Aide au Développement de l’OCDE comme pays pilote pour initier une revue de l’efficacité de l’aide en 1996. Dans ce cadre, plusieurs démarches visant les réformes de l’aide ont été entreprises et des mécanismes institutionnels ont été adoptés par le gouvernement et les bailleurs. Des instances de concertation ont notamment été mises en place et se sont révélées être des endroits privilégiés pour le dialogue, le partage d’information ainsi que pour la coordination des bailleurs.
Des innovations ont été perceptibles dans les pratiques d’aide au développement depuis 2002, notamment en association avec la coordination et le suivi de la mise en œuvre du Cadre Stratégique de Lutte contre la Pauvreté (CSLP) pour la période 2002-2006. Les donateurs ont aligné leur aide sur celui-ci, et le gouvernement a discuté périodiquement avec eux de l’état d’avancement de cette stratégie. Depuis son adoption, une commission mixte, lieu de partage d’information plutôt que lieu formel de coordination, a en effet réuni le gouvernement et les partenaires techniques et financiers de manière régulière.
La déclaration de Paris et l’efficacité de l’aide Par la suite, l’adoption (en mars 2005) et la mise en œuvre de la Déclaration de Paris (DdP) au Mali
a généré des résultats tangibles dans plusieurs domaines. Elle a en effet abouti à une meilleure coordination de l’aide, à un dialogue renforcé entre le gouvernement et les partenaires techniques et financiers (PTF) ainsi qu’à l’émergence de cadres conjoints de concertation. Le rapport d’évaluation nationale de sa mise en œuvre mentionne également une meilleure prévisibilité de l’aide et une meilleure division du travail, mais ces éléments sont plus controversés.
Une évolution positive s’est également fait ressentir dans la mise en œuvre des engagements pris, bien que l’on note la persistance de certaines difficultés. L’examen des résultats obtenus par l’évaluation montre que la DdP a créé une dynamique et a favorisé l’efficacité de l’aide grâce aux changements de comportements induits chez les PTF. Ceux-ci ont effectivement fait des efforts d’harmonisation et de coordination de leurs procédures ainsi que d’alignement sur les systèmes du pays, visibles plus particulièrement dans les secteurs de la santé et de l’agriculture.
De nombreuses innovations se sont donc fait sentir dans les pratiques et plusieurs mesures, stratégies et cadres opérationnels ont été adoptés par le Mali et/ou les PTF suite à la DdP. Parmi ceux-ci on trouve :
• Le Cadre Stratégique pour la Croissance et la Réduction de la Pauvreté (CSCRP) : adopté par le gouvernement en 2006 pour la période 2007-2011, il a succédé au CSLP comme cadre de référence unique et fédérateur des politiques et stratégies de développement du Mali et il incarne le principal instrument de négociation avec l’ensemble des PTF. On a pu observer des acquis indirects en matière de coordination dans le cadre du CSLP et du CSCRP, comme les réunions de la Commission Mixte, les efforts de quelques bailleurs pour coordonner les procédures de suivi conjoint du CSCRP, mettre en place des ententes de cofinancement et des
The Aid Effectiveness Agenda: The benefits of going ahead
Final Report - Contract nr. 2010/256898 Page 152 of 169
initiatives de coopération déléguée ou encore tout simplement un réel effort vers l’alignement des activités de développement via la volonté affirmée des acteurs de
développement de faire du CSCRP un cadre unique de référence. La mise en œuvre
effective du CSCRP donne donc une occasion au Mali de travailler de manière commune
avec les PTF et de rationaliser les activités pour atteindre les économies de coûts de
transaction.
• L’Arrangement Cadre relatif aux appuis budgétaire généraux, mais également des Arrangements spécifiques relatifs aux appuis budgétaires sectoriels en faveur des secteurs de la santé et de l’éducation, ont été signés en 2006 par le gouvernement et 6 partenaires au développement. Ce protocole d’accord sur un cadre conjoint d’appui budgétaire a été renouvelé en 2010 avec la participation de 14 donateurs50. Il spécifie que la coordination doit être conduite par le gouvernement, le calendrier compatible avec le cycle budgétaire, les conditionnalités harmonisées entre donateurs et les engagements financiers pluriannuels.
• Un Plan National d’Action sur l’Efficacité de l’Aide (PNAEA) a été adopté par le Conseil des Ministres en 2007 pour la période 2007-2009. Il marque la volonté du gouvernement à renforcer son degré d’appropriation dans le processus de conception et de mise en œuvre des politiques publiques, bien que ce processus soit lent et que le leadership reste timide.
• 14 PTF ont quant à eux adopté la Stratégie Commune d’Assistance Pays (SCAP) pour la période 2008-2011, dans une volonté de changer profondément leurs modalités d’aide. Le gouvernement malien a été impliqué dans le processus de préparation et d’approbation. Les PTF ont pris la décision concertée de disposer d’un cadre harmonisé de leurs interventions afin
d’appuyer le Mali dans l’atteinte des objectifs du CSCRP. Les raisons à la base de cette décision sont en autres :
o La pratique en cours au niveau international d’élaborer des stratégies communes d’assistance pays
o La prise de conscience des donateurs de la nécessité d’accroitre l’efficacité de leurs interventions et de réduire le nombre de leurs procédures de délivrance de l’aide afin de mieux respecter les systèmes nationaux
o La nécessité d’une coordination entre les PTF eux-mêmes pour avancer dans les
actions d’efficacité de l’aide
La SCAP est donc le document de travail qui formule ce cadre commun dans lequel les stratégies des agences s’insèrent. Et tout comme le PNAEA, il vise l’objectif général d’amélioration de l’efficacité de l’aide au Mali à travers la mise en œuvre de la DdP grâce à de nouvelles modalités de travail et de collaboration.
• Des cadres de concertations régulières entre le gouvernement et PTF ont également été créés (Revue budgétaire conjointe, revue du CSCRP, commissions mixtes, rencontres mensuelles MEF-Troïka, …)
• Le Cadre Budgétaire à Moyen Terme a été mis en place et est actualisé annuellement tandis que le Cadre de Ressources à Moyen Terme (CRMT) a été tracé en 2009 afin de permettre au gouvernement d’avoir des projections budgétaires plus fiables.
Des partenariats stratégiques ont été développés à divers niveaux avec les PTF aussi bien avant que sous la DdP pour la mise en œuvre d’une bonne gestion de l’aide publique au développement à travers un dialogue inclusif. Le dialogue politique s’est élargi et renforcé et l’intérêt affiché des acteurs aux questions sur l’aide, sa gestion et son efficacité montre à bien des égards l’évolution positive de la DdP au niveau de la conception, de la mise en œuvre et du suivi des politiques globales et stratégies de développement.
50 dont la BM, l’UE, la BAD, la Belgique, la France, les Pays-Bas, le Canada et la Suède
The Aid Effectiveness Agenda: The benefits of going ahead
Final Report - Contract nr. 2010/256898 Page 153 of 169
La mise en œuvre de la DdP a également été encouragée par la mise en place de 3 entités
:
• La Cellule Technique du CSLP : sous la tutelle du Ministère de l’Economie et des Finances (MEF), elle a notamment pour mission d’élaborer et de mettre en œuvre la politique de Lutte contre la Pauvreté et de coordonner l’ensemble des activités pour la mise en œuvre du CSLP
• Le Secrétariat à l’Harmonisation de l’Aide (SHA) : également sous la tutelle du MEF, il doit s’assurer de la mise en œuvre de PNAEA et de la DdP, assurer l’interface avec le Pool Technique et développer le dialogue avec les PTF en vue d’une meilleure coordination de l’aide par le gouvernement
• Les donateurs ont par ailleurs mis en place une cellule d’appui technique, nommé Pool Technique, afin de les aider à harmoniser leurs interventions et à préparer les consultations avec les responsables nationaux. Cette entité est donc l’interface technique principale avec le SHA mais aussi le secrétariat de la Troïka51. Parmi ses objectifs se dressent la mise en œuvre du CSCRP, du PNAEA et de la SCAP, l’amélioration de l’efficacité de la concertation des PTF, le suivi de l’agenda de l’harmonisation et de l’alignement, la capitalisation des expériences et des progrès ainsi que la facilitation du dialogue avec le gouvernement.
Ces trois entités, qui forment un cadre partenarial sous l’appellation de « structures co-localisées », ont permis d’instaurer un dialogue régulier entre le gouvernement et les partenaires. Elles agissent ensemble et élaborent un programme de travail commun. Elles permettent également de capitaliser ce qui est fait car il y a beaucoup de mouvements au gouvernement comme au sein des PTF ; elles assurent ainsi le relais.
En cours
Dans le contexte marqué par l’élaboration du nouveau CSCRP 2012-2017, la formulation de la SCAP II et la formulation des stratégies d’appui par la majorité des PTF (dont l’UE et nombre de ses pays membres), les PTF ont adopté le Programme de travail 2011, relevant d’une approche participative et consensuel, et ils ont saisi l’opportunité de travailler sur une Programmation Conjointe. Cette dernière constitue un processus qui ambitionne l’élaboration d’un diagnostic conjoint, d’une vision commune et d’un programme opérationnel conjoint d’appui au CSCRP 2012-2017 reposant sur une division du travail et une complémentarité entre PTF en vue d’une allocation optimale des ressources. La BM, la BAD, l’UE et plusieurs de ses Etats membres, ainsi que le Canada, se sont impliqués dans la mise en œuvre de cette programmation.
La SCAP II est donc envisagée de manière plus large, comme une stratégie intégrant une réflexion approfondie en vue d’aboutir à cette programmation conjointe et de donner ainsi une réponse conjointe à la mise en œuvre du CSCRP 2012-2017. Ainsi, alors que la SCAP I était principalement considérée comme une programmation concertée, la SCAP II une programmation conjointe.
Notons qu’il existe un problème d’alignement de ces nouveaux programmes avec les cycles politiques. En effet, le CSCRP 2012-2017 et la SCAP II sont en cours de préparation alors que les élections au Mali se dérouleront vers avril-mai 2012. Il y aura donc un nouveau gouvernement, avec de nouvelles ambitions, et on peut voir cela comme allant à l’encontre des principes d’alignement, d’appropriation et de responsabilité mutuelle.
51 La présidence des PTF change tous les 6 mois, selon un système de rotation alternée entre donateurs bilatéraux et multilatéraux. L’ex-président (Canada), l’actuel (BAD) et le futur (Danemark) constituent la « Troïka »
The Aid Effectiveness Agenda: The benefits of going ahead
Final Report - Contract nr. 2010/256898 Page 154 of 169
La coordination
Les niveaux de coordination entre PTF
La problématique de l’organisation formelle des PTF au Mali s’est posée avec l’exercice pilote de revue de l’aide en 1996. Mais avec l’avènement du CSLP 2002-2006, leur organisation s’est améliorée de façon significative comme nous avons déjà pu le voir précédemment avec le Pool Technique, la SCAP, le Programme de Travail, ….
Les PTF au Mali ont mis en place des cadres conjoints de concertation pour mieux coordonner leurs interventions et échanger des informations à la fois au niveau général et sectoriel. On retrouve trois niveaux de coordination:
Le premier niveau est la coordination globale autour du CSCRP et est assurée par le Collectif des PTF (Chefs d’agence et Chefs de mission), sous l’animation de la Troïka assistée du Pool Technique. Cette coordination se réunit une fois par mois (en dehors des réunions spécifiques) pour des discussions politiques et stratégiques. Les PTF assiste également à la Revue Budgétaire Conjointe ainsi qu’à la Revue annuelle du CSCRP. Une retraite annuelle des PTF est finalement organisée par la Troïka afin de faire le bilan de l’année écoulée et de discuter de la programmation à venir.
Le deuxième niveau est la coordination sectorielle et thématique autour de 10 Groupes Thématique (GT) et 3 Groupes transversaux52. Des chefs de file ont été désignés pour chacun des 13 Groupes avec un mandat couvrant la période du CSCRP ou d’une durée d’au moins 2 ans renouvelables. Ces groupes thématiques servent de base pour le dialogue sectoriel avec le gouvernement malien. Les membres du groupe se réunissent une fois par mois et la qualité du dialogue varie selon les secteurs. Les chefs de file se réunissent finalement entre eux tous les trimestres afin de partager l’information.
Le troisième niveau est la coordination autour des sous-secteurs identifiés dans les 13 Groupes thématiques PTF. Pour chaque sous-secteur est désigné un point focal, personne ressource pour les PTF et le gouvernement, chargée de traiter tout ce qui est lié au sujet.
Comme en Ouganda, la coordination et l’alignement au Mali s’opèrent donc via des groupes thématiques et on peut dire que la coordination au niveau sectoriel marche tout de même bien, surtout lorsque le pilotage est effectué par de vrais bailleurs (pas par les partenaires techniques). Les PTF du secteur élisent donc un chef de file annuel qui organise les échanges d’informations entre les PTF du secteur et avec le gouvernement. En 2006, les engagements de la Déclaration de Paris ont renforcé ce cadre de partenariat en instituant des mécanismes de suivi des réformes vers une harmonisation de leurs interventions. Cela a donné l’opportunité de réaliser un plaidoyer pour les PTF n’ayant pas encore adopté ces principes. Les PTF ont donc institutionnalisé des réunions mensuelles auxquelles sont invités certains représentants de l’administration du secteur concerné et la société civile pour discuter sur les thématiques spécifiques, les résultats des recherches et adopter une position harmonisée sur les différents agendas ainsi que pour les discussions sur les réformes du département. De l’avis de certains partenaires, ce mécanisme a considérablement réduit les risques de duplications des interventions des donateurs qui sont dès lors mieux informés sur les actions des uns des autres. Le dialogue politique en serait mieux harmonisé, facilitant les
52 Les groupes sectoriels recouvrent : (i) Economie agricole et rurale, (ii) Secteur privé et Micro Finances, (iii) Décentralisation/Développement institutionnel, (iv) Justice, (v) Education, (vi) Santé/Développement Social, (vii) Eau et Assainissement, (viii) Cadre macro-économique, (ix) Processus démocratique et société civile, (x) Développement des Infrastructures. Au niveau transversal : (i) Environnement/GRN, (ii) Genre, (iii) VIH/Sida
The Aid Effectiveness Agenda: The benefits of going ahead
Final Report - Contract nr. 2010/256898 Page 155 of 169
échanges avec le gouvernement et une prise de position commune permettant de mettre en œuvre les bénéfices liés à un partenariat silencieux. Par exemple en 2009, les PTF ont délégué un représentant pour participer aux travaux de validation de l’audit 2008 du PRODESS qui a été chargé de formuler les observations communes de l’ensemble des PTF rassemblées par ce dernier. Ce système de délégation permet d’utiliser au mieux les ressources humaines disponibles et de mieux orienter leur travail avec plus d’efficience (MEF 2011). De plus, les acteurs se connaissent les uns les autres et peuvent partager leurs expériences, leurs succès mais également leurs problèmes. Une sorte de mécanisme de réputation multilatéral est donc mis en place, même si il n’est pas toujours effectif au vu des préoccupations parfois divergentes.
Certes, malgré ces progrès en matière de coordination, un travail d’approche et de conviction reste à faire, notamment pour élargir le dialogue politique aux donateurs non traditionnels (non adhérents à la DdP). Au Mali, la coordination ne regroupe en effet pas tous les partenaires techniques et financiers et l’implication de ceux-ci peut varier fortement. En effet, les préférences des acteurs sont différentes, tout comme les intérêts nationaux ou encore les visions sur ce qui compte en terme de développement. L’aide peut être allouée sous l’influence d’intérêts personnels (géopolitiques ou commerciaux) plutôt que selon les besoins ou les mérites du pays récipiendaire. Mais on peut dire que le niveau et les efforts de coordination sont satisfaisants au sein du pays.
Les mécanismes de coordination entre les Etats membres de l’UE
Tous les mois se déroule une réunion entre les PTF européens, dirigée par la délégation de l’UE (Emile Jeannee en assume la responsabilité). Ces interactions européennes ont pour but d’appuyer les relations Gouvernement du Mali-PTF. Ce mécanisme de coordination est tout récent, seulement 7 ou 8 réunions ont eu lieu jusqu’à présent. Sur les 8 PTF, le Danemark, la Suède ainsi que les Pays-Bas se montrent relativement hostiles à une coordination entre PTF européens. Ils semblent ne pas avoir les mêmes visions de l’aide au développement même si il y a un consensus pour soutenir la DdP. Le Danemark n’hésite d’ailleurs pas à signaler un plus grand désir d’allocation de ses fonds au Canada, qu’il considère plus proche de ses visions. Il soutient ainsi la réforme de la justice au Mali par le biais d’une coopération déléguée avec le Canada. La France, l’Allemagne et la Belgique sont davantage sur la même longueur d’ondes. Il n’y a donc pas de véritable coordination des Etats membres à l’heure actuelle, les réunions ayant très peu de contenu. Aucun rapport n’a d’ailleurs été fait. Il existe des tensions internes, surtout à cause de personnalités fort différentes au sein du groupe. On ne peut donc pas parler de la DUE comme d’un véritable agent de coordination. L’UE est là en tant que PTF au même titre que la France, l’Espagne, la Belgique, … Les Etats membres et la DUE agissent de manière très indépendante et différente, certains sont en effet dans l’appui budgétaire (la DUE est dans l’ABG, l’ABS et l’aide projets), d’autres pas, … La CE est de plus en plus sévère vis-à-vis de l’ABG et estime qu’elle doit être liée à la gouvernance, ce qui n’est pas le cas de tout le monde. Et alors que certains souhaitent une séparation du dialogue politique et de la mise en œuvre de l’appui budgétaire, l’UE a tendance à vouloir lier les 2.
Ce serait une très bonne chose que l’UE se coordonne et il est souhaitable qu’elle parle d’une seule voix mais il existe une réelle difficulté à prendre une décision commune et il y a des contradictions entre les pays (le Danemark est opposé au CSCRP par exemple). Il y aurait pourtant moins de problèmes de coordination en amont s’il était possible de ne négocier qu’avec l’UE.
La coopération déléguée est mise en œuvre entre certains pays de l’UE et la DUE mais ne remporte pas le succès escompté. L’Agence française de Développement déplore notamment la lenteur des procédures bureaucratiques et du déboursement des fonds européens. La lourdeur des conventions ne faciliterait pas le mécanisme de collaboration.
The Aid Effectiveness Agenda: The benefits of going ahead
Final Report - Contract nr. 2010/256898 Page 156 of 169
Coûts de transaction
L’étude postule que les coûts de transaction supportés par chacun des PTF s’affaiblissent grâce à la coordination mais aussi avec le nombre de participants au processus de coordination. Pourtant, comme cela l’a été rapporté dans le rapport de SIDA mentionné dans l’étude (p37), de nombreux donateurs se plaignent d’une charge de travail supérieure engendrée par les efforts d’harmonisation. La DdP a en effet donné naissance a un nombre de nouvelles activités, comme le renforcement du système national pour l‘implémentation et le rapport des résultats, le dialogue, la négociation,… Et les réunions sont parfois décrites comme « longues, lentes et rébarbatives ». De plus, le travail de coordination qui devrait être fait par le gouvernement est réalisé par les bailleurs. Etre chef de file sectoriel est couteux, prend du temps, nécessite la mobilisation d’1 ou 2 personnes à temps plein et représente donc un investissement considérable que de moins en moins de personne sont prêtes à assumer selon Hervé Bougault. Les bailleurs doivent gérer les objectifs, leurs engagements, leurs déboursements, la prédictibilité et doivent en outre adosser ce travail de coordination qui nécessite beaucoup d’interactions, de temps, .... Il semblerait donc que l’harmonisation et la coordination allègent la charge du pays partenaire et la place sur les donateurs. L’avantage de la coordination n’est donc pas nettement perceptible du point de vue des PTF, avec l’augmentation actuelle des coûts de transaction et très peu de résultats tangibles au final.
Néanmoins, on peut considérer ces coûts et cette charge supplémentaire de travail comme un investissement. En effet, la coordination évite de multiplier les coûts. Il y a notamment un bénéfice perceptible par rapport au partage des analyses et statistiques et aux bilans communs (comme le problème de la démographie). Ces bilans touchent désormais le gouvernement et il y a donc un réel effet. Sans Pool Technique, chaque bailleur devrait mobiliser des ressources humaines pour chaque réunion et cela multiplierait également les coûts. Le groupe thématique peut quant à lui faire le point sur le sujet et il n’y a pas de déboursement direct du bailleur. Le SHA et le Pool Technique sont financées par les PTF mais lorsqu’on relativise celui-ci à la somme des coûts individuels, il y a économie. Il y a également un gai au niveau de la qualité de la préparation des revues lorsqu’il n’y a qu’un seul interlocuteur. Et lorsque les préoccupations sont discutées au préalable, cela facilite par la suite le dialogue. Les économies sont donc bien réelles.
La réduction de la compétition
La coordination permettrait de réaliser un bénéfice grâce à la réduction de la compétition sur le marché de l’aide. Cette compétition pousse en effet les agences rivales à débourser les fonds rapidement (budget pressure) et augmente la probabilité de détournement par les intermédiaires. La multiplication des bailleurs offre en outre plus d’ « options de sortie » pour les autorités nationales (surtout lorsqu’aucun mécanisme de réputation multilatéral n’est mis en place) et encourage donc le phénomène de capture par l’élite.
Au Mali, cette vision positive de la réduction de la compétition est discutée. Pour certains, il est évident que les mécanismes de coordination et de concertation sont bénéfiques en termes de réduction de la compétition. Elle permet de réduire les options de sortie, de discipliner le gouvernement en diminuant sa propension à la fraude (notons que même si il y a des PTF qui ne coopèrent pas, l’information circule) et de réduire la pression budgétaire qui pèse sur les PTF. Il y aurait donc moins d’aide gaspillée. Mais pour d’autres, la coordination « supprime la bonne concurrence ». Selon ceux-ci, le fait qu’il n’y ait qu’un représentant des PTF engendre une perte de souveraineté du gouvernement récipiendaire qui se retrouve contraint d’accepter les propositions faites, alors qu’il aurait pu effectuer un comparatif auparavant. Ces détracteurs pensent en en effet qu’il n’est pas souhaitable d’avoir un bailleur unique et qu’il est intéressant d’avoir plusieurs idées, plusieurs choix, et de choisir ce qui est le mieux en fonction des priorités nationales.
Pour le Pool Technique, ce problème relatif à l’offre et la demande n’est pas vraiment un problème. Certes le gouvernement aime pouvoir jouer avec les exigences des uns et des autres mais il aime également que les PTF s’organisent, notamment sur les conditionnalités de l’appui budgétaire.
The Aid Effectiveness Agenda: The benefits of going ahead
Final Report - Contract nr. 2010/256898 Page 157 of 169
Fragmentation vs complémentarité et division du travail
La fragmentation et la prolifération de l’aide se manifestent par un nombre important de donneurs au sein d’un pays ainsi que leur éparpillement au niveau sectoriel, avec l’affectation de petits montants financiers. Au Mali, 29 donateurs étaient présents en 2009 et le taux de fragmentation était évalué à 21% pour un niveau d’APD de 940 millions de dollars.
En mai 2007, l’UE a adopté le Code de conduite sur la complémentarité et la division du travail dans la politique de développement, visant à améliorer la performance de la politique de coopération de l’UE par une meilleure répartition des tâches entre les donateurs de l’UE. En tenant compte des avantages comparatifs de chacun, la division du travail permet en effet de déléguer, d’effectuer des programmes conjoints et d’intervenir dans un nombre réduit de secteurs. Elle contribue ainsi à éviter la fragmentation de l’aide nuisant à l’efficacité. Entre 2008 et 2010, on remarque une diminution du nombre de PTF actifs dans la grande majorité des secteurs mais celle-ci reste assez faible, sauf dans les secteurs de l’éducation, de la santé et de l’assainissement pour lesquels il existe une dynamique de coordination plus forte permettant de réduire la fragmentation53. On note que l’ensemble des donneurs engagés dans la division du travail sont des pays membres de l’UE qui donnent ainsi l’exemple pour le respect du Code européen. On peut visualiser cela à l’annexe 1, grâce au nombre de partenariats silencieux et de coopérations déléguées signalés pour les pays membres de l’UE (DUE comprise). Malgré tout, ce Code est difficile à mettre en œuvre car les habitudes des PTF sont fort ancrées et personne ne le soutient donc vraiment.
Tout comme le Code de conduite européen, la note méthodologique sur la Programmation conjointe des PTF, issue en janvier 2011, mentionne comme objectif l’utilisation optimale des ressources grâce à une division du travail et une complémentarité accrue et on s’attend donc à des retombées positives dans les années à venir. Une Matrice de Complémentarité a vu le jour pour mieux répartir les opérations, en signalant les PTF présents par sous-thèmes ainsi que leur rôle et les coopérations déléguées, et un accord sur une stratégie de retrait responsable des PTF sortants doit être conclu. En effet, des retraits se sont opérés jusqu’à présent mais principalement parce qu’une opération arrivait à terme et qu’elle n’était pas reconduite. Des approches communes en matière de suivi-évaluation et d’examens annuels conjoints des résultats de la mise en œuvre du CSCRP et de la stratégie de réponse conjointe des PTF seront également mises en place dans le cadre de la Programmation.
Même si la coordination marche relativement bien au niveau sectoriel54, la mutualisation des missions peine à être mise en œuvre et des unités parallèles sont toujours bien présentes. 60 unités parallèles de mise en œuvre de projets étaient dénombrées en 2008 contre 65 en 2006, dénotant une faible diminution vers l’objectif cible de 22 unités parallèles en 2010. Relativement aux missions conjointes, les travaux d’analyse conjoints sont tout de même passés en proportion de 30 à 39% entre 2005 et 2007 en raison des efforts faits par les donateurs (MEF 2011). Le rapport d’évaluation nationale souligne également la diminution du nombre des missions sur le terrain. Il faut en outre souligner les efforts de quelques bailleurs pour coordonner les procédures de suivi conjoint, ainsi que l’existence d’ententes de cofinancement et d’initiatives de coopération déléguée, même si plusieurs d’entre elles ont échoués.
Il est important de noter que, dans le cadre de la division du travail, les ministres sectoriels maliens peuvent craindre de perdre des ressources en cas d’abandon d’un secteur par un donneur (étant donné le caractère unilatéral et non concerté des retraits) et certains préfèrent donc le statu quo. La partie nationale s’est également montrée frileuse et réticente, craignant que la coordination et la division du travail ne réduisent le montant total d’aide allouée plutôt que de l’amener à son optimum social. En matière de division du travail, l’idéal serait néanmoins une concertation des PTF et une implication du gouvernement quant au nombre de secteurs d’intervention par PTF, au nombre d’agents, aux montants à investir, … Une meilleure
53 Cfr annexe 1 54 Il s’est notamment opéré une réduction des coûts de transaction liés aux études dans le groupe macroéconomique grâce au partage d’information sur les travaux et les études de chacun.
The Aid Effectiveness Agenda: The benefits of going ahead
Final Report - Contract nr. 2010/256898 Page 158 of 169
compréhension par le gouvernement des bénéfices de la division du travail est néanmoins nécessaire afin que celui-ci s’investisse.
La réforme des Nations-Unies
Les Nations Unies se sont engagées à réformer leur système dans la perspective d’accroitre leur cohérence et leur efficacité grâce à une nouvelle approche de coordination des activités opérationnelles au sein d’un pays. Comme le renseigne le site de l’APD : « Cette réforme, illustrée par l’adage « Unis dans l’Action » (Delivering as One), correspond à l’idée d’une définition claire du rôle des agences dans le respect de leurs mandats pour chacun des objectifs stratégiques du Plan Cadre des Nations Unies pour l’Aide au Développement (PNUAD), de sorte à produire une action concertée et responsable. Il ne s’agit donc pas pour les agences des Nations Unies de se regrouper en une seule entité mais plutôt de se répartir les tâches de façon complémentaire et sur une base rationnelle qui implique que chaque entité soit en charge du secteur dans lequel elle est la plus performante. En revanche, dans les domaines où une action conjointe produirait une valeur ajoutée indéniable, les agences devront nécessairement travailler de concert pour une plus grande efficacité ».
Pour l’instant, plus de 10 agences des NU interviennent de manière désordonnée au Mali, dont une dans 11 secteurs et cette absence de coordination interne est problématique. Grâce à cette réforme, il y aura un cadre budgétaire unique, un bureau unique, un leader unique et un programme unique. Ainsi, il ne restera plus qu’un seul interlocuteur, ce qui facilitera largement la tâche du gouvernement et réduira les coûts. Le processus sera appuyé par une stratégie de communication solide qui veillera à forger une identité commune au Système des NU et l’aider à parler d’une seule voix sur les questions stratégiques55. Cette réforme pourrait servir de cadre de référence par la suite, notamment pour l’UE.
+ Harmonisation et alignement
Dans le cadre de la mise en œuvre de la DdP, le gouvernement du Mali et ses partenaires ont convenus
• De mieux coordonner leurs activités et de substituer progressivement les procédures nationales à la multiplicité des procédures des bailleurs de fonds et ;
• D’examiner les moyens concrets d’harmoniser les programmes et les procédures afin de préparer une réorientation progressive d’une partie de l’aide internationale sous la forme d’une aide programme à travers le budget de l’Etat, grâce aux appuis budgétaires.
Une harmonisation des interventions facilite l’alignement des apports d’aide sur les stratégies et systèmes nationaux, surtout si les donneurs simplifient leurs procédures. Pour favoriser cette harmonisation, le gouvernement, en collaboration avec les PTF, a donc arrêté une approche de coordination par secteurs clés. Les interventions s’organisent ainsi désormais autour de stratégies sectorielles et de cadres de dépenses à moyen terme.
Le taux des approches fondées sur des cadres communs et programmes était de 48% en 2005 et est néanmoins tombé à 41% en 2007, faute de cadres et programmes sectoriels suffisants pour faciliter la coordination des donneurs. La domination de l’aide projet aux coûts de transaction élevés et le faible leadership de gouvernement dans la coordination de l’aide ont également contribué à cet échec. L’engagement à utiliser les systèmes nationaux, avec la promesse d’accroitre la part de l’aide apportée aux pays par le biais des approches-programmes, est particulièrement approprié pour les pays qui ont élaboré des stratégies sectorielles saines et axées sur les résultats, ce qui fait souvent défaut au Mali où il n’existe
55 Pour plus d’informations consulter le site http://www.mali-apd.org/
The Aid Effectiveness Agenda: The benefits of going ahead
Final Report - Contract nr. 2010/256898 Page 159 of 169
même pas de politique nationale de l’aide. Les approches programmes qui étaient censées remplacer les projets classiques n’ont donc malheureusement pas beaucoup progressé.
Le Gouvernement du Mali a en outre fait de l’appui budgétaire un instrument privilégié de sa coopération financière. Un grand espoir a en effet été placé dans cette modalité d’aide, considérée par la DdP comme celle pouvant participer à une meilleure efficacité de l’aide par la réduction significative des procédures et le soutien à la politique budgétaire nationale. Dans ce contexte, le gouvernement a engagé un dialogue très suivi avec les PTF qui a abouti à la signature de l’Arrangement Cadre relatif aux appuis budgétaires généraux et sectoriels. Celui-ci prévoit explicitement en matière d’alignement de l’aide sur les priorités nationales : une coordination conduite par le gouvernement, des conditionnalités harmonisées entre donateurs s’appuyant sur les stratégies et programmes du gouvernement bénéficiaire, des engagements financiers pluriannuels (sous réserve des performances réalisées) ou encore un calendrier d’engagements et des versements des donneurs compatibles avec le cycle budgétaire de l’Etat. On a pu constater des progrès en matière d’appui budgétaire avec le triplement des montants alloués entre 2005 et 2009, après une diminution en 2004. En 2009, 9 PTF ont fait de l’appui budgétaire général (ABG) et 7 de l’appui budgétaire sectoriel (ABS). Cependant, l’imposition de conditionnalités au décaissement des fonds relevant de chaque PTF et le nombre réduit de ceux-ci (moins d’un tiers des PTF intervenant dans le pays) en limite la portée. L’ABG ne représentait en effet que 9% de l’enveloppe d’APD accordée au pays et l’ABS ne constituait que 2% de celle-ci (MEF 2011). Il faudrait donc que les arrangements cadres relatifs aux appuis budgétaires soient multipliés. L’approche budgétaire reste donc largement en deçà des attentes du gouvernement en termes du nombre de donneurs et en termes de montants.
En 2010, les PTF ont néanmoins renouvelé leur engagement à poursuivre et à consolider leur appui de la mise en œuvre de la stratégie de réduction de la pauvreté auprès du gouvernement et cela s’est traduit par une augmentation des annonces de financement pour 2011 de l’ordre de 3,9%. Il est difficile de dire si la coordination a eu un quelconque effet sur la revue à la hausse des montants, mais cela constitue un signe favorable.
Mais malgré les engagements, des difficultés subsistent car les priorités de certains donateurs et celles du Mali ne sont pas alignées et certains bailleurs refusent d’utiliser les systèmes et procédures nationaux en invoquant des raisons de non compatibilité avec les normes internationales et l’absence de fiabilité et d’efficacité de ces systèmes. Les sièges des donneurs ont en effet tendance à imposer des orientations, normes et procédures à ceux qui les représentent.
Malgré les progrès réalisés en matière de gestion des finances publiques, des réformes doivent encore être programmées pour que les procédures gouvernementales inspirent la confiance (beaucoup de donneurs ne s’alignent pas). La qualité des systèmes nationaux de gestion budgétaire, financière et de passation des marchés sont en effet essentielles à l’alignement des donneurs. En 2009, 37% de l’aide allouée au secteur public passaient par le système de passation des marchés (contre 45% en 2005) et 40% passaient par les systèmes nationaux de gestion des finances publiques contre 29% en 2005 et 34% en 2007, essentiellement grâce à l’augmentation du nombre de donneurs ayant eu recours à l’appui budgétaire56 (en effet les aides alignées sont essentiellement les aides budgétaires). On peut remarquer que les multilatéraux s’alignent désormais d’avantage sur les procédures de gestion des finances publiques, avec 35% en 2010 contre 25% pour les bilatéraux. La part de l’aide des PTF membres de l’OCDE ayant respecté les procédures nationales d’exécution budgétaire, de suivi financier et de contrôle financier a également chuté, en passant de 34% en 2007 et 2009 à 30% en 2010. Une très large part de l’aide reste donc non alignée. A contrario, l’indicateur d’alignement des apports d’aide sur les priorités nationales est tout de même passé de 60% des fonds versés au secteur public en 2005 à 73% en 2007, soulignant une volonté des PTF de s’aligner de plus en plus sur les priorités du Mali.
56 Avec la signature de l’Arrangement Spécifique de l’ABS en 2006, plusieurs donateurs appuyant le PRODESS se sont alignés sur les procédures nationales des finances publiques.
The Aid Effectiveness Agenda: The benefits of going ahead
Final Report - Contract nr. 2010/256898 Page 160 of 169
Exemples
Il existe un groupe thématique propre au développement rural. Les efforts pour l’alignement avec les priorités nationales sont de plus en plus sensibles au sein de celui-ci mais les PTF restent très hésitants. L’harmonisation est recherchée à travers 2 aspects : l’utilisation de procédures ou dispositifs communs de préparation des projets/programmes (P/P) et de conduite des missions de terrain ainsi que l’encouragement des analyses conjointes des P/P. La 2e revue conjointe a mis en avant que seulement 15% des interventions P/P ont été mises en œuvre par le biais de « programmes » en 2009 (objectif cible de 66% en 2010 !) et qu’il n’existe pas de panier commun des interventions. Deuxièmement, la revue a signalé qu’aucune évolution n’a été observée pour les missions conjointes, la plupart des PTF effectuant leurs missions de terrain de manière séparée. En 2009, ce ne sont que 22 projets qui ont été cofinancés par plusieurs bailleurs (soit 20% contre 18% en 2008). Il a aussi été observé que 58% des projets/programmes ont une unité de gestion parallèle. Ceci indique les nombreux efforts qui sont encore à faire.
Notons qu’un exemple fructueux s’est opéré dans le secteur de la santé, avec la mise en œuvre du programme sanitaire en 2005. Cela s’est traduit par une réduction des coûts de transaction (les charges étant élevées pour la gestion d’un projet) et la disponibilité des travailleurs engagés par l’Etat même après l’arrêt ou la fin de l’intervention spécifique. En effet, pour l’approche projet, les cadres s’en vont à la fin du projet et cela ne contribue donc pas au renforcement des capacités de l’administration. A partir de 2005, certains PTF ont réduit considérablement les activités mises en œuvre par leur agence d’exécution au profit d’un appui financier au département de la santé. Cela a permis le renforcement institutionnel des structures de l’administration et un renforcement des capacités de gestion financière.
Actuellement, les différents accords et programmes de coopération des PTF spécifient également des appuis au secteur de la santé qui devront être conformes avec les priorités nationales, ce qui constitue un aspect positif du partenariat dans la mesure où les priorités du bénéficiaire sont appuyées par les PTF. Les entretiens ont révélé que les PTF peuvent néanmoins exiger également la prise en compte d’indicateurs non retenus au préalable dans les documents sectoriels, dénotant malheureusement un faible leadership du pays dans le dialogue avec les PTF.
+ Déliement de l’aide
L’aide non liée a représenté 95% en 2005 et 93% en 2007, pour un objectif cible devant dépasser 95% en 2010. La plupart des PTF membres du Comité d’Aide au Développement font des efforts pour respecter la décision de celui-ci prise en avril 2001 de délier l’aide à destination des pays les moins avancés (MEF 2011). Mais alors que certains bailleurs, comme l’AFD, pratiquent le déliement de l’aide à 100% et recourent notamment aux entreprises chinoises très compétitives, beaucoup d’autres s’y opposent et préfèrent continuer l’aide liée. Le déliement de l’aide n’est donc pas encore une réalité au Mali. Dans la majorité des cas, les consultants sont issus du pays de financement.
+ Prédictibilité
« Une meilleure prédictibilité permet au gouvernement d’avoir la visibilité la plus complète possible sur les intentions d’appuis financiers et de programmer les actions à soumettre au financement des donneurs en cohérence avec le calendrier budgétaire » (MEF 2011). L’indicateur a malheureusement chuté de 71% en 2005 et 68% en 2007. L’amélioration de celle-ci est néanmoins prévue dans un avenir prochain. En 2009, la coordination des PTF a en effet élaboré et adopté un Cadre de Ressources à Moyen Terme (CRMT) pour la période 2010-2012 dans le but d’améliorer la prédictibilité de l’aide. En 2010, 24 ministères ont élaboré un cadre de dépenses à moyen terme (contre 20 en 2008). Les PTF ont établi une base pluriannuelle d’intervention et se sont engagés à l’horizon 2015. La plupart des donateurs, notamment les pays membres
The Aid Effectiveness Agenda: The benefits of going ahead
Final Report - Contract nr. 2010/256898 Page 161 of 169
de l’UE et la Délégation de la Commission européenne ont un programme de coopération sur une durée minimale de 3 ans. Depuis l’adoption du CRMT actualisé, les engagements sont tenus avec beaucoup de rigueur et on note des progrès en termes de prédictibilité, notamment en matière d’appuis budgétaires. Il faut néanmoins signaler que malgré les progrès, les CRMT restent fiables pour la première année mais qu’ils le sont déjà moins pour la deuxième année. Des réformes en interne doivent encore être faites pour pouvoir garantir un montant sur plusieurs années. De plus, pour une grande part des PTF il reste difficile d’avoir des engagements sur plusieurs années, les flux restent donc très imprévisibles. Il y a en effet une pression pour des résultats rapides et visibles et les bailleurs sont donc réticents à s’engager dans le long terme.
On peut également signaler que la réorganisation de la Matrice Commune des déclencheurs est perçue comme une avancée notable et favorable en termes de gestion macroéconomique.
+ Réduction de la volatilité
La volatilité existe bien évidemment au niveau du calendrier des décaissements. En effet, la non-satisfaction d’un déclencheur dans les temps impartis entraine un report du déboursement. Il y a également de la volatilité générée par le déboursement des tranches variables (méthode utilisée par l’UE).
En ce qui concerne les retombées de la crise économique de 2008, il semblerait que celle-ci ait eu un faible impact sur l’aide et l’appui budgétaire mais qu’une énorme perte de devises se soit fait sentir par rapport aux flux des migrants avec en conséquence un déséquilibre dans la balance des payements. Il n’y a pas eu d’effet perceptible dans les flux d’aide car les engagements étaient déjà signés. C’est l’avantage des conventions signées sur 3,4 voire 5 ans. L’effet s’est plutôt fait ressentir au niveau de non respect du calendrier dans certains cas. Il n’y a pas non plus eu de retrait de PTF suite à cette crise. Mais la recherche de fonds ailleurs s’est tout de même produite étant donné le niveau faible des recettes comparativement aux dépenses. Le Fonds Monétaire, la BM et la BAD ont également augmenté leur appui budgétaire en réaction post-crise. Le gouvernement ne s’est pas nécessairement tourné davantage vers les bailleurs non traditionnels étant donné que ceux-ci investissent surtout dans les projets ciblés.
+ Coordination avec d’autres pays
L’étude parle de bénéfices additionnels liés à la coordination de l’UE avec des pays hors UE, ce qui est bien évidemment le cas au Mali, où la coordination ne s’effectue pas entre pays européens mais s’effectue essentiellement au niveau de l’OCDE, avec la rare participation de quelques pays hors OCDE. Tous les bénéfices actuellement retirés de la coordination sont en effet dus à une coordination internationale entre donateurs bilatéraux et multilatéraux.
Une question intéressante est de savoir si les nouveaux acteurs peuvent compromettre la coordination des acteurs de l’aide traditionnels. En effet, les PTF non traditionnels ne s’inscrivent pas dans les stratégies, ni dans la matrice de complémentarité, et ils pourraient réduire les bénéfices générés par la coordination des PTF traditionnels. Ils pourraient en plus représenter des options de sortie, des exécutoires, pour le gouvernement malien. Ils sont en effet considérés comme « plus souples »57, ont moins de conditionnalités et leurs discours est facilement compris par les autorités : ils ont besoin d’influence politique et de ressources naturelles. La convergence des intérêts est donc plus facile.
57 Par exemple, la Chine connait bien les problèmes de corruption, liés aux droits de l’homme et à la démocratie, et elle ne vient donc pas embêter le Mali avec ça.
The Aid Effectiveness Agenda: The benefits of going ahead
Final Report - Contract nr. 2010/256898 Page 162 of 169
L’intervention de façon substantielle de fournisseurs non traditionnels d’aide au Mali (non adhérents à la DdP) comme la Chine, la Lybie, L’Inde, le Brésil, … est un facteur significatif intervenu dans le domaine de l’aide. Les financements de ces pays sont importants et n’ont malheureusement pas été évalués dans le cadre de l’évaluation nationale. Ils fonctionnent principalement sous forme de prêts, avec des projets « clé sur porte » (ils construisent des ponts, des routes, …). Ils interviennent principalement dans les secteurs productifs et des infrastructures et ne représentent donc pas une menace car ils « ne cassent pas les efforts des autres ». En effet, peu de ces pays sont considérés comme non-coopératifs et hostiles. Les discussions avec eux s’opèrent surtout au niveau de la coopération internationale. Mais ils sont invités aux diverses réunions et il existe une réelle volonté des PTF de les intégrer au processus et de les faire « rejoindre le bateau ». A l’heure actuelle, la Chine coopère, comme la Japon ou les Banques islamiques. La Tunisie passe par le système bancaire, le Maroc investit dans la téléphonie, … Certains s’insèrent même dans le Programme de Travail des PTF.
C’est le rôle du gouvernement du Mali de veiller à la coordination entre les PTF traditionnels et non traditionnels, et celui-ci doit élaborer une politique nationale de l’aide et amener les nouveaux PTF à s’aligner sur celle-ci. Le SHA indique qu’il y a une volonté de la partie nationale de ne pas les bousculer, au risque qu’ils posent la question du ralliement, alors que 50 d’aide traditionnelle n’a pas donné de résultats. Néanmoins, l’évaluation nationale de la mise en œuvre de la DdP indique que le traitement différentiel accordé par le Mali aux donneurs non traditionnels démontre la montée en importance des nouveaux programmes des pays Arabes et des pays du Sud, et l’effet potentiel à la hausse sur les coûts de transaction. Si l’arrivée de ces nouveaux acteurs de l’aide « perturbe » la gestion de l’APD au Mali, déjà difficilement coordonnée, elle aiguillonne également les donneurs classiques en remettant en cause l’efficacité des nouvelles pratiques de l’aide chèrement acquises, et peut même évoquer un retour en arrière avec, par exemple, les anciennes modalités de l’aide, comme l’aide liée.
Coûts de transaction du pays récipiendaire
Il est difficile d’évaluer les économies réalisées dans les ressources humaines nationales. On peut citer plusieurs mesures en vue de réduire les doubles emplois, comme la création du Pool Technique chargé de l’harmonisation de l’aide et du suivi du Plan d’Action en partenariat avec le SHA, ainsi que leur colocalisation (MEF 2011). Néanmoins, l’aide n’est pas suffisamment coordonnée par indécision des autorités et on remarque une imprécision dans les attributions et des duplications des structures impliquées dans la gestion de l’aide suite à une mauvaise division du travail. (MEF 2011). La coordination des bailleurs doit donc s’accompagner d’un effort de coordination au sein même du gouvernement.
L’économie au niveau national semble néanmoins avoir été sous-estimée. En effet, l’avantage actuel de la coordination semble plus fort du côté du gouvernement du Mali. Grâce au mécanisme de concertation, il sait désormais à qui s’adresser au niveau général (Troïka) mais également au niveau sectoriel (chefs de file). Selon le Pool Technique, cela diminue énormément ses coûts de transaction car il peut dès lors s’entretenir avec un seul interlocuteur connu pour l’ensemble des PTF coordonnés, lorsqu’il souhaite des informations ou tout simplement lors des rencontres. Ce système organisé constitue un avantage très net, d’autant plus qu’il s’est répandu à la société civile qui s’organise désormais également.
Effets indirects
La gouvernance
Il existe plusieurs types de gouvernance : la gouvernance sectorielle, administrative, démocratique, économique, … La matrice d’Actions du CSCRP 2007-2009 s’est focalisée sur l’ensemble de celles-ci en pointant comme objectifs : le renforcement de la gestion du développement, la consolidation de la réforme des administrations publiques, l’amélioration et la modernisation de la gestion des finances publiques, sur la
The Aid Effectiveness Agenda: The benefits of going ahead
Final Report - Contract nr. 2010/256898 Page 163 of 169
promotion de la gouvernance démocratique, … Il est fort probable que la coordination des PTF et leur soutien au CSCRP aient encouragé l’ensemble de ces initiatives et engendré des effets indirects sur la gouvernance.
En ce qui concerne la gouvernance administrative, les auteurs de l’étude postulent que l’incitant d’un pays récipiendaire à définir ses propres priorités est renforcé lorsqu’il négocie avec les donateurs comme un seul groupe plutôt qu’avec chacun d’entre eux. En effet, la tentation de tailler les objectifs de développement sur mesure des préférences de chacun des donateurs est fortement réduite au Mali grâce aux cadres conjoints de concertation et aux mécanismes de coordination entre le gouvernement et les PTF et entre les PTF eux-mêmes. Ces derniers invitent le gouvernement à définir ses priorités et stratégies de développement et ils se sont engagés à s’aligner sur celles-ci. Le gouvernement du Mali est donc plus discipliné pour atteindre une cohérence interne dans le processus de définition de ses priorités et objectifs, comme on peut le remarquer avec le CSLP et le CSCRP. Le PNAEA marque également un effort en termes de gestion et d’administration de l’aide ainsi qu’en termes d’appropriation. L’ensemble des stratégies, des cadres opérationnels, des revues, … sont aussi de véritables progrès encouragés par la coordination des PTF. Malheureusement, l’implication du gouvernement reste encore faible et que l’appropriation est loin d’être optimale. Le pays manque encore d’une politique nationale de l’aide et semble parfois incapable de conceptualiser sa propre volonté de développement. Le gouvernement a en effet tendance à se reposer sur les idées, propositions et prescriptions des bailleurs plutôt que d’opérer une véritable remise en question interne afin de déterminer les priorités nationales et de se les approprier. Il n’y a malheureusement pas de définition du budget national pour mener à bien les objectifs, et certains iront jusqu’à dire qu’il n’y a pas de développement de politiques adéquates.
Nous avons vu précédemment qu’il s’est aussi opéré un renforcement institutionnel des structures de l’administration dans le secteur de la santé. On remarque également un renforcement des capacités institutionnelles au niveau de certaines structures comme le Ministère des Finances ou la Cellule Technique du CSLP.
Comme il l’est également mentionné dans l’étude, la transparence est supérieure lorsque les donateurs partagent l’information et agissent en cohésion pour inciter le gouvernement à préciser ses objectifs et à publier les résultats atteints. Au Mali, en ce qui concerne le principe de responsabilité mutuelle, l’objectif est d’ailleurs d’impliquer un plus grand nombre d’acteurs pour contrôler et rendre transparente la gestion de l’aide. Les PTF, la société civile et le secteur privé participent désormais à la planification à travers les groupes sectoriels et on note une implication progressive des instances parlementaires dans cette planification, même si leur rôle est encore trop faible et que le Parlement ne se prononce pas assez alors que c’est fondamental qu’il puisse le faire. Il subsiste malheureusement un problème de communication de l’information entre le gouvernement et les PTF et un problème de gestion de l’information au niveau du gouvernement. La duplication des structures de gestion de l’aide et l’absence d’une bonne circulation de l’information au niveau du gouvernement nuisent à l’efficacité de l’aide en favorisant la reddition des comptes (corruption, manque de transparence, …) (MEF 2011). Les bénéfices de la coordination d’un grand nombre d’acteur sur la transparence sont donc mitigés.
Au niveau de la gouvernance économique, le Mali a entrepris des efforts majeurs et a réalisé des progrès notables dans les domaines de la gestion des finances publiques (notamment grâce au PAGAM/GFP) et du cadre macroéconomique (plus grande transparence dans la passation des marchés, fiscalité,…). Ces performances résultent sans aucun doute du dialogue étroit instauré entre le gouvernement et les PTF et renforcé par la Revue Budgétaire conjointe, la Commission mixte gouvernement – PTF ainsi qu’aux rencontres mensuelles MEF – Troïka. Les progrès sont bien évidemment également attribuables à la coordination des PTF et le fait que la satisfaction des conditionnalités permette aux PTF de s’aligner et de drainer plus d’argent dans l’appui budgétaire a été encourageant pour le gouvernement. La réorganisation de la Matrice conjointe des déclencheurs de l’appui budgétaire, base unique d’évaluation qui conditionne les décaissements prévus, a permis au gouvernement de concentrer ses efforts sur un nombre réduit d’indicateurs, plus cohérents entre eux. La Matrice permet en effet de prioriser, d’éviter la compilation et la réduction est donc positive. En 2010, seulement 4 indicateurs sur 17 liés à aux domaines de la GFP et
The Aid Effectiveness Agenda: The benefits of going ahead
Final Report - Contract nr. 2010/256898 Page 164 of 169
du cadre macroéconomique présents dans cette Matrice n’ont pas été satisfaits selon les PTF, ce qui est positif.
La coordination a la réputation de pouvoir discipliner le gouvernement récipiendaire lorsque les donateurs sont incapables de ne pas aider les pauvres. En effet, cela peut permettre de confier la gestion à un agent moins averse. On remarque notamment que la Délégation de l’UE est plus stricte par rapport aux déclencheurs à l’appui budgétaire et qu’elle n’hésite pas à réduire le décaissement de la tranche variable en cas de non satisfaction des indicateurs, pouvant signaler une aversion moins forte à la pauvreté. L’étude mentionne qu’il est concevable que la CE ait un avantage comparatif quant aux interventions basées sur des problèmes de gouvernance et, dans le contexte malien, on peut en effet percevoir une gestion différente de la DUE par rapport à l’appui budgétaire. Il est néanmoins difficile de se prononcer quant à l’avantage procuré par son comportement au Mali. Certains PTF portent un regard négatif sur la manière de fonctionner de la DUE, la considérant parfois comme trop sévère. On prête à ces contrats basés sur la performance la capacité de mener à une meilleure appropriation ou encore à une croissance de la prévisibilité mais la tranche variable mise en œuvre par la DUE au Mali ne semble avoir qu’un effet restreint sur les performances du gouvernement. En effet, les PTF se sont mis d’accord sur la Matrice des déclencheurs mais, les préoccupations étant différentes, certains indicateurs revêtent plus d’importance pour les uns que pour les autres. La DUE n’a pas décaissé une partie de sa tranche variable durant 2 années consécutives, mais elle fut la seule à le faire. Effectivement, l’Arrangement Cadre de l’appui budgétaire indique que le déboursement dépend d’une décision individuelle. Les PTF se concertent pour décider si les indicateurs sont satisfaits ou non mais le décaissement est finalement laissé à l’appréciation de chacun. Malgré le partage d’information entre les PTF (mécanisme de réputation multilatéral), il n’y a donc pas de coordination quant aux décaissements qui permettrait de mettre le gouvernement au pied du mur. Le moyen de pression commun n’est présent que pour les indicateurs faisant l’unanimité des PTF. Certains déboursent moins car ils attendent des pièces justificatives qui tardent toujours, tandis que d’autres déboursent toujours sous l’effet de la pression budgétaire. Les critères de décision ne sont pas purement objectifs, mais des enjeux politiques et des exigences différentes par rapport aux indicateurs engendrent des décaissements disparates qui empêchent de contraindre totalement le gouvernement. Néanmoins, la concertation, l’Arrangement Cadre, la Revue Budgétaire conjointe, la Matrice des déclencheurs,… constituent des avancées notables et ont heureusement permis au gouvernement de faire des progrès indiscutables en matière de gouvernance économique.
La préoccupation relative au fléau de la corruption reste bien présente. En effet, le phénomène est toujours répandu malgré les nombreux efforts pour renforcer la transparence dans la gestion des ressources publiques et l’organisation d’un Forum National sur la Lutte contre la Corruption. Le gouvernement continue sa lutte avec la mise en œuvre du Plan d’Action sur la Corruption et la Délinquance financière pour la période 2009-2013. La Revue Budgétaire conjointe de 2010 a souligné qu’il n’y avait pas d’avancées significatives par rapport à ce plan et le problème du contrôle externe reste au centre des discussions mais des avancées notables et satisfaisantes ont été enregistrées vis-à-vis du contrôle interne (le contrôle financier de la dépense publique a atteint 96% en 2010 contre 70% en 2007).
On peut considérer que la gouvernance sectorielle a connu des avancées. Grâce à la coordination des PTF, ceux-ci peuvent d’avantage imposer sur les politiques sectorielles et le fait que tout le monde tiennent le même discours permet une pression plus forte. Pour le moment, les progrès ont été essentiellement limités aux secteurs de l’éducation et de la santé. Le gouvernement, en collaboration avec les PTF, a en effet arrêté une approche de coordination par secteurs clés et a tâché de mettre en œuvre des stratégies sectorielles et des cadres de dépenses à moyen terme pour de nombreux secteurs. Faute de cadres et programmes sectoriels suffisants pour faciliter la coordination des donneurs, le taux des approches fondées sur des cadres communs et programmes est néanmoins resté faible.
The Aid Effectiveness Agenda: The benefits of going ahead
Final Report - Contract nr. 2010/256898 Page 165 of 169
Coût politique
Du côté des bailleurs
On entend par coût politique le coût engendré par la perte de souveraineté et la réduction de la capacité d’un donateur de poursuivre les objectifs qui lui sont propres au profit d’une efficacité accrue de l’aide. En effet, en mettant en œuvre les principes d’harmonisation, d’alignement et de coordination, les Etats membres présents au Mali doivent faire des concessions et calmer leurs ardeurs patriotiques. Certains ne sont clairement pas prêts à payer le prix politique d’adhérence à la DdP. Ils s’engagent mais se montrent réticents à la complète mise en œuvre des différents principes. Chacun veut avoir sa propre analyse, son propre jugement, utiliser ses procédures, et les bailleurs ne poussent donc pas la logique de la coordination jusqu’au bout. Il y a peu de volonté politique pour une coordination parfaite car il reste un désir fort de conserver un suivi rigoureux et individuel de leur appui financier. Il y a donc une négligence et une incompréhension de ce à quoi ils se sont engagés. En plus, il est nécessaire pour certains PTF (notamment les ambassadeurs) d’avoir recours à l’Assemblée nationale, d’aller se justifier devant leur Parlement et la préoccupation de celui-ci compte. Il y a une certaine redevabilité par rapport aux électeurs, et le Code de conduite européen est en ce sens compliqué à mettre en œuvre car il existe des contraintes propres à l’électorat de se focaliser sur telle ou telle chose. Sans l’implication des politiques, la coordination ne peut donc pas être forte. Et les écarts de comportements des PTF ne s’expliquent qu’avec le politique.
On remarque en outre que les grands pays comme les USA ou le Canada, tendent à assigner un poids supérieurs aux considérations politiques et au contrôle. Au sein des pays de l’UE, ce sont surtout le Danemark et les Pays-Bas qui semblent être plus réticents à la coordination. Il existe un leadership caché et les pays puissants tirent vers leurs positions et font parfois jouer leur influence géopolitique.
Selon le Pool Technique, une des raisons pour laquelle les coûts de transaction des PTF ont augmenté est que ceux-ci ont accepté de mettre en œuvre des principes très ambitieux alors que les réformes de leur côté n’ont pas été faites. Ils ont en effet continué de fonctionner comme avant la DdP. Ils sont formatés et continuent dans la voie qu’ils ont toujours suivie. On peut faire une analogie aux directives européennes : celles-ci nécessitent une implémentation au niveau national et les réformes sont nécessaires pour que ce soit effectif. Mais le problème central est le problème politique. Les choix politiques ne cadrent pas toujours avec les choix nationaux et une réponse des PTF est souvent « mes procédures ne me le permettent pas ». Or, afin de ressentir réellement les bénéfices de la coordination, il y a besoin de réformer/changer l’architecture de l’aide. Mais cela prend du temps et implique effectivement une perte de souveraineté.
Comme mentionné dans l’évaluation nationale de la mise en œuvre de la DdP, la délégation n’est pas encore suffisante et ne peut pas l’être sans réforme des systèmes des différents acteurs. Certaines décisions des sièges limitent les actions sur le terrain pour des raisons politiques ou géostratégiques. Il existe peu de marge de manœuvre aux missions sur le terrain et les sièges peuvent restreindre fortement la gestion de l’aide sur place. On remarque que la DdP est très mal connue ou comprise au sein des capitales et sièges or il y a besoin qu’ils connaissent et qu’ils croient en la structure pour qu’elle puisse avancer. C’est difficile de mettre en œuvre quelque chose dont on ignore le contenu. Les PTF sont confronté à un dilemme car ils doivent promouvoir l’appropriation par le partenaire ainsi que l’alignement, mais tout en demandant des rapports sur les résultats pour rencontrer les requis de l’administration qui n’a qu’une connaissance limitée de la DdP et des bienfaits qu’elle peut engendrer. L’équilibre est donc délicat comme le mentionne le rapport de SIDA.
La coordination autour des projets a toujours existé, même avec des difficultés, mais la coordination autour de messages politiques est beaucoup plus difficile. La représentation politique et l’ambassade ont beaucoup d’importance. Chacun a noué ses réseaux, ses relations et si il y a des messages à faire passer au gouvernement, cela se fait à travers des discours bilatéraux et il n’y a pas de passage par la cellule de coordination. Les PTF ne sont en effet pas prêts de lâcher cette voie de contrôle.
The Aid Effectiveness Agenda: The benefits of going ahead
Final Report - Contract nr. 2010/256898 Page 166 of 169
Du côté du gouvernement récipiendaire
Comme cela a été dit précédemment en rapport avec la réduction de la compétition, il y a un risque que la coordination des PTF mène à une perte de souveraineté de la partie nationale. Le gouvernement peut en effet avoir plus de difficultés à s’affirmer face aux PTF et le leadership peut être mis à mal lorsqu’il n’y a qu’un seul interlocuteur car il pourrait être contraint de s’y soumettre. Le gouvernement doit donc se montrer fort, ce qui n’est pas toujours le cas à l’heure actuelle. Il y a une réelle nécessité d’appropriation des réformes par le gouvernement, de définition des priorités et objectifs nationaux ainsi que des politiques nationales afin que celui-ci puisse s’affirmer, clairement indiquer aux partenaires ce qu’il souhaite et ce qu’il peut ou non accepter.
Notons tout de même aussi qu’il est rare que le gouvernement refuse une proposition qu’il y ait un ou plusieurs interlocuteurs, faute de leadership et d’une réelle volonté de porter politiquement le développement de manière consciencieuse (en effet, ce n’est visiblement pas une priorité politique). Au Mali, il existe une culture du consensus qui empêche la prise de position tranchée, même si le dialogue devient tout de même plus franc au fil du temps. L’effet pervers de la coordination n’est donc pas si fort.
Conclusion
La coordination est plus poussée au Mali qu’ailleurs mais on continue à se poser beaucoup de questions sur celle-ci. En effet, il est impossible de savoir quels sont les gains ayant pu être réalisés à ce stade grâce à l’implémentation de la DdP et plus particulièrement grâce à la coordination des PTF, ni quel est l’impact en termes réels. Il est en outre difficile d’attribuer les résultats en développement à l’unique mise en œuvre de la DdP. Le Ministère de l’Economie et des Finances affirme toutefois qu’ils y ont contribué. Comme il le mentionne, le soutien des efforts de développement à travers une aide significative (10%) a permis de maintenir un taux de croissance économique annuel supérieur à celui de la démographie (3,6% contre 3,1%). La croissance de l’économie malienne a été de 4,6% sur la période de 2007 à 2009, en dépit des fluctuations annuelles dues à des chocs répétés de l’environnement international (différentes crises rencontrées : alimentaire, énergétique et financière). De plus, l’incidence de la pauvreté monétaire a été estimée à 43,7% en 2009, contre 47,4% en 2006. En ce qui concerne les montants déboursés, il n’y a néanmoins pas de ressenti. L’enveloppe est restée constante globalement.
Selon plusieurs acteurs du développement, prendre cette impossibilité de mesure de l’impact comme argument contre la mise en œuvre de la DdP apparait faible et la volonté d’aboutir à un chiffre précis d’économies et de gains parait absurde. En outre, les effets se feront sentir sur le long terme et il est donc très difficile d’en estimer les bénéfices à l’heure actuelle. On peut en effet déjà considérer que la DdP a constitué un acte révolutionnaire de par son contenu fait d’engagements individuels et collectifs, mais aussi du système de suivi. Elle a créé une sorte de dynamique dans la recherche d’impacts en matière de développement. Tous les domaines font l’objet, soit d’un début, soit de véritables changements de pratiques et de comportements dans l’acheminement et la gestion de l’aide, et des progrès se sont fait et se font encore ressentir.
Le dialogue entre le gouvernement et les PTF et entre les PTF eux-mêmes s’est indéniablement renforcé. Un renforcement de la confiance s’est opéré entre le gouvernement et les PTF et il existe désormais un cadre permanent de concertation ainsi qu’un cadre partenarial qui essaye de prendre en charge la gestion de l’aide dans sa globalité. Des progrès ont été faits en matière de conception des stratégies et politiques de développement.
The Aid Effectiveness Agenda: The benefits of going ahead
Final Report - Contract nr. 2010/256898 Page 167 of 169
Au sein du CSCRP, les politiques sectorielles interagissent et l’alignement des PTF sur celles-ci procure un avantage certain. On note également une amélioration de l’harmonisation et de la coordination des procédures ainsi que de l’alignement sur les systèmes nationaux dans certains secteurs comme l’éducation et la santé. Il est vrai néanmoins qu’en dépit des efforts des bailleurs l’indicateur d’harmonisation signale encore un besoin d’améliorer le dispositif commun de planification, l’approche programme, les missions conjointes, la division du travail, l’harmonisation des procédures,… Mais la mise en œuvre de la Programmation conjointe permettra sans doute de faire des avancées dans le domaine. Certains partenaires sont également d’avis que le véritable plan de coordination ne sera réellement mis en œuvre qu’en 2012 avec la SCAP II. Les bénéfices réels ne seront donc sensibles que dans 3-4 ans, également avec la réforme du Système des NU.
De manière globale, les réformes enclenchées sont considérées comme positives, bien que lentes. Des résistances au changement sont présentes, tant du côté du gouvernement que des bailleurs. On déplore notamment une faible volonté du gouvernement de prendre son rôle de leadership dans le processus, alors que la coordination nécessite d’être orchestrée par le gouvernement lui-même. Les donateurs sont quant à eux lents au changement et restent averses au risque. Un problème non négligeable est que la coordination parfaite amènerait la suppression de nombreux postes et la disparition d’avantages pour de nombreuses personnes. Cela engendre une réticence du côté national (réduction de nombre de cadres, départements) et du côté des PTF (scient la branche sur laquelle ils sont assis).
La liste des faiblesses soulignées par le rapport final de l’évaluation nationale est la suivante :
• Faiblesse du mécanisme de coordination de l’aide par indécision des autorités : l’appropriation par le gouvernement est cruciale pour aboutir à une gestion efficace d’ l’aide ; c’est celui-ci qui doit coordonner l’appui des PTF et s’assurer que cet appui se focalise sur les priorités nationales.
• Dispersion des rôles et duplication des structures chargées de la gestion de l’aide • Faible prévisibilité de l’aide malgré l’adoption du CRMT • Le refus de certains PTF de s’aligner • Le Pool Technique ne couvre pas tous les PTF (notamment les PTF non classiques) • La réticence des donateurs à mettre en place des fonds fiduciaires financés par des donneurs
multiples • Le manque de volonté manifeste à réduire les unités parallèles
Les recommandations adressées aux PTF sont les suivantes :
• Respecter les engagements pris dans la DdP • Renforcer la prévisibilité de l’aide et décaisser conformément aux prévisions • Augmenter l’aide dans des programmes compatibles avec les stratégies nationales • Renforcer la coopération déléguée en réduisant le nombre d’acteurs • Augmentation des missions conjointes • Réformes des conditionnalités de l’aide
Le gouvernement devrait quant à lui :
• Elaborer une nouvelle politique nationale de l’aide et renforcer le leadership national • Rationnaliser le système de coordination de l’Aide Publique au Développement • Améliorer la fiabilité des données sur l’aide et sur le budget • Renforcer les évaluations des politiques publiques • Améliorer la performance des structures de contrôle et la transparence sur l’utilisation des
ressources • Renforcer les pouvoirs et les capacités du SHA • Faire une meilleure promotion de la DdP
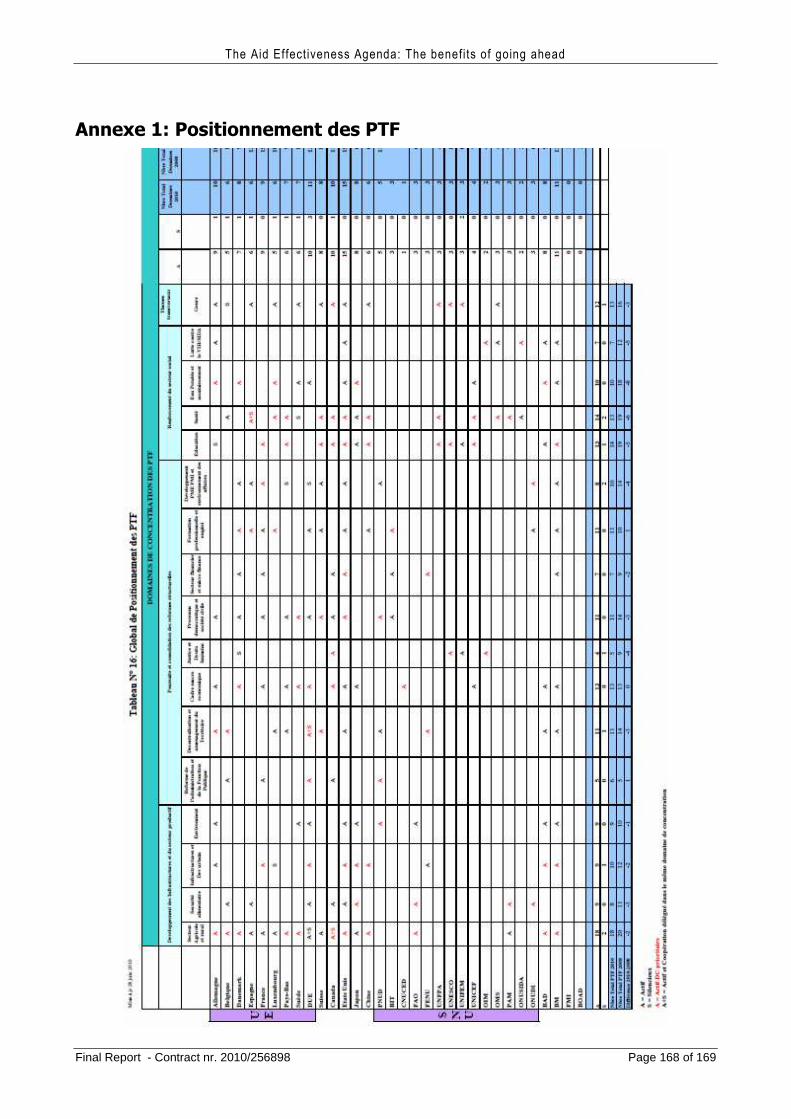
The Aid Effectiveness Agenda: The benefits of going ahead
Final Report - Contract nr. 2010/256898 Page 168 of 169
Annexe 1: Positionnement des PTF

The Aid Effectiveness Agenda: The benefits of going ahead
Final Report - Contract nr. 2010/256898 Page 169 of 169
Bibliographie
Le Prétoire, « Projet d’appui au développement de la justice (Prodej) », 14/02/2011, [En ligne], URL : http://www.maliweb.net/category.php?NID=71122
Ministère de l’Economie et des Finances (MEF), SG, SHA (2011), « Rapport Final - Evaluation nationale de la mise en œuvre de la Déclaration de Paris (phase 2) », groupement Bac +/ADERC.
Site internet
Mali APD 2001, Harmonisation de l’Aide au Mali, URL : http://www.mali-apd.org/
Liste des personnes interviewées Nom et prénom Fonction Email
TRAORE Sidiki Conseiller chargé du
Budget (MEF)
DEMBELE Mamadou Président du SHA [email protected]
GERBIER Baptiste Conseiller auprès du SHA et de la Cellule CSLP
NEBIE Pierre Coordonnateur
Pool Technique
JEANNEE Emile Chef de la coopération
Délégation de l’UE au Mali
DIOP Cheikh Economiste à la BM [email protected]
BOUGAULT Hervé Directeur de l’AFD [email protected]
CISSE Aminata Economiste à l’AFD