Embed Size (px)
Citation preview

Tectonophysics, 152 (1988) 119-135
Elsevier Science Publishers B.V., Amsterdam - Printed in The Netherlands
119
The a~~~icati~n of the ~a~netute~~u~ic impedance tensor to earthquake prediction research in Greece
CERASIMUS CHOULIARAS ’ and TflORKILD M. RASMUSSEN *
(Received July 24, 1986; revised version accepted October 15, 1987)
Abstract
Chouliaras, G. and Rasmussen, T-M., 1988. The application of the magnetotelluric impedance tensor to earthquake prediction research in Greece. Tectm5pfrysics, 152: 119-135.
Continuous short period (0.1-3600 s) measurements of the magnetotelluric field components were conducted simultaneously at two sites in Greece for a period of 5 weeks. The estimation of the impedance tensor elements from X-hr windows of recorded data, at each station, is found to describe the local electromagnetic induction with great accuracy, The computation of the residual electric field, obtained as the difference between the observed and estimated
inductive part of the electric fields, clearly improves the detection of any local electric field anomaly. This method was used in an attempt to detect precursory seismic electrical signals @ES) that have been reported to precede earthquakes in Greece. The results indicate the success of this method in resolving ambiguities about the nature of the reported SES, i.e. whether it has an external or internal source.
Although during the recording period no large earthquake occurred, five with a magnitude of between ML = 4.0
and M, = 4.3 occurred within a radius of 150 km from one of the stations. The magnetotelluric recordings and the computed residual electric fields far the time intervals reported to contain the SES precursors to these events were analysed in some detail. In two of the cases it was found that the sources could not be related to earthquake processes. In the other three cases the nature of the source of the suspected SES, although electric, could not be established with certainty. These results indicate that for earthquakes of small magnitude (M,s4.3) or of large epicentral distance (r 2 100 km), the detection of a SES is extremely difficult.
Introduction
Local variations in the earth’s electric field
prior to earthquakes in Greece have recently been
reported by Varotsos and Alexopoulos (l!?Ma, b).
They claim that every sizable earthquake is pre-
ceded by a transient change in the electric field,
the so-called seismic electric signal (SES). The
amplitude of the SES, as observed by measuring
the potential difference (AV) between a pair of
electrodes placed in the ground, is supposed to
contain information on the time of occurrence,
epicentral distance and magnitude of an impend-
ing earthquake.
From results obtained thus far by the 1%sta-
tion telhn-ic network in Greece, the following rules
have been established:
(l} The SES occur 6-115 hrs before the earth-
quake and have a duration of f minute to 1.5 hrs,
The duration and lead time do not depend on
earthquake magnitude (ML).
(2) The SES appear as a transient change in the
potential difference (AT) between two electrodes
(up to a few millivolts for an electrode spacing
L = 50 m> depending on M,, epicentral distance,
rr and lacal structural inhomogeneities.
(3) The SES retarded on a single line (east-west
or north-south) of a given station and emitted
0040-1951/88/$03.50 0 X988 Elsevier Science Publishers B.V.

120
from various seismic regions show AI’ values that
decrease with increasing epicentral distance r
roughly according to a l/r-law (for Y > 50 km).
(4) For a given line at a given station, the
SES’s emitted from a given seismic region (r =
constant) have AI’ values that increase with in-
creasing earthquake magnitude M, .
(5) The SES of an impending earthquake ap-
pears simultaneously at a number of stations
without being accompanied by any significant
change in the magnetic field.
Varotsos and Alexopoulos (1984b) claim an
outstanding success rate in predicting sizable
earthquakes located within the network of telluric
stations. As has been mentioned, ma~etotelluric
disturbances are a very serious shortcoming in the
identification of the SES, especially for an im-
pending earthquake of small magnitude or of large
epicentral distance. The removal of magnetically
induced effects from the telluric measurements
should improve the detectability of the SES and
thus make predictions for distant or small
earthquakes more reliable. It is well known that
the application of the tensor impedance concept
to the analysis of ma~etotelluric data as pub-
lished by Sims et al. (1971) makes it possible to
obtain estimates of the tensor elements which
describe the local induction effect. This standard
magnetotelluric analysis is employed to remove
induction effects from the electrical measurements
and thus we may observe what is henceforth
termed the “ residual” electric field.
Rikitake (1947) suggested that the method of
computing the difference between observed earth
potentials and those predicted from measurements
of the magnetic field should be applied to monitor
any anomalous changes in earth currents related
to earthquakes. The transfer function relating the
magnetic field to the electric field from a galvanic
source will in general be different from the one
describing the induction process analysed by the
standard magnetotelluric method. Thus. for
noise-free data, the calculated residual electric field
should show if an electric potential is generated
within the earthquake volume. In general, magne-
totelluric data are noise contaminated, which can
cause severe problems in the interpretation of the
nature of an observed anomaly in the residual
field. Noise related to the actual measuring tech-
nique is mostly related to the measurements of the
electric field. This type of noise can easily be
identified by using double coverage of the elec-
trode setup. Another type of noise is related to
artificial galvanic and inductive sources in the
vicinity of the measuring station. Changes in the
residual electric field showing a step-like rise of
the anomaly can probably be referred to this type
of noise, since electric field changes from sus-
pected earthquake-related sources with well de-
fined hypocenters should show a smooth rise in
the signal because of stronger attenuation of the
higher frequency components at some distance
from the hypocentre. To safely distinguish be-
tween anomalous residual electric fields related to
artificial sources and anomalous electric fields re-
lated to earthquake processes, it is necessary to
observe the anomalous field at a minimum of two
stations, separated by a distance large enough to
ensure that artificial sources cannot affect both
stations.
In order to test the feasibility of the above
mentioned methodology, the Seismological and
Solid Earth Physics Departments of Uppsala Uni-
versity, in cooperation with P. Varotsos, K.
Alexopoulos and K. Nomicos from the Depart-
ment of Physics of Athens University, installed
and operated two ma~etotellu~c stations in
Greece. The two magnetotelluric stations were
near two of the telluric stations of the Greek
network and monitored the five components of
the magnetotelluric field for a 5-week period.
The analysis of the magnetotelluric data pro-
vides an accurate estimate of the local induction
effect. The subsequent removal of such induction
effects from the electric field measurements is
shown to drastically improve the detection of any
local variation in the earth’s electric field caused
by galvanic sources.
Instrumentation
Two pairs of non-polari~ng electrodes of the
copper-coppersulphate type were used for detect-
ing the two horizontal components of the electric
field in an east-west and north-south direction.
The distance between the electrodes was 100 m for
each pair. Three induction coil magnetometers

121
41
3s
37
35
20. 22, 24' 26. 28'
Fig. 1. Map of Greece showing the locations of the magnetotelluric stations in Pirgos and Amfiloxia.
were used to measure the time derivatives of the three orthogonal components of the magnetic field in north-south, east-west and vertical directions.
The output voltages were suitably amplified and filtered with a passband of 0.00027-10 Hz. The five channels were sampled at 48 Hz and recorded digitally on magnetic tapes. Each tape ~ont~ned 8 hrs of simult~eous recordings of the five magnetotelluric components. 12-V batteries were used for power supply. Tapes were replaced three times a day and during these breaks in the recording the station functions (gains, self-poten- tial compensation etc.) were checked and when necessary adjusted.
Two such magnetotelluric stations were in- stalled at the locations shown in Fig. 1. Both stations were situated well away from industry and man-made sources of noise. Nevertheless, the station in Amfiloxia showed random transient dis- turbances from an unidentified source. These dis- turbances did not occur at night time.
The separation between the telluric and magne- totelluric station was about 8 km for the station at Pirgos and a few hundred metres for the station in Amfiloxia. The recording of data began on April 3 and was continuous until May 8,1983.
Data analysis
Maxwell’s equations imply a linear dependance between electric and magnetic fields at a particu- lar frequency and spatial wave number. In the frequency domain this relationship may be written as:
(1)
where Z,,, zxy, zpx, ZYy are elements of the impedance tensor 2, and depend on the conduc- tivity structure beneath the measuring point. E, and E, are the horizontal electric field compo- nents and H,, H, the horizontal magnetic field components. The indices x and y refer to the

measuring axis in the north-south and east-west
direction, respectively.
A relationship similar to eqn. (I) relating the
vertical magnetic field component Hz and the
magnetic field components H, and H,, in the
frequency domain, may be written as:
H, = AH, -k BH, (2)
where A and B are unknown complex coefficients.
The pair (A, B) can be thought of as operating on
the horizontal magnetic field and tipping a part of
it into the vertical. For this reason (A, B) is often
referred to as the “tipper”; its application to the
inte~retation of conducti~ty structures is de-
scribed by Vozoff (1972).
The estimation of the impedance tensor ele-
ments from measured data as performed by Sims
et al. (1971), is obtained as a least squares solution
in narrow bands of frequencies so that the noise
power in two of the channels is minimized while
assuming the remaining two to be noise free.
Recently, Jepsen and Pedersen (1981) developed a
computer program which provides solutions for
the impedance tensor elements and their random
errors, given the recorded time series of the hori-
zontal magnetotelluric components as input. The
solutions are in terms of auto and cross spectral
estimates in a given frequency band. The follow-
ing model is considered in the frequency domain
( _ indicates vector quantity consisting of field
values at discrete frequencies within the frequency
band):
_E, = Z,,_H, + z, ,_H,. + _N, (3)
where _N, denotes the noise of that part of the
electrical field which is not related to the induc-
tion process. Assuming gX and -_Hy to be noise
free and Z,, and Z,Y, to be constant within the
frequency range of interest, through the minimiza-
tion of il_NI 1’. a least squares solution Z,, and
,?,,. for the tensor elements is found (- indicates
vector transposition and conjugation and * indi-
cates estimated quantities):
i,,.= (4b)
Similarly, Z ,.,,. 2, ~, 2 and 6 are found. This
program, with minor modifications to handle
longer time series and estimate the tipper ( A. B).
was used in the analysis of the magnetoteiluric
data collected in Greece.
The main steps in the analysis of each field
tape containing 8 hours of simultaneous recording
of the time series are:
(I) Each of the five time series is iow pass
filtered at 0.5 Hz with a Gaussian filter and re-
sampled to provide for a total window length of
32,768 samples.
(2) Linear trends are removed and the time
series are subsequently multiplied by a cosine
window, at both ends, of 400 samples width. This
reduces the effects of discontinuities on the com-
puted spectra.
(3) The time series are Fourier transformed.
(4) Cross and auto spectra are calculated within
each band of frequencies. The first nine frequency
bands were chosen to be discrete and centred at
the corresponding first nine harmonics. The subse-
quent bands were chosen so that we had ten
frequency bands per decade. In total we used forty
bands.
(5) Average impedance tensor elements and
their standard errors are calculated from band ten
onwards. The first nine bands are excluded from
further computation since they involve periods
above the l/3600 Hz instrumental filter.
(6) Apparent resistivities and phases are calcu-
lated for the average.
(7) The estimated impedance tensor elements
and the tipper estimates along with the spectra of
the time series are inputs to a subroutine which
computes the differences AE,, AE, and AHi.
between the observed electric and vertical mag-
netic components and those predicted by the
horizontal magnetic field components:
AE, = E, - i,,H, - i,,.H, (54
AE, = E, - i,,H, - &,H, (5b)
AH,=HZ-iH,-iH, (5C)
These residuals and the recorded time series are
finally transformed into the time domain and
plotted.

123
In this mode of analysis we use the single station technique rather than the remote reference
station technique (Clarke et al., 1983) in determin- ing the impedance tensor elements. This is prim- arily justified by the noise-free nature of the input data, which can be achieved by careful selection of the station sites and by making preliminary site noise measurements. However, as indicated above, the magnetotelluric station in Amfiloxia did show random transient disturbances; in this case the tensor estimates were obtained by rejecting noise
contaminated segments or by analysing data sets with a high signal-to-noise ratio. The random er- rors of the estimated elements in each analysis were calculated with the method described by Pedersen (1982).
Results
Impedance tensor estimates and tensor analysis
The magnetotelluric data collected during the 5-week recording period at the two stations con- sisted of a total of 210 field tapes. Upon analysis of the data it was found that about 15% of the field tapes could not be analysed, mainly due to earth-electrode coupling problems. Furthermore, it was found that the magnetotelluric station in Amfiloxia was situated near some unidentified source of transient electric disturbances during the daytime. The presence of such disturbances clearly affects to some degree the accuracy in estimating the impedance tensor elements, depending on how frequently they appeared during the recording in- terval and how strong the signal was.
Figs. 2-5 show typical results obtained by the standard analysis of an 8-hr recording window of noise-free data, at each of the two stations for the same recording interval. Figs. 2 and 3 show the normalized impedance tensor P and the tipper 2 and j, for each station. The impedance tensor Z is normalized using the following relationship:
where w is the angular frequency and p0 the magnetic permeability in a vacuum.
Figures 4 and 5 show the apparent resistivities:
P ax = I Txy I 2
P ay = I Tyx I 2
and corresponding phases:
Gx = arg( - iTxy > i=J--T
g+ = arg( + iTyx ) @b)
resulting from the analysis of each station. Routine determination of impedance tensor ele-
ments, from data having high multiple coherence values, shows only minor changes in the tensor estimates during the recording period.
The interpretation of these results leads to the following conclusions: both stations exhibit lateral anisotropies regarding the electrical conductivity distribution; the impedance tensor elements are numerically larger for the x-measuring direction; this anisotropy is more pronounced in the Amfi- loxia station; the transfer functions indicate three-dimensional earth structures below both sta- tions.
Residual field analysis
Using the estimated impedance tensor and tipper elements shown earlier and the spectra of the recorded time series, from which they were derived, the residual horizontal electric and verti- cal magnetic fields were computed. An example is displayed for a 2-hr segment of data, recorded simultaneously at both magnetotelluric stations, in Fig. 6a, b. By using sufficiently long time series, compared to the duration of the suspected SES, the presence of such anomalous signals can be expected to be of minor importance for the de- termination of the transfer functions. The residual electric fields, A E, and AEy, for both stations show a good prediction of the horizontal electric fields from the corresponding magnetic fields. The same may be said about the prediction of the vertical magnetic field from the two horizontal components as seen by the residual AH,.

124
PIRGOS, 830424
43
30
15
x
;-” 0
-15
-30
-45
In measur i ng direct ion
0 75.0
0 60.0
0 45.0 h
0 x 30.0 k-
0 t5.0
0 0.0
0 -15.0
0. 1. 2. 3. 4. 0. 1. 2. 3. 4.
LOG PERIOD [sj
-0.6 I
-0.9 0. 1. 2. 3. 4
LOG PERIOD [s]
m 0.0
-0.3
-0.6
-0,9
0. 1. 2. 3. 4.
LOG PERIOD [s]
Fig. 2. Normaliied impedance tensor f and tipper (a, d) for the station in Pirgos. Squares are the real components, triangles are the
ima~na~ components and crosses are the standard errors. Units for the normalized tensor elements are (Qm)‘/2.
0. 1. 2. 3. 4
LOG PERIOD [s]
0.9
0.6
0.3
The simultaneous variation in the electric field, difficult to identify local variations in the electric
indicated by an arrow, at both stations is of field, such as the SES, from the telluric recordings.
magnetic origin. This variation does not exist on Thus, knowledge of the source field is required
the computed residuals. It is such simultaneous and this is where the magnetotelluric method can
variations in the magnetotelluric field that make it be helpful in resolving such ambiguities.

125
AMFILOXIA, 830424
0. 1. 2. 5. 4.
LOG PERIOD [s]
15.0
-1s.o x 3r, % -30.0 h
t- c
-45.0
-75.0
0. t. 2. 3. 4.
LOG PERIOD [s]
0.B
0.6
0.f
a 0.0 m
-0.3
-0.9
0. 1. 2. 3. 4.
LOG PERIOD [s]
0. 1. 2. 3. 4.
LOG PERIOD [s]
45.
30.
1s.
0.
-15.
-30.
-45.
0. 1. 2. 3. 4.
LOG PERIOD [s]
0.B
0.6
0.s
0.0
-0.3
-0.6
-0.9 0. 1. 2. 3. 4.
LOG PERIOD [s-j Fig. 3. Normalized impedance tensor 2 and tipper (a, i) for the station in Amfiloxia. Squares are the real components, triangles are the imaginary compenents and crosses are the standard errors. Units for the normalized tensor elements are (Qm)‘/2.
Detection of the SES
During the recording period at the magnetotel- luric stations, Varotsos (pers. cummun., 1983) is- sued 14 telegrams predicting the occurrence of 14
earthquakes in Greece. Of the 14 telegrams 5 were issued on the basis of the appearance of a SES at the Pirgos telluric station, which was simulta- neously observed at other stations in the Greek telluric network.
0 1 2. 3. 4
LOG PERIOD 133 a
PIRGOS, 830424
0 . 1 2. 3. 4.
b LOG PERIOD [3]
Fig. 4. a. Logarithm of apparent resistivity pax and pay (ram) versus logarithm of period T’(s) for the magnetotelluric station in Pirgos. Squares are the north-south direction and triangles are the east-west direction. Error bars are standard errors. b. Phases QI, and $ (degrees) versus logarithm of period T (s) for the magnetotelluric station in Pirgos. Squares are the north-south direction and triangles are the east-west direction. Error bars are standard errors.
As described by Varotsos and Alexopoulos (1984b), every telegram issued is based on the appearance of a SES in the network of 18 telluric stations operating in Greece. Each telegram states the predicted epicentral distance and direction from Athens, the predicted magnitude and the time of appearance of the SES. The impending earthquake is expected to occur within a time
E
E c 0
LA
w cc
a n 4:
4.
3.
2.
1.
AMFILOXIA, 830424
!" neosuring direction
0
d 0. / 0. 1 2. 3. 4
LOG PERIOD [31 a
window of 6-115 hours from the time of ap- pearance of the SES.
It is clearly of interest at this point to analyse the magnetotelluric recordings from the stations in Pirgos and Amfiloxia at the time of appearance of the reported SES, in each of the five cases. It is expected that the residual field analysis of the magnetotelluric data should resolve ambiguities
AMFILOXIA, 830424
i-60
d-75
-90.i 0. 1. 2. 3. 4.
b LOG PERIOD [s]
Fig. 5. a. Logarithm of apparent resistivity pax and par (Urn) versus logarithm of period T (s) for the magnetotelhuic station in
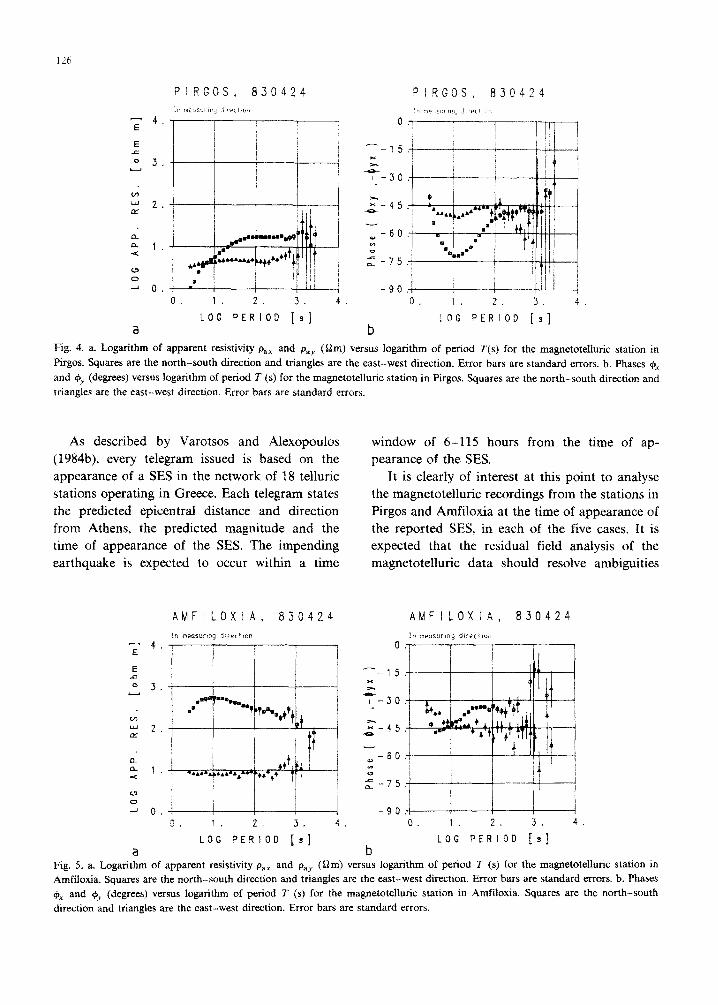
Amfiloxia. Squares are the north-south direction and triangles are the east-west direction. Error bars are standard errors. b. Phases ez and qY (degrees) versus logarithm of period T (s) for the magnetotelhnic station in Amfiloxia. Squares are the north-south direction and triangles are the east-west direction. Error bars are standard errors.

10 min. p I RfiOS t 83-84-24 I -
2.0 10-J: AH, :
-2.0 10’3-
2.0 10-G:
Ex I
-2-o lo-” f 23:35
6*U 10-4: AH2 :
-6.0 lo-4-
7.5 10-6:: AEx :
-7.5 10-c-
Fig. 6. SimuItaneous recording of the five magnetotelluric components and the computed residuals from the magnetotelluric stations in Pirgos (a) and Arnfiloxia (b). Index x refers to the no&-south direction, y ta the east-west direction and z to the vertical direction. H is the mawetic field component and E is the electric field component. AE and AH are the computed residuals. Units are A m-’ for the magnetic field and V m-l for the ekctric field. Time indicated is G.M.T.

TAH1.E I
Listing of telegram number, date and time of issue along with the suspected SES onset for each of the five cases. and the
corresponding prediction of position (eplcentral distance in ktlometres and direction from Athem.) and magnitude M, (Varotso\.
per\. commun.. 1983)
Case Tel. no. Date Tel. time SES time Prediction (<;.M.Tj (G.M.T.)
positlon
I 79
II 81
ill 83 * IV 84 *
V 91
* Uncertain predictions.
---- 06/04/‘83 20: 12 17:55 w 170 3.6
15/04/83 13 : 15 12 : 16 w 160-200
17,‘04/83 lb: 14 12:53 WSW 230 3.6-4.0 18/04/X3 09 : 00 @I:41 w300 _
05/05/83 18:27 13 : 53 Wl60 3.x
regarding the nature of the SES, i.e. whether it has an external or internal source.
Table 1 shows details regarding the predictions issued in each of the five cases. Figures 7, 9a, 10a and 11 show the recordings and the computed residuals from the magnetotelluric station in Pirgos
that include the time of appearance of the SES at the telluric station network corresponding to cases I, III, IV and V, respectively. Similarly, Figs. 8, 9b and 10b show the recordings and the computed residuals from the magnetotelluric station in Amfiloxia that include the time of appearance of
10 min. PIRCOS , 83-04-06 ‘ I
2.0 10-311
*Hz -2.0 HI-3:'
- , 1
Fig. 7. Simultaneous recording of the magnetotelluric components and the computed residuals from the magnetotelluric station in
Pirgos for case I. Index x refers to the north-south direction, y to the east-west direction and z to the vertical direction. H is the
magnetic field component and E is the electric field component. AE and bH are the computed residuals. Units are A m-l for the
magnetic field and V m-’ for the electric field. The time indicated is G.M.T.

the SES at the telluric station network correspond- ing to cases II, III and IV, respectively.
No recordings are available from the magneto-
telluric station in Amfiloxia corresponding to the time interval in cases I and V, nor for the Pirgos magnetotelluric station in case II. This is because station maintenance was being carried out during the specified intervals.
Case I
The computed residuals from the magnetotel- luric recordings in Pirgos (Fig. 7) show a low- frequency periodic background “noise” due to errors in estimating the impedance tensor around that frequency. A transient signal is clearly super- imposed on this background, in both electric re- siduals, at the same time as the reported SES appearance. The amplitude of the transient is larger in the x-direction (north-south) and it is of the order of 4.0 x lo-’ V m-r. The transient signal has a duration of about 5 min.
10 min. AUfllOXlA , (I&04-15 , I
129
It is very difficult in this case to draw any conclusions regarding the source of this transient from the recordings of only one station, However
the amplitude of the transient as recorded by the magnetotelluric station in Pirgos appears to be one order of magnitude lower than that of the SES reported by Varotsos and Alexopoulos (1984a). This difference is most likely due to the different surface resistivities of the two sites at Pirgos.
Case II
The computed residuals from the magnetotel- luric recordings in Amfiloxia (Fig. 8) show a tran- sient signal superimposed on the background noise of the computed residual in the x-direction, at the same time as the reported SES appearance. The duration of the transient signal is about 3 min and it has an amplitude of the order of 6.0 x 10m6 V m -‘, which is compatible with the amplitudes reported by Varotsos and Alexopoulos (1984a).
Also displayed at the beginning of the same
1.0 10-3:
*Hz
-1.0 10-3:
6.0 10-61
AEJ A.
-- - fi -d +_-
-6.0 10-6~
6.0 10-6:
% -6.0 10-6:
2.0 10-5:
*Eat
-2.0 10-5: 12116
Fig. 8. Simultaneous recording of the magnetotelluric components and the computed residuals from the magnetotelluric station in
Amfiloxia for case II. Index x refers to the north-south direction, y to the east-west direction and z to the vertical direction. H is
the magnetic field component and E the electric field component. A E and AH are the computed residuals. Units are A m-’ for the
magnetic field and V m-’ for the electric field. The time indicated is G.M.T.

a PIRCOS 10 mm.
, 83-04-17 , ----
4.0 lo-‘:1 AEx
-4.0 10-7Ir
“x -2.0 lo-3-
b 10 min.
AYFILOXlA 83-04-17 M
3.0 lo-6-
AEY -3.0 10-6~
3.0 10-G:
EY -3.0 1c-6f
hd of recording
AEx I
Fig. 9. Simultaneous recordmg of the magnetot&uric components and the computed residuals from the magnetotelluric stations in
Pirgos (a) and Amfiloxia (b) for case III. Index x refers to the north-south direction, y to the east-west direction and 2 to the
vertical direction. H is the magnetic field component and E is the electric field component. AE and AH are the computed residuals.
Units are A mm ’ for the magnetic field and V m-’ for the electric field. The time indicated is G.M.T.

Fig_ 10. Simultaneous recordi& of the ~llagn~tot&~rie components and the computed residuals frmn the magnetotelluric stations in
Pirgos (a) and Amfiloxia (b) for case IV. Index x refers to the north-south direction, y to the east-west direction and z to the
vertical direction. R is the magnettic field component and E is the dectric field component. hE and 4B are the computed residuals.
Unirs are A m-l for the magnetic field and V m-’ for the dectric field. The time indicated is G.M.T.

segment are two transient signals which can be
related to an artificial source due to their sharp
rise time. A residual field anomaly similar to the
one at 12: 16 may be found about 20 min later in
the same measuring direction.
In view of this and given the presence of an
artificial source at Amfiloxia. it becomes rather
difficult to draw any conclusion regarding the
source of this transient. which nevertheless ap-
pears on the electric residual’ in the x-direction at
Amfiloxia simultaneously with the reported SES
appearance at the Pirgos telluric station.
Case III
A direct comparison of Figs. 9a and 9b, dis-
playing the recordings and the computed residuals
for the magnetotelluric stations in Pirgos and
Amfiloxia, at the time of the reported SES. reveals
no transient signals superimposed on the low
background “noise” of the residual electric fields.
10 min. PI RCOS , 83-05-05 , -
One of the directions of the electric field (6, )
in Amfiloxia was not monitored due to bad earth-
electrode coupling. The other (E,.) shows a tran-
sient variation at the same time as the reported
SES, but this is clearly accompanied by a mag-
netic field variation as seen on the H, recording.
The same observation is made from Pirgos where
the same transient variation is seen simultaneously
on the E, and H, components of the electric and
magnetic fields. respectively.
it should be pointed out that the telegram
corresponding to the SES in this case issued an
“uncertain prediction” and the suspicion that the
signal was induced by the external magnetic field
is confirmed clearly by applying the residual
methodology to the magnetotelluric data.
Case IV
As in the previous case, a direct comparison of
the recordings and the computed residuals in Figs.
"Y -7.0 xl-4IW
7.0 10-4: "x
-7.0 10-4:
Fig. 11. Simultaneous recording of the magnetotelluric components and the computed residuals from the magnetotelluric station in
Pirgos for case V. Index x refers to the north-south direction, y to the east-west direction and z to the vertical direction. H is the
magnetic field component and E is the electric field component. AE and AH are the computed residuals. Units are A rn- ’ for the
magnetic field and V m-’ for the electric field. The time indicated is G.M.T.

10a and lob, from the ma~etote~u~c stations in Pirgos and Amfiloxia, respectively, at the time of the reported SES, leads to the following observa-
tions. No transient signal is seen on the residuals from the Amfiloxia recording. The Pirgos record- ing shows a transient variation of the electric field component E, which is accompanied by a simul- taneous transient variation of the magnetic field component HY having a duration of about 13 min. The electric residual AE, for Pirgos shows a small component of this transient variation within the background noise and this is due to errors in the estimation of the impedance tensor at these fre- quencies. Since the same variation appears on the magnetic recordings of Amfiloxia but not on the computed electric residuals it is considered an external magnetic field variation.
The telegram issued in this case, as in the previous case, spoke of an ‘uncertain prediction’. The suspicion that the SES was induced by the external magnetic field is again confirmed with the methodology presented here.
Case V
Figure 11 displays the magnetotelluric record- ings and the computed residuals from the station at Pirgos which includes the time of the reported SES. The Ey direction had earth-electrode cou- pling problems and is not displayed. However one can see a signal superimposed on the residual A& at the same time as the reported SES in this case. The amplitude of the signal at this station is again one order of magnitude less than that of the SES reported and as in case I, this is different surface resistivities of Pirgos.
attributed to the the two sites at
TABLE 2
133
As in cases I and II, it is extremely ~fficult to draw any conclusions on the source of this electric
signal, solely on the basis of this data.
Seismicity and correlation with issued predictions
Seismological data from the Preliminary Seis- mological Bulletin of the National Observatory of Athens for the period April 3, 1983 to May 12, 1983 show no earthquakes of magnitude M,(ATH) > 4.3 to have occurred within a radius of 150 km from Pirgos. However, there were roughly 20 seismic events ranging in magnitude from M,(ATH) = 3.7 to M,(ATH) = 4.3. Most of these took place in the Kefalonia region and are aftershocks to the January 1983 earthquake se- quence. Three events during the recording period
were of magnitude M,(ATH) = 4 and occurred roughly 120 km to the west of Pirgos. The largest events during the recording period were two of magnitude M,(ATH) = 4.3 which occured in the Kalavrita region roughly 55 km east-northeast of Pirgos. These data can be seen in Table 2.
Varotsos and Alexopoulos (1984b) claim that “every sizable earthquake is preceded by an SES”. The term “sizable” refers to a limitation of the telluric method, which is unreliable for predicting earthquakes of small magnitude (M,(ATH) < 4.0) and of large epicentral distance from the field stations (r > 100 km), due to difficulties in identi- fying the low amplitude SES in the presence of the background magnetotelluric noise.
In order to examine objectively the cross-corre- lation between SES and earthquake occurrence one should refer to Varotsos and Alexopoulos (1984b) where this task was performed using a
Earthquakes with M,(ATH) 2 4 occurring within a radius of 150 km from the Pirgos station between April 3,1983 and May 8, 1983 (epicentral coordinates are given by Strasbourg Monthly Bulletin and local magnitudes by the National Observatory of Athens Preliminary Monthly Bulletin)
Date
10/04/x3 11/04/83 19/04/83 22/04/83 08/05/83
Time Epicentre Epicentral dist. Magnitude (G.M.T) (ON-‘E) from Athens (km) (ML)
22:53 38.48-20.07 w340 4.0
17:23 37.95-21.99 w150 4.3
lo:23 38.13-20.28 w300 4.0
02:46 38.07-20.25 w300 4.0
22:44 38.25-22.50 w130 4.3

1.74
significant number of sizable (M,(ATH) 2 4.0)
earthquakes well separated in time. In view of the
few sizable earthquakes during the recording
period we are concerned with here, and given the
fact that four out of five occurred within a window
of 6-115 hours from each other, one can hardly
make an objective cross correlation here. Nev-
ertheless, by directly comparing the issued predic-
tions in Table 1 and the earthquakes in Table 2 we
may note the following. The prediction issued by
telegram 79 may correspond to either of the
earthquakes on April 10 and April II, regarding
the time window between SES appearance and
earthquake occurrence. However. it can be cor-
related better with the earthquake on April 11,
regarding the location of this event.
The earthquake on April 19 occurred within the
time window of the prediction issued by telegram
81.
Anomalies induced by the external magnetic
field were present at the time of the reported SES
for the predictions issued by telegrams 83 and 84.
Telegrams 83 and 84 issued uncertain predictions.
The prediction of telegram 91 is compatible
with the earthquake on May 8, regarding time,
position and magnitude.
It should be noted that in cases I, II and V,
corresponding to telegram numbers 79, 81 and 91,
an electric signal was found to have been present
in at least one of the residuals from the magneto-
telluric recordings simultaneously with the ap-
pearance of the reported SES in the Greek telluric
network. In the remaining two cases suspicions of
artificial SES were further confirmed by the resid-
ual method presented earlier.
Discussion
Variations in the local electric field preceding
earthquakes have long been reported in the litera-
ture and have been su~a~zed by Rikitake (1976).
However, their correlation with earthquake occur-
rences has been difficult to establish because
background fluctuations in the electric field of
external origin have not been completely
eliminated.
It is obvious that measurements of only the
telluric field can produce ambiguities in the re-
sults, and knowledge of the source field is re-
quired. In this paper. we have presented a method
for removing magnetotelluric field variations of
external origin from short period telluric data
using magnetotelluric impedance tensor analysis.
The results from continuous short period magne-
totelluric measurements conducted in Greece indi-
cate that impedance tensor analysis is successful
in estimating the electromagnetic induction at the
measuring point with great accuracy. The subse-
quent calculation of the residual electric field
clearly improves the detection of any anomalous
change in the telluric field. In this first step to-
wards a more quantitative analysis of electromag-
netic field variations prior to earthquakes, the
information available from having simultaneous
recordings at two sites was used only in a rather
qualitative fashion. The measurements are clearly
noise contaminated and this can lead to difficul-
ties in inte~reting the nature of the residual elec-
trical variations observed. It would be of interest
for future work to incorporate simultaneous mea-
surements of the magnetic field from more than
one station, whereby a better description of the
noise terms involved in the residual calculations
could be obtained.
The present method was applied to the detec-
tion of the suspected SES in five cases during the
recording period. Of the five cases under study, in
two it was found that an external transient mag-
netic disturbance was present simultaneous to the
reported SES time. For these cases an uncertain
prediction was actually issued. For the remaining
three cases a transient electric signal was observed
superimposed on the computed residual electric
field of the magnetotelluric recordings, simulta-
neous to the SES reported by Varotsos (P. Varot-
SOS. pers. commun. 1983).
In view of the absence of larger earthquakes
during the time of recording, our limited data do
not contribute to the estabIishment of the relation
between reported anomalous changes of the geo-
electrical field (SES) and earthquakes. It is obvi-
ous that recordings prior to small magnitude
earthquakes, such as those presented here, are
insufficient to establish such a relation. However.
the magnetotelluric results presented here hardly
contradict the observations from the ongoing re-

search in the Greek telluric network. As a result, this paper may be considered to be of a pre-
liminary nature, suggesting that the residual meth- odology described above may prove useful in fu- ture research into earthquake prediction by means of geoelectricaI currents.
This research was carried out at the Seismofogi- cal Department and the Solid Earth Physics De- partment of Uppsafa University_ Partial support was provided by the Swedish Natural Science Research Council and by the Greek Ministry of Public Works.
References
Clarke, J., Gamble, T.D, Goubau, WM., Kock, R.H. and
Miracky, RF., 1983. Remote-reference ma~etotell~~c~
equipment and procedures. Gwphys. Prospect., 31:
149-170.
Jepsen, J.B and Pedersen, LB., 1981. Evaluation of a tensor
AMT measurement system. Geoskrifter, 15: l-68.
Pedersen, L.B., X982. The m~$netotellu~c impedance tensor,
its random and bias errors. Geophys. Prospect., 30:
188-210.
Rikitake, T., 1947, A method for studying the relations be-
tween the changes in g~m~~etism and earth current. Bull.
Earthquake Res. Inst., 25: 9-13
Rikitake, T., 1976. Earthquake prediction. Dev. Solid Earth
Geophys., 9.
Sims, W.E., Bostick, F.X. and Smith, H.W., 1971. The estima-
tion of the magnetotetluric impedance tensor elements from
measured data. Geophysics, 36: 938-942.
Varotsos, P. and Alexopoulos, K., 1984a. Physica properties of
the variation of the electric field of the earth preceding
earthquakes, 1. Tectonopbysics, 110: 73-98.
Varotsos. P. and Alexopoulos, K., t9gbb. Physical properties
of the variation of the electric fiefd of the earth preceding
earthquakes, II. ~te~~a~on of epicentre and magnitude.
Tectonophysics, 110: 99-125.
Vozoff, K., 1972. The ma~etotei~~~c method in the explora-
tion of sedimentary basins. Geophysics, 37: 9%141.