Embed Size (px)
Citation preview

The AgraGate Experience&
Lessons Learned
David MillerChief Science Officer
AgraGate Climate Credits Corp&
Director of ResearchIowa Farm Bureau Federation


• An entity for carbon credit aggregation owned by Iowa Farm Bureau Federation
• First licensed aggregator on the Chicago Climate Exchange (2003)
• Aggregation Specialists – Building a nation-wide network of contract facilitators in every state.
• Handling about 6 Million Carbon Credits annually
• “Country Elevator of Carbon Credits”
• General Farm Organization
• Part of the American Farm Bureau Federation
• 155,000 member families
• Political Representation
• Member Services

Services
• Information • Enrollment• Certification
• Verification• Credit marketing

Within the US: Agriculture accounts for 7 % of GHG emissions Carbon sequestration offsets 11 % of U.S. emissions
U.S. GHG Emissions: 7,260 million metric tons CO2e
Ag. N2O: 5%
Ag. CH4: 2%
Other: 14% **
U.S. Carbon Sequestration: 828.5 million metric tons CO2e
Forests: 72%
Wood products: 12%
Urban trees: 11%
Agricultural Soils: 5%
Fossil Fuel CO2: 80%
Source: US EPA. 2007. Inventory of U.S. Greenhouse Gas Emissions and Sinks: 1990 - 2005

Energy Use 14%
Enteric Fermentation 22%
Cropland Soils 34%
Managed Livestock 10%
Grazed Lands 18%
Rice Cropping and Residue Burning
2%
U.S. Agriculture and Forestry Greenhouse Gas Inventory: 2005
Within agriculture: Half of emissions are from livestock and grazing, A third are from cropland nitrogen, and The remainder from energy use and small sources

Approaches to Greenhouse Gas Regulation• Traditional Command and Control
– Regulatory agency sets standards • Specific technologies (scrubbers)• Performance (tons, tons/unit output)
• Cap and Trade– Regulatory agency sets overall objective (total allowable emissions)
• Allocates or auctions emission allowances (auction = tax)• Firms must obtain allowances in order to emit a pollutant
– Firms can receive allowances, purchase allowances, or reduce emissions
• Cap and Trade with Offsets• Unregulated firms can receive credits for reducing emissions• Regulated firms can purchase offset credits to meet regulatory requirements
(“offsetting emissions”)
• Emission Taxes– Internalizes public damage– Equates costs of abatement

Why is there interest in Cap-and-Trade?
Concept: Regulators set overall limits on emissions (or environmental performance). Firms must have allowances to emit the pollutant. Allowances can be bought, sold, or transferred
Attributes:• Establishes clear property rights for pollutants
• Taps market forces to efficiently allocate resources to reduce pollution
• Provides incentives to innovate
• Equates costs of environmental control across all polluters
Concerns:• Makes it difficult to address localized environmental damage
• Could concentrate pollution in lower income areas
• Distribution of allowances creates new assets – and transfers of wealth
• Cost of regulation
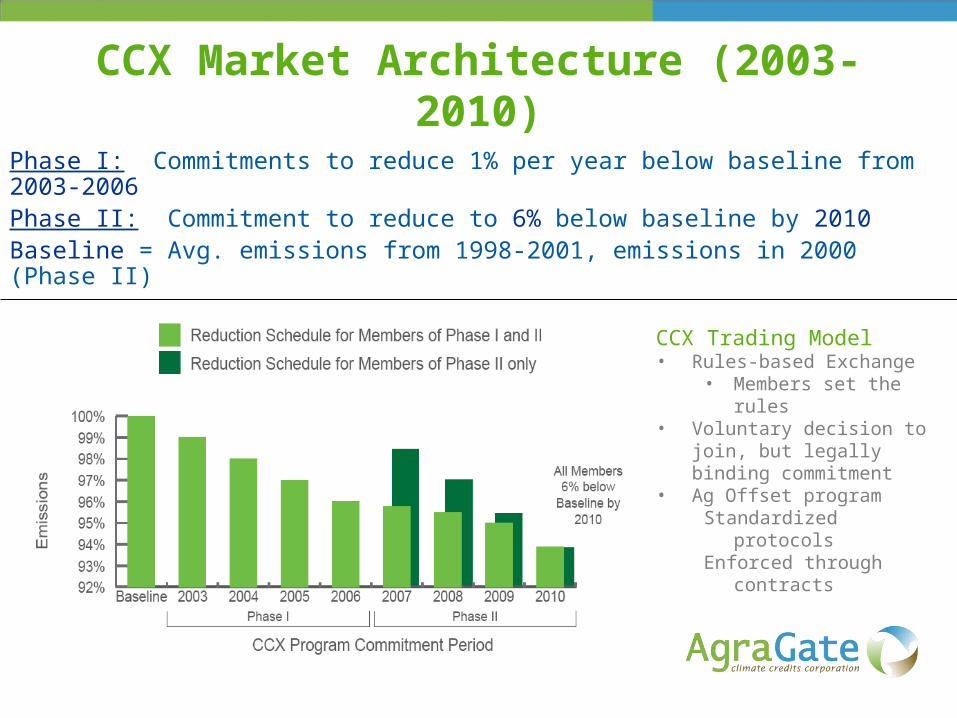
CCX Market Architecture (2003-2010)
Phase I: Commitments to reduce 1% per year below baseline from 2003-2006Phase II: Commitment to reduce to 6% below baseline by 2010Baseline = Avg. emissions from 1998-2001, emissions in 2000 (Phase II)
CCX Trading Model• Rules-based Exchange
• Members set the rules• Voluntary decision to join, but
legally binding commitment• Ag Offset program
Standardized protocolsEnforced through contracts
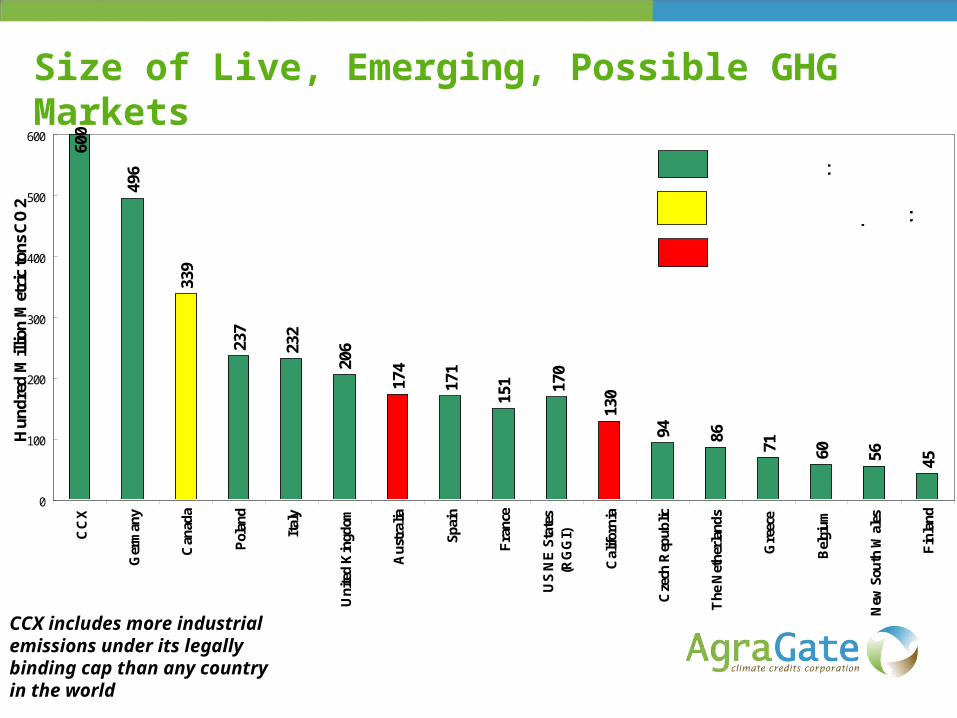
Size of Live, Emerging, Possible GHG Markets60
0
339
237
232
206
174
171
151
130
94 86
71 60 56 45
496
170
0
100
200
300
400
500
600
CC
X
Ger
man
y
Can
ada
Pol
and
Ital
y
Uni
ted
Kin
gdom
Aus
tral
ia
Spai
n
Fra
nce
US
NE
Sta
tes
(RG
GI)
Cal
iforn
ia
Cze
ch R
epub
lic
The
Net
herl
ands
Gre
ece
Bel
gium
New
Sou
th W
ales
Fin
land
Hu
nd
red
Mill
ion
Met
ric
ton
s C
O2
Live Market
Market in development
Under discussion
CCX includes more industrial emissions under its legally binding cap than any country in the world

Emission Reductions and Project-based Offsets in CCX 2003 through 2007*
(metric tons CO2)
404,358,500
53,359,000
11,837,200
469,554,700
0
50,000,000
100,000,000
150,000,000
200,000,000
250,000,000
300,000,000
350,000,000
400,000,000
450,000,000
500,000,000
Internal On-site EmissionReductions at Member
Facilities
Project-based Offsets Forest Management Total
met
ric
tons
CO
2
*As of 2-20-09. A portion of new member emission reductions are currently undergoing verification.
86%
11%
3%

CCX Offset Projects
• As science directs, foster emission reductions all sectors: low cost, win-win
– Landfill, agricultural and coalmine methane capture/destruction
– Agricultural soils best management practices
– Afforestation & forest management
– Fuel switching, renewables
• All projects must be independently verified by an approved entity
• CCX Offset Rules can be found at:– http://www.chicagoclimateexchange.com/docs
/offsets/CCX_Rulebook_Chapter09_OffsetsAndEarlyActionCredits
Predictable: facilitate carbon finance
Additional: beyond regulation, recent
Verifiable: eligibility, quantity, ownership
No cherry picking – emitters must take entity-wide reductions
Fungible: All Carbon Financial Instruments are equivalent
Avoid perverse incentives
Conservative crediting
Reserve pools for sequestration assurance
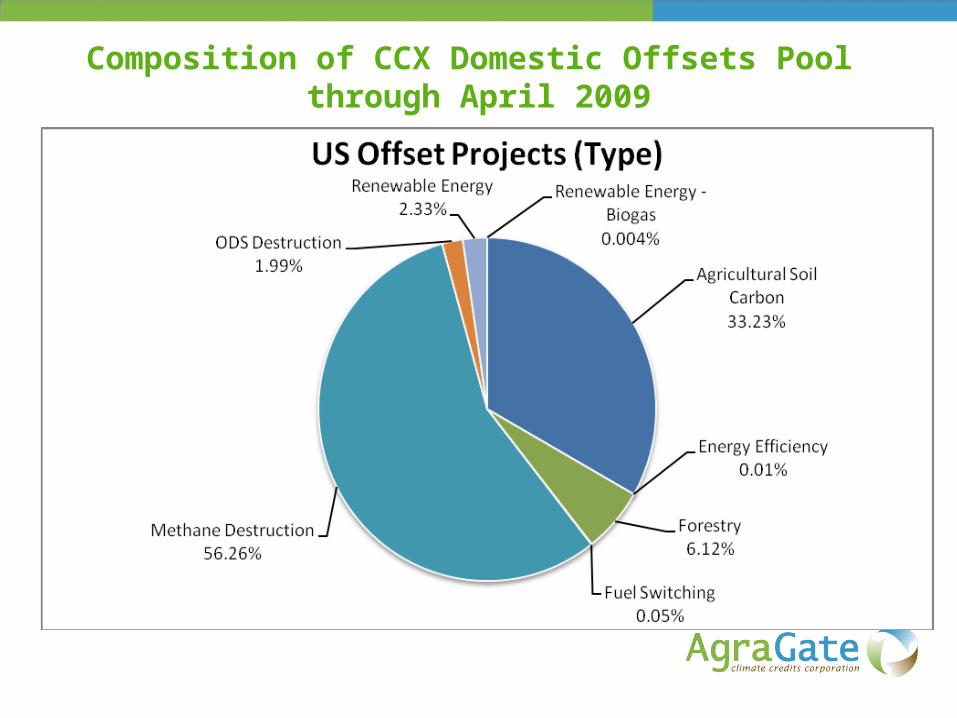
Composition of CCX Domestic Offsets Pool through April 2009

CCX CFI spot and derivatives volume 2004-2008
0
20
40
60
80
100
120
2004 2005 2006 2007 2008
Mil
lio
n (
me
tric
to
ns
) Options
Futures
Cash

Annual Average* Price for CCX CFIs 2003-2008
$0.97 $1.15
$1.89
$3.71
$3.16
$4.43
$0.00
$0.50
$1.00
$1.50
$2.00
$2.50
$3.00
$3.50
$4.00
$4.50
$5.00
2002 2003 2004 2005 2006 2007 2008 2009
Ave
rage
pric
e pe
r m
etric
ton
CO
2
* Volume-weighted average for spot market trades
2009

U.S. Farmer Participation in CCX
• 2 major aggregators
– AgraGate & Farmers Union
• Many minor aggregators
• 4.5 million acres no-till• 2 million acres grass
establishment• 5 million acres rangeland• 0.5 million acres afforestation• 4 million acres managed forest• ag methane projects
• 16 million acres nationally in 36 states
• 9,000 farmers, ranchers & landowners
• 25 professional verification entities approved• “green jobs” employment &
income is a reality at CCX• Tens of millions of dollars in
new income through global environmental services


Agricultural soil sequestration offsets in CCX
• No-till, New Grasslands, Rangeland
• CCX Special Committee on Soil Carbon (scientific committee) provided guidance on annual carbon gains, geography
• 20% Implicit Reserve to mitigate against post-contract reversals
• 20% Explicit Reserve to mitigate against in-contract reversals
• Full accountability in-contract
• Avoided perverse incentive to till if only “new” no-tillers allowed in
• 100% annual certification; 10% visual inspection;
• Pilot project on satellite imagery

Forestry OffsetsTwo Protocols
1. New tree plantings -- Planting and/or natural regeneration on private non-forest lands after Jan 1, 2003.
• Credits based on net annual increase in carbon stocks (CO2 equivalents) during 2003-2010.
• Thinning of a tree stand is not allowed.• Proof of ownership and legal description of land.• Statement of Intent to keep as forest• 15 year contract.
2. Sustainably Managed Forests -- Must provide evidence of sustainable forest management of all their managed forest land.
• Must have a forest management plan and must be member of the Sustainable Forestry Initiative or American Tree Farm System.
• Provide a description of forest management activity and quantification model used.
• Stand thinning & harvest is allowed.• Long-lived wood credits• 15 year contract.

Methane Offsets
• Ag Methane destruction projects that were put into place after Jan 1, 2003.
• Eligibility– Liquid slurry storage– Pit storage below animals
(> 1 month)– Uncovered anaerobic
lagoons

CCX Offsets Issued 2009Agricultural Soil Carbon Offset 10,857,400
Forestry Offset 6,022,000
Landfill Methane Offset 1,840,700
Renewable Energy Offset - Wind 1,557,200
Energy Efficiency Offset 1,413,400
Coal Mine Methane Offset 1,159,300
Renewable Energy Offset 1,041,700
Fuel Switching Offset 904,200
Agricultural Methane Offset 483,800
Renewable Energy Offset - Biomass 472,300
Waste Disposal Offset - HFC Destruction 255,700
Ozone Depleting Substance Destruction Offset 175,300
Renewable Energy Offset - Biogas 55,800
Wastewater Treatment Methane Recovery Offset 44,300
Organic Waste Disposal Methane Offset 25,700
Grand Total 26,308,800

Emerging Issues for Carbon Markets
• Scope of Coverage• Eligibility• Consistency of Rules• Financial Impacts• Environmental Considerations• Unintended Consequences

Impacts of Climate Change Legislation*
• If enacted, the ultimate cost of H.R. 2454 would be determined by the response of the economy to the technological challenges presented by the bill.– Allocation of allowances determines who ultimately bears the cost.– Availability of offsets is the key factor in determining the cost of
H.R.2454.– Long-term depends on low-carbon electrical sources such as
nuclear power, renewables, natural gas, and coal-fired capacity with carbon capture and storage technology.
– Attempts to estimate household effects (or other fine-grained analyses) are fraught with numerous difficulties that reflect more on the philosophies and assumptions of the cases reviewed than on any credible future effect.
*From CBO analysis of H.R. 2454

Costs and Benefits of Climate Policy to Agriculture
• Four main issues:– Production costs : energy and fertilizer inputs
– Offsets/incentives: GHG reduction potential
– Renewable energy: Wind, bioenergy
– Global food security
• Agriculture is energy intensive:– Fertilizer and fuel costs account for 50-60 percent of variable costs of
production for corn;
– Because of higher personal transportation expenditures, rural households are more likely than urban households to feel the pinch of increased gas prices.
• The costs should be considered against the potential benefits from offsets and renewable energy markets
Estimates of Costs of W-M
• Congressional Budget Office (6/19/09)– CBO estimates that households costs would range from an average
net benefit of about $40 to net costs of approximately $245. Overall, costs for households would average 0.2 percent of their average after-tax income.
– $3 Billion in Domestic Offsets annually
• EPA Analysis (6/23/09)– 10-35% increases in electricity prices; 7-30% increases in natural
gas prices; and 3-15% increases petroleum prices between 2015-2050.
– Changes in GDP range from +0.03 in 2012 to -1.3% by 2050.
– Domestic offsets would range from 166 MMTCO2e – 643 MMTCO2e between 2012-2050.

Total Ag Net Returns in 2025*
*University of Tennessee analysis, October 2009

Issues for Ag & Forestry
• Who regulates?• Will offsets be included• Who will set standards for
ag & forestry?• Effects on ag inputs• Effects on energy markets• Effects on economy• Linkages to world markets
Key Carbon Offset Issues (RSVP&E)
• Real – Quantification methodology• Surplus – Additionality measures• Verified – 3rd party certification• Permanence – Duration &
reversability• Enforceable – Contract terms &
ownership

Potential roles for USDA in Carbon Offset Markets
• Determine eligible practices; • Establish quantification protocols; • Establish reporting requirements; • Provide technical assistance; • Certify implementation; • Maintain registry of information, recordkeeping, including ensuring
against duplicate records; • Conduct audits and spot checks; • Award offsets or issuance of incentive payments; • Monitor against loss of carbon that is sequestered.

Asking the Right Questions
• What can agriculture and forestry do to mitigate carbon emissions?
• Focus is on reductions:
– Less nitrogen
– Less cattle
– Reduced stocking rates
– Land-use change
– Afforestation
– Grasslands
– Forest preservation
• How can we achieve global food security in a carbon constrained world?
• Focus on resource use efficiency
– Output per unit of input
– Increased food production
– Technology solutions
– Minimizes land-use change
– Resource utilization
• Managed forest
• Grazing efficiency
• Adaptation
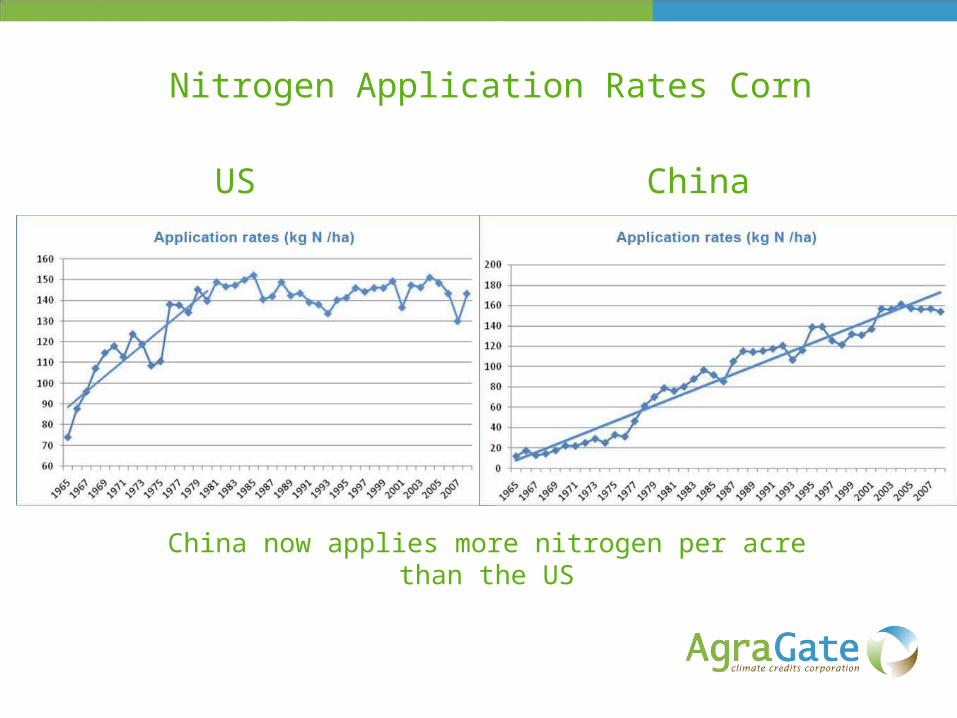
Nitrogen Application Rates Corn
US China
China now applies more nitrogen per acre than the US

Yield Comparison - Corn
US China
China corn yields today are where the US was in 1968
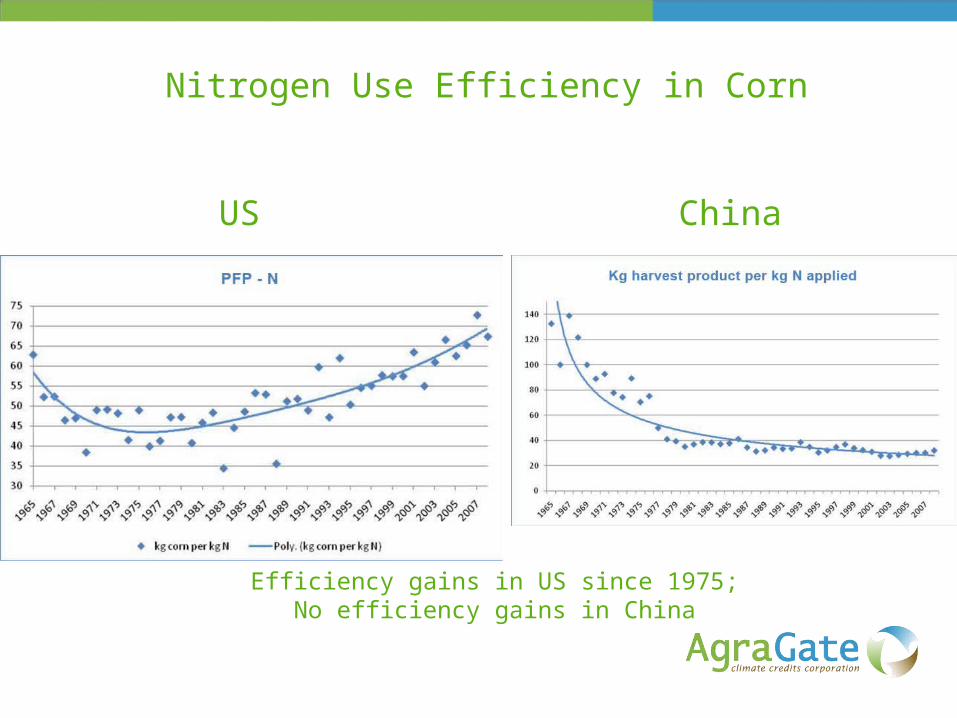
Nitrogen Use Efficiency in Corn
US China
Efficiency gains in US since 1975;No efficiency gains in China

Lessons Learned
• The US “voluntary” market has allowed ag & forestry to “learn by doing”
• Ag & Forestry offsets are the oil that will enable a GHG reduction program to run smoothly
• As the carbon market matures, more opportunities are likely to emerge for ag & forestry
• Over-estimation of offset supply
• Political uncertainty can kill fledgling markets– Specific authority & recognition of ag &
forestry offsets– USDA needs to be the lead agency on
ag & forestry offsets– “grandfathering in” of early action
credits• Perfection is the enemy of progress &
success– Mechanisms designed for developing
countries are not necessarily good for the US
– Zero tolerance does not work for ag– Reasonable operating criteria for
offsets – must work on “working lands”

Lessons Learned
• Contract length matters
– Land control turnover
– Commitment
• The paperwork requirements may be more than most farmers will put up with.
• Offsets vs USDA programs
• Voluntary eco-system markets are not reliable enough for most farmers
• Myths & perceptions are hard to overcome
• There are a lot of people who are quite content to dictate production practices to farmers

Let us remember:
• For society as a whole, there is a very strong correlation between energy use and standard of living. Energy makes manual labor more efficient; is a catalyst for transformation of ingredients and raw products to usable goods; and energy extends the capabilities of the human mind.
• For society to prosper, it must grow. The debate cannot become one of, “maintaining the status quo with less”. It must be a debate about “how to do more with what we have.”