Embed Size (px)
Citation preview

The AGR Apprenticeships Survey 2017

The AGR Apprenticeships Survey 2017
Organisations that are not AGR members can purchase this report for £150 + VAT
All information contained in this report is believed to be correct at the time of publication but the publisher does not accept responsibility for any loss arising from decisions made upon this information.
Association of Graduate Recruiters © 2017
All rights reserved.
Association of Graduate RecruitersBath PlaceLondon EC1A 2JE
The key findings for this report were collected in April 2017 and the report was published in June 2017.
This survey, analysis and commentary have been produced by Samuel Gordon, AGR Research Analyst. For any queries please email [email protected] or contact 020 7033 2465.

3
Contents
ContentsForeword 4Executive summary 5
1. Apprenticeships at student employers 7
2. 2017 trends 12
Predicted changes in hiring 13
Hiring by level and by sector 16
Responses to the 17
Apprenticeship Levy
Minimum entry criteria 19
Attraction 21
3. Comparing graduates and apprentices 26
Resourcing 27
Soft skills gaps 29
Recruiters’ key challenges 32
4. Appendix 33
Employer diversity initiatives 34
Methodology and respondent 36
profile
of respondents are paying the Apprenticeship Levy
100%

Foreword
4
challenges for recruiters, and have very different gaps in soft skills. Understanding these differences will help employers to tailor their approaches to both forms of talent and to make the most of them.
As usual, delve into this report, share the findings with colleagues, and let us know how we can support your decisions. We are constantly evolving our research and want to do what we can to ensure that our industry keeps creating great opportunities for students both in 2017 and well into the future.
Stephen IsherwoodChief Executive, AGR
Samuel GordonResearch Analyst, AGR
Stephen Isherwood
Samuel Gordon
Welcome to AGR’s first Apprenticeships Survey. While we typically capture insight on apprenticeships in our Annual Survey, which launches in September, this year we have brought forward a set of key research questions so that you can make well-informed decisions on apprenticeships as soon as possible. We have also combined this new information with existing AGR research to create the most holistic picture. All 144 survey respondents are paying the Apprenticeship Levy in 2017 and they represent a wide range of organisational sizes as well as collectively employing more than 2.4 million staff.
The number of apprenticeships is rising rapidly among Levy-paying student employers. Intermediate, Advanced and Higher level apprenticeships are all on the rise, with varying trends by sector. Half of employers are starting programmes in response to the Levy and a wide range of attraction and selection activities are being carried out as employers seek the best young talent for their organisations. Competition for apprentices will rise in future and employers will need to stay up to date with the latest trends.
Employers wishing to compare the relative merits of apprentices and graduates will also find a number of key differences. Broadly speaking, organisations attract and select these two types of talent in the same way. However, graduates and apprentices go onto different types of contracts, programmes of different lengths, make up different shares of the workforce, pose different
Forewordapprentices hired by survey
respondents in 2017
12,281

Executive summary
5
Levy-paying student employers are rapidly expanding their apprenticeship programmes in 2017. The overall growth in apprenticeships is predicted at 59% this year, although 8% of respondents are still unsure of the volumes of apprentices they will be recruiting. 74% of employers say that their apprentice programmes will have no impact on graduate hiring. There appears to be strong demand for student talent.
Employers are still evolving their approaches to the Apprenticeship Levy (see Chapter 2.1 for a description). 58% say that managing their organisational response to the Levy is one of their biggest challenges in 2017. On average, they expect to reclaim 33% of their Levy bill to train new apprentices this year, with 23% saying that a lack of government-approved apprenticeship standards in
Executive summary
their sector is one of their top challenges. 50% are starting new programmes as a result of the Levy with some reclaiming their Levy bill to upskill existing staff instead.
Apprenticeship trends also vary by level of apprenticeship. 34% of apprenticeships in 2017 are Advanced level apprenticeships. Intermediate-level apprenticeships make up the highest volumes in the IT & Telecommunications, Construction and Banking sectors. 42% of employers have an A-level requirement for Higher level apprenticeships and just 5% require students to have relevant work experience to apply.
In terms of resourcing, apprentice recruitment teams typically have 35 apprentices for every team member with an average of 3 staff in a team.
growth in apprenticeships predicted this year
59%

6
Apprentice intakes are typically 1% of staff while graduate intakes are 1.9%, for those organisations recruiting both types of talent. 35% of organisations employ apprentices on fixed-term contracts and in 59% of these cases the hire has to apply for a job at the end of the programme. The programmes themselves vary between 1-6 years long depending on the nature of business needs.
So far, apprenticeships in 2017 have received an average of 19 applications for every vacancy (relative to 68 applications per vacancy for graduates in 2016). 53% of firms have an attraction & marketing budget for apprentices with an estimated average spend of £743 per hire. 45% of organisations market specifically to parents, and 65% offer students work experience. 37% outsource at least some of their marketing, reflecting the importance of partnerships in our industry.
Selection processes for apprentices differ to those for graduates. Employers are less likely to use video interviews, psychometric tests or assessment centres and appear more likely to use bespoke application forms as opposed to asking for formal CVs. 44% of organisations outsource at least one aspect of their selection process for apprentices.
Executive summary
Employers may expect apprentices to have better soft skills than these hires have in practice. 91% of organisations believe that at least some apprentices lack expected soft skills, compared with 49% of employers stating this for graduates. The key skills for apprentices to focus on are seen as business-appropriate communication, time management and professionalism. Organisations are likely to need to invest in remedial skills training, review the nature of their work experience programmes and communicate their expectations to students in order to make the most of apprentice hires.
Finally, employers expect a wide variety of challenges related to apprenticeships this year. Many of these are similar to the challenges highlighted by graduate recruiters. However, improving diversity and responding to competition are the key issues which are seen as more pronounced for apprentices. There are plenty of areas for employers to share best practice and plenty of scope to keep evolving and improving our industry’s approach to apprenticeships.
Executive summary
of employers use fixed-term contracts for apprentices
35%


Chapter 1
8
Apprenticeships at student employers
Type of Level Number of Examples of recently approved standards apprenticeship approved standards
Intermediate 2 37 Fishmonger, Construction Steel Fixer
Advanced 3 68 Composites Technician, Facilities Management Supervisor
Higher 4,5,6,7 60 IS Business Analyst, Nuclear Technician
Degree 6 and 7 22 Power Engineer, Healthcare Science Practitioner
Table A: Current apprenticeship levels and standards
AGR employers (referred to as ‘employers’ for most of the rest of this report) recruit students from a variety of sources onto a variety of programmes. Member organisations come from over 17 sectors, recruit into all regions of the UK, and run graduate development schemes, apprenticeships, internships, year-long industrial placements and direct entry school leaver programmes. These employers are a robust proxy to the wider market for graduate hires although are increasingly managing multiple pipelines of talent. They are also starting to link their programmes e.g. encouraging interns to re-apply for graduate roles.
Apprenticeships are training programmes that combine on-the-job learning with study. They lead to a qualification. UK employers who hire apprentices must ensure that certain criteria are met, such as 20% of the time of these hires being spent on off-the-job training, and the apprenticeship must also be in line with industry-recognised standards which have been formally approved. The number of currently approved standards is shown below.
55% of AGR employers hired apprentices in 2016. However, they have been gradually increasing the use of apprenticeship programmes for some time. Over the last five years, the share of employers with higher apprenticeship programmes has doubled from 12% to 23%, and the overall volume of apprentices rose by 13% in 2016 alone. A quarter of employers collaborated with other employers to promote apprenticeships last year.
Source: https://www.gov.uk/government/publications/apprenticeship-funding-bands
of employers collaborated with peers to promote apprenticeships
in 2016
23%
55% of AGR employers hired apprentices in 2016.
However, they have been gradually increasing the
use of apprenticeship programmes for some
time.

Chapter 1
9
In 2016, intermediate level apprenticeships were used by the highest share of student employers, and apprentices at different levels were typically paid different amounts. Intermediate level apprentices were paid a median starting salary of £14,000 which is well above the minimum apprenticeship wage of £3.50 an hour. Graduates are typically paid £27,500 on graduate programmes, which is 72% more than the median starting salary for the highest level of apprenticeship at £16,000.
This year, organisations who recruit both types of talent typically recruit more graduates than apprentices. An annual intake of apprentices is typically 1% of the workforce while an annual intake of graduates is typically 1.9%. Three sectors – the Construction, Energy and IT & Telecommunications sectors – have more apprentices than graduates, which perhaps reflects
a historical focus on apprenticeships and the technical nature of these industries. By contrast, the Accountancy and Legal sectors have far more graduates than apprentices, reflecting their focus on bringing in students to become professionally qualified. Apprentices and graduates appear to be meeting different sets of business needs.
>>
Type of Level Equivalent educational Share of AGR employers Median starting apprenticeship level hiring in 2016 salaries in 2016
Intermediate 2 5 GCSE passes at grades A* to C 28% £14,000
Advanced 3 2 A level passes 27% £14,050
Higher 4,5,6,7 Foundation degree and above 23% £16,000
Graduates n/a University degree 96% £27,500
Table B: Information on apprentices for 2016
Figure 1: Graduate and apprentice intakes as a share of the workforce – 94 employers who hired both types of talent in 2017, representing 12,191 graduate hires and at least 10,569 apprentice hires. Note: these numbers represent one annual intake as opposed to the hires currently on internal programmes
median starting salary for an intermediate-level apprentice
in 2016
£14,000

Chapter 1
10
Only 33% of employers hire apprentices onto permanent contracts. 21% of employers also have apprentices re-apply for a permanent role at the end of their fixed-term contract. Employers stated that whether the apprentice moves to a permanent role depends on business requirements, role availability and satisfactory performance.
By comparison, 67% of employers offer permanent contracts for graduates. Part of this difference could be due to the fact that 94% of graduate employers state that they run graduate programmes to build a pipeline of future leaders. The use of permanent or fixed-term contracts is linked to workforce planning.
Apprenticeship programmes also vary in length. 54% of intermediate programmes are just one year long, while 70% of higher level apprenticeships are three years or longer. Of the three sectors who provided enough information to establish trends by level within their sector – the Retail, Construction and Engineering sectors – the Retail sector had programmes that were the shortest in length with 71% of Intermediate level programmes being one year long.
By comparison, graduate programmes are overwhelmingly two years long. This reflects their focus on building leadership skills and wider business awareness: graduate employers state that most key soft skills can be learnt within a year, and 81% of employers offer multiple rotations between business units that typically last six months each.
>>
Figure 2: Types of contract apprentices are recruited onto – 130 employers with at least 12,277 apprentice hires. Source of graduate data: AGR Development Survey 2017
Figure 3: Length of programmes – 121 employers with at least 12,273 apprentice hires. Source of graduate data: AGR Development Survey 2017

• What ratio of graduates to
apprentices is best suited to
your organisation’s business
model?
• What share of intermediate
level apprentices are
expected to progress
to advanced level
apprenticeships and beyond?
• Does guaranteeing a
permanent role at the end of
an apprenticeship programme
make the programme more
attractive to prospective
applicants?
Questions to explore:
?
Chapter 1
11

13
This chapter covers the ways in which employers are attracting and selecting apprentices in 2017 and responses to the Apprenticeship Levy in terms of reclaiming Levy bills and starting new programmes. Comparisons with graduates are based on data from the AGR Annual Survey 2016, unless stated otherwise.
2017 trends
The Apprenticeship Levy is a UK government initiative which came into force in April 2017. This Levy requires all UK employers with a payroll of over £3 million to pay 0.5% of that payroll to the government, although these funds can be recouped for the specific purpose of training apprentices. These apprenticeships can be for existing staff or new hires or a combination of both. The Levy affects less than 2% of UK employers but is expected to change the landscape for apprenticeships overall.
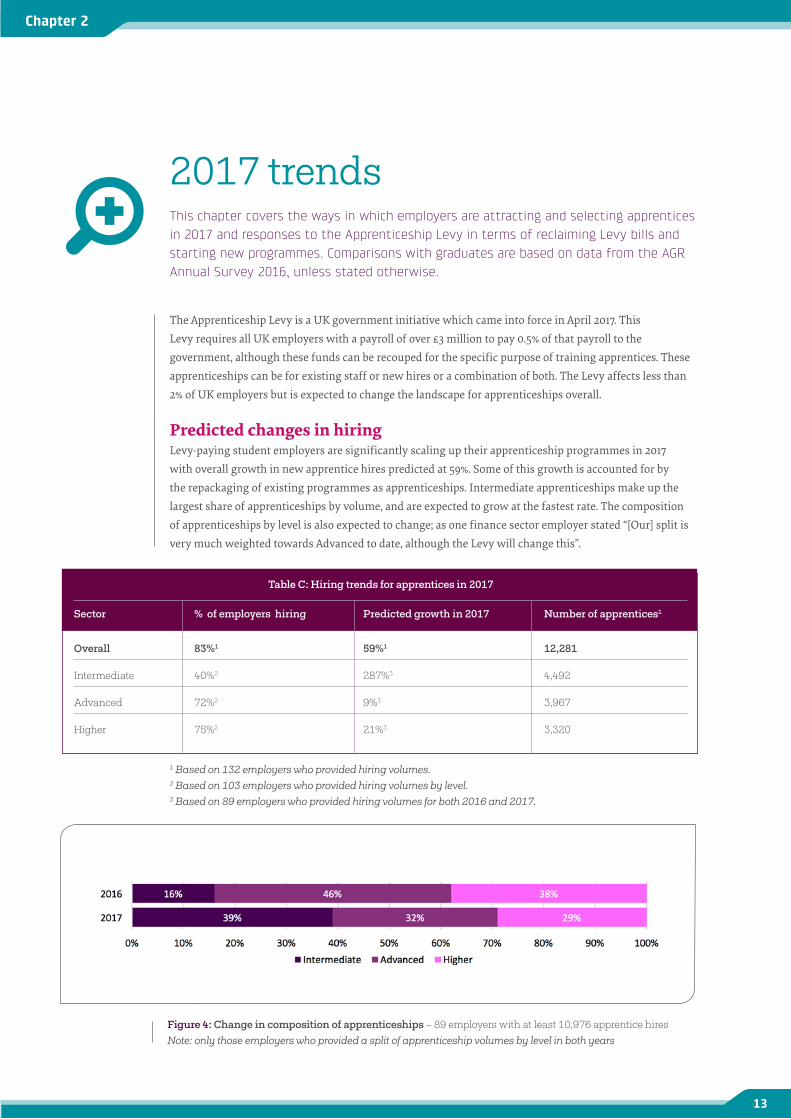
Predicted changes in hiringLevy-paying student employers are significantly scaling up their apprenticeship programmes in 2017 with overall growth in new apprentice hires predicted at 59%. Some of this growth is accounted for by the repackaging of existing programmes as apprenticeships. Intermediate apprenticeships make up the largest share of apprenticeships by volume, and are expected to grow at the fastest rate. The composition of apprenticeships by level is also expected to change; as one finance sector employer stated “[Our] split is very much weighted towards Advanced to date, although the Levy will change this”.
1 Based on 132 employers who provided hiring volumes.2 Based on 103 employers who provided hiring volumes by level.3 Based on 89 employers who provided hiring volumes for both 2016 and 2017.
Chapter 2
Sector % of employers hiring Predicted growth in 2017 Number of apprentices1
Overall 83%1 59%1 12,281
Intermediate 40%2 287%3 4,492
Advanced 72%2 9%3 3,967
Higher 75%2 21%3 3,320
Table C: Hiring trends for apprentices in 2017
Figure 4: Change in composition of apprenticeships – 89 employers with at least 10,976 apprentice hiresNote: only those employers who provided a split of apprenticeship volumes by level in both years

14
Chapter 2
These hiring predictions should be treated as a guide only. 44% of organisations started recruiting for apprentices between January-April of this year, and a number are still recruiting. Employers also highlighted ongoing uncertainty e.g. “It is difficult for us to forecast a number for 2017, apprentices are recruited locally within the business units and recruitment of these is not planned ahead.” and “Still trying to determine opportunity and appetite to bring apprentices on board.” The market for apprentices is still in flux even though growth is expected.
This predicted growth in new apprentice hires also appears to having little impact on graduate hiring. 74% of employers stated that their apprentice and school leaver programmes were having no impact on the number of graduates hired in 2017. Employers are even more certain of this now that the Levy has come into force: just 51% of employers stated that there would be no impact on graduate hiring when asked a similar question in mid-2016. Demand for apprentices and graduates does not appear to be strongly connected at this stage.
>>
Figure 5: When employers start recruiting for apprentices – 119 employers with at least 12,227 apprentice hires.
Figure 6: Impact of apprenticeship/school leaver programmes on the numbers of graduates hired in 2017 – 139 employers with at least 12,281 apprentice hires.
44% of organisations started recruiting for apprentices
between January-April
44%

15
Chapter 2
• As more Higher level
apprenticeship standards
get approved, how will this
change your organisation’s
apprenticeship strategy?
• How might your internal
planning cycles need to
change to account for
growing competition for
apprenticeship talent?
• As apprenticeship
programmes grow, how are
they likely to affect graduate
recruitment in future?
Questions to explore:
?

16
Chapter 2
Hiring by level and by sectorExpected growth rates in apprenticeships vary by sector. The largest volumes of apprenticeships were in the IT & Telecoms and Banking sectors, while the highest growth rates were in the Retail and IT & Telecoms sectors. The Energy, water or utilities sector was the only sector to experience a decrease.
Based on 132 employers who provided overall hiring volumes. Not enough Public sector responses to report on this sector. The sum of all levels may not add to the overall total as only 103 employers were able to provide the levels of their apprentice hires. 1. Excluding one employer undergoing a restructure.
>>
Sector 2017 Average per % growth Intermediate Advanced Higher
hires employer from 2016
Overall 12,281 93 59% 4,492 3,967 3,320
Accountancy or professional services 1,108 139 72% 1 65 1,042
Banking or financial services 1,906 147 18% 885 723 264
Construction/Built Environment 709 59 15% 194 88 159
Energy, water or utilities 613 68 -8%1 265 296 52
Engineering or industrial 1,511 72 33% 197 837 477
IT & Telecommunications 3,100 388 125% 2,189 818 93
Law firm 150 7 52% 21 63 45
Retail 1,273 141 363% 450 666 157
Table D: Apprenticeship hires in 2017
Figure 7: Apprenticeship volumes by level of apprenticeships – 103 employers with at least 11,779 apprentice hires
• How do you expect growth
in apprenticeships in your
sector to change over the
next five years?
• Which sectors is your
organisation competing with
for apprenticeship talent?
• Which organisations can
you collaborate with on
apprenticeships?
Questions to explore:
?of apprenticeships are
intermediate level
38%

17
Chapter 2
Responses to the Apprenticeship LevyRespondents to this survey are typically reclaiming part of their Levy bill to train new hires. On average, they are reclaiming just 33% of their Levy bill for this purpose. This estimate is in line with research by BPP1, which suggests that organisations intend to use an average of 43% of their Levy bill overall in 2017.
The low use of funds for new hires appears to be due to ongoing planning around the Levy and also use of these funds to upskill existing staff instead. Comments included: “In year 1 the majority of funding will be directed in using apprenticeships to strengthen existing internal development programmes”, “We are likely to initially use the levy with existing staff” and “External hires expected to be 5-10% of overall targets.”
Different sectors are typically reclaiming different shares of their Levy bill too. Energy, water or utilities and Accountancy or professional services firms appear to be using the highest shares, which could be due to existing apprenticeship standards being available and having apprenticeship programmes already being in place. As several employers commented: “[Use of Levy bill] depends on sign off of two trailblazer degree apprenticeships in time for September intake” and “The approval of new trailblazer standards change these numbers drastically”.
Employers also expect to reclaim higher shares of their Levy bills in future. Comments included “Would see this increasing significantly from next year”, and “It will be phased and in year one much less but in year two and three much more”. External factors and government support for employers could affect hiring plans.
Half of employers are starting new apprenticeship programmes as a result of the Levy with this being most common in the Retail and Engineering sectors. However, these statistics should be
interpreted with care: a low share of employers starting new programmes does not mean low growth in the number of apprenticeships. It may reflect a number of existing programmes already in place and undergoing expansion. The number of apprenticeships started for new hires as a result of the Levy is still unclear.
>>
Figure 8: Average estimated share of Levy bills used to train new apprentice hires in 2017 – 123 employers with at least 10,705 apprentice hires. Note: employers selected ranges e.g. 1-20%, 41-60%, and these averages were calculated based on the midpoints of the ranges e.g. 11%, 51%
1 Source: http://employers.bpp.com/insights/employer-research/index.html. Employers selected ranges of spend e.g. 1-25%, and the 43% average is based on a weighted average of the midpoints of these ranges.

18
Chapter 2
>>
Figure 9: Share of employers starting apprenticeship programmes as a result of the Levy – 144 employers with at least 12,281 apprentice hires.
• How might external factors
affect your apprenticeship
targets and can you plan for
different scenarios?
• How quickly can you ramp up
the amount of Levy funding
you can reclaim?
• What tools do you need
to convince internal
stakeholders of the value
of using your Levy bill for
apprentices?
Questions to explore:
?

19
Chapter 2
Minimum entry criteriaMost employers have some minimum academic entry criteria for their apprenticeship hires. This type of criteria is more common for more advanced levels of apprenticeship. Interestingly, use of entry criteria for graduate programmes is lower than for Higher/Degree apprenticeships, which could reflect the more generalist nature of graduate programmes (see Chapter 1) and the fact the 82% of graduate employers do not mind which degree subject their candidates have studied.
Use of specific minimum entry criteria also varies by level of apprenticeship. For example, the share of employers relying on 5 or more GCSEs drops from 67% to 37% of employers between Advanced and Higher apprenticeships. Reliance on A-level results increases from 7% to 79% of employers between Intermediate and Higher/Degree apprenticeships. Employers appear to rely on the most recent qualifications of candidates as a sign of future performance. Only 4-5% of organisations require candidates to have had work experience.
>>
Figure 10: Use of entry criteria by level of apprenticeship – 118 employers with at least 12,007 apprentice hires.
Grade requirements, where they exist, vary widely by employers and by apprenticeship programme. For example “We generally ask for a grade B in Maths GCSE and then English and some technical subjects and the A-levels vary according to the Level 4 or above we’re recruiting for.”, “We ask for minimum of 300 UCAS points or equivalent and a minimum of B for English Maths and English GCSE.” and “Engineering Higher [apprenticeships] - 3 A-levels in Maths and Physics or Equivalent B or above”. Maths and English requirements were the most common subject-related GCSE requirements.
Figure 11: Academic entry criteria by level of apprenticeship – 118 employers with at least 12,007 apprentice hires.

20
Chapter 2
By comparison, entry criteria for graduates are usually linked to one measure of academic performance. 71% of employers rely on candidates having achieved a 2:1 degree (an upper second class honours degree), even if the share of employers using this entry criteria declined by five percentage points between 2014 and 2016. Reliance on minimum UCAS tariffs and relevant work experience is also far more common for graduates than apprentices, perhaps reflecting a different set of expectations and the need for employers to find the best candidates from a larger volume of applicants.
Overall, apprentices seem to be subject to a broader set of minimum entry criteria than graduates. One possible reason for this difference could be the relative lack of information on apprentices, as they are less experienced and many Levy-paying organisations have less experience of hiring them. Use of minimum criteria is likely to change in the future as organisations become more sophisticated in their approach to apprenticeships..
>>
Figure 12: Minimum entry criteria for graduates – 194 employers with 22,164 graduate hires in 2016.
• How applicable is the use of
strengths-based assessment
for apprentice hires?
• What is the correlation
between academic
achievement at secondary
school and on-the-job
performance?
• How does the use of UCAS
tariffs affect social mobility
goals?
Questions to explore:
?

21
Chapter 2
AttractionTo date, apprenticeships in 2017 have received an average of 19 applications per vacancy. This is much lower than the average of 68 applications per vacancy for graduate vacancies last year, suggesting that apprenticeship roles are still much less popular than graduate roles. This value is also a lower bound: some employers mentioned that they were yet to open for applications, were only marketing for some roles, or were recruiting locally. These figures should be treated as a guide only and Law and Accountancy firms appear to be the most attractive.
Employers appear to invest less on attracting apprentices than attracting graduates. Just 53% have an attraction & marketing budget for apprentices, with an estimated average spend of £743 per hire in 2017 compared to £1,722 per hire on attracting graduates in 2016. Employers typically visit fewer schools than university campuses and also recruit school leavers from a lower share of possible locations.
>>
Figure 13: Applications per vacancy for apprentices – 78 employers with at least 8,517 apprentice hires.
Figure 14: Average attraction & marketing cost per hire - 48 employers with at least 6,281 apprentice hires.Source of graduate data: AGR Annual Survey 2016, based on 110 employers with 15,792 graduate hires.
applications per vacancy for apprenticeships in 2017
19

22
Chapter 2
Type of location Total number of Number that Number that visited/hired from universities/schools1 employers visit3 employers hire from3
Graduates Universities 1641 20 30Apprentices Secondary schools 5,4472 26 24
Table D: Comparing attraction & marketing activity
1. http://www.universitiesuk.ac.uk/facts-and-stats/Pages/higher-education-data.aspx2. https://www.gov.uk/government/statistics/schools-pupils-and-their-characteristics-january-20163. Averages, based on the AGR Annual Survey 2016
Employers are attracting apprentices via a wide range of attraction & marketing activity. 37% outsource some aspect of their attraction & marketing, with 26% of employers outsourcing at least some of their online marketing specifically. 45% market to the parents of apprentices, indicating a need to change the perceptions of apprenticeships in order to encourage students to apply.
Figure 15: Attraction & marketing activity for apprentices – 137 employers with at least 12,269 apprentice hires.
of employers market to the parents of apprentices
45%

23
Chapter 2
Employers listed a wide range of other specific actions too. Organisations referred to targeted advertising through third parties, employability programmes for NEETs, drawing from existing part-time staff, advertising to parents of potential apprentices via a staff intranet, and visiting universities to encourage graduates to join apprenticeship schemes. Working closely with professional bodies was another approach. Employers are pursuing a diverse range of options.
However, the main attraction & marketing activities are broadly similar between apprentices and graduates. Use of online marketing is the most common in both cases. This method complements rather than substitutes for face-to-face interactions: over 80% of employers still use print media and still make visits to campuses. There appears to be scope for more apprenticeship recruiters to use competitions to engage students.
>>
Figure 16: Comparing attraction & marketing activity – 137 employers with at least 12,269 apprentice hires. Source of graduate data: AGR Winter Survey 2015.
• Is applications per vacancy a
suitable metric for localised
recruitment campaigns?
• What are the best ways
to engage the parents of
apprentices?
• How can organisations tailor
their attraction & marketing
to improve diversity and
social mobility?
Questions to explore:
? The main attraction and
marketing activities are broadly similar between
apprentices and graduates. Use of online marketing is the most common activity
in both cases.
of employers use competitions to engage potential apprentice
hires
28%

24
Chapter 2
Employers appear to invest less in selection processes for apprentices than they do for graduates. Just 38% of organisations have a selection & assessment budget for apprenticeships, and they spend an estimated average of £669 per hire in 2017 relative to an average of £1,661 spent per graduate in 2016.
>>
Figure 17: Average selection & assessment cost per hire – 28 employers with at least 4,850 apprentice hires.Source of graduate data: AGR Annual Survey 2016, 110 employers with 15,792 graduate hires.
of organisations have a specific selection & assessment budget for
apprentices
38%

25
Chapter 2
>> Selection processes for apprentices also have a few key differences to selection for graduates. Employers are more likely to use phone interviews and less likely to use video interviews, psychometric tests or assessment centres. Specific application forms are sometimes used in place of generic CVs e.g. “We don’t use CVs any longer but a relevant application form which is then screened. It helps ensure the candidate provides the right information and if they are younger they struggle with a CV anyway”. The use of assessment centres is also different, for example “We also run work placement programmes in place of the traditional assessment centre that will include work based tasks and interviews” and “Some locations opt for assessment centres whereas others hold face to face interviews, we don’t encourage the use of both as we feel it’s overkill for apprentice recruitment”. 44% of employers outsource at least part of their apprentice selection process.
Figure 18: Selection & assessment activity for apprentices – 135 employers with at least 12,269 apprentice hires.
Figure 19: Comparing selection & assessment activity – 135 employers with at least 12,269 apprentice hires.
• Which types of psychometric
tests are most suitable for
younger candidates?
• How can you ensure high-
quality partnerships with
external providers?
• How are you tailoring
your processes to manage
candidate expectations and
a younger audience?
Questions to explore:
?


27
This section compares a range of metrics for graduates and apprentices. Resourcing levels, gaps in soft skills and key future challenges are explored. All graduate data is from the AGR Annual Survey 2016, unless indicated otherwise.
Comparing graduates and apprentices
ResourcingThere are typically three staff members in an apprenticeship recruitment team and 36 apprentice hires for every team member. Larger intakes of apprentices have larger teams on average. Resourcing levels for apprentices are typically lower than those for graduates.
Chapter 3
Figure 20: Average team sizes for graduate and apprentice recruitment – 92 employers with at least 9,955 apprentice hires.
Figure 21: Average hires per recruitment team member – 92 employers with at least 9,955 pprentice hires.
apprentices for every apprentice recruiter
35

28
Chapter 3
Responsibility for graduate and apprentice recruitment also typically sits within the same team. 72% of employers adopted this structure in 2016. Only organisations which hire more than 250 apprentices are more likely to have apprentice and graduate recruitment in different teams.
>>
Figure 22: Share of employers with graduate and apprentice recruitment in the same team – 136 employers with 16,122 graduates and 9,788 apprentice hires in 2016.
of employers with over 250 apprentices have apprentice/graduate recruitment
in the same team
57% • How do specific resourcing
needs for apprentices differ
for resourcing needs for
graduates?
• What are the pros and cons
of combining graduate and
apprentice recruitment
functions in the same team?
• How can other teams
within your organisation
support your apprenticeship
resourcing?
Questions to explore:
?

29
Chapter 3
Soft skills gapsMany employers expect apprentices to have better soft skills than they actually do. 91% of employers think that at least some of their apprentices lack the soft skills they expect. This compares to 49% of employers stating that graduates lack expected soft skills, based on the AGR Development Survey 2017.
Part of this difference could be due to an “expectation gap” rather than a skills gap. Uncertainty around how apprentices will behave could be leading employers to have expectations that are unrealistically high. Graduate recruiters may also have more consistent (or more clearly
communicated) expectations which are easier for candidates to meet. Employers have an active role to play in closing the gaps.
To this end, employers listed a wide range of soft skills that apprentices need to focus on. 64% of employers highlighted business-appropriate communication as a skill that apprentices lack when starting work. The top five skills – including time management, professionalism, confidence, and presentation skills – could also all be considered as basic work-readiness skills. These can act as a guide for informing work experience programmes and designing more effective skills training.
>>
Figure 23: The ten most common soft skills which apprentices lack – 84 employers with 8,674 apprentice hires. Note: based on the share of employers who think apprentices lack each skill. Employers were asked in an open-ended question to list up to three skills, with responses grouped by common themes. of employers say apprentices
lack business communication skills
61%

30
Chapter 3
Targeted action by employers and schools could potentially close these gaps quickly. A key finding from the AGR Development Survey 2017 was that most employers think that most key soft skills can be learnt within a year. The estimated time taken to learn five of the listed skills is shown below. Based on their work and experience, employers feel that teamwork skills can be learnt in the shortest time.
Clarifying what employers expect of apprentices is another key step which could help to close any soft skills gaps. As shown below, graduate recruiters expect that graduates will lack some soft skills when they start work. Awareness of these gaps makes it easier for organisations to design soft skills training and undertake employability initiatives. Reaching consensus on the soft skills gaps for apprentices is a key step towards more focussed remedial training and better pastoral care.
>>
Figure 24: Employer views on the time it takes students to learn key skills – 136 employers with 14,284 graduate hires. Source: AGR Development Survey 2017.
Figure 25: Key soft skills gaps for graduates – 177 employers with 17,527 graduates in 2015 Note: share of employers who feel that graduates lack these skills when hired. Source: AGR Development Survey 2017.
of employers believe business communication skills can be learnt
in less than a year
95%

• What is the fastest way
to raise awareness of
apprentice skills gaps and
identify solutions to these?
• How long might it take
students to learn each of
the identified skills, and how
could this time be reduced?
• How does employability
support for apprentices vary
for employability support for
graduates?
Questions to explore:
?
31
Chapter 3

32
Chapter 3
Recruiters’ key challengesApprentice recruiters expect similar challenges to those of graduate recruiters in 2017. Responding to the Levy is seen as the biggest challenge by far, with 58% of organisations highlighting this. 23% of respondents also stated that a lack of government-approved apprenticeships in their sector was a top challenge in the year ahead, highlighting the need for continued support around the Levy. Attracting student candidates, improving apprenticeship diversity, coping with competition and improving retention were seen as bigger challenges for apprentices than for graduates. These challenges could be more pronounced because many employers are recruiting apprentices for the first time.
Employers made a range of specific comments about Levy-related challenges. These included “Current frameworks are not fit for purpose so we would need to design our own”, “Ensuring there are enough standards out there in the right format to support our needs”, “Gaining buy-in from other areas of the business to taking apprenticeships” and “Identifying suitable vacancies for apprentice applicants”. Managing responses to the Levy is likely to continue to be a challenge for some time.
Employers mentioned a varied range of other challenges too. These included “Not really sure yet what the challenges will be with regard to skills as not yet hired”, “Spotting potential at school leaver level when we are more used to hiring at graduate level” and “The levy is irrelevant. It assumes the only thing stopping employers taking on more apprentices is the cost of course fees, which is marginal compared to their employment and supervision costs”. Employers will need to stay up to date with the latest trends in order to respond to these evolving challenges and to gain the most value from apprenticeships in future.
>>
Figure 26: Key expected challenges in 2017 – 131 employers with at least 11,061 apprentice hires. Note: Employers were asked to list up to three challenges in each case. Souce of graduate data: AGR Annual survey 2016.
• How can organisations
collaborate to address each
of these challenges?
• How will diversity and social
mobility considerations
shape your response to these
challenges?
• What expertise exists in
graduate recruitment that
might be transferable in
terms of solving challenges
in apprentice recruitment?
Questions to explore:
?


34
Appendix
Employer diversity initiativesApprentice recruiters indicate that improving apprentice diversity is one of their top three challenges in 2017. There is currently limited information on apprenticeship diversity initiatives at AGR employers. However, a wide range of information exists for graduate diversity initiatives. Some of these findings may be transferable to apprentice recruitment and so are included here for reference.
Diversity strategies for apprentices could be used more widely. 40% of employers had some form of diversity strategy for their apprentices in 2016, compared to 73% of employers having a diversity strategy for graduates. Employers in the Accountancy, Energy, water or utilities and IT & Telecommunications sectors were the most likely to have an apprenticeship strategy in place and so can potentially provide the most case studies for how to implement one successfully.
Chapter 4
Figure 27: Use of apprenticeship diversity strategies in 2016 – 169 employers with 22,011 graduate hires in 2015. Source: AGR Diversity & Inclusion Survey 2016.

35
Employers adopt a holistic approach to improving diversity. While gender diversity is overwhelmingly the main focus for graduate employers – 83% see this as a high or medium priority in their organisation – ethnic diversity and social mobility rank highly as well. Efforts to cater for disabled candidates are also on the rise, with a 19 percentage point increase in employers monitoring disability in 2016. There are potentially many aspects of apprenticeship diversity to consider.
There are many potential investments which could improve the diversity of intakes as well. Contextual recruitment systems – which provide data about the educational/social context of a candidate in order to give employers a more holistic view of their potential – are seen as having the highest impact on graduate diversity. A wide range of other methods are also being used, with scope for all of these to be more effective, and partnerships with other organisations are very common.
>>
Chapter 4
Figure 28: Priority of different types of diversity in graduate recruitment processes in 2016 – 168 employers with 22,037 graduate hires in 2015. Source: AGR Diversity & Inclusion Survey 2016.
Figure 29: Use of specific diversity investments in 2015, ranked by perceived effectiveness – 84 employers with 16,119 graduate hires. Note: only those employers who could comment on the impact of their investments. Source: AGR Diversity & Inclusion Survey 2016.

36
There is also more than one way to support apprentices from minority groups once they are in the workplace. Graduate employers currently offer in-house support networks, tailored development plans/programmes, and access to coaching to support the development of graduate hires with specific characteristics. However, use of these methods is rare, and while in-house support networks are the most frequently used these are usually for all staff rather than being specific to junior hires. More data is needed on whether different groups of hires have different developmental needs before the effectiveness of these methods and their applicability to apprentices can be established.
>>
Chapter 4
Figure 30: Share of employers offering specific on-the-job support for hires with these characteristics – 140 employers with 14,244 graduate hires. Source: AGR Development Survey 2017
This survey was sent to 306 employers in April 2017 and 138 responses were received from Levy-paying organisations, representing a 45% response rate. Six universities also contributed, meaning that 144 Levy-paying organisations responded in total. Survey respondents are hiring at least 12,281 apprentices in 2017 (with some organisations still confirming their hiring volumes) and represent organisations with over 2.4 million UK staff.
Responses were analysed via a mixture of statistical and manual methods. Individual responses were checked for input errors e.g. “25” rather than “25%” and in some cases re-confirmed with employers and updated. Statistical software was used to generate key statistics including frequencies and means. Specific values perceived to be outliers (e.g. 100% above the next highest value in a particular sector) were also checked with responding employers and updated or excluded from the analysis.
Methodology and respondent profile
When reporting on trends, the minimum threshold used for reporting on a sector is five employer responses. This is to ensure reliability of the trend and to maintain the anonymity of respondents. The number of employers who responded to each question is listed below each graph along with a lower bound on the number of apprentices they are hiring (due to some organisations unable to confirm the number of 2017 hires).
survey respondents with over 2.4 million staff
144

37
This report also includes references to previous AGR reports. Key reports are listed above and are available for AGR members upon request.
A wide range of sectors, firm sizes and apprenticeship intake sizes are represented in the data. Employers with small intakes of apprentices were the most common respondents, while 8% of respondents did not provide hiring volumes for this year. Larger organisations are better represented than smaller ones. Law firms, Engineering firms and Banking or financial services firms were the sectors with the highest number of respondents overall.
>>
Chapter 4
Survey Date of publication
AGR Development Survey 2017 March 2017
AGR Annual Survey 2016 September 2016
AGR Diversity & Inclusion Survey 2016 June 2016
AGR Development Survey 2016 March 2016
AGR Winter Survey 2015 September 2015
Table E: AGR surveys referred to in this report
of respondents are recruiting 1-25 apprentices
24%
Figure 31: Intake sizes of responding organisations – 144 employers with at least 12,281 apprentice hires.
Figure 32: Business sizes of responding organisations – 144 employers with at least 12,281 apprentice hires.

38
Chapter 4
Figure 33: Business sectors of responding organisations – 144 employers with at least 12,281 apprentice hires.
of respondents are engineering or industrial firms
15%

• Aberdeen Asset Management
• Accenture• AkzoNobel• Allen & Overy• Amey Plc• Aon• Arcadia• Arcadis• Ark• Arriva• Arup• Atkins• Aviva• AXA UK• Babcock
International• Baillie Gifford• Bakkavor• Barratt
Developments• BDO• Bentley Motors• Berkeley Group• Bloomberg• BNP Paribas
Real Estate• Bond Dickinson• Boots UK• Bristows• British Council• BT• Burges Salmon• Burness Paull• BWB• CBRE UK• Centrica• Charles Russell
Speechlys• City, University of
London• Civil Service• Clifford Chance• Clyde & Co
• Lancaster University• Lendlease
Construction• Leonardo• Lidl• Lloyds Banking
Group• Lloyd’s Register• Lockheed Martin• LV=• Mace• Marks & Spencer• McDonald’s
Restaurants• Merlin
Entertainments• Morgan Sindall• Mott MacDonald• MUFG• National Audit
Office• National Grid• Nationwide• NBIM• Nestlé• Nomura• Northumbria
University• Pinsent Masons• Pladis• PwC• QinetiQ• RBS• Redrow Homes• Reed Smith• RM• Roche• Rolls-Royce• RSM• RWE• Sainsbury’s• Santander• Schroders• ScottishPower
• Commerzbank AG• Costain• Danone• Deloitte• DLA Piper• DWF• Dyson• EDF Energy• Enterprise Rent-A-
Car• Equiniti• Essentra• Eversheds
Sutherland• Expedia• Explore Learning• EY• FactSet• FCA• FDM Group• Firstco• Fladgate• Fujitsu• Gardiner & Theobald• Go-Ahead• Gowling WLG• Grant Thornton• GSK• Howard Kennedy• HSBC• IMI Precision
Engineering• Innogy• Interserve• Irwin Mitchell• Jacobs• Jaguar Land Rover• JLL• John Sisk & Son• Johnson Matthey• Kennedys Law• KFC• KPMG• L.E.K. Consulting
• Severn Trent Water• Shearman & Sterling• Shoosmiths• Smith & Williamson• St George’s
University Hospitals NHS Foundation Trust
• St. James’s Place• Stephenson
Harwood• Tarmac• Tata Steel• Taylor Vinters• Taylor Wessing• Tesco• Thales• Thames Water• Thomson Reuters• Transport for
London• Travis Perkins• UK Power Networks• University of
Edinburgh• University of
Huddersfield• University of
Liverpool• Virgin Media• Vodafone• Wates• Wates Group• Watson Farley
& Williams
Survey respondents are listed below in alphabetical order.>> Responding organisations
39
Responding organisations

The Association of Graduate Recruiters6 Bath Place, Rivington Street, London, EC2A 3JE