Embed Size (px)
Citation preview
Florida Medicaid
January 23, 2009
Workgroup on Hospital Reimbursement
Agency for Health Care Administration
Tallahassee, Florida
MedicaidA State and Federal Partnership
In 1965, the federal Social Security Act was amended to
establish two major national health care programs:
Title XVIII (Medicare).
Title XIX (Medicaid).
Medicaid is jointly financed by state and federal funds.
States administer their programs under federally approved state
plans.
1
The Medicaid ProgramMajor Federal Requirements
States must submit a Medicaid State Plan to the federal Centers
for Medicare and Medicaid Services (CMS).
Mandatory eligibility groups and services must be covered.
Services must be available statewide in the same amount,
duration and scope.
2
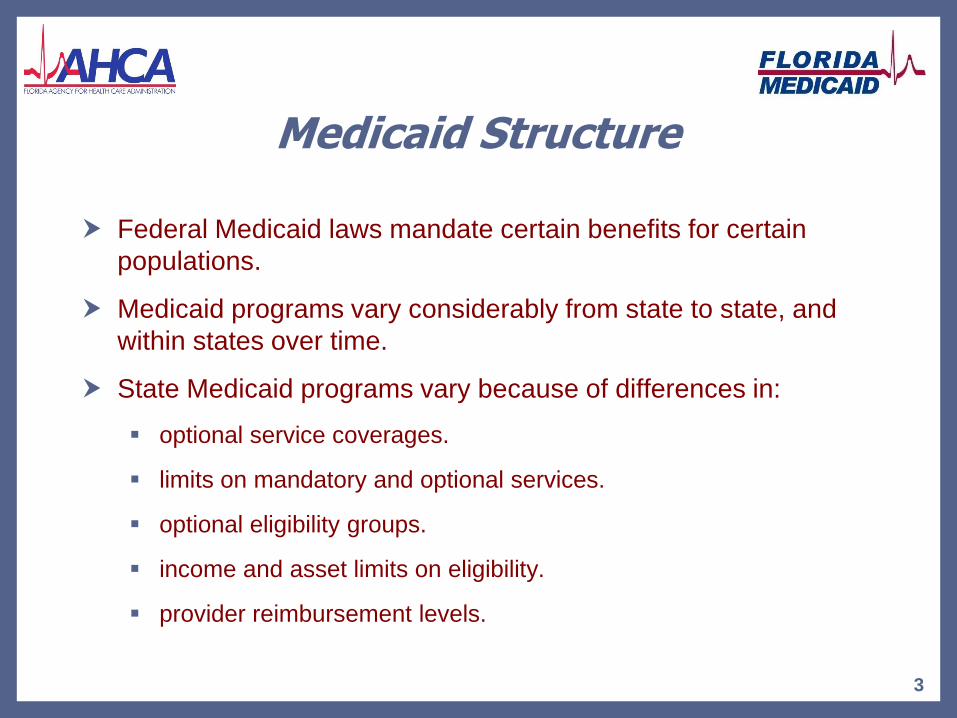
Medicaid Structure
Federal Medicaid laws mandate certain benefits for certain
populations.
Medicaid programs vary considerably from state to state, and
within states over time.
State Medicaid programs vary because of differences in:
optional service coverages.
limits on mandatory and optional services.
optional eligibility groups.
income and asset limits on eligibility.
provider reimbursement levels.
3
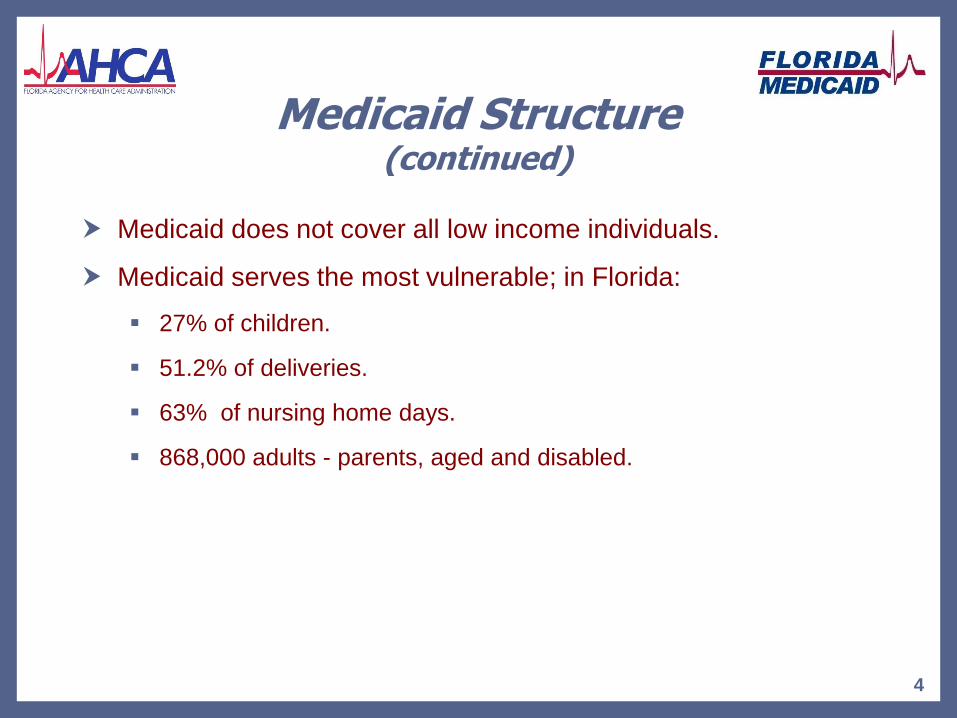
Medicaid Structure(continued)
Medicaid does not cover all low income individuals.
Medicaid serves the most vulnerable; in Florida:
27% of children.
51.2% of deliveries.
63% of nursing home days.
868,000 adults - parents, aged and disabled.
4
5
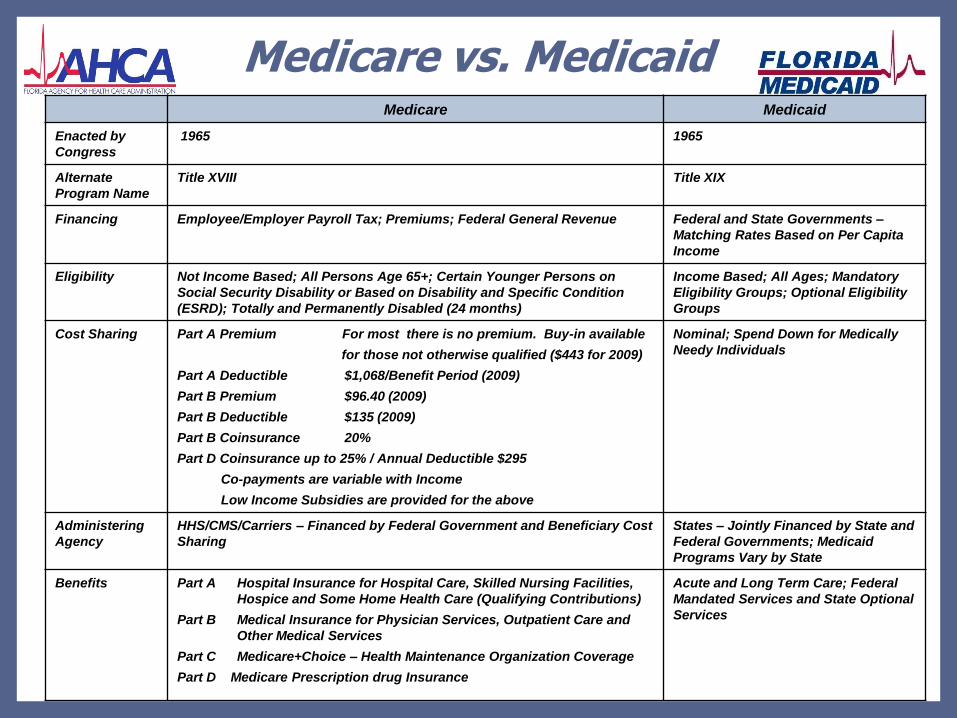
Medicare vs. MedicaidMedicare Medicaid
Enacted by
Congress
1965 1965
Alternate
Program Name
Title XVIII Title XIX
Financing Employee/Employer Payroll Tax; Premiums; Federal General Revenue Federal and State Governments –
Matching Rates Based on Per Capita
Income
Eligibility Not Income Based; All Persons Age 65+; Certain Younger Persons on
Social Security Disability or Based on Disability and Specific Condition
(ESRD); Totally and Permanently Disabled (24 months)
Income Based; All Ages; Mandatory
Eligibility Groups; Optional Eligibility
Groups
Cost Sharing Part A Premium For most there is no premium. Buy-in available
for those not otherwise qualified ($443 for 2009)
Part A Deductible $1,068/Benefit Period (2009)
Part B Premium $96.40 (2009)
Part B Deductible $135 (2009)
Part B Coinsurance 20%
Part D Coinsurance up to 25% / Annual Deductible $295
Co-payments are variable with Income
Low Income Subsidies are provided for the above
Nominal; Spend Down for Medically
Needy Individuals
Administering
Agency
HHS/CMS/Carriers – Financed by Federal Government and Beneficiary Cost
Sharing
States – Jointly Financed by State and
Federal Governments; Medicaid
Programs Vary by State
Benefits Part A Hospital Insurance for Hospital Care, Skilled Nursing Facilities,
Hospice and Some Home Health Care (Qualifying Contributions)
Part B Medical Insurance for Physician Services, Outpatient Care and
Other Medical Services
Part C Medicare+Choice – Health Maintenance Organization Coverage
Part D Medicare Prescription drug Insurance
Acute and Long Term Care; Federal
Mandated Services and State Optional
Services
6
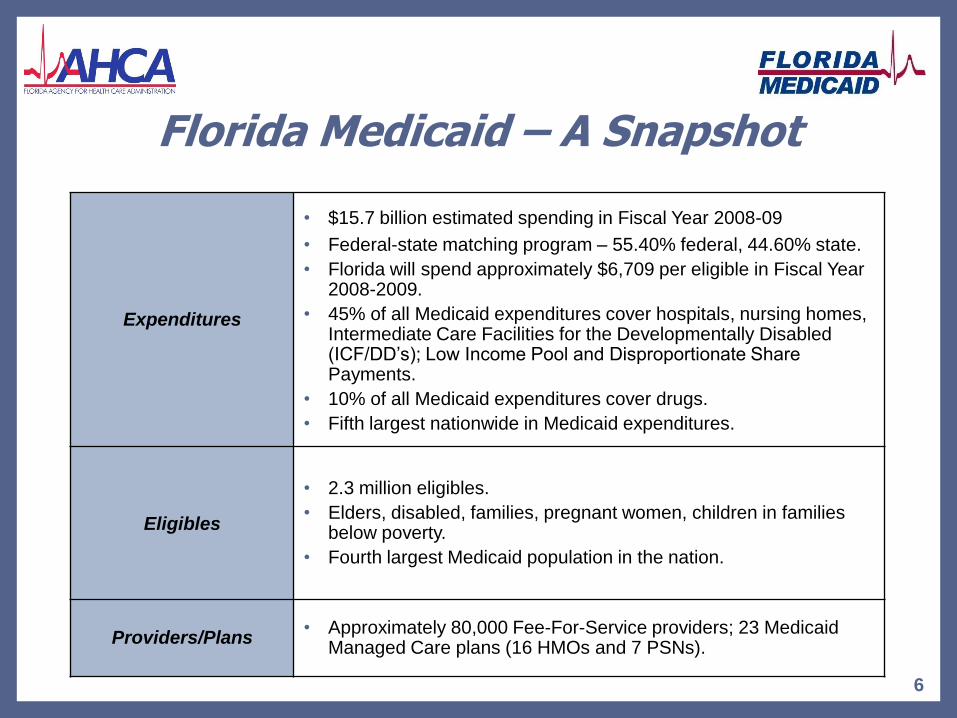
Florida Medicaid – A Snapshot
Expenditures
• $15.7 billion estimated spending in Fiscal Year 2008-09
• Federal-state matching program – 55.40% federal, 44.60% state.
• Florida will spend approximately $6,709 per eligible in Fiscal Year 2008-2009.
• 45% of all Medicaid expenditures cover hospitals, nursing homes, Intermediate Care Facilities for the Developmentally Disabled (ICF/DD’s); Low Income Pool and Disproportionate Share Payments.
• 10% of all Medicaid expenditures cover drugs.
• Fifth largest nationwide in Medicaid expenditures.
Eligibles
• 2.3 million eligibles.
• Elders, disabled, families, pregnant women, children in families below poverty.
• Fourth largest Medicaid population in the nation.
Providers/Plans• Approximately 80,000 Fee-For-Service providers; 23 Medicaid
Managed Care plans (16 HMOs and 7 PSNs).
Who’s Eligible?
Medicaid eligibility is determined by:
Categorical groups, i.e., pregnant women; families and children;
and aged, blind, and disabled individuals.
Income.
Assets.
Citizenship.
Residency.
Cooperation with Child Support Enforcement (when one or both
parents are absent from the home).
Medical need for home and community-based services, and
persons in nursing facilities.
Level of medical bills (for Medically Needy). 7
8
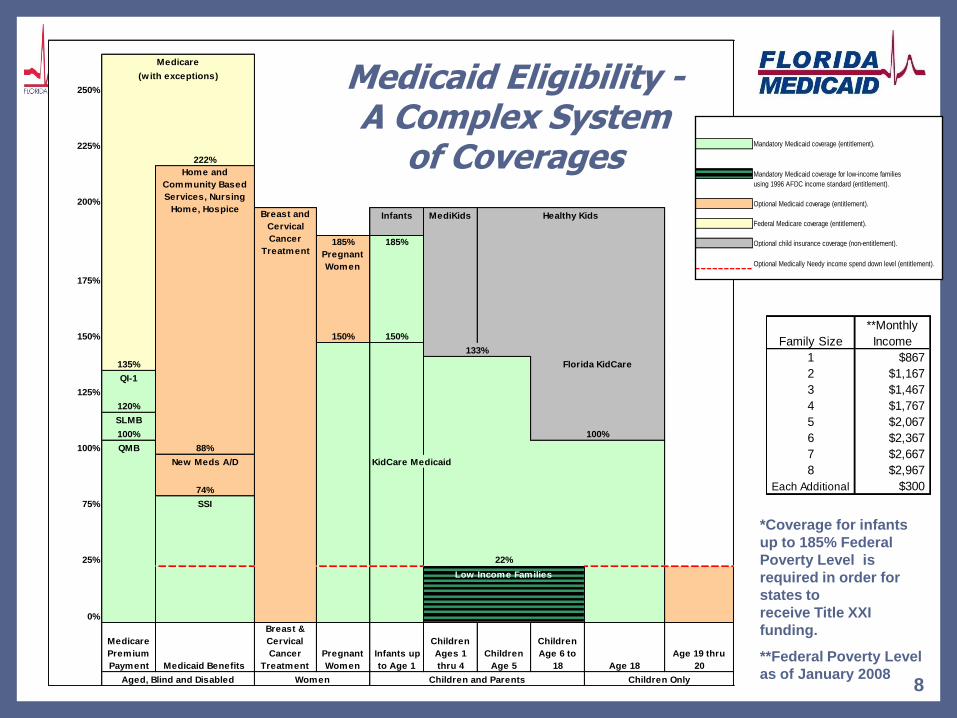
*Coverage for infants
up to 185% Federal
Poverty Level is
required in order for
states to
receive Title XXI
funding.
**Federal Poverty Level
as of January 2008
250%
225%
222%
200%
Infants MediKids
185%
Pregnant
Women
185%
175%
150% 150% 150%
135%
QI-1
125%
120%
SLMB
100%
100% QMB 88%
New Meds A/D KidCare Medicaid
74%
75% SSI
25% 22%
0%
Medicare
Premium
Payment Medicaid Benefits
Breast &
Cervical
Cancer
Treatment
Pregnant
Women
Infants up
to Age 1
Children
Ages 1
thru 4
Children
Age 5
Children
Age 6 to
18 Age 18
Age 19 thru
20
Low Income Families
Aged, Blind and Disabled Children and Parents Children OnlyWomen
133%
100%
Medicare
(w ith exceptions)
Healthy Kids
Home and
Community Based
Services, Nursing
Home, HospiceBreast and
Cervical
Cancer
Treatment
Florida KidCare
Family Size
**Monthly
Income
1 $867
2 $1,167
3 $1,467
4 $1,767
5 $2,067
6 $2,367
7 $2,667
8 $2,967
Each Additional $300
2004 Federal Poverty
Guidelines
Mandatory Medicaid coverage for low-income families
using 1996 AFDC income standard (entitlement).
Mandatory Medicaid coverage (entitlement).
Optional Medicaid coverage (entitlement).
Federal Medicare coverage (entitlement).
Optional child insurance coverage (non-entitlement).
Optional Medically Needy income spend down level (entitlement).
Medicaid Eligibility -A Complex System
of Coverages
Who Can Provide Medicaid?
Any willing health care practitioner or entity who:
provides one of the Medicaid covered services;
submits an application to Medicaid;
is licensed or certified to practice in the State of Florida;
is not terminated from any government health care program; and
signs an agreement with Medicaid.
Managed Care plans with appropriate provider networks.
9
10
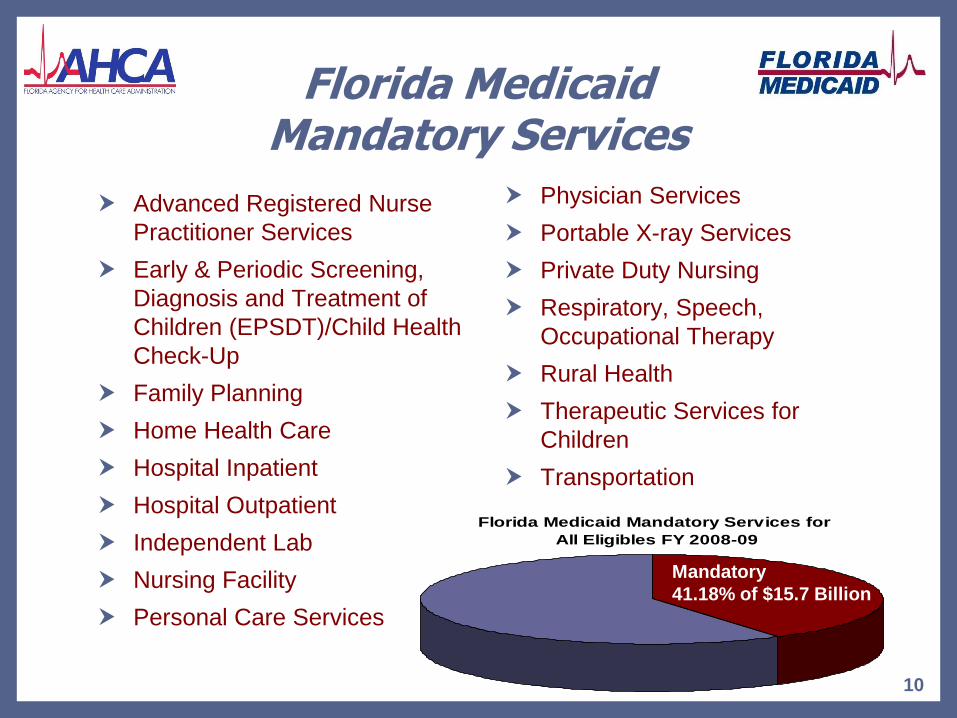
Florida Medicaid Mandatory Services
Advanced Registered Nurse
Practitioner Services
Early & Periodic Screening,
Diagnosis and Treatment of
Children (EPSDT)/Child Health
Check-Up
Family Planning
Home Health Care
Hospital Inpatient
Hospital Outpatient
Independent Lab
Nursing Facility
Personal Care Services
Physician Services
Portable X-ray Services
Private Duty Nursing
Respiratory, Speech,
Occupational Therapy
Rural Health
Therapeutic Services for
Children
Transportation
Florida Medicaid Mandatory Services for
All Eligibles FY 2008-09
Mandatory
41.18% of $15.7 Billion
11
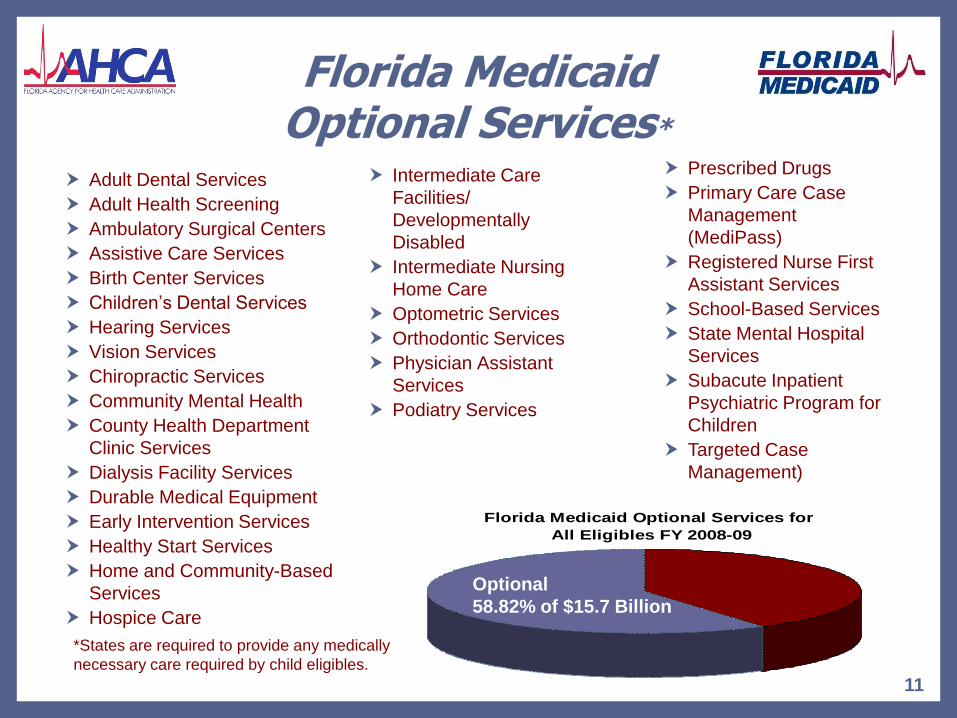
Florida Medicaid Optional Services*
Adult Dental Services
Adult Health Screening
Ambulatory Surgical Centers
Assistive Care Services
Birth Center Services
Children’s Dental Services
Hearing Services
Vision Services
Chiropractic Services
Community Mental Health
County Health Department
Clinic Services
Dialysis Facility Services
Durable Medical Equipment
Early Intervention Services
Healthy Start Services
Home and Community-Based
Services
Hospice Care
Intermediate Care
Facilities/
Developmentally
Disabled
Intermediate Nursing
Home Care
Optometric Services
Orthodontic Services
Physician Assistant
Services
Podiatry Services
Florida Medicaid Optional Services for
All Eligibles FY 2008-09
Optional
58.82% of $15.7 Billion
Prescribed Drugs
Primary Care Case
Management
(MediPass)
Registered Nurse First
Assistant Services
School-Based Services
State Mental Hospital
Services
Subacute Inpatient
Psychiatric Program for
Children
Targeted Case
Management)
*States are required to provide any medically
necessary care required by child eligibles.
Institutional Providers / Other
Institutional Providers / Other
Services with automatic price level increases under current law.
Examples of provider types:
Inpatient Hospitals
Outpatient Hospitals
Nursing Homes
Intermediate Care Facilities for Developmentally Disabled (ICF/DD)
Rural Health Clinics (RHCs)
County Health Departments
Federally Qualified Health Centers
Pharmacy
12
Fee For Service Providers
Fee for Service Providers
Services that don’t receive automatic increases under current law.
Increases are determined by legislative appropriation.
Examples of provider types:
Physician Services
Home Health Services
Dental Services
Transportation (Emergency and Non-Emergency)
Dialysis
Nurse Practitioners
Laboratory and X-Ray
13
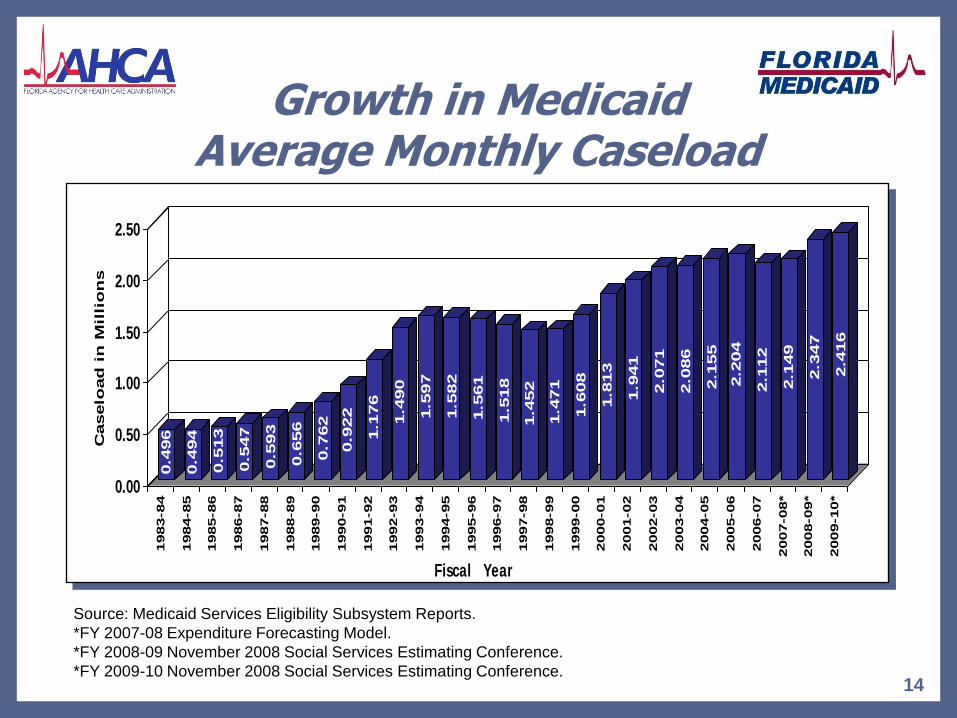
Growth in Medicaid Average Monthly Caseload
14
0.4
96
0.4
94
0.5
13
0.5
47
0.5
93
0.6
56
0.7
62
0.9
22
1.1
76
1.4
90
1.5
97
1.5
82
1.5
61
1.5
18
1.4
52
1.4
71
1.6
08
1.8
13
1.9
41
2.0
71
2.0
86
2.1
55
2.2
04
2.1
12
2.1
49
2.3
47
2.4
16
0.00
0.50
1.00
1.50
2.00
2.50
Caselo
ad
in
Mil
lio
ns
1983-84
1984-85
1985-86
1986-87
1987-88
1988-89
1989-90
1990-91
1991-92
1992-93
1993-94
1994-95
1995-96
1996-97
1997-98
1998-99
1999-00
2000-01
2001-02
2002-03
2003-04
2004-05
2005-06
2006-07
2007-08*
2008-09*
2009-10*
Fiscal Year
Source: Medicaid Services Eligibility Subsystem Reports.
*FY 2007-08 Expenditure Forecasting Model.
*FY 2008-09 November 2008 Social Services Estimating Conference.
*FY 2009-10 November 2008 Social Services Estimating Conference.
15
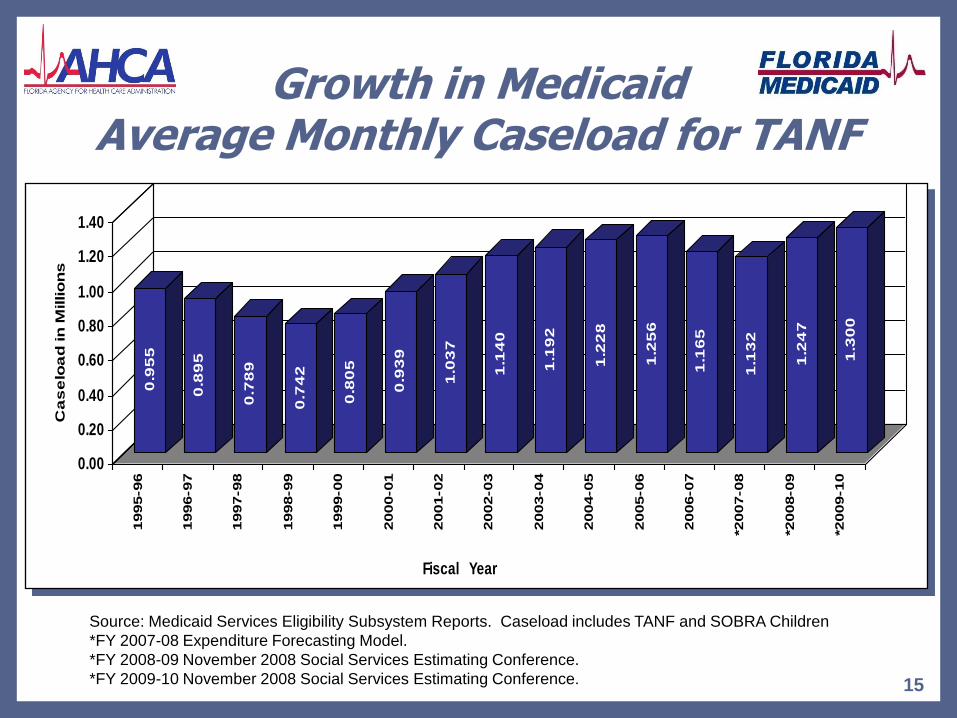
Growth in Medicaid Average Monthly Caseload for TANF
0.9
55
0.8
95
0.7
89
0.7
42
0.8
05
0.9
39
1.0
37
1.1
40
1.1
92
1.2
28
1.2
56
1.1
65
1.1
32
1.2
47
1.3
00
0.00
0.20
0.40
0.60
0.80
1.00
1.20
1.40
Ca
se
loa
d in
Millio
ns
1995-9
6
1996-9
7
1997-9
8
1998-9
9
1999-0
0
2000-0
1
2001-0
2
2002-0
3
2003-0
4
2004-0
5
2005-0
6
2006-0
7
*2007-0
8
*2008-0
9
*2009-1
0
Fiscal Year
Source: Medicaid Services Eligibility Subsystem Reports. Caseload includes TANF and SOBRA Children
*FY 2007-08 Expenditure Forecasting Model.
*FY 2008-09 November 2008 Social Services Estimating Conference.
*FY 2009-10 November 2008 Social Services Estimating Conference.
16
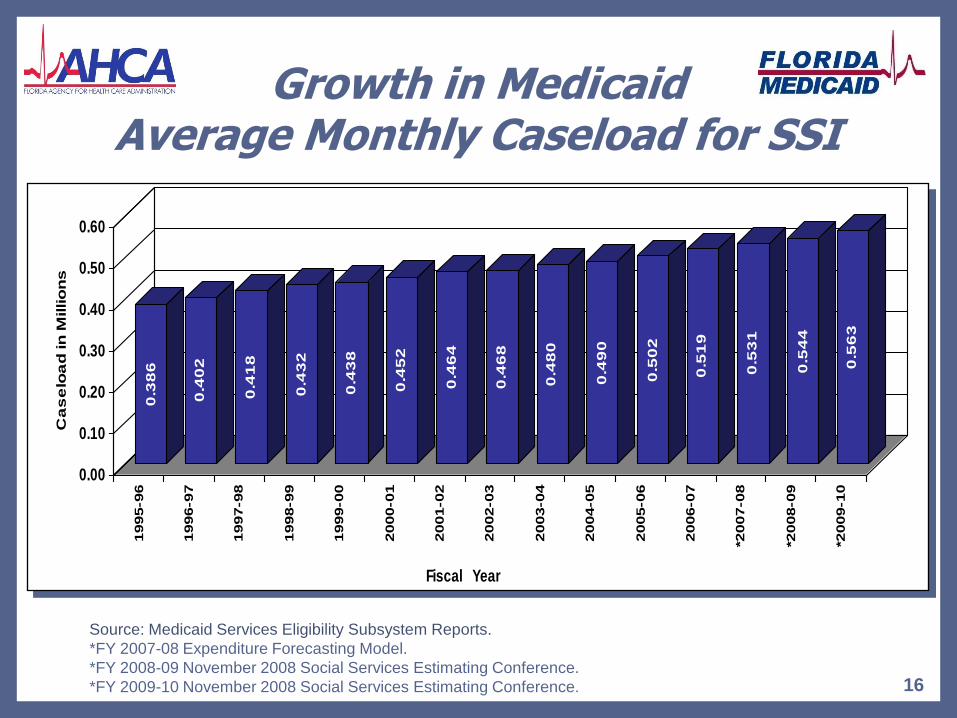
Growth in Medicaid Average Monthly Caseload for SSI
0.3
86
0.4
02
0.4
18
0.4
32
0.4
38
0.4
52
0.4
64
0.4
68
0.4
80
0.4
90
0.5
02
0.5
19
0.5
31
0.5
44
0.5
63
0.00
0.10
0.20
0.30
0.40
0.50
0.60
Ca
se
loa
d in
Millio
ns
1995-9
6
1996-9
7
1997-9
8
1998-9
9
1999-0
0
2000-0
1
2001-0
2
2002-0
3
2003-0
4
2004-0
5
2005-0
6
2006-0
7
*2007-0
8
*2008-0
9
*2009-1
0
Fiscal Year
Source: Medicaid Services Eligibility Subsystem Reports.
*FY 2007-08 Expenditure Forecasting Model.
*FY 2008-09 November 2008 Social Services Estimating Conference.
*FY 2009-10 November 2008 Social Services Estimating Conference.
17
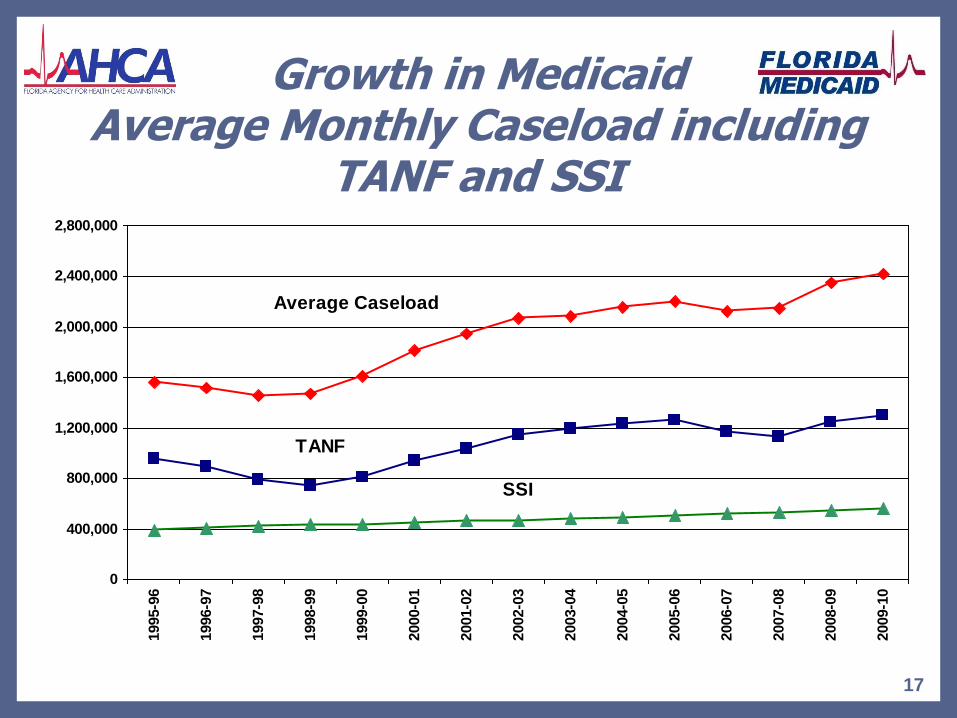
Growth in Medicaid Average Monthly Caseload including
TANF and SSI
0
400,000
800,000
1,200,000
1,600,000
2,000,000
2,400,000
2,800,000
1995-9
6
1996-9
7
1997-9
8
1998-9
9
1999-0
0
2000-0
1
2001-0
2
2002-0
3
2003-0
4
2004-0
5
2005-0
6
2006-0
7
2007-0
8
2008-0
9
2009-1
0
Average Caseload
TANF
SSI
18
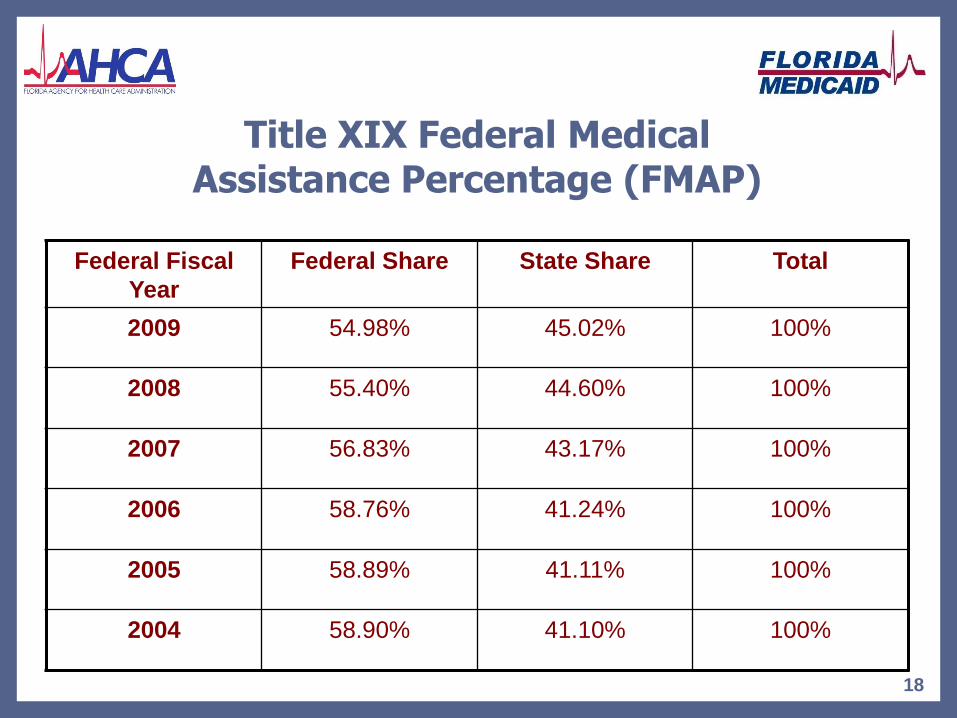
Title XIX Federal MedicalAssistance Percentage (FMAP)
Federal Fiscal
Year
Federal Share State Share Total
2009 54.98% 45.02% 100%
2008 55.40% 44.60% 100%
2007 56.83% 43.17% 100%
2006 58.76% 41.24% 100%
2005 58.89% 41.11% 100%
2004 58.90% 41.10% 100%
19
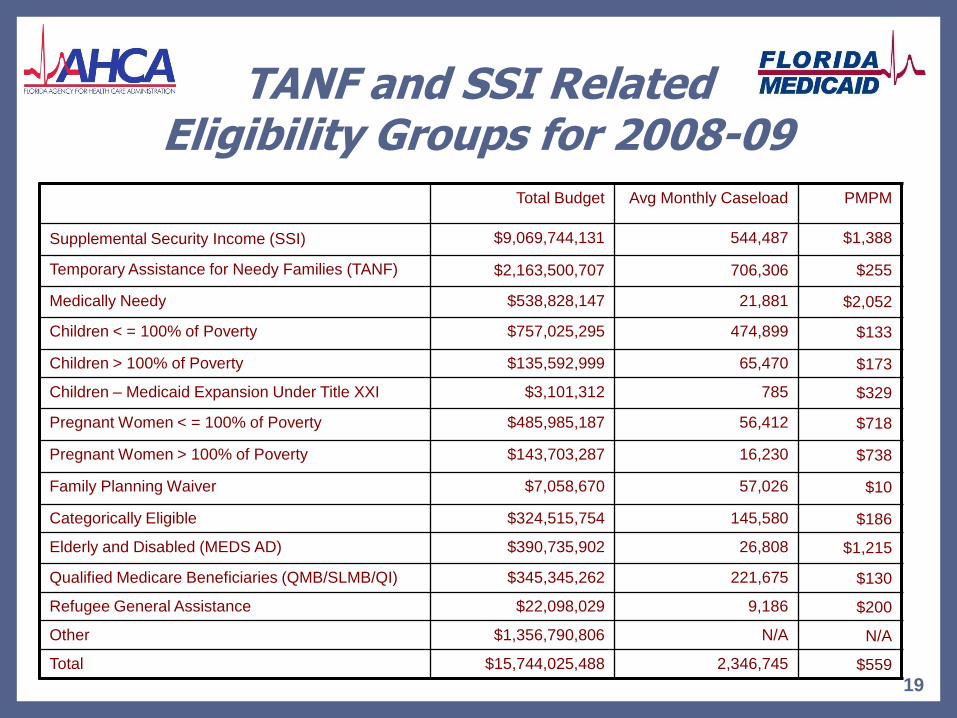
TANF and SSI Related Eligibility Groups for 2008-09
Total Budget Avg Monthly Caseload PMPM
Supplemental Security Income (SSI) $9,069,744,131 544,487 $1,388
Temporary Assistance for Needy Families (TANF) $2,163,500,707 706,306 $255
Medically Needy $538,828,147 21,881 $2,052
Children < = 100% of Poverty $757,025,295 474,899 $133
Children > 100% of Poverty $135,592,999 65,470 $173
Children – Medicaid Expansion Under Title XXI $3,101,312 785 $329
Pregnant Women < = 100% of Poverty $485,985,187 56,412 $718
Pregnant Women > 100% of Poverty $143,703,287 16,230 $738
Family Planning Waiver $7,058,670 57,026 $10
Categorically Eligible $324,515,754 145,580 $186
Elderly and Disabled (MEDS AD) $390,735,902 26,808 $1,215
Qualified Medicare Beneficiaries (QMB/SLMB/QI) $345,345,262 221,675 $130
Refugee General Assistance $22,098,029 9,186 $200
Other $1,356,790,806 N/A N/A
Total $15,744,025,488 2,346,745 $559
20
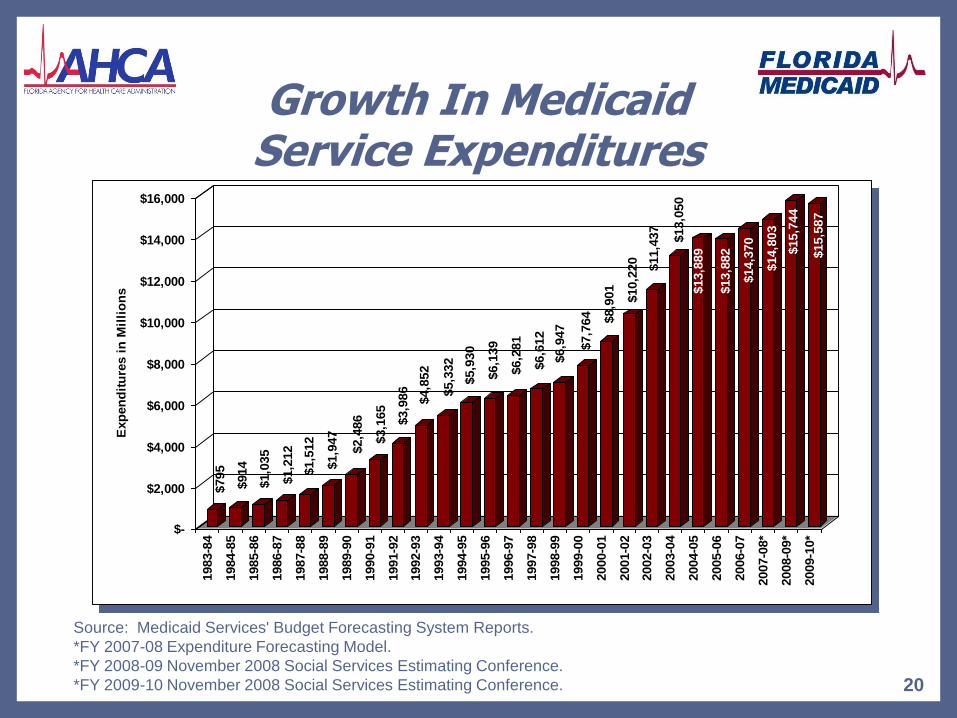
Growth In Medicaid Service Expenditures
$795
$914
$1,0
35
$1,2
12
$1,5
12
$1,9
47
$2,4
86
$3,1
65
$3,9
86
$4,8
52
$5,3
32
$5,9
30
$6,1
39
$6,2
81
$6,6
12
$6,9
47
$7,7
64 $8,9
01
$10,2
20
$11,4
37
$13,0
50
$13,8
89
$13,8
82
$14,3
70
$14,8
03
$15,7
44
$15,5
87
$-
$2,000
$4,000
$6,000
$8,000
$10,000
$12,000
$14,000
$16,000
Exp
en
dit
ure
s i
n M
illi
on
s
1983-8
4
1984-8
5
1985-8
6
1986-8
7
1987-8
8
1988-8
9
1989-9
0
1990-9
1
1991-9
2
1992-9
3
1993-9
4
1994-9
5
1995-9
6
1996-9
7
1997-9
8
1998-9
9
1999-0
0
2000-0
1
2001-0
2
2002-0
3
2003-0
4
2004-0
5
2005-0
6
2006-0
7
2007-0
8*
2008-0
9*
2009-1
0*
Source: Medicaid Services' Budget Forecasting System Reports.
*FY 2007-08 Expenditure Forecasting Model.
*FY 2008-09 November 2008 Social Services Estimating Conference.
*FY 2009-10 November 2008 Social Services Estimating Conference.
21
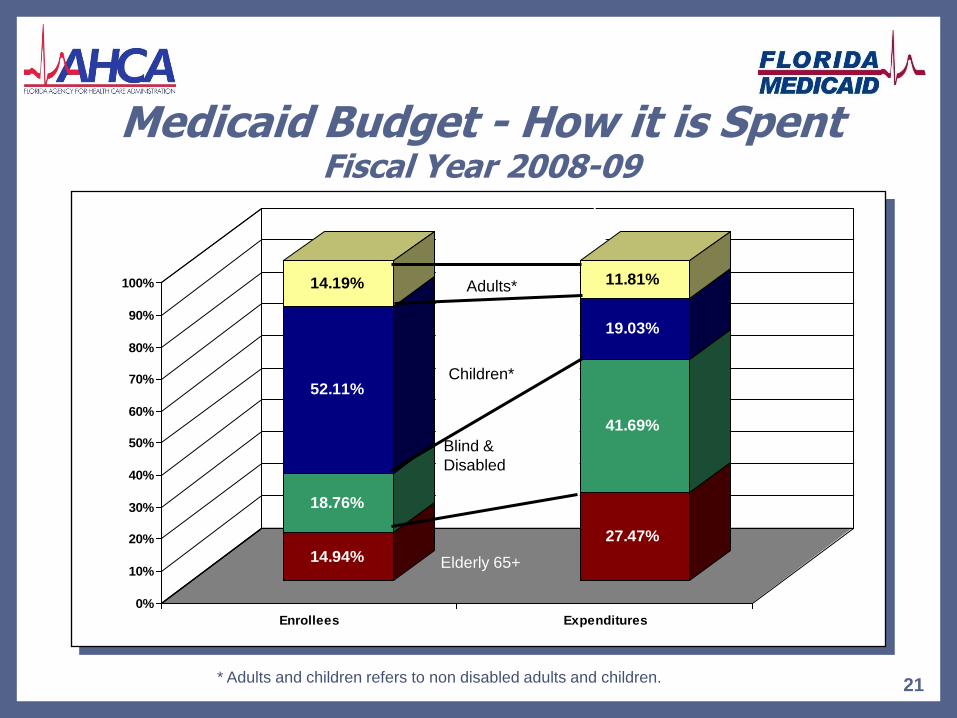
Medicaid Budget - How it is Spent Fiscal Year 2008-09
* Adults and children refers to non disabled adults and children.
14.94%
18.76%
52.11%
14.19%
27.47%
41.69%
19.03%
11.81%
0%
10%
20%
30%
40%
50%
60%
70%
80%
90%
100%
Enrollees Expenditures
Adults*
Children*
Elderly 65+
Blind &
Disabled
22
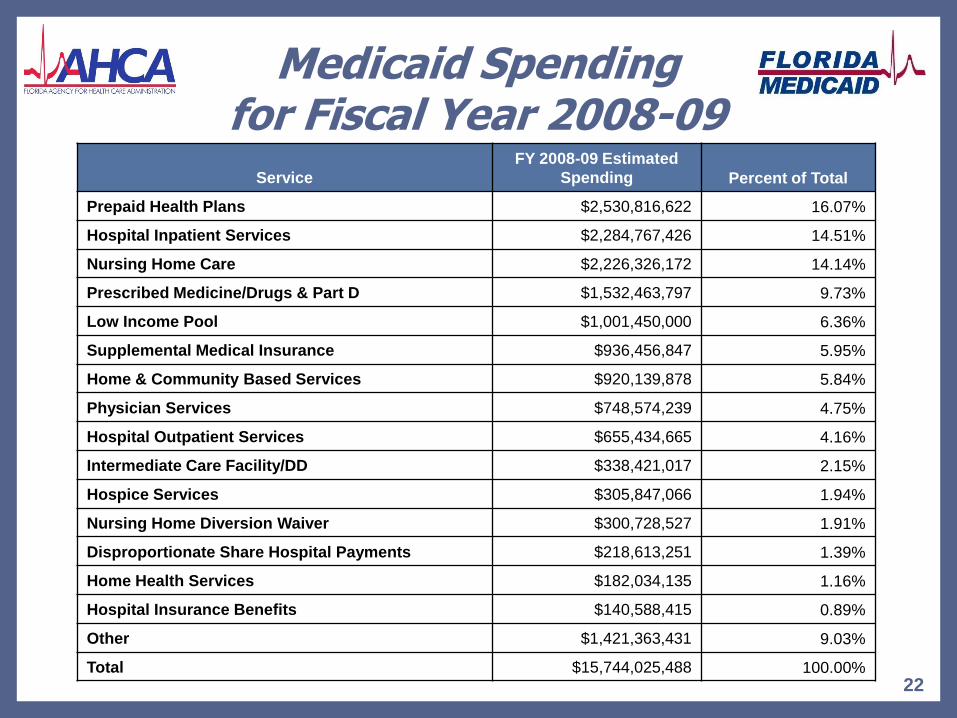
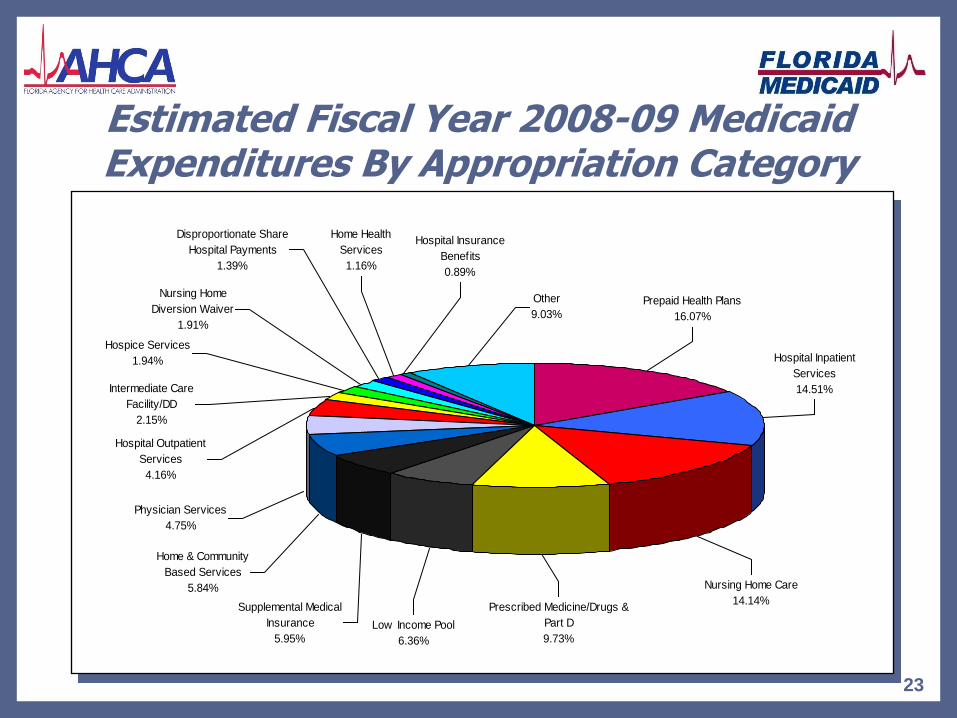
Medicaid Spending for Fiscal Year 2008-09
Service
FY 2008-09 Estimated
Spending Percent of Total
Prepaid Health Plans $2,530,816,622 16.07%
Hospital Inpatient Services $2,284,767,426 14.51%
Nursing Home Care $2,226,326,172 14.14%
Prescribed Medicine/Drugs & Part D $1,532,463,797 9.73%
Low Income Pool $1,001,450,000 6.36%
Supplemental Medical Insurance $936,456,847 5.95%
Home & Community Based Services $920,139,878 5.84%
Physician Services $748,574,239 4.75%
Hospital Outpatient Services $655,434,665 4.16%
Intermediate Care Facility/DD $338,421,017 2.15%
Hospice Services $305,847,066 1.94%
Nursing Home Diversion Waiver $300,728,527 1.91%
Disproportionate Share Hospital Payments $218,613,251 1.39%
Home Health Services $182,034,135 1.16%
Hospital Insurance Benefits $140,588,415 0.89%
Other $1,421,363,431 9.03%
Total $15,744,025,488 100.00%
23
Estimated Fiscal Year 2008-09 Medicaid Expenditures By Appropriation Category
Hospice Services
1.94%
Nursing Home
Diversion Waiver
1.91%
Home & Community
Based Services
5.84%
Low Income Pool
6.36%
Supplemental Medical
Insurance
5.95%
Disproportionate Share
Hospital Payments
1.39%
Intermediate Care
Facility/DD
2.15%
Hospital Outpatient
Services
4.16%
Hospital Insurance
Benefits
0.89%
Home Health
Services
1.16%
Physician Services
4.75%
Prescribed Medicine/Drugs &
Part D
9.73%
Nursing Home Care
14.14%
Hospital Inpatient
Services
14.51%
Prepaid Health Plans
16.07%
Other
9.03%
24
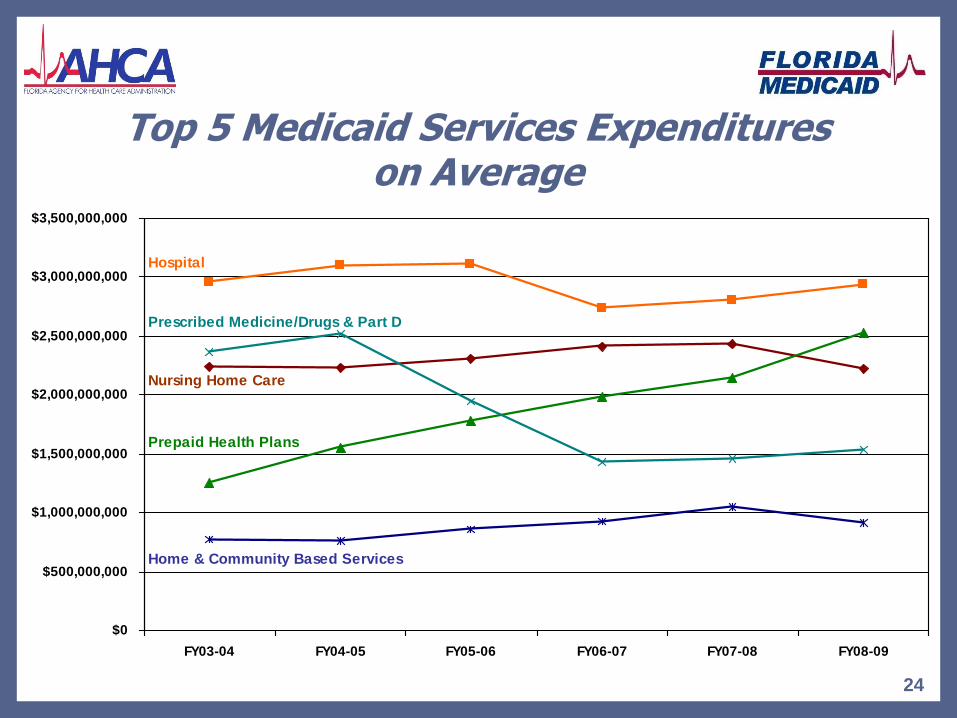
Top 5 Medicaid Services Expenditures on Average
$0
$500,000,000
$1,000,000,000
$1,500,000,000
$2,000,000,000
$2,500,000,000
$3,000,000,000
$3,500,000,000
FY03-04 FY04-05 FY05-06 FY06-07 FY07-08 FY08-09
Hospital
Prescribed Medicine/Drugs & Part D
Nursing Home Care
Prepaid Health Plans
Home & Community Based Services

Questions