Embed Size (px)
Citation preview
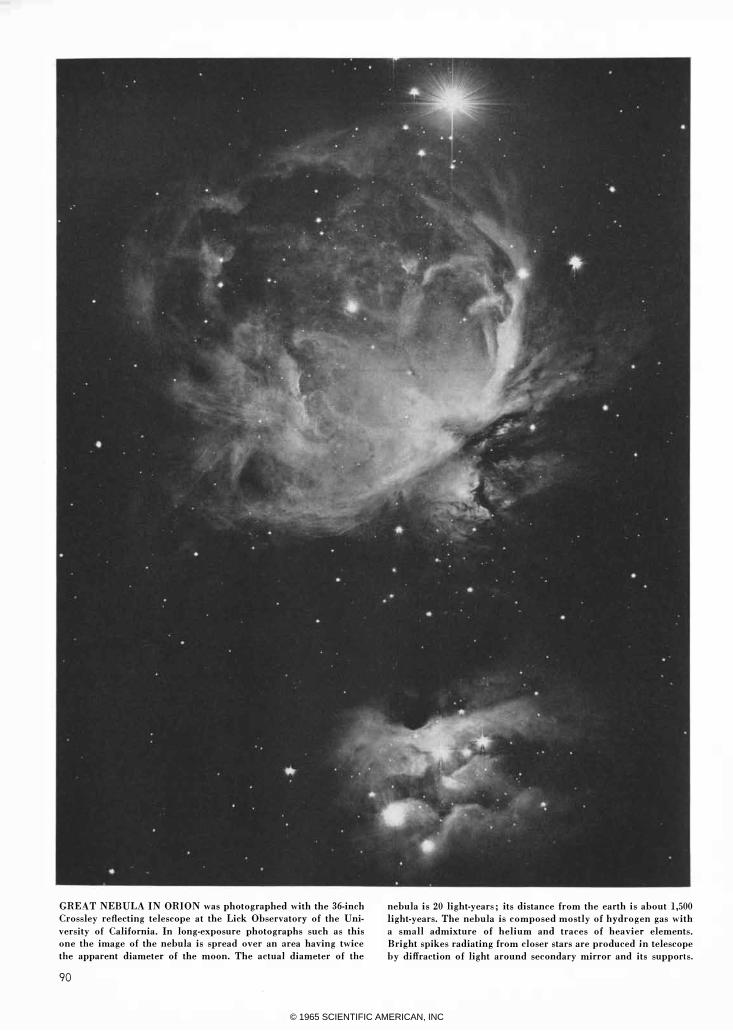
GREAT NEBULA IN ORION was photographed with the 36-inch
Crossley reflecting telescope at the Lick Observatory of the Uni
versity of California_ In long-exposure photographs such as this
one the image of the nebula is spread over an area having twice
the apparent diameter of the moon_ The actual diameter of the
90
nebula is 20 light-years; its distance from the earth is about 1,500
Iight-years_ The nebula is composed mostly of hydrogen gas with
a small admixture of helium and traces of heavier elements_
Bright spikes radiating from closer stars are produced in telescope
by diffraction of light around secondary mirror and its supports_
© 1965 SCIENTIFIC AMERICAN, INC

THE AGE OF THE ORION NEBULA
This magnificent swirl of o'as b IS made luminous by the ultraviolet
radiation of hot young stars that are embedded In it. Its motions
indicate that it may have begun to shine only some 23,000 years ago
The ancient idea that the heavens are perfect and immutable has long since been abandoned. But
even though the principles of cosmic and stellar evolution are now firmly accepted, it is generally thought that large-scale celestial changes are so gradual they can be measured only on a time scale that is extremely long by ordinary standards. Recent studies indicate, however, that in at least one instance this is not so. If 25,000 years ago some cave dwellers had left a picture of the stars in Orion the Hunter, the most prominent constellation in the night sky during the winter, it is probable they would have omitted one of the most interesting objects now visible to the unaided eye. The missing "star" would have been the Great Nebula in Orion, which is located at the central position in the Hunter's sword. On the basis of observations made with optical and radio telescopes it is now estimated that the Great Nebula and the brightest stars with which it is associated started to shine no more than about 23,000 years ago.
What is seen with the unaided eye as the middle star in the sword is really a group of stars known as Theta Orionis. Four of these stars, commonly known as the Trapezium, make up the subgroup Theta-One Orionis. A short distance from the Trapezium is the pair of stars called Theta-Two Orionis. The Great Nebula shows up in a small telescope as an ill-defined, faintly luminous patch surrounding these stars. It is only in photographs of long exposure made with large telescopes that the vast extent and complex structure of the nebula become clearly visible. If it could be seen with the unaided eye as it is in such a photograph, its apparent diameter would be approximately twice that of the moon. Of course its true diam-
by Peter O. Vandervoort
eter is enormously greater: about 20 light-years. Its distance from the earth is about 1,500 light-years.
Until 100 years ago, when astronomical photography was still in its infancy, the physical nature of the Orion nebula and similar nebulae elsewhere was a matter of conjecture. Some astronomers thought that such nebulae might be composed of stars too numerous and faint to be observed individually. The question was settled in 1864, when Sir 'William Huggins made a visual examination of the spectrum of the Orion nebula and discovered that its light was concentrated in a few bright lines at distinct wavelengths. This meant that the light was produced by hot, glowing gases, since only incandescent gases were known to emit bright-line spectra
in the laboratory. If the nebulosity had represented the total light of many faint stars, it would have had a starlike spectrum, in which the light is distributed cont:nuously over almost all wavelengths (except for a few wavelengths at which dark lines appear). Huggins concluded that the Orion nebula must be a great cloud of hot interstellar gas.
Since Huggins' discovery many gaseous nebulae have been studied, and the
physical processes that give rise to their luminosity are now fairly well understood. The Orion nebula, which is similar to many others, contains about 100 solar masses of gas, of which hydrogen constitutes about 65 percent, helium nearly 35 percent, oxygen and calcium less than . 1 percent and other elements
CONSTELLATION OF ORION is the most prominent constellation in the northern skies
during the winter months. Three bright stars in a straight line at top left represent
the belt of Orion the Hunter. The three brightest objects extending downward from the belt
(bottom center) are Orion's sword. The middle "star" of the sword is actually the Great
Nebula. Photograph was made at the Yerkes Observatory of the University of Chicago.
91
© 1965 SCIENTIFIC AMERICAN, INC

CENTRAL REGION of the Orion nebula was photographed in red light by George H.
Herbig with the 120·inch reHecting telescope of the Lick Observatory. Hydrogen gas
in the nebula is quite luminous in the red wavelengths of the electromagnetic spectrum.
CENTRAL STARS of the Orion nebula produce most of the light visible in this photograph
made by Herbig in infrared radiation. Hydrogen gas is quite faint in the infrared wave.
lengths. The bright patch at center contains four bright stars known as Theta.One
Orionis or the Trapezium. Two brighter stars at upper right are called Theta·Two Orionis.
92
only trace amounts. Embedded in the gas is a cluster of several hundred stars. The brightest and hottest of these stars are the members of the Trapezium and Theta-Two Orionis, which have surface temperatures that range from 20,000 to 50,000 degrees Kelvin (degrees centigrade above absolute zero), as compared to less than 6,000 degrees for the sun. Because these stars are so hot, much of the electromagnetic radiation they emit lies at the extreme ultraviolet end of the spectrum, a region known as the Lyman continuum. It is this radiation that heats the gas of the nebula to incandescence.
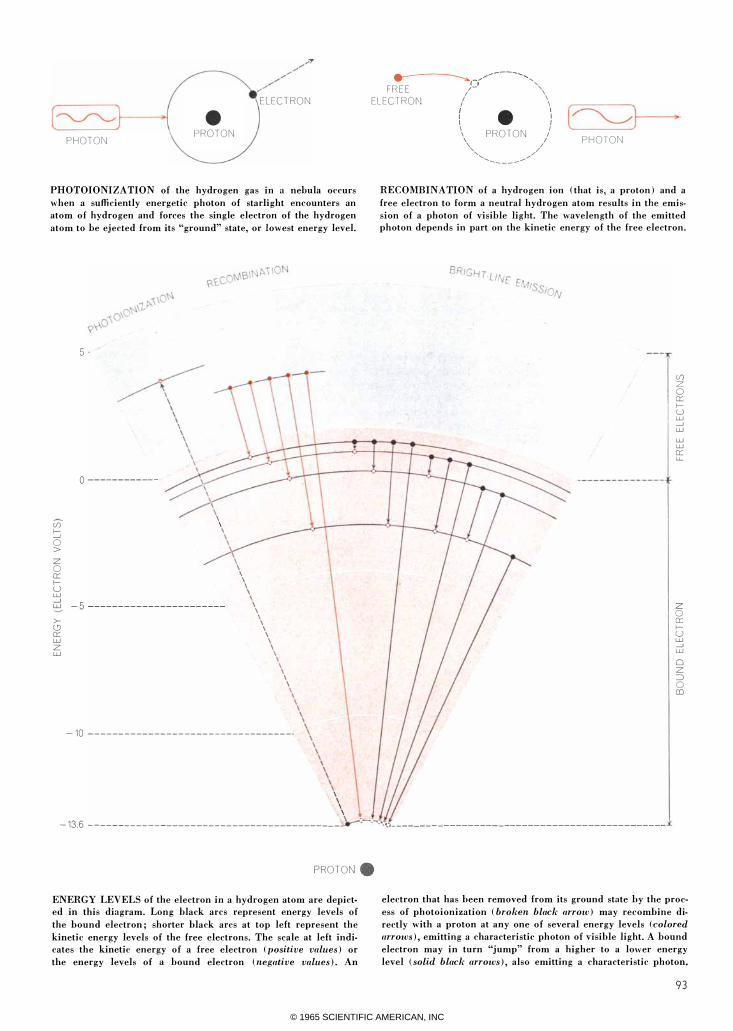
By definition the Lyman continuum includes every wavelength at which a quantum of radiation (or photon) carries enough energy to remove the electron from a hydrogen atom that is in its "ground" state, or state of lowest energy. All wavelengths shorter than 9 12 angstrom units are included in the Lyman continuum. (The visible spectrum runs from 4,000 to 7,000 angstroms.) A photon whose wavelength is in the Lyman continuum is readily absorbed by a hydrogen atom; in the process the electron and proton that constitute the atom are separated and the atom is said to be photoionized. Since the nebula consists mainly of hydrogen, the photoionization of hydrogen governs the nebula's physical state.
Let us now trace what happens to the energy released from a hot star in the form of a photon in the Lyman continuum. Because the energy of the photon is usually above the minimum of 13.6 electron volts needed to ionize a hydrogen atom, there is energy left over after photoionization. This energy is carried away in the form of the kinetic energy possessed by the ejected electron, and a portion of it is subsequently transferred, through repeated collisions, to other particles in the gas cloud. Hence a fraction of the ultniviolet energy radiated by the hot stars is convetted to thermal motions of the nebula.
A free electron produced by photoionization will wander through the nebula for 1,000 years or so, on the average, before a chance encounter with a free proton (also produced by photoionization) will enable the two particles to recombine to form a hydrogen atom. The atom can form with the electron in the ground state or in any one of many higher energy levels. In either case the electron must give up its kinetic energy together with an amount of energy corresponding to the energy with which it is bound to the proton at its final energy level. It does this by emitting a
© 1965 SCIENTIFIC AMERICAN, INC
ELECTRON
• PHOTON PROTON
PHOTOIONIZATION of the hydrogen gas in a nehula occurs
when a sufficiently energetic photon of starlight encounters an
atom of hydrogen and forces the single electron of the hydrogen
atom to he ejected from its "ground" state, or lowest energy level.
5
� ---
/'\ �\ \ o ----------- - �.
/\ \
�(-('------'" FREE ;- \ ELECTRO�J ,' \
I •
\ I \ \ I \ PROTON / \ / \ / , / , /
'-----_ ...... /
PHOTON
RECOMBINATION of a hydrogen ion (that is, a proton) and a
free electron to form a neutral hydrogen atom results in the emis·
sion of a photon of visihle light. The wavelength of the emitted
photon depends in part on the kinetic energy of the free electron.
U) z o 0:: IU w -' w w w 0:: LL.
Vl \ .�--------���k \\�. �
o > z o a:
/\ \ \ \ \ \ IU w uj -5 ----------------------- \
>-1..9 a: w Z w
\ \ \ \ \ \ \ \
\ \ \ \ \ \ \ \
\ \ \ \
-10 ----------------------------------. \ \ \ \ \ \ \
\ \ \ \ " \ . \
z o 0:: IU w -' w o Z ::J o m
, \ '; \
-13.6 __________________________________________ 3y:�:�). .•. ;_---------------------------------------------
PROTON.
ENERGY LEVELS of the electron in a hydrogen atom are depict.
ed in this diagram. Long black arcs represent energy levels of
the bound electron; shorter black arcs at top left represent the
kinetic energy levels of the free electrons. The scale at left indio
cates the kinetic energy of a free electron (positive values) Or
the energy levels of a hound electron (negative values). An
electron that has been removed from its ground state by the proc·
ess of photoionization (broken black arrow) may recombine di·
rectly with a proton at any one of several energy levels (colored
arrows), emitting a characteristic photon of visible light. A hound
electron may in turn "jump" from a higher to a lower energy
level (solid black arrows), also emitting a characteristic photon.
93
© 1965 SCIENTIFIC AMERICAN, INC

+ o
I
+ + ClJ ClJ '" �
I <0
I I
,.. I I
ClJ I I
WAVELENGTH (ANGSTROM UNITS)
SPECTROGRAM of the Orion nebula was made by Donald E. Osterbrock of the Univer
sity of Wisconsin with the 100·inch reflecting telescope on Mount Wilson. The spectrum
of the nebula consists of bright lines that are produced by the characteristic emis
sions of hydrogen, oxygen and other elements in the gaseous state. The wavelengths of
several of these lines and the elements responsible for them are indicated. The superscript
plus signs after some of the letters signify whether the element is singly or doubly
ionized. The subscript Greek letters denote the characteristic emission lines of hydrogen.
photon of the proper energy. If the atom is formed at the ground level, the emitted photon will be in the Lyman continuum and will therefore have enough energy to photoionize another hydrogen atom elsewhere in the nebula. If the atom is formed at one of the higher energy levels, the photon will have too little energy to be in the Lyman continuum and will escape from the nebula without being absorbed.
If the hydrogen atom produced by recombination is at a higher energy level, it will subsequently undergo a sequence of transitions in which the electron drops to successively lower levels until it reaches the ground state. In each transition the atom emits a photon whose energy equals the change in the energy of the atom as it drops from level to level [see illustrations on preceding page J. Since the atom has a set of distinct energy levels, the emitted photons have distinct energies and therefore distinct wavelengths. This accounts for some of the bright lines originally observed by Huggins.
It can be calculated that a typical hydrogen atom in the Orion nebula can exist for about a year, on the average, before it is photoionized. Since its components can then remain free for 1,000 years or more before recombining, it is evident that most of the hydrogen in the nebula is ionized.
To summarize, a fraction of the energy released by the exciting stars as photons in the Lyman continuum is convelted to thermal motion in the gas of the nebula, and the remainder reappears as photons of lower energy that are emitted by the hydrogen in the gas and escape from the nebula. On the average the kinetic energy of a free electron at the moment it is released by
94
photoionization is slightly larger than its kinetic energy 1,000 years or so later, when it recombines with a proton. The energy it loses between photoionization and recombination remains in the gas as thermal energy. Every time an electron goes through the cycle of photoionization and recombination it adds a bit of thermal energy to the gas. Since temperature is directly related to thermal energy, the gas in the nebula tends to get hotter.
The temperature is kept from rising indefinitely by a cooling process that involves the emission of radiation by elements other than hydrogen, principally oxygen, nitrogen and neon. The physical evidence for this cooling process can be found in certain strong spectral lines known as forbidden lines. They are so named because they can be emitted only by a gas that is at a lower density than can be achieved in the laboratory. Densities that are sufficiently low prevail in gaseous nebulae.
The photons that produce these forbidden lines are emitted when an electron collides with an ion of some element other than hydrogen. Such an ion is an atom from which one or more electrons have been removed; in the nebular gas it is usually in its ground state. In a collision between an electron and an ion the electron can give up some of its kinetic energy and lift the ion to a higher energy level. Eventually the ion returns to the ground state either in one jump or in a series of jumps. Each transition results in the emission of a photon carrying a discrete amount of energy. These photons are not energetic enough to photoionize hydrogen atoms and thus cannot contribute to the further heating of the nebular gas. They leave the nebula and constitute the for-
bidden lines seen in the spectra of the Orion nebula and other gaseous nebulae [see illustration at leftJ.
The temperature of the gas in a nebula comes to an equilibrium determined by the heating due to photoionization and recombination and the cooling due to the emission of radiation by ions that have been excited by collisions with electrons. By analyzing the strength of the forbidden lines in the spectrum of the Orion nebula it can be calculated that the temperature of the gas is about 9,000 degrees Kelvin.
From this discussion one might assume that the Orion nebula and others
like it exist simply because a number of hot, blue stars happen to be embedded in masses of interstellar gas. It is now recognized, however, that this association is no accident. The clusters of stars in gaseous nebulae are very young-so young, in fact, that the gas in the nebulae must have been involved in the process of their formation.
The mechanism by which stars are formed is not understood in detail, but there is good reason to believe that the stars in a cluster are formed from a large cloud of interstellar gas. Turbulence or some other process might produce regions in the cloud in which the denSity of the gas is higher than the average density of the cloud. The gas in such a region can become detached from the gas in similar regions nearby, with the result that the cloud tends to break into many fragments. If such a fragment has enough mass, it will contract under the force of its own gravitation. As the fragment contracts, the temperature and pressure inside it rise steadily. Eventually the temperature and pressure at its center become so high that thermonuclear reactions begin to convert its hydrogen into helium. The energy released by the burning of hydrogen stops the contraction; at this point the gas fragment has become an ordinary star.
After the formation of the stars in a cluster there will be some interstellar gas left over from the original cloud. If the cluster contains some hot, blue stars, this gas will be heated to incandescel1ce. The result is a gaseous nebula.
Since this picture rests on the assumption that the clusters in gaseous nebulae are quite young, let us see how their ages are determined. After a star has formed and has begun to burn hydrogen, it has a luminosity and surface temperature that are directly related to its mass. In general the more massive the star, the brighter and hotter it is.
© 1965 SCIENTIFIC AMERICAN, INC

a �LECTRON
OUTER
ELECTRONS
b ,,/ FREE
ELECTRON
c
PHOTON
COLLISION between a doubly ionized atom of oxygen and a free
electron results in the excitation of two outer electrons from their
ground state (left) to a higher energy state (middle). The excited
electrons can then shift back to their ground state (right), emitting
a photon of light with a discrete wavelength. This mechanism is
responsible for the so·called forbidden spectral lines of oxygen,
nitrogen, neon and other elements that are emitted by a gas only
at very low densities, such as those that prevail in a gaseous nebula.
When this relation is plotted, it produces what is called the "zero-age main sequence." ("Zero age" refers simply to the time at which a star has completed its formation and settled down to the normal condition of an ordinary star.)
When one plots the luminosities and surface temperatures of the stars clustered in a gaseous nebula, one finds that the cluster departs from the zeroage main sequence in two respects. The faintest and the brightest members of the cluster are found to be cooler than stars of corresponding luminosities that lie on the main sequence. These de-
partures can be explained on the basis of the theory of stellar evolution, which shows that stars of large mass evolve more rapidly than stars of small mass.
The least massive (and faintest) stars have surface temperatures below those expected on the main sequence because they are still in the process of formation; having little mass, they contract slowly in response to gravitation. The stars of average mass contract more rapidly, and as we observe them they are burning their hydrogen normally. Hence they have reached the main sequence and exhibit the expected lumi-
nosities and surface temperatures. The most massive (and brightest) stars in the cluster contract the most rapidly of all. They also consume their hydrogen rapidly because they are so luminous and radiate so much energy. As we observe them, however, they have cooler surfaces than stars of corresponding luminosity on the zero-age main sequence because they have no more hydrogen available for conversion to helium and they have begun to undergo the change of condition that occurs when the burning of hydrogen stops.
The stars that depart from the zero-
RADIO· CONTOUR MAP suggests that the Orion nebula is dis
tributed symmetrically around a small group of stars at the cen
ter; its asymmetric appearance in direct photographs is a result
of the uneven distribution of interstellar dust in foreground. The
map was made by T. K. Menon of the National Radio Astronomy
Observatory by measuring the distribution of radiation produced
by ionized hydrogen at a wavelength of 3.75 centimeters. Distribu
tion of gas in the nebula can then be deduced from these data.
95
© 1965 SCIENTIFIC AMERICAN, INC
age main sequence are evolving on a definite timetable. Consequently, with the help of the theory of stellar evolution we can use these stars to compute the age of the cluster as a whole. The clusters associated with gaseous nebulae are typically a few million years old. Specific estimates for the age of the cluster in the Orion nebula range from half a million to about three million years. Considering that our galaxy is
100,000
c;:: w I-w � 10,000 1"\ I-Z w U
thought to be lO billion to 20 billion years old, such clusters are very young indeed.
The remarkable geometry of the Orion nebula and its star cluster leaves no doubt that the stars and gas are physically associated and have had a common history. The system has a well-defined center in the region of the Trapezium, which is the brightest part of the nebula and the site of the greatest concentra-
U CD :::l U 1,000 0:: w Q.. if)
l,� �-"" r----t ............ ! I z
Q z 100 w I \.9 0 0:: 0 >-6 >- 10 I-U) Z w 0
o o
.............. I � .
...... ......
...... -----... -
1 2
........ .... -
DISTANCE FROM CENTER OF NEBULA (PARSECS)
-
---
3
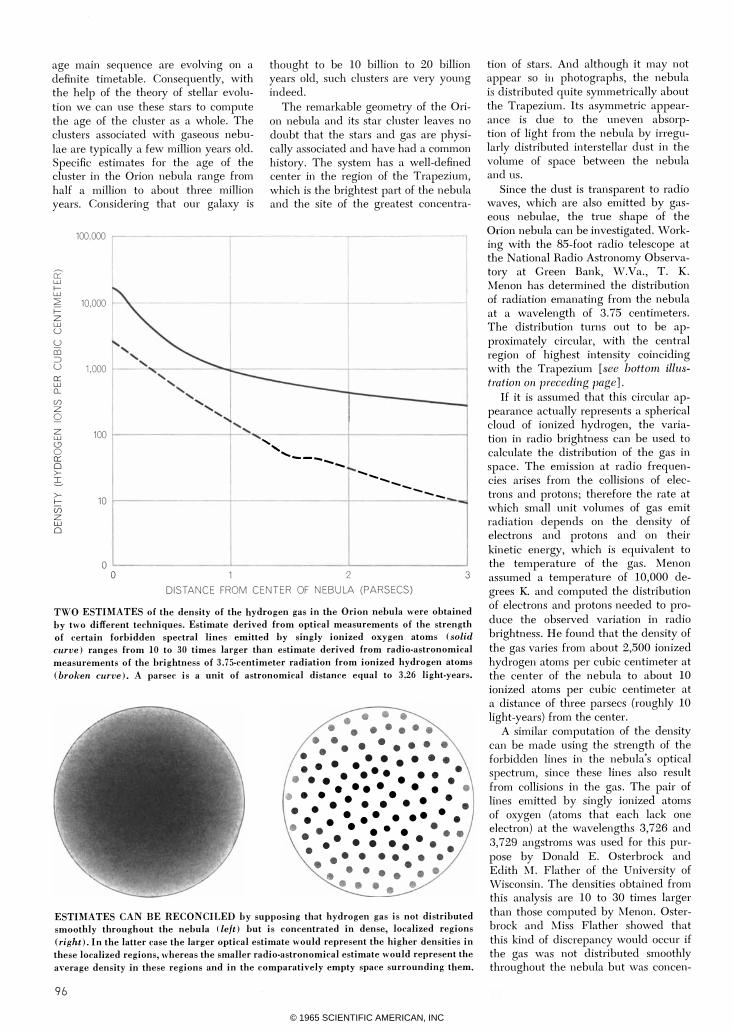
TWO ESTIMATES of the density of the hydrogen gas in the Orion nebula were obtained
by two different techniques. Estimate derived from optical measurements of the strength
of certain forbidden spectral lines emitted by singly ionized oxygen atoms (solid
curve) ranges from 10 to 30 times larger than estimate derived from radio-astronomical
measurements of the brightness of 3.75-centimeter radiation from ionized hydrogen atoms
(broken curve). A parsec is a unit of astronomical distance equal to 3.26 light-years.
o .. 0 0 .. . 0 •• 0 .. 0
..
... ..
. . . .. • • •• • • • • • • • •• •
· .. . .. . . . ...
. ... . . .. .. . . . . . .
• • • • • • • • • • •• • •• • •
· . . .. . ·0. • • • • • • • •• • •
• •• • •••
• • ..
. . . . . . .. . . ..
..
ESTIMATES CAN BE RECONCILED by supposing that hydrogen gas is not distributed
smoothly throughout the nebula (le/t) but is concentrated in dense, localized regions
(right)_ In the latter case the larger optical estimate would represent the higher densities in
these localized regions, whereas the smaller radio-astronomical estimate would represent the
average density in these regions and in the comparatively empty space surrounding them.
96
tion of stars. And although it may not appear so in photographs, the nebula is distributed quite symmetrically about the Trapezium. Its asymmetric appearance is due to the uneven absorption of light from the nebula by irregularly distributed interstellar dust in the volume of space between the nebula and us.
Since the dust is transparent to radio waves, which are also emitted by gaseous nebulae, the true shape of the Orion nebula can be investigated. Working with the 85-foot radio telescope at the National Radio Astronomy Observatory at Green Bank, W.Va., T. K. Menon has determined the distribution of radiation emanating from the nebula at a wavelength of 3.75 centimeters. The distribution turns out to be approximately circular, with the central region of highest intensity coinciding with the Trapezium [see bottom illt,stration on preceding page J.
If it is assumed that this circular appearance actually represents a spherical cloud of ionized hydrogen, the variation in radio brightness can be used to calculate the distribution of the gas in space. The emission at radio frequencies arises from the collisions of electrons and protons; therefore the rate at which small unit volumes of gas emit radiation depends on the density of electrons and protons and on their kinetic energy, which is equivalent to the temperature of the gas. Menon assumed a temperature of lO,OOO degrees K. and computed the distribution of electrons and protons needed to produce the observed variation in radio brightness. He found that the density of the gas varies from about 2,500 ionized hydrogen atoms per cubic centimeter at the center of the nebula to about 10 ionized atoms per cubic centimeter at a distance of three parsecs (roughly 10 light-years) from the center.
A similar computation of the density can be made using the strength of the forbidden lines in the nebula's optical spectrum, since these lines also result from collisions in the gas. The pair of lines emitted by singly ionized atoms of oxygen (atoms that each lack one electron) at the wavelengths 3,726 and 3,729 angstroms was used for this purpose by Donald E. Osterbrock and Edith M. Flather of the University of Wisconsin. The densities obtained from this analysis are lO to 30 times larger than those computed by Menon. Osterbrock and Miss Flather showed that this kind of discrepancy would occur if the gas was not distributed smoothly throughout the nebula but was concen-
© 1965 SCIENTIFIC AMERICAN, INC

Electronic "blood bank"
Walk through our RMC ceramic
capacitor plants and you'll see jars
like these lined up by the hundreds.
They hold some 25 million ceramic
discs, carefully classified by elec
trical properties, ready to be made
into capacitors at an instant's notice
to meet emergency orders. We can
assemble, test and deliver quantity
orders in less than 48 hours.
This swift, sure, abundant supply
saves manufacturers the high cost
of keeping their own capacitor
inventory, saves capital that would
otherwise be tied up in stock.
Mallory concentrates on dependable
delivery, competitive prices and reli
able components to keep your costs
down and your product performance
up. P. R. Mallory & Co. rnc.,
J ndianapolis, T ndiana 46206.
MAiIORY electrical and electronic components· battery systems· seq uence ti mers • special metals
© 1965 SCIENTIFIC AMERICAN, INC

GEOMETRY AND ANALYSIS OF PROJECTIVE SPACES
C. E. Springer, The University of Oklahoma College mathematics students and high school geometry teachers will find this text a
clear and rewarding introduction to an elegant branch of mathematics. To render projective geometry meaningful to the beginner in the field. the author introduces projective notions by means of metric interpretations in the euclidean plane and shows their projective significance later. Many graded exercises, ranging from the routine to the most demanding, test the reader's understanding of the text and his ability to generalize from it.
1964,299 pages, $7.50
REPRODUCTIVE PHYSIOLOGY, Comparative Reproductive Physiology of Domestic Animals. Laboratory Animals. and Man
A. V. Nalbandov, University of Illinois Suitable for readers with a variety of backgrounds and interests. this book provides a
broad base of information in an important branch of physiology. Taking a comparative approach, the author illustrates his discussion with whatever pertinent experimental data there are, whether on domestic animals, laboratory animals, or primates. The new, second edition includes recently discovered information on corpus luteum maintenance, the role of releasing factors in hypophyseal control, and the relationship between hormones and psychosomatic behavior.
Second Edition, 1964, 316 pages, $7.50
QUALITATIVE ELEMENTAL ANALYSIS
Ernest H. Swift and William P. Schaefer, California Institute of Technology
An unconventional system of analysis is employed in this book, which is intended to be used in freshman and sophomore courses in qualitative analysis in conjunction with a general chemistry text. In this system the major separations are designed to correlate with the fundamental properties of the elements, and therefore with their electronic structures and positions in the periodic table. This correlation is a great aid to the student in organizing what he learns in the laboratory. "This is a thorough, high quality text. Any student who masters its contents will know a lot of inorganic and analytical chemistry .. and he will have had fun in the learning."
R. NELSON SMITH in Analytical Chemistry, July 1962
1962,469 pages, $6.75
CONCEPTS OF CLASSICAL OPTICS
John Strong, The Johns Hopkins University
A world-renowned experimental physicist presents a vigorous and coherent treatment of optics, with emphasis on physical notions. "Written as a textbook for an intermediate course in optics, this volume, with its lively and original treatment of the subject, will also be useful for reference purposes .... The latter part of the bookalmost half-is devoted to 17 appendices consisting of essays written by outstanding authorities on topics of current research interest. Several of these are valuable summaries of material that cannot be conveniently found elsewhere .... Roger Hayward's distinctive drawings are especially helpful where three-dimensional visualization is required .... "
F. A. JENKINS in Science, October 31,1958
1958, 692 pages, $9.50
PRINCIPLES OF HUMAN GENETICS
Curt Stern, University of California, Berkeley
"This has been the standard general textbook in human genetics since it first appeared in 1949 .. . . In so far as it is possible for one book to do so, this one fills everybody's need. It is suitable for the beginner, for it assumes no previous knowledge of genetics. Yet it goes far enough that the person who has had a course in general genetics will find perhaps threefourths of the book new to him. Except for specialized treatises, no book that I know of has so much information on such a wide variety of topics in human genetics. Moreover the information is in easily assimilated form, for Stern's writing style is to spell out each principle slowly, in great detail, and with a wealth of illustrative examples .... Curt Stern is known as one of biology's great teachers. This is evident on every page .... "
JAMES F. CROW in The Quarterly Review of Biology, March 1962
Second Edition, 1960, 753 pages, $9.50
W. H. FREEMAN AND COMPANY 660 Market Street San Francisco. California 94104
I enclose payment of $ (California residents add 4% sales tax). Send me. postpaid. tbe books listed above. I understand that if I am not satisfied the books may be returned for full refund within 10 days after they are received.
NAME ______________________ _
AD DR ESS __________________ __
o Send me a complete catalogue of Freeman Books in Science.
© 1965 SCIENTIFIC AMERICAN, INC

b'ated in regions of high density that occupied only a fraction of the total nebular volume.
Another feature of the nebula that can be investigated spectroscopically is the motion of the gas. This is done by measuring the Doppler shifts in the wavelengths of various spectral lines with respect to their normal wavelengths. The most recent and extensive such study has been made by O. C. Wilson, Guido Mi.inch, Miss Flather and Mary F. Coffeen at the Mount Wilson and Palomar Observatories.
Their work shows that the motion of the gas can be resolved into two components. The first is a highly irregular pattern of turbulent motions. Different portions of the gas are moving with respect to one another with velocities
as high as 25 kilometers per second, or about 60,000 miles per hour. The second component is a general expansion of the nebula and is made up of two subcomponents. One subcomponent, derived from the lines of singly ionized atoms of oxygen, shows an expansion velocity of about seven kilometers per second; the second subcomponent, derived from the lines of doubly ionized atoms of oxygen, shows an expansion velocity of about 10 kilometers per second.
The difference between the two values is significant: it indicates that different regions of the Orion nebula are expanding with different velocities. The oxygen in the nebula is photoionized by the ultraviolet radiation of the brightest stars in much the same way the hydro-
gen is. Since the amount of ultraviolet radiation is considerably larger in the central region of the nebula, where these stars are located, than in the outer regions, each atom tends to be doubly ionized if it is near the center of the nebula but only singly ionized if it is in the outer parts. It therefore appears that the region expanding at only seven kilometers per second is farther from the center of the nebula than the region expanding at 10 kilometers per second.
With these various observational re-sults available I became interested
in trying to develop a theoretical model of the Orion nebula that would test current ideas about the formation and expansion of gaseous nebulae. According to these ideas the Orion nebula
5,000.--------------------------,r-------------------------�--------------------------_,
o
Q Q? w f-w � f-Z w 1,000 u � (l] => u cr: w (L (/) 500 z Q z w t.9 0 cr: 0 34,500 >-� >-f-Uj Z w 0
��------------------------�-------------------------L----------------------�� o .5 1 J.5 DISTANCE FROM CENTER OF NEBULA (PARSECS)
THEORETICAL DISTRIBUTION of hydrogen gas in the Orion
nebula was calculated by the author for four different stages in
the expansiou of the nebula; the age in years associated with each
distribution curve is indicated. Small open circles represent density
estimates derived from radio·astronomical measurements. These
estimates appear to fit the theoretical values best at an age be·
tween 1l,500 and 23,000 years. Because of technical difficulties
the densities near center of the nebula have not been calculated.
99
© 1965 SCIENTIFIC AMERICAN, INC

100
25 Years
P1tefJevtUtg �yOWt 1965 T ultmg O'Uleu
You can bet your own product reputation that things are on the quality move at TMI. Being specialists in the production of extremely critical tubing for critical applications, the industrial times leave nary a moment to stray from the basic objectives upon which Tube Methods has
in size, in ability, in
¥ By staying ahead with
research experience. we are
always ready to tackle your
particular cold·drawn tubing
requirements successfully.
We are specialists in cold-drawn seamless and welded stainless steel. High temperature and High Corrosion Alloys including Haynes, and Huntington Alloys, to highest precision standards in small diameters: .050" to 1.250" 0.0. Nationwide distribution. Write, wire, or phone.
Tube Methods Inc.
14 ____ ._ •• m
0 12 z 0 u w U) 0:: 10 w 1!���/ �---'
" "
. //.. .
" "-
,
I--"
D-U) 0:: 23,000 1,...----..........
/ ' ..... ,
"
" '" w c-w 2 8 / I " I "
0 / -----, -----------' � z
/ I , , / '"
" Q 6 U) z « D-x w LL 4 I� � ..... .......... 11'r .......... 0 >-c-U 0 -' w 2 >
/ I -....... ----------I
I I I I o o .5 1 1.5
DISTANCE FROM CENTER OF NEBULA (PARSECS) THEORETICAL VELOCITY OF EXPANSION of Orion nebula was calculated for
three different ages in life of nebula. Model attains observed velocity of expansion (about
10 kilometers per second) only at an age of about 23,000 years (broken black curve).
must have been a stationary cloud of cold, un-ionized gas with a temperature of about 100 degrees K. before the exciting stars formed and began heating the gas. Once the gas was heated its pressure was much greater near the center of the nebula than in the outer parts because the gas is so highly concentrated near the center. The expansion of the nebula results from this excess pressure at the center.
To construct a theoretical model of the expansion of the Orion nebula I had to guess the initial distribution of the un-ionized gas in the original cloud. I then assumed that the exciting stars began radiating abruptly in the Lyman continuum. \"'hen I calculated how the gas became ionized and heated, I found that both processes occurred very rapidly without setting the gas in motion. To calculate the expansion of the gas it was necessary to solve the equations of motion that describe the acceleration of the gas in response to the excess pressure at the center. The results of these calculations can be shown by plotting the calculated density and velocity of expansion at various distances from the center for successive times during the expansion [see illustration on preceding page and illustration above J.
The model shows that 23,000 years after the initial heating of the gas the velocities of expansion in regions not too far from the center are as high as 10 kilometers per second and that outside these regions the velocities decrease w:th increasing distance from the center. At about the same time, or perhaps slightly earlier, the model has a distribution of gas dens;ty that is quite close to that derived from the observations by Menon. (Menon's distribut:on, rather than the higher values found by Osterbrock and Miss Flather, is the correct one to use in this comparison because it gives the average density of gas in the nebula.) Thus at an age of 23,000 years the model gives a satisfactory representation of the present, observed state of the Orion nebula. (We of course are see:ng the nebula as it actually existed when its electromagnetic radiation left it some 1,500 years ago.)
Although this agreement seems to indicate that the model does represent the expansion of the Orion nebula, the model must be viewed with important reservations. For example, a period of between 10,000 and 20,000 years is required for the formation of one of the exciting stars, so it is a crude approximation to treat the onset of their radiation as abrupt. Moreover, the model
© 1965 SCIENTIFIC AMERICAN, INC

neglects fluctuations in density and the turbulent motions of the gas . Nevertheless, it is reasonable to conclude that the age of the Orion nebula, measured from the time when radiation in the Lyman continuum first ionized and heated the gas, is on the order of 20,000 years.
The age of the exciting stars cannot be much different, because the age of the nebula determines the time at which the exciting stars became luminous. As it happens, there is an independent line of evidence that supports a low age for these stars. Several years ago the Soviet astronomer P. P. Parenago studied the motions of the four stars in the Trapezium and found that they are moving away from each other at such velocities that if they were formed close together, which seems likely, they would have moved to their present positions in just about 10,000 years. This establishes their approximate age, because if they were much older than that, they would now be much farther apart.
I t seems entirely reasonable, then, that although most of the members of
the cluster of stars embedded in the Orion nebula are about a million years old, the stars in the Trapezium, the two stars in Theta-Two Orion is and the Great Nebula itself are somewhere between 10,000 and 23,000 years old. This range in estimates is quite satisfactory when one considers the uncertainties involved.
Not many years ago astronomers assumed as a working hypothesis that all the stars in a given cluster were formed at a single, moderately well-defined time. The first important evidence against this view was presented in 1962 by George H. Herbig of the Lick Observatory, who showed that in some clusters (including the cluster in the Orion nebula) the faintest stars seem to be significantly older than the brighter stars. The low age now found for the Orion nebula and its exciting stars is consistent with Herbig's results.
If the Orion nebula and its exciting stars were formed no more than a few thousand years ago, it is quite likely that similar stars and nebulae are in the process of forming even now. If we can improve our understanding of the past history of the Orion nebula, we may learn to recognize clouds of interstellar gas in which gaseous nebulae will form in the future. But it is to the astronomers of the distant future that we must leave the task of observing such clouds as they become luminous and achieve the prominence that now belongs to the Great Nebula in Orion.
Interpretation by William Thoman
Calculating Movement
in Air
los
PROBLEM : H ow to ca l c u l ate what h a ppens when a shock i n a i r co l l i d es with a so l i d obj ect . T h e d eve l o p m e n t of co m p utat i o n a l methods for t h e d eta i l ed so l ut i o n o f m u lt i -d i m e n s i o n a l g a s flow fl u i d dyn a m i c eq uations typifi es the c h a l l e n ges faced by Los A l a m os scientists a n d e n g i n ee rs i n m a n y a reas of basic rese a rch .
Qualified applicants interested in research at Los Alamos are invited to send resumes to : Director of Personnel Division 65-20
alalD.os SCIENTI F I C LABORATORY Of THE UNIVERSITY Of CALIfORNIA lOS AlAMOS. NEW MEXICO
An eq u a l opportun ity employer. U n ited States Citizens h i p req u i red.
1 0 1
© 1965 SCIENTIFIC AMERICAN, INC


![Scattered Nebular Lightin theExtended Orion Nebula · 2018-10-27 · arXiv:0909.0538v1 [astro-ph.GA] 2 Sep 2009 Scattered Nebular Lightin theExtended Orion Nebula 1 C. R. O’Dell](https://img.pdfslide.us/doc/110x75/5f92bc6e796fc824033aa576/scattered-nebular-lightin-theextended-orion-nebula-2018-10-27-arxiv09090538v1.jpg)