Embed Size (px)
Citation preview
Journal of Sound and Vibration, Volume 271, Issues 3-5, 6 April 2004, Pages 959-984.
Title:
THE ACOUSTICS OF RACING ENGINE INTAKE SYSTEMS
Authors:
M.F. Harrison*1 and A. Dunkley 2
*corresponding author
Professional addresses:
1 School of Engineering,Cranfield University, Cranfield, Bedfordshire MK43 0AL, England
2 Ilmor Engineering LtdQuarry Road, Brixworth, Northants NN6 9UB, England
Correspondence to:
Dr Matthew HarrisonSchool of Engineering
Whittle BuildingCranfield University
CranfieldBedfordshire MK43 0AL
Reference: INTAKE SYSTEM ACOUSTICS, Revision 2 (25th February 2003)
Total number of pages of text: 30 (out of 47 including this page)Total number of figures: 268022 words
M.F. Harrison, A. Dunkley RACING INTAKE SYSTEM ACOUSTICS, Revision 2
2
ABSTRACT
Naturally aspirated racing engines have tuned intake systems and can now achieve volumetric
efficiencies in excess of 125% and peak engine speeds in excess of 18,000 rev/min.
Engines designed for single seater racing commonly dispense with the intake manifold and its
convoluted and restricting flow path preferring single lengths of pipe feeding each cylinder
separately.
An investigation into the intake process on a single cylinder racing engine has shown that
inertial ram effects make a strong contribution to the intake process at high engine speeds
whereas acoustic resonance effects are more important to the rather weak wave action that
occurs at low engine speeds. An acoustic model of the resonant wave action has proved
useful in distinguishing between these two effects. The attributes of the acoustic model have
been compared to those of more traditional time-marching gas-dynamics calculation
methods.
A decoupled hybrid method has been shown to yield calculations of the wave dynamics in the
intake system of a single cylinder racing engine that show fair agreement with measured
results up to the 10th harmonic of the engine cycle frequency.
In a case study, the intake characteristics of a single cylinder racing engine have been shown
to differ only slightly from those expected from the V10 engine on which it is based,
although this will only be the case when the dimensions of the intake system are chosen
appropriately.
M.F. Harrison, A. Dunkley RACING INTAKE SYSTEM ACOUSTICS, Revision 2
3
1 Introduction
Naturally aspirated racing engines have tuned intake systems and can now achieve volumetric
efficiencies in excess of 125% and peak engine speeds in excess of 18,000 rev/min.
Engines designed for single seater racing commonly dispense with the intake manifold and its
convoluted and restricting flow path preferring single lengths of pipe feeding each cylinder
separately. In the main, the engine tuning process involves the selection of an appropriate
pipe length along with the sizing and timing of the intake (and exhaust) valves in order to
harness the unsteady flow in the intake to produce improved volumetric efficiency.
The V10 Formula 1 engine sits a little way behind the driver. Ten short lengths of vertically
aligned intake pipe feed the ten cylinders. These pipes are contained in an airbox of several
litres capacity located directly over the engine. This airbox is fed with air collected from
above the driver’s head and delivered by a large flared air-horn that is about three-quarters of
one metre long.
Traditional trial and error tuning on the dynamometer is nowadays supported by engine
simulations on the computer. These take account of the unsteady flow in the intake (and
exhaust) pipes as well as the unsteady mass transfer through the valves using one-
dimensional (1D) models in the time domain [1]. The special requirements for such
simulations when applied to racing engines have been investigated [2] and good agreement
has been found between measured and calculated pressures in the intake systems of high-
speed engines. Notwithstanding this, most engine developers still rely on engine tests to
verify and extend the results from simulations. For the very high performance engines such
M.F. Harrison, A. Dunkley RACING INTAKE SYSTEM ACOUSTICS, Revision 2
4
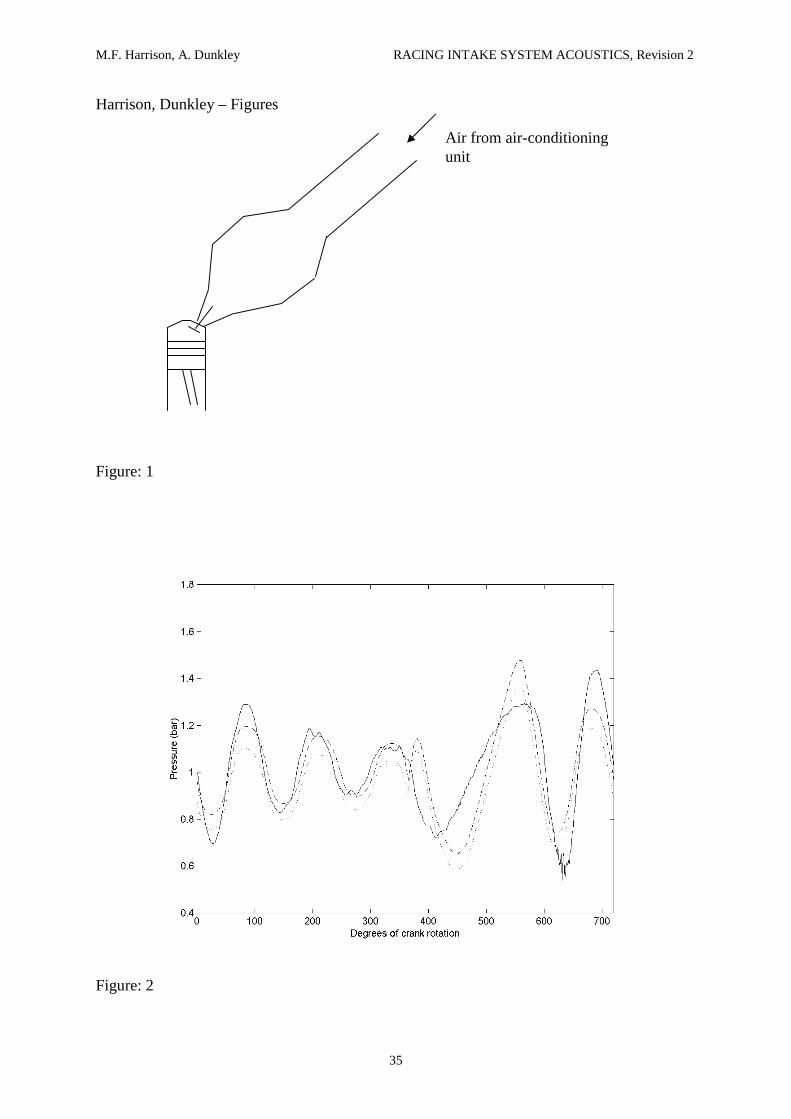
as the 600 kW V10 used in Formula 1 racing it is convenient to test single cylinder engines,
being in essence one cylinder sawn off the V10. A sketch of the intake portion of such an
engine is shown in Figure 1.
The advantage of the single cylinder engine is a much lower running cost. A Formula 1
engine has a service life of only one or two hours when operating at full load. After that time,
a near complete rebuild of the engine is required. The cost advantage of the single cylinder
engine comes from a much reduced rebuild time and the need for service parts (bearings,
piston, piston rings, seals) for only one cylinder rather than ten.
For the single cylinder engine sketched in Figure 1 a large plenum (30 litres) is placed at the
open end of the flared intake pipe to reproduce the effect of the 30 litre airbox on the V10.
Dynamic pressure measurements made in the plenum of the running engine show only slight
fluctuations in pressure compared with the large fluctuation seen in the intake pipe [3]. This
suggests that the plenum is large enough to attenuate the fluctuating pressure amplitude at
that location. It is commonly hoped that this attenuation means that the intake pipes are
effectively decoupled from the remainder of the intake system, which normally includes an
air conditioning unit to control the temperature, pressure and humidity of the air delivered to
the engine. It is also commonly hoped that the airbox on the V10 performs the same
decoupling function.
The main difficulty with the use of a single cylinder engine is that the measured performance
does not closely match that obtained with the V10 [3]. The reasons for this have been
investigated [3,4]. The first reason is simply that the friction levels per cylinder are higher in
the single cylinder engine due to the extra mechanical systems (such as balance shafts)
M.F. Harrison, A. Dunkley RACING INTAKE SYSTEM ACOUSTICS, Revision 2
5
required to balance the engine. The second reason is the absence of exhaust tuning effects
found with the V10 where five cylinders in a bank empty into a common exhaust pipe. The
third reason, which is the subject of this paper, is due to the unsteady cyclic nature of the
intake flow. The term ‘wave action’ is commonly used to describe such flow and it comprises
two effects: resonant acoustic behaviour and an ‘inertial ram effect’.
The inertial ram effect has been reported before. Dennison [5] found that the optimum
supercharging effect occurred with a pipe of only 52% of the length that Capetti predicted
would yield the lowest resonance frequency of a simple intake pipe using his resonant wave
action theory [6]. On the basis of this he rejected the theory of resonance as being of “little
more than academic interest” when it came to improving engine performance and he
developed a theory of supercharging by inertia effects. His calculations based solely on
inertia effects, did not match his experimental results very well.
Taylor et al [7] expanded the investigation to take account of both inertial and acoustic
resonance effects. Both were found to be important, the relative importance of each varying
with engine speed and intake pipe length. Variations with valve timing and with inlet pipe
diameter were also reported. For operating conditions yielding the greatest volumetric
efficiency, their results showed the inertial ramming effect to be the most significant.
Wave action in intake (and exhaust) systems is most conveniently calculated using a time-
marching solver to the well-known gas-dynamic equations [1]. In this way, both resonant
acoustic and inertial ram effects are considered. Such solvers form the basis to engine
performance simulation methods, of which several computer codes are available
commercially.
M.F. Harrison, A. Dunkley RACING INTAKE SYSTEM ACOUSTICS, Revision 2
6
A commercial engine simulation code (known as AVL Boost) has been used to calculate the
intake wave dynamics in a single cylinder Formula 1 engine [4]. The code uses a finite-
volume shock-capturing scheme [8] as the wave action solver and is taken to be a good
representative example of the current state of the art in such codes.
Figure: 2 shows the pressure time history measured in the intake port of the single cylinder
Formula 1 engine sketched in Figure: 1, operating at 10,000 revmin-1 wide-open throttle. The
results of two engine simulations are also shown where the gas exchange in the cylinder, the
combustion, and the intake and exhaust wave action have been included in the modelling. In
the first model, only the intake port geometry is included, neglecting the 30 litre plenum and
the air horn beyond. In the second model, the full intake geometry is included. The results
from the two simulations are very similar to each other and both broadly agree with the
measured results, although some differences in detail are obvious. The degree of agreement
shown was only found when the intake port was modelled as a 175mm long section of pipe
whereas its physical length was known to be 150mm. The need for such ‘end corrections’ has
been noticed in other simulations of this type [2, 4].
On the basis of validation such as this, engine simulations of this type have been commended
for use in racing engine design and development. However, a study of the theoretical
background to current engine simulations has identified areas where the realism of the
modelling might be improved.
At present, the gas conditions in intake system plena tend to be calculated in the same manner
as the gas exchange in the cylinder. The plenum is treated as a zero dimensional volume and
rates of mass inflow/outflow are calculated using an idealised model of the flow through an
M.F. Harrison, A. Dunkley RACING INTAKE SYSTEM ACOUSTICS, Revision 2
7
orifice that is corrected using empirical flow coefficients. This has important implications.
Firstly, the plenum has no length and therefore higher frequency acoustic resonances cannot
be modelled and secondly the results obtained are strongly determined by the choice of inlet
and outlet flow coefficients. In Figure: 2, inlet and outlet flow coefficients were somewhat
arbitrarily set to a value of 0.95. Lower values would have reduced the fluctuating intake
pressure amplitudes obtained from the model.
At present, the rate of inflow to the intake system is calculated assuming stagnation
conditions outside the duct [1]. The implications of this are: firstly, the resulting quasi-steady
state model is unlikely to be fully realistic in racing engines where the intake valve actuates at
a frequency of 150 Hz at 18,000 revmin-1; secondly, the intake air is gathered from above the
driver’s head in an airstream that is far from stagnant, having a race-average velocity
approaching 60 ms-1.
In order to begin to address some of these issues, a linear acoustic model has been employed
here to calculate the intake wave action in a single cylinder Formula 1 engine. The relevant
attributes of the method are: firstly the model for the inflow to the system is dynamic, being
bounded by an acoustic reflection coefficient that varies with frequency; secondly, plena are
modelled with a length dimension and thus wave action therein is included; thirdly the
method is simple thus providing an alternative insight into intake wave action that might
otherwise be hidden in the time-marching numerics of conventional engine simulations.
M.F. Harrison, A. Dunkley RACING INTAKE SYSTEM ACOUSTICS, Revision 2
8
2 The acoustics of the intake system
Consider the intake system of the single cylinder engine as sketched in Figure 1. If the
engine were disconnected from the air-conditioning system then the acoustics of the V10
installation in the car could be approximated by feeding the plenum with air directly from the
dynamometer cell via a large bore straight walled pipe the same length as the air-horn. This
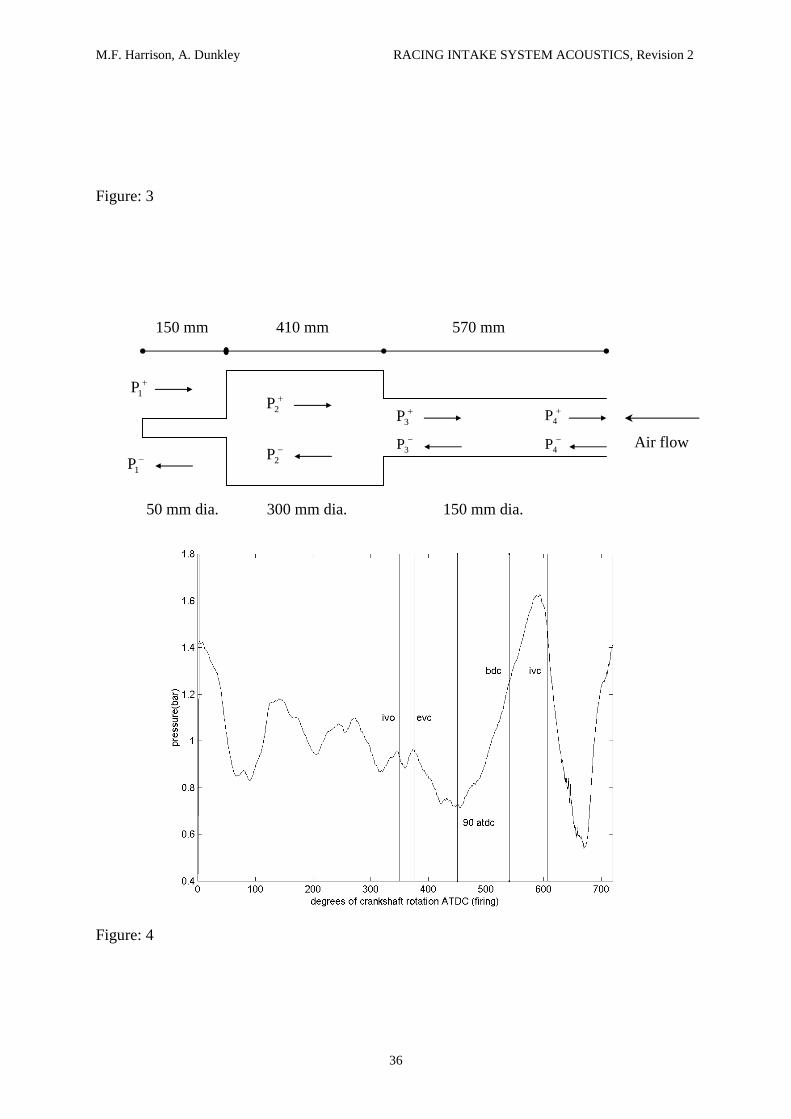
has been tested [3]. The cone angles of the flared inlet and outlet of the plenum are large
enough to suggest the adoption of a simplified model of the intake system as shown in
Figure: 3.
Figures: 4,5 show intake pressures measured on the single cylinder engine at 13,000 revmin-1
and 7000 revmin-1 respectively. In each case, measurements were made using a piezo-
resistive pressure transducer (Kistler type 4045A2) in the short intake pipe near to the back of
the intake valve(s). A crankshaft encoder was used to divide the pressure records so obtained
into short lengths, each one being the data relating to a different four-stroke cycle. These data
sets were ensemble averaged to obtain an average pressure record for one full cycle and
labelled with the key valve events (intake valve opening (IVO), intake valve closing (IVC),
exhaust valve closing (EVC)) and the important piston positions (90 degrees after top dead
centre (ATDC) where the piston velocity is greatest and bottom dead centre (BDC) where it
is instantaneously zero).
The intake pressure record in Figure: 4 has certain features that are similar to intake pressures
measured on another single cylinder engine running at low speeds [9]. Firstly, there is a
decaying pressure oscillation in the period IVC-IVO. Secondly, there is a pressure depression
centred on 90 degrees ATDC corresponding to the maximum piston velocity. Thirdly, there is
M.F. Harrison, A. Dunkley RACING INTAKE SYSTEM ACOUSTICS, Revision 2
9
a pressure peak just before IVC. However, the peak found at 13,000 revmin-1 with this engine
is different from the one found at 2000 revmin-1 on the low speed engine [9]. The height of
the peak on the low speed engine matched the depth of the depression that preceded it
suggesting the dominance of an acoustic oscillation about the prevailing stagnation pressure.
In the racing engine, the height of the peak (0.6 bar) is much larger than the depth of the
depression (0.25 bar). This suggests that in addition to there being an acoustic oscillation
present, there is some transfer of momentum in the late intake flow that causes a pressure rise
behind the closing intake valve(s). That effect (often called inertial ram) seems to account for
0.35 bar of the 0.6 bar pressure peak and therefore seems to be the dominant effect at this
engine speed.
The conclusions reached by Taylor et al [7] are in line with the observations made with
respect to Figure: 4. The speed of 13,000 revmin-1 corresponds to the speed region of very
high volumetric efficiency for the racing engine, and the inertial effects do seem to be more
significant than the acoustic resonance effects.
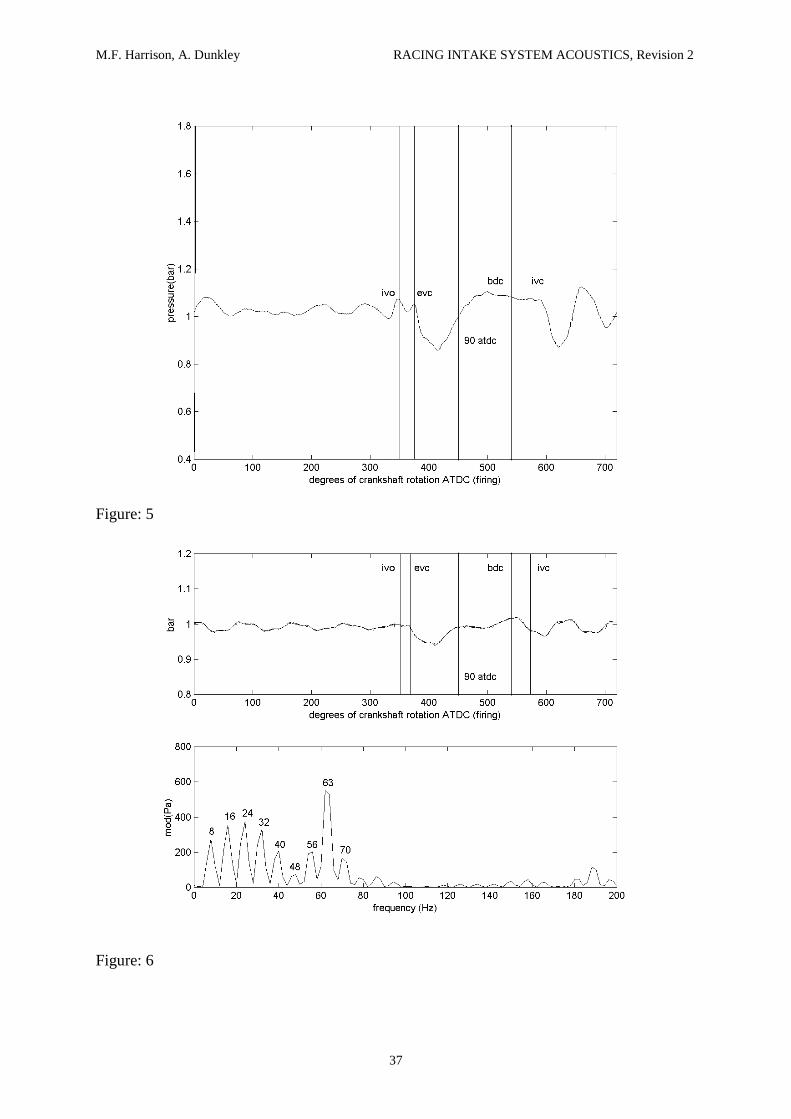
The pressure record in Figure: 5 corresponds to the lowest practical speed for a racing engine
(7000 revmin-1) where the volumetric efficiency of the engine is known to be poor. The fact
that it is poor is not surprising as there is no evidence of inertial ram effects and only slight
evidence of acoustic resonance effects as there is hardly any pressure peak before IVC. The
pressure depression occurs before 90 degrees ATDC, an effect that has been noticed on
another single cylinder engine operating at 1000 revmin-1 (the lowest practical running speed
for that engine) as shown in Figure: 6. The pressure records in Figures: 5 and 6 have very
similar features showing that poor volumetric efficiency at the lowest speeds corresponds to a
pressure depression soon after IVO and very weak wave action to follow.
M.F. Harrison, A. Dunkley RACING INTAKE SYSTEM ACOUSTICS, Revision 2
10
The frequency at which the pressure oscillates in the intake pipe of the racing engine has been
estimated by finding the time interval between successive pressure minima in Figures: 4 and
5. At 13,000 revmin-1, the pressure oscillates at 600Hz directly after IVC, then at 629 Hz for
the next oscillation and then at 690 Hz for the last oscillation before IVO. So, the oscillation
frequency varies during the cycle, the variation being some 15% when the valve is closed.
This may simply be due to the variation in the flow Mach number which will drop from
around 0.15M at IVC to near zero at the next IVO. The corresponding oscillation frequencies
for the 7000 revmin-1 case are 506 Hz, 525 Hz, 552 Hz, (362 Hz – double minimum present),
545 Hz.
These variations in oscillation frequency were not found when the wave action was
investigated in the intake system of a low speed engine [9].
The average pressure record from one cycle shown in Figure: 4 has been repeated many times
to form a long data sequence. By using a moving Hanning window to produce the average of
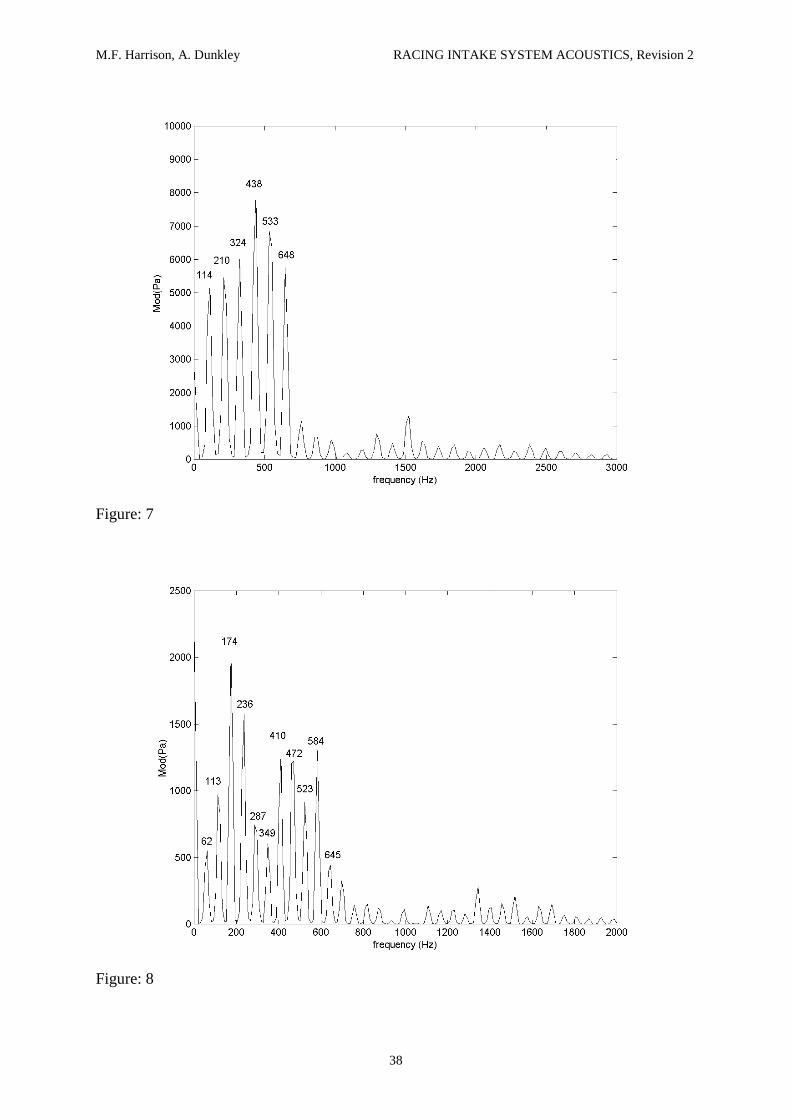
many 4096 point FFTs the spectrum shown in Figure: 7 was produced with a spectral
resolution of 19Hz due to the sample frequency being 78 kHz. The same technique applied to
the data in Figure: 5 yields a spectrum of the intake pressure at 7000 revmin-1 with a
frequency resolution of 10 Hz (the sample frequency being 42 kHz) as shown in Figure: 8.
Inspecting Figure: 7, the dominant frequency component of the intake pressure is 438 Hz.
This is the 4th harmonic of the intake valve actuation frequency at 13,000 revmin-1. The other
spectral components are the other integer harmonics of the cycle frequency (1, 2nd , 3rd etc).
The arithmetic mean of the closed valve oscillations is 640Hz which is close to the 6th
harmonic of the cycle frequency (648 Hz).
M.F. Harrison, A. Dunkley RACING INTAKE SYSTEM ACOUSTICS, Revision 2
11
Inspecting Figure: 8, the dominant frequency component of the intake pressure is 174 Hz.
This is the 3rd harmonic of the intake valve actuation frequency at 7000 revmin-1. As before,
the other spectral components are the other integer harmonics of the cycle frequency. The
arithmetic mean of the closed valve oscillations is 504Hz which does not coincide with any
of the harmonics of the cycle frequency. This suggests that any acoustic resonance present is
only weak.
For a low speed single cylinder engine with a long straight pipe intake system, the following
hypothesis was developed [9]:
The early stages of the intake process are governed by the instantaneous values of the piston
velocity and the open area under the valve. Thereafter the effects of acoustic resonance
dominate the process. The depth of the early depression caused by the moving piston
governs the intensity of the wave action that follows. A pressure ratio across the valve that is
favourable to inflow is maintained and maximised when the open period of the valve is such
to allow at least, but no more than, one complete oscillation of the pressure at its resonant
frequency to occur whilst the valve is open.
The racing engine studied here deviates from that hypothesis in two ways. Firstly, at high
speeds inertial ram effects dominate the intake process rather than the seemingly weaker
acoustic resonance effects. Secondly, at low speeds, there is no evidence of inertial ram
effects and any acoustic resonance effects seem to be weak.
M.F. Harrison, A. Dunkley RACING INTAKE SYSTEM ACOUSTICS, Revision 2
12
3 Overview of the acoustic model
The acoustic model employed for this study has been described in detail elsewhere [9], so
only an overview of the calculation method will be given here. The model calculates the
resonant response of the intake system, characterised by the pressure time history P1 in the
intake port, to a forcing due to the volume velocity U1 passing through the intake valve.
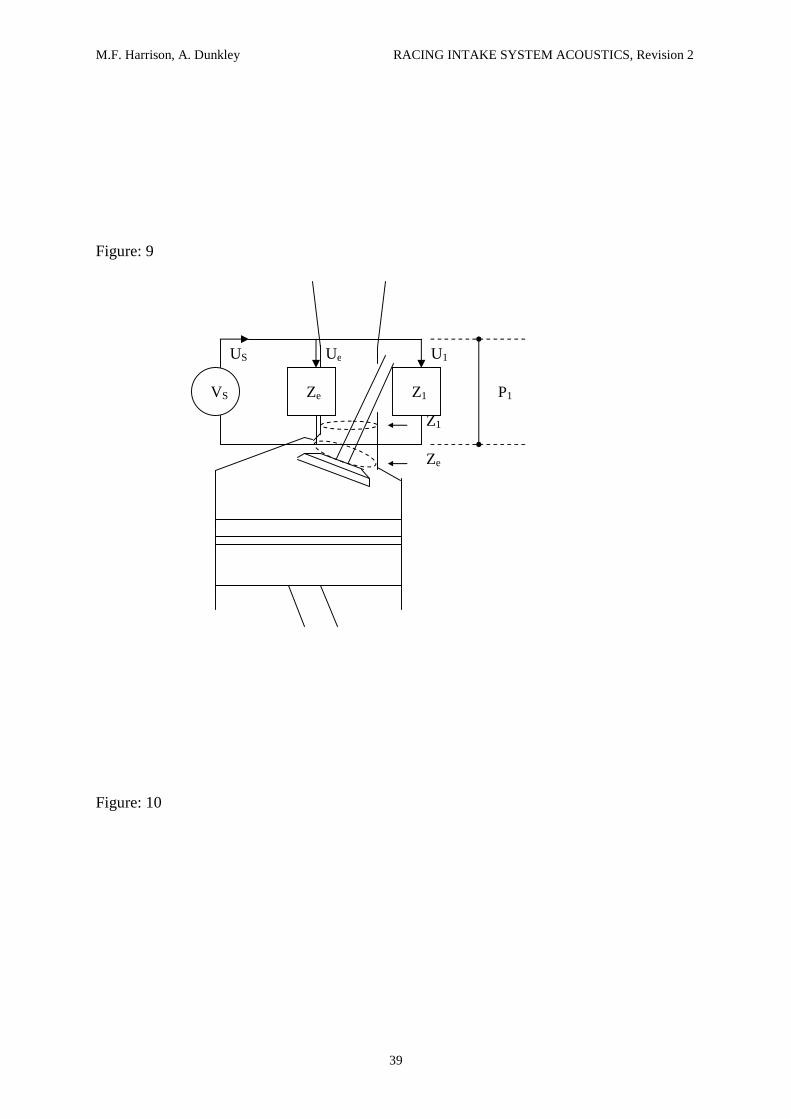
The model may be described using the equivalent acoustic circuit shown in Figure: 9. The
intake process involves two acoustic loads Ze and Z1 acting on a volume velocity source of
strength Vs and producing the pressure P1. The source impedance Ze is a function of the
geometry of the opening and closing intake valve as well as the flow pattern between the
intake port and the cylinder. Its physical location in the engine is shown in Figure: 10. The
load impedance Z1 is a function of the wave action in the intake port and in the rest of the
intake system. Its physical location in the engine is also shown in Figure: 10.
After a study of the intake wave action in a low speed engine [9], it was determined that the
influence of Ze must be small compared with the influence of Z1 and therefore Ze could be
neglected. Therefore, the intake problem reduces to the solution of:
11 ZUP s (1)
The model adopted here can be described as a hybrid method [10] because it combines a time
domain model for Us with a frequency domain model for Z1 to produce a time domain
calculation of P1. However, it is more correctly described as an uncoupled hybrid method
M.F. Harrison, A. Dunkley RACING INTAKE SYSTEM ACOUSTICS, Revision 2
13
because it does not include the interaction between the engine as acoustic source (Us and Ze)
and the acoustic load (Z1) imposed by the intake system.
In the uncoupled hybrid method, U1 is estimated from engine geometry. In the true hybrid
method U1 is equal to Us – Ue and Us is a function of: cylinder dimensions (bore, stroke,
compression ratio), engine speed, scavenging of residual exhaust gas (in turn a function of
exhaust wave dynamics), valve geometry, valve timing, in-cylinder gas temperatures. Ue is
associated with flow losses in the valve.
Therefore, in essence the various hybrid methods in the literature [11 - 19] calculate Us, Ue,
Ze, Z1, U1, P1 whereas in the uncoupled hybrid method used here Z1 is calculated, Ze is
neglected, U1 is estimated and these are used to calculate an approximate P1.
3.1 The model for volume velocity U1
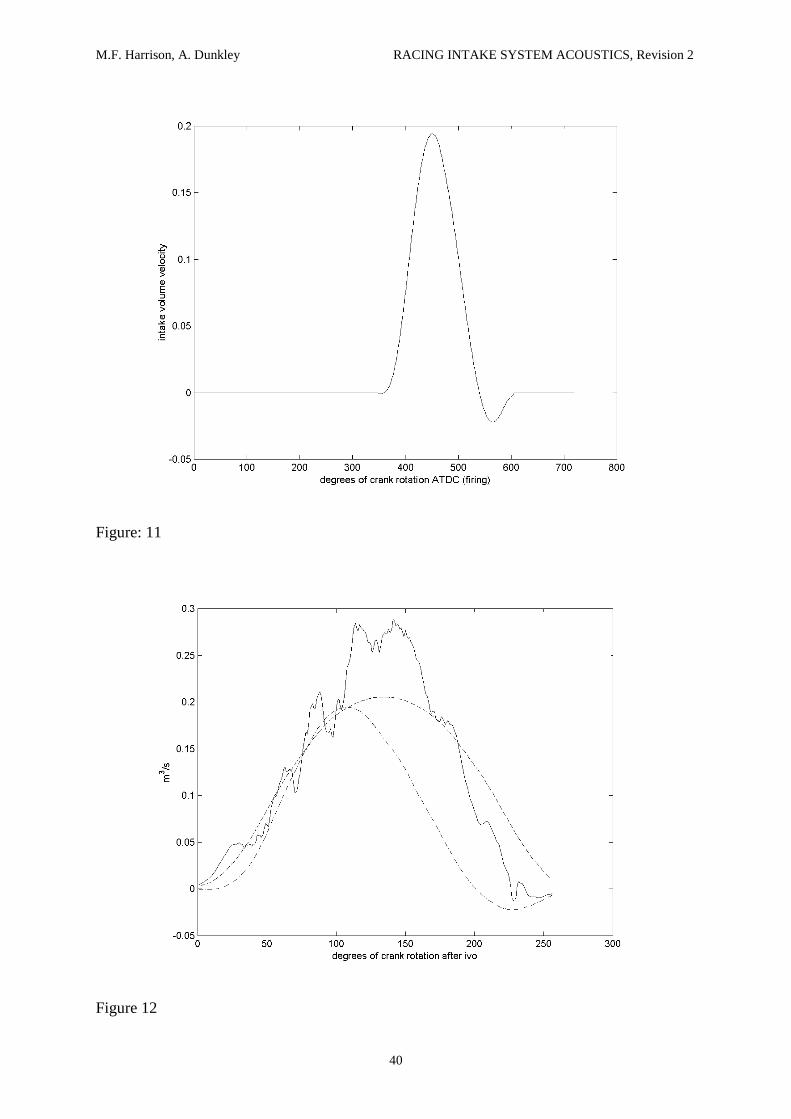
An estimate for U1 is calculated in two steps. A first estimate is obtained from
U1 =1
vd
SS
xtd
Vd(2)
where U1 is time varying and it is a function of the rate of change of cylinder volume Vd and
of the instantaneous flow area under the valve Sv and of the intake port area S1. The results
from this calculation at 13,000 revmin-1 are shown in Figure: 11 (the dimensions of the
engine geometry are not given here in order to respect the confidentiality of the engine
builders). The second stage calculation is a scaling of the time history of flow area under the
opening and closing intake valve(s) (obtained by calculating the curtain area around the base
M.F. Harrison, A. Dunkley RACING INTAKE SYSTEM ACOUSTICS, Revision 2
14
of the opening valve for every degree of crankshaft rotation) so that the scaled results pass
through the maximum value calculated from (2). No physical significance is placed on this
choice of scaling, it is merely convenient and appears to be effective.
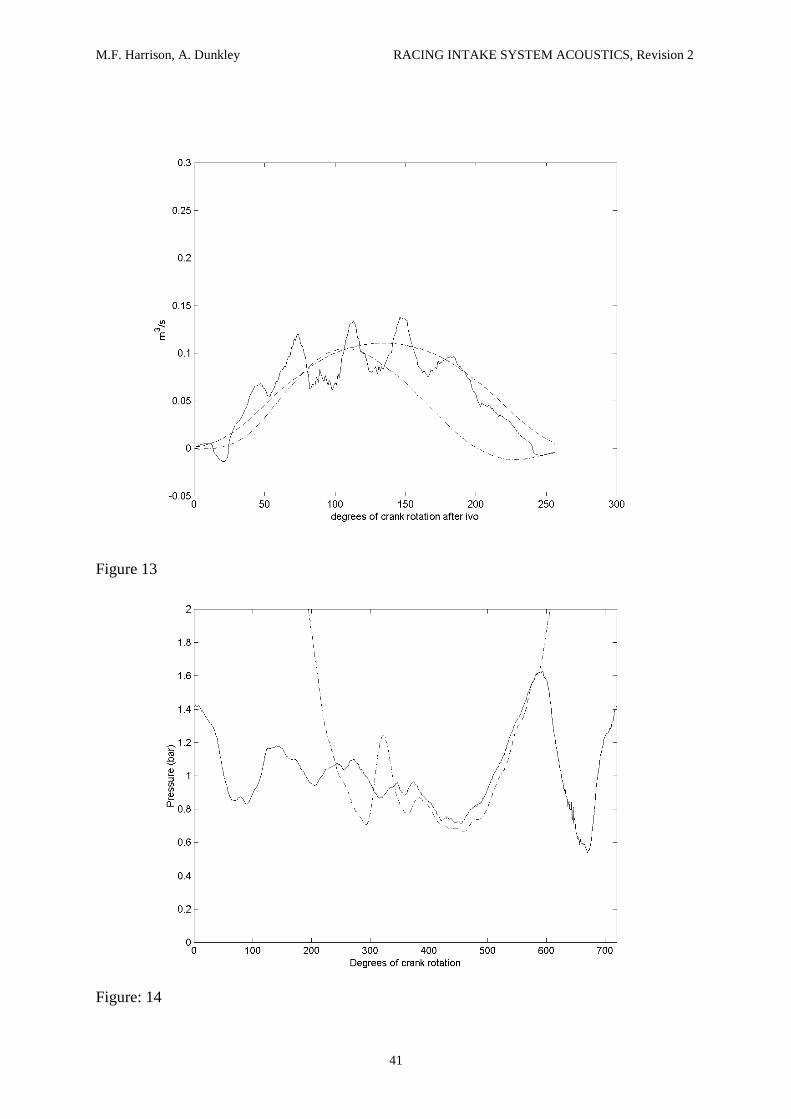
The results from the first and second stage estimates for U1 are shown for a speed of 13,000
revmin-1 in Figure: 12 and for 7000 revmin-1 in Figure: 13. In addition, measurements of U1
are also presented [3] and the agreement between these and the second stage estimates are
seen to be good in a general sense. However, the measured results clearly show a smaller
amplitude oscillation superimposed on a larger amplitude envelope. In developing the models
for estimating U1 the uncoupled assumption was adopted and the effects of Ze were
neglected. If the flow through the valve(s) were truly uncoupled from the wave action in the
intake system then the detail of a good estimate for U1 should agree with measured results.
The presence of the smaller amplitude oscillation in the measured results suggests that either
the oscillation is due to the use of measured data acquired in the intake port rather than at the
actual valve seat or there is some coupling present. If the latter is assumed to be true then Ze
should be included in the model, but in the case of the high engine speed results its influence
is of second order importance as the amplitude of the oscillation is small compared to the
amplitude of the envelope. Inspecting Figure: 13, the influence of what might be assumed to
be coupling is clearly more important at lower engine speeds. Notwithstanding this
suggestion of some coupling between acoustic source and acoustic load, the uncoupled
assumption is retained here as it allows the creation of a simple model that has proved to
validate reasonably well against experiment.
To obtain the measurements of U1 (the volume velocity through the intake valve, at a position
in the intake port just behind the intake valve(s)) a calculation was made based on the
M.F. Harrison, A. Dunkley RACING INTAKE SYSTEM ACOUSTICS, Revision 2
15
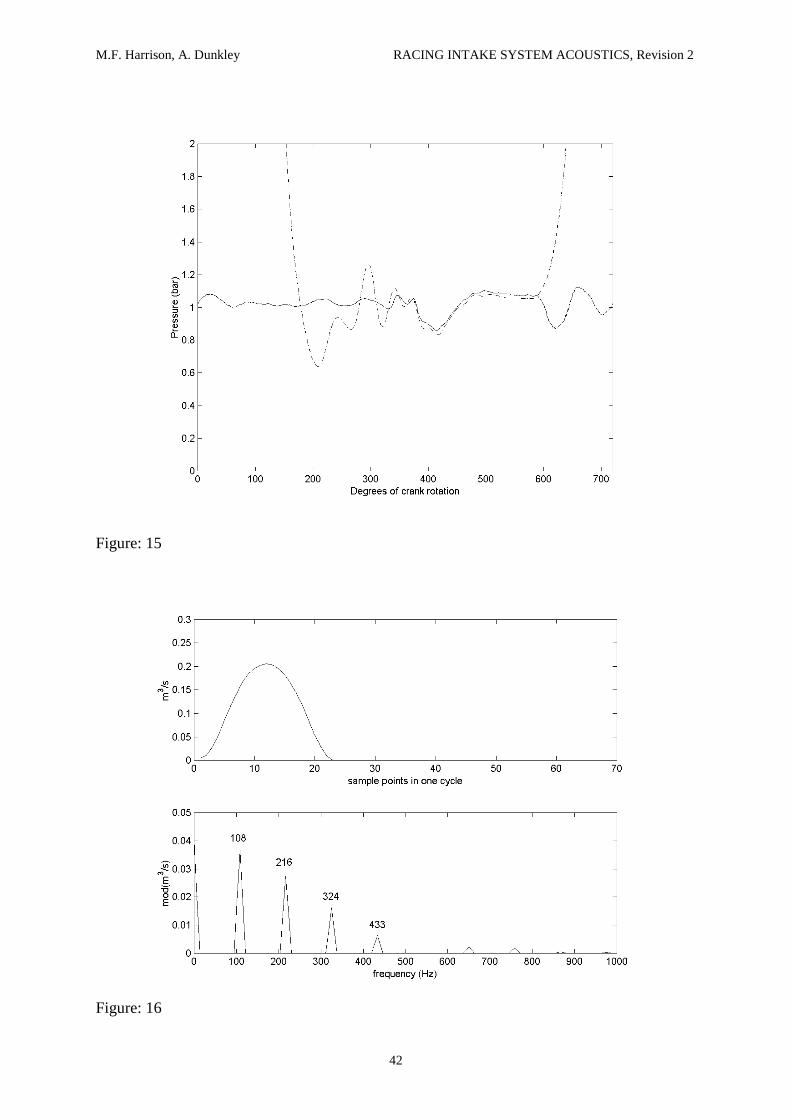
pressure ratio across the opening and closing intake valve [3, 20]. The inputs to this
calculation are simultaneous measurements of the cylinder pressure and of the pressure in the
intake port just behind the intake valve(s) (Figures: 14, 15). These require some careful cross
calibration to overcome DC drift problems commonly encountered with cylinder pressure
measurements as described in [20]. The measured pressure ratio across the intake valve may
be used in a classical model for the flow through poppet valves [21] to calculate the mass
flow rate through the valve:
21
γ1γ
C
1γ
2
C
12
C
eC
PP
1PP
1γγ2
cAP
m
(3)
where
PC = cylinder pressure (Pa)
P1 = intake port pressure (Pa)
cc = speed of sound in the cylinder
Ae = Am C
Am = valve open area (m2)
C = flow loss coefficient (measured on a flow bench)
By assuming stagnation conditions in the cylinder, and by using the value for the prevailing
stagnation density, the volume velocity through the intake valve can be calculated as shown
in Figures: 12,13.
The second-stage estimate of U1 from Figure: 12 has been interpolated so that it forms part of
a 64 point data sequence to describe the 7200 of crankshaft rotation for the four-stroke cycle
as shown in Figure: 16. The single calculated cycle shown in Figure: 12 was repeated many
M.F. Harrison, A. Dunkley RACING INTAKE SYSTEM ACOUSTICS, Revision 2
16
times in a long sequence and by using a moving Hanning window to produce an average of
many 1024 point FFTs the spectrum shown in Figure: 16 was produced with a spectral
resolution of around 7 Hz due to the sample frequency being 6933Hz. It is clear that every
integer harmonic of the valve actuation frequency of 108 Hz is present in this spectrum. This
explains the presence of these spectral components in the corresponding intake port pressure
spectrum shown in Figure: 7.
3.2 The model for the acoustic load impedance Z1
A one-dimensional, linear, plane-wave, frequency domain model of the simplified intake
system shown in Figure: 3 has been prepared [9, 22].
The starting point for the acoustic calculations is the known reflection coefficient at the open
end of the long air-horn
4
44 p
pr (4)
That reflection coefficient is known for the case of inflow to a pipe with a slight bellmouth,
where there is no flow separation on entry and the flow outside of the pipe is essentially
stagnant [22]. The reflection coefficient varies with Mach number in the pipe as well as being
subject to the addition of a small end correction to the length of the pipe to take account of
the phase of r4. As a result, two calculations are performed [9], one for the open valve
condition where the mean Mach number in the short intake pipe is high (0.13M) and one for
M.F. Harrison, A. Dunkley RACING INTAKE SYSTEM ACOUSTICS, Revision 2
17
the closed valve condition when the mean Mach number in the short intake pipe is low
(0.05M).
An acoustic transfer is made between r4 at the open end to r1 at the intake valve position
1
11 p
pr (5)
where the effects of pipe lengths, sudden expansions and sudden contractions in the flow duct
are considered [22]. The final result is the specific acoustic impedance ratio
1
11 r1
r1ζ
(6)
where
1oo11 ScρζZ co = stagnation sound speed (7)
ρo = stagnation speed density
S1 = cross sectional area of the intake port
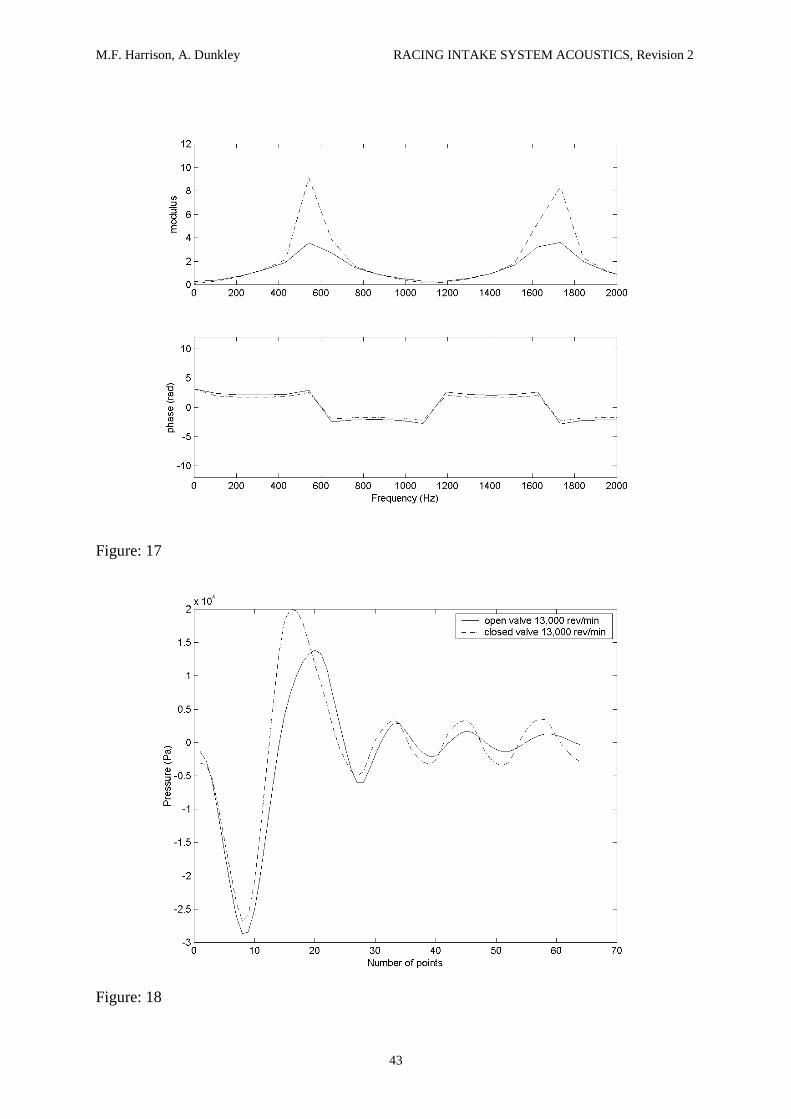
The specific acoustic impedance ratios corresponding to the open and closed valve cases at
13,000 revmin-1 are shown in Figure: 17. The increased mean Mach number in the open valve
case reduces the magnitude of the acoustic impedance at the two resonant frequencies (542
Hz, 1733 Hz) which are clearly shown as peaks in the impedance.
M.F. Harrison, A. Dunkley RACING INTAKE SYSTEM ACOUSTICS, Revision 2
18
3.3 Calculating the intake port pressure P1
Following on from equation 1:
fZfUIFFTtP 111 (8)
U1 (f) is found by taking a single 64 point FFT of the 64 points used in the model to describe
U1 for one cycle as shown in Figure:16. In order to obtain the product in equation (8), the
specific acoustic impedance ratio spectra shown in Figure 17 should be recalculated to be a
64 point double sided spectra with a resolution that matches U1 (f).
The inverse Fourier transform of equation (8) must be performed twice, once for the open
valve values of Z1 and once for the closed valve values. The resulting time histories of P1 are
shown for 13,000 revmin-1 in Figure 18.
In order to complete the calculation of P1, the 64-point sequences from equation (8) must first
be interpolated to 720-point sequences, one value for each degree of crankshaft rotation in the
four-stroke cycle. The first few data points from the open valve sequence correspond to the
values of P1 for the interval IVO-IVC. The corresponding values from the closed valve
sequence are discarded. The remaining values from the closed valve sequence correspond to
the values of P1 for the period when the valve is closed. The pressure in the intake system
will be the composite P1 added to the prevailing static pressure. The final composite curve
will exhibit discontinuities at both IVO and IVC. These are evident by close inspection of the
results presented in this paper as no attempts to smooth the transitions have been made.
M.F. Harrison, A. Dunkley RACING INTAKE SYSTEM ACOUSTICS, Revision 2
19
4 Results and discussion
4.1 Results obtained using the acoustic model
The acoustic model described in Section 3 has been used to calculate the pressure P1 in the
intake port of the racing engine sketched in Figure: 1. This has been done for two engine
speeds. The first at 13,000 revmin-1 corresponds to a speed at which very high volumetric
efficiency is expected, and the second at 7000 revmin-1 is the lowest practical running speed
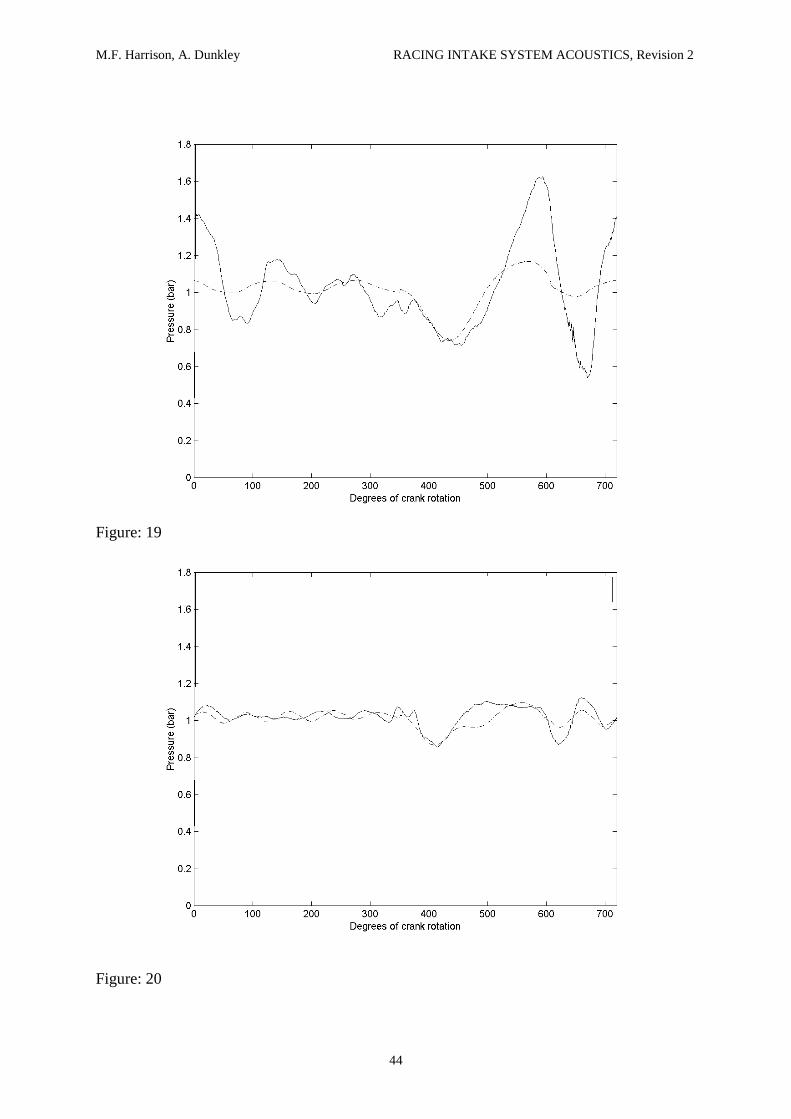
for this engine. The calculated intake port pressure at 13,000 revmin-1 is shown in Figure: 19
along with the measured average pressure record from Figure: 4. There are some important
differences in the results.
Firstly, when the valve is closed, the calculation results show a decaying pressure oscillation
with a frequency of 565Hz for the first cycle of oscillation after IVC. The frequency was
obtained using the method described in Section 2 and is close to both the 5th harmonic of the
cycle frequency at 540 Hz and to the lowest resonant frequency of the intake system at 542
Hz. The frequency for the first cycle of oscillation in the measured data was found to be
600Hz. For the second cycle of oscillation, the calculated frequency is 574 Hz and the
measured frequency is 629 Hz. Therefore, the stretching of the pressure wavelength as the
oscillation decays after IVC first noted in the experimental results is reproduced to some
small degree by the calculation. However, the resonant frequencies shown in the calculated
results are too low. The acoustic length of the intake pipe must be shorter than the 150mm
plus end correction assumed in the modelling (the end correction being 13.8mm at the lowest
Helmholtz number and 10.5mm at the highest).
M.F. Harrison, A. Dunkley RACING INTAKE SYSTEM ACOUSTICS, Revision 2
20
The second difference is that the inertial ram effects suggested in the measured data and
discussed in Section 2 are not included in the calculated results and therefore the calculated
pressure peak just before IVC is lower. The reason for this is straightforward. The acoustic
model calculates the resonant pressure response of the intake system to a volume velocity
excitation and any momentum transfer (the inertial ram effect) from the mean flow is not
included in the model. It seems from the results in Figure: 19 that this momentum transfer has
the effect of adding to the pressure peak just before IVC caused by acoustic resonance
effects. Because the amplitude of the pressure peak just before IVC is lower in the calculated
results, the amplitude of the pressure peaks that follow in the period IVC-IVO are also lower.
Figure: 20 shows a comparison between calculated and measured intake port pressures at
7000 revmin-1. This time the decaying pressure oscillation after IVC in the calculated results
has cycle frequencies of 575 Hz, 538 Hz, 591 Hz, 538 Hz, 575 Hz respectively. These
compare to the frequencies discussed in Section 2 which were 506 Hz, 525 Hz, 552 Hz, (362
Hz – double minimum present), 545 Hz. There is a variation in oscillation frequency in both
cases although the rather unusual 4th oscillation found in the measured results is not replicated
by the calculation and therefore the overall agreement is reduced. The intake behaviour at
low speeds seems to be fairly well modelled and therefore the effect of weak acoustic
resonance seems to dominate the behaviour, in contrast to the strong inertial ram effect
suspected at higher speeds.
4.2 Results that include a simple model of the inertia ram effect
The discussion in Section 4.1 highlights the need to include the inertial ram effect in a
calculation of the high speed inlet flow to a racing engine. Therefore, the acoustic model
M.F. Harrison, A. Dunkley RACING INTAKE SYSTEM ACOUSTICS, Revision 2
21
described in Section 3 has been extended with the simplest possible model of the inertial ram
effect. The momentum Φ of the intake flow is taken to be:
1110ρΦ ulS (9)
where
ρ0 = stagnation density of the inlet air (kgm-3)
S1 = effective cross sectional area of conical of inlet pipe (m2)
l1 = length of inlet pipe (m)
u1 = flow velocity in the intake pipe (ms-1)
1
11 S
)t(U)t(u (10)
The transfer of momentum as the intake flow is brought to rest on the back of the closing
valve causes a rise in pressure PIR due to the inertial ram effect given by
1IR S
1dtd
)t(P φ
(11)
The simplifying assumption made here is that the flow is incompressible, therefore there is a
constant density equal to ρ0 down the length of the intake pipe. The dominant pressure
fluctuation occurs at around 600 Hz and therefore the length of the 150mm intake pipe is
around ¼ of the dominant wavelength. This is too high a proportion of one wavelength to
support the simplifying assumption, but because of its ease of use it will be retained until a
better alternative is developed.
M.F. Harrison, A. Dunkley RACING INTAKE SYSTEM ACOUSTICS, Revision 2
22
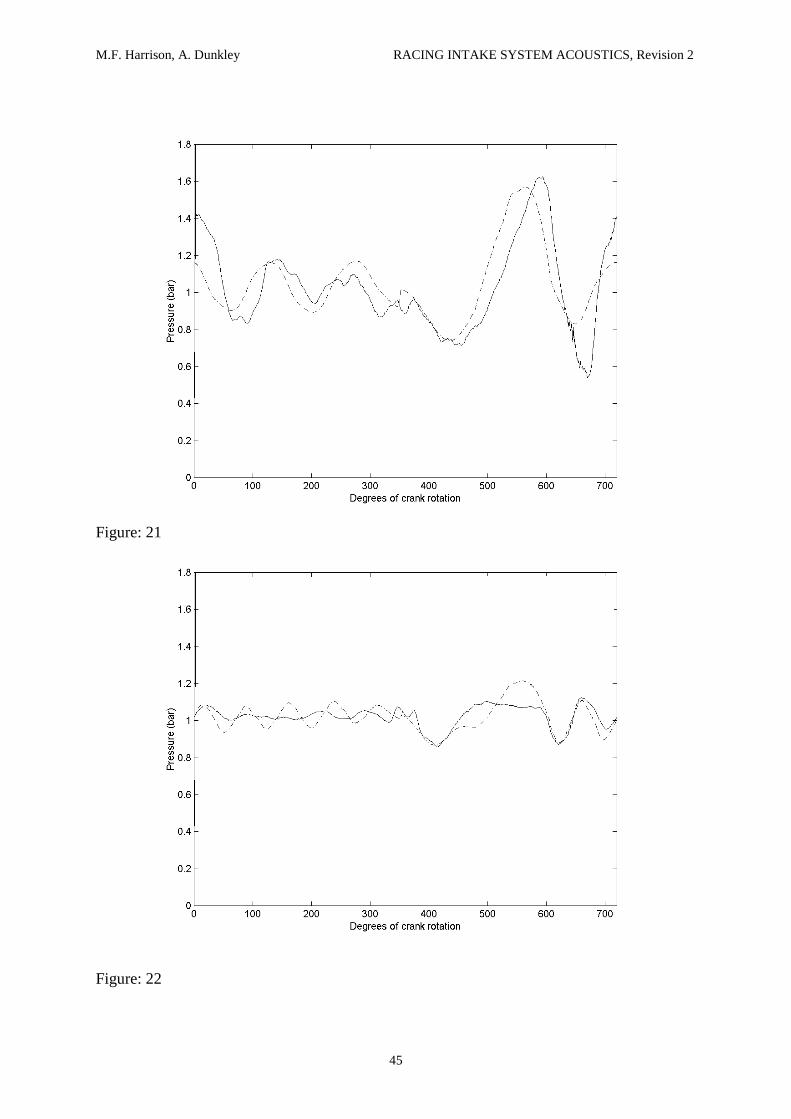
Figure: 21 shows the results of the extended calculation method at 13,000 revmin-1. The
inertial ram effect has been included only for the portion of the period IVO-IVC where the
valve is closing. In addition, the results in the period IVC-IVO have been scaled by the factor
IVCIVOmax1
IVCIVOmaxIRmax1
P
PPfactor
(12)
to reflect the increased pressure pulse around IVC that immediately precedes the period IVC-
IVO. The agreement between calculated and measured results is much better for the extended
model than was obtained using the acoustic model described in Section 3. The need to
include even the simplest model of the inertial ram effect at high engine speeds such as this
one is clear.
Figure: 22 shows the results obtained from the extended model at 7000 revmin-1. The added
inertial ram effects are clearly too strong in this low speed case. Unfortunately, there is no
means at present of predicting the onset of the inertial ram effect with increasing speed. A
simple rule of including inertial ram effects at speeds above say 2/3 of the rated engine speed
might prove acceptable in practice but there is no physical justification for this.
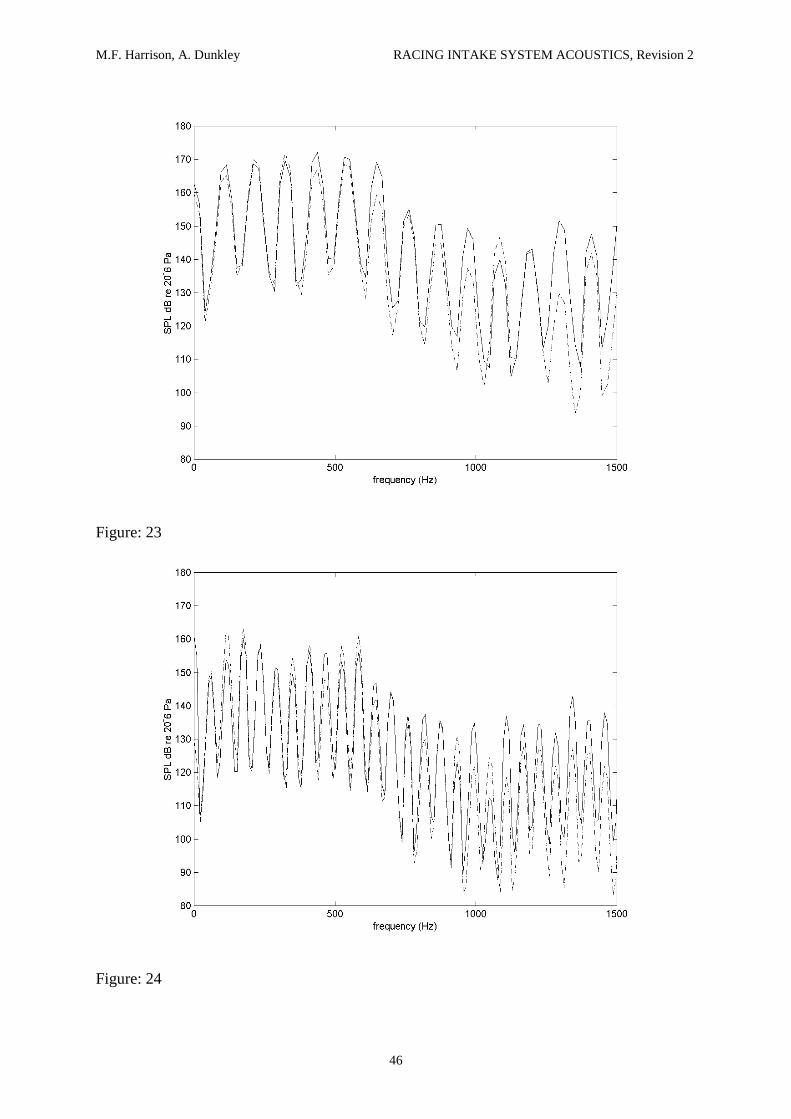
An alternative form of validation of the extended calculations is offered. The spectra of
calculated and measured intake port pressures are compared in Figures: 23, 24. These spectra
have been produced by repeating the single cycle data from Figures: 21, 22 many times to
form long data sequences. By using a moving Hanning window to produce averages of many
4096 point FFTs the spectra shown in Figures: 23, 24 were produced with a spectral
resolution of 19 Hz and 10 Hz respectively due to the sample frequency being 78 kHz and 42
M.F. Harrison, A. Dunkley RACING INTAKE SYSTEM ACOUSTICS, Revision 2
23
kHz respectively. In both speed cases, the calculated sound pressure level is within 5 dB of
the measured value for the majority of the first ten harmonics of the cycle frequency.
The agreement between measured and the calculated results is fair. Any lack of agreement
might be due to: oversimplification of the acoustic model where wide-angle cones were
modelled as straight pipes of the same length, oversimplification of the effects of un-steady
flow modelled as an equivalent mean flow, the use of a reflective boundary at the open end
which has not been validated at high Mach numbers and with high sound levels,
oversimplified modelling of the inertial ram effects, or the effects of flow induced noise.
A comment is offered on the usefulness of the extended acoustic model presented here. It is
fair to say that a time domain solution to the equations of fluid motion offers the best way to
calculate both acoustic resonance and inertial ram effects together. The use of such approach
has been discussed in the introduction to this paper and some validation of the results is
offered there. However, it is impossible to distinguish between the acoustic resonance effects
and the inertial ram effects with such an approach, whereas the extended acoustic model does
allow that distinction, albeit in a rather simplified form.
M.F. Harrison, A. Dunkley RACING INTAKE SYSTEM ACOUSTICS, Revision 2
24
4.3 A case study: the influence of the intake plenum
To illustrate how the extended linear acoustic model might be used to better understand the
intake wave action in a racing engine, a case study is offered where the decoupling effect of
the plenum used in the intake of the single cylinder engine sketched in Figure: 1 is assessed.
The acoustic characteristics of the simplified model of the single cylinder intake system
shown in Figure: 3 can be described thus.
The maximum attenuation of the sound wave emanating from the intake valve is due to the
plenum is given by:
Attenuation = 20 log10
2
1
pp
≈ 20 log101
2
SS
= 12 dB (13)
This will only be obtained at frequencies away from resonance in the plenum. Assuming a
parallel-piped plenum, these resonant frequencies can be estimated from:
xnc
f2
n = 1, 2, 3… (14)
x = 0.41 m
c = 343 m/s
f1 = 418 Hz f2 = 836 Hz f3 = 1672 Hz
The attenuation of the plenum at these resonant frequencies will tend to zero dB.
M.F. Harrison, A. Dunkley RACING INTAKE SYSTEM ACOUSTICS, Revision 2
25
The intake wave action is expected at a frequency that is near to the lowest resonant
frequency of the short intake pipe, given by [9]:
xnc
f4
n = 1, 3, 5… (15)
x = 0.15m
c = 343 m/s
f1 = 572 Hz f2 = 1716 Hz
The resonant frequency of 572Hz is neatly between the two lowest resonant frequencies of
the plenum (418 Hz and 836 Hz) and so the attenuation of the plenum should be near 12dB at
572 Hz. Therefore, the plenum ought to decouple the wave action in the short intake pipe
from the wave action in the rest of the intake system. If the short intake pipe had been any
longer (say 200mm) then the two resonant frequencies would have coincided and the
decoupling would be expected to be poor.
This simple analysis suggests that the plenum will decouple the intake pipe from the rest of
the intake system when a 410mm long, 300mm diameter plenum is used with a 150mm long,
50mm diameter intake pipe. Thus, any differences in the indicated mean effective pressures
measured on the single cylinder engine and on the V10 ought not to be due to differences in
intake wave action, but perhaps differences in exhaust wave action.
However, this simple analysis is not completely reliable as it is hard to judge exactly which
frequency components will dominate the wave action in the intake system.
M.F. Harrison, A. Dunkley RACING INTAKE SYSTEM ACOUSTICS, Revision 2
26
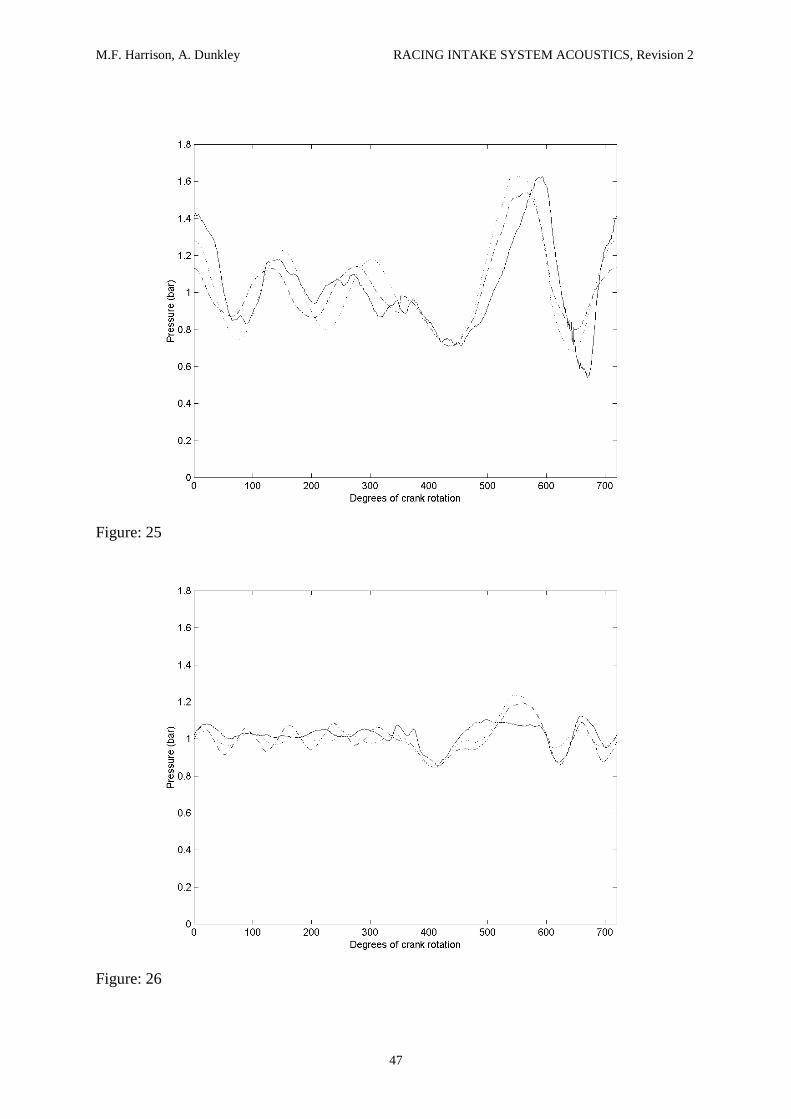
The acoustic model can be used to assess the effect of the plenum directly. Figures: 25, 26
show a comparison of calculated results where the whole intake system has been modelled
and other results where only the 150mm intake pipe has been modelled. The fact that there
are only slight differences between the two sets of results suggests that the decoupling
achieved by the 30 litre plenum is strong but not perfect. Therefore, there may be slight
variations in the intake behaviour of the single cylinder engine when compared with V10
engines either on the dynamometer or installed in the car, assuming that the decoupling
provided by the 30 litre V10 airbox is equally strong. These variations will only be small and
will only be responsible for minor differences in indicated mean effective pressure. Any
significant differences in engine performance are likely to be due to some other factor such as
differences in the exhaust action.
M.F. Harrison, A. Dunkley RACING INTAKE SYSTEM ACOUSTICS, Revision 2
27
5 Conclusions
An investigation into the intake process on a single cylinder racing engine has shown that
inertial ram effects make a strong contribution to the intake process at high engine speeds
whereas acoustic resonance effects are more important to the rather weak wave action that
occurs at low engine speeds.
An acoustic model of the acoustic resonance effect has proved useful in distinguishing
between these two mechanisms. A simple model of the inertial ram effect has also proved
useful.
A decoupled hybrid method has been shown to yield calculations of the wave dynamics in the
intake system of a single cylinder racing engine that show at least fair agreement with
measured results up to the 10th harmonic of the engine cycle frequency.
The intake characteristics of a single cylinder racing engine have been shown to be only
slightly different from those expected from a V10 engine due to the decoupling effects of the
plenum fitted to the intake of the single cylinder engine and the airbox fitted to the V10.
Acknowledgements
The authors thank Ilmor Racing Engines for their permission to publish the second author’s
measured data in this paper.
The first author gratefully acknowledges the support of EPSRC for the theoretical aspects of
this work made possible under grant No: GR/R04324.
M.F. Harrison, A. Dunkley RACING INTAKE SYSTEM ACOUSTICS, Revision 2
28
References
1 D.E. Winterbone & R.J. Pearson, 2000, Professional Engineering Publishing Ltd,
London, Theory of engine manifold design: wave action methods for IC engines.
2 X. F. Ferlet, 1995, PhD Thesis, University of Manchester, Institute of Science and
Technology, Computer simulation of combustion and gas dynamics in racing engines.
3 Alex Dunkley, 2000, MSc Thesis, Cranfield University, The acoustics of IC engine
manifolds.
4 D. Cottyn, 2002, MSc Thesis, Cranfield University, Concept design of a single
cylinder F1 research engine
5 E.S. Dennison, 1933, Trans. ASME Oil Gas and Power, Vol55, pp53-64, Inertia
supercharging of engine cylinders.
6 A. Capetti, February 1929, NACA TM 501, Effects of intake pipe on the volumetric
efficiency of an internal combustion engine (translation).
7 C.F. Taylor, J.C. Livengood, D.H. Tsai, 1955, Trans. ASME, Vol 77, 1133-1145,
Dynamics in the inlet system of a four-stroke single cylinder engine
8 P. Giannattasio, A. Dadone, 1991, IMEchE International Conference on Computers in
Engine Technology, Cambridge England, pp119-126, Applications of a high
resolution shock-capturing scheme to the unsteady flow computation in engine ducts.
M.F. Harrison, A. Dunkley RACING INTAKE SYSTEM ACOUSTICS, Revision 2
29
9 M.F. Harrison, P.T. Stanev, 2003, J. Sound Vib. (in press), A linear acoustic model
for intake wave dynamics in I.C. engines.
10 A.D. Jones, 1984, Noise Control Engineering, 23(1), 12-31, Modelling the exhaust
noise radiated from reciprocating internal combustion engines – a literature review.
11 P.O.A.L. Davies & M.F. Harrison, 1997, Journal of Sound and Vibration, 202(2),
249-274, Predictive acoustic modelling applied to the control of intake/exhaust noise
of internal combustion engines
12 W.M. Wang, 1967, Journal of the Acoustical Society of America, Vol. 42, No 6,
p1244-1249, Acoustical analysis of a multi-cylinder engine air-induction system
13 L. Desmons & J. Kergomard, 1994, Applied Acoustics, Vol. 41, p127-155, Simple
analysis of exhaust noise produced by a four cylinder engine
14 M.R. Driels, 1975, Journal of Sound and Vibration, 43(3), p499-510, Dynamics of IC
engine induction systems
15 F. Payri, J.M. Desantes & A.J. Torregrosa, 1995, Journal of Sound and Vibration,
188(1), p85-110, Acoustic boundary conditions for unsteady one-dimensional flow
calculations
16 J.M. Desantes, A.J. Torregrosa & A. Broatch, 1995, SAE Paper No 950575, Hybrid
linear/non-linear method for exhaust noise prediction
M.F. Harrison, A. Dunkley RACING INTAKE SYSTEM ACOUSTICS, Revision 2
30
17 Y. Sathyanarayana & M.L. Munjal, 2000, Applied Acoustics 60, p425-450, A hybrid
approach for aeroacoustic analysis of the engine exhaust system
18 F. Albertson & J. Gilbert, 2000, Seventh International Congress on Sound and
Vibration, 4-7 July 2000, p1725-1732, The acoustic balance method for predicting the
sound from a piston-restriction system
19 F. Albertson & J. Gilbert, 2001, Journal of Sound and Vibration, 241(4), p541-565,
Harmonic balance method used for calculating the steady-state oscillations of a
simple one-cylinder cold engine
20 M.F. Harrison, P.T. Stanev, 2003, J. Sound Vib. (in press), Measuring wave dynamics
in I.C. engine intake systems.
21 T.C. Tsu, 1947, NACA TN 1446, Theory of the inlet and exhaust processes of
internal combustion engines.
22 P O A L Davies, 1998, Journal of Sound and Vibration, 124(1), pp91-115
Practical flow duct acoustics
M.F. Harrison, A. Dunkley RACING INTAKE SYSTEM ACOUSTICS, Revision 2
31
Figure labels
Figure: 1 Layout of the single cylinder Formula 1 intake system.
Figure: 2 Measured intake pressure (solid line) in the port of a single cylinder Formula 1
engine at 10,000 revmin-1 versus engine simulation results modelling the full
intake system (dashed line) and just the intake port (dotted line).
Figure: 3 Simplified geometry of the full intake system to the single cylinder Formula 1
engine used for acoustic modelling.
Figure: 4 Single cylinder Formula 1 engine. Measured intake port pressure – 13,000
revmin-1, wide open throttle.
Figure: 5 Single cylinder Formula 1 engine. Measured intake port pressures – 7000
revmin-1 wide open throttle.
Figure: 6 Intake pressure record: low speed single cylinder engine with a long (1.4m)
straight pipe intake system. 1000 revmin-1 wide open throttle.
Figure: 7 Single cylinder Formula 1 engine. Measured intake port pressure spectrum –
13,000 revmin-1 wide open throttle.
Figure: 8 Single cylinder Formula 1 engine. Measured intake port pressure spectrum –
7000 revmin-1 wide open throttle.
M.F. Harrison, A. Dunkley RACING INTAKE SYSTEM ACOUSTICS, Revision 2
32
Figure: 9 Equivalent acoustic circuit for the intake process.
Figure: 10 Intake geometry and the physical location of the load impedance Z1 and the
source impedance Ze.
Figure: 11 Single cylinder Formula 1 engine. Calculated volume flow rate, 13,000
revmin-1 wide open throttle.
Figure 12 Single cylinder Formula 1 engine. Calculated and measured volume flow
rates, 13,000 revmin-1 wide open throttle. Measured (solid line), calculated
from equation (6) (chain dotted line), calculated by scaling the open area
under the lifting valve (dashed line).
Figure 13 Single cylinder Formula 1 engine. Calculated and measured volume flow
rates, 7,000 revmin-1 wide open throttle. Measured (solid line), calculated from
equation (6) (chain dotted line), calculated by scaling the open area under the
lifting valve (dashed line).
Figure: 14 Single cylinder Formula 1 engine. Measured intake port (solid line) and
cylinder (chain dotted line) pressures, 13000 revmin-1 wide open throttle.
Figure: 15 Single cylinder Formula 1 engine. Measured intake port (solid line) and
cylinder (chain dotted line) pressures, 7000 revmin-1 wide open throttle.
M.F. Harrison, A. Dunkley RACING INTAKE SYSTEM ACOUSTICS, Revision 2
33
Figure: 16 Single cylinder Formula 1 engine. Spectrum of the estimated volume velocity
in the intake port, 13,000 revmin-1 wide open throttle.
Figure: 17 Single cylinder Formula 1 engine. Calculated specific acoustic impedance
ratio for the full intake system, 13,000 revmin-1 wide open throttle. Open
intake valve (solid line), closed intake valve (chain dotted line).
Figure: 18 Single cylinder Formula 1 engine. Calculated fluctuations in intake port
pressure, 13,000 revmin-1 wide open throttle. Open intake valve (solid line),
closed intake valve (chain dotted line).
Figure: 19 Single cylinder Formula 1 engine. Measured (solid line) and calculated (chain
dotted line) intake port pressures, 13,000 revmin-1 wide open throttle.
Figure: 20 Single cylinder Formula 1 engine. Measured (solid line) and calculated (chain
dotted line) intake port pressures, 7000 revmin-1 wide open throttle.
Figure: 21 Single cylinder Formula 1 engine. Measured (solid line) and calculated (chain
dotted line) intake port pressures, 13,000 revmin-1 wide open throttle,
including a model for inertial ram effects.
Figure: 22 Single cylinder Formula 1 engine. Measured (solid line) and calculated (chain
dotted line) intake port pressures, 7000 revmin-1 wide open throttle, including
a model for inertial ram effects.
M.F. Harrison, A. Dunkley RACING INTAKE SYSTEM ACOUSTICS, Revision 2
34
Figure: 23 Single cylinder Formula 1 engine. Measured (solid line) and calculated (chain
dotted line) intake port pressure spectra, 13,000 revmin-1 wide open throttle,
including a model for inertial ram effects.
Figure: 24 Single cylinder Formula 1 engine. Measured (solid line) and calculated (chain
dotted line) intake port pressure spectra, 7,000 revmin-1 wide open throttle,
including a model for inertial ram effects.
Figure: 25 Single cylinder Formula 1 engine. Measured (solid line) and calculated intake
port pressures, 13,000 revmin-1 wide open throttle. Calculated results are for
models that include the full intake system (chain dotted line) and models that
only consider the 150mm long intake pipe / port (dashed line). Both sets of
calculated results include a model for inertial ram effects.
Figure: 26 Single cylinder Formula 1 engine. Measured (solid line) and calculated intake
port pressures, 13,000 revmin-1 wide open throttle. Calculated results are for
models that include the full intake system (chain dotted line) and models that
only consider the 150mm long intake pipe / port (dashed line). Both sets of
calculated results include a model for inertial ram effects.
M.F. Harrison, A. Dunkley RACING INTAKE SYSTEM ACOUSTICS, Revision 2
35
Harrison, Dunkley – Figures
Figure: 1
Figure: 2
Air from air-conditioningunit
M.F. Harrison, A. Dunkley RACING INTAKE SYSTEM ACOUSTICS, Revision 2
36
Figure: 3
Figure: 4
410 mm 570 mm150 mm
50 mm dia. 300 mm dia. 150 mm dia.
1P
1P
2P
3P
3P2P
Air flow4P
4P
M.F. Harrison, A. Dunkley RACING INTAKE SYSTEM ACOUSTICS, Revision 2
37
Figure: 5
Figure: 6
M.F. Harrison, A. Dunkley RACING INTAKE SYSTEM ACOUSTICS, Revision 2
38
Figure: 7
Figure: 8
M.F. Harrison, A. Dunkley RACING INTAKE SYSTEM ACOUSTICS, Revision 2
39
Figure: 9
Figure: 10
Z1
Ze
VS Ze Z1 P1
U1UeUS
M.F. Harrison, A. Dunkley RACING INTAKE SYSTEM ACOUSTICS, Revision 2
40
Figure: 11
Figure 12
M.F. Harrison, A. Dunkley RACING INTAKE SYSTEM ACOUSTICS, Revision 2
41
Figure 13
Figure: 14
M.F. Harrison, A. Dunkley RACING INTAKE SYSTEM ACOUSTICS, Revision 2
42
Figure: 15
Figure: 16
M.F. Harrison, A. Dunkley RACING INTAKE SYSTEM ACOUSTICS, Revision 2
43
Figure: 17
Figure: 18
M.F. Harrison, A. Dunkley RACING INTAKE SYSTEM ACOUSTICS, Revision 2
44
Figure: 19
Figure: 20
M.F. Harrison, A. Dunkley RACING INTAKE SYSTEM ACOUSTICS, Revision 2
45
Figure: 21
Figure: 22
M.F. Harrison, A. Dunkley RACING INTAKE SYSTEM ACOUSTICS, Revision 2
46
Figure: 23
Figure: 24
M.F. Harrison, A. Dunkley RACING INTAKE SYSTEM ACOUSTICS, Revision 2
47
Figure: 25
Figure: 26