Embed Size (px)
Citation preview
The A/C Tune-up:
How to Evaluate and Optimize Peak
Performance
Jim Bergmann
&
Bill Spohn
TruTech Tools

• Experienced professionals delivering
CEU training to the HVAC and related
trades
• 45+ years combined experience
• Practical, related and hands-on training
• Earn while you Learn
– BPI Recognized CEUs
“Quality comes not from inspection
but from improvement of the process.”
W. Edwards Deming
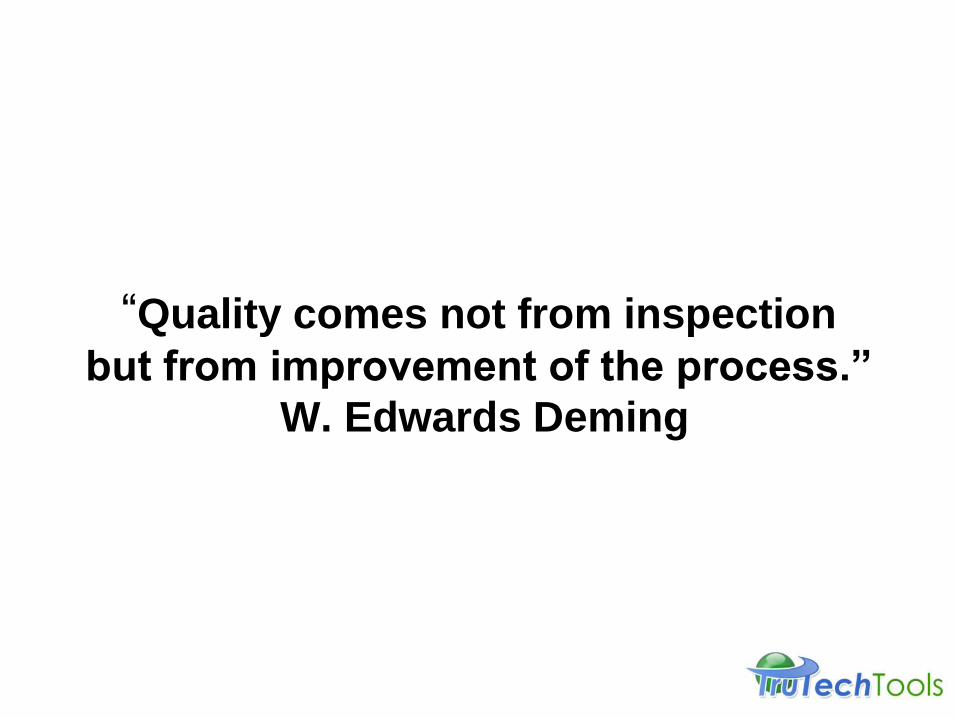
There are no theories in HVAC/R!
• Air conditioning founded on scientific facts – Repeatable
– Universal
– Well proven
– Understandable
– Provable
– And you can do it!
• Measurements are made to prove facts!
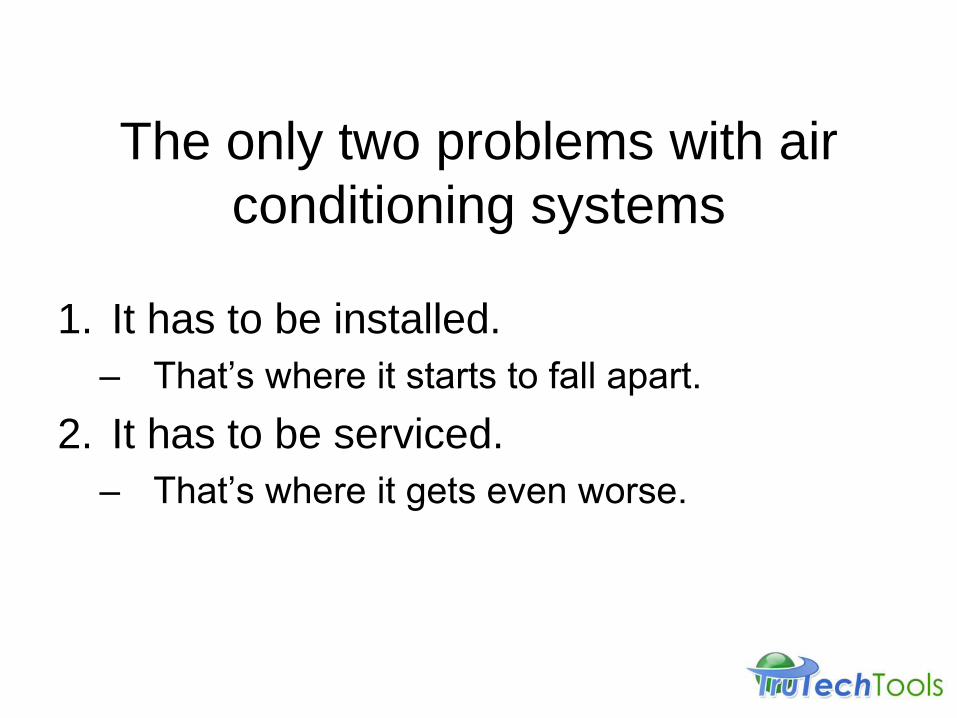
The only two problems with air
conditioning systems
1. It has to be installed.
– That’s where it starts to fall apart.
2. It has to be serviced.
– That’s where it gets even worse.
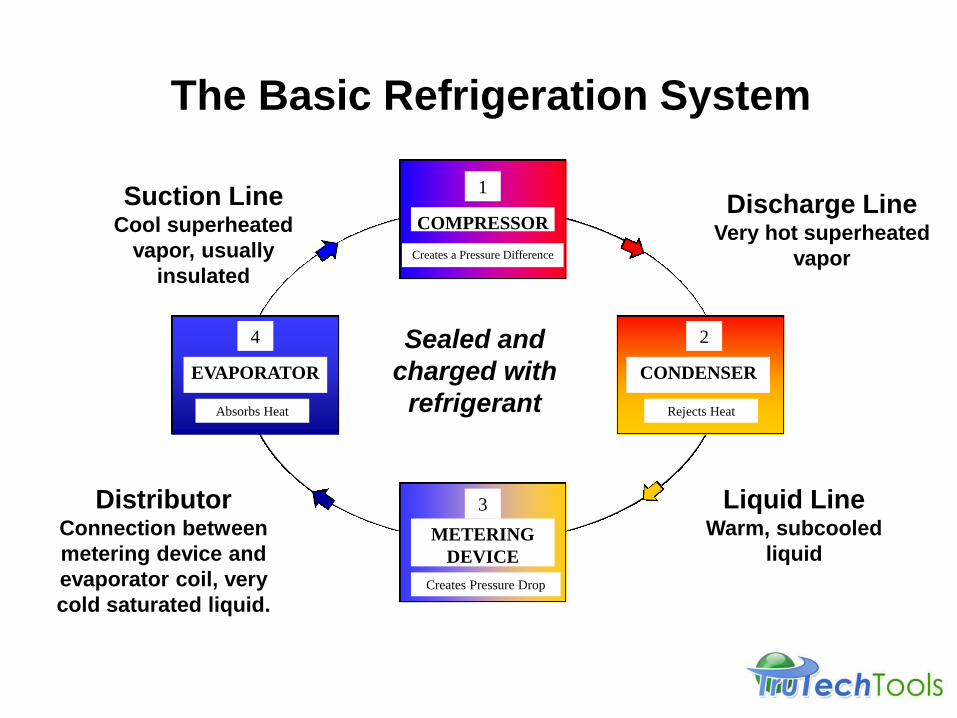
EVAPORATOR
4
Absorbs Heat
CONDENSER
2
Rejects Heat
METERING
DEVICE
3
Creates Pressure Drop
COMPRESSOR
1
Creates a Pressure Difference
The Basic Refrigeration System
Suction Line
Cool superheated
vapor, usually
insulated
Discharge Line Very hot superheated
vapor
Liquid Line Warm, subcooled
liquid
Distributor Connection between
metering device and
evaporator coil, very
cold saturated liquid.
Sealed and
charged with
refrigerant
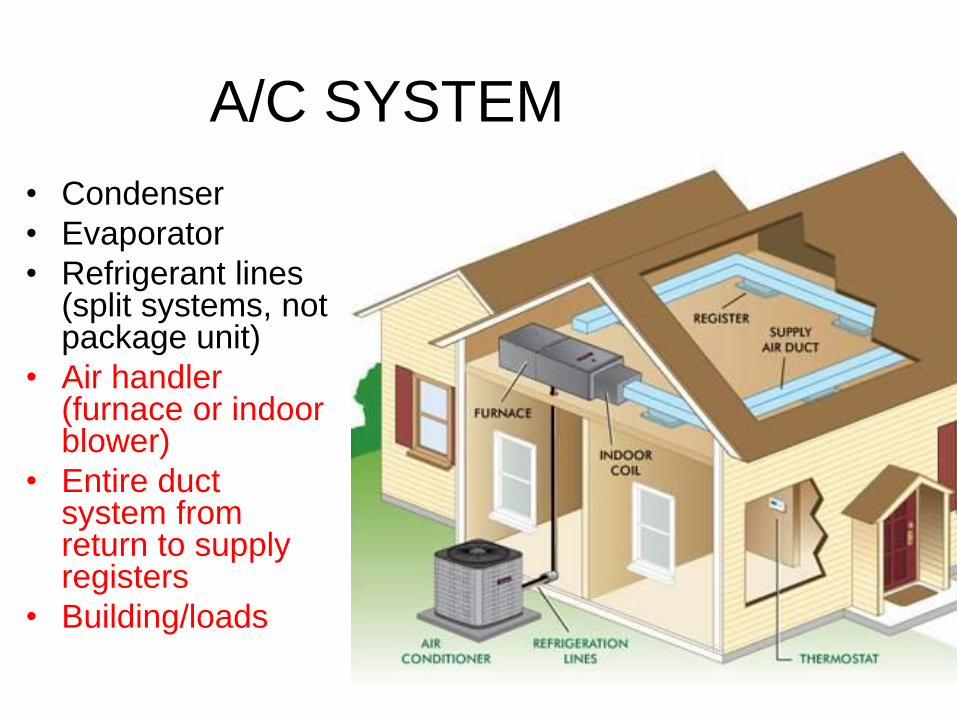
A/C SYSTEM
• Condenser
• Evaporator
• Refrigerant lines (split systems, not package unit)
• Air handler (furnace or indoor blower)
• Entire duct system from return to supply registers
• Building/loads
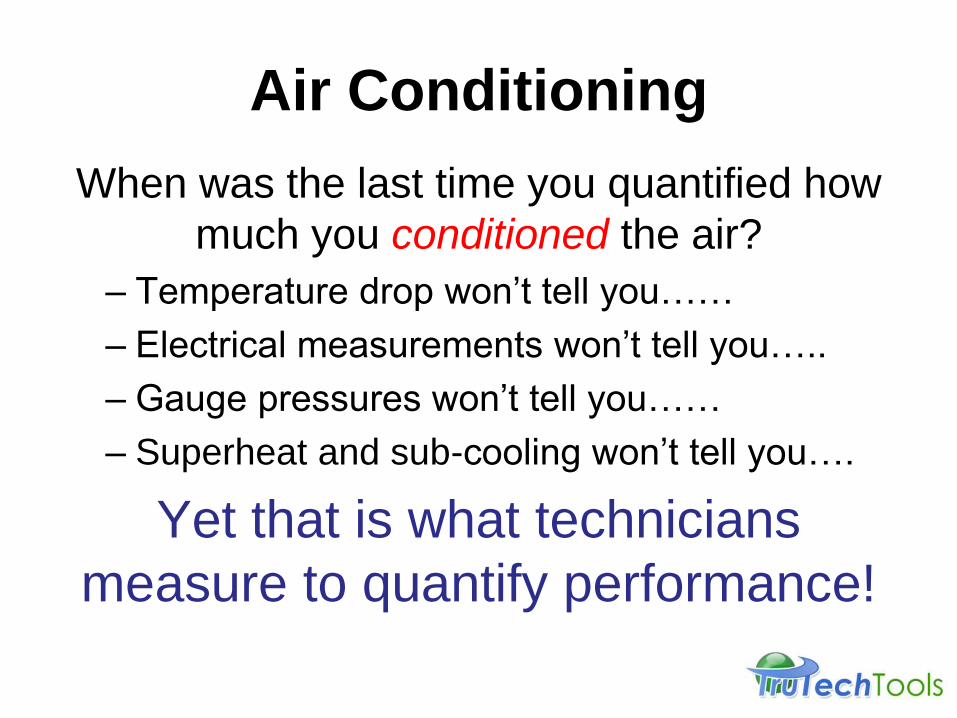
Air Conditioning
When was the last time you quantified how
much you conditioned the air?
– Temperature drop won’t tell you……
– Electrical measurements won’t tell you…..
– Gauge pressures won’t tell you……
– Superheat and sub-cooling won’t tell you….
Yet that is what technicians
measure to quantify performance!
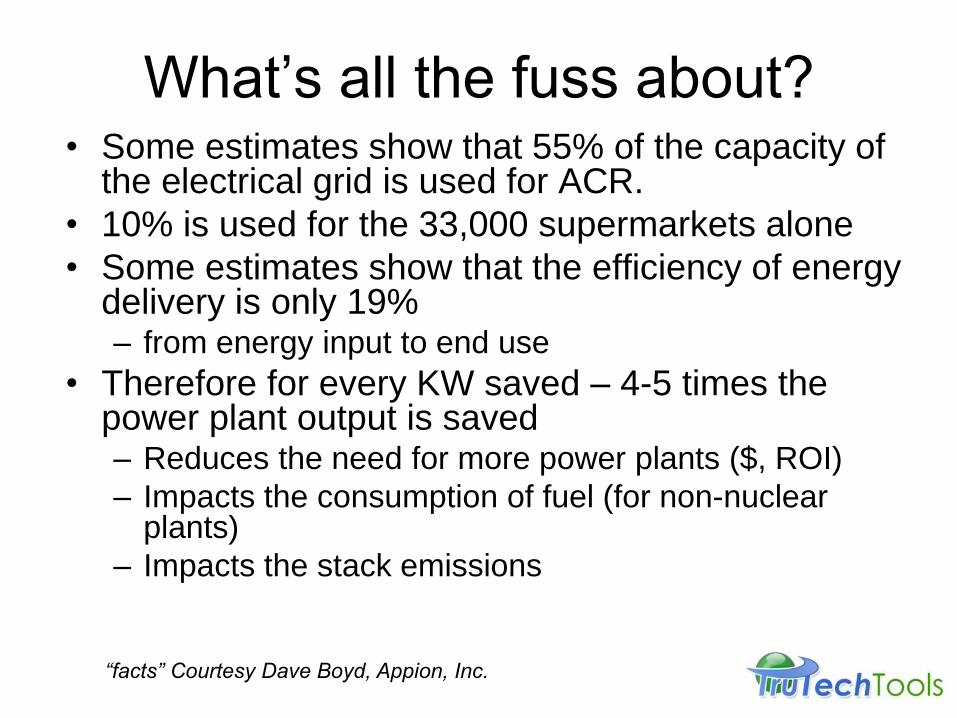
What’s all the fuss about? • Some estimates show that 55% of the capacity of
the electrical grid is used for ACR.
• 10% is used for the 33,000 supermarkets alone
• Some estimates show that the efficiency of energy delivery is only 19% – from energy input to end use
• Therefore for every KW saved – 4-5 times the power plant output is saved – Reduces the need for more power plants ($, ROI)
– Impacts the consumption of fuel (for non-nuclear plants)
– Impacts the stack emissions
“facts” Courtesy Dave Boyd, Appion, Inc.
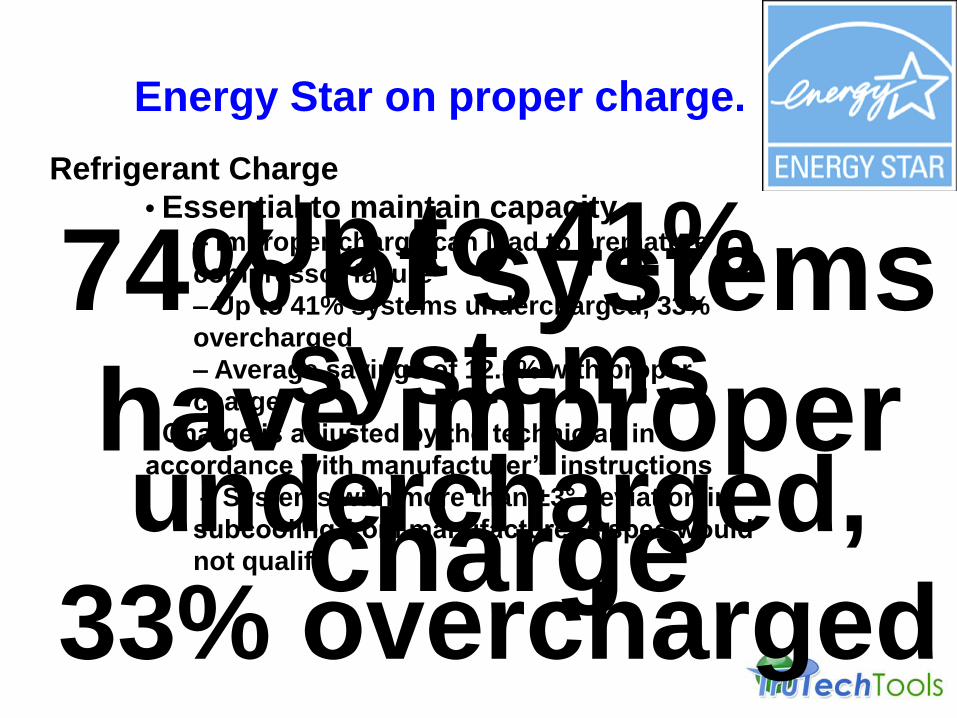
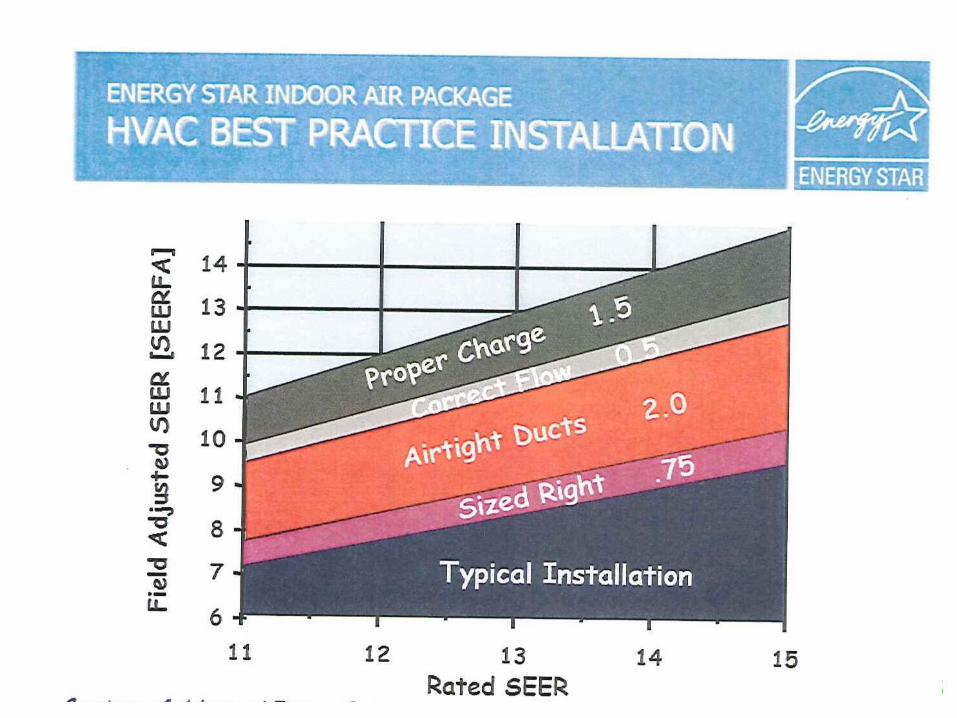
Refrigerant Charge
• Essential to maintain capacity – Improper charge can lead to premature
compressor failure
– Up to 41% systems undercharged, 33%
overcharged
– Average savings of 12.5% with proper
charge
• Charge is adjusted by the technician in
accordance with manufacturer’s instructions
– Systems with more than ±3° deviation in
subcooling from manufacturer’s spec would
not qualify
Energy Star on proper charge.
Up to 41%
systems
undercharged,
33% overcharged
74% of systems
have improper
charge
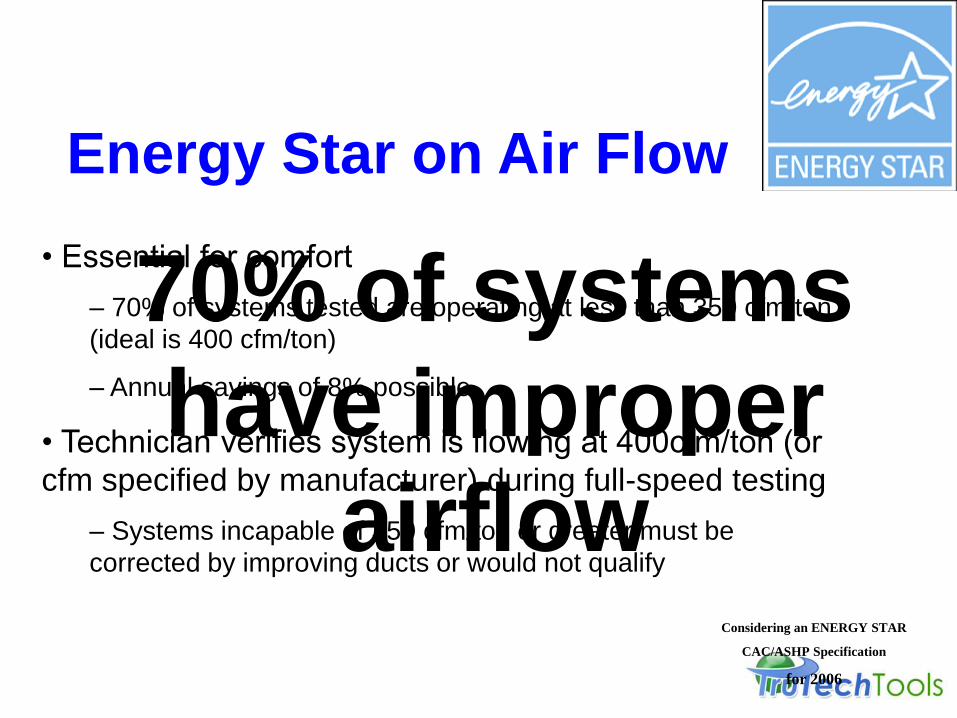
Energy Star on Air Flow
• Essential for comfort
– 70% of systems tested are operating at less than 350 cfm/ton
(ideal is 400 cfm/ton)
– Annual savings of 8% possible
• Technician verifies system is flowing at 400cfm/ton (or
cfm specified by manufacturer) during full-speed testing
– Systems incapable of 350 cfm/ton or greater must be
corrected by improving ducts or would not qualify
Considering an ENERGY STAR
CAC/ASHP Specification
for 2006
70% of systems
have improper
airflow
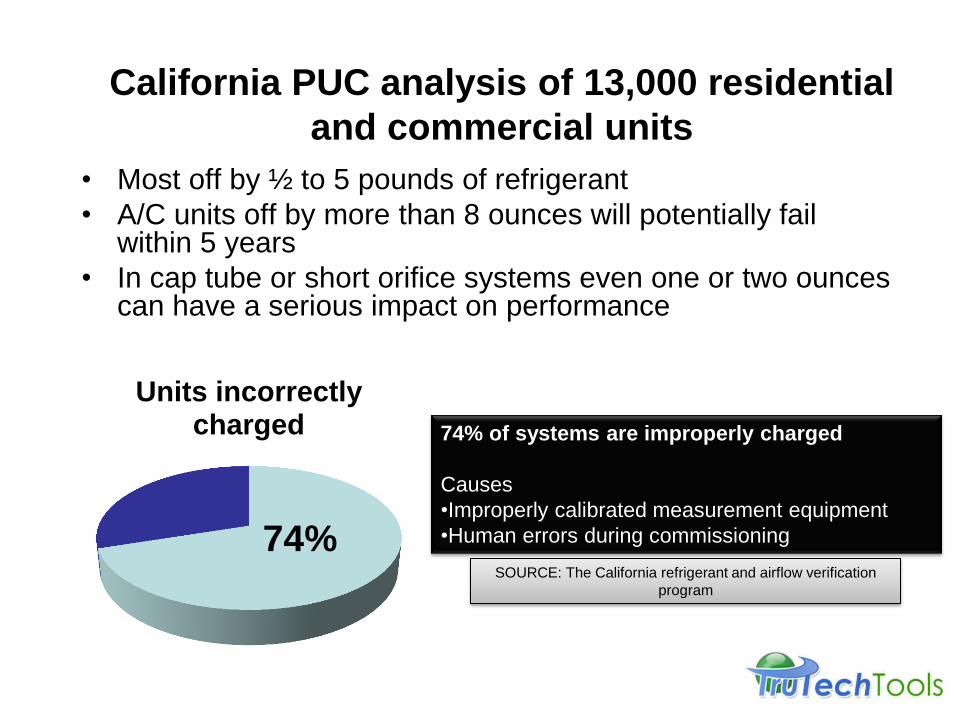
California PUC analysis of 13,000 residential
and commercial units
• Most off by ½ to 5 pounds of refrigerant
• A/C units off by more than 8 ounces will potentially fail within 5 years
• In cap tube or short orifice systems even one or two ounces can have a serious impact on performance
Units incorrectly
charged
74%
74% of systems are improperly charged
Causes
•Improperly calibrated measurement equipment
•Human errors during commissioning
SOURCE: The California refrigerant and airflow verification
program
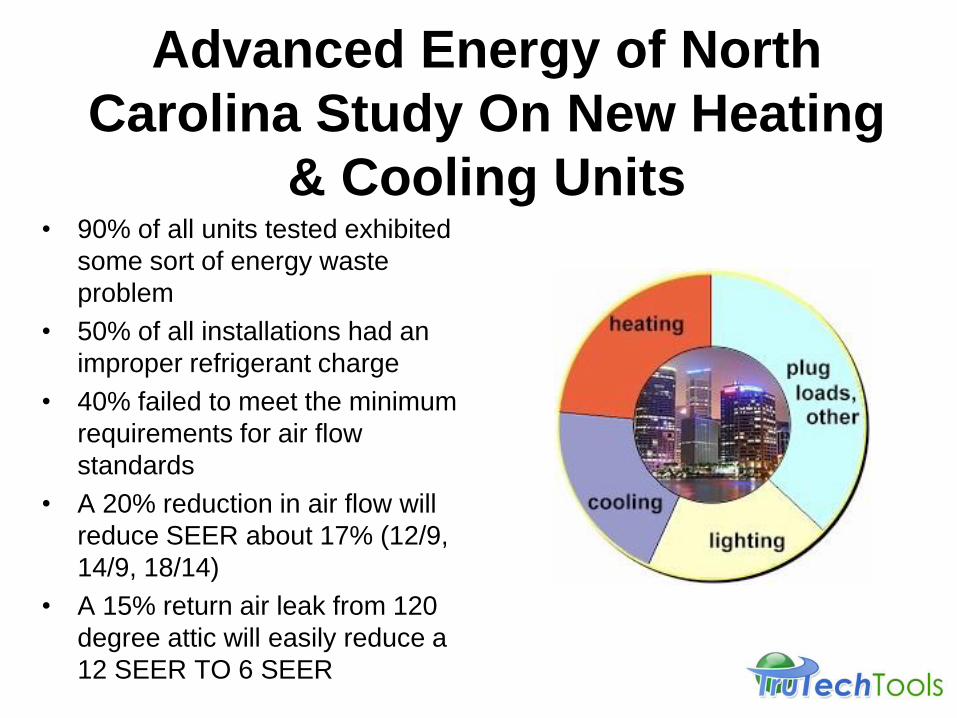
Advanced Energy of North
Carolina Study On New Heating
& Cooling Units
• 90% of all units tested exhibited
some sort of energy waste
problem
• 50% of all installations had an
improper refrigerant charge
• 40% failed to meet the minimum
requirements for air flow
standards
• A 20% reduction in air flow will
reduce SEER about 17% (12/9,
14/9, 18/14)
• A 15% return air leak from 120
degree attic will easily reduce a
12 SEER TO 6 SEER
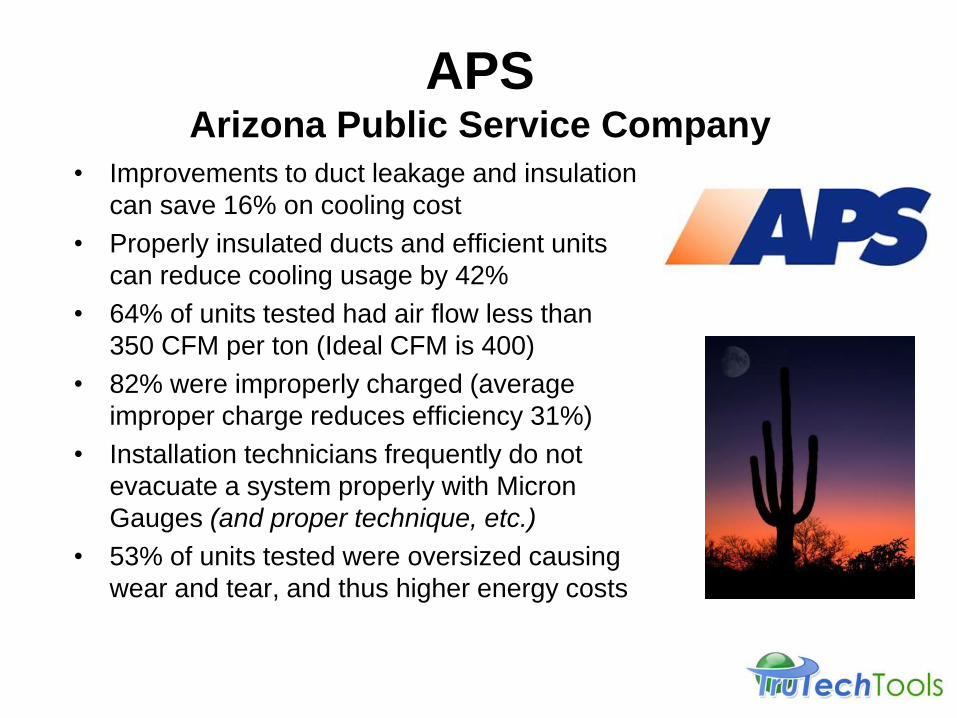
APS Arizona Public Service Company
• Improvements to duct leakage and insulation
can save 16% on cooling cost
• Properly insulated ducts and efficient units
can reduce cooling usage by 42%
• 64% of units tested had air flow less than
350 CFM per ton (Ideal CFM is 400)
• 82% were improperly charged (average
improper charge reduces efficiency 31%)
• Installation technicians frequently do not
evacuate a system properly with Micron
Gauges (and proper technique, etc.)
• 53% of units tested were oversized causing
wear and tear, and thus higher energy costs

WHY????
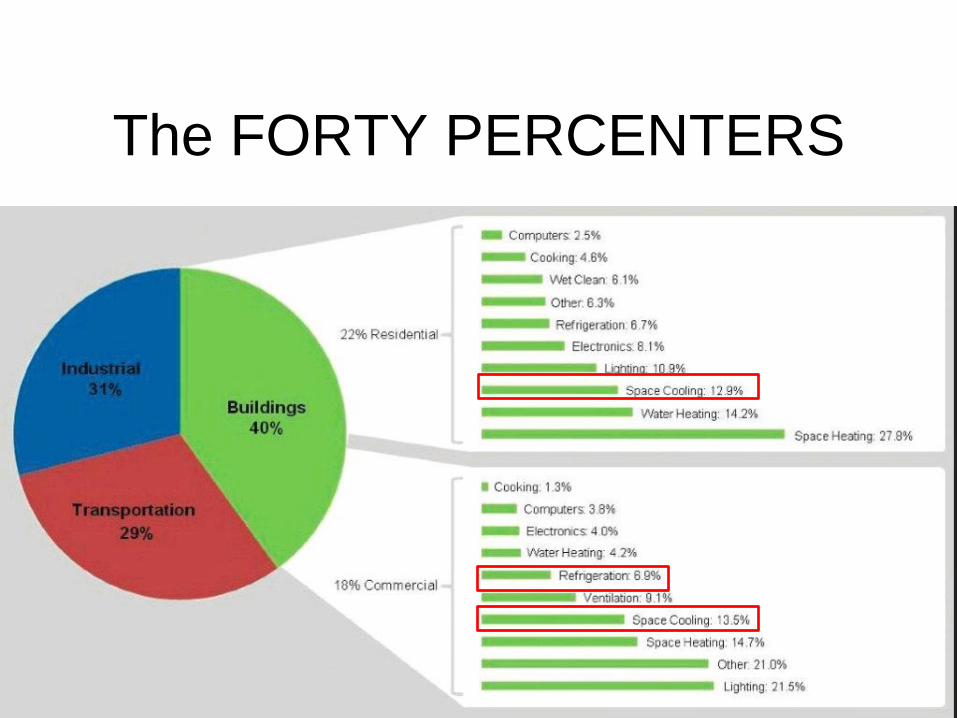
The FORTY PERCENTERS
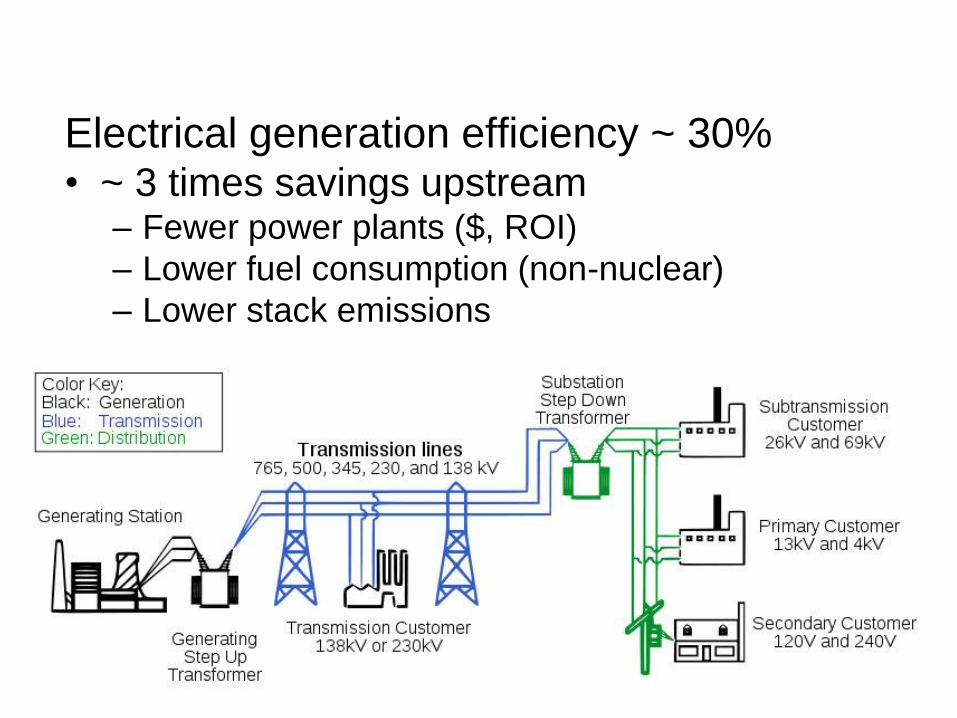
Electrical generation efficiency ~ 30% • ~ 3 times savings upstream
– Fewer power plants ($, ROI)
– Lower fuel consumption (non-nuclear)
– Lower stack emissions
Why are utilities interested in AC?
• Why are utilities interested in this?
– Demand side reduction for peak load times
– Increasing customer satisfaction
– PUCs are forcing the hands of utilities
• Benefits to peak load reduction:
– if all A/Cs are running due to weather
– fewer are running simultaneously since individual A/C system operations & delivery are more efficient and matched to load
– This helps to “shave the peaks”
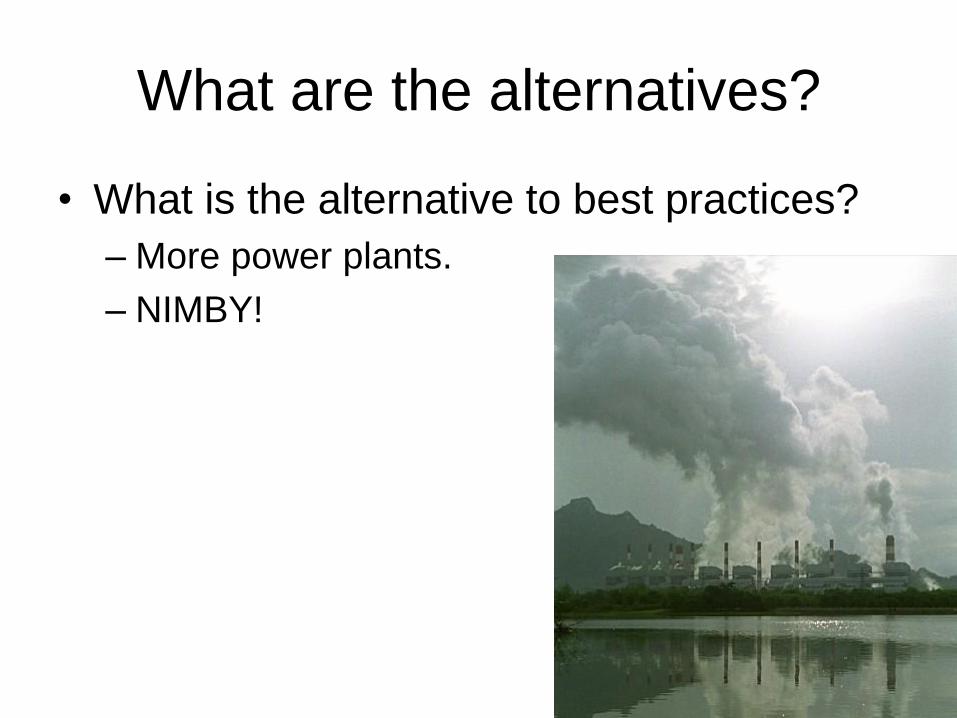
What are the alternatives?
• What is the alternative to best practices?
– More power plants.
– NIMBY!
The Status Quo, Rights and
Wrongs
• Historically measurements were not made due to expense and time
• Also, until the last 5 years, good measurements were hard to make, usually done in lab
• Bad measurements were made and did not yield results and measurements were abandoned
• A resurgence of good measurements, now in the field, is under way!
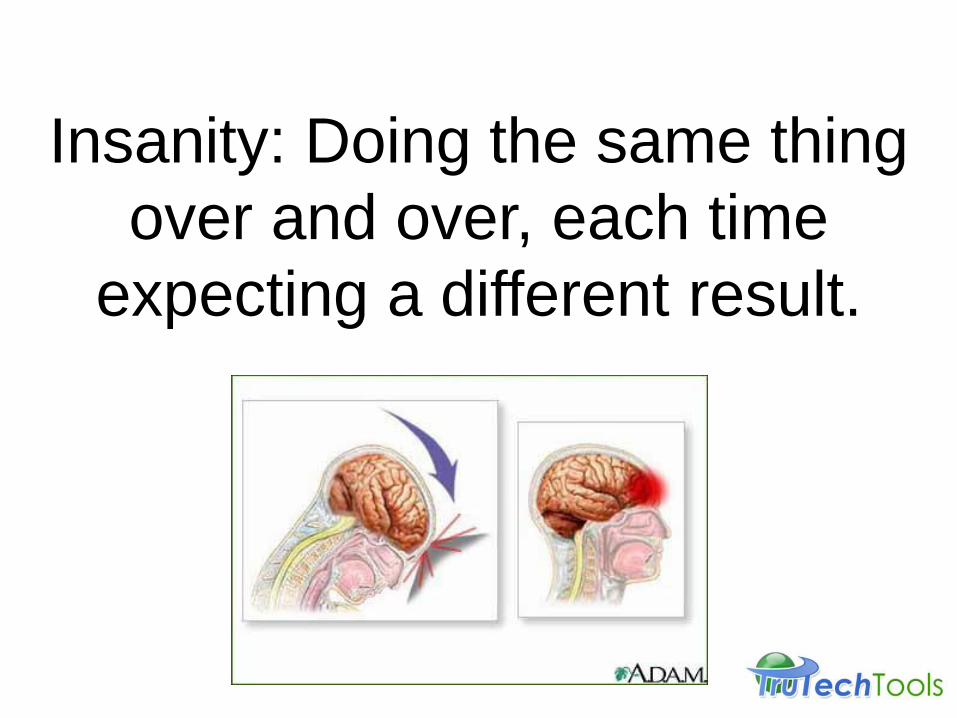
Insanity: Doing the same thing
over and over, each time
expecting a different result.
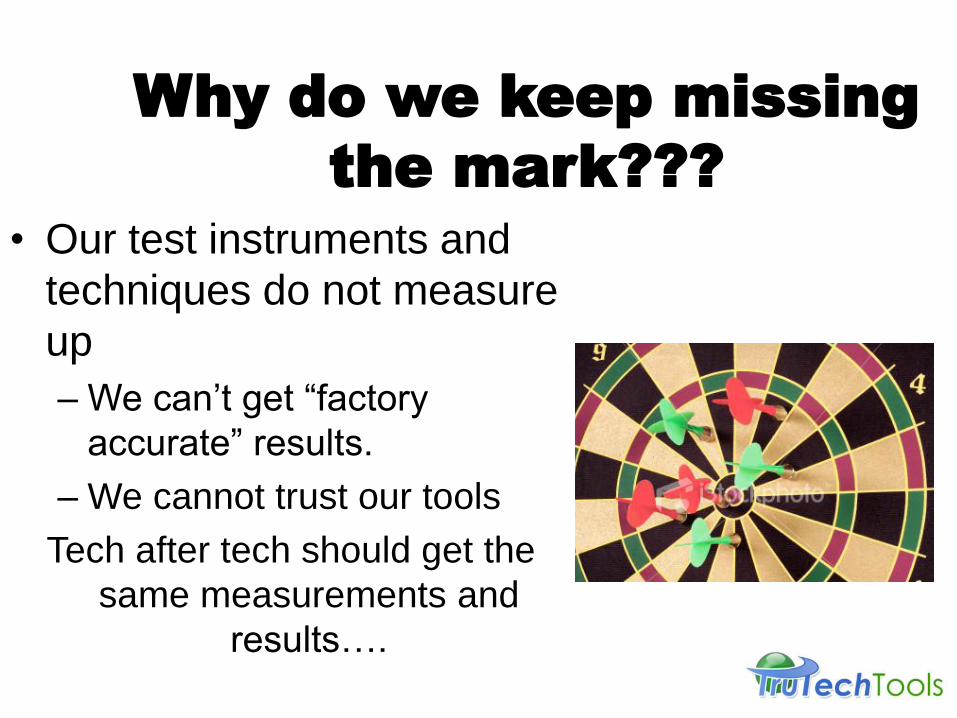
Why do we keep missing
the mark???
• Our test instruments and
techniques do not measure
up
– We can’t get “factory
accurate” results.
– We cannot trust our tools
Tech after tech should get the
same measurements and
results….
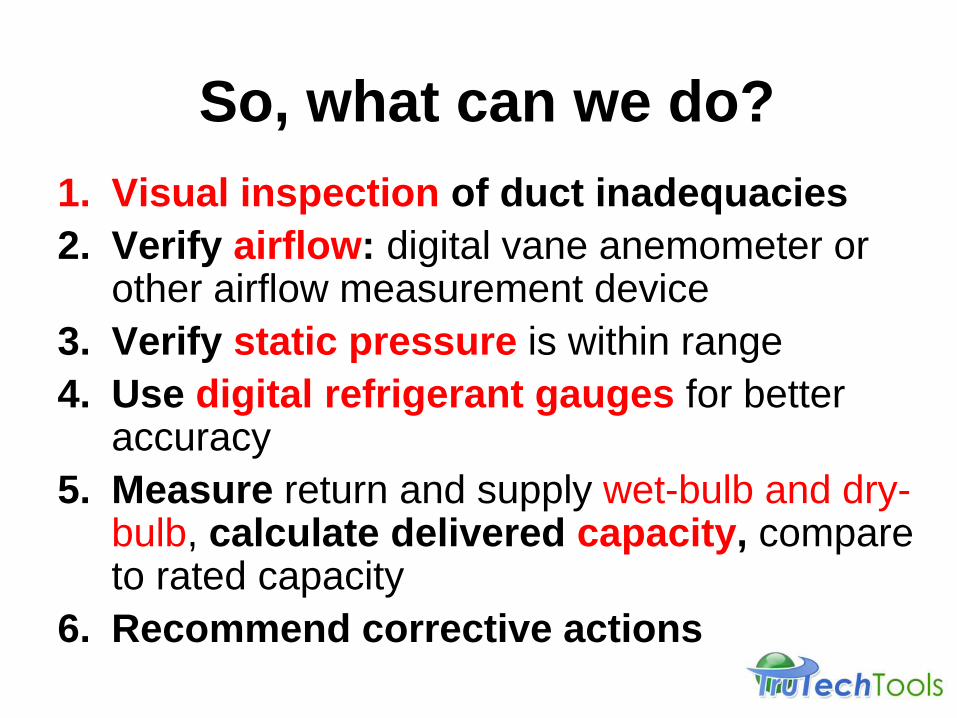
So, what can we do?
1. Visual inspection of duct inadequacies
2. Verify airflow: digital vane anemometer or other airflow measurement device
3. Verify static pressure is within range
4. Use digital refrigerant gauges for better accuracy
5. Measure return and supply wet-bulb and dry-bulb, calculate delivered capacity, compare to rated capacity
6. Recommend corrective actions

THEN…
Using the information
to diagnose problems and
make wise choices
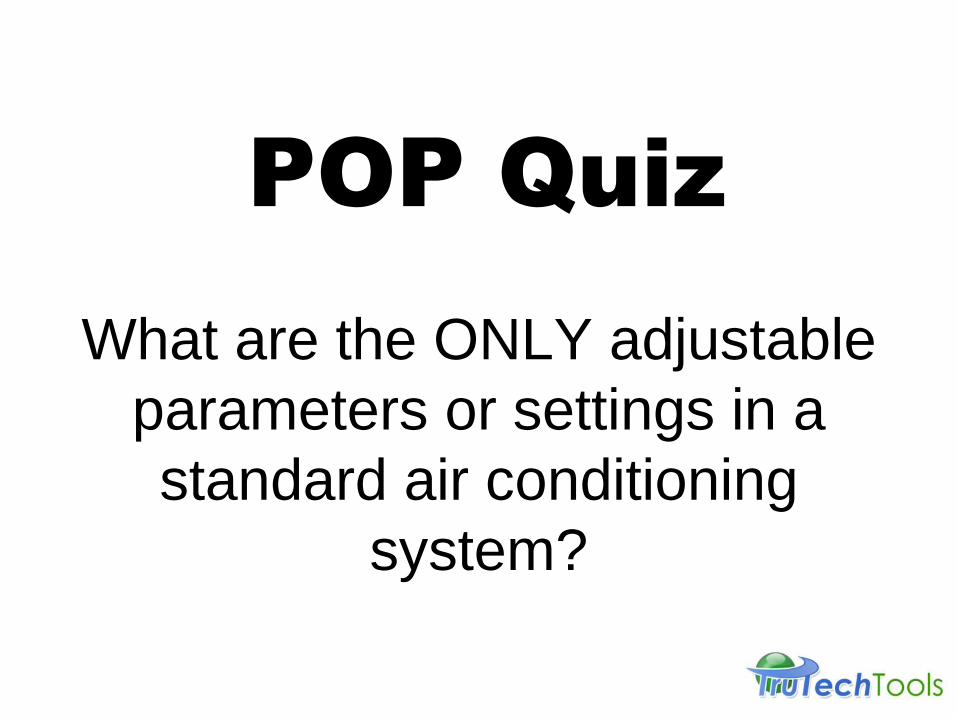
What are the ONLY adjustable
parameters or settings in a
standard air conditioning
system?
POP Quiz
Answer!!!
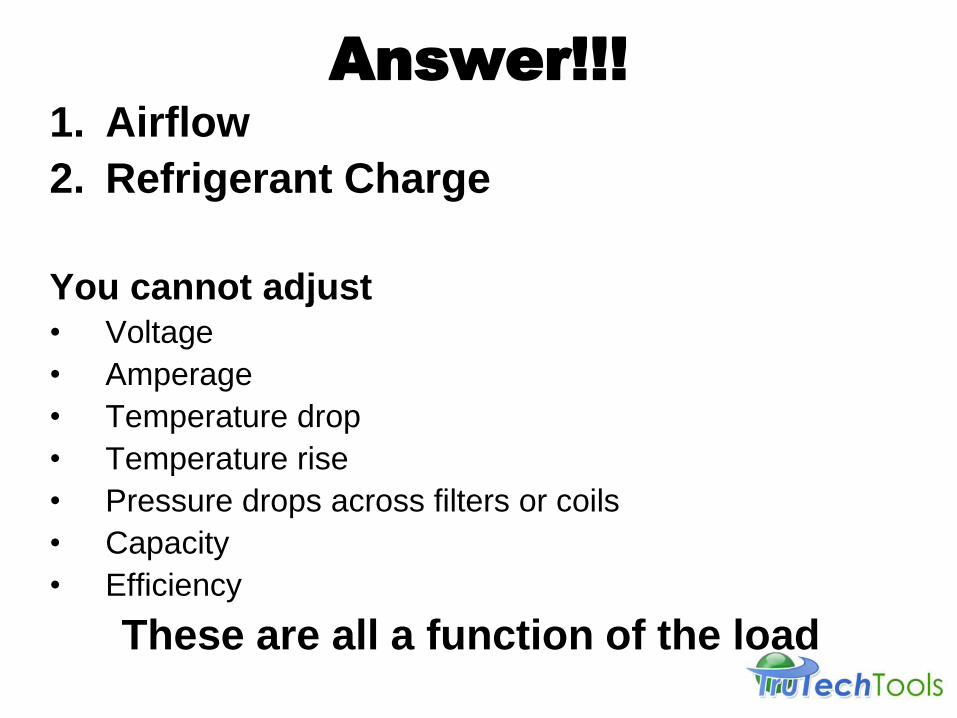
1. Airflow
2. Refrigerant Charge
You cannot adjust • Voltage
• Amperage
• Temperature drop
• Temperature rise
• Pressure drops across filters or coils
• Capacity
• Efficiency
These are all a function of the load
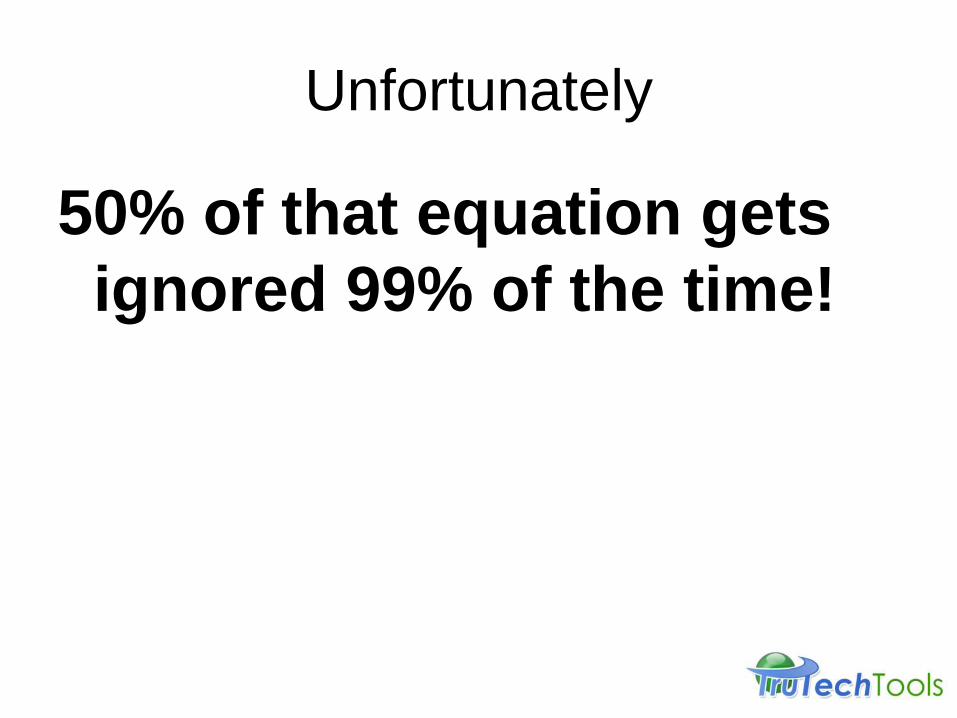
Unfortunately
50% of that equation gets
ignored 99% of the time!

By doing so, the technician
gives up 50% of his power
to control the outcome
of his visit

The $1,000,000 Question is…
WHY????
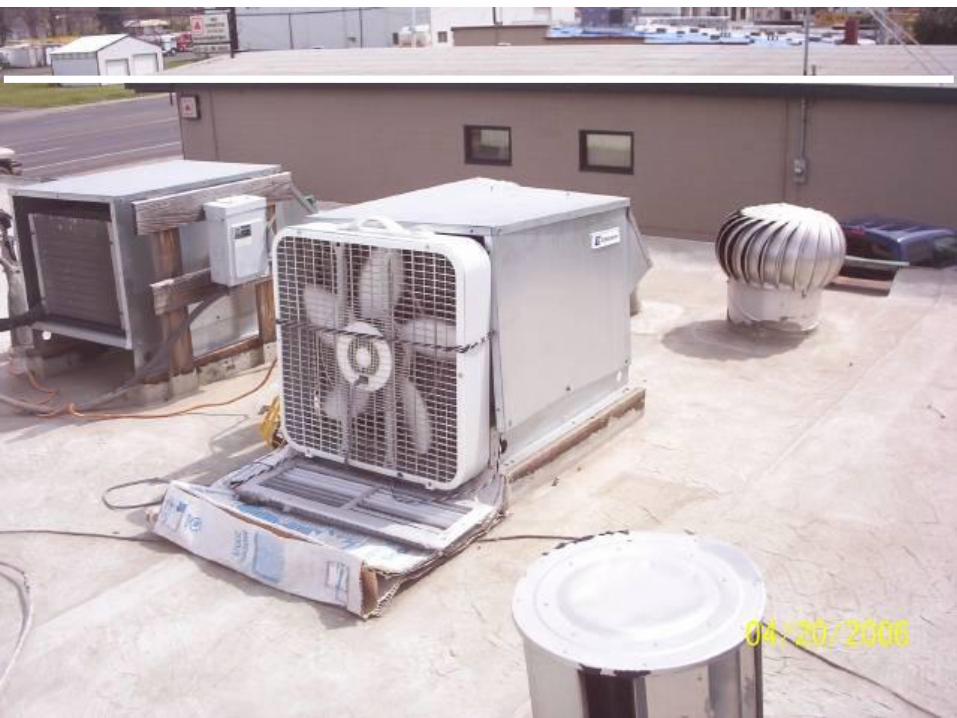
Wake-up call
• Many of these have been regularly
“maintained” by the industry!
• How can this happen?
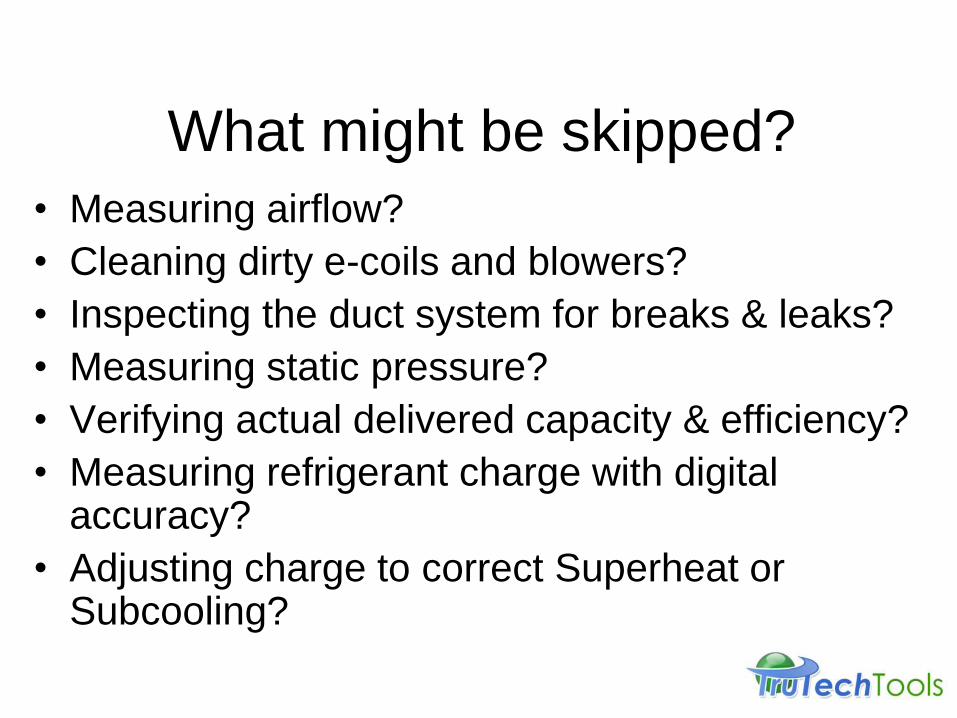
What might be skipped?
• Measuring airflow?
• Cleaning dirty e-coils and blowers?
• Inspecting the duct system for breaks & leaks?
• Measuring static pressure?
• Verifying actual delivered capacity & efficiency?
• Measuring refrigerant charge with digital accuracy?
• Adjusting charge to correct Superheat or Subcooling?
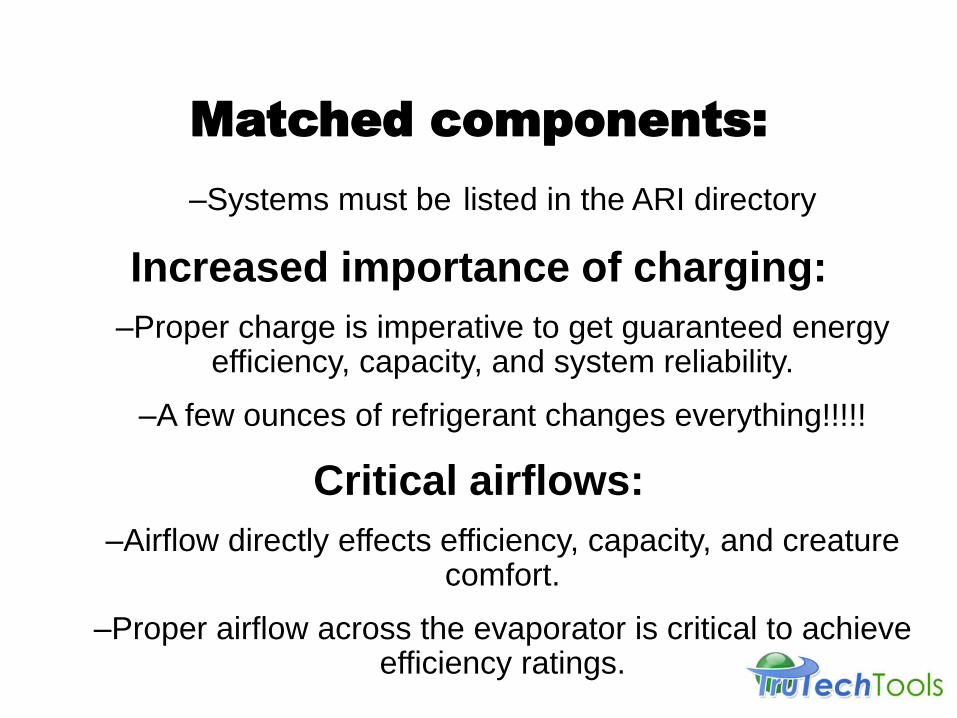
Matched components:
–Systems must be listed in the ARI directory
Increased importance of charging:
–Proper charge is imperative to get guaranteed energy efficiency, capacity, and system reliability.
–A few ounces of refrigerant changes everything!!!!!
Critical airflows:
–Airflow directly effects efficiency, capacity, and creature comfort.
–Proper airflow across the evaporator is critical to achieve efficiency ratings.
System Performance
• Performance cannot be assumed!!!
– Performance varies with load conditions
– Equipment performance does not assure
delivered performance
– Systems are field installed and require a field
commissioning procedure
• Efficiency and performance go hand in
hand
BENEFITS TO YOU AND YOUR CUSTOMER •Enhanced customer services •Additional revenue stream •Additional work for Off-peak seasons •Identify problems that can bite you! •Fewer callbacks •Differentiation in the Marketplace •Become a “Participating Contractor”

THE AC-TUNE-UP
• Includes the entire system
• Focusing on:
– Proper airflow
– Correct refrigerant charge
– Delivering conditioned air
• Ultimately proper AIR CONDITIONING
– By quantifying performance
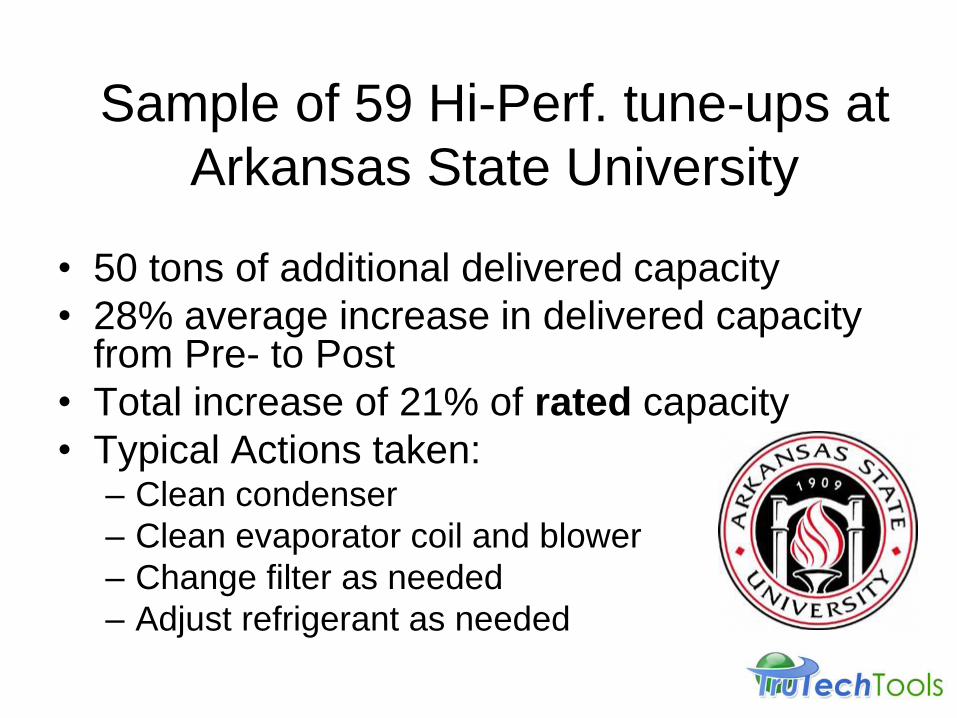
Sample of 59 Hi-Perf. tune-ups at
Arkansas State University
• 50 tons of additional delivered capacity
• 28% average increase in delivered capacity from Pre- to Post
• Total increase of 21% of rated capacity
• Typical Actions taken: – Clean condenser
– Clean evaporator coil and blower
– Change filter as needed
– Adjust refrigerant as needed
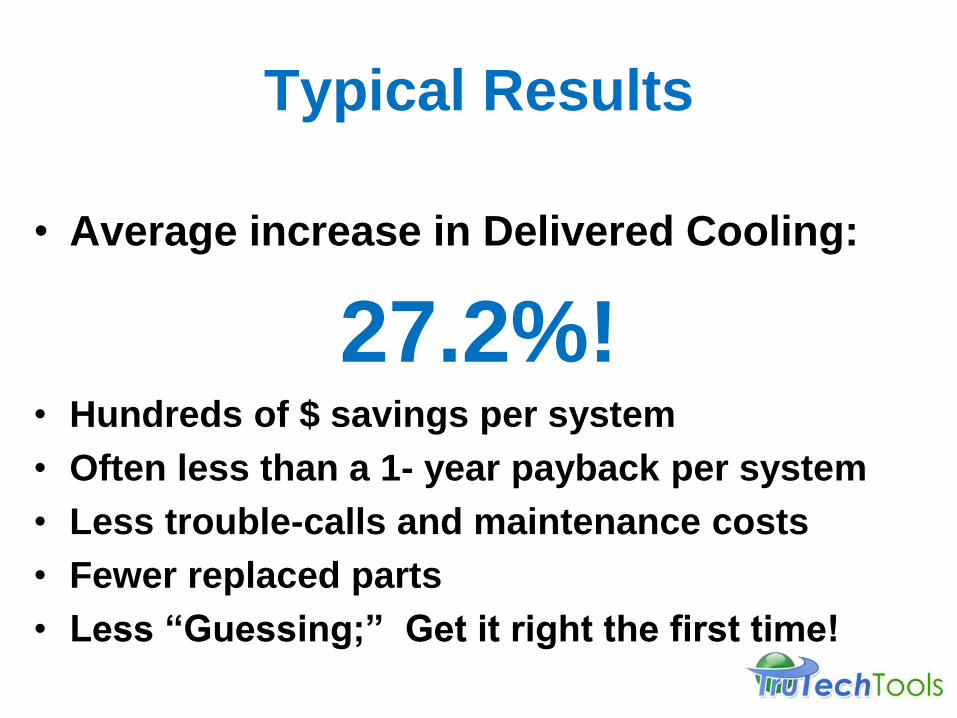
Typical Results
• Average increase in Delivered Cooling:
27.2%! • Hundreds of $ savings per system
• Often less than a 1- year payback per system
• Less trouble-calls and maintenance costs
• Fewer replaced parts
• Less “Guessing;” Get it right the first time!
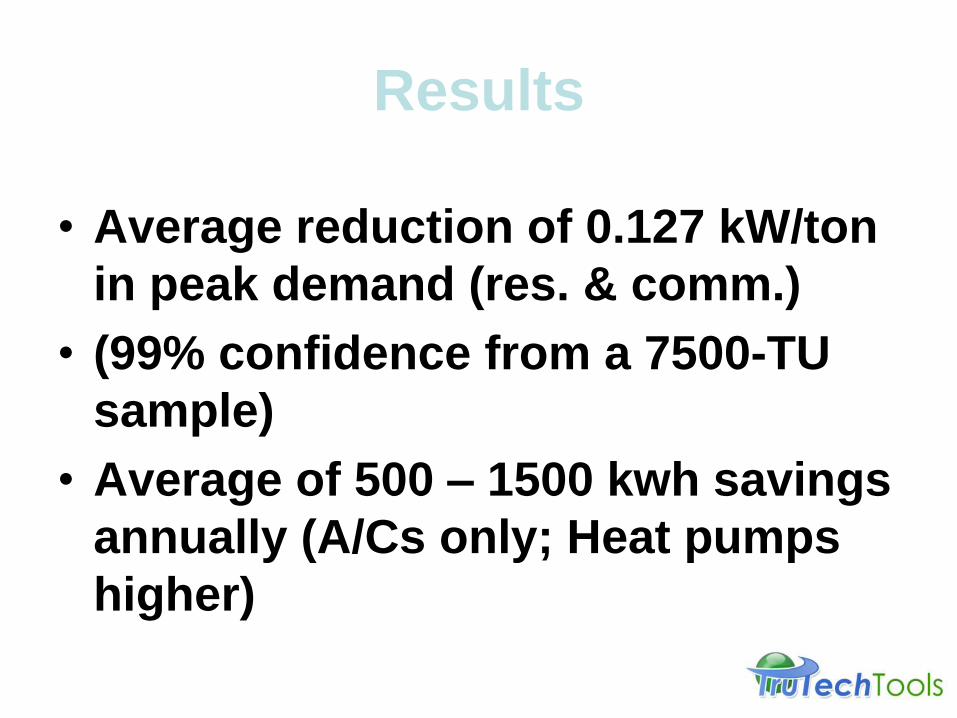
Results
• Average reduction of 0.127 kW/ton
in peak demand (res. & comm.)
• (99% confidence from a 7500-TU
sample)
• Average of 500 – 1500 kwh savings
annually (A/Cs only; Heat pumps
higher)
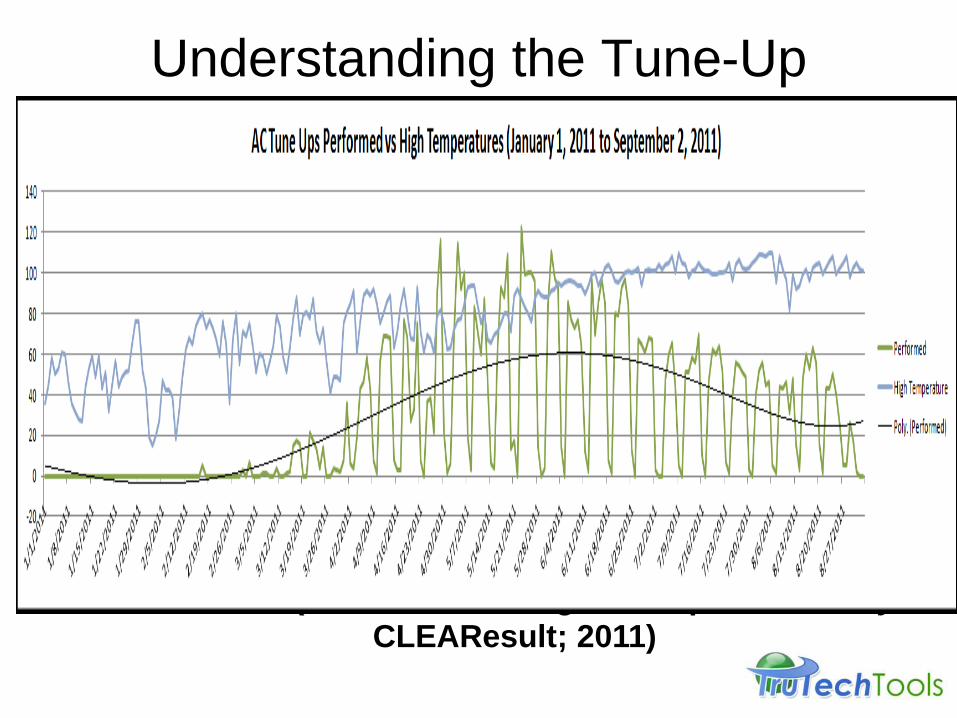
Understanding the Tune-Up
Season
Tune-ups (Green) decreased as daily high temps (Blue)
increased (OG&E HEEP Program, implemented by
CLEAResult; 2011)
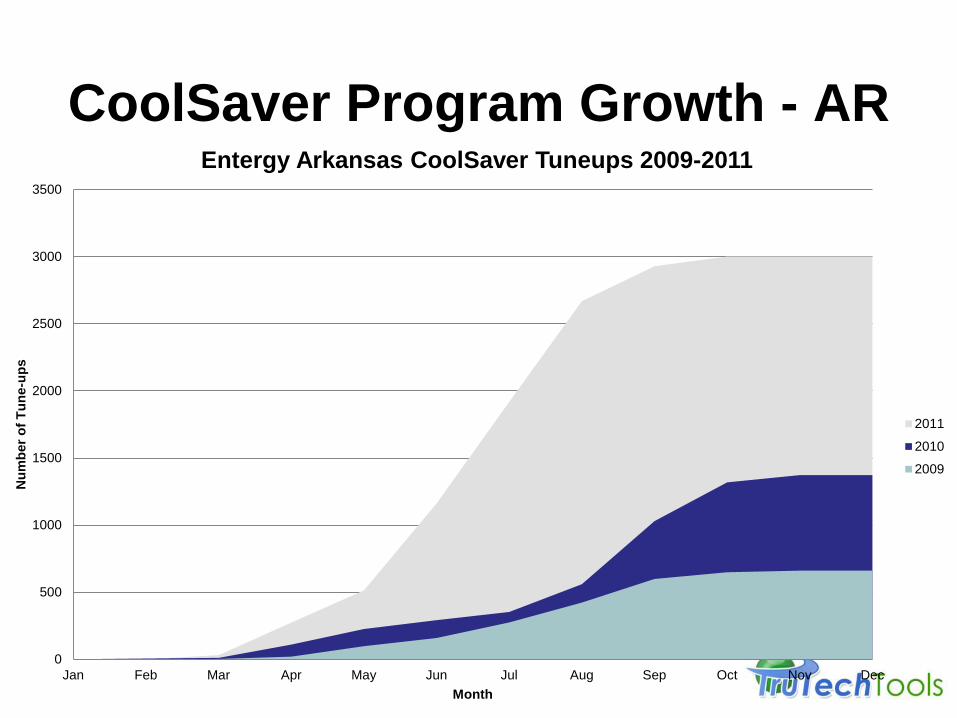
CoolSaver Program Growth - AR
0
500
1000
1500
2000
2500
3000
3500
Jan Feb Mar Apr May Jun Jul Aug Sep Oct Nov Dec
Nu
mb
er
of
Tu
ne
-up
s
Month
Entergy Arkansas CoolSaver Tuneups 2009-2011
2011
2010
2009
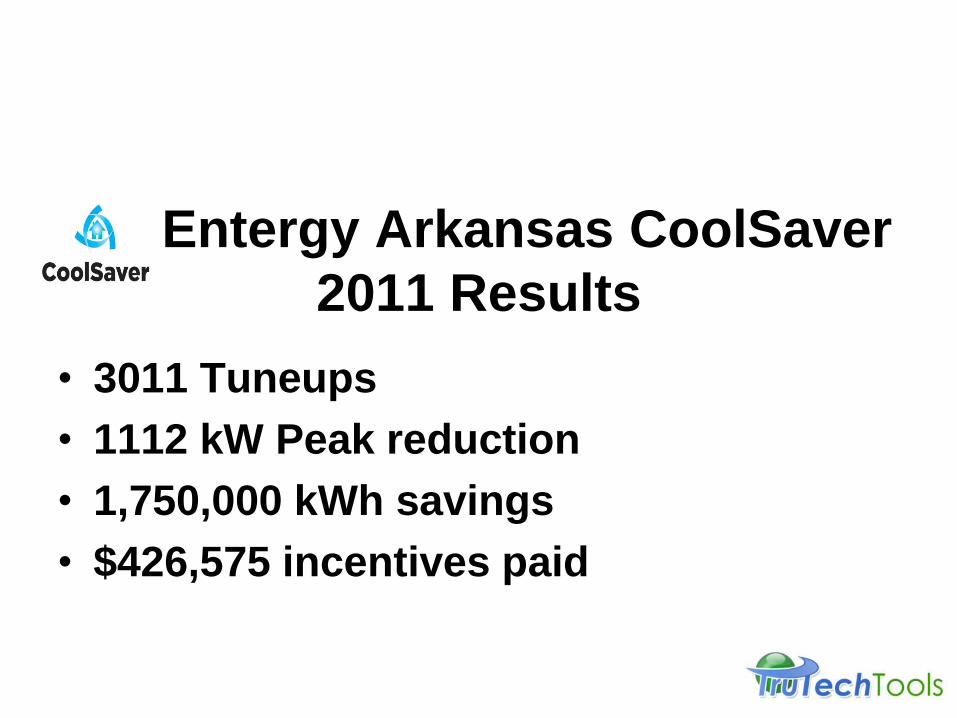
Entergy Arkansas CoolSaver
2011 Results
• 3011 Tuneups
• 1112 kW Peak reduction
• 1,750,000 kWh savings
• $426,575 incentives paid
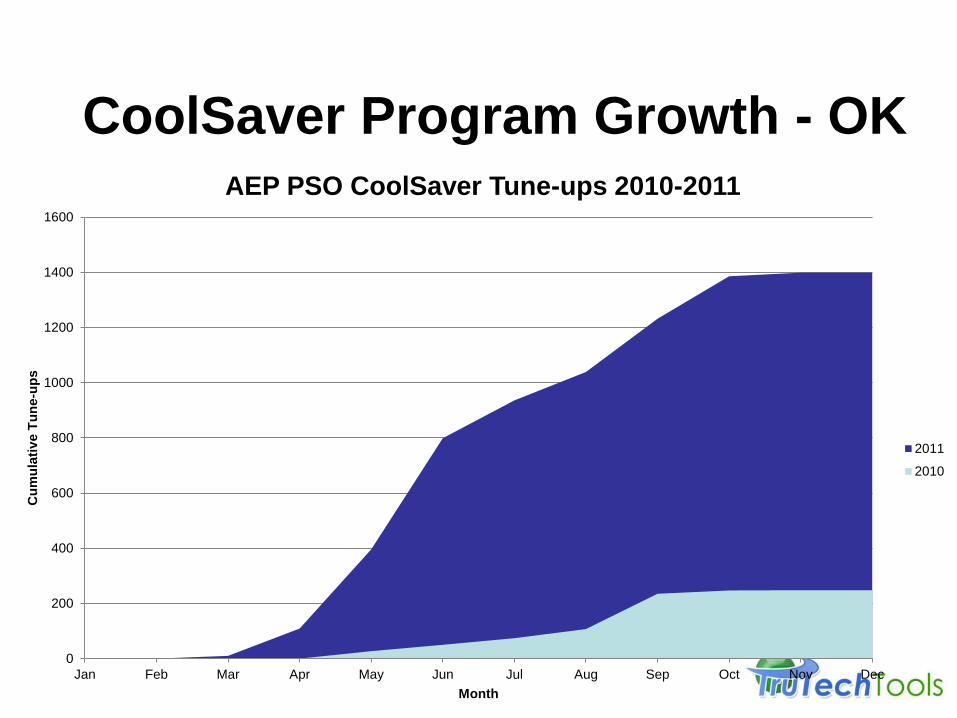
CoolSaver Program Growth - OK
0
200
400
600
800
1000
1200
1400
1600
Jan Feb Mar Apr May Jun Jul Aug Sep Oct Nov Dec
Cu
mu
lati
ve T
un
e-u
ps
Month
AEP PSO CoolSaver Tune-ups 2010-2011
2011
2010
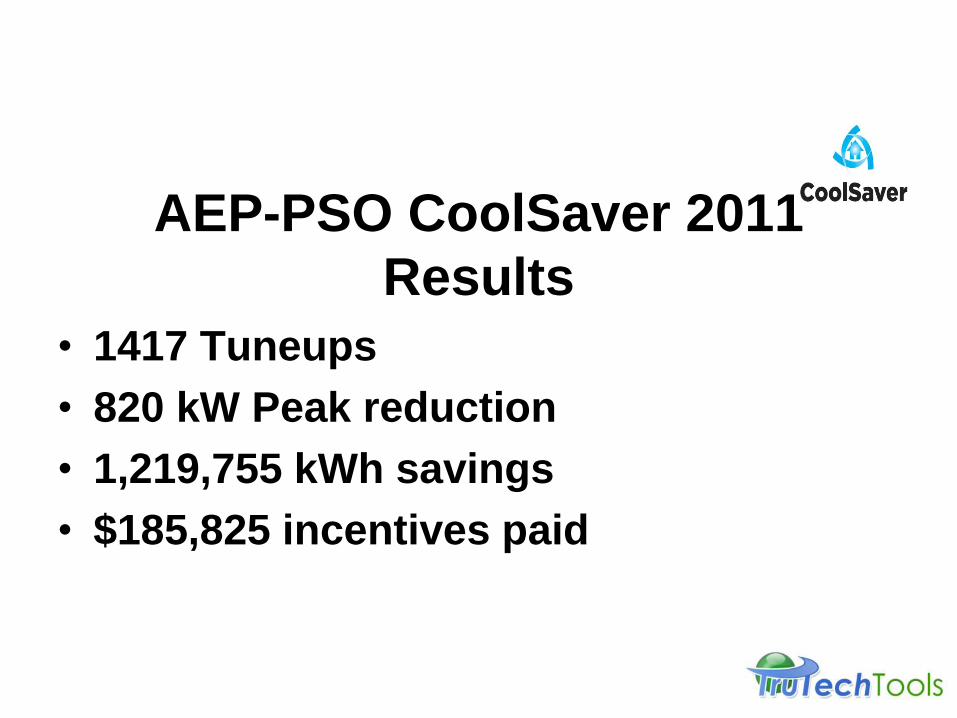
AEP-PSO CoolSaver 2011
Results
• 1417 Tuneups
• 820 kW Peak reduction
• 1,219,755 kWh savings
• $185,825 incentives paid
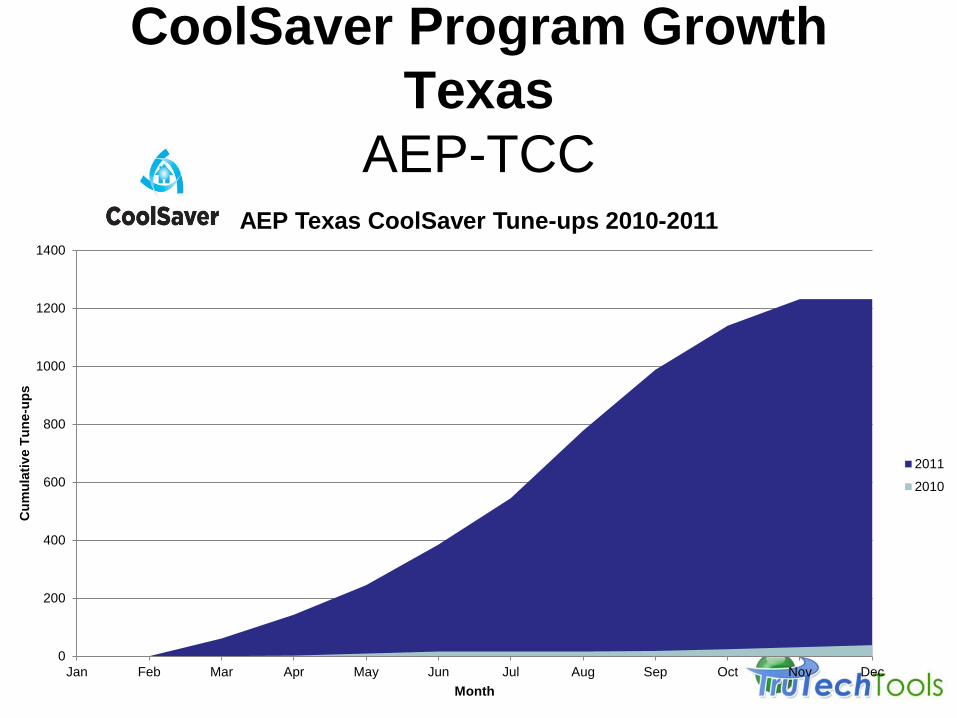
CoolSaver Program Growth
Texas
AEP-TCC
0
200
400
600
800
1000
1200
1400
Jan Feb Mar Apr May Jun Jul Aug Sep Oct Nov Dec
Cu
mu
lati
ve T
un
e-u
ps
Month
AEP Texas CoolSaver Tune-ups 2010-2011
2011
2010
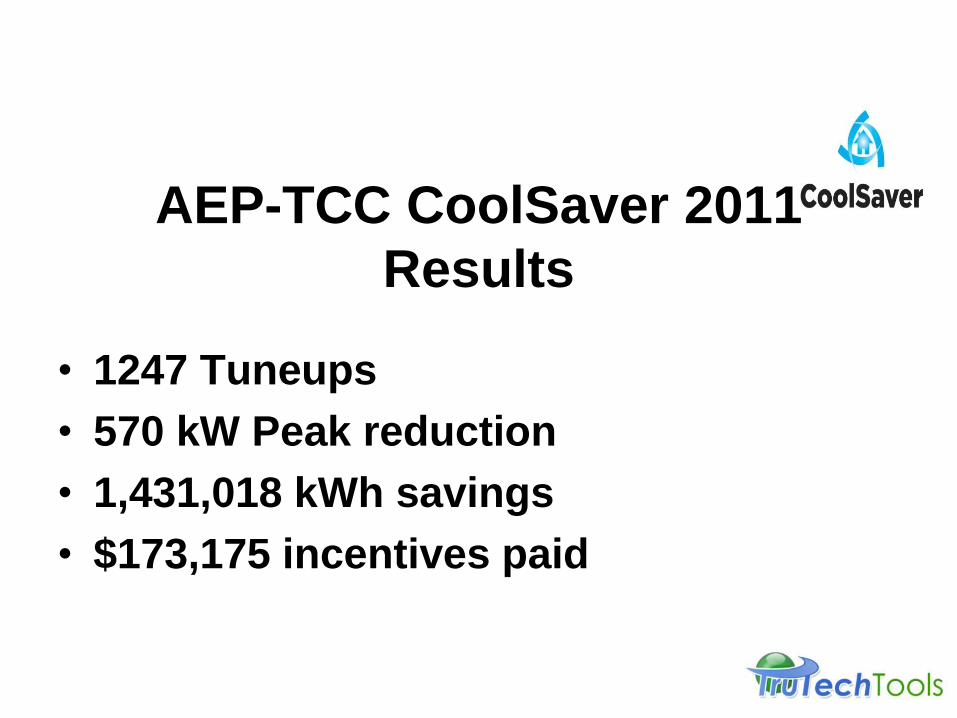
AEP-TCC CoolSaver 2011
Results
• 1247 Tuneups
• 570 kW Peak reduction
• 1,431,018 kWh savings
• $173,175 incentives paid
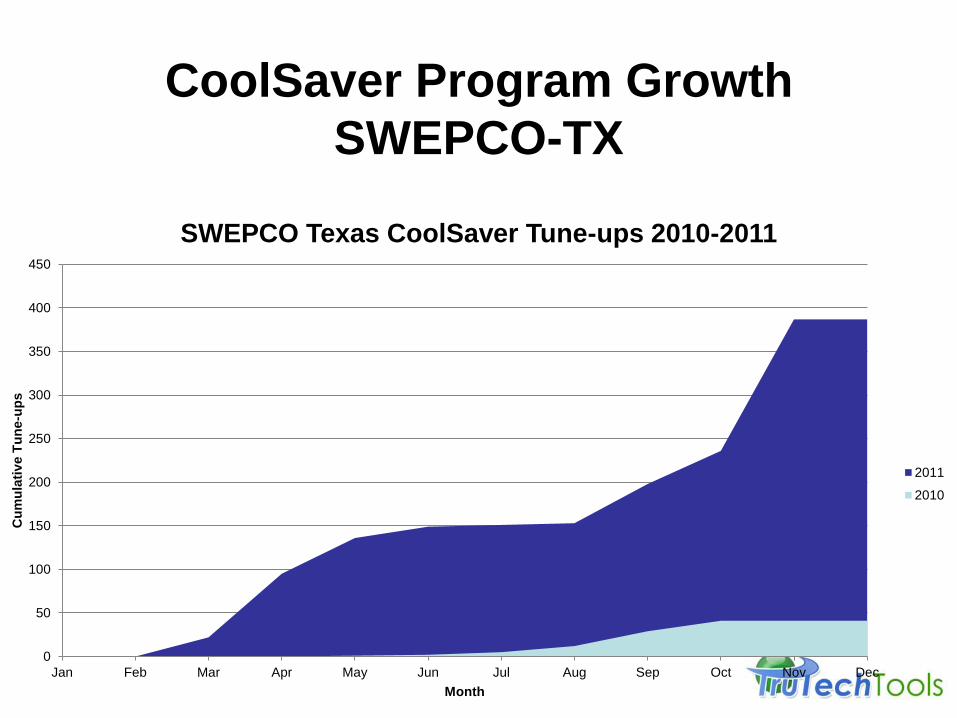
CoolSaver Program Growth
SWEPCO-TX
0
50
100
150
200
250
300
350
400
450
Jan Feb Mar Apr May Jun Jul Aug Sep Oct Nov Dec
Cu
mu
lati
ve T
un
e-u
ps
Month
SWEPCO Texas CoolSaver Tune-ups 2010-2011
2011
2010
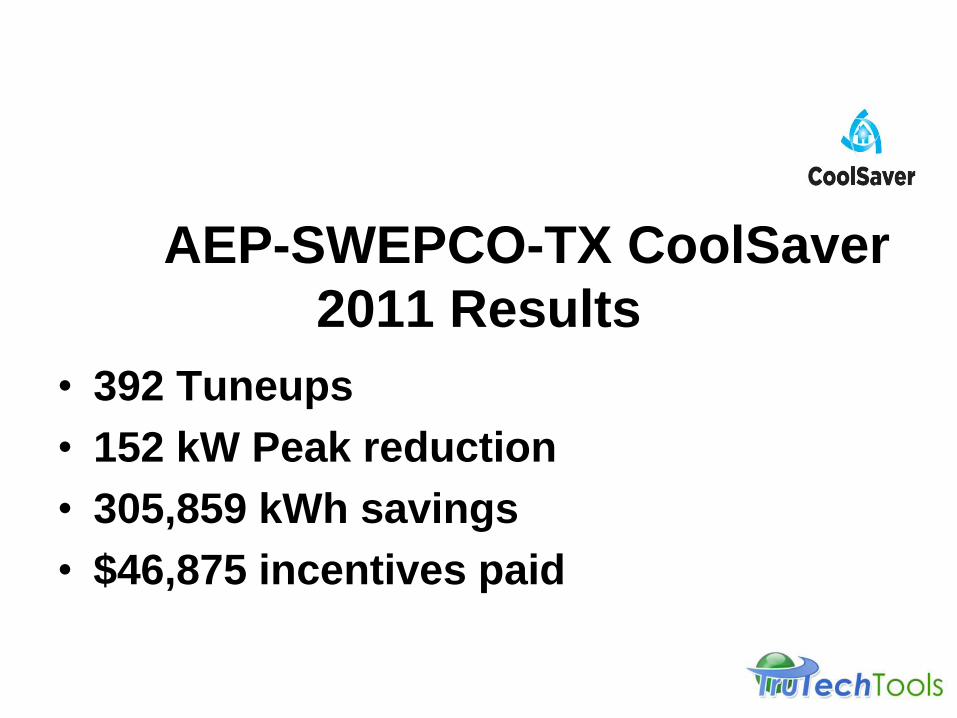
AEP-SWEPCO-TX CoolSaver
2011 Results
• 392 Tuneups
• 152 kW Peak reduction
• 305,859 kWh savings
• $46,875 incentives paid
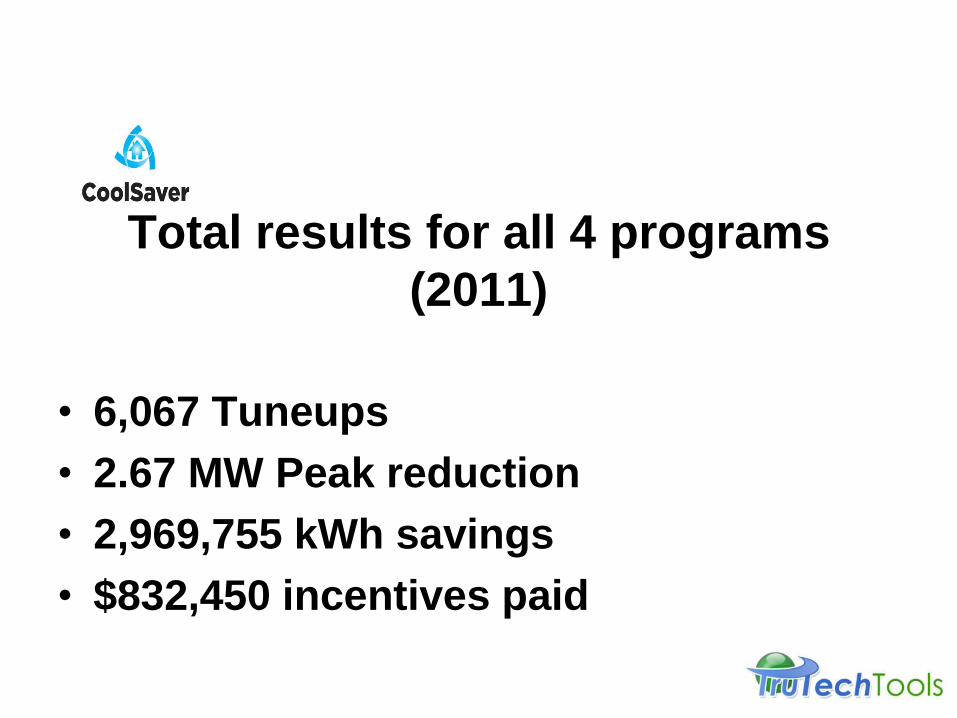
Total results for all 4 programs
(2011)
• 6,067 Tuneups
• 2.67 MW Peak reduction
• 2,969,755 kWh savings
• $832,450 incentives paid

Now…
How do we turn this into a new
profit center in our business?
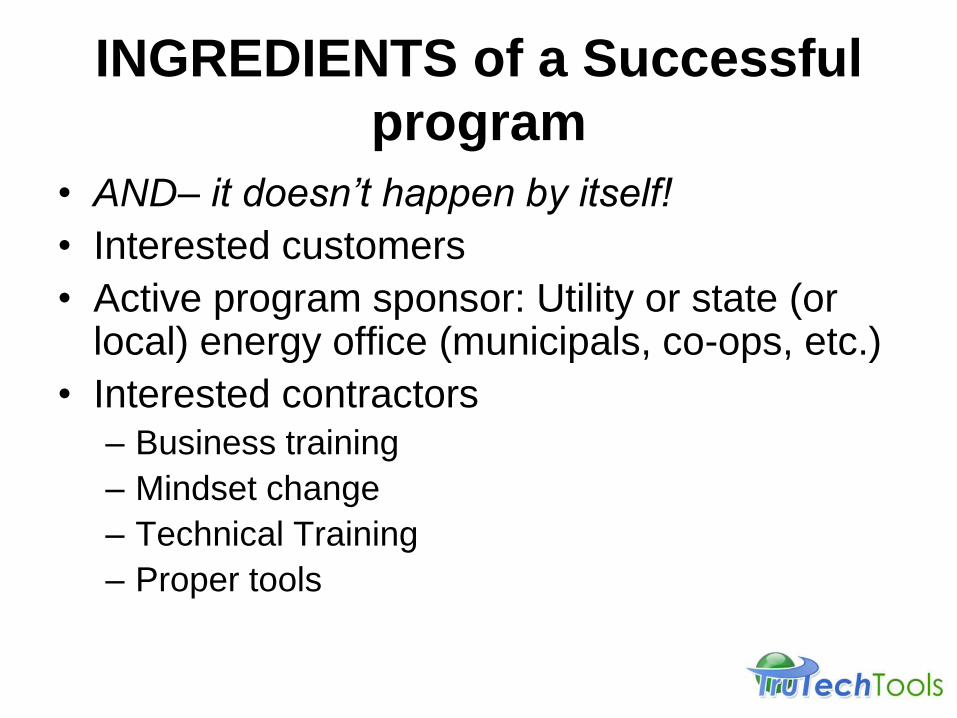
INGREDIENTS of a Successful
program
• AND– it doesn’t happen by itself!
• Interested customers
• Active program sponsor: Utility or state (or local) energy office (municipals, co-ops, etc.)
• Interested contractors
– Business training
– Mindset change
– Technical Training
– Proper tools
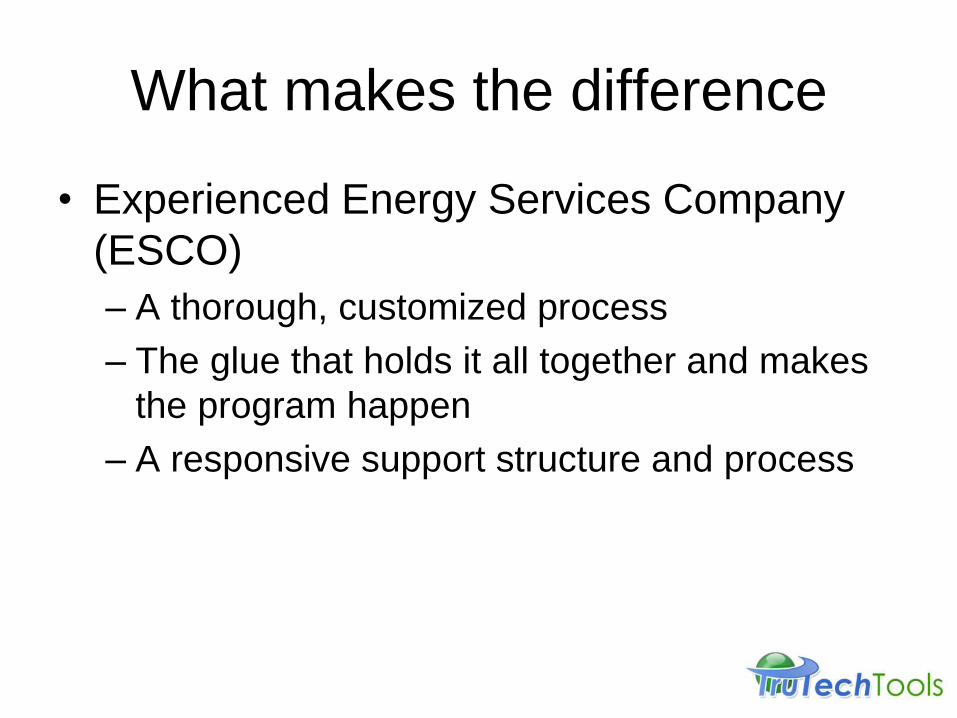
What makes the difference
• Experienced Energy Services Company
(ESCO)
– A thorough, customized process
– The glue that holds it all together and makes
the program happen
– A responsive support structure and process
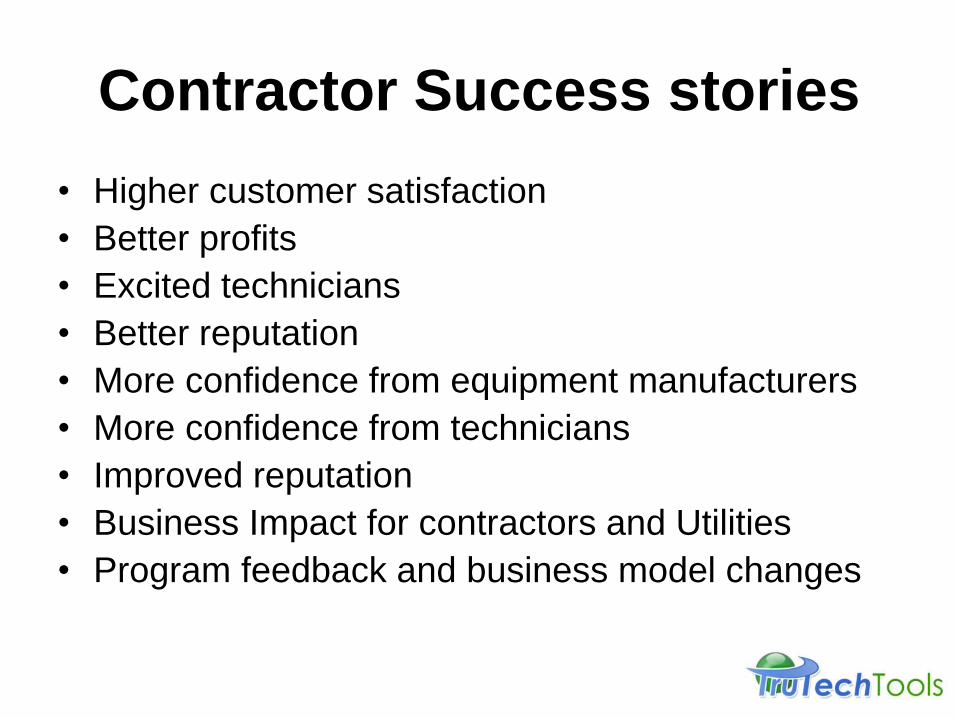
Contractor Success stories
• Higher customer satisfaction
• Better profits
• Excited technicians
• Better reputation
• More confidence from equipment manufacturers
• More confidence from technicians
• Improved reputation
• Business Impact for contractors and Utilities
• Program feedback and business model changes
CONCLUSIONS:
• So Therefore….
• Training need
• Contractors don’t know what they should
know
• Business model changes
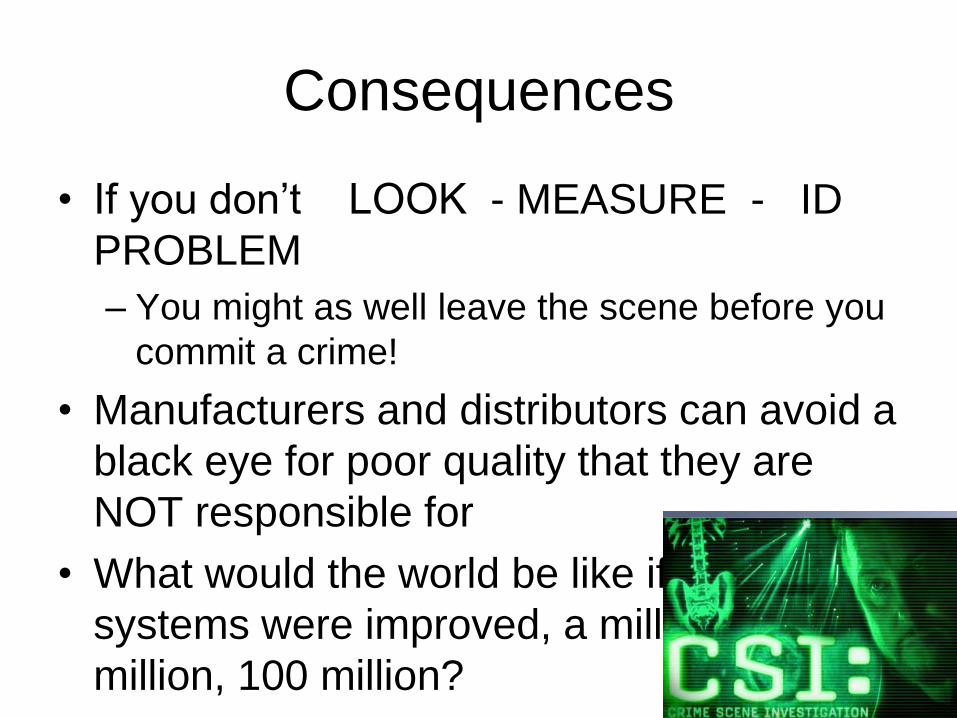
Consequences
• If you don’t LOOK - MEASURE - ID
PROBLEM
– You might as well leave the scene before you
commit a crime!
• Manufacturers and distributors can avoid a
black eye for poor quality that they are
NOT responsible for
• What would the world be like if 100,000
systems were improved, a million, 5
million, 100 million?

Resources & Contacts
www.TruTechTools.com/Training
www.TruTechTools.com/Webinars
www.YouTube.com/user/jimbergmann3
888-224-3437
www.TruTechTools.com