Embed Size (px)
Citation preview

Kathleen Hartnett White, Chairman
Larry R. Soward, Commissioner
H. S. Buddy Garcia, Commissioner
Glenn Shankle, Executive Director
Lake Houston Watershed Area Bacteria TMDL Project - Segment Numbers: 1002, 1003,Re:1004,1008, 1008B, 1009, 1010, and 1011
Dear Dr. Miertschin:
The above named QAPP has been approved. The original QAPP and signature pages are enclosed as
approvaldocumentation of
In accordance with the tenns of the QAPP, please ensure that copies of this document and anysubsequent amendments are distributed to each sub-tier participant as noted in Section A3 ofthe QAPP. This approval letter must be available for review during a monitoring systems audit.
~
Should you have questions, please contact me at (512) 239-0425.
enclosure
Sharon Coleman, Senior Quality Assurance Specialist, MC 176cc:Casey Johnson, Project Manager, MC 203
Austin, Texas 78711-3087 . 512-239-1000printed on recycled paper using S9y-based ink
P.O. Box 13087 .
QualityAssurance Project Plan (QAPP)
Internet address: www.tceq.state.tx.us.

TMDLQAPPRevision0
Lake Houston Watershed Area Bacteria TMDL Project Segment Numbers: 1002, 1003, 1004, 1008, 1008B, 1009, 1010, and 1011
Quality Assurance Project Plan Revision 0
Date submitted to TCEQ: 9/26/2007
USEPA QTRAK#
James Miertschin & Associates, Inc. Post Office Box 162305
Austin, Texas 78716-2305 [email protected]
Total Maximum Daily Load Program
Chief Engineer’s Office, Water Programs Texas Commission on Environmental Quality
P.O. Box 13087, MC - 203 Austin, Texas 78711-3087
This QAPP is effective for a period of one year from approval date.
Questions concerning this QAPP should be directed to: James Miertschin & Associates, Inc.
Austin, TX

At APPROVAL PAGE
Texas Commission on Environmental
.
.Office of Compliance and. Enforcement
~
.
Data Management and Quality Assurance Section
Note: The JMA Quality Assurance Officer will secure written documentation (such as the letterin Appendix G) trom each sub-tier project participant (e.g., subcontractors, other units ofgovernment, laboratories) stating the organization's awareness of and commitment torequirements contained in this quality assurance project plan and any amendments or revisions of
~
TMDLQAPPRevisionO
Section ARevision No. 0
September 26, 2007Page 2
Quality
7

Section A Revision No. 0
September 26, 2007 Page 3
TMDLQAPPRevision0
this plan. The JMA Quality Assurance Officer will maintain the documentation as part of the project’s quality assurance records, and will ensure that the document is available for review. Copies will also be submitted as deliverables to the TMDL Project Manager within 30 days of QAPP approval.

Section A Revision No. 0
September 26, 2007 Page 4
TMDLQAPPRevision0
A2 TABLE OF CONTENTS
A1 APPROVAL PAGE.........................................................................................................................................2 A2 TABLE OF CONTENTS.................................................................................................................................4 LIST OF APPENDICES........................................................................................................................................4 A3 DISTRIBUTION LIST ....................................................................................................................................5 List of Acronyms ...................................................................................................................................................8 A4 PROJECT/TASK ORGANIZATION............................................................................................................10
Figure A4.1 Organization Chart ......................................................................................................................14 A5 PROBLEM DEFINITION/BACKGROUND................................................................................................14
Table 5.1: Impaired Water Bodies ..................................................................................................................15 A6 PROJECT/TASK DESCRIPTION ................................................................................................................15 A7 QUALITY OBJECTIVES AND CRITERIA ................................................................................................16
Table A7.1 - Measurement Performance Specifications..................................................................................17 A8 SPECIAL TRAINING/CERTIFICATION....................................................................................................19 A9 DOCUMENTS AND RECORDS..................................................................................................................20
Table A9.1 Project Documents and Records ...................................................................................................20 B1 SAMPLING PROCESS DESIGN .................................................................................................................22 B2 SAMPLING METHODS...............................................................................................................................22
Table B2.1 Field Sampling and Handling Procedures .....................................................................................23 B3 SAMPLE HANDLING AND CUSTODY ....................................................................................................24 B4 ANALYTICAL METHODS..........................................................................................................................26 B5 QUALITY CONTROL ..................................................................................................................................27 B6 INSTRUMENT/EQUIPMENT TESTING, INSPECTION AND MAINTENANCE ...................................29 B7 INSTRUMENT/EQUIPMENT CALIBRATION AND FREQUENCY........................................................30 B8 INSPECTION/ACCEPTANCE OF SUPPLIES AND CONSUMABLES ....................................................30 B9 NON-DIRECT MEASUREMENTS..............................................................................................................30 B10 DATA MANAGEMENT.............................................................................................................................30 C1 ASSESSMENTS AND RESPONSE ACTIONS ...........................................................................................32
Table C1.1 Assessments and Response Actions..............................................................................................32 C2 REPORTS TO MANAGEMENT ..................................................................................................................33 D1 DATA REVIEW, VERIFICATION AND VALIDATION...........................................................................34 D2 VERIFICATION AND VALIDATION METHODS....................................................................................34
Table D2.1 Data Verification Procedures........................................................................................................35 D3 RECONCILIATION WITH USER REQUIREMENTS................................................................................36
LIST OF APPENDICES
APPENDIX A: WORK PLAN APPENDIX B: SAMPLING PROCESS DESIGN AND MONITORING SCHEDULE APPENDIX C: FIELD DATA REPORTING FORM APPENDIX D: CHAIN-OF-CUSTODY FORM APPENDIX E: DATA MANAGEMENT PLAN APPENDIX F: DATA REVIEW CHECKLIST APPENDIX G: EXAMPLE LETTER

Section A Revision No. 0
September 26, 2007 Page 5
TMDLQAPPRevision0
A3 DISTRIBUTION LIST Texas Commission on Environmental Quality P.O. Box 13087 Austin, Texas 78711-3087 Chief Engineer’s Office Water Programs Casey Johnson, TMDL Project Manager MC-203 (512) 239-1505 Office of Compliance and Enforcement Compliance Support Division Kyle Girten, Quality Assurance Specialist MC-176 (512) 239-0425 Monitoring Operations Division David Manis, Manager Data Management and Quality Assurance MC-165 (512) 239-5853 TCEQ Field Operations Division Monica Harris, Water Program Manager Linda Broach, Region 12 TMDL Staff MC-174 MC-R12 (512) 239-6266 (713) 767-3579
James Miertschin & Associates, Inc. PO Box 162305, Austin, Texas 78746 James Miertschin, PhD, PE, Project Manager Al Capps, Quality Assurance Officer (512)-327-2708 (512)-327-2708 Steve Grychka, Laboratory Supervisor Steve Grychka, Laboratory QA Officer North Water District Laboratory Services, Inc. North Water District Laboratory Services, Inc. (936) 321-6060 (936)321-6060 Thierry Tamers MST Project Manager Source Molecular Corporation, Inc. 4989 SW 74th Court Miami, FL 33155 (786) 268-8363

Section A Revision No. 0
September 26, 2007 Page 6
TMDLQAPPRevision0
U.S. EPA Region 6 1445 Ross Avenue Suite # 1200 Mail Code: 6WQAT Dallas, TX 75202-2733 Donna Miller, Chief (214)-665-8093
Section A Revision No. 0
September 26, 2007 Page 7
TMDLQAPPRevision0
Note: The JMA Quality Assurance Officer will provide copies of this project plan and any amendments or revisions of this plan to each sub-tier project participant, e.g., subcontractors, other units of government, laboratories. The JMA Quality Assurance Officer will document receipt of the plan by sub-tier participants and maintain this documentation as part of the project’s quality assurance records. This documentation will be available for review and will also be submitted to the TMDL Project Manager within 30 days of QAPP approval.

Section A Revision No. 0
September 26, 2007 Page 8
TMDLQAPPRevision0
List of Acronyms AWRL Ambient Water Reporting Limit BOD5 5-day Biochemical Oxygen Demand CAR Corrective Action Report CBOD Carbonaceous Biochemical Oxygen Demand CFU Colony-Forming Unit of Bacteria COC Chain of Custody COD Chemical Oxygen Demand CRP Clean Rivers Program CWA Clean Water Act DM&QA Data Management & Quality Assurance DMRG Data Management Reference Guide DOC Demonstration of Capability DO Dissolved Oxygen DOC Dissolved Organic Carbon EPA Environmental Protection Agency FOD Field Operations Division GPS Global Positioning System ISO/IEC International Standard Organization/International Electrotechnical Commission LCS Laboratory Control Sample LCSD Laboratory Control Sample Duplicate LIMS Laboratory Information Management System LOD Limit of Detection LOQ Limit of Quantification MS Matrix Spike MDMA Monitoring Data Management and Analysis MPN Most Probable Number NPS Nonpoint Source NWDLS North Water District Laboratory Services, Inc. QA/QC Quality Assurance/Quality Control QAO Quality Assurance Officer QAM Quality Assurance Manual (or Manager) QAP Quality Assurance Plan QAPP Quality Assurance Project Plan QAS Quality Assurance Specialist QMP Quality Management Plan qPCR Quantification Polymerase Chain Reaction RPD Relative Percent Difference SMI Source Molecular Corporation, Inc. SOP Standard Operating Procedure SWQM Surface Water Quality Monitoring TDS Total Dissolved Solids TMDL Total Maximum Daily Load TCEQ Texas Commission on Environmental Quality TOC Total Organic Carbon SWQMIS Surface Water Quality Monitoring Information System
Section A Revision No. 0
September 26, 2007 Page 9
TMDLQAPPRevision0
List of Acronyms Continued TSS Total Suspended Solids TSWQS Texas Surface Water Quality Standards USGS United States Geological Survey VOA Volatile Organic Analyses

Section A Revision No. 0
September 26, 2007 Page 10
TMDLQAPPRevision0
A4 PROJECT/TASK ORGANIZATION TCEQ Chief Engineer’s Office Water Programs Faith Hambleton TMDL Program Manager Responsible for managing the TCEQ TMDL Program. Oversees the development of QA guidance for the TMDL Team to be sure it is within pertinent frameworks of the TCEQ. Reviews and/or approves all TMDL Projects, QA audits, QAPPs, agency QMPs, corrective action reports, work plans, and contracts. Enforces corrective action where QA protocols are not met. Ensures TCEQ TMDL personnel are fully trained and TMDL projects are adequately staffed. Casey Johnson TMDL Project Manager Responsible for ensuring that the project delivers data of known quality, quantity, and type on schedule to achieve project objectives. Provides the primary point of contact between the JMA Project Team and the TCEQ. Tracks and reviews deliverables to ensure that tasks in the work plan are completed as specified in the contract. Reviews and approves QAPP and any amendments or revisions and ensures distribution of approved/revised QAPPs to TCEQ participants. Responsible for verifying that the QAPP is followed by the JMA Project Team. Notifies the TCEQ QAS and TMDL Program Manager of significant project nonconformance and corrective actions taken as documented in quarterly progress reports from JMA Project Team Project Manager. Kerry Niemann TMDL Data Manager The TMDL Data Manager tracks and validates data generated by TMDL projects and associates all applicable incoming data with a Project and QAPP in SWQMIS. Responsibilities include receiving data (Event/Results Files) and review checklists from TMDL Project Managers, and loading data sets into SWQMIS. The SWQMIS data loader identifies invalid stations, invalid parameter codes, outliers, and orphans. Deficiencies are provided to Project Managers via a SWQMIS Data Loading Validator Report. The TMDL Data Manager ensures data deficiencies are corrected before data sets are accepted by SWQMIS and loaded. TCEQ Compliance Support Division Kyle Girten TMDL Quality Assurance Specialist Assists the TCEQ TMDL Project Manager on QA-related issues. Coordinates reviews and approvals of QAPPs and amendments or revisions. Conveys QA problems to appropriate TCEQ management. Monitors implementation of corrective actions. Coordinates and conducts audits.

Section A Revision No. 0
September 26, 2007 Page 11
TMDLQAPPRevision0
TCEQ Monitoring Operations Division Data Management and Quality Assurance Data Manager Reviews QAPP for valid surface water quality monitoring stations, checks validity of parameter, submitting entity codes, collecting entity codes, monitoring type codes, and tag prefixes to ensures that data will be reported following the Surface Water Quality Monitoring Data Management Reference Guide (DMRG), 2007 or most current version. Analyzes SWQMIS to identify Level 1 data validation inconsistencies and reports any findings to TMDL Project Managers or TMDL Data Managers as appropriate. Serves as Monitoring Operations data management customer service representative for the TMDL Project Manager. Provides training to the TMDL Data Manager and TMDL Project Manager to ensure proper data submittal. Reviews and approves QAPPs. TCEQ Field Operations Division Linda Broach TCEQ Region 12 TMDL Staff Assists in the development of the project’s water quality monitoring plan as appropriate. Ensures that the water quality monitoring plan in Appendix B adequately represents the local water quality conditions that may account for the observed impairment by corresponding with respective FOD Regional Field Staff. Works with the TMDL Project Manager to resolve problems with water quality monitoring. Maintains contact with TCEQ Project Manager to ensure coordination of issues. James Miertschin & Associates, Inc. James Miertschin, PhD, PE JMA Project Manager The JMA Project Manager is responsible for ensuring that tasks and other requirements in the contract are executed on time and with the quality assurance/quality control requirements in the system as defined by the contract and in the project QAPP; assessing the quality of subcontractor/participant work; submitting accurate and timely deliverables to the TCEQ TMDL Project Manager; and coordinating attendance at conference calls, training, meetings, and related project activities with the TCEQ. Responsible for verifying that the QAPP is distributed and followed by the JMA (including all subcontractors) and that the project is producing data of known and acceptable quality. Responsible for ensuring adequate training and supervision of all activities involved in generating analytical and field data, including the facilitation of audits and the implementation, documentation, verification and reporting of corrective actions. Al Capps JMA Quality Assurance Officer Responsible for coordinating development and implementation of JMA’s QA program. Responsible for writing and maintaining QAPPs and monitoring its implementation. Responsible for maintaining records of QAPP distribution, including appendices and amendments. Ensures the data collected for the project is of known and acceptable quality and adheres to the specifications of the QAPP. Responsible for maintaining written records of sub-

Section A Revision No. 0
September 26, 2007 Page 12
TMDLQAPPRevision0
tier commitment to requirements specified in this QAPP. Responsible for identifying, receiving, and maintaining project quality assurance records. Responsible for compiling and submitting the QA report. Responsible for coordinating with the TCEQ QAS to resolve QA-related issues. Notifies the JMA Project Manager and TCEQ Project Manager of particular circumstances which may adversely affect the quality of data. Coordinates the research and review of technical QA material and data related to water quality monitoring system design and analytical techniques. Conducts assessments of participating organizations during the life of the project as noted in Section C1. Implements or ensures implementation of corrective actions needed to resolve nonconformance noted during assessments. Steve Grychka North Water District Laboratory Services, Inc. JMA Project Team Laboratory Manager Responsible for supervision of laboratory personnel involved in generating analytical data for the project. Responsible for ensuring that laboratory personnel involved in generating analytical data have adequate training and a thorough knowledge of the QAPP and all SOPs specific to the analyses or task performed and/or supervised. Responsible for oversight of all laboratory operations ensuring that all QA/QC requirements are met, documentation related to the analysis is complete and adequately maintained, and that results are reported accurately. Responsible for ensuring that corrective actions are implemented, documented, reported and verified. Steve Grychka North Water District Laboratory Services, Inc. JMA Project Team Laboratory Quality Assurance Officer Monitors the implementation of the QAM/QAP within the laboratory to ensure complete compliance with project data quality objectives as defined by the contract and in the QAPP. Conducts in-house audits to ensure compliance with written SOPs and to identify potential problems. Responsible for supervising and verifying all aspects of the QA/QC in the laboratory. Performs validation and verification of data before the report is sent to the primary contractor. Ensures that all QA reviews are conducted in a timely manner from real-time review at the bench during analysis to final pass-off of data to the QA Officer. Thierry Tamers Source Molecular Corporation, Inc. JMA Project Team Microbial Source Tracking Laboratory Manager Responsible for supervision of laboratory personnel involved in generating MST data for the project. Responsible for ensuring that laboratory personnel involved in generating analytical data have adequate training and a thorough knowledge of the QAPP and all SOPs specific to the analyses or task performed and/or supervised. Responsible for oversight of all laboratory operations ensuring that all QA/QC requirements are met, documentation related to the analysis is complete and adequately maintained, and that results are reported accurately. Responsible for ensuring that corrective actions are implemented, documented, reported and verified.

Section A Revision No. 0
September 26, 2007 Page 13
TMDLQAPPRevision0
Thierry Tamers Source Molecular Corporation, Inc. JMA Project Team Microbial Source Tracking Laboratory Quality Assurance Officer Monitors the implementation of the QAM/QAP within the laboratory to ensure complete compliance with project data quality objectives as defined by the contract and in the QAPP. Conducts in-house audits to ensure compliance with written SOPs and to identify potential problems. Responsible for supervising and verifying all aspects of the QA/QC in the laboratory. Performs validation and verification of data before the report is sent to the primary contractor. Ensures that all QA reviews are conducted in a timely manner from real-time review at the bench during analysis to final pass-off of data to the QA Officer. Dan Obenour JMA Data Manager Responsible for the acquisition, verification, and transfer of data to the TCEQ TMDL Project Manager. Oversees data management for the project. Performs data quality assurances prior to transfer of data to TCEQ in the format specified in the SWQM Data Management Reference Guide (2003) or most recent version. Ensures that the data review checklist is completed and data is submitted with appropriate codes. Provides the point of contact for the TCEQ TMDL Project Manager to resolve issues related to the data and assumes responsibility for the correction of any data errors. Al Capps JMA Project Team Field Supervisor Responsible for supervising all aspects of the sampling and measurement of surface waters and other parameters in the field. Responsible for the collection of water samples and field data measurements in a timely manner that meet the quality objectives specified in Section A7 (Table A7.1), as well as the requirements of Sections B1 through B8. Responsible for field scheduling, staffing, and ensuring that staff is appropriately trained. When monitoring activities include TCEQ entities the field supervisor shall coordinate with the TCEQ Project Manager. Reports status, problems, and progress to JMA Project Manager.

Section A Revision No. 0
September 26, 2007 Page 14
TMDLQAPPRevision0
Figure A4.1 Organization Chart A5 PROBLEM DEFINITION/BACKGROUND Section 303(d) of the Federal Clean Water Act and U.S. Environmental Protection Agency (EPA) regulation 40 CFR 130.7 require states to identify water bodies that do not meet, or are not expected to meet, applicable water quality standards. The compilation of subject water bodies is known as the 303(d) list. Each state must assign priorities to water bodies on the list, in order to schedule development of total maximum daily loads (TMDLs). The TMDL is an allocation of point and nonpoint source pollutant loadings that will enable the water body to meet water quality standards. The TCEQ selected several waterbodies in the Lake Houston watershed for assessment of water quality. The waterbodies were placed on the 303(d) list for elevated levels of E. coli bacteria.
A
l Faith Hambleton TCEQ TMDL
Program Manager
Casey Johnson TCEQ TMDL
Project Manager
Kerry Niemann TCEQ TMDL Data Manager
TCEQ DM&QA Data Manager
Kyle Girten TCEQ QAS
TCEQ FOD Reg. _
TMDL Staff
Dr. James Miertschin JMA, Inc.
JMA Project Team Project Manager
Steve Grychka NWDLS
JMA Project Team Lab Manager and Lab QAO
Dan Obenour JMA Project Team
Data Manager
Al Capps JMA Project Team
QAO
Al Capps JMA Project Team
Field Supervisor
Thierry Tamers Source Molecular Corp., Inc.MST Lab Mangager and Lab
QAO
Section A Revision No. 0
September 26, 2007 Page 15
TMDLQAPPRevision0
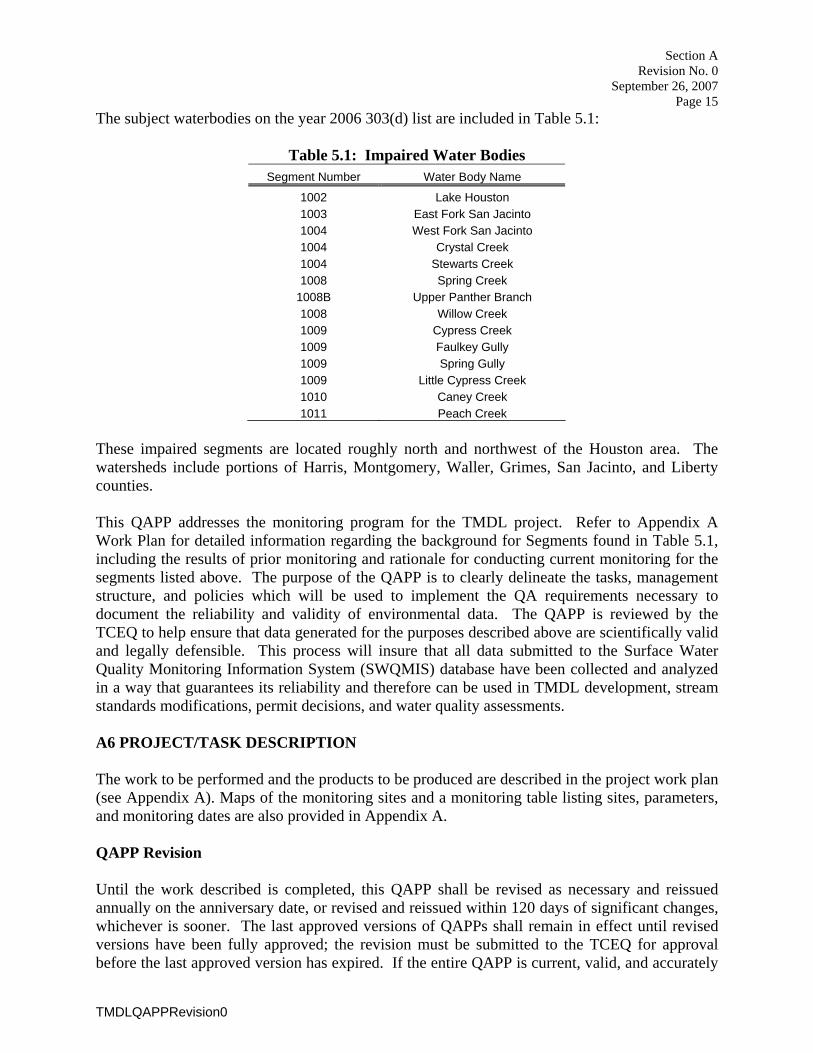
The subject waterbodies on the year 2006 303(d) list are included in Table 5.1:
Table 5.1: Impaired Water Bodies Segment Number Water Body Name
1002 Lake Houston 1003 East Fork San Jacinto 1004 West Fork San Jacinto 1004 Crystal Creek 1004 Stewarts Creek 1008 Spring Creek
1008B Upper Panther Branch 1008 Willow Creek 1009 Cypress Creek 1009 Faulkey Gully 1009 Spring Gully 1009 Little Cypress Creek 1010 Caney Creek 1011 Peach Creek
These impaired segments are located roughly north and northwest of the Houston area. The watersheds include portions of Harris, Montgomery, Waller, Grimes, San Jacinto, and Liberty counties. This QAPP addresses the monitoring program for the TMDL project. Refer to Appendix A Work Plan for detailed information regarding the background for Segments found in Table 5.1, including the results of prior monitoring and rationale for conducting current monitoring for the segments listed above. The purpose of the QAPP is to clearly delineate the tasks, management structure, and policies which will be used to implement the QA requirements necessary to document the reliability and validity of environmental data. The QAPP is reviewed by the TCEQ to help ensure that data generated for the purposes described above are scientifically valid and legally defensible. This process will insure that all data submitted to the Surface Water Quality Monitoring Information System (SWQMIS) database have been collected and analyzed in a way that guarantees its reliability and therefore can be used in TMDL development, stream standards modifications, permit decisions, and water quality assessments. A6 PROJECT/TASK DESCRIPTION The work to be performed and the products to be produced are described in the project work plan (see Appendix A). Maps of the monitoring sites and a monitoring table listing sites, parameters, and monitoring dates are also provided in Appendix A. QAPP Revision Until the work described is completed, this QAPP shall be revised as necessary and reissued annually on the anniversary date, or revised and reissued within 120 days of significant changes, whichever is sooner. The last approved versions of QAPPs shall remain in effect until revised versions have been fully approved; the revision must be submitted to the TCEQ for approval before the last approved version has expired. If the entire QAPP is current, valid, and accurately

Section A Revision No. 0
September 26, 2007 Page 16
TMDLQAPPRevision0
reflects the project goals and the organization’s policy, the annual re-issuance may be done by a certification that the plan is current. This can be accomplished by submitting a cover letter stating the status of the QAPP and a copy of new, signed approval pages for the QAPP. Amendments Amendments to the QAPP may be necessary to reflect changes in project organization, tasks, schedules, objectives and methods; address deficiencies and nonconformances; improve operational efficiency; and/or accommodate unique or unanticipated circumstances. Requests for amendments are directed from the JMA Project Manager to the TCEQ TMDL Project Manager in writing using the TMDL QAPP Amendment form. The changes are effective immediately upon approval by the TCEQ TMDL Project Manager and Quality Assurance Specialist, or their designees, and the EPA Project Officer (if applicable). Amendments to the QAPP and the reasons for the changes will be documented, and copies of the approved QAPP Amendment form will be distributed to all individuals on the QAPP distribution list by the JMA Project Team QAO. Amendments shall be reviewed, approved, and incorporated into a revised QAPP during the annual revision process or within 120 days of the initial approval in cases of significant changes. A7 QUALITY OBJECTIVES AND CRITERIA The project objective is to collect data that complies with TCEQ’s Guidance for Assessing Texas Surface and Finished Drinking Water Quality Data for surface water quality monitoring programs, and which may be used to support decisions related to TMDL development, stream standards modifications, permit decisions, and water quality assessments. The measurement performance specifications to support the project objective are specified in Table A7.1. The QAPP is reviewed by the TCEQ to help ensure that data generated for the purposes described herein are scientifically valid and legally defensible. This review process will also help ensure that data submitted to the SWQMIS database have been collected and analyzed in a way that guarantees its reliability. Only data collected that have a valid TCEQ parameter code assigned in Table A7.1 will be stored in SWQMIS. Any parameter listed in Table A7.1 that does not have a valid TCEQ parameter code assigned will not be stored in SWQMIS.

Section A Revision No. 0
September 26, 2007 Page 17
Table A7.1 - Measurement Performance Specifications PARAMETER UNITS METHOD PARAMETER
CODES AWRL Lab Limit of
Detection Recovery at Lab Limit of
Detection
PRECISION (RPD of
LCS/LCSD)
BIAS
(% Rec. LCS/LCSD mean)
Laboratory Performing
Analysis
Field Parameters
Conductivity uS/cm EPA 120.1and TCEQ SOP v1
00094 NA NA NA NA NA field
Temperature B C EPA 170.1and TCEQ SOP v1
00010 NA NA NA NA NA field
Flow cfs TCEQ SOP v1 00061 NA NA NA NA NA field
Chlorine Residual mg/L SM 4500-Cl G and TCEQ SOP v1
50060 0.10 NA NA NA NA field
PARAMETER UNITS METHOD PARAMETER CODES
AWRL Lab Limit of Detection
Recovery at Lab Limit of
Detection
PRECISION (RPD of
LCS/LCSD)
BIAS (% Rec. LCS/LCSD
mean)
Laboratory Performing
Analysis
Conventional Parameters
E. coli CFU/100 mL SM 9213D 31648*** 1.0 1.0 NA 3.27*∑Rlog/n* NA NWDLS
E. Coli CFU/100 mL EPA Method 1603** 31648*** 1.0 1.0 NA 3.27*∑Rlog/n* NA NWDLS
E. Coli CFU/100 mL SM 9222-D+SM9222-G 31700 1.0 1.0 NA 3.27*∑Rlog/n* NA NWDLS
E. coli, IDEXX Colilert MPN/100 mL SM 9223B 31699 1.0 1.0 NA 0.5* NA NWDLS
E. Coli CFU/100 g
SM 9123D; EPA Method 1603**; SM
922-D+SM922-G; SM 9223B
31702 1.0 1.0 NA 3.27*∑Rlog/n*; 0.5* NA SMI
*Based on range statistic as described in Standard Methods, 20th Edition, Section 9020-B, “QA/QC - Intralaboratory QC Guidelines.” **EPA Method 1603 EPA/821/R-02/023. September 2002. Escherichia coli in Water by Membrane Filtration Using Modified membrane-Thermotolerant Escherichia coli Agar (modified mTEC.). Web link to EPA Method 1603: http://epa.gov/waterscience/methods/biological/1603escherichiacoli.pdf *** New parameter codes will be requested prior to data submittal Note: Multiple methods for E. coli analyses are listed so that JMA has the flexibility to choose a method of analysis based on available sample collection media, lab analytical capability, etc. EPA Method 1603 will be the preferred method of E. Coli analysis. If EPA Method 1603 is unavailable, SM 9223B, SM922-D+SM922-G, or SM 9213D will be used in decreasing order of preference. References for Table A7.1: United States Environmental Protection Agency (USEPA), “Methods for Chemical Analysis of Water and Wastes,” Manual #EPA-600-4-79-020 American Public Health Association (APHA), American Water Works Association (AWWA), and Water Environment Federation (WEF), “Standard Methods for the Examination of Water and Wastewater,” 20th Edition, 1998 (NOTE: The 21st edition may be cited if it becomes available). TCEQ, 2003 (RG-415). Surface Water Quality Monitoring Procedures Volume 1: Physical and Chemical Monitoring Methods for Water, Sediment and Tissue, (December 2003).

Section A Revision No. 0
September 26, 2007 Page 18
TMDLQAPPRevision0
Ambient Water Reporting Limits and Laboratory Reporting Limits The laboratory will not perform Ambient Water Reporting Limits (AWRL) verification for E. coli tests. The AWRL for E. coli would nominally be 1 colony/100 ml. However, the actual reporting limit may vary from sample to sample depending upon the organism density and the dilutions employed for each sample. Precision Precision is the degree to which a set of observations or measurements of the same property, obtained under similar conditions, conform to themselves. It is a measure of agreement among replicate measurements of the same property, under prescribed similar conditions, and is an indication of random error. Laboratory precision is assessed by comparing replicate analyses of laboratory control samples in the sample matrix (e.g. deionized water, sediment, commercially available tissue) or sample/duplicate pairs in the case of bacteria analysis. Precision results are compared against measured performance specifications and used during evaluation of analytical performance. Program-defined measurement performance specifications for precision are defined in Table A7.1 Field splits are used to assess the variability of sample handling, preservation, and storage, as well as the analytical process, and are prepared by splitting samples in the field. Control limits for field splits are defined in Section B5. Bias Bias cannot be directly measured for bacterial samples. Bias will be assessed through the analysis of positive and negative controls. Representativeness Much of the data collected under the TMDL Program will be considered representative of ambient water quality conditions. This data will be coded with the Monitoring Type Code BF in Appendix A, Tables 3-1 to 3-18. BF reflects samples that cannot be precisely scheduled in advance because they target a certain flow condition that must be present in order for sample to be taken. Representativeness is a measure of how accurately a monitoring program reflects the actual water quality conditions. The representativeness of the data is dependent on 1) the sampling locations, 2) the number of samples collected, 3) the number of years and seasons when sampling is performed, 4) the number of depths sampled, and 5) the sampling procedures. Site selection and sampling of all pertinent media and use of only approved analytical methods will assure that the measurement data represents the conditions at the site.

Section A Revision No. 0
September 26, 2007 Page 19
TMDLQAPPRevision0
The goal for meeting total representation of the water body is tempered by the availability of time and funding. Representativeness will be measured with the completion of samples collected in accordance with the approved QAPP and sampling plan. Comparability Confidence in the comparability of data sets from this project and those for similar uses is based on the commitment of project staff to use only approved sampling and analysis methods and QA/QC protocols in accordance with quality system requirements and as described in this QAPP. Comparability is also guaranteed by reporting data in standard units, by using accepted rules for significant figures, and by reporting data in a standard format as specified in the Data Management Plan (Appendix E), SWQM DMRG, and other data reporting forms included in this QAPP. Completeness The completeness of the data is basically a relationship of how much of the data is available for use compared to the total potential data. Ideally, 100% of the data should be available. However, the possibility of unavailable data due to accidents, insufficient sample volume, broken or lost samples, etc. is to be expected. Therefore, it will be a general goal of the project(s) that 90% data completion is achieved. A8 SPECIAL TRAINING/CERTIFICATION Field personnel will receive training in proper sampling and field analysis. Before actual sampling or field analysis occurs, they will demonstrate to the JMA Project Team QA Officer their ability to properly calibrate field equipment and perform field sampling and analysis procedures. Training will be documented and retained in the JMA Project Team personnel file and be available during a monitoring systems audit. Contractors and subcontractors must ensure that laboratories analyzing samples under this QAPP meet the requirements contained in section 5.4.4 of the NELAC standards (concerning Review of Requests, Tenders, and Contracts). Laboratory analysts have a combination of experience, education, and training to demonstrate knowledge of their function. Global Positioning System (GPS) training and certification are required in accordance with TCEQ Operating Policies 8.12: Global Positioning System. Certification can be obtained by: 1) completing an agency training class, 2) completing a suitable training class offered by an outside vendor, or 3) by providing documentation of sufficient GPS expertise and experience.
Section A Revision No. 0
September 26, 2007 Page 20
TMDLQAPPRevision0
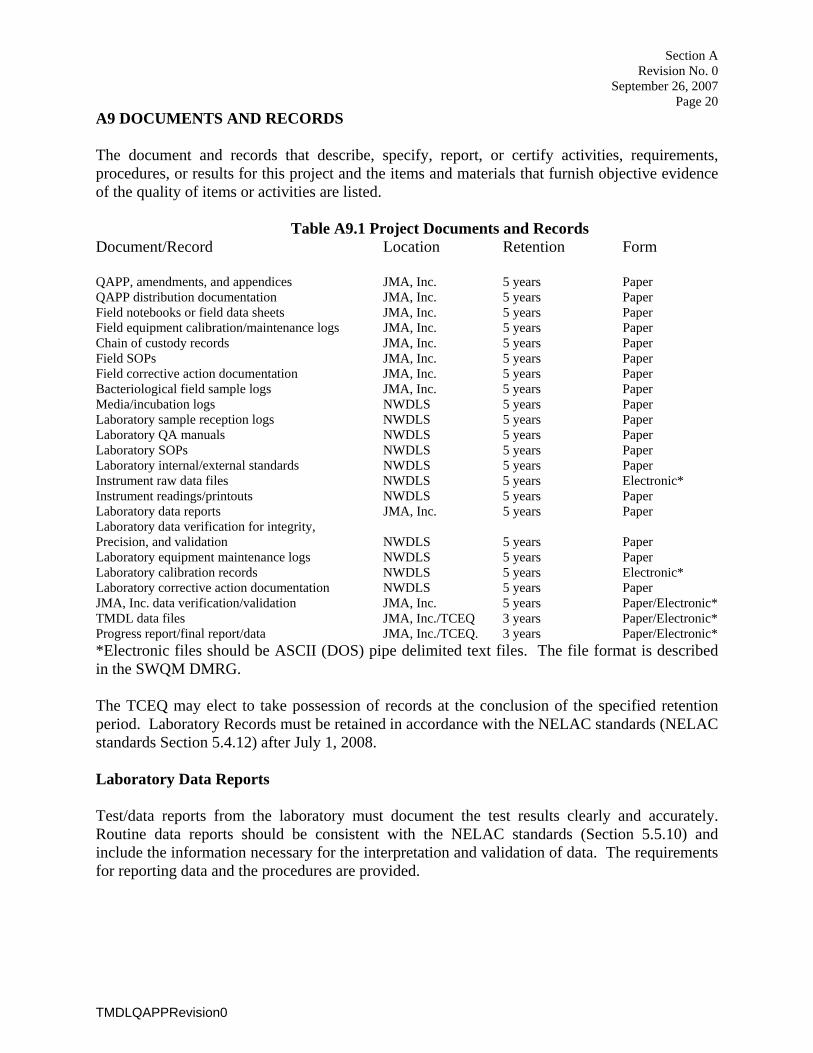
A9 DOCUMENTS AND RECORDS The document and records that describe, specify, report, or certify activities, requirements, procedures, or results for this project and the items and materials that furnish objective evidence of the quality of items or activities are listed.
Table A9.1 Project Documents and Records Document/Record Location Retention Form QAPP, amendments, and appendices JMA, Inc. 5 years Paper QAPP distribution documentation JMA, Inc. 5 years Paper Field notebooks or field data sheets JMA, Inc. 5 years Paper Field equipment calibration/maintenance logs JMA, Inc. 5 years Paper Chain of custody records JMA, Inc. 5 years Paper Field SOPs JMA, Inc. 5 years Paper Field corrective action documentation JMA, Inc. 5 years Paper Bacteriological field sample logs JMA, Inc. 5 years Paper Media/incubation logs NWDLS 5 years Paper Laboratory sample reception logs NWDLS 5 years Paper Laboratory QA manuals NWDLS 5 years Paper Laboratory SOPs NWDLS 5 years Paper Laboratory internal/external standards NWDLS 5 years Paper Instrument raw data files NWDLS 5 years Electronic* Instrument readings/printouts NWDLS 5 years Paper Laboratory data reports JMA, Inc. 5 years Paper Laboratory data verification for integrity, Precision, and validation NWDLS 5 years Paper Laboratory equipment maintenance logs NWDLS 5 years Paper Laboratory calibration records NWDLS 5 years Electronic* Laboratory corrective action documentation NWDLS 5 years Paper JMA, Inc. data verification/validation JMA, Inc. 5 years Paper/Electronic* TMDL data files JMA, Inc./TCEQ 3 years Paper/Electronic* Progress report/final report/data JMA, Inc./TCEQ. 3 years Paper/Electronic* *Electronic files should be ASCII (DOS) pipe delimited text files. The file format is described in the SWQM DMRG. The TCEQ may elect to take possession of records at the conclusion of the specified retention period. Laboratory Records must be retained in accordance with the NELAC standards (NELAC standards Section 5.4.12) after July 1, 2008. Laboratory Data Reports Test/data reports from the laboratory must document the test results clearly and accurately. Routine data reports should be consistent with the NELAC standards (Section 5.5.10) and include the information necessary for the interpretation and validation of data. The requirements for reporting data and the procedures are provided.

Section A Revision No. 0
September 26, 2007 Page 21
TMDLQAPPRevision0
The test report will include the information necessary for the interpretation and validation of data and will include the following: C project/report title C name and address of the laboratory C name and address of the client C a clear identification of the sample(s) analyzed C identification of samples that did not meet QA requirements and why (i.e., holding times
exceeded) C date of sample receipt C narrative information on QC failures or deviations from requirements that may affect the
quality of results. C sample results C units of measure C sample matrix C dry weight or wet weight (as applicable) C station information C date of collection C sample depth C LOQ and LOD, and qualification of results outside the working range (if applicable) C Certification of NELAC compliance on a result by result basis Electronic Data The JMA Project Team will use the electronic data reporting formats included in the most recent version of the SWQM Data Management Reference Guide. A completed data review checklist (see Appendix F) will accompany each set of electronic data. References TCEQ, 2007, (or most recent version). Surface Water Quality Monitoring Data Management Reference Guide. (March 2007) http://www.tceq.state.tx.us/compliance/monitoring/water/quality/data/wdma/dmrg_index.html TCEQ, 2003 (or most recent version). Surface Water Quality Monitoring Procedures Volume 1: Physical and Chemical Monitoring Methods for Water, Sediments and Tissue (March 2003) TCEQ, 2006. Program Guidance & Reference Guide FY 2007-2008, Texas Clean Rivers Program. Warning: When references are made to documents that are not attached to the QAPP, the Project Manager/QAO of the Lead Organization should assume responsibility for compliance of the documentation with the procedures and requirements set forth in the QAPP.

Section B Revision No. 0
September 26, 2007 Page 22
TMDLQAPPRevision0
B1 SAMPLING PROCESS DESIGN See Appendix A for sampling process design and monitoring schedule associated with data collected under this QAPP. B2 SAMPLING METHODS The JMA Project Team will follow the field sampling procedures documented for field and biological parameters documented in TCEQ Surface Water Quality Monitoring Procedures Volume 1: Physical and Chemical Monitoring Methods for Water, Sediment and Tissue (December 2003) and the TCEQ Receiving Water Assessment Procedures Manual (TCEQ, 1999b). Water samples will be collected directly in sterile polyurethane and/or glass bottles or Whirlpak bags for bacterial analysis, or they may be collected with decontaminated buckets or dippers and transferred to the sample container. Additional procedures for field sampling outlined in this section reflect specific requirements for sampling under the TMDL Project and/or provide additional clarification. Field Sampling Procedures The JMA Project Team will follow the field sampling procedures documented in the TCEQ Surface Water Quality Monitoring Procedures Volume 1: Physical and Chemical Monitoring Methods for Water, Sediment and Tissue (2003) and Volume 2: Methods for Collecting and analyzing Biological Community and Habitat Data (2005). Additional procedures for field sampling outlined in this section reflect specific requirements for sampling under this TMDL Project and/or provide additional clarification. These additional procedures must be consistent with TCEQ field sampling procedures.

Section B Revision No. 0
September 26, 2007 Page 23
TMDLQAPPRevision0
Sample Volume, Container Types, Minimum Sample Volume, Preservation Requirements, and Holding Time Requirements.
Table B2.1 Field Sampling and Handling Procedures
Parameter Matrix Container Preservation Sample Volume Holding Time
Temperature (probe) Water N/A N/A N/A N/A
Conductivity (probe) Water N/A N/A N/A N/A
Flow Water N/A N/A N/A N/A
Residual Chlorine Water N/A N/A N/A N/A
E. Coli Water Polyurethane or glass bottle, or Whirlpak bag
4º C, dark, sodium thiosulfate1 100-250 mL 6+2 hrs2
E. coli, IDEXX Colilert
Water Polyurethane or glass bottle, or Whirlpak bags
4º C, dark, sodium thiosulfate1 400 mL 6+2 hrs2
E. coli Sed. Polyurethane or glass bottle, or Whirlpak bags
4º C, dark, sodium thiosulfate1 100-250 ml 6+2 hrs2
1 Sodium thiosulfate will be used if residual chlorine is suspected to be present 2 This holding time represents 6 field hours and 2 lab hours Sample Containers Sample containers are purchased pre-cleaned and pre-sterilized for bacteriological samples. Either polyurethane or glass bottles or Whirlpak bags are used for bacteriological samples. Sterilized bottles may be purchased with a sodium thisulfate tablet added to each. This dechlorination agent then is present in case the collected sample contains residual chlorine. Alternatively, a 1% sodium thiosulfate tablet will be added if residual chlorine is suspected to be present. Processes to Prevent Cross Contamination The TCEQ Surface Water Quality Monitoring Procedures Volume 1: Physical and Chemical Monitoring Methods for Water, Sediment and Tissue (2003) outlines the necessary steps to prevent cross-contamination of samples. These may include direct collection into sample containers, when possible. Field QC samples as discussed in Section B5 are collected to verify that cross-contamination has not occurred. Documentation of Field Sampling Activities Field sampling activities are documented on field data sheets as presented in Appendix C. Flow work sheets, multi-probe calibration records, and records of bacteria analyses (if applicable) are part of the field data record. For all visits, station ID, location, sampling time, sampling date, sampling depth, preservatives added to samples and sample collector’s name/signature are recorded. Values for all measured field parameters are also recorded. Detailed observational data are recorded including water appearance, weather, biological activity, stream uses, unusual

Section B Revision No. 0
September 26, 2007 Page 24
TMDLQAPPRevision0
odors, specific sample information, missing parameters (items that were to have been sampled that day, but weren’t), days since last significant rainfall, and flow severity. Recording Data For the purposes of this section and subsequent sections, all field and laboratory personnel follow the basic rules for recording information as documented below: 1. Legible writing in indelible, waterproof ink with no modifications, write-overs or cross-
outs; 2. Correction of errors with a single line followed by an initial and date; 3. Close-outs on incomplete pages with an initialed and dated diagonal line. Deviations from Sampling Method Requirements or Sample Design, and Corrective Action Examples of deviations from sampling method requirements or sample design include but are not limited to such things as inadequate sample volume due to spillage or container leaks, failure to preserve samples appropriately, contamination of a sample bottle during collection, storage temperature and holding time exceedance, sampling at the wrong site, etc. Any deviations will invalidate resulting data and may require corrective action. Corrective action may include for samples to be discarded and re-collected. It is the responsibility of the JMA Project Manager, in consultation with the JMA QAO, to ensure that the actions and resolutions to the problems are documented and that records are maintained in accordance with this QAPP. In addition, these actions and resolutions will be conveyed to the TMDL Project Manager both verbally and in writing in the project progress reports and by completion of a corrective action report (CAR). Corrective Action Reports document: root cause(s); programmatic impact(s); specific corrective action(s) to address any deviations; action(s) to prevent recurrence; individual(s) responsible for each action; the timetable for completion of each action; and the means by which completion of each corrective action will be documented. CARs will be included with project progress reports. In addition, significant conditions (i.e., situations which, if uncorrected, could have a serious effect on safety or on the validity or integrity of data) will be reported to the TCEQ immediately both verbally and in writing. B3 SAMPLE HANDLING AND CUSTODY Chain-of -Custody Proper sample handling and custody procedures ensure the custody and integrity of samples beginning at the time of sampling and continuing through transport, sample receipt, preparation, and analysis. A sample is in custody if it is in actual physical possession or in a secured area that is restricted to authorized personnel. The COC form is used to document sample handling during transfer from the field to the laboratory and among contractors. The list of items below is included on the COC form (See Appendix D for sample form).

Section B Revision No. 0
September 26, 2007 Page 25
TMDLQAPPRevision0
1. Date and time of sample collection, shipping and receiving 2. Site identification 3. Sample matrix 4. Number of containers 5. Preservative used or if the sample was filtered 6. Analyses required 7. Name of collector 8. Custody transfer signatures and dates and time of transfer 9. Name of laboratory admitting the sample 10. Bill of lading (if applicable) Sample Labeling Samples are labeled on the container with an indelible, waterproof marker. Label information includes the site identification, the date and time of sampling, sample type (e.g., conventional water parameters, organics), the preservative added if applicable. Sample Handling EC analysis in water Sterile polyurethane or glass bottles or Whirlpak bags will be used to collect the E. coli samples. If residual chloride is suspected to be present sodium thiosulfate tablets will be used in the sampling containers. Samples will be sealed and carried in ice chests from the point of collection to the laboratory or delivered by a laboratory representative. The laboratory data manager will receive a copy of the COC and will log in the samples at the laboratory including both time of collection and time of reception of each sample, as well as the temperature measured from a temperature blank. If the temperature exceeds 4 C, the lab will document if wet ice is present. If ice is present, the temperature could be attributed to a short hold time that did not allow the samples to cool to 4º C. Samples will be acceptable if they were placed on ice immediately after collection and remain on wet ice upon receipt by the laboratory. Sample preparation will be initiated within eight hours after the sample is collected. To insure that the holding time criterion is met, the laboratory data manager will receive a copy of the COC and will log in the samples at the laboratory including both time of collection and time of reception of each sample. EC analysis in sediment Sterile polyurethane or glass bottles or Whirlpak bags will be used to collect sediment samples. Samples will be sealed and carried in ice chests from the point of collection to NWDLS, or a representative from the lab will meet the sampling crew in the field and deliver the samples to the lab. The laboratory data manager will receive a copy of the COC and will log in the samples at the laboratory including both time of collection and time of reception of each sample, as well as the temperature measured from the temperature blank. The indirect enumeration of microorganisms from a sediment sample will involve transferring the organisms from the sample into a water phase. The sediment-to-water transference will start as soon as possible after the

Section B Revision No. 0
September 26, 2007 Page 26
TMDLQAPPRevision0
samples are logged in at the laboratory but in all cases in less than eight hours after sample collection. Failures in Chain-of-Custody and Corrective Action All failures associated with chain-of-custody procedures as described in this QAPP are immediately reported to the JMA Project Manager. These include such items as delays in transfer, resulting in holding time violations; violations of sample preservation requirements; incomplete documentation, including signatures; possible tampering of samples; broken or spilled samples, etc. The JMA Project Manager in consultation with the JMA QAO will determine if the procedural violation may have compromised the validity of the resulting data. Any failures that have reasonable potential to compromise data validity will invalidate data and the sampling event should be repeated. The resolution of the situation will be reported to the TCEQ TMDL Project Manager in the project progress report. Corrective action reports will be prepared by the JMA QAO and submitted to TCEQ TMDL Project Manager along with project progress report. Corrective Action Reports (CARs) document: root cause(s); programmatic impact(s); specific corrective action(s) to address any deviations; action(s) to prevent recurrence; individual(s) responsible for each action; the timetable for completion of each action; and the means by which completion of each corrective action will be documented. CARs will be included with project progress reports. In addition, significant conditions (i.e., situations which, if uncorrected, could have a serious effect on safety or on the validity or integrity of data) will be reported to the TCEQ immediately both verbally and in writing. B4 ANALYTICAL METHODS The analytical methods are listed in Table A7.1 of Section A7. Procedures for laboratory analysis will be in accordance with the most recently published edition of Standard Methods for the Examination of Water and Wastewater, the latest version of the TCEQ Surface Water Quality Monitoring Procedures Volume 1: Physical and Chemical Monitoring Methods for Water, Sediment and Tissue (2003), Volume 2: Methods for Collecting and Analyzing Biological Community and Habitat Data (2005), 40 CFR 136, or other reliable procedures acceptable to TCEQ. Laboratories collecting data under this QAPP are, at a minimum, compliant with ISO/IEC Guide 25 and will be NELAC accredited by July 1, 2008. Copies of laboratory SOPs are retained by the JMA Project Team and are available for review by the TCEQ. Laboratory SOPs are consistent with EPA requirements as specified in the method. Standards Traceability All standards used in the field and laboratory are traceable to certified reference materials. Standards preparation is fully documented and maintained in a standards log book. Each documentation includes information concerning the standard identification, starting materials, including concentration, amount used and lot number, date prepared, expiration date and

Section B Revision No. 0
September 26, 2007 Page 27
TMDLQAPPRevision0
preparer’s initials or signature. The reagent bottle will be labeled in a way that will trace the reagent back to preparation. Analytical Method Modification Only data generated using approved analytical methodologies as specified in this QAPP will be submitted to the TCEQ. Requests for method modifications will be documented on form TCEQ-10364, the TCEQ Application for Analytical Method Modification, and submitted for approval to the TCEQ Quality Assurance Section. Work will only begin after the modified procedures have been approved. Failures in Measurement Systems and Corrective Actions Failures in field and laboratory measurement systems involve, but are not limited to such things as instrument malfunctions, failures in calibration, blank contamination, quality control samples outside QAPP defined limits, etc. In many cases, the field technician or lab analyst will be able to correct the problem. If the problem is resolvable by the field technician or lab analyst, then they will document the problem on the field data sheet or laboratory record and complete the analysis. If the problem is not resolvable, then it is conveyed to the JMA Laboratory Supervisor, who will make the determination and notify the JMA QAO. If the analytical system failure may compromise the sample results, the resulting data will not be reported to the TCEQ as part of this study. The nature and disposition of the problem is reported on the data report which is sent to the JMA Project Manager. The JMA Project Manager will include this information in the CAR and submit with the Progress Report which is sent to the TCEQ TMDL Project Manager. Corrective Action Reports document: root cause(s); programmatic impact(s); specific corrective action(s) to address any deviations; action(s) to prevent recurrence; individual(s) responsible for each action; the timetable for completion of each action; and the means by which completion of each corrective action will be documented. CARs will be included with project progress reports. In addition, significant conditions (i.e., situations which, if uncorrected, could have a serious effect on safety or on the validity or integrity of data) will be reported to the TCEQ immediately both verbally and in writing. B5 QUALITY CONTROL Sampling Quality Control Requirements and Acceptability Criteria The minimum Field QC Requirements are outlined in the TCEQ Surface Water Quality Monitoring Procedures Volume 1: Physical and Chemical Monitoring Methods for Water, Sediment and Tissue (2003) and Volume 2: Methods for Collecting and analyzing Biological Community and Habitat Data (2005). Specific requirements are outlined below. Field QC samples are reported with the laboratory data report (See Section A9 and C2). Field splits - A field split is a single sample subdivided by field staff immediately following collection and submitted to the laboratory as two separate, identified samples according to procedures specified in the SWQM Procedures. Split samples are preserved, handled, shipped,
Section B Revision No. 0
September 26, 2007 Page 28
TMDLQAPPRevision0
and analyzed identically and are used to assess variability in all of these processes. Field splits apply to conventional samples only and are collected on a 10% basis or one per batch, whichever is greater. The precision of field split results is calculated by relative percent difference (RPD) using the following equation: RPD ={ (X1 - X2)/ §(X1+X2)/2¨ }* 100 For bacteria, the logarithms of the actual counts are used in this formula. Field splits will be collected at a frequency of 10% or greater. Laboratory Measurement Quality Control Requirements and Acceptability Criteria Detailed laboratory QC requirements are contained within each individual method and laboratory quality assurance manuals (QAMs). The minimum requirements that all participants abide by are stated below. Lab QC sample results are reported with the laboratory data report (see Section C2 and A9). Laboratory duplicate - Laboratory duplicates are used to assess precision. A laboratory duplicate is prepared by splitting aliquots of a single sample (or a matrix spike or a laboratory control standard) in the laboratory. Both samples are carried through the entire preparation and analytical process. Laboratory duplicates are run at a rate of one per batch. Acceptability criteria are outlined in Table A7.1 of Section A7. A bacteriological duplicate is considered to be a special type of laboratory duplicate and applies when bacteriological samples are run in the field as well as in the laboratory. Bacteriological duplicate analyses are performed on samples from the sample bottle on a 10% basis. Results of bacteriological duplicates are evaluated by calculating the logarithm of each result and determining the range of each pair. Performance limits and control charts are used to determine the acceptability of duplicate analyses. Precision limits for bacteriological analyses are defined in Table A7.1 and applies to samples with concentrations >10 org/100 ml. Method Blank - A method blank is an analyte-free matrix to which all reagents are added in the same volumes or proportions as used in the sample processing and analyzed with each batch. The method blank is carried through the complete sample preparation and analytical procedure. The method blank is used to document contamination from the analytical process. The analysis of method blanks should yield values less than the laboratory’s reporting limit. For very high level analyses, blank value should be less than 5% of the lowest value of the batch or corrective action will be implemented. Control Cultures – Each new lot of modified mTEC media is tested with positive control cultures (known E. coli) to verify that it supports growth of E. coli, and negative control cultures (known non-E. coli bacteria) to ensure the selectivity of the media.
Section B Revision No. 0
September 26, 2007 Page 29
TMDLQAPPRevision0
Colony Verification – For initial test of analyst capability, and with each new batch of media, ten red or magenta presumed E. coli colonies from one or more completed tests are verified as E. coli through procedures described in this method. Failures in Quality Control and Corrective Action Sampling QC excursions are evaluated by the JMA Project Manager, in consultation with the JMA QAO. In that differences in sample results are used to assess the entire sampling process, including environmental variability, the arbitrary rejection of results based on pre-determined limits is not practical. Therefore, the professional judgment of the JMA Project Manager and QAO will be relied upon in evaluating results. Rejecting sample results based on wide variability is a possibility. Notations of field split excursions and blank contamination are noted in the quarterly report and the final QC Report. Corrective action will involve identification of the cause of the failure where possible. Response actions will typically include re-analysis of questionable samples. In some cases, a site may have to be re-sampled to achieve project goals. Laboratory measurement quality control failures are evaluated by the laboratory staff. The disposition of such failures and conveyance to the TCEQ is discussed in Section B4 under Failures in Measurement Systems and Corrective Actions. Corrective Action Reports document: root cause(s); programmatic impact(s); specific corrective action(s) to address any deviations; action(s) to prevent recurrence; individual(s) responsible for each action; the timetable for completion of each action; and the means by which completion of each corrective action will be documented. CARs will be included with project progress reports. In addition, significant conditions (i.e., situations which, if uncorrected, could have a serious effect on safety or on the validity or integrity of data) will be reported to the TCEQ immediately both verbally and in writing. B6 INSTRUMENT/EQUIPMENT TESTING, INSPECTION AND MAINTENANCE All sampling equipment testing and maintenance requirements are detailed in the TCEQ Surface Water Quality Monitoring Procedures. Sampling equipment is inspected and tested upon receipt and is assured appropriate for use. Equipment records are kept on all field equipment and a supply of critical spare parts is maintained by the JMA Field Supervisor, or designee. All laboratory tools, gauges, instrument, and equipment testing and maintenance requirements are contained within laboratory QAM(s). Instruments requiring daily or in-use testing may include, but are not limited to, water baths, ovens, autoclaves, incubators, refrigerators, and laboratory pure water. Critical spare parts for essential equipment are maintained to prevent downtime. Testing and maintenance records are available for inspection by the TCEQ. The JMA Project Manager assumes responsibility for compliance of the QAM Quality Assurance Management Plan from the laboratory with the QAPP requirements.

Section B Revision No. 0
September 26, 2007 Page 30
TMDLQAPPRevision0
B7 INSTRUMENT/EQUIPMENT CALIBRATION AND FREQUENCY Field equipment calibration requirements are contained in the TCEQ Surface Water Quality Monitoring Procedures. Post calibration error limits and the disposition resulting from error are adhered to. Data not meeting post-error limit requirements invalidates associated data collected subsequent to the pre-calibration and are not submitted to the TCEQ. Detailed laboratory calibrations are contained within the QAM(s). The laboratory QAM identifies all tools, gauges, instruments, and other sampling, measuring, and test equipment used for data collection activities affecting quality that must be controlled and, at specified periods, calibrated to maintain bias within specified limits. Calibration records are maintained, are traceable to the instrument, and are available for inspection by the TCEQ. Equipment requiring periodic calibrations includes, but is not limited to, thermometers, pH meters, balances, incubators, turbidity meters, and analytical instruments. B8 INSPECTION/ACCEPTANCE OF SUPPLIES AND CONSUMABLES All new batches of field and laboratory supplies are inspected and tested before use to ensure that they are adequate and not contaminated. Acceptance criteria are detailed in supplier’s purchasing manual. The laboratory QAM provides additional details on the acceptance requirements for laboratory supplies and consumables. B9 NON-DIRECT MEASUREMENTS Only data collected directly under this QAPP will be submitted to the SWQMIS database. Sampling conducted by the TCEQ, the USGS, Texas Clean Rivers Program partners, and Texas Watch quality-assured volunteer monitors is not covered under this QAPP and will not be reported to the TCEQ Data Manager by the JMA. However, data collected by the above organizations that meet the data quality objectives of this project may be useful in satisfying the data and informational needs of the TMDL. The collection and qualification of the TCEQ and USGS data are addressed in the TCEQ Surface Water Quality Monitoring QAPP. The collection and qualification of the Texas CRP data are addressed in the Texas Clean Rivers Program QAPP. The collection and qualification of the Texas Watch volunteer monitoring data are addressed in the Southwest Texas State University Texas Watch QAPP. B10 DATA MANAGEMENT Data Management Protocols are addressed in the Data Management Plan which is in Appendix E of this document.
Section B Revision No. 0
September 26, 2007 Page 31
TMDLQAPPRevision0
References TCEQ, 2007, (or most recent version). Surface Water Quality Monitoring Data Management Reference Guide. (March 2007) http://www.tceq.state.tx.us/compliance/monitoring/water/quality/data/wdma/dmrg_index.html TCEQ, 2003 (or most recent version). Surface Water Quality Monitoring Procedures Volume 1: Physical and Chemical Monitoring Methods for Water, Sediments and Tissue (March 2003). TCEQ, 1999c. Receiving Water Assessment Procedures Manual, GI-253 (June 1999). Warning: When references are made to documents that are not attached to the QAPP, the Project Manager/QAO of JMA should assume responsibility for compliance of the documentation with the procedures and requirements set forth in the QAPP.

Section C Revision No. 0
September 26, 2007 Page 32
TMDLQAPPRevision0
C1 ASSESSMENTS AND RESPONSE ACTIONS The following table presents types of assessments and response action for data collection activities applicable to the QAPP.
Table C1.1 Assessments and Response Actions
Assessment Activity
Approximate Schedule
Responsible Party
Scope Response Requirements
Status Monitoring Oversight, etc.
Continuous JMA
Project Manager
Monitoring of the project status and records to
ensure requirements are being fulfilled. Monitoring
and review of contract laboratory performance
and data quality
Report to TCEQ in Quarterly Report.
Ensure project requirements are being fulfilled.
Dates to be determined by the TCEQ lab
inspector
TCEQ Laboratory Inspector
30 days to respond in writing to the TCEQ to address corrective actions
Laboratory Inspections
Annually NWDLS
QAO
Analytical and quality control procedures
employed at the laboratory and the contract laboratory
Implements corrective action. Inspection Report will be available
for review by TCEQ
Dates to be determined by
TCEQ
TCEQ QAS 30 days to respond in writing to the TCEQ to address corrective actions
Monitoring Systems Audit
Annually JMA
QAO
Field sampling, handling and measurement; facility
review; and data management as they relate
to the TMDL Project Report sent to TCEQ Project
Manager. Resolves any deficiencies.

Section C Revision No. 0
September 26, 2007 Page 33
TMDLQAPPRevision0
Corrective Action The JMA Project Manager is responsible for implementing and tracking corrective action procedures as a result of audit findings. Records of audit findings and corrective actions are maintained by the TCEQ Project Manager and JMA Quality Assurance Officer. Corrective action documentation will be submitted to the TCEQ TMDL Project Manager with the progress report. If audit findings and corrective actions cannot be resolved, then the authority and responsibility for terminating work is specified in agreements or contracts between participating organizations. C2 REPORTS TO MANAGEMENT Laboratory Data Reports Laboratory data reports contain the results of all specified QC measures listed in section B5, including but not limited to laboratory blanks and laboratory duplicates. This information is reviewed by the JMA QAO and compared to the pre-specified acceptance criteria to determine acceptability of data before forwarding to the JMA Project Manager. This information is available for inspection by the TCEQ. Reports to TCEQ Project Management All reports detailed in this section are contract deliverables and are transferred to the TCEQ in accordance with contract requirements. Monthly Progress Report - Summarizes the JMA activities for each task; reports problems, delays, and corrective actions; and outlines the status of each task’s deliverables. Monitoring Systems Review Audit Report and Response - Following any audit performed by the JMA, a report of findings, recommendations and responses are sent to the TCEQ project manager in the quarterly/monthly progress report. Reports by TCEQ Project Management Contractor Evaluation - The JMA is evaluated in a Contractor Evaluation by the TCEQ annually for compliance with administrative and programmatic standards. Results of the evaluation are submitted to the TCEQ Financial Administration Division, Procurements and Contracts Section.

Section D Revision No. 0
September 26, 2007 Page 34
TMDLQAPPRevision0
D1 DATA REVIEW, VERIFICATION AND VALIDATION For the purposes of this document, verification refers to the processes taken to determine compliance of data with project requirements, including documentation and technical criteria. Validation means those processes taken independently of the data-generation processes to determine the usability of data for its intended use(s). Integrity means the processes taken to assure that no falsified data will be reported. All data obtained from field and laboratory measurements will be reviewed and verified for conformance to project requirements, and then validated against the data quality objectives which are listed in Section A7. Only those data which are supported by appropriate quality control data and meet the data quality objectives defined for this project will be considered acceptable. This data will be submitted to the TCEQ for entry into the SWQMIS database. The procedures for verification and validation of data are described in Section D2, below. The JMA Field Supervisor is responsible for ensuring that field data are properly reviewed and verified for integrity. The Laboratory Supervisor is responsible for ensuring that laboratory data are scientifically valid, defensible, of acceptable precision and accuracy, and reviewed for integrity. The JMA Data Manager will be responsible for ensuring that all data are properly reviewed and verified, and submitted in the required format as described in the latest version of the SWQM Data Management Reference Guide to the TCEQ Project Manager. Finally, the JMA Project Manager, with the concurrence of the JMA QAO, are responsible for validating that all data to be reported meet the objectives of the project and are suitable for reporting to TCEQ. D2 VERIFICATION AND VALIDATION METHODS All field and laboratory data will be reviewed, verified and validated to ensure they conform to project specifications and meet the conditions of end use as described in Section A7. The staff and management of the respective field, laboratory, and data management tasks are responsible for the integrity, validation and verification of the data each task generates or handles throughout each process. The field and laboratory tasks ensure the verification of raw data, electronically generated data, and data on chain-of-custody forms and hard copy output from instruments. Verification, validation and integrity review of data will be performed using self-assessments and peer review, as appropriate to the project task, followed by technical review by the manager of the task. The data to be verified (listed by task in Table D2.1) are evaluated against project specifications (Section A7) and are checked for errors, especially errors in transcription, calculations, and data input. Potential outliers are identified by examination for unreasonable data, or identified using computer-based statistical software. If a question arises or an error or potential outlier is identified, the manager of the task responsible for generating the data is contacted to resolve the issue. Issues which can be corrected are corrected and documented electronically or by initialing and dating the associated paperwork. If an issue cannot be corrected, the task manager consults with higher level project management to establish the appropriate course of action, or the data associated with the issue are rejected. The performance of these tasks is documented by completion of the data review checklist (Appendix F) by the JMA Data Manager.

Section D Revision No. 0
September 26, 2007 Page 35
TMDLQAPPRevision0
The JMA Project Manager and QAO are each responsible for validating that the verified data are scientifically valid, legally defensible, of known precision, accuracy, integrity, meet the data quality objectives of the project, and are reportable to TCEQ. One element of the validation process involves evaluating the data again for anomalies. The JMA QAO or Project Manager may designate other experienced water quality experts familiar with the water bodies under investigation to perform this evaluation. Any suspected errors or anomalous data must be addressed by the manager of the task associated with the data, before data validation can be completed. A second element of the validation process is consideration of any findings identified during the monitoring systems audit conducted by the JMA QAO or TCEQ QAS assigned to the project. Any issues requiring corrective action must be addressed, and the potential impact of these issues on previously collected data will be assessed. Finally, the JMA Project Manager, with the concurrence of the QAO validates that the data meet the data quality objectives of the project and are suitable for reporting to TCEQ.
Table D2.1 Data Verification Procedures Tasks
Responsible Entity/Individual
Field Data Review
Field data reviewed for conformance with data collection procedures, sample handling and chain of custody, analytical and QC requirements
JMA
Post calibrations checked to ensure compliance with error limits JMA
Field data calculated, reduced, and transcribed correctly JMA
Laboratory Data Review
Laboratory data reviewed for conformance with data collection, sample handling and chain of custody, analytical and QC requirements to include documentation, holding times, sample receipt, sample preparation, sample analysis, project and program QC results, and reporting
JMA and NWDLS
Laboratory data calculated, reduced, and transcribed correctly JMA and NWDLS
Reporting limits consistent with requirements for AWRLs JMA and NWDLS
Analytical data documentation evaluated for consistency, reasonableness and/or improper practices JMA and NWDLS
Analytical QC information evaluated to determine impact on individual analyses JMA and NWDLS
All laboratory samples analyzed for all parameters JMA and NWDLS
Data Set Review
The test report has all required information as described in Section A9 of the QAPP JMA
Confirmation that field and lab data have been reviewed JMA
Data set ( to include field and laboratory data) evaluated for reasonableness and if corollary data agree
JMA
Outliers confirmed and documented JMA

Section D Revision No. 0
September 26, 2007 Page 36
TMDLQAPPRevision0
Tasks
Responsible Entity/Individual
Field QC acceptable (e.g., field splits and trip, field and equipment blanks) JMA
Sampling and analytical data gaps checked and documented JMA
Verification and validation confirmed. Data meets conditions of end use and are reportable JMA D3 RECONCILIATION WITH USER REQUIREMENTS No decisions will be made by the project team based on the data collected. These data, and data collected by other organizations (e.g., USGS, TCEQ, etc.), may be subsequently analyzed and used by the TCEQ for TMDL development, stream standards modifications, permit decisions, and water quality assessments. Data which do not meet requirements will not be submitted to the SWQMIS nor will be considered appropriate for any of the uses noted above.

Appendix A Revision No. 0
September 26, 2007
TMDLQAPPRevision0
APPENDIX A. WORK PLAN
JAMES MIERTSCHIN & ASSOCIATES, INC. ENVIRONMENTAL ENGINEERING
P.O. BOX 162305 B AUSTIN, TEXAS 78716-2305 B (512) 327-2708
MONITORING PLAN LAKE HOUSTON WATERSHED BACTERIA TMDLS PROJECT
Prepared For:
TMDL Unit Texas Commission on Environmental Quality
Post Office Box 13087 Austin, Texas 78711-3087
Prepared By:
James Miertschin & Associates, Inc.
August 2007

MRPT07.DOC
ii
TABLE OF CONTENTS LIST OF FIGURES..................................................................................................................................................... iii LIST OF TABLES .......................................................................................................................................................iv 1.0 INTRODUCTION .....................................................................................................................................1 1.1 PROJECT AREAS ....................................................................................................................................1 1.2 OBJECTIVES AND SCOPE.....................................................................................................................2 1.3 BACKGROUND DATA ...........................................................................................................................2 2.0 STATION SELECTION............................................................................................................................4 3.0 MONITORING PLAN ............................................................................................................................18 3.1 MONITORING OBJECTIVES ...............................................................................................................18 3.2 MONITORING ACTIVITIES.................................................................................................................18 3.3 MONITORING LOCATIONS AND FREQUENCY..............................................................................22 4.1 TYPE OF SAMPLES ..............................................................................................................................41 4.2 METHODS OF COLLECTION..............................................................................................................41 4.2.1 FIELD MEASUREMENTS.....................................................................................................................41 4.2.2 SAMPLE COLLECTION AND HANDLING........................................................................................41 4.3 PARAMETERS .......................................................................................................................................42 4.4 MICROBIAL SOURCE TRACKING.....................................................................................................42 5.0 REFERENCES ........................................................................................................................................44
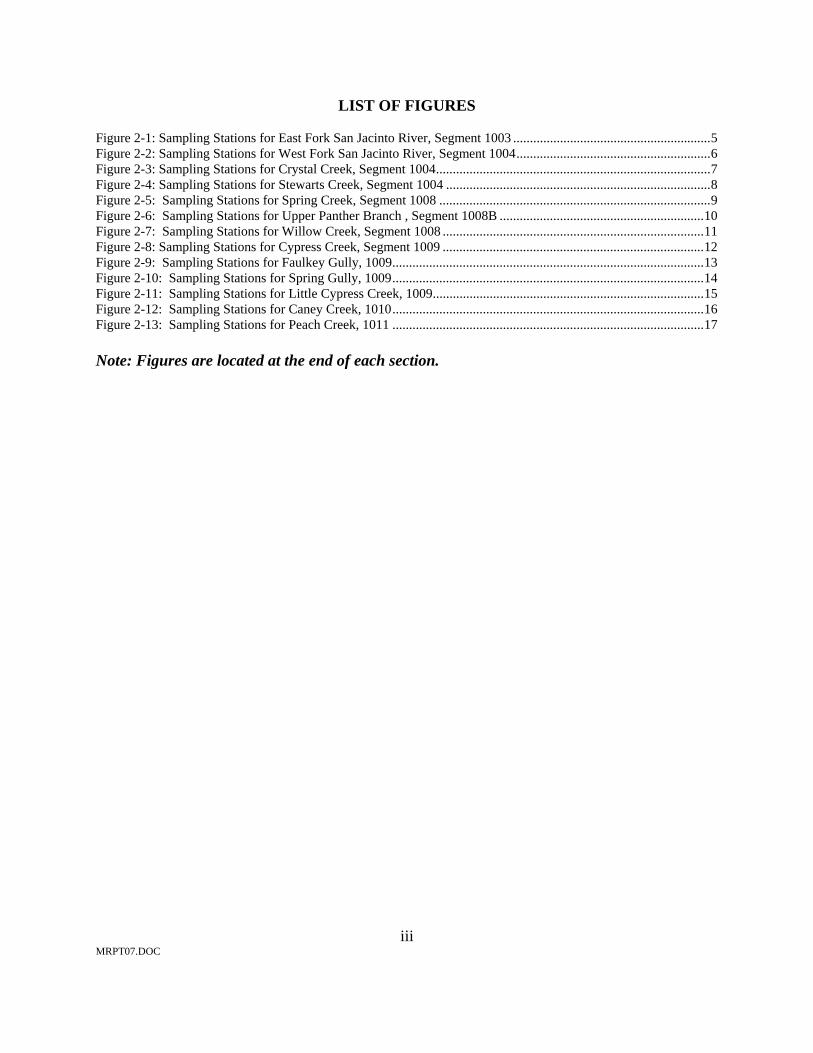
MRPT07.DOC
iii
LIST OF FIGURES Figure 2-1: Sampling Stations for East Fork San Jacinto River, Segment 1003 ...........................................................5 Figure 2-2: Sampling Stations for West Fork San Jacinto River, Segment 1004..........................................................6 Figure 2-3: Sampling Stations for Crystal Creek, Segment 1004..................................................................................7 Figure 2-4: Sampling Stations for Stewarts Creek, Segment 1004 ...............................................................................8 Figure 2-5: Sampling Stations for Spring Creek, Segment 1008 .................................................................................9 Figure 2-6: Sampling Stations for Upper Panther Branch , Segment 1008B .............................................................10 Figure 2-7: Sampling Stations for Willow Creek, Segment 1008 ..............................................................................11 Figure 2-8: Sampling Stations for Cypress Creek, Segment 1009 ..............................................................................12 Figure 2-9: Sampling Stations for Faulkey Gully, 1009.............................................................................................13 Figure 2-10: Sampling Stations for Spring Gully, 1009.............................................................................................14 Figure 2-11: Sampling Stations for Little Cypress Creek, 1009.................................................................................15 Figure 2-12: Sampling Stations for Caney Creek, 1010.............................................................................................16 Figure 2-13: Sampling Stations for Peach Creek, 1011 .............................................................................................17 Note: Figures are located at the end of each section.

MRPT07.DOC
iv
LIST OF TABLES
Table 1-1: Impaired Water Bodies ...............................................................................................................................1 Table 1-2: E. coli Data Summary .................................................................................................................................3 Table 3-1: 2007-2008 Monitoring Schedule for East Fork San Jacinto, Segment 1003 .............................................23 Table 3-2: 2007-2008 Monitoring Schedule for West Fork San Jacinto, Segment 1004............................................24 Table 3-3: 2007-2008 Monitoring Schedule for Crystal Creek, Segment 1004..........................................................25 Table 3-4: 2007-2008 Monitoring Schedule for Stewarts Creek, Segment 1004........................................................26 Table 3-5: 2007-2008 Monitoring Schedule for Spring Creek, Segment 1008...........................................................27 Table 3-6: 2007-2008 Monitoring Schedule for Upper Panther Branch, Segment 1008B..........................................28 Table 3-7: 2007-2008 Monitoring Schedule for Willow Creek, Segment 1008 .........................................................29 Table 3-8: 2007-2008 Monitoring Schedule for Cypress Creek, Segment 1009.........................................................30 Table 3-9: 2007-2008 Monitoring Schedule for Faulkey Gully, Segment 1009 .........................................................31 Table 3-10: 2007-2008 Monitoring Schedule for Spring Gully, Segment 1009 .........................................................32 Table 3-11: 2007-2008 Monitoring Schedule for Little Cypress Creek, Segment 1009 .............................................33 Table 3-12: 2007-2008 Monitoring Schedule for Caney Creek, Segment 1010 .........................................................34 Table 3-13: 2007-2008 Monitoring Schedule for Peach Creek, Segment 1011..........................................................35 Table 3-14: 2007-2008 Spatially-Intensive Source Sampling Schedule for East Fork San Jacinto River, Segment 1003 ...........................................................................................................................................36 Table 3-15: 2007-2008 Spatially-Intensive Source Sampling Schedule for Stewarts Creek, Segment 1004 .............37 Table 3-16: 2007-2008 Spatially-Intensive Source Sampling Schedule for Willow Creek, Segment 1008 ...............38 Table 3-17: 2007-2008 Spatially-Intensive Source Sampling Schedule for Spring Gully, Segment 1009 .................39 Table 3-18: 2007-2008 Wet Weather Point Source Sampling for Willow Creek, ......................................................40 Segment 1008 ..........................................................................................................................................40 Table 4-1: Sampling Parameters, Containers and Preservation...................................................................................42
MRPT07.DOC
1
1.0 INTRODUCTION Section 303(d) of the Federal Clean Water Act and U.S. Environmental Protection Agency (EPA) regulation 40 CFR 130.7 require states to identify waterbodies that do no meet, or are not expected to meet, applicable water quality standards. The compilation of subject waterbodies is known as the 303(d) list. Each state must assign priorities to waterbodies on the list, in order to schedule development of total maximum daily loads (TMDLs). The TMDL is an allocation of point and nonpoint source pollutant loadings that will enable the waterbody to meet water quality standards. The Texas Commission on Environmental Quality (TCEQ) is responsible for the monitoring and assessment of water quality to evaluate compliance with State water quality standards. Pursuant to the Clean Water Act, one of the areas of TCEQ responsibility is the development of the 303(d) list for Texas and subsequent development of TMDLs. 1.1 PROJECT AREAS The TCEQ selected several waterbodies in the Lake Houston watershed for assessment of water quality. The waterbodies were placed on the 303(d) list for elevated levels of E. coli bacteria. The subject waterbodies on the year 2006 303(d) list are included in table 1-1:
Table 1-1: Impaired Water Bodies Segment Number Water Body Name
1002 Lake Houston 1003 East Fork San Jacinto 1004 West Fork San Jacinto 1004 Crystal Creek 1004 Stewarts Creek 1008 Spring Creek
1008B Upper Panther Branch 1008 Willow Creek 1009 Cypress Creek 1009 Faulkey Gully 1009 Spring Gully 1009 Little Cypress Creek 1010 Caney Creek 1011 Peach Creek
These impaired segments are located roughly north and northwest of the Houston area. The watersheds include portions of Harris, Montgomery, Waller, Grimes, San Jacinto, and Liberty counties.

MRPT07.DOC
2
1.2 OBJECTIVES AND SCOPE The objective of this report is to prepare a monitoring plan for the study segments in order to provide additional water quality data for assessment purposes, provide data to support technical analysis of problems, identify potential sources of bacterial contamination, and support appropriate determination of bacterial loadings for establishment of TMDLs, as needed. 1.3 BACKGROUND DATA An overview of the available E. coli data for these segments was included in the Preliminary Data Review: Lake Houston Watershed Bacteria Impairments, developed by James Miertschin & Associates in August, 2007. As a general statement, all of the impaired segments had monitoring stations that showed exceedance of the geometric mean criterion for E. coli. A summary of segments, monitoring stations, number of E. coli samples, and geometric means is provided in Table 1-2. The study area segments generally have an adequate number of monitoring stations with sufficient data available to calculate geometric means of E. coli with confidence. On most segments, there are more than one monitoring station that demonstrate exceedance of the geometric mean criterion. But on some segments, there is only a single monitoring station that shows noncompliance. The spatial coverage of the routine monitoring stations appears to be sufficient to define the general extent of impairment for most segments, but most segments would benefit from additional spatial coverage. Preparation of preliminary load duration curves also indicates that the segments have generally good distribution of data over a range of hydrologic regimes. The E. coli data are adequate to quantify bacteria loads conveyed by the watercourse at the monitoring locations under different flow regimes. All of the study segments would benefit from additional sampling that is designed to identify and quantify the sources of bacteria. A variety of sampling activities are prescribed in order to provide the data needed to better define bacteria sources and source areas. These sampling activities are described in subsequent sections. No additional sampling is proposed in this project for Lake Houston Segment 1002. The monitoring station that indicated impairment has a large number of data points, and agency-sponsored monitoring is scheduled to continue on a frequent schedule. The additional sampling exercises proposed in this study for the major tributaries in the Lake Houston watershed are expected to provide data regarding potential sources of bacteria that enter the reservoir. If sampling crews encounter suspected sources of bacteria in the immediate vicinity of the reservoir, additional samples can be collected. Technical presentations to stakeholders during the project will provide an opportunity for the public to comment or note potential trouble spots.

MRPT07.DOC
3
Table 1-2: E. coli Data Summary Segment Sta. ID Monitoring Station Location Start Date End Date
Number of Samples
E.coli Geomean (org/100mL)
1002, Lake Houston11213 LAKE HOUSTON AT US 59 Jun-00 Jun-06 192 21118669 LAKE HOUSTON AT WEST LAKE HOUSTON PARKWAY Dec-01 May-05 278 10218667 LAKE HOUSTON WEST FORK SAN JACINTO Jun-00 May-05 57 92
1003, East Fork17431 E FK SAN JACINTO RIV AT SH 150 Mar-02 Jul-04 11 19714242 E.F. SAN JACINTO RIVER AT US59 Jun-00 Apr-05 39 19911235 E FK SAN JACINTO R AT FM 1485 Jun-00 May-05 86 198
1004, West Fork11251 W FORK SAN JACINTO R AT SH 105 Jun-00 Apr-05 41 6911250 W FK SAN JACINTO AT FM 2854 Oct-04 Jul-06 8 17816626 STEWARTS CREEK AT SH LOOP 336 Jun-00 Apr-05 91 22916624 W FK SAN JACINTO RIV AT SH 242 Jun-00 Apr-05 41 17016635 CRYSTAL CREEK AT SH 242 Jun-00 Apr-05 89 164
1008, Spring Creek11323 SPRING CREEK AT DECKER PRAIRIE Jan-02 May-05 41 34611314 SPRING CREEK AT SH 249 Jun-00 Apr-05 39 35117489 SPRING CREEK AT KUYKENDAHL RD Jan-02 May-05 42 43211185 WILLOW CREEK AT GOSLING ROAD Jan-02 May-05 41 48311313 SPRING CREEK BRIDGE AT IH45 Jun-00 Apr-05 40 27111312 SPRING CREEK AT RILEY FUZZEL RD Dec-01 May-05 42 370
1008B, Panther Branch System (Spring Creek)16629 UPB UPSTREAM OF WWTP 2 OUTFALL Oct-02 Jul-05 12 14116630 UPB DOWNSTREAM OF WWTP 2 Oct-02 Jul-05 12 200
1008C, Lower Panther Branch System16627 L PANTHER BR OF SAWDUST RD Oct-02 Jul-05 12 17716628 L PANTHER BR DOWNSTREAM WWTP 1 Oct-02 Jul-05 12 179
1008E, Bear Branch System16631 BEAR BRANCH AT RESEARCH FOREST Mar-99 Jul-05 18 202
1008F, Lake Woodlands16484 LK WOODLANDS AT NORTH END Oct-02 Jul-05 12 5316483 LK WOODLANDS AT MID POINT Oct-02 Jul-05 12 3916481 LK WOODLANDS AT WESTERN REACH Oct-02 Jul-05 12 6716482 LK WOODLANDS AT SOUTH END Oct-02 Jul-05 12 65
1009, Cypress Creek11333 CYPRESS CREEK AT HOUSE HAHL ROAD Jan-02 May-05 41 29114159 LITTLE CYPRESS CREEK AT KLUGE RD Jan-02 May-05 41 58911332 CYPRESS CREEK AT GRANT ROAD Jan-01 May-06 61 40517496 FAULKEY GULLY AT LAKEWOOD FOREST DR Jan-02 May-05 42 55511331 CYPRESS CREEK AT SH 249 Jun-00 Apr-05 41 57311330 CYPRESS CK AT STEUBNER AIRLINE Jan-02 May-05 42 64217481 SPRING GULLY AT SPRING CREEK OAK Jan-02 May-05 42 59711328 CYPRESS CREEK AT IH 45 Jun-00 May-05 100 53311324 CYPRESS CREEK AT CYPRESSWOOD DR Jan-02 Jun-06 22 470
1010, Caney Creek14241 CANEY CREEK AT SH 105 Jun-00 Apr-05 45 26411335 CANEY CREEK UPSTRM OF FM 2090 Dec-02 Jun-04 9 11911334 CANEY CREEK AT FM 1485 Jun-00 May-06 101 196
1011, Peach Creek11338 PEACH CREEK AT SH 105 Dec-02 Jun-04 9 8616625 PEACH CREEK AT OLD HWY 105 Jun-00 Apr-05 41 11811337 PEACH CREEK AT FM 2090 Dec-02 Jun-04 9 14111336 PEACH CREEK AT FM 1485 Jun-00 May-05 93 23617746 PEACH CREEK AT LAKE HOUSTON SP Oct-03 Jul-06 10 189

MRPT07.DOC
4
2.0 STATION SELECTION In order to achieve the desired objectives several stations have been identified in each of the impaired study segments in this monitoring plan. The project’s monitoring activities include the following major activities, each discussed in more detail in Section 4.0:
• Synoptic water sampling • Spatially-intensive source sampling • Wet-weather point source sampling
Monitoring sites were selected for the study area using a variety of criteria, including the following:
• Sites representative of in-stream conditions • Sites selected to maximize stream spatial coverage • Sites include documented impaired reaches • Sites include any historical sampling stations • Sites on major tributaries, as needed • Sites at outfalls of selected representative wastewater treatment plants • Sites with accessibility
The synoptic water sampling will occur at a comprehensive network of stations to characterize conditions within the mainstem, major tributaries, and wastewater treatment plant effluents on each study segment. This network of stations is described in detail in Section 3.0. Maps showing the locations of proposed monitoring locations are provided in Figures 2-1 through 2-13. The station locations are described further in Tables 3-1 through 3-13 in Section 3.0. The spatially-intensive source sampling surveys will take place on four segments: the upper East Fork San Jacinto, Segment 1003; Stewarts Creek, Segment 1004; Willow Creek, Segment 1008; and Spring Gully, Segment 1009. On each segment, a comprehensive network of sampling stations will be visited to describe conditions on the mainstem, major tributaries, and wastewater treatment plant effluents. The network of stations is described generally in Section 3.0. The maps shown in Figure 2-1 for the East Fork San Jacinto, Figure 2-4 for Stewarts Creek, Figure 2-7 for Willow Creek, and Figure 2-10 for the Spring Gully synoptic surveys indicate some of the locations that will be sampled in the spatially-intensive source studies. Additional locations, however, will be determined in the field and are not known at the present time. For example, if a drainage outfall pipe is discovered in any portion of the segment, a sample will be collected. The wet-weather point source sampling will take place on wastewater treatment plant outfalls located in the Willow Creek (Segment 1008) watershed. This network of stations is described in Section 3.0. The map shown in Figure 2-7 for the Willow Creek synoptic survey shows the locations of all permitted point sources discharging to the segment.

MRPT07.DOC
5
Figure 2-1: Sampling Stations for East Fork San Jacinto River, Segment 1003

MRPT07.DOC
6
Figure 2-2: Sampling Stations for West Fork San Jacinto River, Segment 1004

MRPT07.DOC
7
Figure 2-3: Sampling Stations for Crystal Creek, Segment 1004

MRPT07.DOC
8
Figure 2-4: Sampling Stations for Stewarts Creek, Segment 1004

MRPT07.DOC
9
Figure 2-5: Sampling Stations for Spring Creek, Segment 1008

MRPT07.DOC
10
Figure 2-6: Sampling Stations for Upper Panther Branch , Segment 1008B

MRPT07.DOC
11
Figure 2-7: Sampling Stations for Willow Creek, Segment 1008

MRPT07.DOC
12
Figure 2-8: Sampling Stations for Cypress Creek, Segment 1009
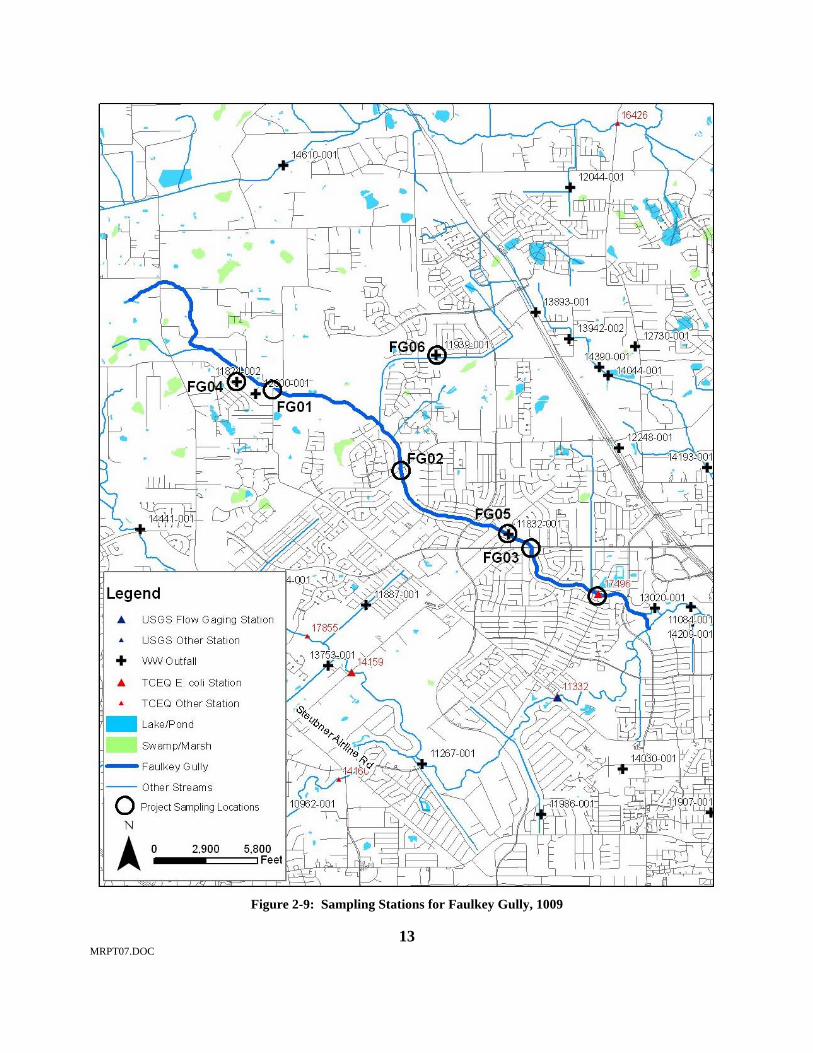
MRPT07.DOC
13
Figure 2-9: Sampling Stations for Faulkey Gully, 1009

MRPT07.DOC
14
Figure 2-10: Sampling Stations for Spring Gully, 1009

MRPT07.DOC
15
Figure 2-11: Sampling Stations for Little Cypress Creek, 1009

MRPT07.DOC
16
Figure 2-12: Sampling Stations for Caney Creek, 1010
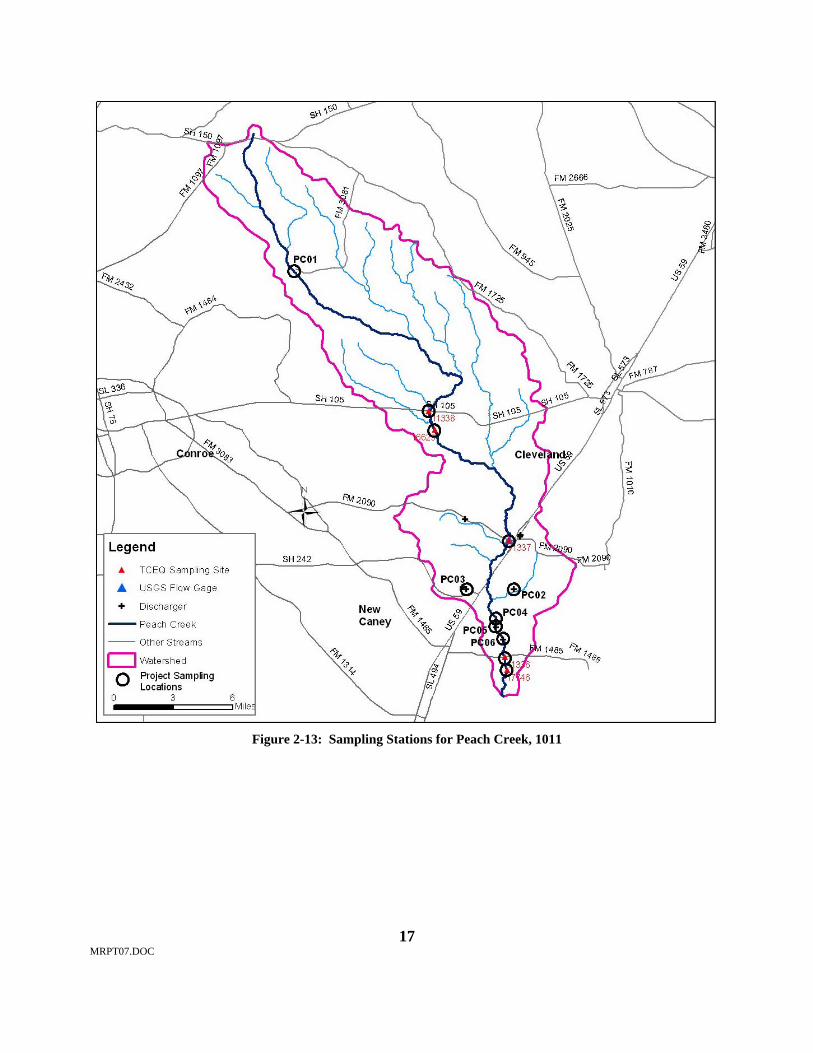
MRPT07.DOC
17
Figure 2-13: Sampling Stations for Peach Creek, 1011

MRPT07.DOC
18
• Ascertain source areas, extent of impairment
• Baseflow priority • Include full spatial extent of
segment • Routine monitoring stations and
additional sites • Include representative point sources• Ascertain longitudinal trends in E.
coli concentrations
3.0 MONITORING PLAN 3.1 MONITORING OBJECTIVES There are multiple objectives embodied in the strategy for sampling. The overall objective is to conduct the monitoring activities necessary to provide:
(i) better definition of the water quality conditions on the study segments with respect to bacterial indicators,
(ii) definition of source areas or loading points that contribute to conditions in the segment,
(iii) data sufficient for estimation of loadings and support of allocation activities. As discussed previously, sufficient bacteria data does not exist to identify and quantify the various sources of bacteria contributing to the study segments. In preparation for TMDL development, additional sampling will be completed. This additional sampling will provide data to expand available databases and will provide information to assist in estimation of bacteria source loadings. Sampling activities prescribed to provide additional data are described in a subsequent section. Additional data should also be available as sampling is conducted by local agencies at routine monitoring sites. 3.2 MONITORING ACTIVITIES The monitoring plan for the study segments will include the following activities. All of the thirteen impaired segments will be scheduled for two Synoptic Sampling Surveys. Four of the impaired segments, East Fork San Jacinto (Segment 1003), Stewarts Creek (Segment 1004), Willow Creek (Segment 1008), and Spring Gully (Segment 1009), will be scheduled for Spatially-Intensive Source Sampling. One of the impaired segments, Willow Creek (Segment 1008) will be scheduled for Wet-Weather Point Source Sampling. Synoptic Sampling Surveys The primary objective of synoptic sampling surveys would be to identify general source areas of bacteria loading to the stream system. Synoptic sampling involves the occupation of a comprehensive network of stations along the longitudinal extent of a segment, sufficient to provide spatial coverage in order to track longitudinal trends and changes in constituent concentration in an upstream to downstream direction. Major tributary and selected point source contributors (where accessible) may also be sampled. This type of monitoring will dictate that samples be collected under a specific hydrologic regime, namely, baseflow conditions. The selection of baseflow conditions is based on the fact that the study area
MRPT07.DOC
19
• Evaluate sediment as a potential bacteria source
• Baseflow conditions • Selected locations • Sediment sampling at varying distance
from stream bed
• Evaluate specific source locations in detail
• Baseflow conditions • selected segments: urban • Numerous sampling points, eg, 1000-ft
intervals • Sample pipes, outfalls, tributaries • Test for bacteria, optical brighteners • Extrapolate to general study area
watercourses demonstrate impairment by bacteria indicators under baseflow conditions, as well as under high flow conditions. Sampling under baseflow conditions presents a realistic opportunity to define specific reaches of the streams, tributaries, or point sources that are contributing bacteria. In an ideal situation, additional sampling surveys would also be conducted under runoff conditions, but it is a foregone conclusion that bacteria concentrations will be elevated from land-based sources under runoff conditions. Therefore, if funding is limited, it appears that more value will be derived from baseline sampling where the potential exists to identify sources with more specificity. Two synoptic sampling surveys will be conducted under baseflow conditions on each study segment. It is recognized that “baseflow” in these study areas may be influenced to a certain degree by the frequent rainfall patterns in the area. The general schedule for these events will most probably range from October 2007 to July 2008. Sampling activities will commence once the Quality Assurance Project Plan (QAPP) is approved by TCEQ. Spatially-Intensive Source Studies
The spatially-intensive studies will be designed to cover a relatively small watershed with numerous sampling points to better define potential sources of bacteria. Four watersheds have been selected for spatially intensive studies: the upper East Fork San Jacinto River Segment 1003, representing a largely undeveloped area; Stewarts Creek Segment 1004, representing an urbanized area without permitted wastewater treatment facility discharges; Willow Creek Segment 1008, representing both a relatively rural area with septic systems and an urbanized area with
numerous permitted wastewater treatment facilities; and Spring Gully Segment 1009, representing an urbanized area with a few permitted wastewater treatment facilities. On the study watersheds, sampling personnel will travel by foot (or boat) along the study reach, pulling samples at some nominal interval, say approximately 1000-ft, or wherever a tributary or outfall pipe joins with the stream. Water samples will be tested for E. coli concentration. Testing for optical brighteners will also be conducted using portable instrumentation. The optical brightner data may provide an indication of the presence of domestic wastewater, with particular relevance in areas served by onsite septic treatment systems. This detailed sampling exercise will enable a high level of definition regarding actual sources that are active at the time of sampling. Sediment Source Studies
Keen interest has been expressed in past studies regarding the role of sediment as a source of bacteria in impaired waterbodies. A sediment source study will be conducted in conjunction with each Spatially-

MRPT07.DOC
20
• Evaluate regrowth of bacteria from point sources
• Baseflow conditions • Selected locations • In situ bacteria kinetic rates
• Evaluate resuspension of bed sediments as bacteria source
• Baseflow conditions • Selected locations • Disturb sediment over defined area • Track bacteria in water column over 1-2
days
Intensive study (upper East Fork San Jacinto, Stewarts Creek, Willow Creek, and Spring Gully) to provide additional information and data regarding this potential source of bacteria. The sediment source studies will involve collection of sediments within the stream bed and at radial distances from the edge of water. For example, at a specific station, one sample will be collected from the wet streambed sediments, one sample will be collected from the wet edge-of-water region, and dry sediment samples will be collected at distances of 1 ft, 3 ft, 10 ft, and 50 ft from the waterline. Samples will be analyzed in the laboratory by mixing a measured weight of sediment with buffered water, mixing, then determining bacteria concentrations. The bacteria data will be transformed to organism counts per unit weight (dry) of sediment. Sediment characteristics of texture and grain size will be determined. The sediment studies will be conducted on each of the four segments selected for spatially intensive sampling.
Resuspension Study The resuspension of sediments that have been previously deposited on a stream bottom is often targeted as a potential source of bacteria loadings in impaired segments. The objective of the resuspension study would be to quantify the concentration of bacteria that can be potentially released from the sediment upon disturbance, then determine the gross fate of the resuspended bacteria. Two sites have been selected for the experiment, in conjunction with Spatially-Intensive studies: Willow Creek and Spring Gully. A defined area of the streambed will be vigorously disturbed by raking, in order to resuspend the upper layer of deposited sediment. The bacteria concentration in the water column will be defined immediately after disturbance by sampling. At the time of disturbance, dye will be released as a hydrodynamic tracer. The resultant sediment plume will be tracked downstream and sampled periodically for bacteria concentration. This exercise will enable determination of the magnitude and fate of resuspended bacteria. It may be determined, for example, that the resuspended bacteria summarily die-off by settling and or ultraviolet deactivation at a typical first-order decay rate. Alternately, it may be determined that resuspended bacteria populations continue to increase with transport downstream, signaling a regrowth phenomenon. Kinetics Study Bacteria regrowth in the stream environment has been hypothesized in previous bacteria studies. The existence/absence of regrowth of bacteria from municipal effluent discharges has received particular attention. Special studies will be conducted at one location on Willow Creek and at one location on Spring Gully, in conjunction with Spatially-Intensive Studies, to provide additional information and data regarding this aspect of bacteria transport. Chambers of
MRPT07.DOC
21
• Estimate point source loads under wet weather conditions
• Sample 10-30 WWTPs at outfall pipes • Sample receiving stream at downstream
monitoring station • Estimate total event loading of bacteria
from point sources • Estimate proportion of total stream
loading derived from point sources
• Conduct sampling and testing for qPCR
• Test for human presence/absence • Test raw wastewater samples • Rapid turn-around of results may guide
additional testing • One baseline survey
discharged effluent, or effluent in combination with receiving water, will be set up within the stream environment, maintained intact, and tested at regular intervals for bacteria concentrations. A similar approach has been utilized in previous studies of bacteria kinetics (JMA, 2005). Regular testing of these in situ chambers will demonstrate that bacteria numbers either increase or decrease with time subsequent to discharge. Chambers can also be placed at selected distances downstream of outfalls to define kinetic properties. Wet Weather Point Source Sampling There is often considerable debate among stakeholders regarding the contribution of bacteria from point sources under wet weather conditions. While the discharge of bacteria from point sources would normally be expected to be controlled by disinfection unit processes included in the treatment plant, problems may arise during wet weather conditions due to increased inflow to the facility. The increased inflow may impair the capabilities of the disinfection process, and in some situations, may enable solids containing bacteria to be discharged. Sampling will be conducted on one of the impaired segments, Willow Creek Segment 1008, to determine the actual discharge bacteria concentrations from wastewater treatment plants under wet weather conditions. A representative number of plants will be selected for sampling, since it would be impractical to sample every municipal point source. The logistics of coordination with operators and owners of treatment facilities is a handicap for wet weather event sampling, since there is often very little advance warning or notification time available. Therefore, sampling of wastewater treatment plants under this exercise will be conducted at the discharge points that are accessible outside of the fenced boundaries of the facilities. For example, an outlet pipe that conveys discharged effluent to the receiving stream will be a logical, accessible point for sampling. Sampling at such outlets will provide data to define the bacteria load entering the stream, accounting for any potential concentration changes between the treatment plant and the end of the pipe. Regular sampling will also be performed at a downstream monitoring station within each watershed for comparison to the point source data. By extrapolation, the collected bacteria data should enable an estimate of the total bacteria load discharged by point sources in each watershed. This point source loading estimate can be compared directly to the corresponding loading estimate within the receiving stream measured during the same wet weather event. Microbial Source Tracking Microbial source tracking (MST) will be utilized to provide an advanced degree of specificity regarding the identification of sources of bacterial indicators. MST results are expected to provide a substantial
MRPT07.DOC
22
benefit to identification of potential sources, in that emphasis could be placed upon the specific sources identified. Application of some newer non-library MST technology and approaches is recommended for the proposed study. Methods based upon two tests specific to human bacteria sources should be considered. One test is based on detection of Enterococcus faecium, which is a strain of Enterococcus genus specific to humans. These Enterococcus bacteria are able to survive for extended periods of time outside of the host. The other test is based on detection of strains of Bacteroidetes that are specific to humans. These Bacteroidetes are strict anaerobes that are indicative of recent fecal contamination because they cannot proliferate in soil or sediments. Both of these tests are analyzed using qPCR DNA technology. These tests are useful to identify or confirm that bacteria are attributable to human sources. This may be a key piece of information for this study area, with its proliferation of municipal wastewater treatment plants. The present scope for MST includes collection of one water sample at a monitoring station on Spring Gully in conjunction with the spatially intensive study. A sample from a wastewater treatment plant in the same watershed will also be tested. This effort will then focus upon a relatively small targeted watershed. If the resultant data proves useful, the sampling could be expanded to additional sites. 3.3 MONITORING LOCATIONS AND FREQUENCY Monitoring schedules for synoptic sampling of each segment are tables 3-1 to 3-13. Monitoring schedules for the Spatially-Intensive Source Studies are provided in Table 3-14 to 3-17 for the East Fork San Jacinto, Stewarts Creek, Willow Creek, and Spring Gully, respectively. A monitoring schedule for Wet Weather Point Source Sampling of Willow Creek is provided in Table 3-18. Station IDs that begin with EFSJ, WFSJ, CrC, StC, SC, UPB, WC, CyC, FG, SG, LCC, CC, and PC do not coincide with TCEQ station IDs. Samples from these stations will not be submitted for inclusion in SWQMIS.
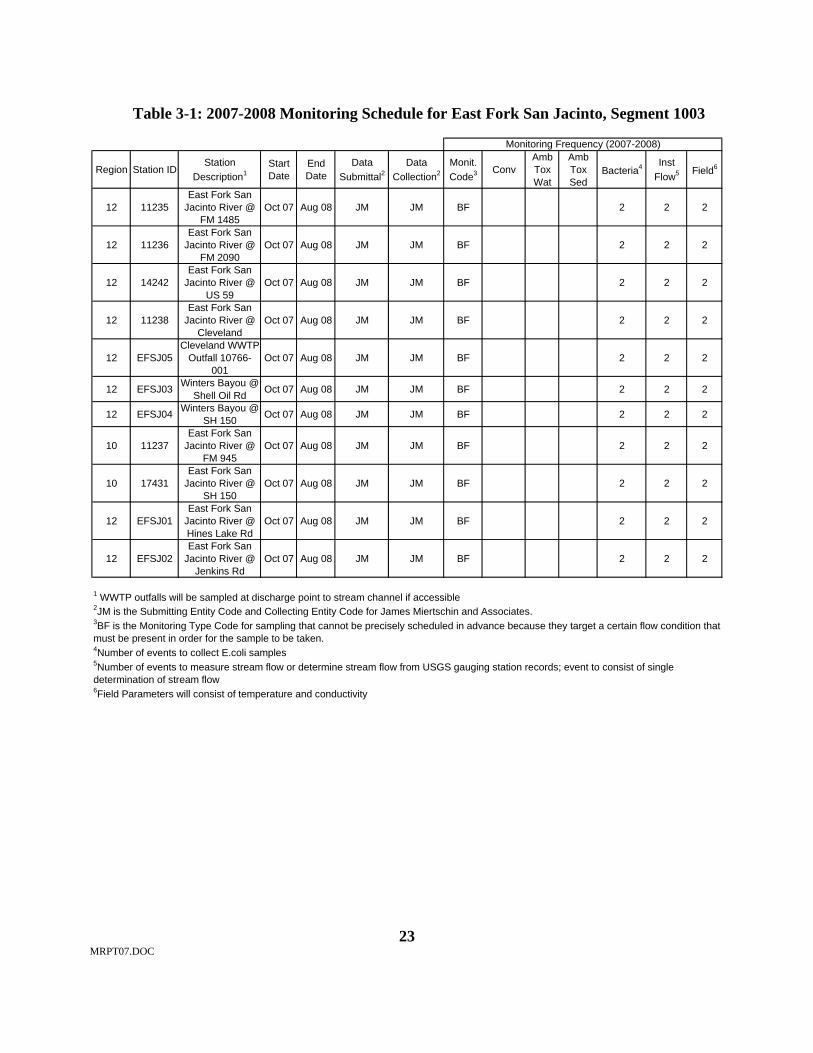
MRPT07.DOC
23
Table 3-1: 2007-2008 Monitoring Schedule for East Fork San Jacinto, Segment 1003
Region Station IDStation
Description1Start Date
End Date
Data Submittal2
Data Collection2
Monit. Code3 Conv
Amb Tox Wat
Amb Tox Sed
Bacteria4 Inst Flow5 Field6
12 11235East Fork San
Jacinto River @ FM 1485
Oct 07 Aug 08 JM JM BF 2 2 2
12 11236East Fork San
Jacinto River @ FM 2090
Oct 07 Aug 08 JM JM BF 2 2 2
12 14242East Fork San
Jacinto River @ US 59
Oct 07 Aug 08 JM JM BF 2 2 2
12 11238East Fork San
Jacinto River @ Cleveland
Oct 07 Aug 08 JM JM BF 2 2 2
12 EFSJ05Cleveland WWTP
Outfall 10766-001
Oct 07 Aug 08 JM JM BF 2 2 2
12 EFSJ03 Winters Bayou @ Shell Oil Rd Oct 07 Aug 08 JM JM BF 2 2 2
12 EFSJ04 Winters Bayou @ SH 150 Oct 07 Aug 08 JM JM BF 2 2 2
10 11237East Fork San
Jacinto River @ FM 945
Oct 07 Aug 08 JM JM BF 2 2 2
10 17431East Fork San
Jacinto River @ SH 150
Oct 07 Aug 08 JM JM BF 2 2 2
12 EFSJ01East Fork San
Jacinto River @ Hines Lake Rd
Oct 07 Aug 08 JM JM BF 2 2 2
12 EFSJ02East Fork San
Jacinto River @ Jenkins Rd
Oct 07 Aug 08 JM JM BF 2 2 2
6Field Parameters will consist of temperature and conductivity
Monitoring Frequency (2007-2008)
5Number of events to measure stream flow or determine stream flow from USGS gauging station records; event to consist of single determination of stream flow
1 WWTP outfalls will be sampled at discharge point to stream channel if accessible2JM is the Submitting Entity Code and Collecting Entity Code for James Miertschin and Associates.
4Number of events to collect E.coli samples
3BF is the Monitoring Type Code for sampling that cannot be precisely scheduled in advance because they target a certain flow condition that must be present in order for the sample to be taken.

MRPT07.DOC
24
Table 3-2: 2007-2008 Monitoring Schedule for West Fork San Jacinto, Segment 1004
Region Station ID Station Description1 Start Date
End Date
Data Submittal2
Data Collection2
Monit. Code3 Conv
Amb Tox Wat
Amb Tox Sed
Bacteria4 Inst Flow5 Field6
12 WFSJ02 Woodson's Gully @ Riley Fuzzel Oct 07 Aug 08 JM JM BF 2 2 2
12 WFSJ01 White Oak Creek @ Sleepy Hollow Oct 07 Aug 08 JM JM BF 2 2 2
12 13611West Fork San
Jacinto River SW of Porter Heights
Oct 07 Aug 08 JM JM BF 2 2 2
12 16624West Fork San
Jacinto River @ SH 242
Oct 07 Aug 08 JM JM BF 2 2 2
12 11245West Fork San
Jacinto River @ IH 45
Oct 07 Aug 08 JM JM BF 2 2 2
12 WFSJ03 Lake Creek @ Honea Egypt Rd Oct 07 Aug 08 JM JM BF 2 2 2
12 11250West Fork San
Jacinto River @ FM 2854
Oct 07 Aug 08 JM JM BF 2 2 2
4Number of events to collect E.coli samples5Number of events to measure stream flow or determine stream flow from USGS gauging station records; event to consist of single determination of stream flow6Field Parameters will consist of temperature and conductivity
Monitoring Frequency (2007-2008)
1 WWTP outfalls will be sampled at discharge point to stream channel if accessible2JM is the Submitting Entity Code and Collecting Entity Code for James Miertschin and Associates. 3BF is the Monitoring Type Code for sampling that cannot be precisely scheduled in advance because they target a certain flow condition that must be present in order for the sample to be taken.

MRPT07.DOC
25
Table 3-3: 2007-2008 Monitoring Schedule for Crystal Creek, Segment 1004
Region Station ID Station Description1 Start Date
End Date
Data Submittal2
Data Collection2
Monit. Code3 Conv
Amb Tox Wat
Amb Tox Sed Bacteria4 Inst
Flow5 Field6
12 16635 Crystal Creek @ SH 242 Oct 07 Aug 08 JM JM BF 2 2 2
12 11181 Crystal Creek @ FM 1314 Oct 07 Aug 08 JM JM BF 2 2 2
12 15804 East Fork Crystal Creek @ FM 3083 Oct 07 Aug 08 JM JM BF 2 2 2
12 CrC02 East Fork Crystal Creek @ FM 1484 Oct 07 Aug 08 JM JM BF 2 2 2
12 CrC03 East Fork Crystal Creek @ SH 105 Oct 07 Aug 08 JM JM BF 2 2 2
12 15805 West Fork Crystal Creek @ FM 3083 Oct 07 Aug 08 JM JM BF 2 2 2
12 CrC04Huntsman
Corporation WWTP 00584-000
Oct 07 Aug 08 JM JM BF 2 2 2
12 CrC01 West Fork Crystal Creek @ SH 105 Oct 07 Aug 08 JM JM BF 2 2 2
6Field Parameters will consist of temperature and conductivity
Monitoring Frequency (2007-2008)
5Number of events to measure stream flow or determine stream flow from USGS gauging station records; event to consist of single determination of stream flow
1 WWTP outfalls will be sampled at discharge point to stream channel if accessible2JM is the Submitting Entity Code and Collecting Entity Code for James Miertschin and Associates. 3BF is the Monitoring Type Code for sampling that cannot be precisely scheduled in advance because they target a certain flow condition that must be present in order for the sample to be taken.4Number of events to collect E.coli samples

MRPT07.DOC
26
Table 3-4: 2007-2008 Monitoring Schedule for Stewarts Creek, Segment 1004
Region Station IDStation
Description1Start Date
End Date
Data Submittal2
Data Collection2
Monit. Code3 Conv
Amb Tox Wat
Amb Tox Sed
Bacteria4 Inst Flow5 Field6
12 11178 Stewarts Creek @ Sliverdale Dr Oct 07 Aug 08 JM JM BF 2 2 2
12 16626 Stewarts Creek @ SH Loop 336 Oct 07 Aug 08 JM JM BF 2 2 2
12 StC01 Stewarts Creek @ SH 105 Oct 07 Aug 08 JM JM BF 2 2 2
12 StC02Stewarts Creek
@ North SH Loop 336
Oct 07 Aug 08 JM JM BF 2 2 2
12 StC05Little Caney
Branch @ Fm 3083
Oct 07 Aug 08 JM JM BF 2 2 2
12 StC03 Stewarts Creek @ FM 3083 Oct 07 Aug 08 JM JM BF 2 2 2
12 StC04 Stewarts Creek @SH 75 Oct 07 Aug 08 JM JM BF 2 2 2
4Number of events to collect E.coli samples5Number of events to measure stream flow or determine stream flow from USGS gauging station records; event to consist of single determination of stream flow6Field Parameters will consist of temperature and conductivity
Monitoring Frequency (2007-2008)
1 WWTP outfalls will be sampled at discharge point to stream channel if accessible2JM is the Submitting Entity Code and Collecting Entity Code for James Miertschin and Associates. 3BF is the Monitoring Type Code for sampling that cannot be precisely scheduled in advance because they target a certain flow condition that must be present in order for the sample to be taken.

MRPT07.DOC
27
Table 3-5: 2007-2008 Monitoring Schedule for Spring Creek, Segment 1008
Region Station IDStation
Description1Start Date
End Date
Data Submittal2
Data Collection2
Monit. Code3 Conv
Amb Tox Wat
Amb Tox Sed
Bacteria4 Inst Flow5 Field6
12 11312 Spring Creek @ Riley Fuzzel Rd Oct 07 Aug 08 JM JM BF 2 2 2
12 11313 Spring Creek @ IH 45 Oct 07 Aug 08 JM JM BF 2 2 2
12 17489 Spring Creek @ Kuykendahl Rd Oct 07 Aug 08 JM JM BF 2 2 2
12 SC02Mill Creek
@Neidgt Lake Outfall
Oct 07 Aug 08 JM JM BF 2 2 2
12 11314 Spring Creek at SH 249 Oct 07 Aug 08 JM JM BF 2 2 2
12 SC03 Walnut Creek @ Cypress Rosehill Oct 07 Aug 08 JM JM BF 2 2 2
12 SC07Brushy Creek at
Glenmont Estates
Oct 07 Aug 08 JM JM BF 2 2 2
12 11323Spring Creek @ Decker Prairie
RdOct 07 Aug 08 JM JM BF 2 2 2
12 SC01 Spring Creek @ Murrell Rd Oct 07 Aug 08 JM JM BF 2 2 2
4Number of events to collect E.coli samples5Number of events to measure stream flow or determine stream flow from USGS gauging station records; event to consist of single determination of stream flow6Field Parameters will consist of temperature and conductivity
Monitoring Frequency (2007-2008)
1 WWTP outfalls will be sampled at discharge point to stream channel if accessible2JM is the Submitting Entity Code and Collecting Entity Code for James Miertschin and Associates. 3BF is the Monitoring Type Code for sampling that cannot be precisely scheduled in advance because they target a certain flow condition that must be present in order for the sample to be taken.

MRPT07.DOC
28
Table 3-6: 2007-2008 Monitoring Schedule for Upper Panther Branch, Segment 1008B
Region Station IDStation
Description1Start Date
End Date
Data Submittal2
Data Collection2
Monit. Code3 Conv
Amb Tox Wat
Amb Tox Sed
Bacteria4 Inst Flow5 Field6
12 16632Upper Panther
Branch at Gosling Rd
Oct 07 Aug 08 JM JM BF 2 2 2
12 UPB04Woodlands Plant 2 WWTP Outfall
12597-001Oct 07 Aug 08 JM JM BF 2 2 2
12 16631Bear Branch @Research
Forest DrOct 07 Aug 08 JM JM BF 2 2 2
12 UPB01 Bear Branch @ Kuykendahl Rd Oct 07 Aug 08 JM JM BF 2 2 2
12 UPB05
Old Egypt Buisness Center WWTP Outfall
1414-001
Oct 07 Aug 08 JM JM BF 2 2 2
12 16630
Upper Panther Branch
downstream of outfall
Oct 07 Aug 08 JM JM BF 2 2 2
12 16629Upper Panther
Branch upstream of outfall
Oct 07 Aug 08 JM JM BF 2 2 2
12 UPB03Upper Panther
Branch @ Green Bridge Drive
Oct 07 Aug 08 JM JM BF 2 2 2
12 UPB02Upper Panther Branch @ FM
1488Oct 07 Aug 08 JM JM BF 2 2 2
6Field Parameters will consist of temperature and conductivity
Monitoring Frequency (2007-2008)
5Number of events to measure stream flow or determine stream flow from USGS gauging station records; event to consist of single determination of stream flow
1 WWTP outfalls will be sampled at discharge point to stream channel if accessible2JM is the Submitting Entity Code and Collecting Entity Code for James Miertschin and Associates. 3BF is the Monitoring Type Code for sampling that cannot be precisely scheduled in advance because they target a certain flow condition that must be present in order for the sample to be taken.4Number of events to collect E.coli samples

MRPT07.DOC
29
Table 3-7: 2007-2008 Monitoring Schedule for Willow Creek, Segment 1008
Region Station IDStation
Description1Start Date
End Date
Data Submittal2
Data Collection2
Monit. Code3 Conv
Amb Tox Wat
Amb Tox Sed
Bacteria4 Inst Flow5 Field6
12 11185 Willow Creek @ Gosling Rd Oct 07 Aug 08 JM JM BF 2 2 2
12 WC08Northhampton WWTP Outfall
10910-001Oct 07 Aug 08 JM JM BF 2 2 2
12 WC06Unnamed Trib of Willow Creek @ W Rayford Rd
Oct 07 Aug 08 JM JM BF 2 2 2
12 WC01 Willow Creek @ Kuykendahl Rd Oct 07 Aug 08 JM JM BF 2 2 2
12 WC09Dowdell WWTP Outfall 11404-
001Oct 07 Aug 08 JM JM BF 2 2 2
12 WC02 Willow Creek @ Fm 2920 Oct 07 Aug 08 JM JM BF 2 2 2
12 16426
Willow Creek @ Huffsmith
Kohrville Rd (FM 2978)
Oct 07 Aug 08 JM JM BF 2 2 2
12 WC07Tomball WWTP Outfall 10616-
002Oct 07 Aug 08 JM JM BF 2 2 2
12 WC03 Willow Creek @ SH 249 Oct 07 Aug 08 JM JM BF 2 2 2
12 WC04 Willow Creek @ Telge Rd Oct 07 Aug 08 JM JM BF 2 2 2
12 WC05Willow Creek @ Cypress Rosehill
RdOct 07 Aug 08 JM JM BF 2 2 2
4Number of events to collect E.coli samples5Number of events to measure stream flow or determine stream flow from USGS gauging station records; event to consist of single determination of stream flow6Field Parameters will consist of temperature and conductivity
Monitoring Frequency (2007-2008)
1 WWTP outfalls will be sampled at discharge point to stream channel if accessible2JM is the Submitting Entity Code and Collecting Entity Code for James Miertschin and Associates. 3BF is the Monitoring Type Code for sampling that cannot be precisely scheduled in advance because they target a certain flow condition that must be present in order for the sample to be taken.
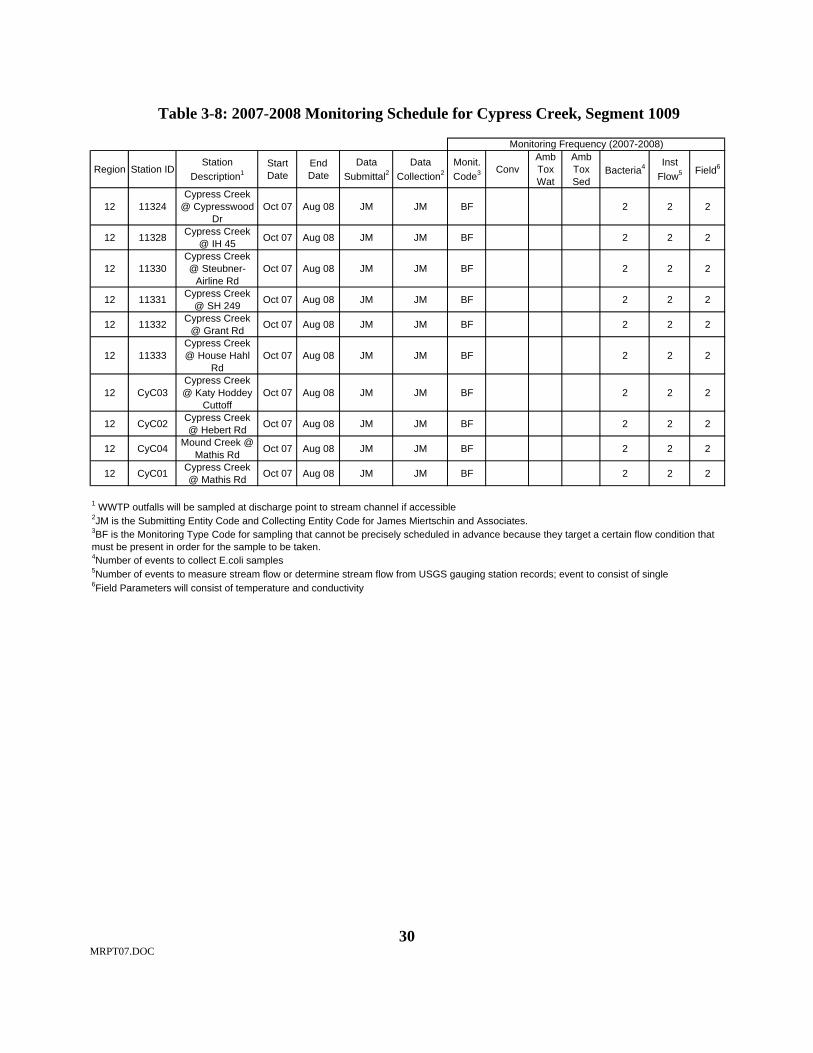
MRPT07.DOC
30
Table 3-8: 2007-2008 Monitoring Schedule for Cypress Creek, Segment 1009
Region Station IDStation
Description1Start Date
End Date
Data Submittal2
Data Collection2
Monit. Code3 Conv
Amb Tox Wat
Amb Tox Sed
Bacteria4 Inst Flow5 Field6
12 11324Cypress Creek
@ Cypresswood Dr
Oct 07 Aug 08 JM JM BF 2 2 2
12 11328 Cypress Creek @ IH 45 Oct 07 Aug 08 JM JM BF 2 2 2
12 11330Cypress Creek @ Steubner-
Airline RdOct 07 Aug 08 JM JM BF 2 2 2
12 11331 Cypress Creek @ SH 249 Oct 07 Aug 08 JM JM BF 2 2 2
12 11332 Cypress Creek @ Grant Rd Oct 07 Aug 08 JM JM BF 2 2 2
12 11333Cypress Creek @ House Hahl
RdOct 07 Aug 08 JM JM BF 2 2 2
12 CyC03Cypress Creek @ Katy Hoddey
CuttoffOct 07 Aug 08 JM JM BF 2 2 2
12 CyC02 Cypress Creek @ Hebert Rd Oct 07 Aug 08 JM JM BF 2 2 2
12 CyC04 Mound Creek @ Mathis Rd Oct 07 Aug 08 JM JM BF 2 2 2
12 CyC01 Cypress Creek @ Mathis Rd Oct 07 Aug 08 JM JM BF 2 2 2
6Field Parameters will consist of temperature and conductivity
5Number of events to measure stream flow or determine stream flow from USGS gauging station records; event to consist of single
Monitoring Frequency (2007-2008)
4Number of events to collect E.coli samples
1 WWTP outfalls will be sampled at discharge point to stream channel if accessible2JM is the Submitting Entity Code and Collecting Entity Code for James Miertschin and Associates. 3BF is the Monitoring Type Code for sampling that cannot be precisely scheduled in advance because they target a certain flow condition that must be present in order for the sample to be taken.
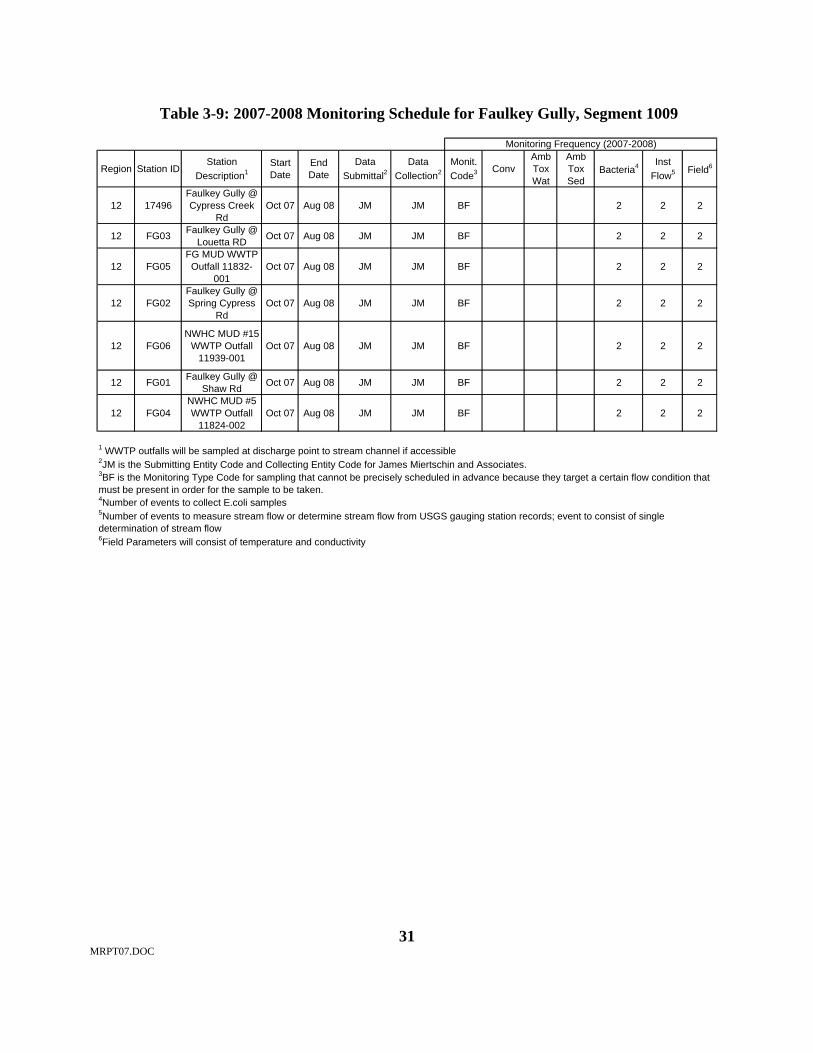
MRPT07.DOC
31
Table 3-9: 2007-2008 Monitoring Schedule for Faulkey Gully, Segment 1009
Region Station IDStation
Description1Start Date
End Date
Data Submittal2
Data Collection2
Monit. Code3 Conv
Amb Tox Wat
Amb Tox Sed
Bacteria4 Inst Flow5 Field6
12 17496Faulkey Gully @ Cypress Creek
RdOct 07 Aug 08 JM JM BF 2 2 2
12 FG03 Faulkey Gully @ Louetta RD Oct 07 Aug 08 JM JM BF 2 2 2
12 FG05FG MUD WWTP Outfall 11832-
001Oct 07 Aug 08 JM JM BF 2 2 2
12 FG02Faulkey Gully @ Spring Cypress
RdOct 07 Aug 08 JM JM BF 2 2 2
12 FG06NWHC MUD #15
WWTP Outfall 11939-001
Oct 07 Aug 08 JM JM BF 2 2 2
12 FG01 Faulkey Gully @ Shaw Rd Oct 07 Aug 08 JM JM BF 2 2 2
12 FG04NWHC MUD #5 WWTP Outfall
11824-002Oct 07 Aug 08 JM JM BF 2 2 2
6Field Parameters will consist of temperature and conductivity
Monitoring Frequency (2007-2008)
5Number of events to measure stream flow or determine stream flow from USGS gauging station records; event to consist of single determination of stream flow
1 WWTP outfalls will be sampled at discharge point to stream channel if accessible2JM is the Submitting Entity Code and Collecting Entity Code for James Miertschin and Associates. 3BF is the Monitoring Type Code for sampling that cannot be precisely scheduled in advance because they target a certain flow condition that must be present in order for the sample to be taken.4Number of events to collect E.coli samples

MRPT07.DOC
32
Table 3-10: 2007-2008 Monitoring Schedule for Spring Gully, Segment 1009
Region Station ID
Station Description1
Start Date
End Date
Data Submittal2
Data Collection2
Monit. Code3 Conv
Amb Tox Wat
Amb Tox Sed Bacteria4 Inst
Flow5 Field6
12 17481Spring Gully @ Spring Creek
Oaks DrOct 07 Aug 08 JM JM BF 2 2 2
12 SG01East Branch
Spring Gully @ TC Jester Rd
Oct 07 Aug 08 JM JM BF 2 2 2
12 SG07 Bilma WWTP Outfall 12025-002 Oct 07 Aug 08 JM JM BF 2 2 2
12 SG02East Branch
Spring Gully @ Spring Cypress Rd
Oct 07 Aug 08 JM JM BF 2 2 2
12 SG03
Spring Gully, 0.4 mi SW of Spring Cypress Rd., 0.4
mi SE of Klein Cemetery Rd
Oct 07 Aug 08 JM JM BF 2 2 2
12 SG06West Branch
Spring Gully @ Klein Cemetery Rd
Oct 07 Aug 08 JM JM BF 2 2 2
12 SG08 KISD WWTP Outfall 1224-001 Oct 07 Aug 08 JM JM BF 2 2 2
12 SG04 Spring Gully @ Spring Cypress Rd Oct 07 Aug 08 JM JM BF 2 2 2
12 SG05 Spring Gully @ Pine Lakes Blvd Oct 07 Aug 08 JM JM BF 2 2 2
12 SG09NWHC MUD #32
WWTP Outfall 13152-001
Oct 07 Aug 08 JM JM BF 2 2 2
3BF is the Monitoring Type Code for sampling that cannot be precisely scheduled in advance because they target a certain flow condition that must be present in order for the sample to be taken.4Number of events to collect E.coli samples
6Field Parameters will consist of temperature and conductivity
Monitoring Frequency (2007-2008)
1 WWTP outfalls will be sampled at discharge point to stream channel if accessible2JM is the Submitting Entity Code and Collecting Entity Code for James Miertschin and Associates.
5Number of events to measure stream flow or determine stream flow from USGS gauging station records; event to consist of single
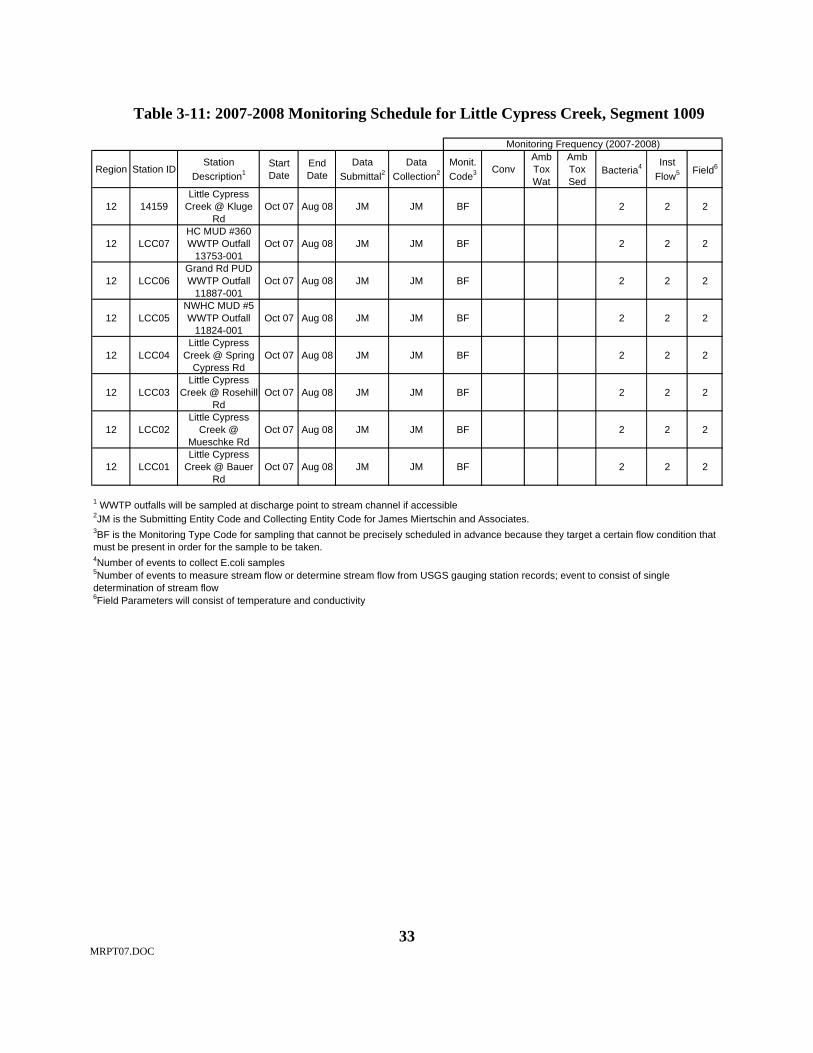
MRPT07.DOC
33
Table 3-11: 2007-2008 Monitoring Schedule for Little Cypress Creek, Segment 1009
Region Station IDStation
Description1Start Date
End Date
Data Submittal2
Data Collection2
Monit. Code3 Conv
Amb Tox Wat
Amb Tox Sed
Bacteria4 Inst Flow5 Field6
12 14159Little Cypress
Creek @ Kluge Rd
Oct 07 Aug 08 JM JM BF 2 2 2
12 LCC07HC MUD #360 WWTP Outfall
13753-001Oct 07 Aug 08 JM JM BF 2 2 2
12 LCC06Grand Rd PUD WWTP Outfall
11887-001Oct 07 Aug 08 JM JM BF 2 2 2
12 LCC05NWHC MUD #5 WWTP Outfall
11824-001Oct 07 Aug 08 JM JM BF 2 2 2
12 LCC04Little Cypress
Creek @ Spring Cypress Rd
Oct 07 Aug 08 JM JM BF 2 2 2
12 LCC03Little Cypress
Creek @ Rosehill Rd
Oct 07 Aug 08 JM JM BF 2 2 2
12 LCC02Little Cypress
Creek @ Mueschke Rd
Oct 07 Aug 08 JM JM BF 2 2 2
12 LCC01Little Cypress
Creek @ Bauer Rd
Oct 07 Aug 08 JM JM BF 2 2 2
6Field Parameters will consist of temperature and conductivity
Monitoring Frequency (2007-2008)
5Number of events to measure stream flow or determine stream flow from USGS gauging station records; event to consist of single determination of stream flow
1 WWTP outfalls will be sampled at discharge point to stream channel if accessible2JM is the Submitting Entity Code and Collecting Entity Code for James Miertschin and Associates. 3BF is the Monitoring Type Code for sampling that cannot be precisely scheduled in advance because they target a certain flow condition that must be present in order for the sample to be taken.4Number of events to collect E.coli samples

MRPT07.DOC
34
Table 3-12: 2007-2008 Monitoring Schedule for Caney Creek, Segment 1010
Region Station IDStation
Description1Start Date
End Date
Data Submittal2
Data Collection2
Monit. Code3 Conv
Amb Tox Wat
Amb Tox Sed
Bacteria4 Inst Flow5 Field6
12 CC04 White Oak Creek @ SH 494 Oct 07 Aug 08 JM JM BF 2 2 2
12 11334 Caney Creek @ FM 1485 Oct 07 Aug 08 JM JM BF 2 2 2
12 CC07
Whitestone Caney Creek WWTP Outfall
14559-001
Oct 07 Aug 08 JM JM BF 2 2 2
12 CC01 Dry Creek @ 1485 Oct 07 Aug 08 JM JM BF 2 2 2
12 CC06Lone Star Ranch
WWTP Outfall 14029-001
Oct 07 Aug 08 JM JM BF 2 2 2
12 CC03 Spring Branch @ SH 242 Oct 07 Aug 08 JM JM BF 2 2 2
12 CC05Conroe ISD
WWTP Outfall 13690-001
Oct 07 Aug 08 JM JM BF 2 2 2
12 11335 Caney Creek @ FM 2090 Oct 07 Aug 08 JM JM BF 2 2 2
12 14241 Caney Creek @ SH 105 Oct 07 Aug 08 JM JM BF 2 2 2
12 CC02 Caney Creek @ FM 1097 Oct 07 Aug 08 JM JM BF 2 2 2
5Number of events to measure stream flow or determine stream flow from USGS gauging station records; event to consist of single determination of stream flow
4Number of events to collect E.coli samples
6Field Parameters will consist of temperature and conductivity
Monitoring Frequency (2007-2008)
1 WWTP outfalls will be sampled at discharge point to stream channel if accessible2JM is the Submitting Entity Code and Collecting Entity Code for James Miertschin and Associates. 3BF is the Monitoring Type Code for sampling that cannot be precisely scheduled in advance because they target a certain flow condition that must be present in order for the sample to be taken.
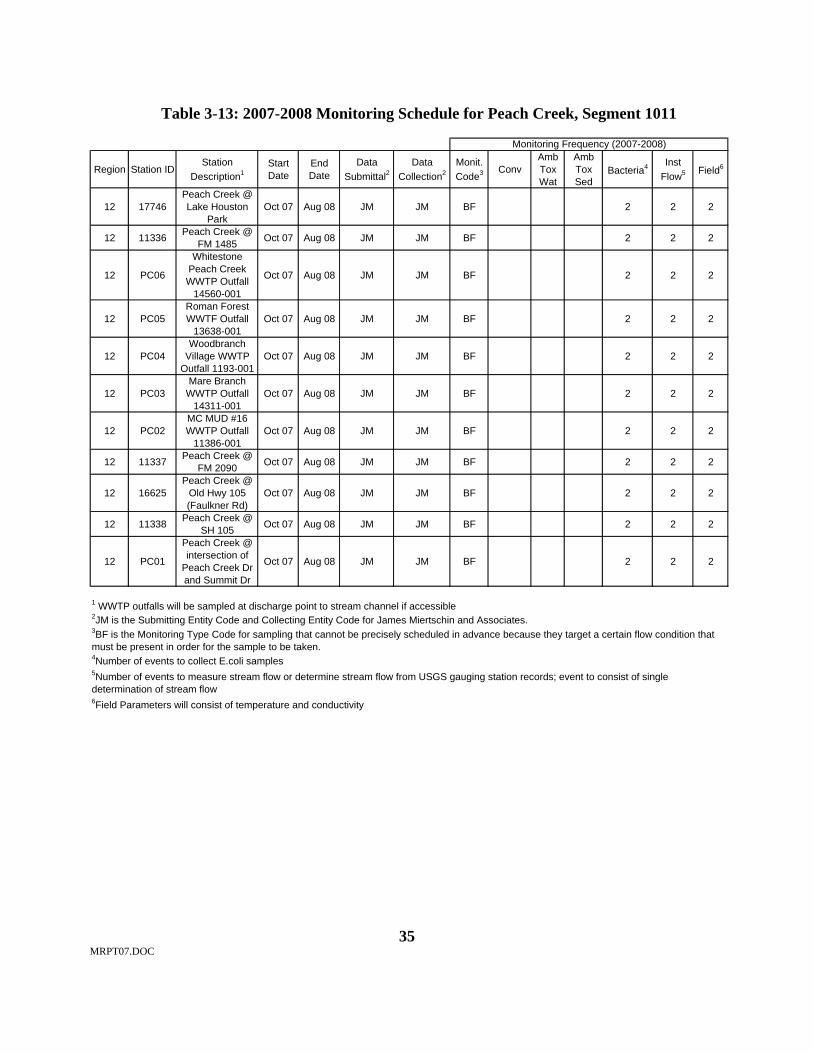
MRPT07.DOC
35
Table 3-13: 2007-2008 Monitoring Schedule for Peach Creek, Segment 1011
Region Station IDStation
Description1Start Date
End Date
Data Submittal2
Data Collection2
Monit. Code3 Conv
Amb Tox Wat
Amb Tox Sed
Bacteria4 Inst Flow5 Field6
12 17746Peach Creek @ Lake Houston
ParkOct 07 Aug 08 JM JM BF 2 2 2
12 11336 Peach Creek @ FM 1485 Oct 07 Aug 08 JM JM BF 2 2 2
12 PC06
Whitestone Peach Creek WWTP Outfall
14560-001
Oct 07 Aug 08 JM JM BF 2 2 2
12 PC05Roman Forest WWTF Outfall
13638-001Oct 07 Aug 08 JM JM BF 2 2 2
12 PC04Woodbranch
Village WWTP Outfall 1193-001
Oct 07 Aug 08 JM JM BF 2 2 2
12 PC03Mare Branch
WWTP Outfall 14311-001
Oct 07 Aug 08 JM JM BF 2 2 2
12 PC02MC MUD #16 WWTP Outfall
11386-001Oct 07 Aug 08 JM JM BF 2 2 2
12 11337 Peach Creek @ FM 2090 Oct 07 Aug 08 JM JM BF 2 2 2
12 16625Peach Creek @
Old Hwy 105 (Faulkner Rd)
Oct 07 Aug 08 JM JM BF 2 2 2
12 11338 Peach Creek @ SH 105 Oct 07 Aug 08 JM JM BF 2 2 2
12 PC01
Peach Creek @ intersection of
Peach Creek Dr and Summit Dr
Oct 07 Aug 08 JM JM BF 2 2 2
5Number of events to measure stream flow or determine stream flow from USGS gauging station records; event to consist of single determination of stream flow
4Number of events to collect E.coli samples
6Field Parameters will consist of temperature and conductivity
Monitoring Frequency (2007-2008)
1 WWTP outfalls will be sampled at discharge point to stream channel if accessible2JM is the Submitting Entity Code and Collecting Entity Code for James Miertschin and Associates. 3BF is the Monitoring Type Code for sampling that cannot be precisely scheduled in advance because they target a certain flow condition that must be present in order for the sample to be taken.
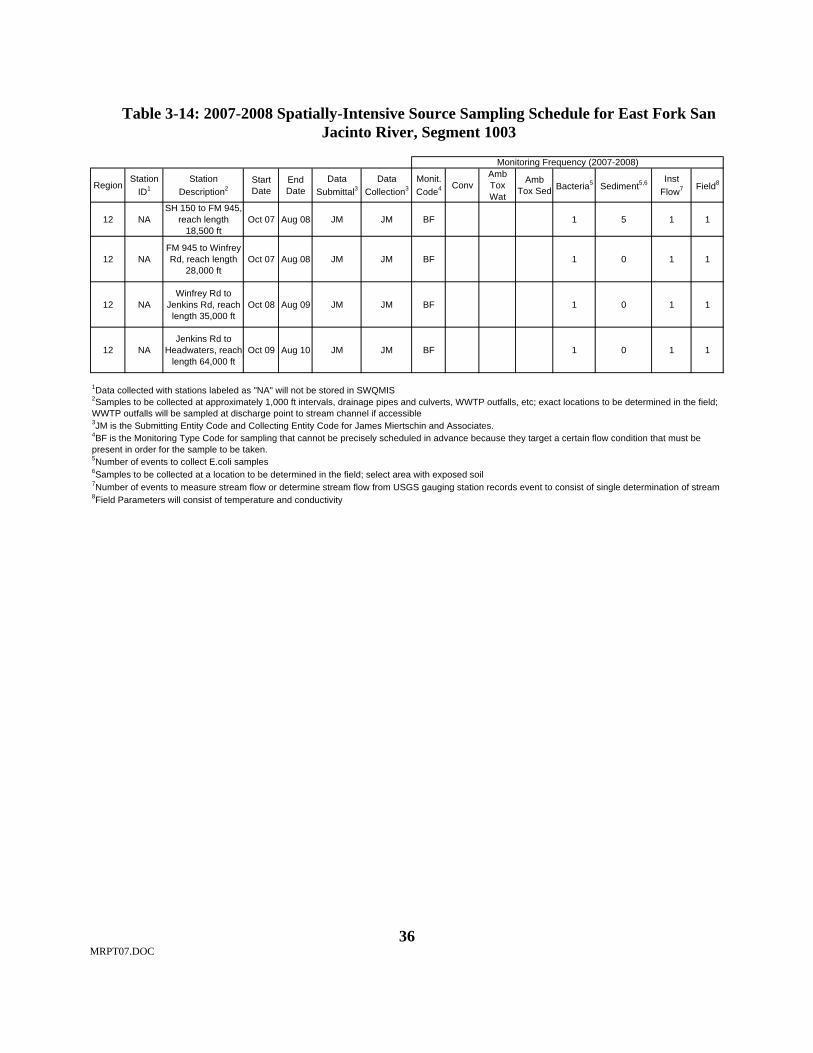
MRPT07.DOC
36
Table 3-14: 2007-2008 Spatially-Intensive Source Sampling Schedule for East Fork San Jacinto River, Segment 1003
RegionStation
ID1Station
Description2Start Date
End Date
Data Submittal3
Data Collection3
Monit. Code4 Conv
Amb Tox Wat
Amb Tox Sed Bacteria5 Sediment5,6 Inst
Flow7 Field8
12 NASH 150 to FM 945,
reach length 18,500 ft
Oct 07 Aug 08 JM JM BF 1 5 1 1
12 NAFM 945 to Winfrey Rd, reach length
28,000 ftOct 07 Aug 08 JM JM BF 1 0 1 1
12 NAWinfrey Rd to
Jenkins Rd, reach length 35,000 ft
Oct 08 Aug 09 JM JM BF 1 0 1 1
12 NAJenkins Rd to
Headwaters, reach length 64,000 ft
Oct 09 Aug 10 JM JM BF 1 0 1 1
Monitoring Frequency (2007-2008)
1Data collected with stations labeled as "NA" will not be stored in SWQMIS2Samples to be collected at approximately 1,000 ft intervals, drainage pipes and culverts, WWTP outfalls, etc; exact locations to be determined in the field; WWTP outfalls will be sampled at discharge point to stream channel if accessible3JM is the Submitting Entity Code and Collecting Entity Code for James Miertschin and Associates.
8Field Parameters will consist of temperature and conductivity
4BF is the Monitoring Type Code for sampling that cannot be precisely scheduled in advance because they target a certain flow condition that must be present in order for the sample to be taken.5Number of events to collect E.coli samples
7Number of events to measure stream flow or determine stream flow from USGS gauging station records event to consist of single determination of stream
6Samples to be collected at a location to be determined in the field; select area with exposed soil

MRPT07.DOC
37
Table 3-15: 2007-2008 Spatially-Intensive Source Sampling Schedule for Stewarts Creek, Segment 1004
RegionStation
ID1Station
Description2Start Date
End Date
Data Submittal3
Data Collection3
Monit. Code4 Conv
Amb Tox Wat
Amb Tox Sed Bacteria5 Sediment5,6 Inst
Flow7 Field8
12 NALoop 336 South to
SH 105, reach length 16,500 ft
Oct 07 Aug 08 JM JM BF 1 5 1 1
12 NASH 105 to Loop 336 North, reach
length 10,600Oct 07 Aug 08 JM JM BF 1 0 1 1
12 NALoop 336 North to
SH 75, reach length 23,900
Oct 08 Aug 09 JM JM BF 1 0 1 1
12 NASH 75 to
Headwaters, reach length 19,600
Oct 09 Aug 10 JM JM BF 1 0 1 1
8Field Parameters will consist of temperature and conductivity
Monitoring Frequency (2007-2008)
1Data collected with stations labeled as "NA" will not be stored in SWQMIS2Samples to be collected at approximately 1,000 ft intervals, drainage pipes and culverts, WWTP outfalls, etc; exact locations to be determined in the field; WWTP outfalls will be sampled at discharge point to stream channel if accessible3JM is the Submitting Entity Code and Collecting Entity Code for James Miertschin and Associates.
7Number of events to measure stream flow or determine stream flow from USGS gauging station records event to consist of single determination of stream
4BF is the Monitoring Type Code for sampling that cannot be precisely scheduled in advance because they target a certain flow condition that must be 5Number of events to collect E.coli samples6Samples to be collected at a location to be determined in the field; select area with exposed soil

MRPT07.DOC
38
Table 3-16: 2007-2008 Spatially-Intensive Source Sampling Schedule for Willow Creek, Segment 1008
RegionStation
ID1Station
Description2Start Date
End Date
Data Submittal3
Data Collection3
Monit. Code4 Conv
Amb Tox Wat
Amb Tox Sed Bacteria5 Sediment5,6 Inst
Flow7 Field8
12 NA
Gosling Rd to Kuykendahl Rd,
reach length 22,500 ft
Oct 07 Aug 08 JM JM BF 1 5 1 1
12 NAKuykendahl Rd to FM 2920, reach length 12,300 ft
Oct 07 Aug 08 JM JM BF 1 0 1 1
12 NAFM 2920 to FM
2978, reach length 14,200 ft
Oct 08 Aug 09 JM JM BF 1 0 1 1
12 NAFM 2978 to SH
249, reach length 11,900 ft
Oct 09 Aug 10 JM JM BF 1 0 1 1
12 NASH 249 to Telge Rd, reach length
14,300 ftOct 10 Aug 11 JM JM BF 1 0 1 1
12 NA
Telge Rd to Cypress Rosehill Rd, reach length
12,300 ft
Oct 11 Aug 12 JM JM BF 1 0 1 1
12 NA
Cypress Rosehill Rd to Headwaters,
reach length 11,000 ft
Oct 12 Aug 13 JM JM BF 1 0 1 1
Monitoring Frequency (2007-2008)
1Data collected with stations labeled as "NA" will not be stored in SWQMIS2Samples to be collected at approximately 1,000 ft intervals, drainage pipes and culverts, WWTP outfalls, etc; exact locations to be determined in the field; 3JM is the Submitting Entity Code and Collecting Entity Code for James Miertschin and Associates.
8Field Parameters will consist of temperature and conductivity
7Number of events to measure stream flow or determine stream flow from USGS gauging station records event to consist of single determination of stream
4BF is the Monitoring Type Code for sampling that cannot be precisely scheduled in advance because they target a certain flow condition that must be 5Number of events to collect E.coli samples6Samples to be collected at a location to be determined in the field; select area with exposed soil

MRPT07.DOC
39
Table 3-17: 2007-2008 Spatially-Intensive Source Sampling Schedule for Spring Gully, Segment 1009
RegionStation
ID1Station
Description2Start Date
End Date
Data Submittal3
Data Collection3
Monit. Code4 Conv
Amb Tox Wat
Amb Tox Sed Bacteria5 Sediment5,6 Inst
Flow7 Field8
12 NA
Main Stem (upstream from
Louetta Rd), reach length 16,500 ft
Oct 07 Aug 08 JM JM BF 1 5 1 1
12 NA
East Branch Spring Gully, reach length
11,600 ft
Oct 07 Aug 08 JM JM BF 1 0 1 1
12 NA
West Branch Spring Gully,
reach length 7,000 ft
Oct 07 Aug 08 JM JM BF 1 0 1 1
8Field Parameters will consist of temperature and conductivity
6Samples to be collected at a location to be determined in the field; select area with exposed soil7Number of events to measure stream flow or determine stream flow from USGS gauging station records event to consist of single determination of stream flow
Monitoring Frequency (2007-2008)
3JM is the Submitting Entity Code and Collecting Entity Code for James Miertschin and Associates. 4BF is the Monitoring Type Code for sampling that cannot be precisely scheduled in advance because they target a certain flow condition that must be present in order for the sample to be taken.5Number of events to collect E.coli samples
2Samples to be collected at approximately 1,000 ft intervals, drainage pipes and culverts, WWTP outfalls, etc; exact locations to be determined in the field; WWTP outfalls will be sampled at discharge point to stream channel if accessible
1Data collected with stations labeled as "NA" will not be stored in SWQMIS
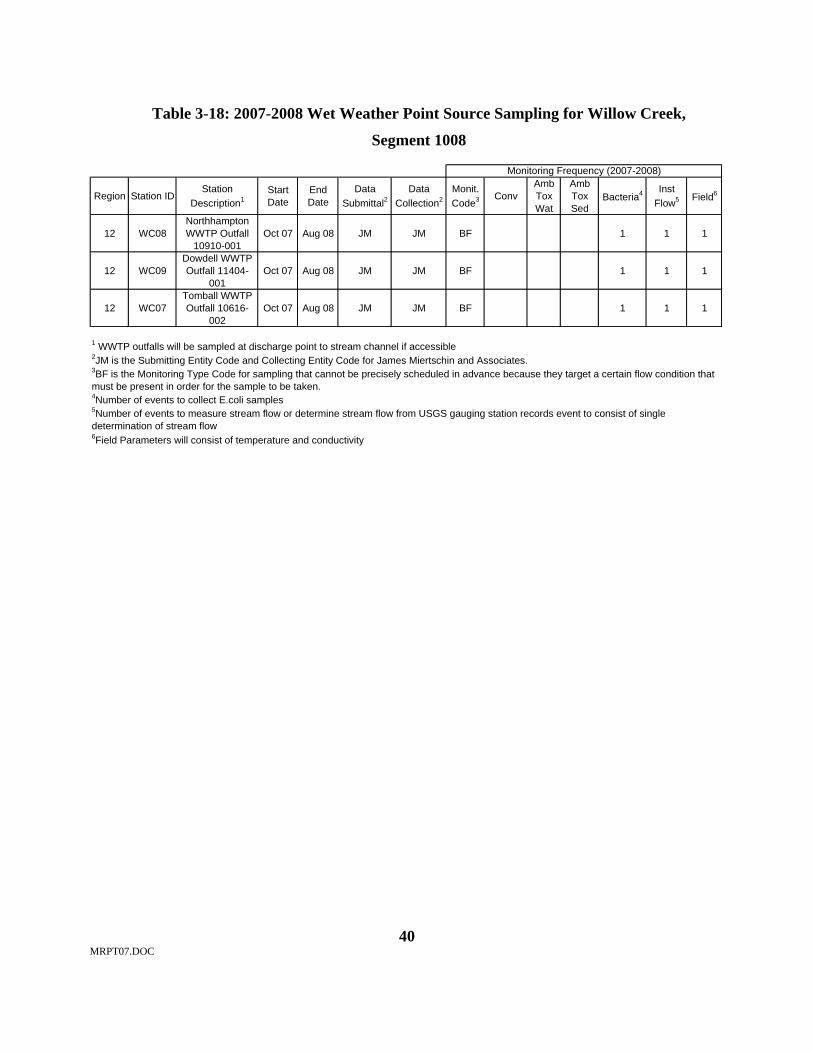
MRPT07.DOC
40
Table 3-18: 2007-2008 Wet Weather Point Source Sampling for Willow Creek,
Segment 1008
Region Station IDStation
Description1Start Date
End Date
Data Submittal2
Data Collection2
Monit. Code3 Conv
Amb Tox Wat
Amb Tox Sed
Bacteria4 Inst Flow5 Field6
12 WC08Northhampton WWTP Outfall
10910-001Oct 07 Aug 08 JM JM BF 1 1 1
12 WC09Dowdell WWTP Outfall 11404-
001Oct 07 Aug 08 JM JM BF 1 1 1
12 WC07Tomball WWTP Outfall 10616-
002Oct 07 Aug 08 JM JM BF 1 1 1
Monitoring Frequency (2007-2008)
1 WWTP outfalls will be sampled at discharge point to stream channel if accessible2JM is the Submitting Entity Code and Collecting Entity Code for James Miertschin and Associates. 3BF is the Monitoring Type Code for sampling that cannot be precisely scheduled in advance because they target a certain flow condition that must be present in order for the sample to be taken.4Number of events to collect E.coli samples5Number of events to measure stream flow or determine stream flow from USGS gauging station records event to consist of single determination of stream flow6Field Parameters will consist of temperature and conductivity
MRPT07.DOC
41
4.0 MONITORING PROCEDURES 4.1 TYPE OF SAMPLES The proposed monitoring plan emphasizes collection of samples for E. coli bacteria analysis. As a companion activity, field measurements will be routinely collected for temperature and conductivity. These field measurements will be collected if practicable, and if time allows, by the field crews, since the primary effort will be devoted to the collection of E. coli samples and maintenance of their relatively short holding and transport time requirements. 4.2 METHODS OF COLLECTION 4.2.1 FIELD MEASUREMENTS All field measurement equipment will be calibrated according to manufacturer’s recommendations. Field Measurements will be collected using the standard methods found in TCEQ Surface Water Quality Monitoring Procedures Volume 1: Physical and Chemical Monitoring Methods for Water, Sediment and Tissue (December 2003). Field instrumentation will be used to measure temperature and conductivity. Selected samples, namely those collected from point sources or immediately downstream, may be tested in the field for residual chlorine. Treatment plant flow meters will be relied upon for plant flows at the time of sampling. Water flow velocity will be measured at selected sampling stations, when practical, in accordance with the SWQM Manual. 4.2.2 SAMPLE COLLECTION AND HANDLING All water samples will be collected from roughly 0.5 foot below the water surface directly into the sample container, or with decontaminated buckets or dippers and transferred into the sample container. Decontamination of all sampling equipment will be performed by washing and scrubbing, followed by rinsing with a bleach solution, then rinsing with distilled water prior to use at each station. The sampling bucket or dipper will also be rinsed thoroughly with ambient water at each sampling location immediately prior to use in order to remove any disinfectant residue. Sterile sampling containers will be used for all bacterial samples. Sterile sampling techniques will be applied, and no collection equipment will be used without sterilization. Samples will be collected using standard methods found in TCEQ Surface Water Quality Monitoring Procedures Volume 1: Physical and Chemical Monitoring Methods for Water, Sediment and Tissue (December 2003). The following table identifies the parameters, containers, and preservatives to be utilized.

MRPT07.DOC
42
Table 4-1: Sampling Parameters, Containers and Preservation Parameter Method Parameter
Codes Matrix Container Preservation Sample
Volume Holding
Time
E. Coli EPA 1603; SM 9222-
D+9222-G; SM9213D; SM 9223B
31648*, 31648*, 31700, 31699, 31702
water, sewage
polyurethane or glass bottle, or Whirlpak bag
4E C, dark
100-250 ml 6+2 hrs (6 field hours and 2 lab
hours)
E. Coli EPA 1603; SM 9222-
D+9222-G; SM9213D; SM 9223B
31648*, 31648*, 31700, 31699, 31702
sediment polyurethane or glass bottle, or Whirlpak bag
4E C, dark
100-250 ml 6+2 hrs (6 field hours and 2 lab
hours)
Temperature (probe)
EPA 170.1, TCEQ SOP
00010 water
N/A N/A N/A N/A
Conductivity (probe)
EPA 120.1, TCEQ SOP
00094 water N/A N/A N/A N/A
Flow TCEQ SOP 00061 water N/A N/A N/A N/A
Residual Chlorine
SM 4500-Cl G and TCEQ
SOP v1
50060 water N/A N/A N/A N/A
*Note: New parameter codes will be requested prior to data submittal Quality Assurance/Quality Control to TCEQ standards will be performed for this entire sampling program. 4.3 PARAMETERS Water samples will be collected for laboratory analysis of E. coli. Sediment samples will be collected as a component of special sediment sampling surveys and tested for E. Coli. Sediment data will not be stored in SWQMIS. 4.4 MICROBIAL SOURCE TRACKING Microbial Source Tracking Microbial source tracking will be conducted on Spring Gully in order to define the presence of absence of bacteria from human sources. Ambient Water Sampling, Culturing, and Isolation

MRPT07.DOC
43
Field collection of water samples from the subject water course will be analyzed to segregate and quantify sources of E. coli bacteria. For the FY 2008 activities, one water sample for MST analysis will be collected from Spring Gully and one sample will be collected from a wastewater treatment facility in the same watershed. Following sample collection, the samples will be shipped overnight to the qPCR laboratory, where the E. coli genetic markers will be isolated and identified using quantitative polymerase chain reaction. The QAPP of the present JMA project will include procedures for collection, handling, and shipping of samples to the qPCR lab for subsequent analysis. For the present study, Source Molecular, Inc. (SMI) will provide the qPCR testing. The qPCR procedures employed by the laboratory, Source Molecular, Inc. (SMI) will be contained in Attachment 1 of this monitoring plan. SMI is a subcontractor to the JMA project team.

MRPT07.DOC
44
5.0 REFERENCES
JMA. 2007. Preliminary Data Review: Northwest Houston Bacteria Impairments (July 2007). JMA and PES. 2002. Historical Water Quality Data Assessment, Project Area 2 - Basins Groups
D & E Bacteria Impairments. Report to TNRCC TMDL, Strategic Assessment Division.
TCEQ. 2003 (RG-415). Surface Water Quality Monitoring Procedures Volume 1: Physical and Chemical Monitoring Methods for Water, Sediment and Tissue (December 2003).
TCEQ 2006. Draft 2006 303(d) list. TCEQ. 2003. Guidance for Assessing Texas Surface and Finished Drinking Water Quality Data, 2004. TCEQ. 2002. Draft 305(b) Assessment.

Attachment 1 Microbiology Guide Document and Quality Control Procedures

Version: 2 Revision: 2 Date accepted: 07/11/07 by Dr. T.M. Scott
__________________________________________________________________________________
4842 SW 74th Court Miami, FL 33155
Page 1 of 11
Created on 07/11/07 at 11:45am Revision #2
Microbiology Guide Document and Quality Control Procedures
(MGD-1)
Source Molecular Corporation
4842 SW 74th Court Miami, FL 33155
Policy Statement The management and personnel of Source Molecular Corporation are committed to good professional practice and to provide analytical services in compliance with stringent standards of quality. All analyses performed by said Laboratory shall be in accordance with established assurance practices and specific, written testing procedures. All employees shall be familiar with their responsibilities under the program and implement the

Version: 2 Revision: 2 Date accepted: 07/11/07 by Dr. T.M. Scott
__________________________________________________________________________________
4842 SW 74th Court Miami, FL 33155
Page 2 of 11
Created on 07/11/07 at 11:45am Revision #2
policies and procedures in their work. The quality manual shall be readily available to all employees and maintained up-to-date along with quality documentation. Objectives
1. Test results shall be of known quality 2. The precision and accuracy of all test data shall be determined 3. Data acquisition, transfer and report preparation steps shall be documented 4. All reports shall be reviewed for completeness and conformance to the quality system program by the
appropriate department head, the lab director or the lab manager. 5. Raw data, quality control data and reports shall be stored and retrievable 6. Sample receiving shall ensure that the Laboratory sample acceptance policy is met. 7. Samples shall be retrievable until disposal is called for 8. All operations shall be performed in accordance with and in conformance to detailed, documented
standard operating procedures. Methods and Procedures 1.0 Reference Cultures. All reference cultures of Microorganisms for positive and negative controls and routine laboratory analyses are purchased from the American Type Culture Collection (ATCC). ATCC
information is logged into the reference culture notebook and cultures are stored according to supplier’s specifications.
2.0 Revival of Reference Cultures. Reference cultures are stored according to supplier’s specifications.
Frozen cultures are revived and subcultured only once to provide reference stocks. Reference stocks are only revived once to maintain working stocks. Reference cultures are only replaced directly from supplier (e.g. ATCC).
3.0 Working Cultures. Working stocks are preserved by a method deemed appropriate that maintains desired
characteristics of the reference organism. Working stocks are not thawed and reused. Working Cultures do not replace reference cultures.
3.1 Bacterial cultures. Maintained on solid media plates (non-selective). Prior to analyses, cultures
are streaked onto selective and differential medium to assess desired characteristics. Bacterial cultures are only subcultured 5 times before obtaining another Reference Culture.

Version: 2 Revision: 2 Date accepted: 07/11/07 by Dr. T.M. Scott
__________________________________________________________________________________
4842 SW 74th Court Miami, FL 33155
Page 3 of 11
Created on 07/11/07 at 11:45am Revision #2
3.2 Mammalian Tissue Culture. Stocks are maintained in culture flasks and passed no more than 300 times. After 300 passages, stocks are destroyed and reordered from ATCC.
3.3 Viral Cultures. Viral cultures are kept frozen at –20 oC in minimal essential medium (MEM) supplemented with 10% fetal bovine serum (FBS).
4.0 Cleaning and disinfection of work areas. All floors and work surfaces are cleaned and disinfected weekly
with a commercially available cleaning/disinfection agent. Routine surface area disinfection is accomplished by spraying work areas with an aqueous solution containing 70% ethanol and wiping with paper towels. Flooring in the laboratory is tile and all work surfaces are sealed formica. Dusting is performed weekly.
5.0 Food and Drink in the Laboratory. All food and drink is prohibited in the laboratory. Food and drink is
only allowed in offices and reception areas. 6.0 Temperature monitoring and recording. All incubators, refrigerators, freezers, and water baths are
monitored by NIST traceable thermometers. Temperature logs are kept at the equipment and when log is full it is filed in equipment notebook under the appropriate item. Data on traceability of thermometers is available in the equipment notebook. Temperatures are read and recorded to most precise scale measured by the thermometer.
7.0 Equipment calibration and performance.
7.1 Thermometers. All thermometers are replaced annually by NIST-traceable products. 7.2 Autoclave. Autoclaves are monitored for maximum temperature on each run and all data is recorded on autoclave log sheet with each run. Temperature measurements are made from
different quadrants in succession and the thermometer location is reference on the log sheet. All items to be autoclaved are appropriately labeled and marked with temperature tape. Spore tests are performed at least monthly and results are logged on autoclave performance sheet. Autoclave thermometers are replaced annually. Autoclave timing device is checked quarterly by comparing to atomic clock at www.nist.gov. All completed log sheets and performance sheets are filed in the equipment notebook.
7.3 Pipets. All pipets and volumetric equipment is calibrated every six months by an outside vendor. Results from calibrations are recorded in the equipment notebook. Each lot number of disposable pipets and pipet tips is checked for accuracy by weighing amount of discharged purified water on an analytical balance (eg. 10 ml = 10 g). All pipets are calibrated monthly in-

Version: 2 Revision: 2 Date accepted: 07/11/07 by Dr. T.M. Scott
__________________________________________________________________________________
4842 SW 74th Court Miami, FL 33155
Page 4 of 11
Created on 07/11/07 at 11:45am Revision #2
house by this method and results are recorded on pipet calibration log sheets. Completed log sheets are filed in the equipment notebook.
7.4 UV disinfection instruments. UV bulbs are not used for routine surface disinfection. UV bulb in
the Biosafety cabinet is checked quarterly for biocidal activity by Plate Count Agar spread plates.
7.5 pH Meters. All pH meters are calibrated using two separate lots of NIST traceable buffers (pH 4.0,
7.0, 10.0) and results are recorded on pH meter calibration log sheet. Completed sheets are filed in the equipment notebook.
7.6 Incubators and water baths. All incubators and water bath temperatures are monitored twice
daily. Water bath temperatures are recorded from four quadrants with an infrared laser thermometer and the average temperature is recorded on the log sheet. Incubator temperature is recorded from a fixed thermometer location for daily measurements. Uniformity of temperature is measured using an infrared laser thermometer aimed at all four corners of the incubator. Average temp. is only recorded if it deviates from the temperature displayed by the fixed thermometer.
8.0 Dishwashing. SOPs for washing of labware are available for reference at the dishwashing station. Only
detergents designed for laboratory use are used for washing labware. All laboratory glassware is made of borosilicate glass and has readable measurement marks if applicable.
9.0 Glassware. All glassware is tested annually (or with a new lot number of detergent) for inhibitory residue
by performing an inhibitory residue test in conjunction with the media performance tests required by a specific method. Inhibitory residue test results are recorded in the media performance log sheet. Completed media performance log sheets are filed in the media log notebook. All glassware are tested daily for acid or alkaline residues with a pH indicator and results are recorded on glassware log sheet. Completed glassware log sheets are filed in the media log notebook.
10.0 Sterility checks. All lot numbers of sterile materials that are purchased are subjected to a sterility test.
10.1 Sample Containers. A sample container is filled with sterile dilution water and the solution is filtered through a filter membrane (of a lot number previously tested for sterility). The filter membrane is placed on a sterile petri plate (of a lot number previously tested for sterility) containing plate count agar and incubated for 48 hours at 35 oC. Results are recorded on a media QC bench sheet. Completed bench sheets are filed in the media log notebook.

Version: 2 Revision: 2 Date accepted: 07/11/07 by Dr. T.M. Scott
__________________________________________________________________________________
4842 SW 74th Court Miami, FL 33155
Page 5 of 11
Created on 07/11/07 at 11:45am Revision #2
10.2 Dilution water. Sterile dilution water is purchased from an outside vendor and checked for
sterility according to procedure outlined in section 10.1.
10.3 Membrane filters. One filter from each new lot is tested for sterility according to method outlined in section 10.1.
11.0 Analyst Demonstration of Capability. Each laboratory analyst shall have the required level of education
and experience outlined by NELAC or individual method requirements, whichever is greater. Each new analyst must demonstrate an initial and at least annual ongoing demonstrations of capability. In addition, a new demonstration of capability must be performed each time there is a change in equipment, personnel, or test method. All associated supporting data (i.e. bench sheets) are retained in the PT notebook under the specified analytical method. Source Molecular Corporation does not use specialized work cells
11.1 Bacteria by membrane filtration. All bacteriological analysts are required to perform an initial
proficiency (PT) sample prior to commencing laboratory analyses. PT samples are obtained from reputable NELAP-accredited vendor. PT samples are logged and processed according to all standard methods employed by the laboratory. Results. are logged in the PT notebook.
11.1.1 Total coliforms and E coli - Total coliforms and E. coli are analyzed by EPA Method 1604. The published method is available for reference in the laboratory.
11.1.2 Enterococci - Enterococci are analyzed by EPA Method 1600. The published method is available for reference in the laboratory.
11.1.3 Method Blanks and Sterility Blanks- A Method Blank is performed with each new media lot prepared for use. Sterility Blanks are performed each time the method is performed both prior to and after analysis and at least once every 10 samples analyzed. Filter funnels are rinsed three times with sterile rinse water between filtration series. Method Blank and Sterility Blank results and supporting documentation for bacterial analyses are filed in the Bacteriology PT notebook.
11.1.4 Analysis time. Membrane filtration is considered ended when more than 30 minutes has elapsed between successive filtrations.
11.1.5 Result Interpretation. At least once per month, the analysis in the 1 person laboratory must do repetitive counting on the same plate with no more than 5% difference between the counts. Results are recorded on laboratory bench sheet and filed in the bacteriology PT notebook.
11.2 Cryptosporidium and Giardia by EPA Method 1623. All parasitology analysts are required to
perform an initial proficiency (PT) sample prior to commencing laboratory analyses. PT samples

Version: 2 Revision: 2 Date accepted: 07/11/07 by Dr. T.M. Scott
__________________________________________________________________________________
4842 SW 74th Court Miami, FL 33155
Page 6 of 11
Created on 07/11/07 at 11:45am Revision #2
are obtained quarterly from the United States Environmental Protection Agency as part of the Long Term 2 Enhanced Surface Water Treatment Rule (LT2ESTWR) Laboratory Accreditation Program. PT samples are logged and processed according to all standard methods employed by the laboratory. Results are logged in the PT notebook.
11.2.1 Matrix Spikes – Matrix spikes are required each time a new matrix is analyzed under EPA Method 1623. Matrix spike results and supporting documents are recorded in the OPR and Matrix Spike notebook
11.2.2 Ongoing Proficiency Testing - Ongoing Proficiency Testing is a method 1623 requirement and must be performed at least every week testing is being performed, or every 20 samples processed, whichever is greater. OPR results and supporting documentation are filed in the OPR and Matrix Spike notebook.
11.2.3 Method Blanks – Processing of a method blank is a method 1623 requirement and must be performed at least every week testing is being performed, or every 20 samples processed, whichever is greater. Method blank results and supporting documentation are filed in the OPR and Matrix Spike notebook.
11.3 Enteric Viruses by EPA, SM 9510, and ASTM D4994-89. All virology analysts are required to perform an initial proficiency (PT) sample prior to commencing laboratory analyses. PT samples generated in-house and are verified by the QC manager.
11.3.1 Matrix Spikes – Matrix spikes are performed each time a new matrix is analyzed. Matrix spike results and supporting documents are recorded in the OPR and Matrix Spike notebook
11.3.2 Ongoing Proficiency Testing - Ongoing Proficiency Testing is performed with each new lot of Beef Extract used in the method. OPR results and supporting documentation are filed in the OPR and Matrix Spike notebook.
11.3.3 Method Blanks – Processing of a method blank is performed with each new lot of Beef Extract used in the method. Method Blank results and supporting documentation are filed in the OPR and Matrix Spike notebook.
12.0 Quality Control. Positive and negative controls are run with each analysis to verify that filtration
equipment and filters, sample containers, media, and reagents have not been contaminated by improper handling or preparation, inadequate sterilization, or environmental exposure. Each new batch of media prepared by the laboratory is tested for use with at least one pure culture of a positive control organism and at least one pure culture of a negative control organism. See Corporate Quality Control Manual for specific measures and procedures.
12.1 EPA Method 1603. Positive control – E. coli, Negative control – Ent. faecium
Version: 2 Revision: 2 Date accepted: 07/11/07 by Dr. T.M. Scott
__________________________________________________________________________________
4842 SW 74th Court Miami, FL 33155
Page 7 of 11
Created on 07/11/07 at 11:45am Revision #2
12.2 EPA Method 1600. Positive control – Ent. faecium, Negative control – E. coli 12.3 EPA Method 1623. Positive control - BTF Bio Easy Seed flow sorted Cryptosporidium and
Giardia for matrix spikes and OPRs. Positive Staining control organisms are included with each staining kit.
12.4 Enteric Viruses by EPA ICR, ASTM D4994-89, SM9510. Positive Control – Poliovirus Lsc1, Negative Control – Sterile PBS. 40 Liters spiked water processed through entire method from filtration to cell culture.
13.0 Method evaluation and document control . The laboratory records and retains all microbiological
validation data for as long as the pertinent test method is in force and for at least five years past the date of its last use.
14.0 Statistical calculations. Calculations, data reduction, and statistical interpretations are performed
according to method requirements. See SOP Q-5. 15.0 Sampling
15.1 The laboratory has procedures for sampling on file in the SOP Notebook. Sampling plans are constructed on a per-project basis and are filed in the client file.
15.2 The sampling plan and procedures for sampling are taken to the locations where sampling is undertaken
15.3 Whenever reasonable, sampling plans are based on statistical methods 15.4 The sampling procedures address factors to be controlled to ensure validity of the environmental
test results 15.5 The laboratory uses procedures dictated by individual analysis methods (when available) to obtain
representative samples 15.6 All deviations, additions, or exclusions required by the client are recorded in detail with all
appropriate sampling data, communicated to the client and appropriate personnel, and are included on final reports
15.7 Sampling procedures include steps to be taken to ensure adequate recording of pertinent data and operations relevant to sampling.
15.8 These records include sampling procedure used, identification of the sampler, environmental conditions, diagrams, sampling location, and statistical methods (if applicable) used.
15.8.1 See Field Data Sheet (FDS-1) located in sampling notebook

Version: 2 Revision: 2 Date accepted: 07/11/07 by Dr. T.M. Scott
__________________________________________________________________________________
4842 SW 74th Court Miami, FL 33155
Page 8 of 11
Created on 07/11/07 at 11:45am Revision #2
16.0 EPA Method 1623 Equipment and Quality Control All equipment and associated supplies for performance of EPA Method 1623 are available for use in the laboratory. All Quality Control checks and Equipment Maintenance records are on file in the appropriate notebooks.
16.1 Jouan 4 22 centrifuge (serial #49710072) 16.2 Immunomagnetic separation kits (Dynal), magnetic particle concentrators, and rotator 16.3 Primary staining antibodies (BTF – Easy Stain) 16.4 Olympus BX-51 TRF epifluorescence microscope with Differential Interference Contrast
and excitation/band pass filters for FITC and DAPI (Serial # 2D10657) 16.5 Microscope adjustments (Hg bulb adjustments/replacement, transmitted bulb replacement,
adjustment of oculars, calibration of ocular micrometer, establishing Kohler illumination) are performed according to manufacturer’s instruction or EPA Method 1623. Checklist for microscope adjustments are on slide data sheets and are filed with supporting documentation. Bulb replacements are documented in Equipment Maintenance Notebook.
16.6 Acceptance Criteria. Acceptance criteria for Initial Demonstration of Capability (IDC), Ongoing proficiency (OPR), and Matrix Spikes (MS) are outlined in EPA Method 1623 and SOP Q-7
16.7 Analyst proficiency. See Quality Control section EPA Method 1623 16.8 Holding times. Dictated by Method and outlined in SOP P-1
17.0 Enteric Viruses by EPA ICR, ASTM D4994-89, SM9510 Equipment and Quality Control
17.1 Filters. 1-MDS filters are used for EPA ICR, 1-MDS or Filterite Filters are used for SM9510 17.2 Cell lines. Buffalo Green Monkey cell lines are used for all analyses. Only passage 117-250 are
used for virus analysis. Other cell lines are also routinely used and specified in reports and data collection/analysis.
17.3 Cell culture positive control. Poliovirus –1 (attenuated) inoculated onto monolayer. Look for development of CPE within 48 hours (SOP V-3)
17.4 Cell culture negative control. Sterile PBS inoculated onto cell culture monolayer. No CPE observed (SOP V-3)
17.5 Cell culture maintenance. Each lot of calf serum and cell culture media is tested for sterility and performance and recorded in the media log notebook.
17.6 Methods manuals and SOPs for all test methods are available in laboratory SOP notebook and at work stations.

Version: 2 Revision: 2 Date accepted: 07/11/07 by Dr. T.M. Scott
__________________________________________________________________________________
4842 SW 74th Court Miami, FL 33155
Page 9 of 11
Created on 07/11/07 at 11:45am Revision #2
Host Associated Molecular Markers (PCR and Quantitative PCR based assays) Filtration of samples - A specified volume of water from each sample (Enterococcus or Bacteroidetes) is filtered through a 0.45 micron filter to collect bacterial cells for molecular analysis. In case of a clogged filter, an additional filter is utilized until an appropriate volume of water is filtered. Each filter is then processed according to methodology outlined below. Preparation of Enterococcus template DNA for PCR and qPCR reactions - PCR and qPCR reactions are performed on composite DNA samples extracted from membrane filters. Filters containing enterococci colonies are lifted, suspended in Azide dextrose broth (Difco), vortexed vigorously, and incubated for 3 hours at 41 oC to wash bacteria from the filters and partially enrich the culture. DNA extraction is performed on the resulting culture of bacteria using a Qiagen Stool DNA extraction kit according to manufacturer’s instructions (Qiagen, Inc.). Preparation of Bacteroidetes template DNA for PCR and qPCR reactions - PCR and qPCR reactions are performed on composite DNA samples extracted from membrane filters. Water samples are filtered and filters are lifted, suspended in Qiagen Stool Lysis Buffer and vortexed vigorously. The resulting lysate is processed for DNA extraction according to manufacturer’s instructions (Qiagen stool DNA extraction kit). PCR primers and reaction conditions for Human Enterococcus marker - Primers specific for the esp gene in E. faecium were developed by Scott et al. (2005). The forward primer, which is specific for the E. faecium esp gene is: (5’-TAT GAA AGC AAC AGC ACA AGT T-3’). A conserved reverse primer (5’-ACG TCG AAA GTT CGA TTT CC-3’), developed previously by Hammerum and Jensen, was used for all reactions. PCR reactions were performed in a 50 uL reaction mixture containing 1X PCR buffer, 1.5 mM MgCl2, 200 uM of each of the four deoxyribonucleotides, 0.3 uM of each primer, 2.5 U of HotStarTaq DNA polymerase (Qiagen), and 5 ul of template DNA. Amplification was performed with an initial step at 95 oC for 15 minutes (to activate Taq polymerase), followed by 35 cycles of 94oC for 1 min, 58oC for 1 min, and 72oC for 1 min. PCR products were separated on a 1.5% agarose gel stained with GelStar nucleic acid stain (BioWhittaker) and viewed under UV light. The PCR product is 680 base pairs in length. qPCR primers and probes and reaction conditions for Total Enterococcus marker and Human Enterococcus marker – qPCR primers specific for the esp gene in E. faecium were developed based on
Version: 2 Revision: 2 Date accepted: 07/11/07 by Dr. T.M. Scott
__________________________________________________________________________________
4842 SW 74th Court Miami, FL 33155
Page 10 of 11
Created on 07/11/07 at 11:45am Revision #2
Scott et al. (2005). The forward primer, which is specific for the E. faecium gene is: 5’- TATGAAAGCAACAGCACAAGTT-3’ and is identical to the forward primer for conventional PCR. The reverse primer is: 5’- TATGAAAGCAACAGCACAAGTT-3’ and the sequence for the “Taqman” probe is 5’- CCATTTGGTGAAGATTTCATCTTTGATTC-3’. The probe is labeled with FAM at the 5’ end and TAMRA at the 3’ end. A qPCR assay for the total Enterococcus marker was designed based on the target sequence described by Cheng et al. (Journal of Clinical Chemistry, 35, 1248-1250, 1997). The marker sequence was lodged with GenBank under accession number L78127. The forward primer is: 5’-GTTGGTGCAGCTGTGCCA-3’; the reverse primer is: 5’-CGAACGCGACCGTCATG-3’; the sequence for the “Taqman” probe is 5’-CCAAATCGATCCGCATCCATGATCA-3’. The probe is labeled with FAM at the 5’ end and TAMRA at the 3’ end. qPCR reactions for both the human Enterococcus marker and total Enterococcus marker were performed in 25ul reaction mixtures containing 1X Taqman Universal Master Mix (Applied Biosystems) with 900nM of both forward and reverse primers and 250nM probe and 2ul of template DNA. Amplification and analysis was undertaken in an Applied Biosystems 7700 with the following amplification conditions: 50oC for 10 minutes and 95oC for 15 seconds followed by 40 cycles of 95oC for 15 seconds and 57oC for 1 minute. Gene marker copy numbers were calculated by reference to standard curves generated using synthetic target amplicons. 9.7.1 Quality Control All molecular biology is performed in an isolation room separated from live bacterial, viral, and tissue cell cultures. Experiments are performed using separate pipettors with aerosol resistant tips, latex gloves are used at all times, and equipment and bench space is routinely wiped down with DNAse and RNAse inhibitors. Negative and positive controls are used in all PCR reactions. All DNA extractions are performed using kits that remove PCR inhibitors. When applicable, negative samples are spiked with positive control DNA to assess the presence of PCR inhibitors.

Version: 2 Revision: 2 Date accepted: 07/11/07 by Dr. T.M. Scott
__________________________________________________________________________________
4842 SW 74th Court Miami, FL 33155
Page 11 of 11
Created on 07/11/07 at 11:45am Revision #2
Appendix B Revision No. 0
September 26, 2007
TMDLQAPPRevision0
APPENDIX B. SAMPLING PROCESS DESIGN AND MONITORING SCHEDULE
(The Sampling process design and monitoring schedule are integrated into the Work Plan in Appendix A.)
Appendix C Revision No. 0
September 26, 2007
TMDLQAPPRevision0
APPENDIX C. FIELD DATA REPORTING FORM

Field Data SheetJames Miertschin and Associates, Inc.
Project Name/Location
Job Number
Sampler(s) Names (printed) and Signature(s)
Date Time Station ID/Sample ID DO (mg/L) pH Temp.
(°C) Flow (fps)Flow
Severity (1)
Residual Chlorine Cond. Observations (2)
Calibration: Equip.: DO: 1st pH: 2nd pH: Cond.:
Post Calibration: DO: 1st pH: 2nd pH: Cond:
1 1-no flow, 2-low, 3-normal, 4-flood, 5-high, 6-dry2 Observation: (use the entire next row of this table if necessary, complete for each location) Water appearance, weather, biological activity,
stream uses, unusual odors, specific sample information, missing parameters, and if pertinent: recent rainfall (day and amount)or days since last significant rainfall.
field data sheet.xls.xls 7/25/2007
Appendix D Revision No. 0
September 26, 2007
TMDLQAPPRevision0
APPENDIX D. CHAIN-OF-CUSTODY FORM

Appendix D Revision No. 0
September 26, 2007
TMDLQAPPRevision0
North Water District Laboratory Services 8725 Fawn Trail, The Woodlands, Texas 77385
CHAIN OF CUSTODY RECORD Analyses RequiredProject Name:
Station ID Date Time (24hr)
Matrix Description
# of
con
tain
ers
Sample ID
Relinquished by: (Signature)
Date: Time: Received by: (Signature) Date: Time: Laboratory remarks:
Relinquished by: (Signature)
Date: Time: Received by: (Signature) Date: Time: Lab log #
Relinquished by: (Signature)
Date: Time: Received for lab by: (Signature) Date: Time: Laboratory Name:
Appendix E Revision No. 0
September 26, 2007
APPENDIX E. DATA MANAGEMENT PLAN
Appendix E Revision No. 0
September 26, 2007
TMDLQAPPRevision0
1
APPENDIX E. DATA MANAGEMENT PLAN
Data Management Process Implementation of the data management plan is displayed graphically on Figure E.1. Field data will be recorded on field data reporting forms, and then entered into a database file. Field data forms will be maintained for five years. The results of EC tests will be maintained in an electronic database file. If any calculations are made, at least 10% will be checked by hand for accuracy. JMA will archive copies of each file to CD-ROM format. The data file, along with a database review checklist, will then be transferred to the TCEQ Project Manager by e-mail. After approving the database review checklist, the TCEQ Project Manager will convey the file to the TCEQ TMDL Data Manager. Personnel
Casey Johnson is responsible for ensuring that the project delivers data of known quality, quantity, and type on schedule to achieve project objectives. He provides the primary point of contact between the JMA Project Team and the TCEQ. Casey tracks and reviews deliverables to ensure that tasks in the work plan are completed as specified in the contract. He reviews and approves QAPP and any amendments or revisions and ensures distribution of approved/revised QAPPs to TCEQ participants. He is responsible for verifying that the QAPP is followed by the JMA Project Team. Casey notifies the TCEQ QAS and TMDL Program Manager of significant project nonconformance and corrective actions taken as documented in quarterly progress reports from JMA Project Team Project Manager. Kerry Niemann, the TMDL Data Manager, tracks and validates data generated by TMDL projects and associates all applicable incoming data with a Project and QAPP in SWQMIS. Responsibilities include receiving data (Event/Results Files) and review checklists from TMDL Project Managers, and loading data sets into SWQMIS. The SWQMIS data loader identifies invalid stations, invalid parameter codes, outliers, and orphans. Deficiencies are provided to Project Managers via a SWQMIS Data Loading Validator Report. The TMDL Data Manager ensures data deficiencies are corrected before data sets are accepted by SWQMIS and loaded.
Dr. James Miertchin is responsible for managing this TMDL project. He is responsible for ensuring that data is managed by the subcontractors according to this data management plan and QAPP. Dr. Miertschin is responsible for ensuring that tasks and other requirements in the contract are executed on time and with the quality assurance / quality control requirements in the system as defined by the contract and in the project QAPP; assessing the quality of subcontractor/participant work; submitting accurate and timely deliverables to the TCEQ project Manager; and coordinating attendance at conference calls, training, meetings, and related project activities with the TCEQ. Responsible for verifying that the QAPP is distributed and followed by the JMA Project Team (including all subcontractors) and that the project is producing data of

Appendix E Revision No. 0
September 26, 2007
TMDLQAPPRevision0
2
known and acceptable quality. James is responsible for ensuring adequate training and supervision of all activities involved in generating analytical and field data, including the facilitation of audits and in the implementation, documentation, verification and reporting of corrective actions.
Dan Obenour is responsible for the acquisition, verification, and transfer of data to the TCEQ. Dan oversees data management for the study. Performs data quality assurances prior to transfer of data to TCEQ. Responsible for transferring data to TCEQ in the acceptable format. Ensures that the data review checklist is completed and data submitted with appropriate codes and data. Provides the point of contact for the TCEQ Project Manager to resolve issues related to the data and assumes responsibility for the correction of any data errors.
Al Capps is the quality assurance officer for the JMA Project Team. Responsible for coordinating development and implementation of JMA’s QA program. Responsible for writing and maintaining the QAPP and monitoring its implementation. Responsible for maintaining records of QAPP distribution, including appendices and amendments. Ensures the data collected for the project is of known and acceptable quality and adheres to the specifications of the QAPP. Responsible for maintaining written records of sub-tier commitment to requirements specified in this QAPP. Responsible for identifying, receiving, and maintaining project quality assurance records. Responsible for compiling and submitting the QA report. Responsible for coordinating with the TCEQ QAS to resolve QA-related issues. Notifies the JMA Project Manager and TCEQ Project Manager of particular circumstances which may adversely affect the quality of data. Coordinates the research and review of technical QA material and data related to water quality monitoring system design and analytical techniques.
Steve Grychka is responsible for the NWDLS personnel involved in generating analytical data for this project. He is responsible for insuring NWDLS personnel involved in generating analytical data have adequate training and a thorough knowledge of the QAPP and the SOPs specific to the analysis or task performed and or supervised. Responsible for oversight of all NWDLS operations ensuring that all QA/QC requirements are met and documentation related to the analysis is complete and accurately reported. Enforces corrective actions as required. Systems Design Data will be entered into, stored in, and transmitted between personal computers operating on Microsoft Windows 95/98/NT, and using common commercially-available software. Microsoft Excel or Microsoft Access XP will be used as databases, and data files created by these software programs will be transmitted between computers via e-mail. The TCEQ database hardware and software are described elsewhere and available from the TCEQ IR Program.

Appendix E Revision No. 0
September 26, 2007
TMDLQAPPRevision0
3
Data Dictionary - Terminology and field descriptions are included in the SWQM Data Management Reference Guide, 2007 or most recent version. For the purposes of verifying which codes are included in this QAPP, a table outlining the codes that will be used when submitting data under this QAPP is included below: Name of Monitoring Entity Tag Prefix Submitting Entity Collecting Entities
JMA Project Team JM JM JM Quality Assurance/Control - See Section D of this QAPP. Migration/Transfer/Conversion - The JMA Project Team’s data manager is Dan Obenour. He is responsible for the acquisition, verification, and transfer of data to the TCEQ TMDL Project Manager. Mr. Obenour oversees data management for the project by performing data quality assurances prior to transfer of data to TCEQ in the format specified in the SWQM Data Management Reference Guide (2007) or most recent version. Mr. Obenour transfers the laboratory results into a Microsoft Access database. After ensuring the data is free of transcription errors, he converts the data base into an ASCII pipe delimited format. He ensures that the data review checklist is completed and data is submitted with appropriate codes. All migration, transfer, and conversion of data, as well as data history will accompany his final submission. Backup/Disaster Recovery – Data files stored on the network servers at JMA, and TCEQ computer systems are routinely backed up. After a summary report is produced at JMA, it will then be saved to a CD-ROM for distribution and archive. Copies of the field data reporting forms and laboratory paper records will be maintained at JMA for a period of five years as additional insurance against data loss. Archives/Data Retention - Complete original data sets are archived on permanent media (CD-ROM) and retained on-site by the JMA for a retention period specified in Table A9.1 Project Documents and Records. Information Dissemination - Project updates will be provided to the TMDL Project Manager in progress reports and the information will be made available at stakeholder meetings. Environmental data collected as part of the project described in this QAPP will be accessible to the general public from the TCEQ SWQMIS database once the data has undergone the QA/QC protocol described herein.
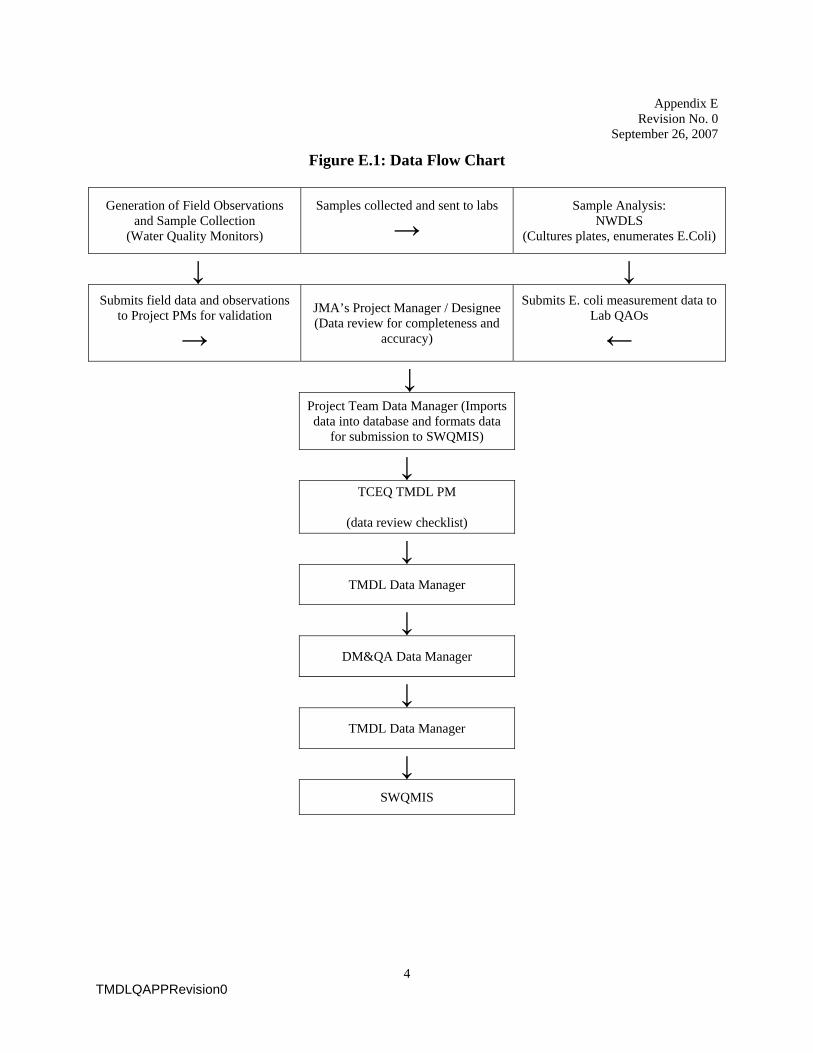
Appendix E Revision No. 0
September 26, 2007
TMDLQAPPRevision0
4
Figure E.1: Data Flow Chart
Generation of Field Observations and Sample Collection
(Water Quality Monitors)
Samples collected and sent to labs
→ Sample Analysis:
NWDLS (Cultures plates, enumerates E.Coli)
↓ ↓ Submits field data and observations
to Project PMs for validation
→ JMA’s Project Manager / Designee (Data review for completeness and
accuracy)
Submits E. coli measurement data to Lab QAOs
← ↓
Project Team Data Manager (Imports data into database and formats data
for submission to SWQMIS)
↓ TCEQ TMDL PM
(data review checklist)
↓ TMDL Data Manager
↓ DM&QA Data Manager
↓ TMDL Data Manager
↓ SWQMIS

Appendix F Revision No. 0
September 26, 2007
APPENDIX F. DATA REVIEW CHECKLIST
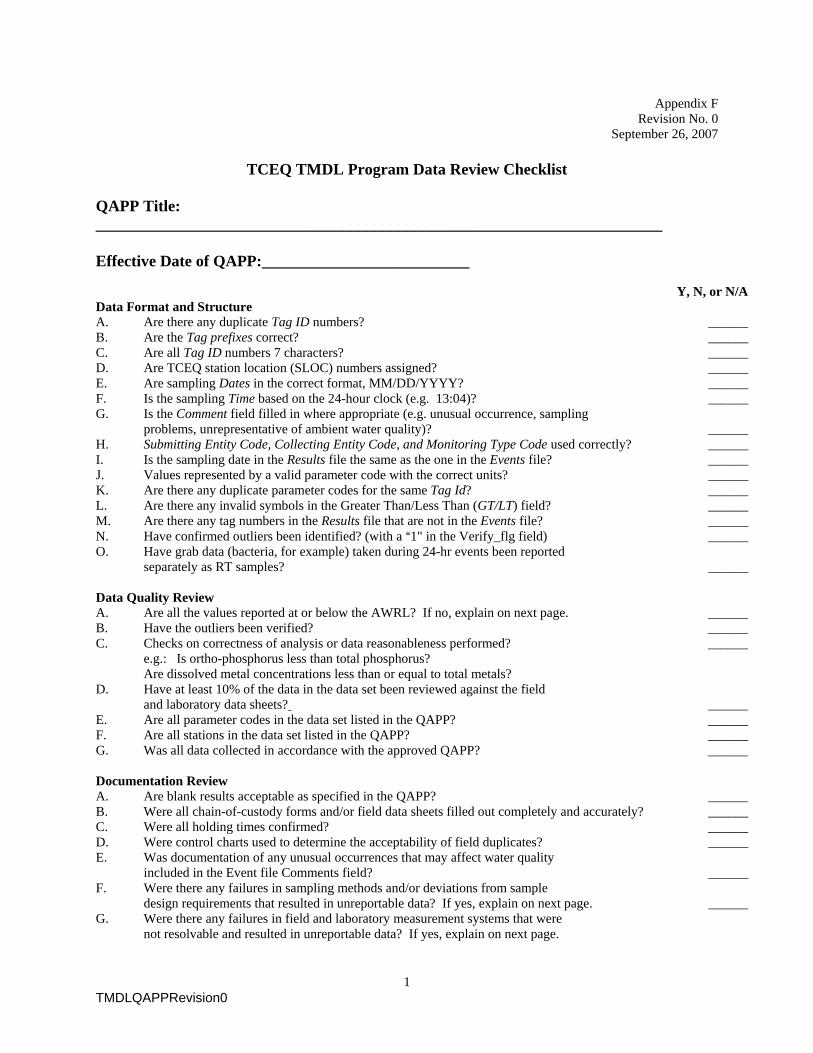
Appendix F Revision No. 0
September 26, 2007
TMDLQAPPRevision0
1
TCEQ TMDL Program Data Review Checklist QAPP Title: _______________________________________________________________________ Effective Date of QAPP:__________________________ Y, N, or N/A Data Format and Structure A. Are there any duplicate Tag ID numbers? ______ B. Are the Tag prefixes correct? ______ C. Are all Tag ID numbers 7 characters? ______ D. Are TCEQ station location (SLOC) numbers assigned? ______ E. Are sampling Dates in the correct format, MM/DD/YYYY? ______ F. Is the sampling Time based on the 24-hour clock (e.g. 13:04)? ______ G. Is the Comment field filled in where appropriate (e.g. unusual occurrence, sampling
problems, unrepresentative of ambient water quality)? ______ H. Submitting Entity Code, Collecting Entity Code, and Monitoring Type Code used correctly? ______ I. Is the sampling date in the Results file the same as the one in the Events file? ______ J. Values represented by a valid parameter code with the correct units? ______ K. Are there any duplicate parameter codes for the same Tag Id? ______ L. Are there any invalid symbols in the Greater Than/Less Than (GT/LT) field? ______ M. Are there any tag numbers in the Results file that are not in the Events file? ______ N. Have confirmed outliers been identified? (with a A1" in the Verify_flg field) ______ O. Have grab data (bacteria, for example) taken during 24-hr events been reported
separately as RT samples? ______ Data Quality Review A. Are all the values reported at or below the AWRL? If no, explain on next page. ______ B. Have the outliers been verified? ______ C. Checks on correctness of analysis or data reasonableness performed? ______
e.g.: Is ortho-phosphorus less than total phosphorus? Are dissolved metal concentrations less than or equal to total metals? D. Have at least 10% of the data in the data set been reviewed against the field
and laboratory data sheets? ______ E. Are all parameter codes in the data set listed in the QAPP? ______ F. Are all stations in the data set listed in the QAPP? ______ G. Was all data collected in accordance with the approved QAPP? ______ Documentation Review A. Are blank results acceptable as specified in the QAPP? ______ B. Were all chain-of-custody forms and/or field data sheets filled out completely and accurately? ______ C. Were all holding times confirmed? ______ D. Were control charts used to determine the acceptability of field duplicates? ______ E. Was documentation of any unusual occurrences that may affect water quality
included in the Event file Comments field? ______ F. Were there any failures in sampling methods and/or deviations from sample
design requirements that resulted in unreportable data? If yes, explain on next page. ______ G. Were there any failures in field and laboratory measurement systems that were
not resolvable and resulted in unreportable data? If yes, explain on next page.

Appendix F Revision No. 0
September 26, 2007
TMDLQAPPRevision0
2
Describe any data reporting inconsistencies with AWRL specifications. Explain failures in sampling methods and
field and laboratory measurement systems that resulted in data that could not be reported to the TCEQ. (attach
another page if necessary):
_____________________________________________________________________________________________
_____________________________________________________________________________________________
_____________________________________________________________________________________________
_____________________________________________________________________________________________
_____________________________________________________________________________________________
_____________________________________________________________________________________________
_____________________________________________________________________________________________
_____________________________________________________________________________________________
Date Submitted to TCEQ: _________________________________
Tag ID Series: __________________________________________
Date Range: ____________________________________________
Data Source: ___________________________________________
Comments (attach README.TXT file if applicable):
________________________________________________________________________________________________
________________________________________________________________________________________________
________________________________________________________________________________________________
________________________________________________________________________________________________
Lead Organization Data Manager: ___________________________________________Date: ___________ Data was collected as specified in the QAPP? Yes No (based on the responses above)
Did the contractor describe any data reporting inconsistencies with the AWRL specifications? Yes No If yes, ensure the data was not reported to the TCEQ. Did the contractor list any failures in sampling methods, field measurements, and/or laboratory measurements? Yes No If yes, ensure the data was not reported to the TCEQ.
TMDL Project Manager:___________________________________________________________Date:____________

Appendix G Revision No. 0
September 26, 2007
TMDLQAPPRevision0
APPENDIX G. EXAMPLE LETTER

Appendix G Revision No. 0
September 26, 2007
TMDLQAPPRevision0
APPENDIX G. EXAMPLE LETTER TO DOCUMENT ADHERENCE TO THE QAPP TO: (name) (organization) FROM: (name) (organization) RE: QAPP for Northwest Houston Area Bacteria TMDL Project Please sign and return this form by (date) to: (address) I acknowledge receipt of the referenced document(s). I understand the document(s) describe quality assurance, quality control, data management and other technical activities that must be implemented to ensure the results of work performed will satisfy stated performance criteria. Signature Date


![CONTENTS€¦ · List of cases digested I-27-I-82 ... Speculative transactions ... Method of accounting in certain cases [Section 145A] 1008-1009 I-19 CONTENTS. CASE NOS](https://img.pdfslide.us/doc/110x75/5b90d17e09d3f22c258cb355/contents-list-of-cases-digested-i-27-i-82-speculative-transactions-method.jpg)