Embed Size (px)
Citation preview

THE 9TH NSA Statement 1
SECTOR PERFORMANCE
CSO PERSPECTIVE
Agriculture Sector Strategic Plan2015/16 -2019/20 at a glance
NSA Working Group in Agriculture C/O Food Rights Alliance
Plot 368 Balintuma Road MengoTel: +256 414 695518,
[email protected] August 2019
THE
9TH
JASAR 2019JOINT AGRICULTURALSECTOR ANNUAL REVIEW

THE 9TH NSA Statement2
Table of Contents
Acknowledgement ................................................................................ 4List of Acronyms..................................................................................... 5
1.0 Background........................................................................... 62.0 Introduction.......................................................................... 93.0 Marco- Economic Sector Performance......................... 103.0.1 Agriculture sector and Uganda’s economy..................... 103.0.2 Agricultural Sector Growth................................................... 123.0.3 Sector Public Financing against ASSP I Costing........... 13
4.0 Human resources................................................................. 17
5.0 Increasing agricultural production & productivity... 195.0.1 Strengthening ecologically sound agriculture research and climate resilience technologies and practices............................................................................. 195.0.2 Implement a single spine agriculture extension system while promoting gendered innovation in agricultural research centers and extension services.. 225.0.3 Control pests, disease and vectors................................... 265.0.4 Promoting sustainable land management (SLM) and adaptation of climate change resilient agricultural production systems, technologies and practices............................................................................... 285.0.5 Increased access to agricultural financing..................... 30
6.0 Increasing Access to Critical Farm Inputs ..................... 356.0.1 The critical agriculture inputs government prioritized include the following ........................................ 366.0.2 Agriculture machinery............................................................. 36
THE 9TH NSA Statement 3
6.0.3 Improving access to high quality seeds and planting materials................................................................... 376.0.4 Water for agriculture production .................................... 396.0.5 Increase Access to and use of fertilizers by all categories of farmers............................................................. 41
7.0 Improving access to agricultural markets and value addition ............................................................... 457.0.1 Value addition and markets ............................................. 467.0.2 Standards development and promotion for increased Uganda’s Agricultural exports ..................... 487.0.3 Markets and Market information..................................... 507.0.4 Agricultural commodity pricing........................................ 527.0.5 Promote private sector investment in value addition through public private partnerships (PPPs)........................................................................................... 53
8.0 Food and nutritional security ........................................ 56NSA contributors of the statement................................................. 59
THE 9TH NSA Statement4
Acknowledgments
The process of generation, preparation and development of this Non State Actors’ (NSAs) sector Assessment for the FY 2018/19, and the participation of NSAs in the preparation and conducting JASAR activities at regional (Western Uganda) and National level has be made possible by financial support from NSAs and several funding partners such as; OXFAM, Trocaire, Rosa Luxemburg Stiftung, Caritas Demark and Hivos. The authors thank the Government of Uganda through its Ministry of Agriculture Animal industry and Fisheries for organizing this Annual Joint Sector Review to provide a mechanism for mutual accountability as espoused by the CAADP Malabo commitments. We further appreciate the space provided to NSAs to take active participation in organizing the JASAR events as well as contributing to the development of the sector.
Much appreciation is extended to different NSAs for taking part in the analysis, drafting of this position paper and actual participation in the preparation of the JASAR events. They include: ESAFF-Ug, CAPCA, ACSA, FRA, PELUM (Ug), SEATINI (Ug), CSBAG, Caritas - Kampala/ACSA, UFCVP- CARITAS Uganda VEDCO , The Hunger project Uganda, CAN –U, Kilimo Trust, OXAFM, CIDI, Self-help Africa, UNFEE, Earth and Rights Initiative and TEENS(ug).
Further appreciation goes to all NSAs mentioned at the back of this booklet whose work in various parts of the country provided inspirations that informed the process of writing this document.
THE 9TH NSA Statement 5
List of Acronyms
NSAs Non state Actors
CAADP Comprehensive Africa agriculture development
program
MAAIF Ministry of Agriculture Animal Industry and Fisheries
MoLHUD Ministry of Lands Housing and Urban Development
OWC Operation Wealth Creation
NDP II National Development Plan II
ASSP Agriculture Sector Development Plan
EU European Union
UNBS Uganda National Bureau of Standards
SACCOs Savings and Credits cooperatives
VSLAs Village savings and loan associations
NAADS National agricultural advisory services
THE 9TH NSA Statement6
1.0 Background
Since 2011 the Government of Uganda through the Ministry of Agriculture Animal Industry and Fisheries (MAAIF) has been organizing Joint Agriculture Sector Annual Review(s) (JASARs), this followed the signing of the CAADP Compact in 2010 and subsequent adoption of the Development Strategy and Investment Plan (DSIP) as the first National Agriculture Investment Plan (NAIP). The broad objective of the JASAR as speculated in the CAADP review guidelines is to collectively and mutually review the performance of the agricultural sector. The previous financial year is reviewed against targets, actions and indicators set out in the Ministerial Policy Statement (MPS). Specifically; the JASAR aims at;
i. Creating a platform for stakeholders in the agriculture sector including; political leaders, sector institutions, decentralized
structures, private sector, civil society and development partners to discuss and review the performance of the agriculture sector, as well as its associated policies and programs;
ii. Assessing the trends in overall sector performance based on relevant Sustainable Development Goals, CAADP, the National Development Plan (NDPII) and the Agricultural Sector Strategic Plan (ASSP) indicators;
iii. Assessing the progress of implementation of sector priorities for the year under review as set out in the Ministerial Policy Statement (MPS) and sector Budget Framework Paper (BFP);
iv. Assessing sector public and private financing for the year under review;
v. Assess progress made towards the agreed actions in the previous JASAR 2018 and other
THE 9TH NSA Statement 7
performance guidelines such as; the cabinet retreat for the Government Annual Performance Report (GAPR) for FY 2017/18, and the Presidential Directives and ruling party Manifestos.
The JASARs therefore are set to promote horizontal accountability and therefore all sector stakeholders (private sector, civil society, farmers’ organizations, Development Partners, Local Governments, and Government Ministries, Departments and Agencies) must take active and competent participation. The JASAR process has evolved since and new innovations have been added all aiming at strengthening participation and accountability. These include; undertaking Regional JASARs since 2017 in central Regions i.e. 2017 in Northern Region, 2018 in Eastern Region and the currently concluded in the Western Region. These are preceded by field visits upholding the principle of “seeing is believing’ and attaching the human face to the narratives and
discussions during the JASAR spaces. An inclusive technical working group was constituted allowing a representation of all stakeholders in organizing the JASAR activities. The national JASAR is preceded by a pre JASAR which allows stakeholders to pretest the methodology and conclude the preparations. A post JASAR has also been conducted in the previous 2 years to synthesize the JASAR discussions and identify recommendations to be integrated in the following FY planning and budgeting frameworks. This evolution has not only aroused participation but also collective ownership of the processes and leveraging on financial and technical human resources for conducting the reviews.
The participation of Non State Actors (NSAs) hasn’t not been active and competent until 2015, NSAs especially civil society were taking a passive role and invitations would be extended to a few to attend as observers. However, since 2015 NSAs have been accorded equal

THE 9TH NSA Statement8
space as state actors. They have prepared and presented own independent assessments, made financial contributions to meet process costs, financed own
participation and participation of their beneficiaries and provided technical input in the conceptualization and implementation of the events.

THE 9TH NSA Statement 9
The 9th JASAR of 2019 marks the 5th NSA active participation in the JASAR processes. It further falls at the locus point of national planning where the agriculture sector is equally required to develop a new ASSP. It therefore necessitates to not only look at the sector performance for the year 2018/19 but also reflecting on the sector performance for the concluding NAIP. This NSA paper therefore is multi-facetted, it provides for the sector performance for the FY 2018/19 as part of the broader performance of the sector for the concluding NAIP of 2015/16 – 2019/20. Additionally, this paper provides a snapshot of the sector performance
on the Comprehensive Africa Agriculture Development Programme (CAADP) commitments and on specific Sustainable Development Goals (SDGs). The paper further provides a snapshot of the NSAs contributions to the sector priorities as laid out in the Agriculture Sector Strategic Plan II (ASSP) with a focus on what needs to be done to set a foundation for agro-industrialization. The recommendations provided in this paper are focusing on the agriculture sector in the next ASSP II and not necessarily the next FY as it has been in the previous years.
2.0 Introduction
THE 9TH NSA Statement10
The agriculture sector remains central to the economy of Uganda. The sector employs majority of the population estimated at 64.6% according to the Uganda National House Hold Survey (UNHS 2016/17); with more women engaged in agriculture at 70.5% compared to men at 58.5%. The agricultural sector according to the NDPII is identified as one of the priority development sectors needed to achieve a “Transformed Ugandan Society from a Peasant to a Modern and Prosperous Country within 30 years.”
3.0.1 Agriculture sector and Uganda’s economy
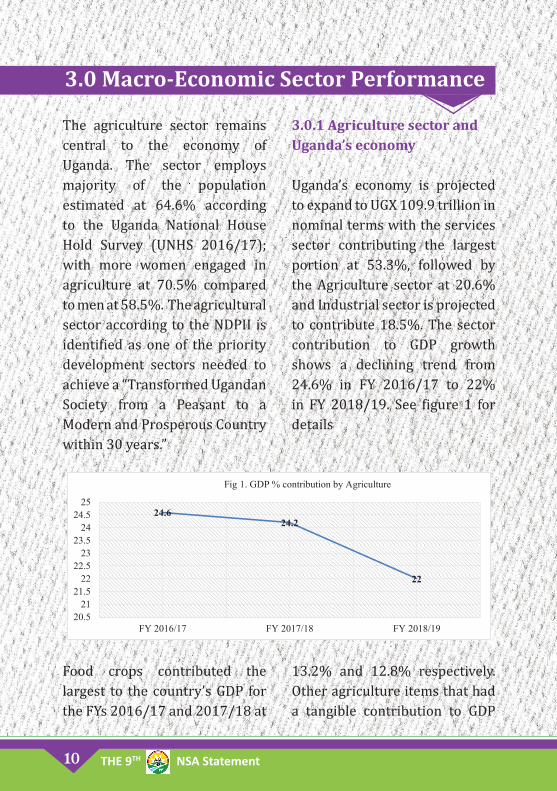
Uganda’s economy is projected to expand to UGX 109.9 trillion in nominal terms with the services sector contributing the largest portion at 53.3%, followed by the Agriculture sector at 20.6% and Industrial sector is projected to contribute 18.5%. The sector contribution to GDP growth shows a declining trend from 24.6% in FY 2016/17 to 22% in FY 2018/19. See figure 1 for details
3.0 Macro-Economic Sector Performance
24.6 24.2
22
20.521
21.522
22.523
23.524
24.525
FY 2016/17 FY 2017/18 FY 2018/19
Fig 1. GDP % contribution by Agriculture
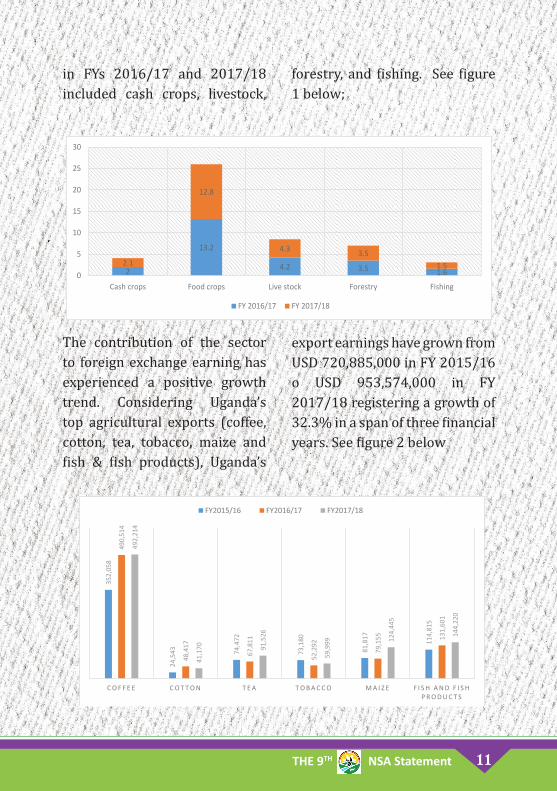
Food crops contributed the largest to the country’s GDP for the FYs 2016/17 and 2017/18 at
13.2% and 12.8% respectively. Other agriculture items that had a tangible contribution to GDP
THE 9TH NSA Statement 11
2
13.2
4.2 3.5 1.6 2.1
12.8
4.3 3.5 1.5
0
5
10
15
20
25
30
Cash crops Food crops Live stock Forestry Fishing
FY 2016/17 FY 2017/18
The contribution of the sector to foreign exchange earning has experienced a positive growth trend. Considering Uganda’s top agricultural exports (coffee, cotton, tea, tobacco, maize and fish & fish products), Uganda’s
export earnings have grown from USD 720,885,000 in FY 2015/16 o USD 953,574,000 in FY 2017/18 registering a growth of 32.3% in a span of three financial years. See figure 2 below
352,
058
24,5
43
74,4
72
73,1
80
81,8
17
114,
815
490,
514
48,4
17
67,8
11
52,2
92
79,1
55
131,
601
492,
214
41,1
70
91,5
26
59,9
99 124,
445
144,
220
C O F F E E C O T T O N T E A T O B A C C O M A I Z E F I S H A N D F I S H P R O D U C T S
FY2015/16 FY2016/17 FY2017/18
in FYs 2016/17 and 2017/18 included cash crops, livestock,
forestry, and fishing. See figure 1 below;
THE 9TH NSA Statement12
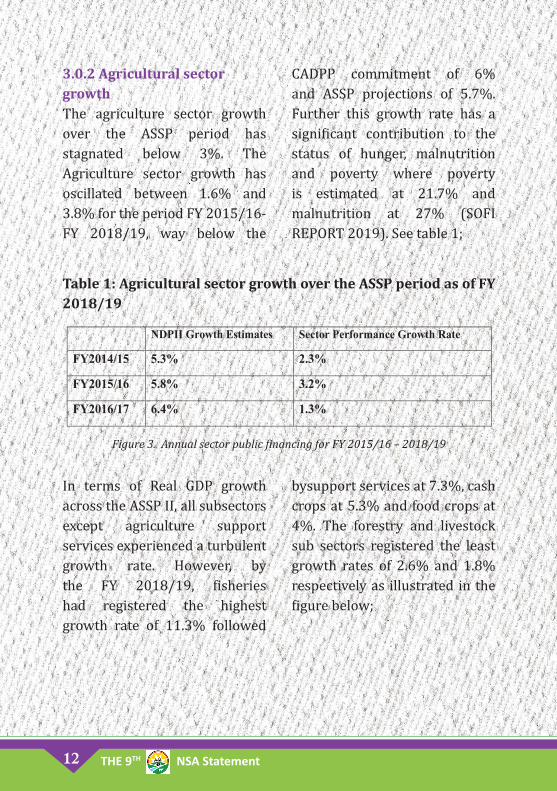
3.0.2 Agricultural sector growthThe agriculture sector growth over the ASSP period has stagnated below 3%. The Agriculture sector growth has oscillated between 1.6% and 3.8% for the period FY 2015/16-FY 2018/19, way below the
CADPP commitment of 6% and ASSP projections of 5.7%. Further this growth rate has a significant contribution to the status of hunger, malnutrition and poverty where poverty is estimated at 21.7% and malnutrition at 27% (SOFI REPORT 2019). See table 1;
Table 1: Agricultural sector growth over the ASSP period as of FY 2018/19
NDPII Growth Estimates Sector Performance Growth Rate
FY2014/15 5.3% 2.3%
FY2015/16 5.8% 3.2%
FY2016/17 6.4% 1.3%
Figure 3. Annual sector public financing for FY 2015/16 – 2018/19
In terms of Real GDP growth across the ASSP II, all subsectors except agriculture support services experienced a turbulent growth rate. However, by the FY 2018/19, fisheries had registered the highest growth rate of 11.3% followed
bysupport services at 7.3%, cash crops at 5.3% and food crops at 4%. The forestry and livestock sub sectors registered the least growth rates of 2.6% and 1.8% respectively as illustrated in the figure below;

THE 9TH NSA Statement 13
-6
-4
-2
0
2
4
6
8
10
12
14
Agriculture,forestry and
fishing
Cash crops Food crops Livestock AgricultureSupportServices
Forestry Fishing
Real GDP Growth Rates for FY 2015/16 – 2018/19
2015/16 2016/17 2017/18 2018/19
3.0.3 Sector Public Financing against ASSP I Costing
This section presents an analysis of the public financing for the agriculture sector against the ASSP costing and estimates as well as a critical review of performance of the sector against the inspirations of the Plan. According to the ASSP 2015/16-2019/20, a total of UGX 4,626.50 billion was the proposed amount
to be invested in the sector over the period. However actual allocations towards the sector fell short by UGX 1,543.89 billion/= representing a deficit of 33%. Although this may appear insignificant, it represents UGX 1,543.89/= billion in real terms an amount significant enough to support the provision of agricultural extension for two FYs

THE 9TH NSA Statement14
Table 2. ASSP COST and budgetary allocations to the sector over the ASSP period
Agency Established Posts
Filled Positions
Vacant posts %ge gap
DDA 140 65 75 54
NARO 994 881 113 11
NAGRIC 313 142 171 55
Total 1,447 1,088 359
From table 2, above it is observed that throughout the ASSP period, budget allocations to the sector have largely fallen below the
ASSP costings save for the first two financial years thus FY 2015/16 and FY 2016/17.
3.0.4 Budget performance of the sector votes
0
20
40
60
80
100
120
MAAIF DDA KCCA NAGRIC DB NARO NAADS Sec UCDO UCDA
% Budget % Budget spent %Releases spent
Fig 2. Average financial performance of Agriculture sector votes as at Dec 2018
Over the ASSP period as of December 2018, the financial performance of the agriculture sector votes in terms of the
percentage of budgets released; percentage of the budget spent and percentage of the releases spent was unevenly distributed
THE 9TH NSA Statement 15
across the sector votes/institutions.
In-terms of the average percentage of vote budgets released, Uganda Cotton Development Organization (UCDO) had the highest percentage of its institution budget released at 106.1% on average, followed by Uganda Coffee Development Authority (UCDA) at 96.55% on average. On the other hand, MAAIF had the least average percentage of its budget released at 64.65%.
Relatedly, taking the average percentage of the budget spent
in consideration, UCDO had the highest average percentage of the budget spent at 98.725% on average, followed by UCDA at 90% on average and in third place was NAADS secretariat with an average of 86.075%. MAAIF had the least average of its budget spent at 60.325%.
The Dairy Development Authority (DDA) had the highest percentage of releases spent on average at 95.125% followed by MAAIF at an average of 93.3% while KCCA had the least average of releases spent at 81.725%. See figure 4 for details and tables 3 and 4 for details

THE 9TH NSA Statement16
Tabl
e 3. B
udge
t Per
form
ance
-App
rove
d, re
leases
and o
uttu
rns
Vote
2015
/16 (U
GX-b
illion
) 20
16/17
(UGX
-billi
on)
2017
/18 (
UGX-
billio
n)
2018
/19 (
UGX-
billio
n)
Appr
oved
Re
lease
d Sp
ent
Appr
oved
Re
lease
d Sp
ent
Appr
oved
Re
lease
d Sp
ent
Appr
oved
Re
lease
d Sp
ent
MAA
IF
130.5
69
97.12
1 89
.393
248.2
02
164.8
45
153.7
92
331.3
28
257.9
71
243.5
96
358.7
29
143.1
05
133.7
46
DDA
5.044
3.9
17
3.907
6.6
19
6.108
6.6
01
6.966
6.7
33
6.634
6.7
35
3.723
2.7
61
KCCA
9.8
59
6.885
6.6
74
7.878
9.6
9 9.5
58
7.074
6.9
13
6.797
7.5
35
2.372
0.7
84
NAGR
IC D
B 4.9
5 4.3
24
4.413
13
.14
12.90
2 12
.972
14.57
9 11
.668
11.66
8 18
.061
8.524
6.2
87
NARO
98
.983
71.77
2 68
.491
114.1
37
93.07
8 92
.14
89.90
3 88
.643
88.04
3 69
.614
28.98
5 19
.971
NAAD
S Sec
17
8.975
18
3.654
18
3.569
31
8.607
31
8.94
317.6
92
279.7
05
279.7
05
279.1
62
249.9
88
160.8
17
105.4
59
UCDO
7.7
86
10.43
3 10
.426
7.395
9.0
62
9.142
8.6
83
8.352
8.3
2 9.8
13
7.031
4.0
85
UCDA
43
.792
43.09
1 42
.882
87.41
2 10
5.384
87
.497
76.9
72.34
1 70
.862
101.2
69
74.04
8 70
.777
Sour
ce-M
inistr
y of F
inanc
e, Pl
annin
g and
Eco
nomi
c Dev
elopm
ent. D
ate of
retri
eval,
27th Ju
ly 20
19
Tabl
e 4: P
erce
ntag
e Bud
get P
erfo
rman
ce –P
erce
ntag
e of b
udge
t rele
ased
, Per
cent
age o
f bud
get s
pent
& pe
rcen
tage
of re
leases
spen
t Vo
te 20
15/16
(Perc
entag
e) 20
16/17
(Perc
entag
e) 20
17/18
(Perc
entag
e) 20
18/19
(Perc
entag
e) se
mi-an
nual
Bu
dget
relea
sed
Budg
et sp
ent
Relea
ses
spen
t Bu
dget
relea
sed
Budg
et sp
ent
Relea
ses
spen
t Bu
dget
relea
sed
Budg
et sp
ent
Relea
ses
spen
t Bu
dget
relea
sed
Budg
et sp
ent
Relea
ses
spen
t M
AAIF
74
.4 68
.5 92
66
.4 62
93
.3 77
.9 73
.5 94
.4 39
.9 37
.3 93
.5 DD
A 77
.7 77
.5 99
.7 92
.3 99
.7 10
8.1
96.7
95.2
98.5
55.3
41
74.2
KCCA
69
.8 67
.7 96
.9 12
3 12
1.3
98.6
97.7
96.1
98.3
31.5
10.4
33.1
NAGR
IC D
B 87
.3 89
.1 10
2.1
98.2
98.7
100.5
80
80
10
0 47
.2 34
.8 73
.8 NA
RO
72.5
69.2
95.4
81.5
80.7
99
98.6
97.9
99.3
41.6
28.7
68.9
NAAD
S Sec
10
2.6
102.6
10
0 10
0.1
99.7
99.6
100
99.8
99.8
64.3
42.2
65.6
UCDO
13
4 13
3.9
99.9
122.5
12
3.6
100.9
96
.2 95
.8 99
.6 71
.7 41
.6 58
.1 UC
DA
98.4
97.9
99.5
120.6
10
0.1
83
94.1
92.1
98
73.1
69.9
95.6
So
urce
-Min
istry
of F
inan
ce, P
lannin
g and
Eco
nomi
c Dev
elopm
ent

THE 9TH NSA Statement 17
The sector continues to grapple with human resources challenges. The Auditor General in his 2018 report identifies three institutions under the agriculture sector that have
staffing challenges. These include the Diary Development Authority (DDA), National Agricultural Research Organization (NARO) and NAGRIC. See table 3 for details.
Table 5: Staff gaps in the agriculture sector
Agency Established Posts
Filled Positions
Vacant posts %ge gap
DDA 140 65 75 54
NARO 994 881 113 11
NAGRIC 313 142 171 55
Total 1,447 1,088 359
Source: OAG report 2018
Further still, the sector MPS has staffing gaps. The recruitment plan therein sets to recruit 115 personnel out of 218 creating a gap of 103. This being the final year of the ASSP, it is implied that the sector has operated with an understaffing gap of 47.25%. This staffing challenge is equally experienced at local governments, the service delivery mechanism for the agriculture sector.
Recommendations
• The agricultural sector is the only renewable sector. It is therefore significant to the micro and macro-economic transformation of the country leading to the future of industrialization, job creation and shared prosperity. We therefore recommend that; particular attention should be paid to
4.0 Human resources

THE 9TH NSA Statement18
investment in food crops due to their double-edged contribution to household and national food security and their exhibited contribution to GDP refer to figure 3 above.
• The positive growth realized in the fisheries sector at the end of the ASSP should be sustained. Investments should be geared to sustaining the fisheries resources, aquaculture, enforcement and standardization.
• Although the livestock sub sector sluggishly grew, the growth in urbanization and
middle class is anticipated to double the consumption of livestock products within and outside the country. Therefore, investment attention should be paid to sustaining the livestock subsector, value addition and integration of the crop and livestock sector.
• In the development of the next MTEF, human resource capacity should be highly negotiated in order to drive the sector and delivery of services to the majority of the population.

THE 9TH NSA Statement 19
5.0 Increasing agricultural production and productivity
Increasing agriculture production and productivity was identified as a priority area in the ASSP I, this decision was premised on the learning that increased production had resulted from increased acreages. Productivity of commodities continued to decline behind the backdrop of this ASSP.
The decline was attributed to; slow uptake of technological innovations, use of poor agronomical practices and high prevalence of pests and diseases. Government therefore directed investments at strengthening generation and adoption of research technologies; provision of extension services; and control of pests, diseases and vectors. This section therefore assesses selected categories of research, agricultural extension Sustainable Land Management (SLM), agricultural financing and access to labor saving technologies
5.0.1 Strengthening ecologically Sound Agriculture Research and Climate resilience technologies and practices
Under the ASSP, GOU admits that despite the increased generation of research technologies by National Agriculture Research Organization (NARO), majority of the smallholder farmers haven’t accessed or adopted these technologies. This is reflected in significantly wide yield gaps between the on-station and on-farm out puts. Additionally, farmers continue to grapple with the effects of climate change characterized by erratic weather patterns which impact on agricultural production and productivity. The low research uptake has been signaled out as a challenge throughout the four years of implementation of the ASSP. To accelerate production and productivity at national and household level, the ASSP

THE 9TH NSA Statement20
2015/16 -2019/20 therefore prioritized generation and up scaling the use of sound agricultural research and climate change resilient technologies across the priority and strategic commodities.
We commend Government of Uganda through MAAIF for the establishment and strengthening of 15 semi-autonomous public institutions under policy guidance of the NARO Secretariat. These institutions have continued to build research capacity and reputation for over decades. During the assessment period, NARO and her semi-autonomous institutions have continued performing the research function, they have generated new varieties and submitting them to the varieties committee for release, for insistence, NARO surpassed its targets of generating 82 productivity improved technologies and instead generated 96. In addition, where NARO had targeted to present at least 47 of these new varieties to the variety release committee,
it successfully presented 41 of them. In the FY 2016/17, NARO generated 64 improved technologies and submitted 21 of them to the variety release committee.
We are concerned however that the end of the ATAAS project that was funding over 90% of the core research and technology work under NARO for seven years affected the operations of NARO research institutions. Whereas absenteeism of technical officers at these research institutions was recorded in FY 2017/18, by the start of 19/20, actual staff turnover was instead being reported. At the closure of ATAAS in 2017, a slowdown in research and technological generation coupled with the poor maintenance and sustainability of the on farm and off farm trials and experiments had been recorded.
Whereas agricultural research posts feasible returns to investment and its efficacy in turning around the growth

THE 9TH NSA Statement 21
in agricultural productivity, the NARO budget has been inconsistent over the years i.e. UGX114.14bn in FY2016/17, Ugx84.104bn in FY2017/18, Ugx62.354bn in FY2018/19 and Ugx81.4bn in FY2019/20 against the ASSP costing of UGX327, 65 billion, way below 2% of the national budget, and less than ten percent of Gross Domestic Product (GDP), quite below the Comprehensive African Agricultural Development Program (CAADP) target1. To ensure that agricultural research effectively contributes to economic growth, food security and poverty alleviation through generation of appropriate technologies, proper funding must be ensured. In order to exploit the full potential of the research function, lessons must be learnt in a programme design such as the ATAAS that was conceptualized in a research extension perspective. Such a design should be scaled up while
conceptualizing the function in the ASSPIII
A lot of research information generated in the country has not been taken up as evidenced in the MPS FY 2017/18 and the subsequent annual budgets per sector. This is attributed to the weak research extension; Poor information flow and feedback mechanism between research institutions and farmers, limited capacity to track technology adoption and impact, resource gaps (human, physical, financial and information), limited capacity to retain staff”.2
It is evidenced that many NGOs disseminate technologies generated by NARO to their farmer beneficiaries, however, there is no system to record such engagements and also provided harmonized feedback on performance of the varieties to the research institutions. Although NGOS have designed and implemented models aimed
1 Lukwago (2017), Increasing Agricultural Sector Financing, “Why it Matters for Uganda’s Socio-eco-nomic Transformation´. 2 NARO Strategic plan 2017/18
THE 9TH NSA Statement22
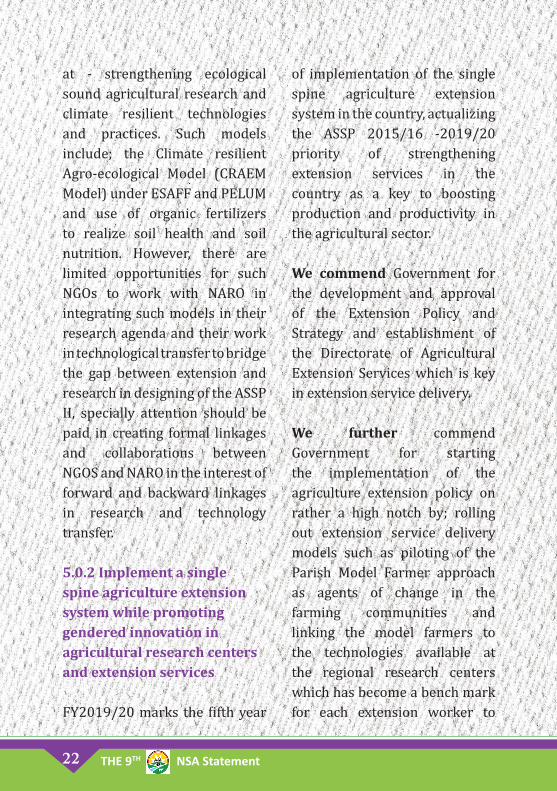
at - strengthening ecological sound agricultural research and climate resilient technologies and practices. Such models include; the Climate resilient Agro-ecological Model (CRAEM Model) under ESAFF and PELUM and use of organic fertilizers to realize soil health and soil nutrition. However, there are limited opportunities for such NGOs to work with NARO in integrating such models in their research agenda and their work in technological transfer to bridge the gap between extension and research in designing of the ASSP II, specially attention should be paid in creating formal linkages and collaborations between NGOS and NARO in the interest of forward and backward linkages in research and technology transfer.
5.0.2 Implement a single spine agriculture extension system while promoting gendered innovation in agricultural research centers and extension services
FY2019/20 marks the fifth year
of implementation of the single spine agriculture extension system in the country, actualizing the ASSP 2015/16 -2019/20 priority of strengthening extension services in the country as a key to boosting production and productivity in the agricultural sector.
We commend Government for the development and approval of the Extension Policy and Strategy and establishment of the Directorate of Agricultural Extension Services which is key in extension service delivery. We further commend Government for starting the implementation of the agriculture extension policy on rather a high notch by; rolling out extension service delivery models such as piloting of the Parish Model Farmer approach as agents of change in the farming communities and linking the model farmers to the technologies available at the regional research centers which has become a bench mark for each extension worker to

THE 9TH NSA Statement 23
support at least one (1) model farmer per parish. And such other models like the farmer-village agent model that creates strong linkages between access to input, extension and access to markets.
We are however concerned that at the start of the implementation of the single spine, cabinet approved the recruitment of only 5000 extension workers against
a total of 8,408 extension works, indicating a gap of 41%. However, the recruitment process stalled at 3,820 extension workers by FY 2017/18. In addition, out of the 1456 approved technical positions at district, only 846 had been filed by FY 2016/17 and out of 6952 approved technical positions at sub county level, only 2945 had been filled during the same year.
Deficit in recruitment of extension workers at district and sub county levels
1456
6952
8408
267 11
89
994
5958
1261
7147
848
608
2945
4007
3811
4615
0100020003000400050006000700080009000
Approvedtechnicalpositions
FilledTechnicalpositions
Unfilledpositions
Approvedtechnicalpositions
FilledTechnicalpositions
Unfilledpositions
Approvedtechnicalpositions
FilledTechnicalpositions
Unfilledpositions
District Sub county Local Government
2013 2014 2018
Source: construction based on data from Department of
Agricultural Extension Services (2018) and ITC Report, 2013
Whereas the national average of recruitment stands at 76.4 %, DLGs are experiencing a staffing
gap of 42 and 58% at district and sub county respectively. It should further be noted that that at the
THE 9TH NSA Statement24
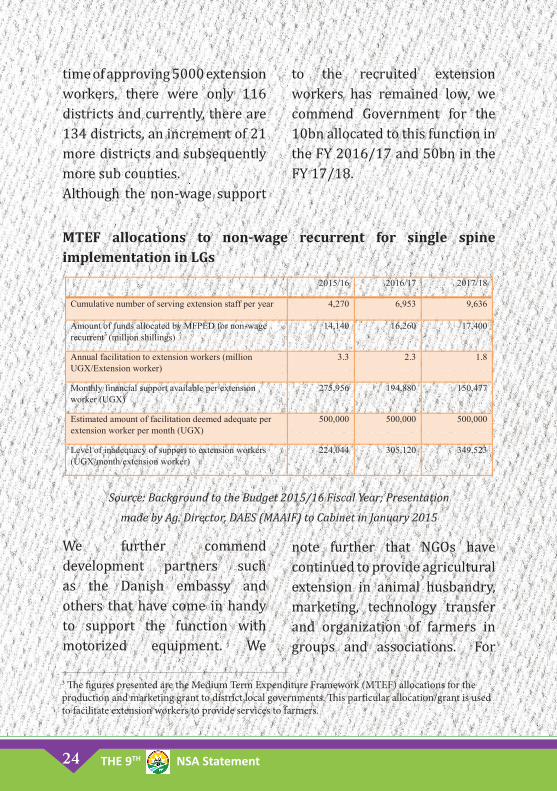
time of approving 5000 extension workers, there were only 116 districts and currently, there are 134 districts, an increment of 21 more districts and subsequently more sub counties. Although the non-wage support
to the recruited extension workers has remained low, we commend Government for the 10bn allocated to this function in the FY 2016/17 and 50bn in the FY 17/18.
MTEF allocations to non-wage recurrent for single spine implementation in LGs
2015/16 2016/17 2017/18
Cumulative number of serving extension staff per year 4,270 6,953 9,636
Amount of funds allocated by MFPED for non-wage recurrent3 (million shillings)
14,140 16,260 17,400
Annual facilitation to extension workers (million UGX/Extension worker)
3.3 2.3 1.8
Monthly financial support available per extension worker (UGX)
275,956 194,880 150,477
Estimated amount of facilitation deemed adequate per extension worker per month (UGX)
500,000 500,000 500,000
Level of inadequacy of support to extension workers (UGX/month/extension worker)
224,044 305,120 349,523
Source: Background to the Budget 2015/16 Fiscal Year; Presentation
made by Ag. Director, DAES (MAAIF) to Cabinet in January 2015
We further commend development partners such as the Danish embassy and others that have come in handy to support the function with motorized equipment. We
note further that NGOs have continued to provide agricultural extension in animal husbandry, marketing, technology transfer and organization of farmers in groups and associations. For
3 The figures presented are the Medium Term Expenditure Framework (MTEF) allocations for the production and marketing grant to district local governments. This particular allocation/grant is used to facilitate extension workers to provide services to farmers.

THE 9TH NSA Statement 25
insistence; heifer international invested 34M Shs in supporting youth with tricycles to transport their bulky products. Further, they established and facilitated 73 community based extensionists and has spent 350, 400,000M Shs on the agro vet community based extension system. In addition they have trained 255 farmer field school facilitators
Recommendations
• Recalling the presidential commitment (1st state of the nation address in the current term) the agricultural Extension Bill was among the first priority legal instruments stated by him to be enacted in this term of office. We therefore recommend that the enactment of this law should be expedited to provide the legal framework for the provision of this critical service.
• The recruitment of agricultural extension workers to fill up the vacant
positions in the old and newly created districts should a priority in the earlier years of the next planning phase. Failure to substantially recruit the required numbers and competencies (agronomists, veterinary and animal scientist, mechanization and irrigation engineers and nutritionists) shall jeopardize all the efforts and investments so far made in this area.
• Allocation of a non-wage budget is essential to yield the full efficacy of the agricultural extension workers. We urge stakeholders, both state and non-state, to contribute towards this critical priority.
• Institutionalize the linkages between DEAS and all NGOs providing agricultural extension. This is important for harmonization of methodology and messages as well as quantifying the provision and access of agricultural extension.

THE 9TH NSA Statement26
5.0.3 Control pests, disease and vectors
Controlling of diseases, pests and vectors was designed as strategic integration under increasing production and productivity. The intervention aimed at; reducing the prevalence of production and trade sensitive disease, creating orderly livestock, crop and fisheries marketing protocols and improving the public sanitary and photo sanitary control systems to ensure that value added products do not transmit pests and diseases. The ASSP therefore planned to take action in controlling crop and livestock pests and diseases, through, strengthening regulatory frameworks, conducting early detection, establishing and maintaining functional control infrastructure and managing pests, diseases and vectors. We commend government for the rapid response mechanisms that have been exhibited during the life of the ASSP e.g. during the occurrence of food and mouth disease in various parts of the country MAAIF has conducted
quarantines, the outbreak of the fall army warm in 2017, bird flu in 2017 where government and various stakeholders responded and managed to the present day. We however note that farmers have continued struggling with disease, vectors and pests among crops, livestock and fisheries. Many of such have not received national attention but have significantly impacted on the production and productivity e.g. Swine fever, CBSD, grass land termites in the rangelands, tick resistance, poultry diseases among others.
Whereas the economic losses from plant diseases can hardly be found, in many African countries Uganda inclusive, (PARM, 2017), their impact on production, productivity and investment is immerse. The loss caused ranges from 10 to 20% in pre harvest and 20 to 30% in post-harvest, while above 100 in perishables. Among the priority enterprises to ASSP such as cotton, banana and cassava, the losses range between 10million dollars, 35 to 200 million dollars and 60 to

THE 9TH NSA Statement 27
80 million dollars respectively. These outbreaks equally impact on the food and nutrition security at household and nation level as well as household incomes. E.g. the army fall worm significantly contributed to the food insecurity of 2017 and pastoral communities under quarantine have significantly drowned into poverty and lost livelihoods. The agriculture Minister Vincent Ssempijja in 2017 as quoted by reliefweb said that the impact of the fall army worm infestation could be responsible for the loss of at least 450,000 tonnes of maize or $192.8 million worth of maize exports.4
We are however concerned that through the ASSP period, pests, diseases and vector control have not been adequately financed and sighting funding gaps every FY. This has resulted in impromptu responses during outbreaks and inadequate management, e.g. in FY 2017/18, availability and distribution of foot and mouth disease vaccine and related
livestock controls had a funding gap of 4B Shs, emergency control of tsetse flies and nagana in Karamoja and other 20 district and routine surveillance in tsetse fly prone districts had a funding gap of 8.2B. The current breakouts of foot and mouth disease in the different cattle rearing districts have continued to distress farmers and affected the performance of the sub sector. The current ban on vaccine importation is worsening the situation in the districts were it has reemerged.
Recommendations
• To facilitate prompt response to outbreaks there’s need to increase funding for the same by closing the funding gaps that have characterized funding for this cause in the life time of the ASSP.
• Government should prioritize mitigation measures instead of banking on rapid response even when the outbreak has caused
4 https://reliefweb.int/report/uganda/army-worm-invasion-wipes-12pc-yield

THE 9TH NSA Statement28
damage like it has been on several occasions of these outbreaks.
• Government should enhance the inspection and monitoring with a robust communication mechanism from the communities to the Ministry.
5.0.4 Promoting sustainable land management (SLM) and adaptation of climate change resilient agricultural production systems, technologies and practices.
In the concluding ASSP, MAAIF designed to promote adaptation of climate change resilient agricultural production systems, technologies and practices especially in areas of increasing climate change stress. It planned to undertake interventions targeting specific climate smart adaptation actions such as; promoting and bulking of drought tolerant varieties, water harvesting, index based weather insurance, conservation agriculture, agroforestry, smart climate villages among others.
As the ASSP comes to an end, land degradation is becoming a major impediment to agricultural production and productivity. As stated in our other statements, the fertility and productivity of Uganda’s land is declining. Arable land has continued to reduce as competing demands for land use continue to increase such as; urbanization is growing at 5.4% as industrialization and new ventures such as oil and gas join tourism and forestry to gazette land formerly used for production. Tenure insecurity is high among farmers, majority of whom have not registered rights of ownership but rather have been enjoying use and access rights. Whereas MAAIF devised in the ASSP to provide for SLM, under other production and productivity enhancing measures, land use was not clearly prioritized in the NDPII curtailing the financing of interventions in this area.
We reiterate our concern about the reduction in annual productivity rate of 1.3 over the last two years and the fact that

THE 9TH NSA Statement 29
Uganda continues to produce at 30% of its potential. The productivity rate for instance in coffee if averaging at 600Kgs per hectare compared to 3000Kgs per hectare in Vietnam. About 36% of the total Uganda surface land is under severe land degradation and 10% is severely degraded. The cost of natural resource degradation estimated at 17% of GDP continues to haunt the macro and micro sections of the country.
We further reaffirm our agreement with the World Bank that by only strengthening land use management and tenure security, Uganda can exploit the potential to increase agricultural productivity by 5.1%.
We commend stakeholders, state and non-state for designing and implementation of interventions to scale up SLM. e.g. the strategic investment framework for SLM that aim for upscaling SLM practices across sectors programmatically to avoid duplication across sectors and stakeholders, the climate
smart agriculture programme that aimed at achieving climate resilient and low carbon agriculture and food systems contributing to increased food security, wealthy and sustainability.
We further recognize several SLM projects that have been implemented with support from development partners in line with national vision 2040 these include; SLM Mainstreaming project, SLM Enabling Environment, Kagera TAMP, Stimulating Community Initiatives in SLM, Climate Smart Agriculture Project, Sustainable Charcoal Project, SLM Climate Change Highlands Project, ATAAS SLM Sub-Component, Karamoja Food Security Project, Mt Elgon Integrated Land Management Project.
CSO contributions too have been commendable, these have been in the areas of promoting agro ecology, such as SATNET in Bundibugyo and Kasese. Civil society have also organized spaces for dialogue to inform

THE 9TH NSA Statement30
programming such as; the 1st National agroecology conference organized by PELUM-Uganda.
SLM case for Rubaya Sub county Kabale districtSLM intervention: Check dams, trenches and bench terracing, water harvesting and integrated farming practicesAcreage 1.7
Enterprises: 450 apple trees, vegetables, pineapples, citrus and mangoes, goats, sheep, rabbits and cows on this piece of land.
Results: - each apple tree can produce upto 300 fruits per season and each apple fruit is sold at Shs 500 generating 150,000 Ug shs per season.
5.0.5 Increased access to agricultural financing
The ASSP designed to increase access to agricultural finance services by implementing commodity based development credit facilities with specific focus on the 12 priority and 4 strategic commodities. Over the ASSP period, access to agricultural finance to drive production and productivity,
We further commend DLGs that have undertaken the implementation of various interventions in the areas of SLM.
has been a priority challenge especially for small holder farmers. The cost of financing in agriculture is influenced by macroeconomic stability prevailing in the country, monetary policies such as those geared to manage inflation equally affect agricultural financing just like any other financing in the market.
We commend stakeholders

THE 9TH NSA Statement 31
-state and non-state that have continued creating facilities and products designed to target the agricultural sector. Whereas there has been a growth trend in agricultural lending, during the period of the ASSP, the first year of the ASSP 2015/16, is within the bracket where agricultural lending was experiencing a decline. However, a steady growth in agricultural lending has been witnessed from that time to date.
Whereas the ACF has continued in operation for 10 years now, we recognize with concern the inconsistence in the allocation of funds to this facility and the terms and conditions of accessing these funds. Although the funds allocated to the fund increased from 20.5BN in 2009/10 to 30Bn in 2015/16 and 50Bn in 2016/17, no further disbursements were made in 2017/18.
It’s established that commercial banks instead contribute
the largest share of the total agricultural lending. Agriculture lenders prefer lending at the higher levels of the value chain (processing and value addition) e.g. between 2015 – 17, lending to processing increased by 60% from 4.8trillion to 7.7trilion UGX although it slightly reduced to 7.4 trillion in 2018. Production lending on the other hand, increased by only 17% between 2015 and 2018 from a total loan value of 5.6trillon to 6.5 trillion in 2018. Lending to marketing has instead declined from 2.8trillion in 2016 to 2.5 trillion in 2018. This may be a result of the presidential drive for value addition and consequently the prioritization of processing by ACF as at May 2019, 149Bn UGX about 45.1% of the total disbursement had been disbursed to processing and Agri business for value addition.5 On the other hand, the facility only disbursed 80Bn i.e. 24.1% to on farm production activities and 71.8Bn which is 21.7% disbursed as working capital for grain trading.
5 Agricultural credit facility progress report March 2019

THE 9TH NSA Statement32
Figure. 6 Total outstanding loans to by agricultural activity 2010 – 2018.
The agric. sector in relation to financing has been characterized as risky, this may explain why lending to agriculture has consistently attracted high interest rates compared to other sectors such as trade and manufacturing. e.g. Between 2015 -18 RFIs under ACF had only disbursed 900m at 8% interest rate to agriculture compare to 2.1Bn and 3.6Bn that had been disbursed to manufacturing and trade respectively.
It should also be noted that more loans at an interest rate
as high as 30% and above where disbursed by commercial banks to agriculture to a tune of 329Bn compared to 31.9Bn and 287.9Bn that were disbursed to trading and manufacturing sectors respectively.6
Reflecting on the loan amounts disbursed at 30 plus percent, against those disbursed at 8% indicates that it’s not a matter of interest rates but other terms and conditions that could be impeding agriculture sector actors to access ACF. For instance, efforts to reduce the minimum
6 Agricultural financing year book, 2019
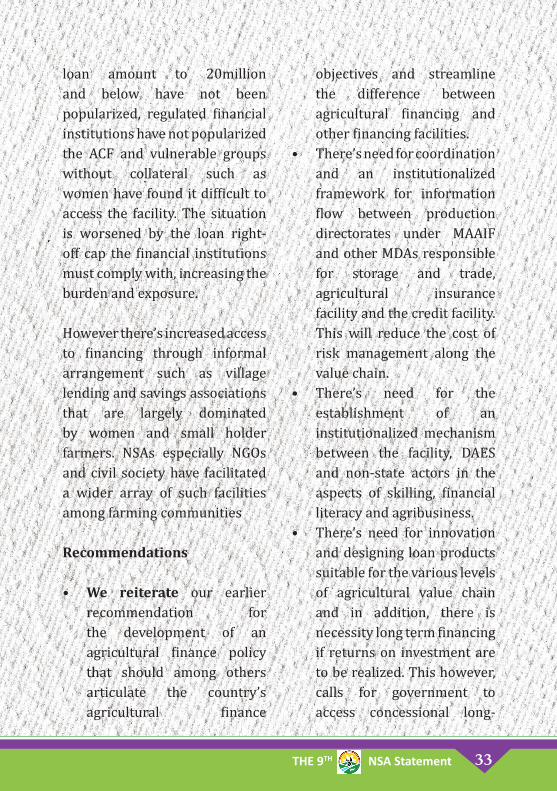
THE 9TH NSA Statement 33
loan amount to 20million and below have not been popularized, regulated financial institutions have not popularized the ACF and vulnerable groups without collateral such as women have found it difficult to access the facility. The situation is worsened by the loan right-off cap the financial institutions must comply with, increasing the burden and exposure.
However there’s increased access to financing through informal arrangement such as village lending and savings associations that are largely dominated by women and small holder farmers. NSAs especially NGOs and civil society have facilitated a wider array of such facilities among farming communities
Recommendations
• We reiterate our earlier recommendation for the development of an agricultural finance policy that should among others articulate the country’s agricultural finance
objectives and streamline the difference between agricultural financing and other financing facilities.
• There’s need for coordination and an institutionalized framework for information flow between production directorates under MAAIF and other MDAs responsible for storage and trade, agricultural insurance facility and the credit facility. This will reduce the cost of risk management along the value chain.
• There’s need for the establishment of an institutionalized mechanism between the facility, DAES and non-state actors in the aspects of skilling, financial literacy and agribusiness.
• There’s need for innovation and designing loan products suitable for the various levels of agricultural value chain and in addition, there is necessity long term financing if returns on investment are to be realized. This however, calls for government to access concessional long-

THE 9TH NSA Statement34
term funding in this interest. • • Provide an enabling legal
and regulatory framework for the ACF that addresses
the issue of right-off by the participating financial institutions.

THE 9TH NSA Statement 35
6.0 Increasing Access to Critical Farm Inputs
The priority area of increasing access to critical inputs in the ASSP I, was premised on the inability of small scale farmers estimated to produce 75 – 80% of the total agricultural output and operating on a land acreage between 2 to 200acres to access appropriate farm inputs. MAAIF recognizes that there’s a huge potential for increasing production and productivity of small scale farmers with increased access to critical farm inputs. In the ASSP 2015-2020, MAAIF prioritized agricultural machinery, quality seeds and planting materials, water for agriculture production and fertilizers as critical inputs to contribute to national wealth creation and improved employment along agricultural value chains.
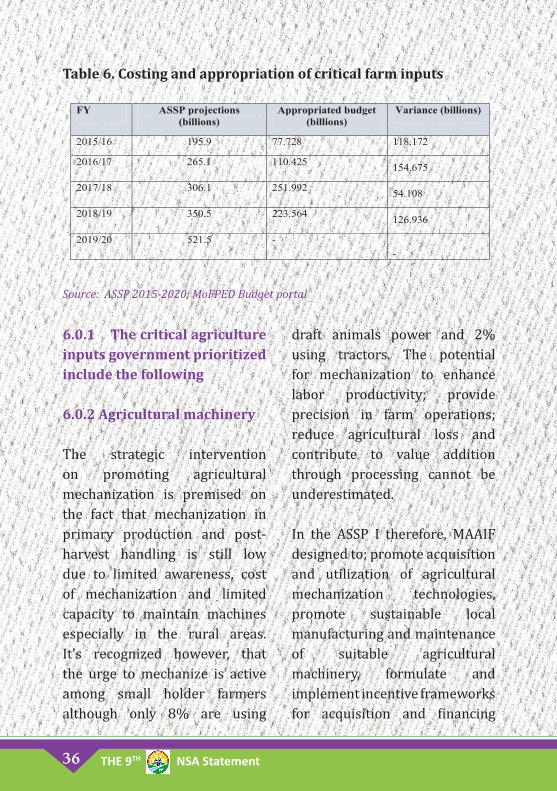
In order to achieve the desired plan, the ASSP costed this priority. We commend government and other stakeholders for the achievements made in supporting access to critical farm inputs, we are however concerned that the planned allocation targeting increased access to critical farm inputs in the ASSP was projected at UGX 1,639.1 billion, has had a short fall of 52% (853.3 billion) in the appropriation over the 5 years of ASSP implementation as detailed in the table below. This explains the public outcry on the quantity, quality and efficacy of the input distribution throughout the ASSP period.
THE 9TH NSA Statement36
Table 6. Costing and appropriation of critical farm inputs
FY ASSP projections (billions)
Appropriated budget (billions)
Variance (billions)
2015/16 195.9 77.728 118.172
2016/17 265.1 110.425 154.675
2017/18 306.1 251.992 54.108
2018/19 350.5 223.564 126.936
2019/20 521.5 - -
Source: ASSP 2015-2020; MoFPED Budget portal
6.0.1 The critical agriculture inputs government prioritized include the following
6.0.2 Agricultural machinery
The strategic intervention on promoting agricultural mechanization is premised on the fact that mechanization in primary production and post-harvest handling is still low due to limited awareness, cost of mechanization and limited capacity to maintain machines especially in the rural areas. It’s recognized however, that the urge to mechanize is active among small holder farmers although only 8% are using
draft animals power and 2% using tractors. The potential for mechanization to enhance labor productivity; provide precision in farm operations; reduce agricultural loss and contribute to value addition through processing cannot be underestimated.
In the ASSP I therefore, MAAIF designed to; promote acquisition and utilization of agricultural mechanization technologies, promote sustainable local manufacturing and maintenance of suitable agricultural machinery, formulate and implement incentive frameworks for acquisition and financing

THE 9TH NSA Statement 37
of labor saving technologies, strengthening capacity for technical information acquisition, equipment evaluation and sustainable acquisition of agricultural machinery, establish an agric. Mechanization center, strengthen the capacity of technical and vocational institutes and strengthen collaboration with the national bureau of standards to eliminate importation of substandard agricultural mechanization equipment. We commend Government for including agricultural mechanization among the critical agriculture inputs. We further commend government for procuring 366 tractors, however this is only 10.5% of the targeted tractors and 2000 OX ploughs procured in the FY 2018/19 which representing 13% of the total planned target. To compliment these efforts, there’re several other mechanization technologies such as; tractors, OX ploughs, shellers, planters, harvesters and processing equipments such as
mills procured and distributed by NGOs and the private sector. We recommend therefore that Government should expedite the conclusion of the Draft Mechanization Policy 2017 whose overall goal is to increase national food production and security through enhanced agriculture mechanization.
6.0.3 Improving access to high Quality seeds and planting materials
This strategic intervention was premised on the fact that, about 15% of the crop area in Uganda was planted with improved seeds in 2014 and therefore targeted to increase it to 20% by the FY 2019/20. To achieve this, the ASSP sought to; strengthen and rationalize the department of regulation and certification, enhancing capacity of private sector seed companies, strengthening laws and policies for agriculture input, upscaling use of improved and climate change resilient seeds and planting materials,

THE 9TH NSA Statement38
strengthening the national certification and regulation system, increase access to quality seeds and planting materials.
Government through the Operation Wealth Creation (OWC) program has continued to avail farmers with seeds and planting materials. For example, by 31st December 2018 NAADS Secretariat distributed to farmers and farmers’ groups 3.124mt of maize; 0.315mt of bean seeds; 368,820 banana suckers; 6,856 bags of seed potato; heifers 837 heifers; 100 improved pigs; 8,400-day old layer chicks; 12,000 Kuroilers,
110 tractors and 72,240kgs poultry feeds.
Although most of the districts received the inputs, they were in lesser quantities than allocated. Some districts like Zombo did not receive allocated inputs while others differed receipt of inputs and planting to subsequent periods when rains are expected. Late delivery, inadequate quality of the materials, inconsistence with the ecological zones and weak linkages with extension services have remained the core barriers in achieving the desired outcomes.
It’s important to note that CSOs have contributed enormously in this area, this has mainly been in form of;
-Developing and implementing models that empower and sustainably facilitate access to quality and diverse seeds by small holder farmers, for example the Community Managed Seeds Security Model (CMSS) and The ISSD Local Seeds Business Model have provided availability and access to both locally diverse seeds and seeds of quality declared seeds. Small holder farmers were supported with improved planting materials of cassava cuttings (NARO CAS 1) resistant to cassava Brown streak virus disease, beans (NARO bean 1 and 3) which are better yielding varieties.
In addition, CSOs have immensely invested in the distribution of seeds and animal breeds to farmers across the country. It’s should be noted however, that many NGOs have been trapped in the distribution of inferior and adulterated inputs owing to a largely unregulated input distribution trade in the country.

THE 9TH NSA Statement 39
CSO Case Contribution: Access to seed input for small holder farmers through the Community Managed Seed Security Model (CMSS)
Community Managed Seed Security (CMSS) model is a participatory farmer-led approach for systematically planning and executing interventions towards promoting farmers’ seed security and seed sovereignty. The model consolidates the existing good seed security practices into a comprehensive approach for promoting community led seed security among smallholder farmers.
Recommendation
• Whereas OWC has remained the main input distribution mechanism, it has evolved in order to become responsive to public outcry and strategic direction of the government. However, we recommend that the agriculture sector requires a well elaborated and articulated agricultural input distribution system. A system that does not focus on distribution of free inputs but linked to agricultural extension, agricultural financing, insurance with strong market linkages.
• Government should consider procurement of planting materials and animals locally for purposes of traceability, agro ecological concerns,
building capacity of local input suppliers, economic empowerment.
6.0.4 Water for agriculture production
Increasing water for production and a critical farm input, was premised on the fact that, Uganda’s agriculture that is rain fed is continuously surrendering to climate change variabilities.
Droughts and floods continue sweeping away agricultural farms directly or indirectly through diseases and pests. The livestock sector especially in the rangelands has recorded gross losses of animals during drought due to lack of water. The agricultural crop sector, is challenged while only 1.2% of the

THE 9TH NSA Statement40
total irrigable area of 3.03 million hectares is under irrigation in a country whose 15% of total surface area is occupied with water and receives an annual rain fall of 500 – 1500ml.
In the ASSP, MAAIF designed interventions to strengthen the legal and institutional framework for developing water for agricultural production, increasing modern irrigation technologies and promoting rain water harvesting and storage at house hold level.
We commend Government of Uganda for the development of the National Irrigation Policy (NIP), 2018 aimed at promoting irrigation, development and management to enhance water use efficiency for increased sustainable agricultural production and profitability to ensure food security and wealthy creation. The policy framework, is a step forward in streamlining roles and therefore direct adequately investment for water for production between the two core sectors of W.E
and agric. However, there’s still need for an elaborate strategy and/or master plan to guide planning and implementation of interventions.
We further commend the Government of Uganda for the investment in water for production especially the large irrigation schemes that have been completed in the life of this ASSP including Mubuku II, Doho and Olweny Irrigation, however, there has been limited access and uptake of appropriate water for agricultural production technologies by the majority small holder farmers. These large scale irrigation schemes do not favor most small scale farmers who are the majority in the sector. We therefore commend Government for investing in construction and desilting of 110 valley tanks, tunnels and fish ponds in the cattle corridor in the FY2017/18 and such other on-farm water for production technologies, we are however concerned that several water for production technologies that are established
THE 9TH NSA Statement 41
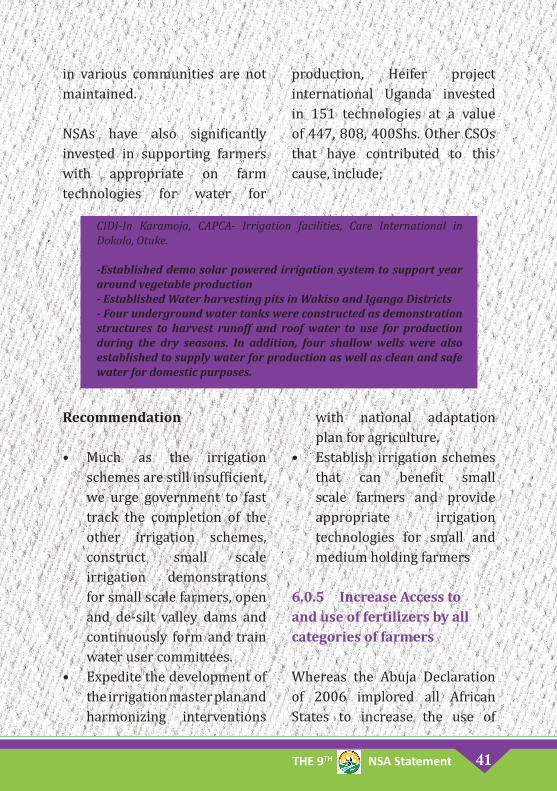
in various communities are not maintained.
NSAs have also significantly invested in supporting farmers with appropriate on farm technologies for water for
production, Heifer project international Uganda invested in 151 technologies at a value of 447, 808, 400Shs. Other CSOs that have contributed to this cause, include;
CIDI-In Karamoja, CAPCA- Irrigation facilities, Care International in Dokolo, Otuke.
-Established demo solar powered irrigation system to support year around vegetable production- Established Water harvesting pits in Wakiso and Iganga Districts- Four underground water tanks were constructed as demonstration structures to harvest runoff and roof water to use for production during the dry seasons. In addition, four shallow wells were also established to supply water for production as well as clean and safe water for domestic purposes.
Recommendation
• Much as the irrigation schemes are still insufficient, we urge government to fast track the completion of the other irrigation schemes, construct small scale irrigation demonstrations for small scale farmers, open and de-silt valley dams and continuously form and train water user committees.
• Expedite the development of the irrigation master plan and harmonizing interventions
with national adaptation plan for agriculture.
• Establish irrigation schemes that can benefit small scale farmers and provide appropriate irrigation technologies for small and medium holding farmers
6.0.5 Increase Access to and use of fertilizers by all categories of farmers
Whereas the Abuja Declaration of 2006 implored all African States to increase the use of

THE 9TH NSA Statement42
fertilizers to at least 50kgs on nutrients per hectare per year by 2015, Uganda’s average fertilizer usage is estimated at 1Kg per hectare. This is as result of the limited access and availability of fertilizers to small holder farmers, erroneous perceptions about the fertility of soils, limited access to soil education and technologies for testing and limited information on soil fertility management.
We commend Government for including fertilizers among the critical inputs that can boost agricultural production and for committing to promote the use of both organic and inorganic fertilizers in the ASSP 2015-2020. Much as this is a critical input a lot of emphasis has been put on scientific research neglecting research on organic agriculture.
We recommend that Government through MAAIF priorities research on Organic agriculture innovations like use of organic fertilizers to boost crop production and soil health.
We further commend Government for the development of National fertilizer policy, 2016 with a policy goal of reducing nutrient loss through soil erosion by 30 kg per hectare per year and raise the use and application levels of fertiliser to at least 50 kg of nutrients per hectare per year by 2020. Whereas there’s more emphasis on the application of fertilizer, little attention is paid to assessing the soil nutrient needs and appropriately apply the required fertilizer. This knowledge gap has actually affected production and productivity as farmers blindly plant wrong crops in right soils and vice versa. Soil science is not highly promoted as part of agricultural research and soil testing kits have not been prioritised as critical farm inputs.
Civil society on the other hand, have invested and promoted production practices that mitigate soil nutrient degrading practises and others that promote production and use of organic composite, e.g. Heifer

THE 9TH NSA Statement 43
project International Uganda distributed fertilizers to 188 farmers at a cost of 19, 612, 500Shs. AFIRD and RUCID Trained farmers on making and application of organic manure (compost, liquid). This is made using plant and animal remains, Purchased fertilizer and raw materials for making organic fertilizers during the training. Among the small holder farmers, vermiculture technology was introduced where each group was supported to construct a vermiculture unit. This was intended to support the farmers make organic compost using animal waste, crop remains at the same time improving the sanitation on the farm. In addition, farmers could earn income through selling of vermi compost and vermi tea.
Recommendations
• Whereas Uganda hit a milestone in approving the fertilizer policy in 2017 in reponse to the global policy concern of low use of fertlizer, other practical and affodable
interventions by farmers and other stakeholders need to be undertaken for instance, scaling out such models like the farm planning model www.fra.ug which enables farmers to plan their farm plans upon being guided by the findings of the soil fertility profiling execises of their farm lands.
• All stakeholders (NSAs and Government) should priotize issues of land use, soil health and nutrition on their agenda of agric transformation, specifically, consider the recruitment of soil specilists at the levels of planning and implementation. Soil testing kits are essential agri-inputs and the recruited extension service providers should be retooled on these aspects.
• MAAIF should liaise with other Government MDAs specifically Ministry of Lands, Housing and Urban Development (MoLHUD) with respect to land policy and land management issues to ensure implementations
THE 9TH NSA Statement44
of complementary interventions necessary for achieving impact on the core mandates of MAAIF as is stated in the implementation of the ASSP 2015/16-2019/2020. For insistence, MAAIF should take an active role in developing land use maps.
• There is a need for the Sub Sector of crop resources under MAAIF to update detailed surveys and
mapping of the countries soils to facilitate better management and planning.
• A lot of emphasis has been put on scientific research neglecting research on organic agriculture. We recommend that Government through MAAIF priorities research on Organic agriculture innovations like use of organic fertilizers to realize soil health and soil nutrition.

THE 9TH NSA Statement 45
7.0 Improving access to agricultural markets and value addition
Improving access to agricultural markets and value addition in the ASSP was intended to transform subsistence farmers into enterprise farmers, and enterprise farmers into commercial farmers. In regard to agro processing, Ministry of Agriculture, Animal Industry and Fisheries (MAAIF) in its sectoral strategic plan committed to build the capacity of farmers, traders and processors in ensuring compliance to quality standards and market requirements of the priority commodities. This was to be realized through strengthening higher level farmer organizations for collective marketing; bulking; quality and standards improvement; promoting appropriate technologies and practices to minimize post-harvest losses along the entire commodity value chain; promoting commodity/farm based storage and processing, and supporting measures to enhance access to
formal domestic and regional markets including intensifying enforcement of standards to ensure high quality of local agricultural produce and improved market information flow.
We commend GOU for recognizing the significant role agro processing and value addition plays in transforming the agriculture sector as seen through its prioritized commitments in policies and initiatives at national, regional and international levels (Vision 2040, NDP II, ASSP; EAC; COMESA; AU; UN-SDGs, WTO, EU) which all seek to promote domestic, regional and international trade in agricultural products through coordinated interventions focusing on agricultural productivity and value addition.
We further commend GoU for putting in place a MSMEs Policy whose major Vision is to put in

THE 9TH NSA Statement46
place a critical mass of viable, dynamic and competitive MSMEs, significantly contributing to the socio-economic development. We note with concern that exportation of raw materials and semi processed products are on the rise owing to limited backward and forward linkages between agricultural, industrial and service sectors.
In this section, we provide an assessment on value addition and markets; agricultural commodity pricing, agro-processing plants and market information as discussed below.
7.0.1 Value addition and markets
Agro processing and value addition are critical in improving competitiveness and increasing shelf life of agricultural produce in domestic, regional and international markets, thus increasing returns to value chain actors. However, the current status of agro-processing in Uganda does not render the country’s exports competitive. Indeed, about 80% of agro-processed products that constitute 69% of Uganda’s total exports and majorly traded in the EAC and COMESA regions, are only processed to a primary level7.
7 http://www.monitor.co.ug/Business/Prosper/Why-Uganda-is-not-exporting-enough-prod-ucts/688616-3485226-q94fohz/index.html

THE 9TH NSA Statement 47
According to the Uganda National Export Development Strategy (NEDS) 2017, Uganda’s trade basket is majorly in agricultural products, and is dominated by raw and semi-processed products which attract low returns and continue to reduce Uganda’s market share. For example, at EAC level, in November 2017, Uganda exported over 600 tonnes of sorghum, 3,000 tonnes of maize, 9,000 tonnes of beans, and 2,000 tonnes of millet, all in unprocessed form to Kenya8. Trade in low value-added products has perpetuated vulnerability of small holder farmers to seasonally induced market shocks and the country’s trade deficit.
Furthermore, whereas MSMEs play a critical role in promoting value addition, they face numerous market access related challenges ranging from lack of access to affordable finance,
poor packaging, lack of a quality mark and competition from cheap imported agro-processed products especially cereals, juices and dairy products among others9. This is aggravated by the fact that government efforts to promote MSMEs and exports have been left to the Ministry of Trade in spite of their direct linkage to MAAIF. According to Uganda Small Scale Industries Association (USSIA) 2017, this has not only hindered on their competitiveness but has also frustrated their efforts in value addition10.
Therefore, whereas value addition is important for agricultural and rural transformation, there is a need to rethink the existing policy enabling environment, support MSMEs to be competitive among others.
8 http://www.theeastafrican.co.ke/business/Uganda-asks-Kenya-to-formalise-trade-in-grain-/2560-4310672-vu2koo/index.html 9 http://www.monitor.co.ug/Business/Commodities/EU-milk-imports-flood-EA-/688610-4539854-otlxvs/index.html 10 http://www.ussia.or.ug/

THE 9TH NSA Statement48
Recommendations
• Strengthen SMEs to add value on their produce
• DAES should prioritize standard and quality in the extension system other than focusing on the quantity production
• Strong collaborations between MAAIF and trade ministries in execution of marketing of the agricultural products
7.0.2 Standards development and promotion for increased Uganda’s Agricultural exports
Uganda’s National Trade Policy prioritizes enhancing the competitiveness of Uganda’s products and services in the domestic, regional and international markets while ensuring that trade conforms to national and international requirements, including Sanitary and Phytosanitary Standards (SPS). The Uganda
11 ...........
Vision 2040 states “In order to enhance market access and value addition, Government will: improve capacity for regulation and enforcement especially in safety standards and quality assurance”.
However, the main challenge to agro processing as a means to boosting Uganda’s share of trade in domestic and regional market is due to poor product standard due to Informality of agro-industries that limit their capacity to comply with standard. Indeed, agro processors in Uganda are still faced with challenges of ensuring that their products meet the relevant market requirements and standards. The Uganda National Bureau of Standards (UNBS) estimates the proliferation of sub-standard products in the Ugandan markets at 54%11. This high rate has not only resulted into rejection of Ugandan exports in major markets but also, if not addressed, will result into suspension from accessing

THE 9TH NSA Statement 49
these markets. For example, the average monetary amount of the rejections of fresh fruits and vegetables (FFVs) in the EU from 2015- 2016 is approximately US$ 100,000. Other key agricultural exports which have often been rejected on grounds of poor standard include sesame (18 metric tons of Uganda’s sesame to Germany was rejected after being found to contain traces of salmonella pathogens)12.
In the life of this ASSP, GOU has a self-imposed an export ban on fresh vegetables and chili to the EU in 2014, 2017, and 2019 respectively, after numerous interceptions due to failure to meet phytosanitary requirements.
We commend GOU through MAAIF for putting in place programs such as the “Enhancing the capacity of the Fruits and Vegetable Sector to comply with Phytosanitary requirements for export to EU and other high-
end regional and markets” and a national action plan and strategy for aflatoxin control in Uganda in order to improve market access of fruits and vegetables from Uganda.
In addition, GOU through UNBS has instituted a mandatory product certification for all products on the Ugandan markets to ensure that all products on shelves have a distinctive quality mark13 with an aim to promote competitiveness of local products and thereby facilitating their access to regional and international markets. Further, UNBS has decentralized its operations to support its service delivery to adherence to standards by actors through extension of registration and training services to regional levels in Gulu, Mbale, Mbarara and Wakiso districts14. The body has also reduced the cost of product certification for MSMEs from UGX 800,000 to UGX 350,000, including digitalized
12 http://radioonefm90.com/germany-rejects-ugandas-sim-sim/ 13 Distinctive Mark regulation 201814 UNBS, 2019

THE 9TH NSA Statement50
certification services.
NSAs have also partnered with UNBS to develop 1300 compulsory standards including those of Maize and Sesame among others. This has also involved simplification and translation of Standards of major products including avocado, rice, pineapple and shea butter15
Recommendations Nonetheless, there are a lot of efforts that are required to promote product standards in Uganda some of which are;
• Efforts should be geared towards scaling up the adoption of these standards, linking target beneficiaries to
structures created by UNBS and implementation of the Nation action plan on Aflatoxin control. 7.0.3 Markets and Market Information
We commend the Government of Uganda for negotiating markets at regional, continental and international levels. Uganda’s exports to the EAC grew by 51.8% from $89.4 million in May 2016 to $135.7 million in 2017 (UBOS; 2017). At the COMESA level, Uganda’s export market share was at 13% with agricultural goods worth $835 million and increased to $1.2 billion dollars in 2017 (UBOS; 2017). Agric exports continue to dominate in these markets as shown in the table below;
15 UNBS, 2019

THE 9TH NSA Statement 51
Product Exported value (USD thousand)
Coffee, Tea, Mate & Spices 2,901,296
Cereals 183,059
Edible Vegetables and certain roots & Tubers 110,427
Sugar, Sugar confectionary 91,711
Dairy produce; birds' eggs; natural honey; edible products of animal origin
79,871
Cotton 54,065
Raw hides and skins (other than furskins) and leather 53,223
Table1: Source: ITC calculations based on Uganda Bureau of Statistics (UBOS) statistics since January, 2017 Table1: Source: ITC calculations based on Uganda Bureau of
Statistics (UBOS) statistics since January, 2017
Uganda’s Top exports
It is key to note that in the recently released African Union bi-annual report on 30th January 2018 in Addis Ababa, Uganda was found not to be on track on tripling intra-African trade for agricultural commodities and services16. This short coming is also reported by the Auditor general’s report17 which notes that the export sector has to a large extent not performed to its full potential because of
a number of weaknesses such as inadequate coordination among stakeholders, insufficient trade and market information, inadequate review of existing policies and strategies and failure to build capacity of exporters.Regarding Market information, the GoU mandates District Commercial Officers (DCOs) to promote trade through enterprise development, creating market linkages, improve product standards, and promote consumption of locally produced
16 Highlights on Intra-African Trade for r agriculture commodities and services: Risks and Opportuni-ties; African Union 2017 progress report to the Assembly.17 General’s report (2018

THE 9TH NSA Statement52
goods. Between 2014 and 2016, the GoU was implementing a project on DICOSS that facilitated commercial extension services at 40 local governments, provision of market research, projection and analysis. However, since the closure of this project in 2016, these functions of the DCOs were stalled (GAPR 2016- 17) and have never been rolled out in other districts and municipal Local Governments. The Uganda Export Promotion Board (UEPB) also continues to train and support exporters (potential and existing) to develop products that meet end-user standards especially in export markets through provision of market information and training. UEPB has further established a database of exporters to improve linkages between them and local industries and deepen domestic supply chains for export competitive.
Recommendation • We recommend that these
functions be integrated in the deliverables of Agri-business Unit and be rolled down in
the structure of DEAS. 7.0.4 Agricultural commodity pricing
Pricing is a pivotal aspect of market access and entry, it controls competitiveness, and motivates investment in Uganda, and agricultural commodity pricing is determined by the market forces, however, 75% to80% of marketed agricultural produce in Uganda, is produced by small holder farmers at subsistence level, in addition, the market functionality in Uganda is at deficient as government has failed to implement minimum regulations. Therefore, letting agricultural commodity prices to be determined by market forces has uncontrollably discouraged investments and frustrated production by the small scale farmers trapping majority of Uganda’s population in poverty and consequently affecting country’s competitiveness in the market. The absence of the minimum price mechanism has affected the levels of investment in the sector as prices fall below

THE 9TH NSA Statement 53
production costs during bumper harvests. In the course of the ASSP, prices have been so volatile and falling drastically low in 2018 causing public outcry.
We commend the response from Government to set a minimum price for grain at 500UGX per kilo and the funds set aside in commercial banks for private sector to access maize on the set price. We are however concerned that this attempt although in a positive direction lacks the legal and institutional framework to guide its implementation, to ensure sustainability, inclusivity and accountability
Recommendations
• We recommend that Government institutionalizes this action of setting a minimum price through establishing a legal, regulatory and institutional framework to sustain this initiative undertaken.
• That government focuses on finding markets for
priority commodities other than the general approach. Their marketing should be harmonized in all actions of relevant MDAs.
7.0.5 Promote Private Sector Investment in Value Addition through Public Private Partnerships (PPPs)
The Government under the ASSP committed to promote PPP approach as a modality to promote value addition. PPP can play a big role in supporting value addition and agro-processing through extension delivery and small holder agricultural development for accessing more profitable markets which directly promote sustainable production and increase income at household level. In order to achieve this, involvement of various stakeholders including public and private bodies and farmer organizations to enable collaboration in addressing and mitigating challenges along the value chain is critical.

THE 9TH NSA Statement54
We commend the Government’s efforts to promote PPP arrangements through development of comprehensive policy, legal and institutional framework for the development and implementation of the PPP for example the development of the PPP act 2015, national privet sector development strategy 2017/18-2021/22. Promotion of the PPP through giving enabling environment to the private investors through tax incentives e.g. 25year given to BIDCO, land giveaways for investments, value addition initiatives like the presidential banana initiative on industrial development, incubation centers in government institutions of higher learning, Enterprise and Skills Development Program (ESDP) Development of the Cottage Industry (Technical and Entrepreneurship skills) where more than 200 MSMEs were trained in fruit juices and wine processing and mushroom value addition (Investment Abstract by UIA 2016/2017)among others.
The NSA to compliment efforts of Government have made efforts to realize the Promotion of Private Sector Investment in Value Addition through PPP, this has been done through Promotion of commodity-based platforms e.g. Potato platform that was promoted by Uganda agri-business alliance in Kasese, Implementation of models such as the Consortium Model that encourage value addition from farm level to the market (sorting, grading e.t.c…) and Promotion of adoption of affordable value addition technologies (moisture meters, solar dries etc…) by Kilimo trust in Uganda, and at the east African level, Capacity building in post-harvest handling, value addition to farmers, village agents, government extension officers, this has specifically been done by most NSAs including FRA, Sasakawa Global 2000, SEATINI-Uganda, Kilimo Trust & PELUM-Uganda etc.

THE 9TH NSA Statement 55
CSO Case Contribution: Increased market accessibility through the use of PESA Model
The PESA Agro-enterprise Marketing model implemented by PELUM Uganda is a marketing model that focuses on building a platform for value chain actors to identify market chain challenges, plan together and identify opportunities that would contribute to the chain development for mutual benefit. The model focuses on imparting farmer entrepreneurship skills such as business plan development, group marketing, market research and quality maintenance. The model further encourages smallholder farmers to follow the principles of Ecological Land Use Management while implementing it.
Recommendation
• We emphasize that the promotion of the PPP should take into consideration the small medium enterprises so that they are not left behind. The Government should as well take into consideration the issue of limited storage
facilities and proliferation of substandard inputs, poor post-harvest handling of product which affect value addition. According to the MPS 2019/20 committee on agriculture note that more than 30% of farmers loss their crops to insects, pests, molds and moistures.

THE 9TH NSA Statement56
8.0 Food and Nutritional Security
Food and Nutritional security in the ASSP was premised on the fact that Food insecurity and malnourishment are common in Uganda’s rural areas and are a significant challenge to human welfare and economic growth in the country. An estimated 66% of households in Uganda were net buyers of food and relied on the market for more than 25% of the value of the food they consumed.
There’re significant consequences of hunger and malnutrition to the agricultural sector, in 2009, the agric. Sector is estimated to have lost, USD 434M worth of productivity due to iron deficiency anemia in the adult population, the other consequences identified so far are as a result of time lost due to illnesses associated with malnutrition among the adults of Uganda’s main employer the agric. Sector18.
MAAIF, committed to lead on the priority action area on, Sustainable, resilient food systems for healthy diets. Strategically, MAAIF set to undertake two broad interventions i.e. Promote production and consumption of bio-fortified and industrial fortified foods and Promote and increase production, access and consumption of diverse high nutrient value and safe foods
The ASSP therefore targeted enhancement of consumption of varied diets at household level including promoting increased awareness on food availability across the 10 agricultural zones. Others focused on developing and implementing early warning systems to prevent and mitigate shocks affecting nutrition and food security and promoting awareness of and access to nutrient bio-fortified food
18 UNAP, 2019 - 2025

THE 9TH NSA Statement 57
varieties across the priority commodities.
A review of sector documents as operationalized annually through the Ministerial Policy statements during the time of the ASSP, Food security in MAAIF is perceived at the high ends of the programme mission statements and objectives. However there are no specific strategies laid and financed to define MAAIF’s targeted actions to improve food and nutrition. We however commend GOU through MAAIF for the development and implementation of the Uganda multisectoral food security and nutrition project who broad object is to increase production and consumption of nutrient rich foods and utilization of community based nutrition foods in small holder households, we applaud the innovative approach under this project of using primary schools especially under universal primary education as a transfer pathway for both agriculture and health base nutrition, friendly technologies and services. Whereas the need
for such services are far widely required, this only food and nutrition targeted programme in MAAIF was only designed to be implemented in 15 districts out of the 134 districts in Uganda at present.
It should be noted that the state of food and nutrition in the country within the ASSP phase has not been impressive, in 2017, only 69% of the total population in Uganda could eat at least 2 to 3 meals a day, 26% were found to be under food security stress and 5% were found to be under food security crisis. 1.88M people in the east and central part of the country, were food stressed followed by 1.24M people in south western Uganda and 1.1M people in Teso and 1.04M people in west Nile.
Whereas Uganda was found to be on track, having met the minimum 4.6%, performance bench mark for the Biannual report against the Malabo indicators, we note with concern that the country was found to be off track on ending hunger by 2025. This
THE 9TH NSA Statement58
was reaffirmed by the President singling out malnutrition as a major development challenge pulling down the positive milestones in his budget speech for FY2019/20.
The primary responsibility of food and nutrition shall forever rest on the agricultural sector, we therefore recommend;
• That in the ASSP II, MAAIF upholds the core action on Sustainable, resilient food systems for healthy
diets and strategically set out interventions for: Promoting production and consumption of bio-fortified and industrial fortified foods and Promoting and increasing production, access and consumption of diverse high nutrient value and safe foods. This will provide ground for private and public specific investments on food and nutrition and in addition it will clearly define the scope of work undertaken by MAAIF and the entire sector in ending hunger and malnutrition.

THE 9TH NSA Statement 59
NSA Contributors of the Statement
1.
2.
CARITAS Uganda
Agency For Integrated Rural Development
Africa Forum on Agricultural Advisory Services
3.
4.
Civil Society Budget Advocacy Group
Climate Change Action Net work
5.
6. Coalition of Pastoralist Civil Society Organizations
7.
8.
9.
Oxfam
Food Rights Alliance
Eastern and Southern Africa small scale Farmers Forum

THE 9TH NSA Statement60
10.
11.
12.
13.
Participatory Ecological Land Use Management
14.
15.
Send a Cow Uganda
Southern and Eastern African Trade, Information and Negotiations Institute
16.
Uganda Agribusiness Alliance
17.
18
Advocacy Coalition for sustainable Development
Uganda Debt Network
Uganda Land Alliance
Volunteers Efforts for Development Concerns
Community Integrated DevelpmentInitiative - CIDI

THE 9TH NSA Statement 61
19
20.
21.
22.
23.
24.
Women and Girl Child Development Association
World Vision
Uganda farmers Common Voice Platform
25.
26.
27.
Farmers media
Trocaire
Central Archdiocesan Province CARITAS Association
TEENS Uganda
CAADP NSA Coalition
Kikandwa Environmental Association

THE 9TH NSA Statement62
28.
29.
30.
31.
32.
33.
Uganda Coalition for Sustainable Development (UCSD)
CIPA
The hunger project
Community restoration initiative project
Heifer international
34. Kilimo Trust
35. Earth and Rights Initiative
36. Slow Food Uganda
CEFROHT

THE 9TH NSA Statement 63
38.
39.
40.
41.
43.
Bread for the World
Rosa Luxemburg Stiftung
Self Help Africa
44.Sopport for Women in Agriculture and Environment (SWAGEN)
CARITAS Denmark
37. Trocaire
CONSENT - Uganda
44. Uganda National Farmers’ Federation

THE 9TH NSA Statement64