Embed Size (px)
Citation preview
June 2018
Statistics & Economic Research Branch
The 9% VAT Rate: Tax
Receipts and Employment
The 9% VAT Rate: Tax
Receipts and Employment
The authors are Donnchadh O’Donovan ([email protected]), Statistics & Economic
Research Branch of the Office of the Revenue Commissioners, Gillian Walsh
([email protected]), Statistics & Economic Research Branch of the Office of the
Revenue Commissioners and Brian Stanley, formerly Office of the Revenue Commissioners.
Gillian Walsh and Brian Stanley are and were respectively also members of the Irish
Government Economic & Evaluation Service (“IGEES”). The authors thank colleagues in
Department of Finance and Revenue for suggestions and advice and Barry O’Leary for
undertaking the initial work on the project. Any opinions expressed in this paper are the
views of the authors and do not necessarily reflect the views of the Office of the Revenue
Commissioners or IGEES. This analysis has been undertaken at the request of the
Department of Finance to help to inform its work, neither Revenue nor IGEES have any
role in formulating the recommendations made by the Department.
June 2018
2 Statistics & Economic Research Branch
Executive Summary
In May 2011 the Government introduced the “Jobs Initiative”, which included a number of
measures to increase employment. One of these measures was the introduction from 1
July 2011 of a reduced Value Added Tax (“VAT”) rate of 9% (from 13.5%) for labour
intensive services mostly linked to tourism expenditure.
This report provides an overview of Revenue data on businesses engaged in activities on
which the 9% rate is charged. The analysis is undertaken to support the Department of
Finance’s review of the 9% rate and therefore includes a particular focus on employment
and earnings trends among businesses engaged in 9% rate activities.
Key findings of the analysis are:
o Consumer expenditure to which a VAT rate applied (i.e., excluding VAT exempt
activities) was €57 billion in 2014, with the majority of this at the standard 23%
VAT rate and 14 per cent of expenditure at the 9% rate.
o Hotel & similar accommodation, restaurants and non-specialised stores with food,
beverages or tobacco predominating accounted for the majority of 9% activity.
o Hairdressing, holiday & other short stay accommodation, other accommodation and
fitness facilities generate over 90 per cent of their sales at the 9% rate.
o It is estimated, based on current data, that to return the 9% rate to 13.5% would
yield around €520 million to the Exchequer.
o From 2011 to 2016 the year on year growth in employment in 9% sectors
exceeded growth compared to all other sectors. This finding holds for both
businesses based in Dublin and businesses based in the rest of the country.
o While employment in the 9% sectors grew year on year from 2011, median pay fell
in 2011 and again from 2013 to 2015.
With the different initiatives since 2011, particularly in tourism (e.g., “The Gathering” in
2013 or the “Wild Atlantic Way” in 2014), as well as the general and widespread changes
in the economy over the same period, accurately isolating the contribution of the 9% rate
alone to the outcomes noted above is challenging. An econometric analysis is undertaken
to match businesses with sales at the 9% rate to comparable businesses with no 9%
sales. This shows some limited evidence that employment increased in the
accommodation and food sectors due to the introduction of the 9% rate.
The analysis is undertaken to support a review of the 9% rate by the Department of
Finance. Any policy conclusions from the review are a matter for the Department.
June 2018
3 Statistics & Economic Research Branch
Table of Contents
Executive Summary .............................................................................................. 2 Table of Contents ................................................................................................. 3 List of Figures ...................................................................................................... 3 List of Tables ....................................................................................................... 3 1 Introduction ................................................................................................... 4 2 VAT Trends .................................................................................................... 5
2.1 VAT Overview ........................................................................................... 5 2.2 Identification of 9% Activity ........................................................................ 7 2.3 9% Sectors .............................................................................................. 9 2.4 Exchequer Cost of the 9% Rate ................................................................. 12
3 Employment Trends ...................................................................................... 14 3.1 Employment and Earnings in 9% Sectors ................................................... 14 3.2 Relative Employment Growth in 9% Sectors ............................................... 18 3.3 Relative Employment Growth in 9% Sectors by Location .............................. 19 3.4 Matching ................................................................................................ 20 3.5 VAT Revenue Foregone per Employment and Earnings Generated ................. 23
4 Conclusion ...................................................................................................... 25 Appendix: Matching ............................................................................................ 26 References ........................................................................................................ 32
List of Figures
Figure 1: VAT Receipts ............................................................................................. 5 Figure 2: Expenditure by VAT Rate ............................................................................ 6 Figure 3: Change in Salary Costs ............................................................................ 17 Figure 4: Change in Staff Numbers .......................................................................... 17 Figure 5: Matching Analysis of Average Total Salary Costs .......................................... 22 Figure 6: Matching Analysis of Average Number of Employments ................................ 23
List of Tables
Table 1: Weighted Average VAT Rate ......................................................................... 6 Table 2: Registered VAT Traders ............................................................................... 7 Table 3: Active VAT Traders ..................................................................................... 7 Table 4: Sectors Supplying 9% Services .................................................................... 9 Table 5: 9% Sectors – Numbers of Traders .............................................................. 10 Table 6: 9% Sectors – VAT Receipts ........................................................................ 11 Table 7: 9% Sectors – VATable Output .................................................................... 12 Table 8: Estimation of VAT Forgone in “9% Sectors” Only .......................................... 13 Table 9: 9% Sectors – Employments ....................................................................... 14 Table 10: 9% Sectors – Earnings ............................................................................ 15 Table 11: Salary Distribution of 9% Sector Employments ........................................... 16 Table 12: Share of Businesses Changing Salary Costs & Staff Numbers Compared to 2009
........................................................................................................................... 18 Table 13: Year on Year Growth in Employment Numbers and Earnings ......................... 19 Table 14: Employment Numbers and Earnings by Location ......................................... 20 Table 15: VAT Revenue Foregone per Euro Earnings Generated .................................. 23 Table 16: Revenue Foregone per Employment Generated ........................................... 24
June 2018
4 Statistics & Economic Research Branch
1 Introduction
In May 2011 the Government introduced the “Jobs Initiative”, which included a number of
measures to increase employment. One component of the Jobs Initiative was the
introduction from 1 July 2011 of a reduced Value Added Tax (“VAT”) rate of 9% for labour
intensive services of which many are linked to tourism expenditure.1 The 9% rate was
intended to increase demand, driven by reduced prices, resulting in higher employment.
The services targeted to benefit from the reduced VAT rate were:2
• Supply of food and drink (excluding alcohol and soft drinks) in the course of
catering or by means of a vending machine;
• Hot take-away food and hot drinks;
• Hotel lettings, including guest houses, caravan parks and camping sites;
• Admissions to cinemas, theatres, certain musical performances, museums and art
gallery exhibitions;
• Amusement services of the kind normally supplied in fairground or amusement
park services;
• Provision of facilities for taking part in sporting activities by a person other than a
non-profit making organisation;
• Printed matter, e.g., newspapers, brochures, leaflets, programmes, maps,
catalogues, printed music (excluding books); and
• Hairdressing services.
This report reviews Revenue data on businesses with activities liable for the 9% VAT rate.
The analysis is undertaken to support the Department of Finance’s review of the 9% rate
and therefore includes a particular focus on employment and earnings trends. Section 2
covers VAT data, Section 3 presents employment analysis and Section 4 concludes.
1 The 9% rate was originally intended to remain in effect until December 2013 but was extended indefinitely in Budget 2014. 2 Finance Act 2012 provides that admissions to historic houses, open farms and built and natural heritage facilities became activities subject to the 9% reduced rate, as of 1 January 2012.
June 2018
5 Statistics & Economic Research Branch
2 VAT Trends
2.1 VAT Overview
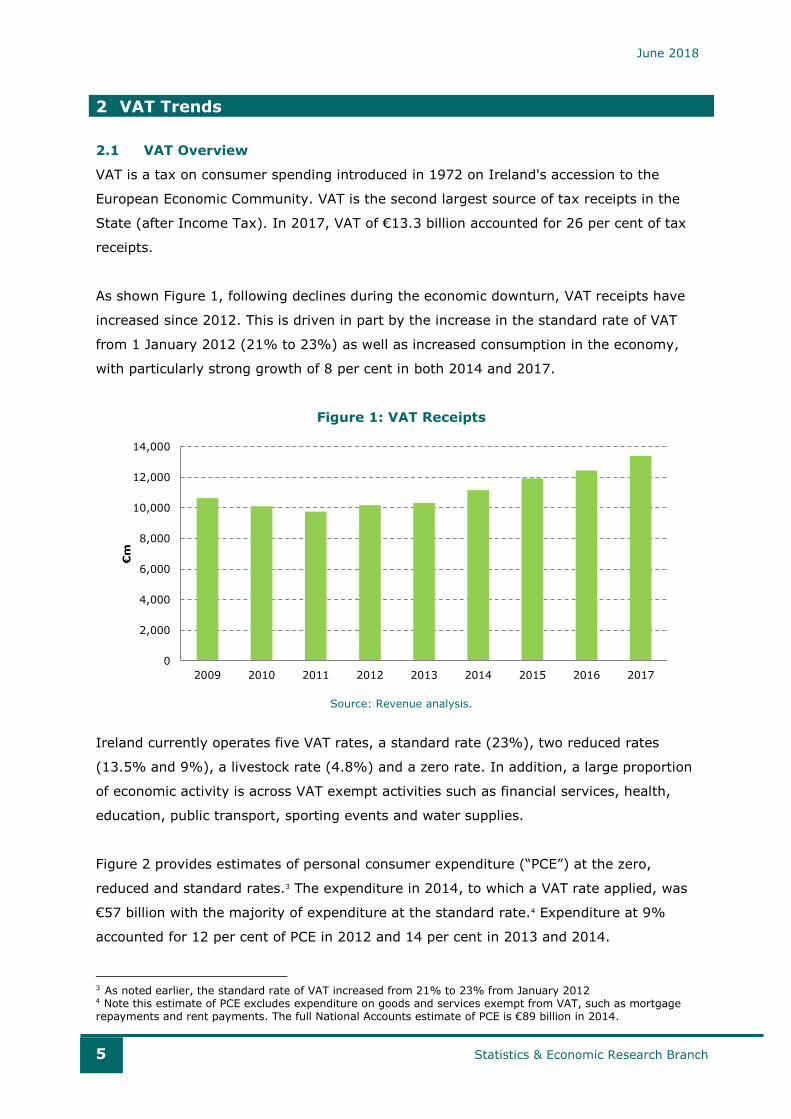
VAT is a tax on consumer spending introduced in 1972 on Ireland's accession to the
European Economic Community. VAT is the second largest source of tax receipts in the
State (after Income Tax). In 2017, VAT of €13.3 billion accounted for 26 per cent of tax
receipts.
As shown Figure 1, following declines during the economic downturn, VAT receipts have
increased since 2012. This is driven in part by the increase in the standard rate of VAT
from 1 January 2012 (21% to 23%) as well as increased consumption in the economy,
with particularly strong growth of 8 per cent in both 2014 and 2017.
Figure 1: VAT Receipts
Source: Revenue analysis.
Ireland currently operates five VAT rates, a standard rate (23%), two reduced rates
(13.5% and 9%), a livestock rate (4.8%) and a zero rate. In addition, a large proportion
of economic activity is across VAT exempt activities such as financial services, health,
education, public transport, sporting events and water supplies.
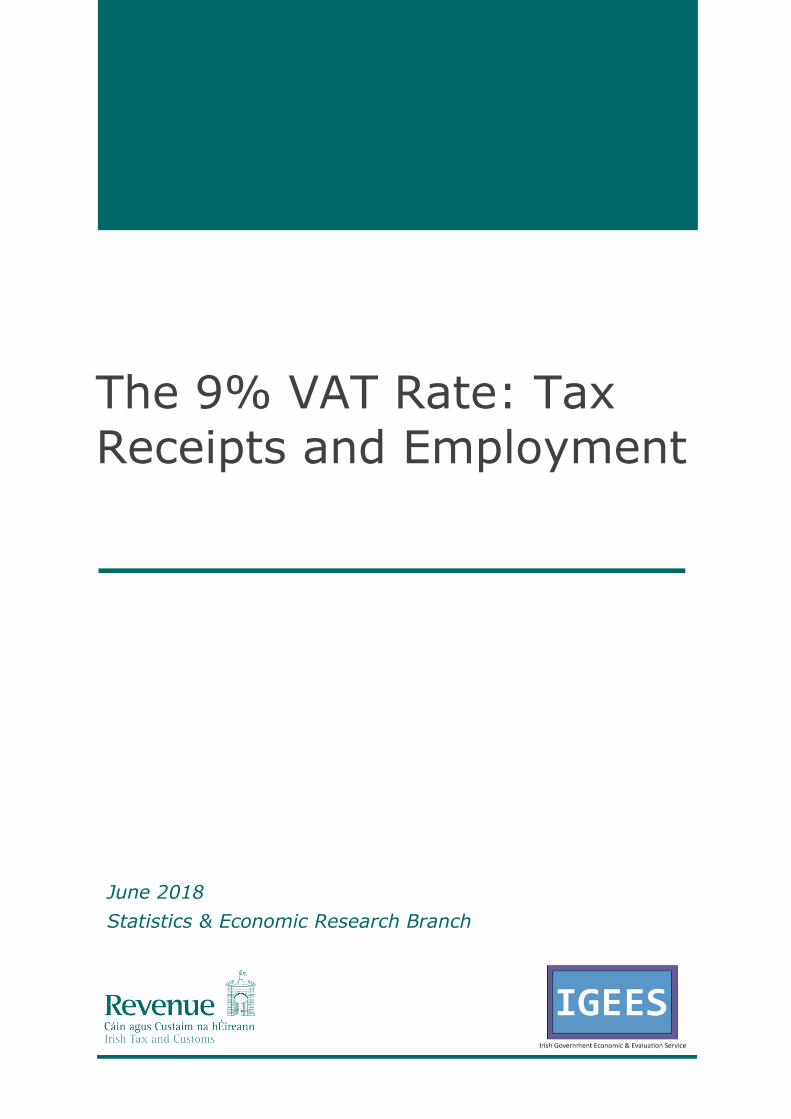
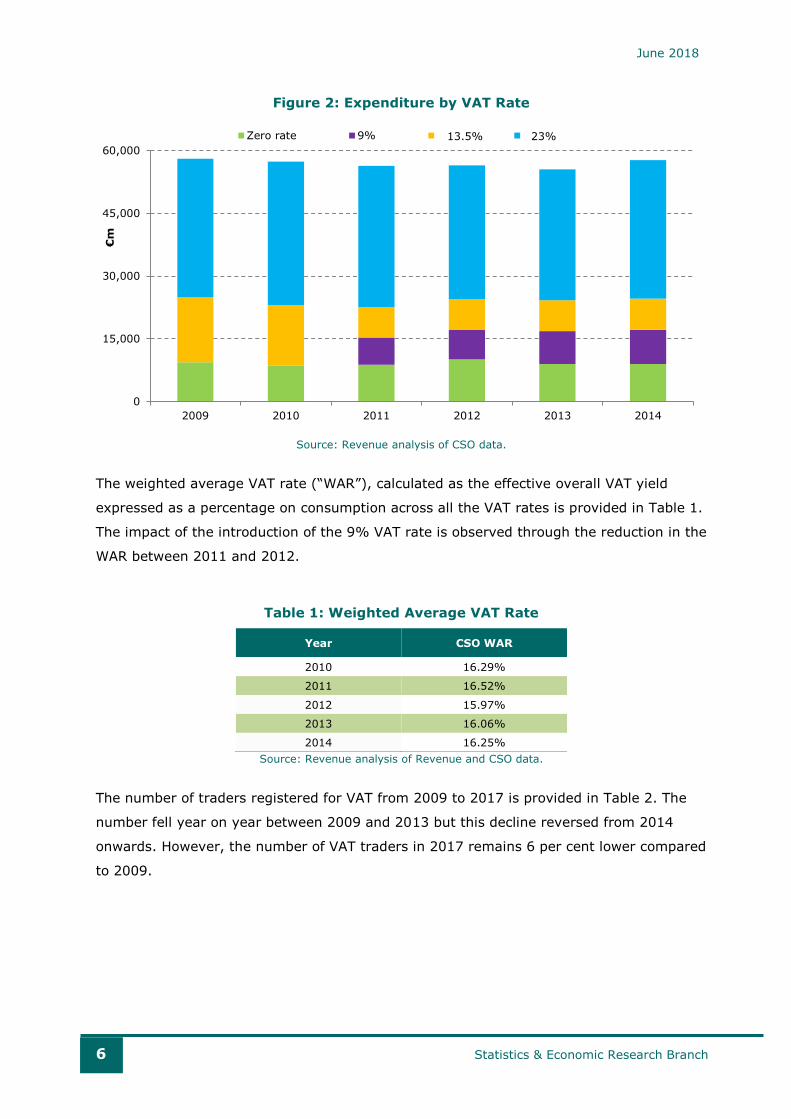
Figure 2 provides estimates of personal consumer expenditure (“PCE”) at the zero,
reduced and standard rates.3 The expenditure in 2014, to which a VAT rate applied, was
€57 billion with the majority of expenditure at the standard rate.4 Expenditure at 9%
accounted for 12 per cent of PCE in 2012 and 14 per cent in 2013 and 2014.
3 As noted earlier, the standard rate of VAT increased from 21% to 23% from January 2012 4 Note this estimate of PCE excludes expenditure on goods and services exempt from VAT, such as mortgage repayments and rent payments. The full National Accounts estimate of PCE is €89 billion in 2014.
0
2,000
4,000
6,000
8,000
10,000
12,000
14,000
2009 2010 2011 2012 2013 2014 2015 2016 2017
€m
June 2018
6 Statistics & Economic Research Branch
Figure 2: Expenditure by VAT Rate
Source: Revenue analysis of CSO data.
The weighted average VAT rate (“WAR”), calculated as the effective overall VAT yield
expressed as a percentage on consumption across all the VAT rates is provided in Table 1.
The impact of the introduction of the 9% VAT rate is observed through the reduction in the
WAR between 2011 and 2012.
Table 1: Weighted Average VAT Rate
Year CSO WAR
2010 16.29%
2011 16.52%
2012 15.97%
2013 16.06%
2014 16.25%
Source: Revenue analysis of Revenue and CSO data.
The number of traders registered for VAT from 2009 to 2017 is provided in Table 2. The
number fell year on year between 2009 and 2013 but this decline reversed from 2014
onwards. However, the number of VAT traders in 2017 remains 6 per cent lower compared
to 2009.
0
15,000
30,000
45,000
60,000
2009 2010 2011 2012 2013 2014
€m
Zero rate 9% 13% Standard rate13.5% 23%
June 2018
7 Statistics & Economic Research Branch
Table 2: Registered VAT Traders
Year Number of Traders
2009 272,506
2010 261,461
2011 250,890
2012 238,949
2013 233,669
2014 236,959
2015 240,492
2016 244,372
2017 255,541
Source: Revenue analysis.
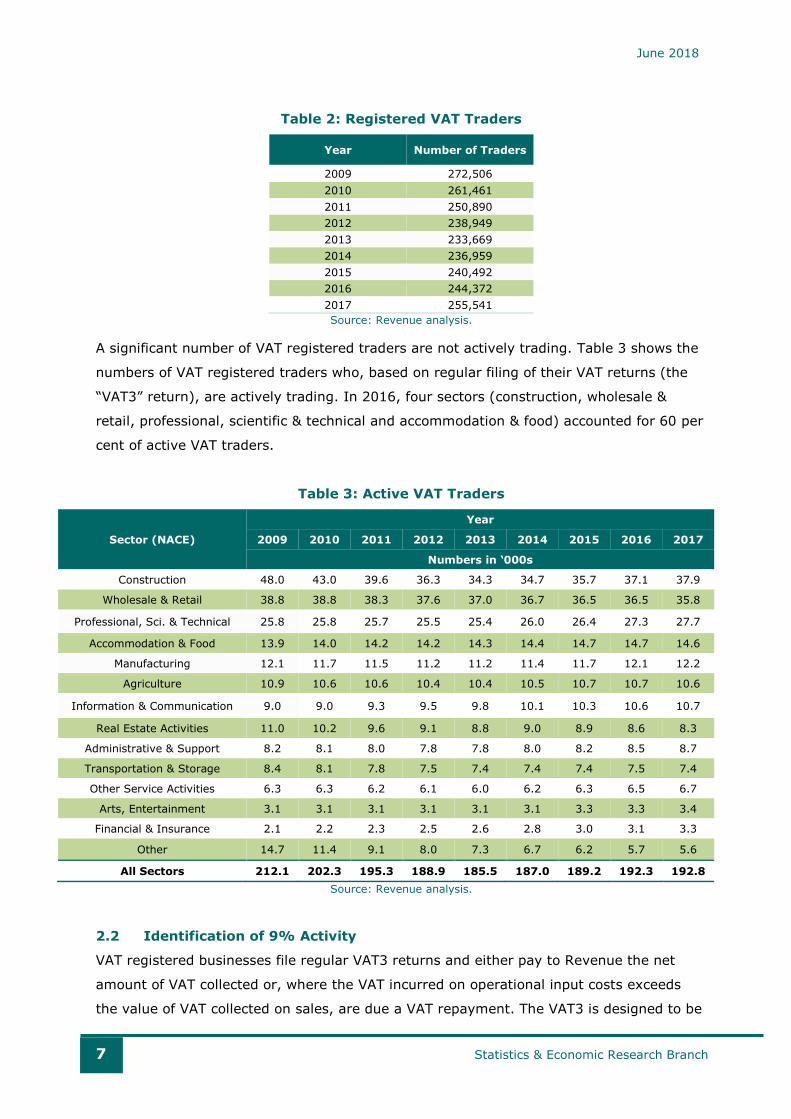
A significant number of VAT registered traders are not actively trading. Table 3 shows the
numbers of VAT registered traders who, based on regular filing of their VAT returns (the
“VAT3” return), are actively trading. In 2016, four sectors (construction, wholesale &
retail, professional, scientific & technical and accommodation & food) accounted for 60 per
cent of active VAT traders.
Table 3: Active VAT Traders
Sector (NACE)
Year
2009 2010 2011 2012 2013 2014 2015 2016 2017
Numbers in ‘000s
Construction 48.0 43.0 39.6 36.3 34.3 34.7 35.7 37.1 37.9
Wholesale & Retail 38.8 38.8 38.3 37.6 37.0 36.7 36.5 36.5 35.8
Professional, Sci. & Technical 25.8 25.8 25.7 25.5 25.4 26.0 26.4 27.3 27.7
Accommodation & Food 13.9 14.0 14.2 14.2 14.3 14.4 14.7 14.7 14.6
Manufacturing 12.1 11.7 11.5 11.2 11.2 11.4 11.7 12.1 12.2
Agriculture 10.9 10.6 10.6 10.4 10.4 10.5 10.7 10.7 10.6
Information & Communication 9.0 9.0 9.3 9.5 9.8 10.1 10.3 10.6 10.7
Real Estate Activities 11.0 10.2 9.6 9.1 8.8 9.0 8.9 8.6 8.3
Administrative & Support 8.2 8.1 8.0 7.8 7.8 8.0 8.2 8.5 8.7
Transportation & Storage 8.4 8.1 7.8 7.5 7.4 7.4 7.4 7.5 7.4
Other Service Activities 6.3 6.3 6.2 6.1 6.0 6.2 6.3 6.5 6.7
Arts, Entertainment 3.1 3.1 3.1 3.1 3.1 3.1 3.3 3.3 3.4
Financial & Insurance 2.1 2.2 2.3 2.5 2.6 2.8 3.0 3.1 3.3
Other 14.7 11.4 9.1 8.0 7.3 6.7 6.2 5.7 5.6
All Sectors 212.1 202.3 195.3 188.9 185.5 187.0 189.2 192.3 192.8
Source: Revenue analysis.
2.2 Identification of 9% Activity
VAT registered businesses file regular VAT3 returns and either pay to Revenue the net
amount of VAT collected or, where the VAT incurred on operational input costs exceeds
the value of VAT collected on sales, are due a VAT repayment. The VAT3 is designed to be
June 2018
8 Statistics & Economic Research Branch
relatively simple in order to minimise the administrative burden on businesses. As such
there is no requirement for a business to provide details on the nature of products or
activities sold, the sales by VAT rate or the type of customer who made the purchase.
In addition to the VAT3 return, VAT registered businesses are required to submit an
annual Return of Trading Details (“RTD”). The RTD is a statistical return which provides a
breakdown by VAT rate of the businesses’ sales and purchases. The RTD has the potential
to identify VAT registered traders suppling at the 9% VAT rate. However, while measures
have been taken in recent years by Revenue to improve the compliance rate of traders
completing and filing RTDs, for the years examined in this report the RTD returns are not
filed by the full population of traders.
The RTD alone is therefore not sufficient to allow a complete analysis of 9% activity and a
mixed approach is taken. The analysis in this report identifies traders as 9% or non-9%
according to their sector (based on NACE code on Revenue’s records) and the prevalence
of RTD returns indicating 9% activity within a sector.5
Analysis of information from RTDs indicates that a large number of businesses in multiple
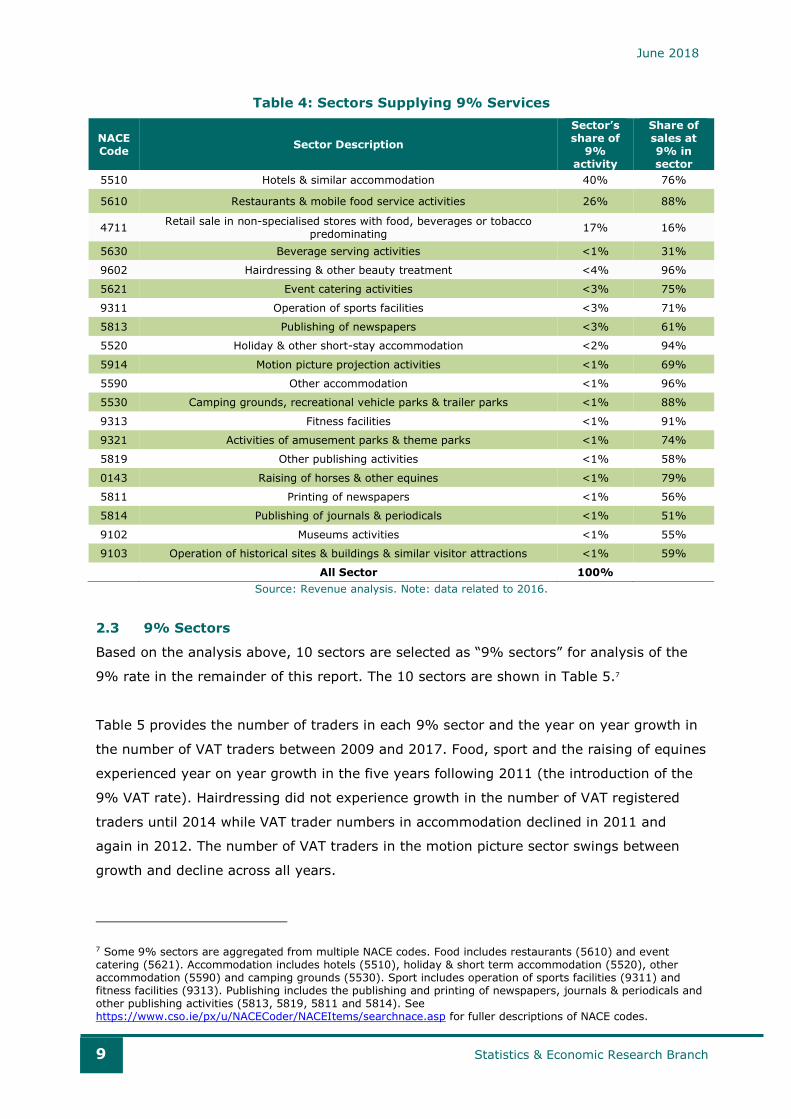
sectors supply at the 9% rate in 2016.6 The 20 sectors in Table 4 account for the majority
(83 per cent) of businesses that indicate supplies at the 9% VAT rate on RTDs. The
remaining 17 per cent are distributed across a further 220 NACE codes. Also shown are
the shares of sales at 9% for each sector. Hotel & similar accommodation, restaurants and
retail sales in non-specialised stores account for the majority of 9% activity. However
these sectors are comparatively less dependent on the 9% rate. Four sectors
(hairdressing, holiday & other short stay accommodation, other accommodation and
fitness facilities) generate over 90 per cent of their sales at the 9% rate.
5 A NACE code is a European classification code that identifies over six hundred different business activities. On registration with Revenue, a business is assigned to a NACE sector based on its business description. While NACE codes on Revenue records may be incorrect or out of date on some individual case records, they are considered sufficiently accurate to support broad analysis. 6 It is important to note that while a business may have activities in multiple sectors, it is assigned one NACE code on Revenue records, usually based on the primary or largest activity undertaken in that business.
June 2018
9 Statistics & Economic Research Branch
Table 4: Sectors Supplying 9% Services
NACE Code
Sector Description
Sector’s share of
9% activity
Share of sales at 9% in sector
5510 Hotels & similar accommodation 40% 76%
5610 Restaurants & mobile food service activities 26% 88%
4711 Retail sale in non-specialised stores with food, beverages or tobacco
predominating 17% 16%
5630 Beverage serving activities <1% 31%
9602 Hairdressing & other beauty treatment <4% 96%
5621 Event catering activities <3% 75%
9311 Operation of sports facilities <3% 71%
5813 Publishing of newspapers <3% 61%
5520 Holiday & other short-stay accommodation <2% 94%
5914 Motion picture projection activities <1% 69%
5590 Other accommodation <1% 96%
5530 Camping grounds, recreational vehicle parks & trailer parks <1% 88%
9313 Fitness facilities <1% 91%
9321 Activities of amusement parks & theme parks <1% 74%
5819 Other publishing activities <1% 58%
0143 Raising of horses & other equines <1% 79%
5811 Printing of newspapers <1% 56%
5814 Publishing of journals & periodicals <1% 51%
9102 Museums activities <1% 55%
9103 Operation of historical sites & buildings & similar visitor attractions <1% 59%
All Sector 100%
Source: Revenue analysis. Note: data related to 2016.
2.3 9% Sectors
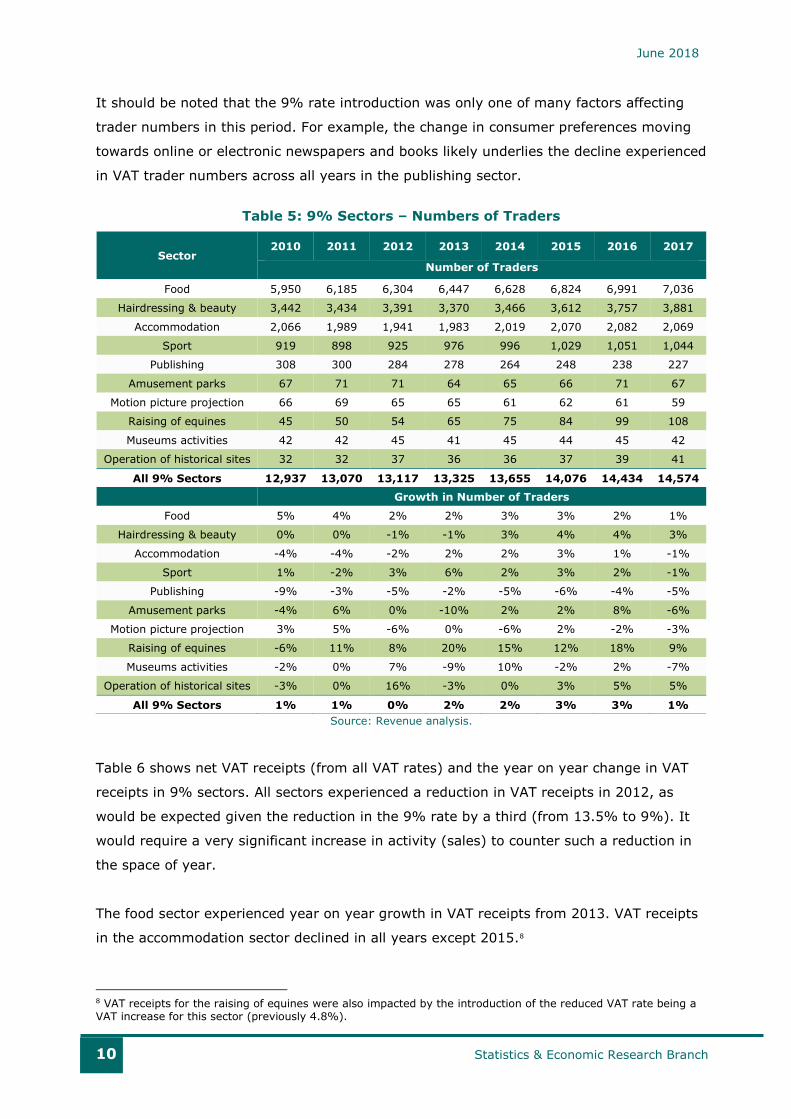
Based on the analysis above, 10 sectors are selected as “9% sectors” for analysis of the
9% rate in the remainder of this report. The 10 sectors are shown in Table 5.7
Table 5 provides the number of traders in each 9% sector and the year on year growth in
the number of VAT traders between 2009 and 2017. Food, sport and the raising of equines
experienced year on year growth in the five years following 2011 (the introduction of the
9% VAT rate). Hairdressing did not experience growth in the number of VAT registered
traders until 2014 while VAT trader numbers in accommodation declined in 2011 and
again in 2012. The number of VAT traders in the motion picture sector swings between
growth and decline across all years.
7 Some 9% sectors are aggregated from multiple NACE codes. Food includes restaurants (5610) and event catering (5621). Accommodation includes hotels (5510), holiday & short term accommodation (5520), other accommodation (5590) and camping grounds (5530). Sport includes operation of sports facilities (9311) and fitness facilities (9313). Publishing includes the publishing and printing of newspapers, journals & periodicals and other publishing activities (5813, 5819, 5811 and 5814). See https://www.cso.ie/px/u/NACECoder/NACEItems/searchnace.asp for fuller descriptions of NACE codes.
June 2018
10 Statistics & Economic Research Branch
It should be noted that the 9% rate introduction was only one of many factors affecting
trader numbers in this period. For example, the change in consumer preferences moving
towards online or electronic newspapers and books likely underlies the decline experienced
in VAT trader numbers across all years in the publishing sector.
Table 5: 9% Sectors – Numbers of Traders
Sector 2010 2011 2012 2013 2014 2015 2016 2017
Number of Traders
Food 5,950 6,185 6,304 6,447 6,628 6,824 6,991 7,036
Hairdressing & beauty 3,442 3,434 3,391 3,370 3,466 3,612 3,757 3,881
Accommodation 2,066 1,989 1,941 1,983 2,019 2,070 2,082 2,069
Sport 919 898 925 976 996 1,029 1,051 1,044
Publishing 308 300 284 278 264 248 238 227
Amusement parks 67 71 71 64 65 66 71 67
Motion picture projection 66 69 65 65 61 62 61 59
Raising of equines 45 50 54 65 75 84 99 108
Museums activities 42 42 45 41 45 44 45 42
Operation of historical sites 32 32 37 36 36 37 39 41
All 9% Sectors 12,937 13,070 13,117 13,325 13,655 14,076 14,434 14,574
Growth in Number of Traders
Food 5% 4% 2% 2% 3% 3% 2% 1%
Hairdressing & beauty 0% 0% -1% -1% 3% 4% 4% 3%
Accommodation -4% -4% -2% 2% 2% 3% 1% -1%
Sport 1% -2% 3% 6% 2% 3% 2% -1%
Publishing -9% -3% -5% -2% -5% -6% -4% -5%
Amusement parks -4% 6% 0% -10% 2% 2% 8% -6%
Motion picture projection 3% 5% -6% 0% -6% 2% -2% -3%
Raising of equines -6% 11% 8% 20% 15% 12% 18% 9%
Museums activities -2% 0% 7% -9% 10% -2% 2% -7%
Operation of historical sites -3% 0% 16% -3% 0% 3% 5% 5%
All 9% Sectors 1% 1% 0% 2% 2% 3% 3% 1%
Source: Revenue analysis.
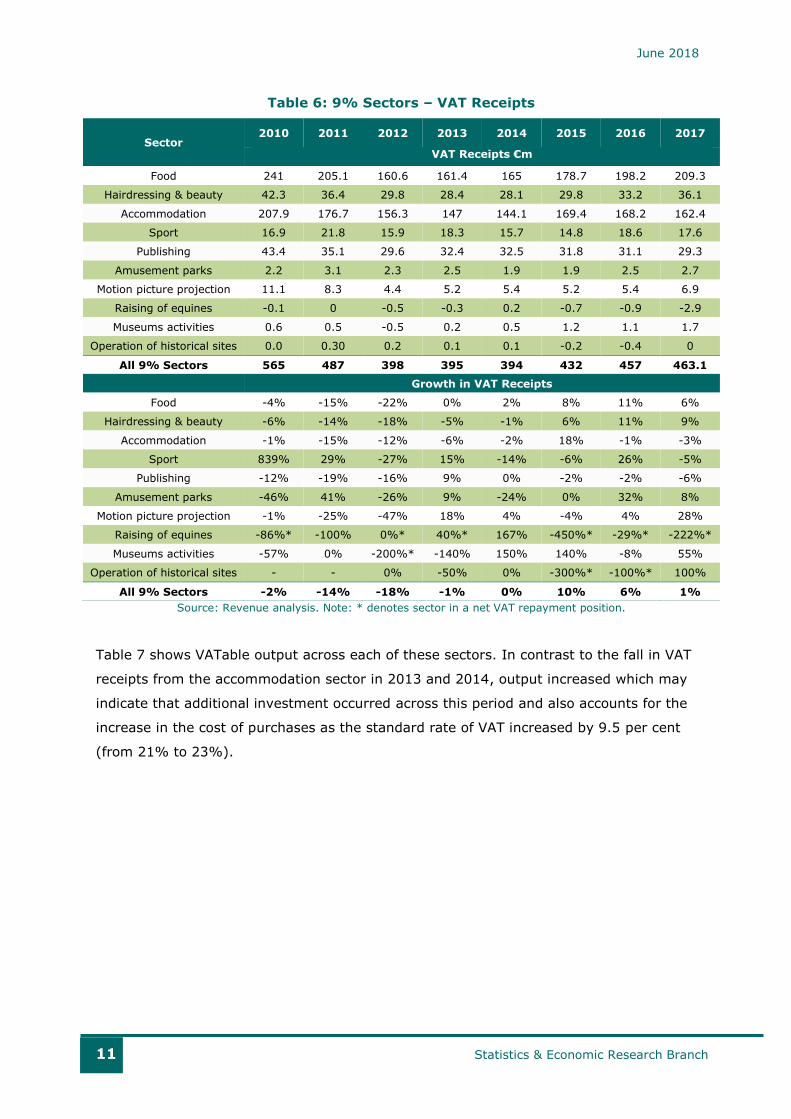
Table 6 shows net VAT receipts (from all VAT rates) and the year on year change in VAT
receipts in 9% sectors. All sectors experienced a reduction in VAT receipts in 2012, as
would be expected given the reduction in the 9% rate by a third (from 13.5% to 9%). It
would require a very significant increase in activity (sales) to counter such a reduction in
the space of year.
The food sector experienced year on year growth in VAT receipts from 2013. VAT receipts
in the accommodation sector declined in all years except 2015.8
8 VAT receipts for the raising of equines were also impacted by the introduction of the reduced VAT rate being a VAT increase for this sector (previously 4.8%).
June 2018
11 Statistics & Economic Research Branch
Table 6: 9% Sectors – VAT Receipts
Sector 2010 2011 2012 2013 2014 2015 2016 2017
VAT Receipts €m
Food 241 205.1 160.6 161.4 165 178.7 198.2 209.3
Hairdressing & beauty 42.3 36.4 29.8 28.4 28.1 29.8 33.2 36.1
Accommodation 207.9 176.7 156.3 147 144.1 169.4 168.2 162.4
Sport 16.9 21.8 15.9 18.3 15.7 14.8 18.6 17.6
Publishing 43.4 35.1 29.6 32.4 32.5 31.8 31.1 29.3
Amusement parks 2.2 3.1 2.3 2.5 1.9 1.9 2.5 2.7
Motion picture projection 11.1 8.3 4.4 5.2 5.4 5.2 5.4 6.9
Raising of equines -0.1 0 -0.5 -0.3 0.2 -0.7 -0.9 -2.9
Museums activities 0.6 0.5 -0.5 0.2 0.5 1.2 1.1 1.7
Operation of historical sites 0.0 0.30 0.2 0.1 0.1 -0.2 -0.4 0
All 9% Sectors 565 487 398 395 394 432 457 463.1
Growth in VAT Receipts
Food -4% -15% -22% 0% 2% 8% 11% 6%
Hairdressing & beauty -6% -14% -18% -5% -1% 6% 11% 9%
Accommodation -1% -15% -12% -6% -2% 18% -1% -3%
Sport 839% 29% -27% 15% -14% -6% 26% -5%
Publishing -12% -19% -16% 9% 0% -2% -2% -6%
Amusement parks -46% 41% -26% 9% -24% 0% 32% 8%
Motion picture projection -1% -25% -47% 18% 4% -4% 4% 28%
Raising of equines -86%* -100% 0%* 40%* 167% -450%* -29%* -222%*
Museums activities -57% 0% -200%* -140% 150% 140% -8% 55%
Operation of historical sites - - 0% -50% 0% -300%* -100%* 100%
All 9% Sectors -2% -14% -18% -1% 0% 10% 6% 1%
Source: Revenue analysis. Note: * denotes sector in a net VAT repayment position.
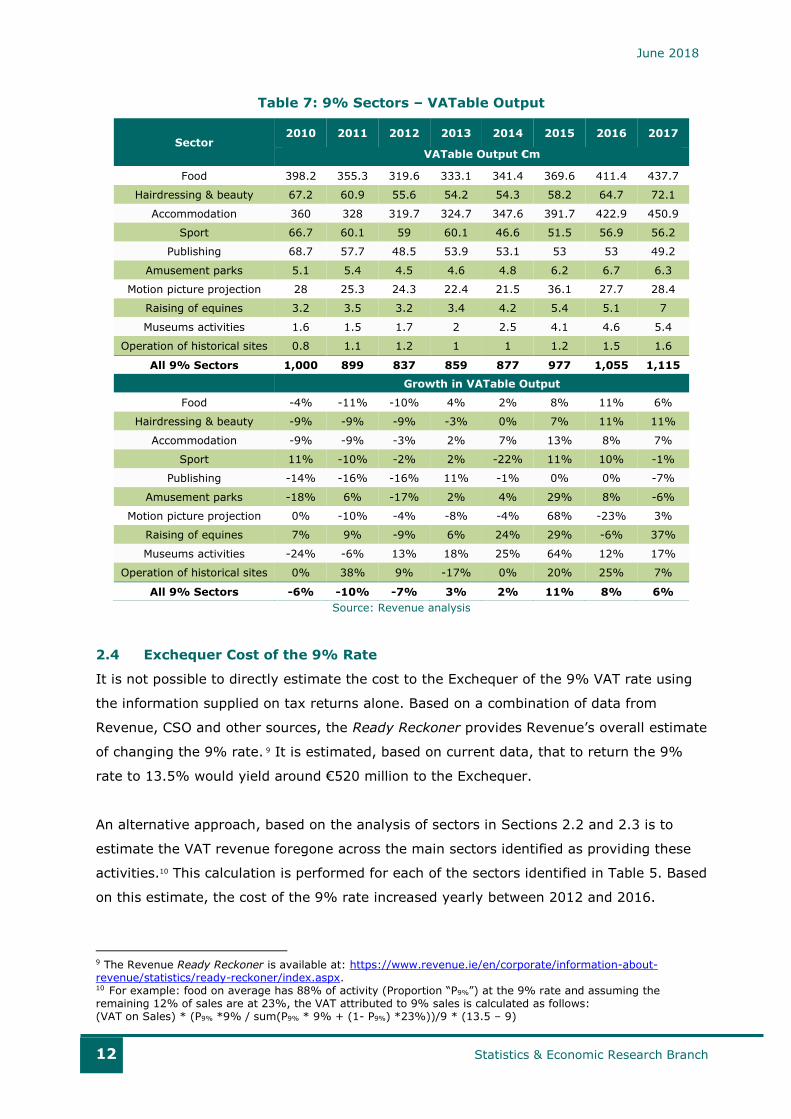
Table 7 shows VATable output across each of these sectors. In contrast to the fall in VAT
receipts from the accommodation sector in 2013 and 2014, output increased which may
indicate that additional investment occurred across this period and also accounts for the
increase in the cost of purchases as the standard rate of VAT increased by 9.5 per cent
(from 21% to 23%).
June 2018
12 Statistics & Economic Research Branch
Table 7: 9% Sectors – VATable Output
Sector 2010 2011 2012 2013 2014 2015 2016 2017
VATable Output €m
Food 398.2 355.3 319.6 333.1 341.4 369.6 411.4 437.7
Hairdressing & beauty 67.2 60.9 55.6 54.2 54.3 58.2 64.7 72.1
Accommodation 360 328 319.7 324.7 347.6 391.7 422.9 450.9
Sport 66.7 60.1 59 60.1 46.6 51.5 56.9 56.2
Publishing 68.7 57.7 48.5 53.9 53.1 53 53 49.2
Amusement parks 5.1 5.4 4.5 4.6 4.8 6.2 6.7 6.3
Motion picture projection 28 25.3 24.3 22.4 21.5 36.1 27.7 28.4
Raising of equines 3.2 3.5 3.2 3.4 4.2 5.4 5.1 7
Museums activities 1.6 1.5 1.7 2 2.5 4.1 4.6 5.4
Operation of historical sites 0.8 1.1 1.2 1 1 1.2 1.5 1.6
All 9% Sectors 1,000 899 837 859 877 977 1,055 1,115
Growth in VATable Output
Food -4% -11% -10% 4% 2% 8% 11% 6%
Hairdressing & beauty -9% -9% -9% -3% 0% 7% 11% 11%
Accommodation -9% -9% -3% 2% 7% 13% 8% 7%
Sport 11% -10% -2% 2% -22% 11% 10% -1%
Publishing -14% -16% -16% 11% -1% 0% 0% -7%
Amusement parks -18% 6% -17% 2% 4% 29% 8% -6%
Motion picture projection 0% -10% -4% -8% -4% 68% -23% 3%
Raising of equines 7% 9% -9% 6% 24% 29% -6% 37%
Museums activities -24% -6% 13% 18% 25% 64% 12% 17%
Operation of historical sites 0% 38% 9% -17% 0% 20% 25% 7%
All 9% Sectors -6% -10% -7% 3% 2% 11% 8% 6%
Source: Revenue analysis
2.4 Exchequer Cost of the 9% Rate
It is not possible to directly estimate the cost to the Exchequer of the 9% VAT rate using
the information supplied on tax returns alone. Based on a combination of data from
Revenue, CSO and other sources, the Ready Reckoner provides Revenue’s overall estimate
of changing the 9% rate. 9 It is estimated, based on current data, that to return the 9%
rate to 13.5% would yield around €520 million to the Exchequer.
An alternative approach, based on the analysis of sectors in Sections 2.2 and 2.3 is to
estimate the VAT revenue foregone across the main sectors identified as providing these
activities.10 This calculation is performed for each of the sectors identified in Table 5. Based
on this estimate, the cost of the 9% rate increased yearly between 2012 and 2016.
9 The Revenue Ready Reckoner is available at: https://www.revenue.ie/en/corporate/information-about-revenue/statistics/ready-reckoner/index.aspx. 10 For example: food on average has 88% of activity (Proportion “P9%”) at the 9% rate and assuming the remaining 12% of sales are at 23%, the VAT attributed to 9% sales is calculated as follows: (VAT on Sales) * (P9% *9% / sum(P9% * 9% + (1- P9%) *23%))/9 * (13.5 – 9)
June 2018
13 Statistics & Economic Research Branch
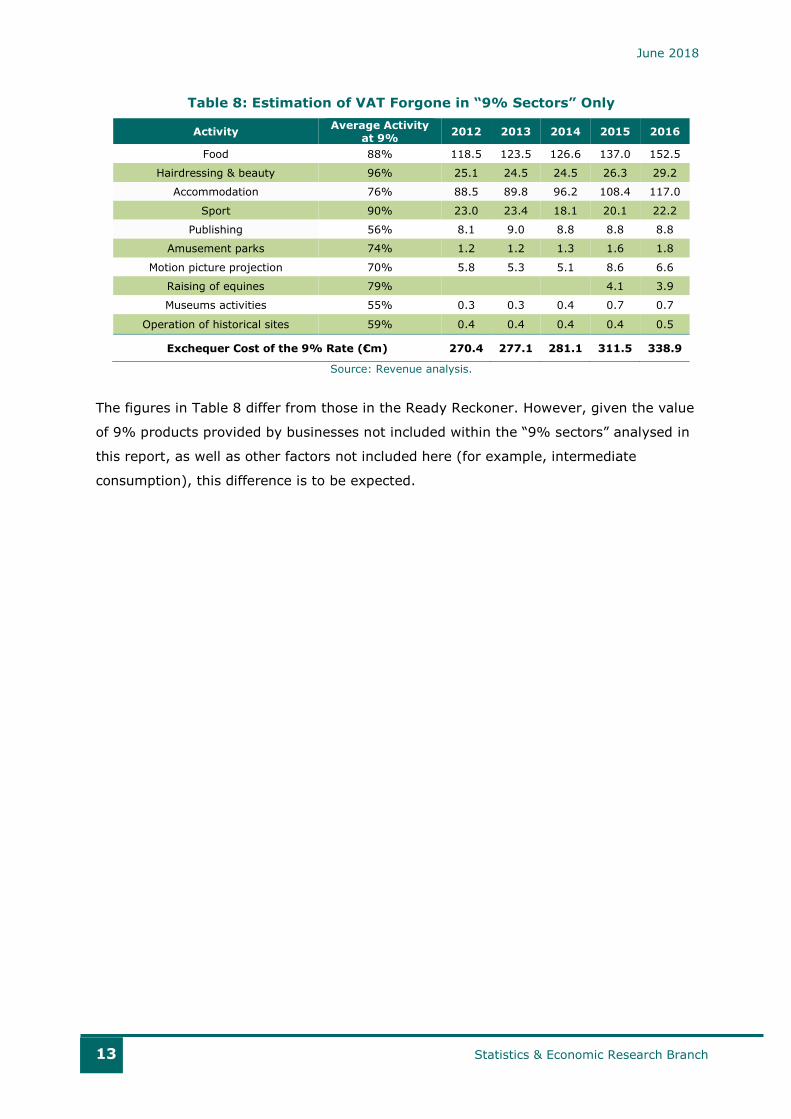
Table 8: Estimation of VAT Forgone in “9% Sectors” Only
Activity Average Activity
at 9% 2012 2013 2014 2015 2016
Food 88% 118.5 123.5 126.6 137.0 152.5
Hairdressing & beauty 96% 25.1 24.5 24.5 26.3 29.2
Accommodation 76% 88.5 89.8 96.2 108.4 117.0
Sport 90% 23.0 23.4 18.1 20.1 22.2
Publishing 56% 8.1 9.0 8.8 8.8 8.8
Amusement parks 74% 1.2 1.2 1.3 1.6 1.8
Motion picture projection 70% 5.8 5.3 5.1 8.6 6.6
Raising of equines 79% 4.1 3.9
Museums activities 55% 0.3 0.3 0.4 0.7 0.7
Operation of historical sites 59% 0.4 0.4 0.4 0.4 0.5
Exchequer Cost of the 9% Rate (€m) 270.4 277.1 281.1 311.5 338.9
Source: Revenue analysis.
The figures in Table 8 differ from those in the Ready Reckoner. However, given the value
of 9% products provided by businesses not included within the “9% sectors” analysed in
this report, as well as other factors not included here (for example, intermediate
consumption), this difference is to be expected.
June 2018
14 Statistics & Economic Research Branch
3 Employment Trends
Revenue data from employers returns (the “P35” return) are linked to VAT records to
analyse the employment of businesses in the 9% sectors (as defined in Section 2).11 It
should be noted that Revenue data record employments rather than individual employees
(e.g., someone switching jobs during a year or holding two jobs concurrently would be
recorded as two separate employments).12 While Revenue employment data are useful to
compare performance in 9% and non-9% sectors, they should not be expected to equate
to CSO labour force figures for these sectors.
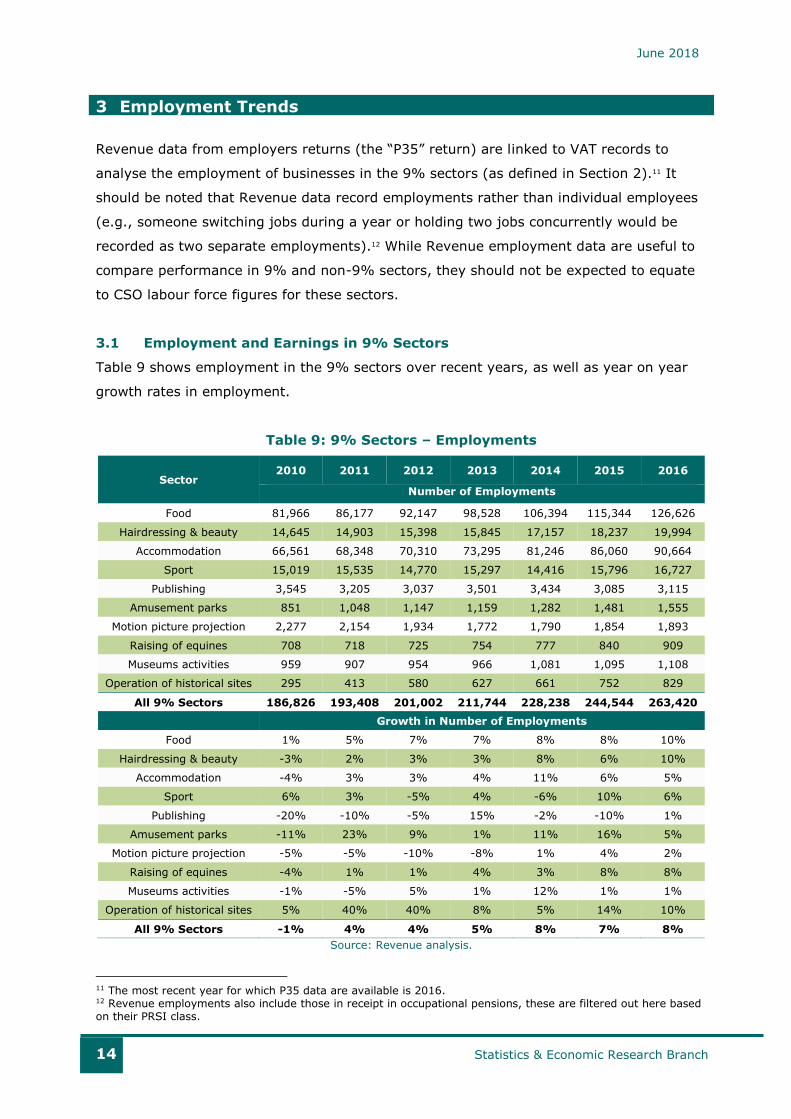
3.1 Employment and Earnings in 9% Sectors
Table 9 shows employment in the 9% sectors over recent years, as well as year on year
growth rates in employment.
Table 9: 9% Sectors – Employments
Sector 2010 2011 2012 2013 2014 2015 2016
Number of Employments
Food 81,966 86,177 92,147 98,528 106,394 115,344 126,626
Hairdressing & beauty 14,645 14,903 15,398 15,845 17,157 18,237 19,994
Accommodation 66,561 68,348 70,310 73,295 81,246 86,060 90,664
Sport 15,019 15,535 14,770 15,297 14,416 15,796 16,727
Publishing 3,545 3,205 3,037 3,501 3,434 3,085 3,115
Amusement parks 851 1,048 1,147 1,159 1,282 1,481 1,555
Motion picture projection 2,277 2,154 1,934 1,772 1,790 1,854 1,893
Raising of equines 708 718 725 754 777 840 909
Museums activities 959 907 954 966 1,081 1,095 1,108
Operation of historical sites 295 413 580 627 661 752 829
All 9% Sectors 186,826 193,408 201,002 211,744 228,238 244,544 263,420
Growth in Number of Employments
Food 1% 5% 7% 7% 8% 8% 10%
Hairdressing & beauty -3% 2% 3% 3% 8% 6% 10%
Accommodation -4% 3% 3% 4% 11% 6% 5%
Sport 6% 3% -5% 4% -6% 10% 6%
Publishing -20% -10% -5% 15% -2% -10% 1%
Amusement parks -11% 23% 9% 1% 11% 16% 5%
Motion picture projection -5% -5% -10% -8% 1% 4% 2%
Raising of equines -4% 1% 1% 4% 3% 8% 8%
Museums activities -1% -5% 5% 1% 12% 1% 1%
Operation of historical sites 5% 40% 40% 8% 5% 14% 10%
All 9% Sectors -1% 4% 4% 5% 8% 7% 8%
Source: Revenue analysis.
11 The most recent year for which P35 data are available is 2016. 12 Revenue employments also include those in receipt in occupational pensions, these are filtered out here based on their PRSI class.
June 2018
15 Statistics & Economic Research Branch
In 2016 the number of employments in the accommodation sector was 32 per cent higher
than in 2011 while numbers in the food sector increased by 41 per cent. Both sectors
experienced year on year growth in employment between 2012 and 2016. The change in
employment numbers in other 9% sectors varies. Employment in publishing/printing
declined significantly in 2015.
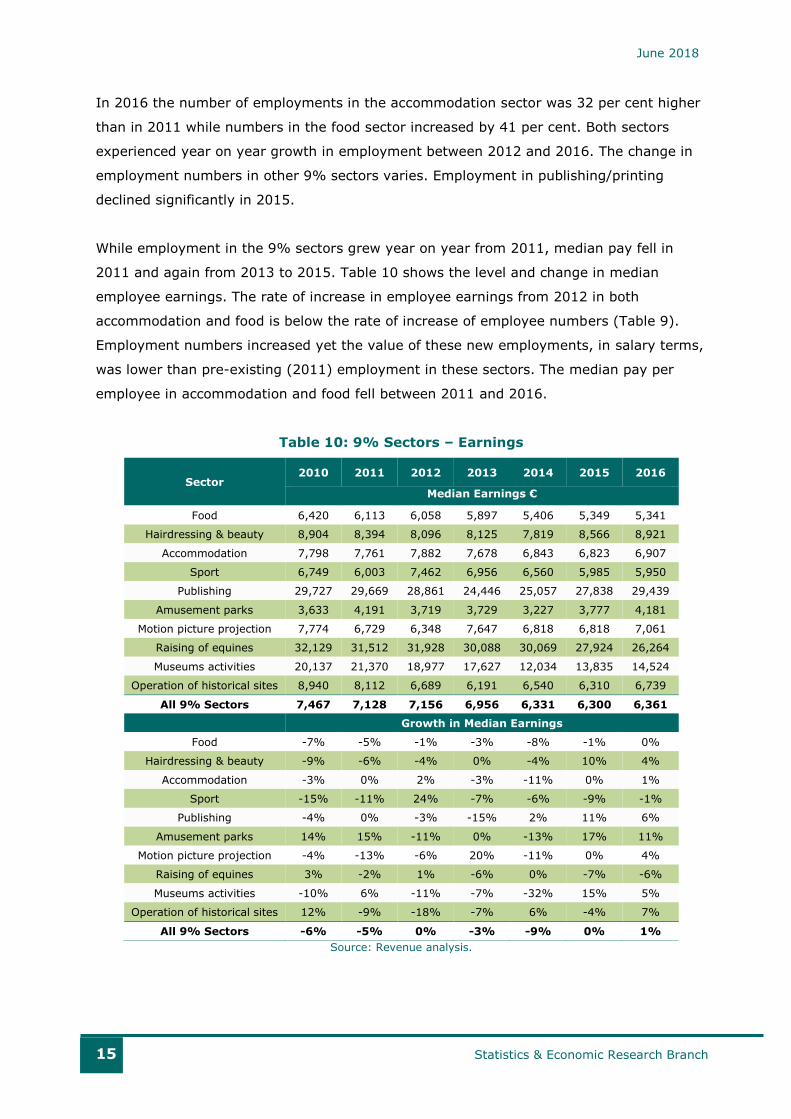
While employment in the 9% sectors grew year on year from 2011, median pay fell in
2011 and again from 2013 to 2015. Table 10 shows the level and change in median
employee earnings. The rate of increase in employee earnings from 2012 in both
accommodation and food is below the rate of increase of employee numbers (Table 9).
Employment numbers increased yet the value of these new employments, in salary terms,
was lower than pre-existing (2011) employment in these sectors. The median pay per
employee in accommodation and food fell between 2011 and 2016.
Table 10: 9% Sectors – Earnings
Sector 2010 2011 2012 2013 2014 2015 2016
Median Earnings €
Food 6,420 6,113 6,058 5,897 5,406 5,349 5,341
Hairdressing & beauty 8,904 8,394 8,096 8,125 7,819 8,566 8,921
Accommodation 7,798 7,761 7,882 7,678 6,843 6,823 6,907
Sport 6,749 6,003 7,462 6,956 6,560 5,985 5,950
Publishing 29,727 29,669 28,861 24,446 25,057 27,838 29,439
Amusement parks 3,633 4,191 3,719 3,729 3,227 3,777 4,181
Motion picture projection 7,774 6,729 6,348 7,647 6,818 6,818 7,061
Raising of equines 32,129 31,512 31,928 30,088 30,069 27,924 26,264
Museums activities 20,137 21,370 18,977 17,627 12,034 13,835 14,524
Operation of historical sites 8,940 8,112 6,689 6,191 6,540 6,310 6,739
All 9% Sectors 7,467 7,128 7,156 6,956 6,331 6,300 6,361
Growth in Median Earnings
Food -7% -5% -1% -3% -8% -1% 0%
Hairdressing & beauty -9% -6% -4% 0% -4% 10% 4%
Accommodation -3% 0% 2% -3% -11% 0% 1%
Sport -15% -11% 24% -7% -6% -9% -1%
Publishing -4% 0% -3% -15% 2% 11% 6%
Amusement parks 14% 15% -11% 0% -13% 17% 11%
Motion picture projection -4% -13% -6% 20% -11% 0% 4%
Raising of equines 3% -2% 1% -6% 0% -7% -6%
Museums activities -10% 6% -11% -7% -32% 15% 5%
Operation of historical sites 12% -9% -18% -7% 6% -4% 7%
All 9% Sectors -6% -5% 0% -3% -9% 0% 1%
Source: Revenue analysis.

June 2018
16 Statistics & Economic Research Branch
The earning distribution across employee pay also varies across these sectors as shown in
Table 11. Revenue data do not distinguish between part time and full time employment.
However, it would be expected that part time employment is common in many 9% sectors
and this likely explains the distribution of earnings in the lower ranges shown in the Table.
In wholesale & retail the bottom 80 per cent of earners receive around 40 per cent of total
salary costs, while accommodation typically spends around 55 per cent of salary on the
lower paid 80 per cent of employees. In hairdressing, which would typically have a higher
level of training required, this rises to 60 per cent of the total salary costs.
Table 11: Salary Distribution of 9% Sector Employments
Earning Band: <€3k €3k-€10k €10k-€21k €21k-€36k >€36k
Year Proportion of Employments in Each Earnings Band
2009 16% 33% 32% 15% 5%
2010 17% 34% 31% 14% 4%
2011 13% 36% 32% 14% 4%
2012 9% 39% 34% 14% 4%
2013 10% 39% 33% 13% 4%
2014 19% 37% 30% 12% 3%
2015 19% 36% 29% 12% 3%
2016 19% 36% 29% 13% 4%
Source: Revenue analysis.
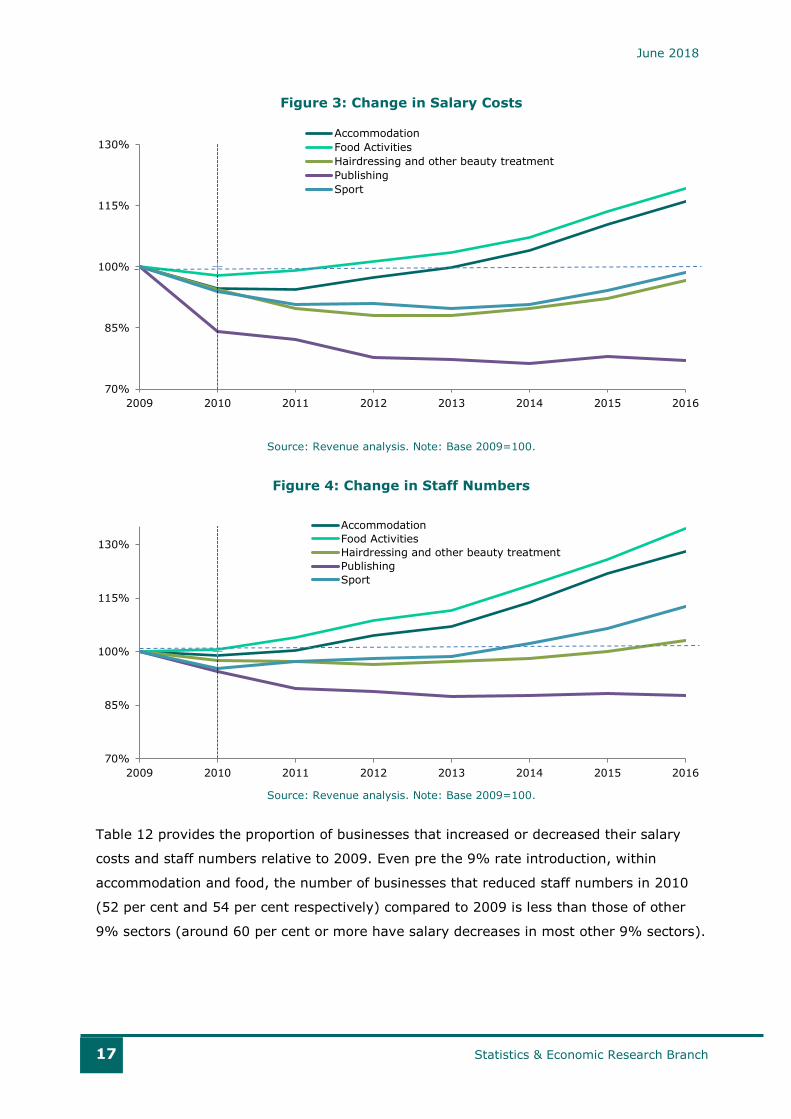
To further assess changes in employment and salary costs in 9% sectors, a sample of
businesses trading in each 9% sector from 2009 to 2016 was analysed. Setting 2009 as a
base year for total salary costs and employee numbers, accommodation and restaurants
experienced growth in salary costs from 2010 onwards as indicated in Figure 3. By 2016
hairdressing and sport were still just below the salary bill paid in 2009 while in 2016 the
food and accommodation sectors were paying a salary bill 18 per cent higher than 2009.
In terms of the change in staff numbers (Figure 4), the rate of increase in numbers of
employments is faster than salary cost. In 2016, with the exception of the publishing
sector, all other 9% sectors have employed a higher number of staff. The accommodation
and food sectors combined have 30 per cent higher employment rate in 2016 (than in
2009) while the cost of this labour is close to 17 per cent higher.
June 2018
17 Statistics & Economic Research Branch
Figure 3: Change in Salary Costs
Source: Revenue analysis. Note: Base 2009=100.
Figure 4: Change in Staff Numbers
Source: Revenue analysis. Note: Base 2009=100.
Table 12 provides the proportion of businesses that increased or decreased their salary
costs and staff numbers relative to 2009. Even pre the 9% rate introduction, within
accommodation and food, the number of businesses that reduced staff numbers in 2010
(52 per cent and 54 per cent respectively) compared to 2009 is less than those of other
9% sectors (around 60 per cent or more have salary decreases in most other 9% sectors).
70%
85%
100%
115%
130%
2009 2010 2011 2012 2013 2014 2015 2016
Accommodation
Food Activities
Hairdressing and other beauty treatment
Publishing
Sport
70%
85%
100%
115%
130%
2009 2010 2011 2012 2013 2014 2015 2016
Accommodation
Food Activities
Hairdressing and other beauty treatment
Publishing
Sport
June 2018
18 Statistics & Economic Research Branch
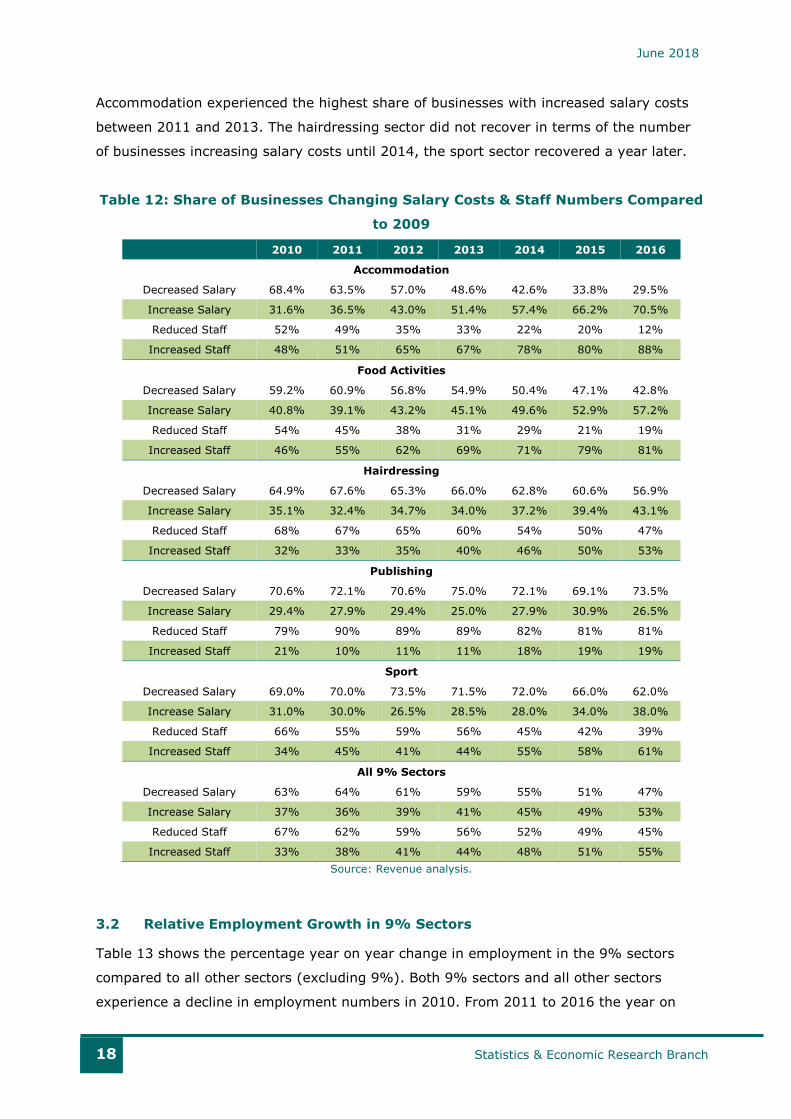
Accommodation experienced the highest share of businesses with increased salary costs
between 2011 and 2013. The hairdressing sector did not recover in terms of the number
of businesses increasing salary costs until 2014, the sport sector recovered a year later.
Table 12: Share of Businesses Changing Salary Costs & Staff Numbers Compared
to 2009
2010 2011 2012 2013 2014 2015 2016
Accommodation
Decreased Salary 68.4% 63.5% 57.0% 48.6% 42.6% 33.8% 29.5%
Increase Salary 31.6% 36.5% 43.0% 51.4% 57.4% 66.2% 70.5%
Reduced Staff 52% 49% 35% 33% 22% 20% 12%
Increased Staff 48% 51% 65% 67% 78% 80% 88%
Food Activities
Decreased Salary 59.2% 60.9% 56.8% 54.9% 50.4% 47.1% 42.8%
Increase Salary 40.8% 39.1% 43.2% 45.1% 49.6% 52.9% 57.2%
Reduced Staff 54% 45% 38% 31% 29% 21% 19%
Increased Staff 46% 55% 62% 69% 71% 79% 81%
Hairdressing
Decreased Salary 64.9% 67.6% 65.3% 66.0% 62.8% 60.6% 56.9%
Increase Salary 35.1% 32.4% 34.7% 34.0% 37.2% 39.4% 43.1%
Reduced Staff 68% 67% 65% 60% 54% 50% 47%
Increased Staff 32% 33% 35% 40% 46% 50% 53%
Publishing
Decreased Salary 70.6% 72.1% 70.6% 75.0% 72.1% 69.1% 73.5%
Increase Salary 29.4% 27.9% 29.4% 25.0% 27.9% 30.9% 26.5%
Reduced Staff 79% 90% 89% 89% 82% 81% 81%
Increased Staff 21% 10% 11% 11% 18% 19% 19%
Sport
Decreased Salary 69.0% 70.0% 73.5% 71.5% 72.0% 66.0% 62.0%
Increase Salary 31.0% 30.0% 26.5% 28.5% 28.0% 34.0% 38.0%
Reduced Staff 66% 55% 59% 56% 45% 42% 39%
Increased Staff 34% 45% 41% 44% 55% 58% 61%
All 9% Sectors
Decreased Salary 63% 64% 61% 59% 55% 51% 47%
Increase Salary 37% 36% 39% 41% 45% 49% 53%
Reduced Staff 67% 62% 59% 56% 52% 49% 45%
Increased Staff 33% 38% 41% 44% 48% 51% 55%
Source: Revenue analysis.
3.2 Relative Employment Growth in 9% Sectors
Table 13 shows the percentage year on year change in employment in the 9% sectors
compared to all other sectors (excluding 9%). Both 9% sectors and all other sectors
experience a decline in employment numbers in 2010. From 2011 to 2016 the year on
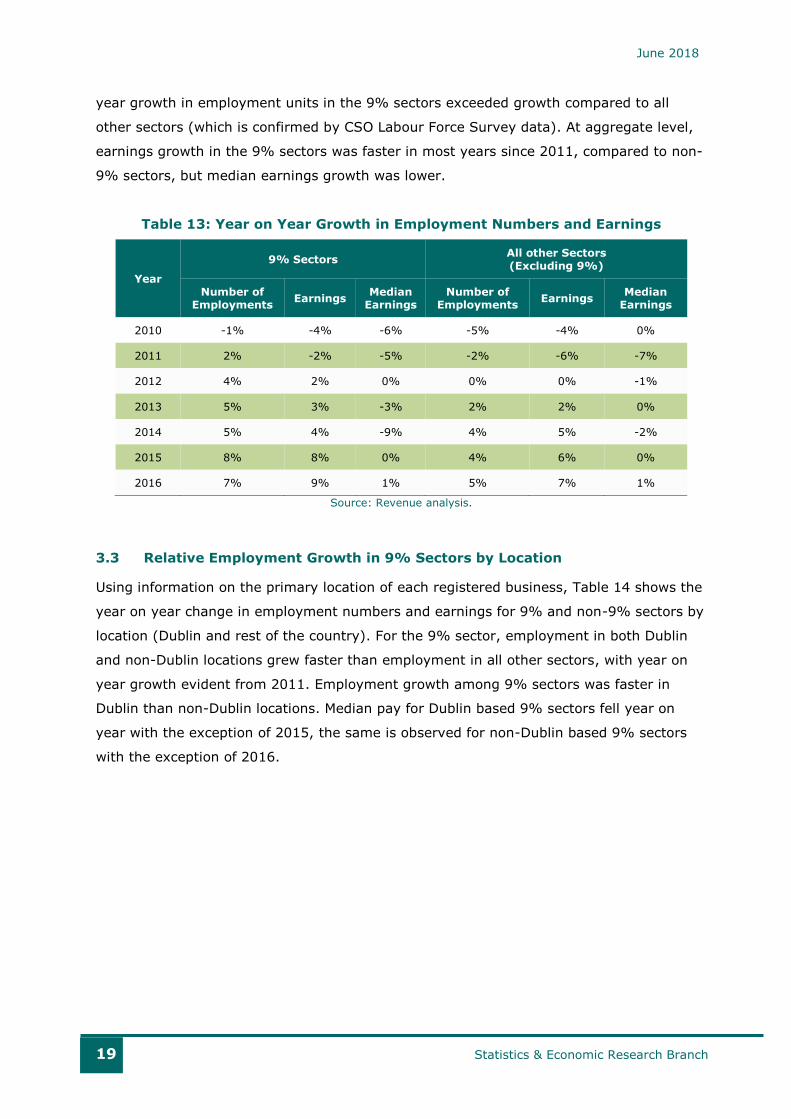
June 2018
19 Statistics & Economic Research Branch
year growth in employment units in the 9% sectors exceeded growth compared to all
other sectors (which is confirmed by CSO Labour Force Survey data). At aggregate level,
earnings growth in the 9% sectors was faster in most years since 2011, compared to non-
9% sectors, but median earnings growth was lower.
Table 13: Year on Year Growth in Employment Numbers and Earnings
Year
9% Sectors All other Sectors (Excluding 9%)
Number of Employments
Earnings Median
Earnings Number of
Employments Earnings
Median Earnings
2010 -1% -4% -6% -5% -4% 0%
2011 2% -2% -5% -2% -6% -7%
2012 4% 2% 0% 0% 0% -1%
2013 5% 3% -3% 2% 2% 0%
2014 5% 4% -9% 4% 5% -2%
2015 8% 8% 0% 4% 6% 0%
2016 7% 9% 1% 5% 7% 1%
Source: Revenue analysis.
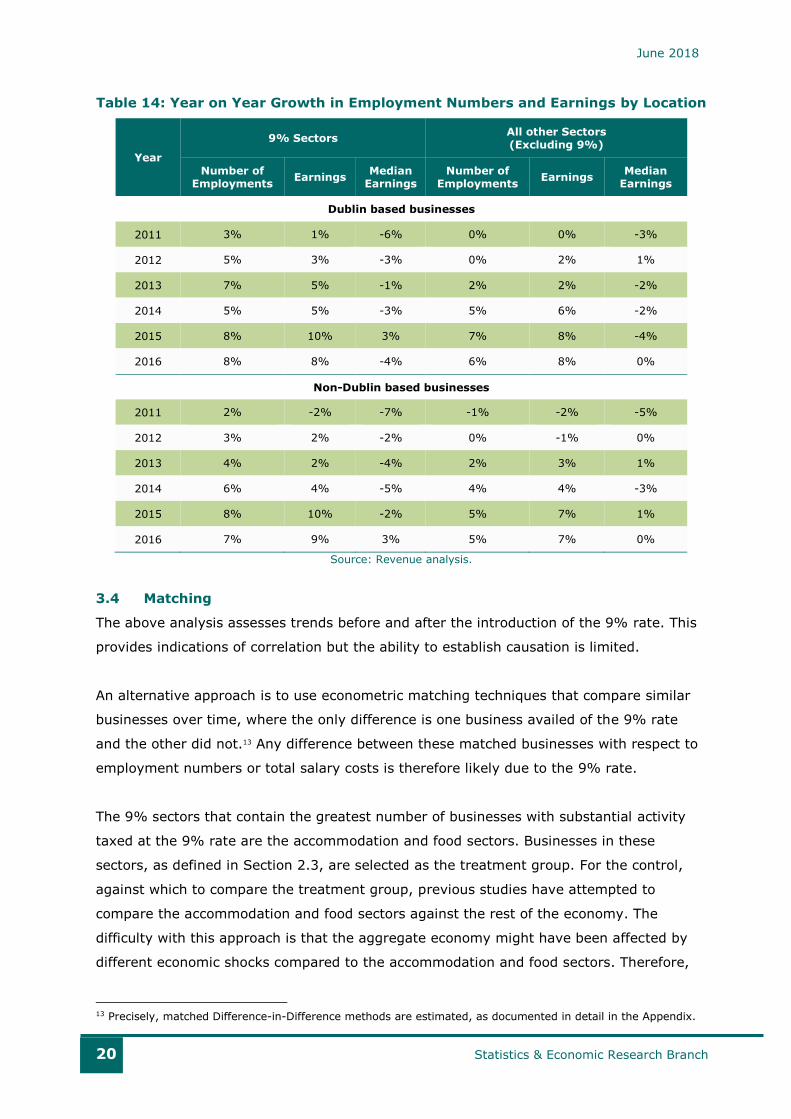
3.3 Relative Employment Growth in 9% Sectors by Location
Using information on the primary location of each registered business, Table 14 shows the
year on year change in employment numbers and earnings for 9% and non-9% sectors by
location (Dublin and rest of the country). For the 9% sector, employment in both Dublin
and non-Dublin locations grew faster than employment in all other sectors, with year on
year growth evident from 2011. Employment growth among 9% sectors was faster in
Dublin than non-Dublin locations. Median pay for Dublin based 9% sectors fell year on
year with the exception of 2015, the same is observed for non-Dublin based 9% sectors
with the exception of 2016.
June 2018
20 Statistics & Economic Research Branch
Table 14: Year on Year Growth in Employment Numbers and Earnings by Location
Year
9% Sectors All other Sectors (Excluding 9%)
Number of Employments
Earnings Median
Earnings Number of
Employments Earnings
Median Earnings
Dublin based businesses
2011 3% 1% -6% 0% 0% -3%
2012 5% 3% -3% 0% 2% 1%
2013 7% 5% -1% 2% 2% -2%
2014 5% 5% -3% 5% 6% -2%
2015 8% 10% 3% 7% 8% -4%
2016 8% 8% -4% 6% 8% 0%
Non-Dublin based businesses
2011 2% -2% -7% -1% -2% -5%
2012 3% 2% -2% 0% -1% 0%
2013 4% 2% -4% 2% 3% 1%
2014 6% 4% -5% 4% 4% -3%
2015 8% 10% -2% 5% 7% 1%
2016 7% 9% 3% 5% 7% 0%
Source: Revenue analysis.
3.4 Matching
The above analysis assesses trends before and after the introduction of the 9% rate. This
provides indications of correlation but the ability to establish causation is limited.
An alternative approach is to use econometric matching techniques that compare similar
businesses over time, where the only difference is one business availed of the 9% rate
and the other did not.13 Any difference between these matched businesses with respect to
employment numbers or total salary costs is therefore likely due to the 9% rate.
The 9% sectors that contain the greatest number of businesses with substantial activity
taxed at the 9% rate are the accommodation and food sectors. Businesses in these
sectors, as defined in Section 2.3, are selected as the treatment group. For the control,
against which to compare the treatment group, previous studies have attempted to
compare the accommodation and food sectors against the rest of the economy. The
difficulty with this approach is that the aggregate economy might have been affected by
different economic shocks compared to the accommodation and food sectors. Therefore,
13 Precisely, matched Difference-in-Difference methods are estimated, as documented in detail in the Appendix.
June 2018
21 Statistics & Economic Research Branch
the whole economy may not make a suitable comparison. Instead, this analysis matches
individual accommodation and food businesses that trade at the 9% rate to similar
individual businesses operating in retail that did not.14 The retail sector (excluding food,
beverages and tobacco) is considered comparable to accommodation and food services as
these sectors are all largely driven by discretionary consumer expenditure.15
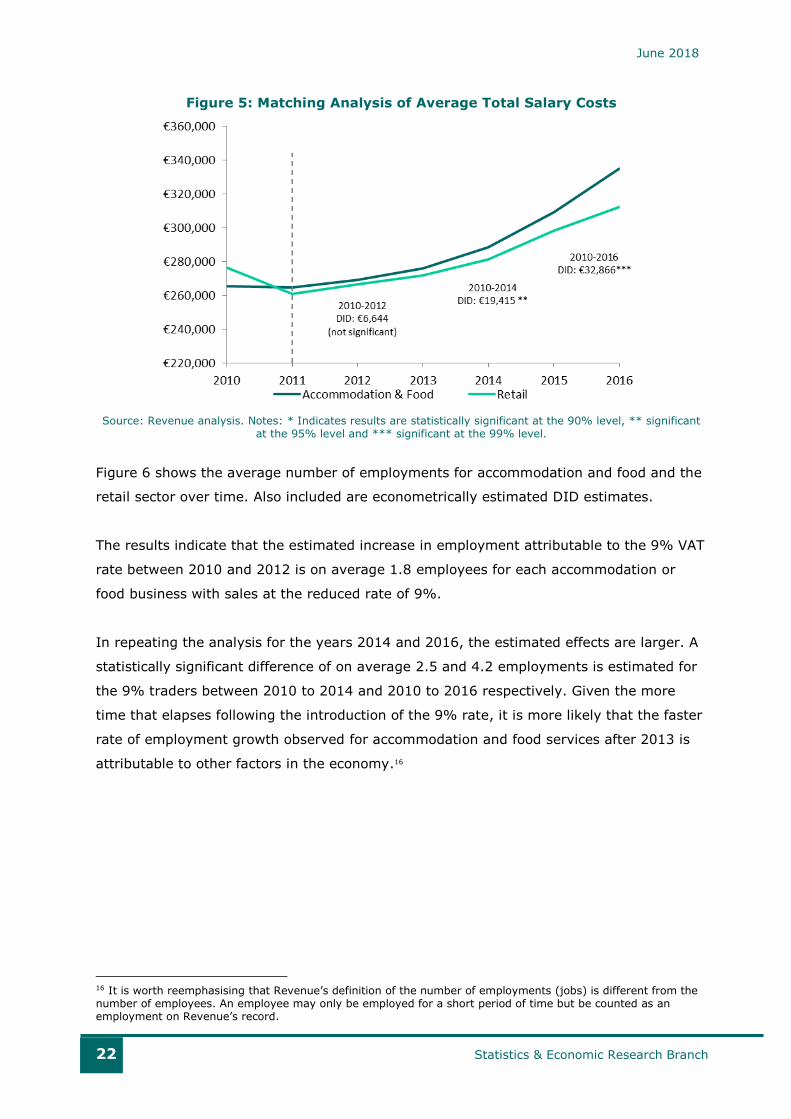
Figure 5 shows the average total annual salary costs per business for both accommodation
and food and the retail sector over time. Also included are econometrically estimated
Difference in Difference (DID) estimates. These show the average difference in total salary
costs over time for each 9% business compared to a similar business in the retail sector.
Overall, the total salary bill increases in both sectors over time. However, when comparing
these sectors econometrically, there is no significant evidence that accommodation and
food services increased their total salary bills in the years immediately following the
introduction of the 9% rate over and above a similar cohort of businesses in the retail
sector that did not receive the lower rate. In other words, the short term difference (2010
to 2012) may arise due to chance rather than a systematic difference between 9% rated
businesses and other businesses.
As businesses’ average total salary costs increase faster in accommodation and food
services compared to retail after 2013, the difference becomes statistically significant.
Between 2010 and 2014, a business with sales at the 9% rate will on average have salary
costs that are over €19,000 higher over and above similar businesses in the retail sector
that did not have sales at the lower rate. However, as more time elapses following the
introduction of the 9% rate in 2011, there is a greater chance that the difference is not
being caused by the reduced VAT rate but rather being driven by other factors in a faster
growing economy.
14 Nonetheless, the results were similar when businesses in food and accommodation were matched to businesses in the whole economy. 15 The control identified as the cohort of businesses in the retail sector that do not have significant trade at the 9% rate. Specifically, the retail sales that are considered are from NACE codes 4741 to 4799. Retail sales that are not considered are in non-specialised stores (NACE codes 4711 and 4719), of food, beverages and tobacco in specialised stores (NACE codes between 4721 and 4729) and of automotive fuel (NACE code 4730).
June 2018
22 Statistics & Economic Research Branch
Figure 5: Matching Analysis of Average Total Salary Costs
Source: Revenue analysis. Notes: * Indicates results are statistically significant at the 90% level, ** significant at the 95% level and *** significant at the 99% level.
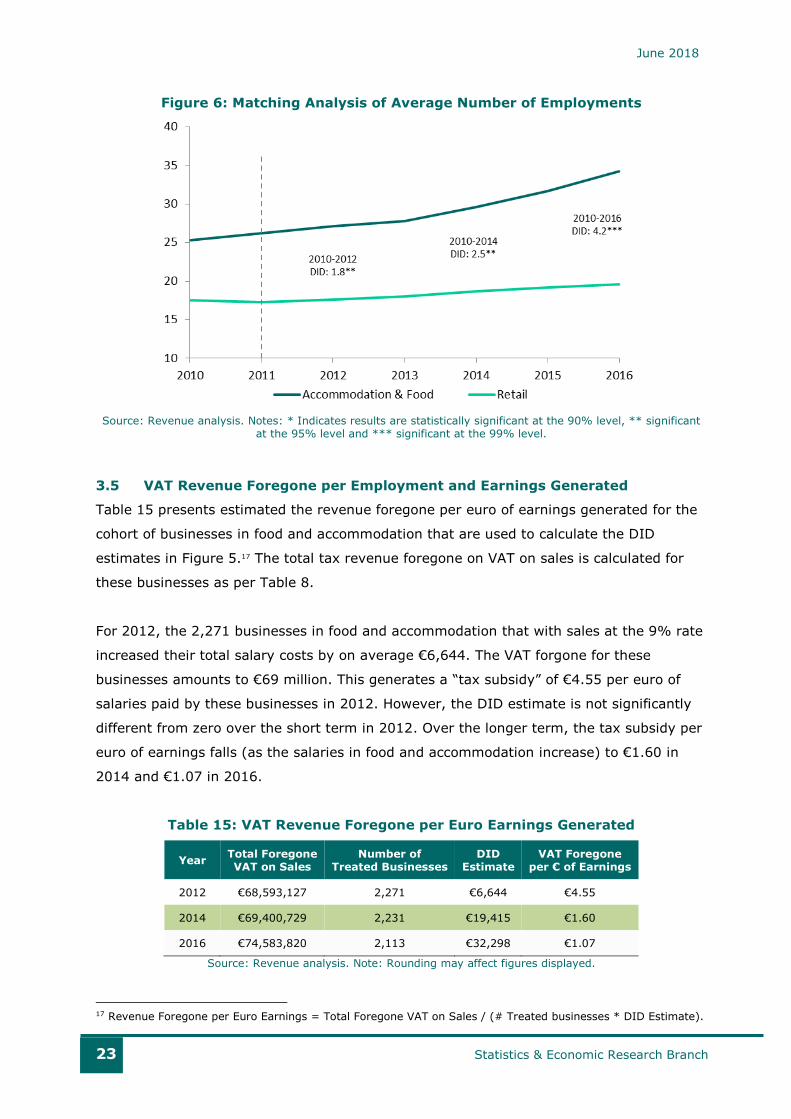
Figure 6 shows the average number of employments for accommodation and food and the
retail sector over time. Also included are econometrically estimated DID estimates.
The results indicate that the estimated increase in employment attributable to the 9% VAT
rate between 2010 and 2012 is on average 1.8 employees for each accommodation or
food business with sales at the reduced rate of 9%.
In repeating the analysis for the years 2014 and 2016, the estimated effects are larger. A
statistically significant difference of on average 2.5 and 4.2 employments is estimated for
the 9% traders between 2010 to 2014 and 2010 to 2016 respectively. Given the more
time that elapses following the introduction of the 9% rate, it is more likely that the faster
rate of employment growth observed for accommodation and food services after 2013 is
attributable to other factors in the economy.16
16 It is worth reemphasising that Revenue’s definition of the number of employments (jobs) is different from the number of employees. An employee may only be employed for a short period of time but be counted as an employment on Revenue’s record.
June 2018
23 Statistics & Economic Research Branch
Figure 6: Matching Analysis of Average Number of Employments
Source: Revenue analysis. Notes: * Indicates results are statistically significant at the 90% level, ** significant at the 95% level and *** significant at the 99% level.
3.5 VAT Revenue Foregone per Employment and Earnings Generated
Table 15 presents estimated the revenue foregone per euro of earnings generated for the
cohort of businesses in food and accommodation that are used to calculate the DID
estimates in Figure 5.17 The total tax revenue foregone on VAT on sales is calculated for
these businesses as per Table 8.
For 2012, the 2,271 businesses in food and accommodation that with sales at the 9% rate
increased their total salary costs by on average €6,644. The VAT forgone for these
businesses amounts to €69 million. This generates a “tax subsidy” of €4.55 per euro of
salaries paid by these businesses in 2012. However, the DID estimate is not significantly
different from zero over the short term in 2012. Over the longer term, the tax subsidy per
euro of earnings falls (as the salaries in food and accommodation increase) to €1.60 in
2014 and €1.07 in 2016.
Table 15: VAT Revenue Foregone per Euro Earnings Generated
Year Total Foregone VAT on Sales
Number of Treated Businesses
DID Estimate
VAT Foregone per € of Earnings
2012 €68,593,127 2,271 €6,644 €4.55
2014 €69,400,729 2,231 €19,415 €1.60
2016 €74,583,820 2,113 €32,298 €1.07
Source: Revenue analysis. Note: Rounding may affect figures displayed.
17 Revenue Foregone per Euro Earnings = Total Foregone VAT on Sales / (# Treated businesses * DID Estimate).

June 2018
24 Statistics & Economic Research Branch
Table 16 presents the VAT revenue foregone per employment for the cohort of businesses
in food and accommodation used to calculate the DID estimates in Figure 6.18 The VAT
foregone is calculated for these businesses as per Table 8.
For 2012, the 2,352 businesses in food and accommodation that traded at the 9% rate
increased employment by on average 1.8 jobs each. The VAT forgone for these businesses
amounts to €83 million. This generates a tax subsidy per employment of just over
€19,000 in 2012. The tax subsidy per employment falls in the longer term as the number
of jobs created by food and accommodation increase. The tax subsidy per employment
falls to under €15,000 in 2014 and under €10,000 in 2016. As shown in Figure 6,
statistical significance of the DID estimates varies over the period and this should be
borne in mind when considering these results. It should be noted also that this analysis
does not take into account the employment taxes paid by employees.
Table 16: Revenue Foregone per Employment Generated
Year Total Foregone VAT on Sales
Number of Treated Businesses
DID Estimate
VAT Foregone per Employment
2012 €83,485,692 2,352 1.8 €19,249
2014 €84,299,675 2,312 2.5 €14,604
2016 €90,597,302 2,193 4.2 €9,743
Source: Revenue analysis. Notes: Rounding may affect figures displayed.
The conclusion from the matching analysis is that while there is evidence employments
increased in accommodation and food, average total salary costs did not significantly
increase in the years immediately following the introduction of the 9% rate. These result
in a large amount of tax revenue foregone per euro of earnings generated in the short
term. In the longer term, there is more evidence to suggest that both employments and
average total salary costs increased in accommodation and food and that the tax revenue
foregone per employment and salary falls. However as more time elapses, there is a
greater likelihood that these findings are attributable to other factors as the economy
rebounded after 2013.
18 Tax subsidy per Employment = Total Foregone VAT on Sales / (# Treated businesses * DID Estimate).
June 2018
25 Statistics & Economic Research Branch
4 Conclusion
The 9% VAT rate was introduced along with a number of other initiatives intended to
boost employment, in particular in the tourism sector following declines in visitor numbers
to Ireland between 2007 and 2010 and the impact of this decline on employment within
the sector. In addition to the cut in the VAT rate, a number of other elements of the Jobs
Initiative were implemented including increased expenditure in marketing Ireland as a
tourism destination, the removal of the air travel tax and reduction in airport fees, visa
alignment with the UK and a number of other measures. In the years following 2011, a
number of high profile tourism initiatives were launched (for example, “The Gathering” in
2013, the “Wild Atlantic Way” in 2014 and “Ireland’s Ancient East” in 2015).
With the range of different initiatives since 2011, as well as the general and widespread
changes in the economy over the same period (e.g., another factor may be increases in
the national minimum wage, which would be significant in many of the 9% sectors),
accurately isolating the impact of 9% rate alone is not possible.
This paper presents information on trend in VAT receipts and employment by businesses
in the sectors of the economy trading in products liable for VAT at 9%. Overall the
analysis indicates that the introduction of 9% reduced VAT rate has coincided with
stronger growth in employment in 9% sectors. With the exception of the econometric
matching analysis in Section 3.4, any correlations in trends with the 9% introduction
should be treated with caution without assuming causation. The matching analysis
suggests some limited evidence for a causal link to employment trends but the statistical
significance of this is mixed.
As noted in the Introduction, this analysis is undertaken to support a Department of
Finance’s review of the 9% rate. Any policy conclusions from this analysis are a matter for
the Department.
June 2018
26 Statistics & Economic Research Branch
Appendix: Matching
This Appendix describes the econometric methods used to identify the effect of the
reduced VAT rate on employments and total salary in accommodation and food services as
it represents the sectors with the greatest share of companies in receipt of the 9% rate.
The treatment evaluation literature is employed for this purpose.19 The treatment is
defined as the 9% VAT rate on sales while the outcome is taken as employment and
salary. The treatment group are the businesses (in accommodation and food) that conduct
at least 20% of their sales at the 9% rate while the control group are businesses in the
retail sector that do not.
If the assignment of goods and services to the 9% rate was completely randomised then
the natural way of measuring the effect of the reduced rate would be to compare the
average employment and salary of both the treated and non-treated firms. However, the
Jobs Initiative targets the 9% rate mainly at labour intensive goods and services relating
to tourism. Thus, the treated firms are systematically different from the non-treated firms,
which is likely to invalidate causal comparisons of outcome by treatment status. For
instance, if the probability of treatment is positively correlated to a firm’s labour intensity
then comparing average employment for the treated and untreated firms will overestimate
the impact of the 9% rate.
However, the tax records essentially contain the information that determines firms’
assignment to the 9% VAT rate. Each firm that receives a treatment can be matched to
non-treated firms on the basis of these observable characteristics.20
The relevant treatment effect is the Average Treatment Effect on the Treated (ATET). The
ATET measures, for the firms who receive the 9% rate, the average change in
employment and salary that is attributable to the reduced VAT rate.
Matching is conducted using available company level characteristics on tax records:
➢ Employment numbers
➢ Total wages
➢ Gross trading profits21
➢ Profitability to wages ratio22
➢ Type of business23 and
19 For further information refer to Cameron (2005), Chapter 25. 20 Matching can be thought of as a way of finding randomised data from within an observational dataset. After conditioning on these characteristics the treatment is randomly assigned to each group. 21 Gross trading profits equals turnover less operational costs (including wages). 22 Profitability to wages ratio equals gross trading profits divided by total wages.

June 2018
27 Statistics & Economic Research Branch
➢ Region24
Estimation of the treatment effect of the 9% VAT rate is conducted using matched
Difference-in-Difference (DID) estimates. A balanced panel is imposed over the period
from 2010 to 2016 to ensure that the combinations of matched firms remain the same
before and after the treatment. Firms in the treatment and control groups are matched on
the basis of their characteristics before the introduction of the 9% rate, in 2010. As the
RTD forms only became available after 2014, it is assumed that firms’ product mix did not
change substantially over the period.
Matching Methods
This analysis presents two types of matching methods: Mahalanobis Distance Matching
(MDM) and Coarsened Exact Matching (CEM).25 MDM is a popular matching method that
matches firms to their “nearest neighbour” on the basis of their observable
characteristics.26
MDM is performed with replacement meaning that a firm in the control group may be
matched to multiple treated firms. This is done even though the control group is large
relative to the treatment group. Matching with replacement reduces bias as the closest
possible matches are achieved. However, this is traded off against reducing variance as
the number of unique firms in the control group falls. The single closest match in the
control group is matched to each treated firm in order to minimise bias.
A limitation of MDM is that it can produce biased matches when the vector of observable
characteristics is large or not normally distributed. This issue arises because MDM
attempts to match firms on all their characteristics using equal weights thus creating a
high dimensional array of possible matches.
CEM is a newer matching method proposed by Blackwell et al. (2009) and Iacus et al.
(2012) with many appealing properties. CEM is conducted in three steps. First, each
observable characteristic is divided (or coarsened) into categories. This step is equivalent
to one which would be conducted if a histogram were to be produced. For instance, a
23 The type of business is categorised into three types and is identified using the type of tax return filed with Revenue to declare profitability or wages. The first is where self-assessed taxpayers with relatively small businesses declare their income via the Form 11. The second is where income arising from partnerships is file via the Form 11. The third is the corporation tax return (CT1) which large businesses are required to file. 24 Region refers to the location of the tax office that the company is registered with. Region is classified as follows: Dublin, Border Midlands West, East South East, South West and Large Cases Division. 25 Propensity Score Matching is considered but not presented as the estimates exhibit poor balancing properties. 26 There are many ex-ante ways of implementing the MDM estimation method. Caliendo and Kopeinig (2008) survey a range of possible implementation choices. MDM is estimated in STATA 13 using the psmatch2 command (Leuven and Sianesi, 2015).
June 2018
28 Statistics & Economic Research Branch
continuous variable such as VAT on sales can be divided into twenty categories while a
discrete variable such as region is naturally divided into five categories. The second step
performs match of firms on the basis of their coarsened characteristics. Finally, the
treatment effect can be identified using the original uncoarsened information. An
advantage of the CEM procedure is that the balance between the treatment and control
group can be chosen ex ante (Blackwell, 2009).
Identification Assumptions
Valid inference relies on a number of assumptions. To identify the treatment effect (ATET)
it is assumed that employment in the absence of treatment (the untreated outcome) is
unrelated to the selection for treatment, conditional on observable characteristics (this is
known as the Conditional Independence Assumption). That is, it is assumed that the full
set of characteristics that determine treatment assignment are observed in the data. This
implies unobservable variables play no role in the treatment assignment and outcome
determination.
Estimating treatment effects using DID requires additional assumptions. The first, known
as the assumption of parallel trends, requires that employment in firms in both the
treatment and control groups would have moved together over time in the absence of the
Jobs Initiative. The second assumption imposes that the composition of the treatment and
control groups did not change over time. This requires the assumption that firms had the
same product mix before and after the Jobs Initiative.27
For operational purposes, the overlap or matching condition requires for each treated firm
there is another matched untreated firm with the same characteristics. Following common
practice in the literature, the region of common support is restricted by setting the caliper
(the maximum permissible distance of nearest neighbours) to one-fifth of the standard
deviation of the probability of firms receiving treatment. The quality of the matches
increase when a caliper is applied by reducing bias however, this is at the expense of
increasing variance. Another important consideration is that the estimated treatment
effect will exclude the treated firms that remain unmatched.
The balancing condition requires that assignment to treatment conditional on the
propensity scores is unrelated to the observable characteristics. In other words whether a
firm is treated or not does not depend on their characteristics, such as labour intensity,
after accounting for the probability of receiving treatment (the propensity score). For
27 An example where this assumption would fail is a pub that begins to sell food after the 9% VAT rate introduction.
June 2018
29 Statistics & Economic Research Branch
example, conditional on the propensity scores, a highly labour intensive firm is equally
likely to be treated or untreated.
Treatment evaluation methods assume that observations are independent and identically
distributed. That is, the treatment received by one firm does not indirectly affect the
employment of other firms through general equilibrium effects. However, this assumption
may not hold if the 9% VAT rate has an indirect impact on the entire economy. If the 9%
VAT rate were to have increased employment in firms that do not sell products at the rate
(firms not in the treatment group) then the observed difference between the treated and
matched untreated groups would be biased downwards.
Total Earnings Results
The treatment effect on total salary in accommodation and food services for the years
2012, 2014 and 2016 are presented in Table A1. Overall, there is no significant evidence
to suggest that accommodation and food services increased their total salary costs when
compared to a similar cohort of retail firms.
The results in Table A1 are interpreted as follows. Before the introduction of the 9% VAT
rate in 2010, for the MDM method, matched firms in the treatment group had a total
annual salary bill of €133,356 on average while the firms they are matched to in the
control group paid on average €137,281. This means that the matched treated firms paid
on average -€3,925 less than the control firms in 2010. But the difference is not
statistically significant from zero. The same set of matched firms are used in 2012, 2014
and 2016. In 2012 the treated group paid €137,337 on average in total salary while the
control group paid on average €134,619, resulting in a difference of €2,719.
The DID estimate is taken as the difference between the 2012 and 2010 differences. In
this case the estimate of the increase in total annual salary attributable to the 9% VAT
rate between 2010 and 2012 is on average €6,644 for each firm in receipt of the reduced
rate. However, there is a large range of uncertainty associated with this estimate as the
result is not statistically significant.
Over time the total annual salary bill increased in both the treatment and control group.
However, total salary cost increased at a faster rate for the treatment group. Over time it
appears that the impact of the 9% rate on the total annual salary bill increased. However,
as more time elapses, it is less likely that the parallel trends assumption holds true.
June 2018
30 Statistics & Economic Research Branch
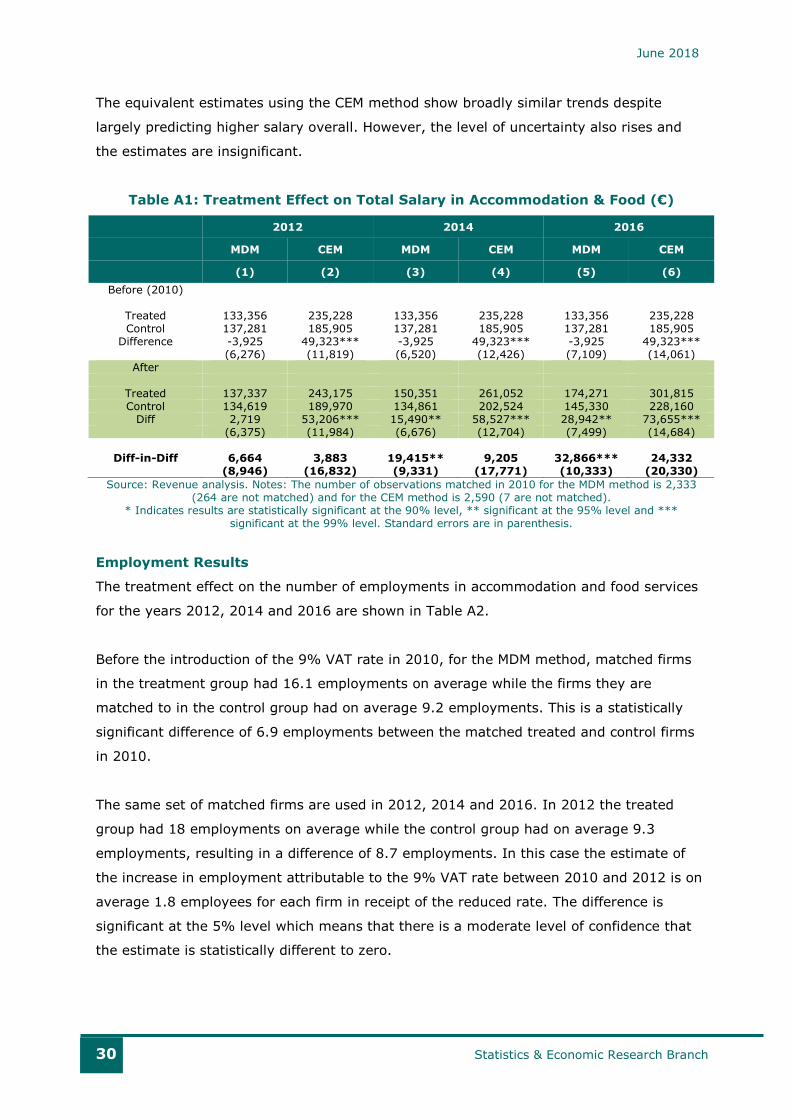
The equivalent estimates using the CEM method show broadly similar trends despite
largely predicting higher salary overall. However, the level of uncertainty also rises and
the estimates are insignificant.
Table A1: Treatment Effect on Total Salary in Accommodation & Food (€)
2012 2014 2016
MDM CEM MDM CEM MDM CEM
(1) (2) (3) (4) (5) (6)
Before (2010)
Treated 133,356 235,228 133,356 235,228 133,356 235,228 Control 137,281 185,905 137,281 185,905 137,281 185,905
Difference -3,925 49,323*** -3,925 49,323*** -3,925 49,323*** (6,276) (11,819) (6,520) (12,426) (7,109) (14,061)
After
Treated 137,337 243,175 150,351 261,052 174,271 301,815 Control 134,619 189,970 134,861 202,524 145,330 228,160
Diff 2,719 53,206*** 15,490** 58,527*** 28,942** 73,655*** (6,375) (11,984) (6,676) (12,704) (7,499) (14,684)
Diff-in-Diff 6,664 3,883 19,415** 9,205 32,866*** 24,332 (8,946) (16,832) (9,331) (17,771) (10,333) (20,330)
Source: Revenue analysis. Notes: The number of observations matched in 2010 for the MDM method is 2,333 (264 are not matched) and for the CEM method is 2,590 (7 are not matched).
* Indicates results are statistically significant at the 90% level, ** significant at the 95% level and *** significant at the 99% level. Standard errors are in parenthesis.
Employment Results
The treatment effect on the number of employments in accommodation and food services
for the years 2012, 2014 and 2016 are shown in Table A2.
Before the introduction of the 9% VAT rate in 2010, for the MDM method, matched firms
in the treatment group had 16.1 employments on average while the firms they are
matched to in the control group had on average 9.2 employments. This is a statistically
significant difference of 6.9 employments between the matched treated and control firms
in 2010.
The same set of matched firms are used in 2012, 2014 and 2016. In 2012 the treated
group had 18 employments on average while the control group had on average 9.3
employments, resulting in a difference of 8.7 employments. In this case the estimate of
the increase in employment attributable to the 9% VAT rate between 2010 and 2012 is on
average 1.8 employees for each firm in receipt of the reduced rate. The difference is
significant at the 5% level which means that there is a moderate level of confidence that
the estimate is statistically different to zero.
June 2018
31 Statistics & Economic Research Branch
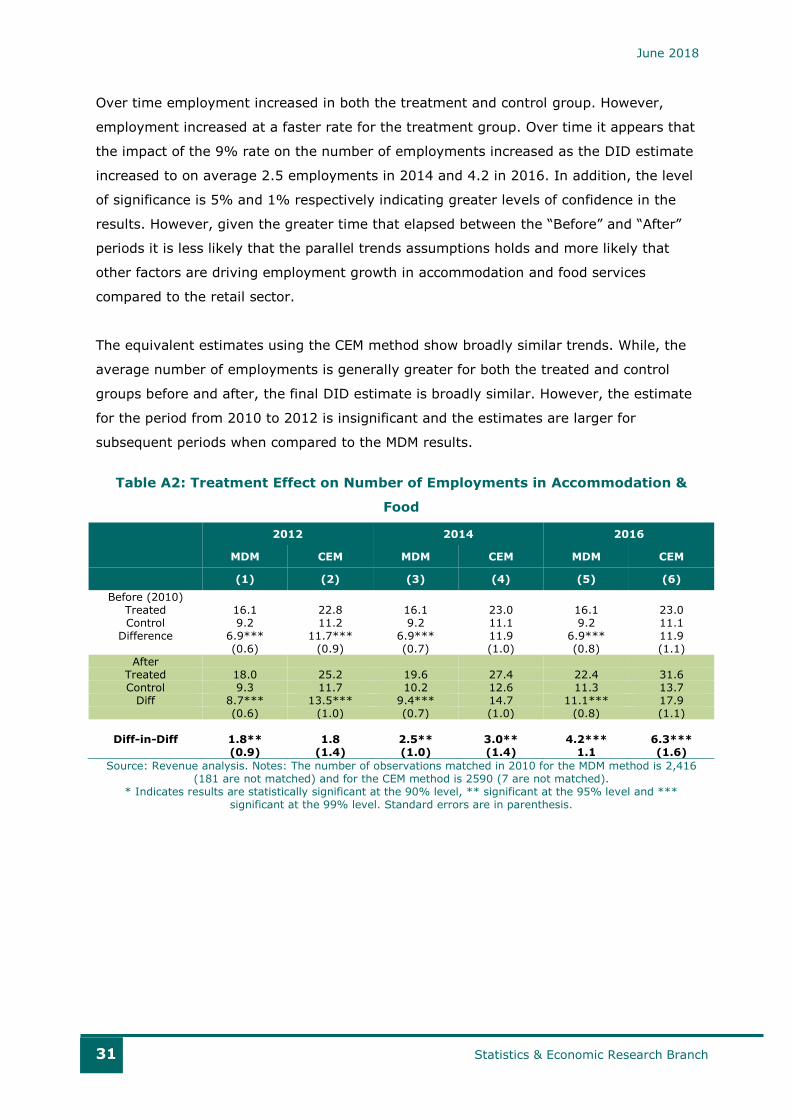
Over time employment increased in both the treatment and control group. However,
employment increased at a faster rate for the treatment group. Over time it appears that
the impact of the 9% rate on the number of employments increased as the DID estimate
increased to on average 2.5 employments in 2014 and 4.2 in 2016. In addition, the level
of significance is 5% and 1% respectively indicating greater levels of confidence in the
results. However, given the greater time that elapsed between the “Before” and “After”
periods it is less likely that the parallel trends assumptions holds and more likely that
other factors are driving employment growth in accommodation and food services
compared to the retail sector.
The equivalent estimates using the CEM method show broadly similar trends. While, the
average number of employments is generally greater for both the treated and control
groups before and after, the final DID estimate is broadly similar. However, the estimate
for the period from 2010 to 2012 is insignificant and the estimates are larger for
subsequent periods when compared to the MDM results.
Table A2: Treatment Effect on Number of Employments in Accommodation &
Food
2012 2014 2016
MDM CEM MDM CEM MDM CEM
(1) (2) (3) (4) (5) (6)
Before (2010) Treated 16.1 22.8 16.1 23.0 16.1 23.0 Control 9.2 11.2 9.2 11.1 9.2 11.1
Difference 6.9*** 11.7*** 6.9*** 11.9 6.9*** 11.9 (0.6) (0.9) (0.7) (1.0) (0.8) (1.1)
After Treated 18.0 25.2 19.6 27.4 22.4 31.6 Control 9.3 11.7 10.2 12.6 11.3 13.7
Diff 8.7*** 13.5*** 9.4*** 14.7 11.1*** 17.9 (0.6) (1.0) (0.7) (1.0) (0.8) (1.1)
Diff-in-Diff 1.8** 1.8 2.5** 3.0** 4.2*** 6.3*** (0.9) (1.4) (1.0) (1.4) 1.1 (1.6)
Source: Revenue analysis. Notes: The number of observations matched in 2010 for the MDM method is 2,416 (181 are not matched) and for the CEM method is 2590 (7 are not matched).
* Indicates results are statistically significant at the 90% level, ** significant at the 95% level and *** significant at the 99% level. Standard errors are in parenthesis.
June 2018
32 Statistics & Economic Research Branch
References
Blackwell, M., Iacus, S., King, G. and Porro, G. (2009). CEM: Coarsened Exact Matching in
Stata. The Stata Journal, 9(4), pages 524-546.
Caliendo, M. and Kopeinig, S. (2008). Some Practical Guidance for the Implementation of
Propensity Score Matching. Journal of Economic Surveys, 22(1), pages 31-72.
Callaghan, N. and Tol, R. (2013). UK tourists, the Great Recession and Irish Tourism
policy. Economic and Social Review, 44(1), pages 103–116.
Cameron, A. C. and Trivedi, P. K. (2005). Microeconometrics: Methods and Applications.
Cambridge University Press.
Deloitte (2013). Analysis of the Impact of the VAT Reduction on Irish Tourism &
Tourism Employment. Report for Fáilte Ireland.
Iacus, S. M., King, G., Porro, G., and Katz, J. N. (2012). Causal Inference without
Balance Checking: Coarsened exact matching. Political Analysis, pages 1–24.
Indecon International Economic Consultants (2017). Impact of the VAT Reduction on Irish
Tourism and Tourism Employment. Report for Fáilte Ireland.
Leuven, E. and Sianesi, B. (2015). PSMATCH2: Stata Module to Perform Full Mahalanobis
and Propensity Score Matching, Common Support Graphing, and Covariate Imbalance
Testing.
O’Connor, B. (2013). Measuring the impact of the Jobs Initiative: Was the VAT reduction
passed on and were jobs created? Administration, 60, pages 161-179.
Walsh, M. (1996). Demand analysis in Irish tourism. Journal of the Statistical and Social
Inquiry Society of Ireland, XXVII pages 1-35.