Embed Size (px)
Citation preview


The 411 on DER from IOUs
DAVID WYLIE, ANGELA CHUANG, GARY BARSLEY, TONY RAFATI, KEN CHAWKINS

The 411 on DER from IOUs
Moderator: David Wylie, P.E.ASWB Engineering

Substation Load Profile with Forecast Overload
4
Forecasted Load Profile
Increased Capacity Rating (Typical Wires Solution)
Capacity Rating
Illustrative

Alter Substation Load Profile Using DER Portfolio
5
Forecasted Load ProfileSolar PV
Net Load Profile
Capacity Rating
Illustrative
Solar Can Impact Load Profile During Daytime Hours

Alter Substation Load Profile with DER Portfolio
6
Forecasted Load Profile
Net Load Profile
Energy Efficiency
Solar PV
Capacity Rating
Illustrative
Energy Efficiency Programs can Permanently Reduce Load Profile

Alter Substation Load Profile Using DER Portfolio
7
Forecasted Load Profile
Energy Efficiency
Net Load Profile
Solar PV
Capacity Rating
IllustrativeDemand Response Programs can Temporarily Reduce Load Profile
Demand Response

Alter Substation Load Profile Using DER Portfolio
0
500
1000
1500
2000
2500
3000
3500
Po
we
r Fl
ow
(M
W)
Substation Z 66/12 kV Forecasted Net Load
20% Unadjusted 15-min Interpolated Load (A)
8
Forecasted Load Profile
Energy Efficiency
Demand Response
Net Load Profile
Solar PV
Energy Storage
Capacity Rating
IllustrativeEnergy Storage can be Dispatched to Prescriptively Reduce Load Profile

Alter Substation Load Profile Using DER Portfolio
10
Forecasted Load Profile
Energy StorageEnergy Storage
Solar PV
Demand Response
Energy Efficiency
Net Load Profile
Capacity Rating
Illustrative
Energy Storage Also Requires Charging Which Will Impact Load Profile

Alter Substation Load Profile Using DER Portfolio
11
Forecasted Load Profile
Net Load Profile with
DER Portfolio Solution
Increased Capacity Rating (Typical Wires Solution)
Capacity Rating
IllustrativeCustomized DER Portfolios Can Address Capacity Needs On Distribution

Alter Substation Load Profile Using DER Portfolio
12
Capacity Rating
Forecasted Load Profile
Energy StorageEnergy Storage
Solar PV
Demand Response
Energy Efficiency
Illustrative Increased Capacity Rating (Typical Wires Solution)
Operators Need Visibility to DER Portfolio Performance in Real Time
Net Load Profile with
DER Portfolio Solution

Avoided distribution capacity costs ($/kW-year)
13
• PG&E: $67.70
• SCE: $30.10
• SDG&E: $52.24
• Range: $1-300

© 2017 Electric Power Research Institute, Inc. All rights reserved.
Angela Chuang
Sr. Technical Leader
April 21, 2017
Driving towards Fast and
Flexible Distributed
Resources

15
© 2017 Electric Power Research Institute, Inc. All rights reserved.
TerminologyDistributed Resources = Demand Response and Distributed Energy Resources
DER
Distributed Resources
Demand Responsive Loads
Distributed
Intermittent
Renewable
Generators
Distributed non-intermittent:
Non-renewable DG
Distributed Storage
Plug-in Electric Vehicle
Thermal Energy Storage
Flexible Loads
Curtailable/Interruptible Loads
Source: EPRI Report 1020313 (2009)

16
© 2017 Electric Power Research Institute, Inc. All rights reserved.
Drivers Impacting Distributed Resources
▪ Rising Intermittent Renewable Penetration (as RPS and targets mature)
– Ramping energy needed to maintain supply and demand balance due to large net load ramps
– Negative prices and renewable curtailments during periods of over-generation
▪ Reversal of EPA Provisions for Emergency DR from Combustion Generators
– Non-compliance of combustion generators led to sudden loss in capacity in U.S. in 2016
– Behind-the-meter-generation (BTMG) decline in ISO/RTO DR programs
▪ Changes in System Load
– PJM winter peaks approaching towards summer peaks
– Driving need for year-round availability of resources
– Consumers becoming prosumers
▪ Changing Role of Distribution Systems
– Local network-level constraints and grid needs
– Widespread DER Integration (e.g., NY REV)
– FERC NOPR on Storage and DER
DR 1.0
Grid
Locational
DR
Customer
Locational DR
Balancing
Resource

17
© 2017 Electric Power Research Institute, Inc. All rights reserved.
A Key DriverIntermittent Renewable Penetration
0
100,000
200,000
300,000
400,000
2006 2007 2008 2009 2010 2011 2012 2013 2014 2015
U.S. Renewable Generation by Type (GWh)
Geothermal Wood fuels Biomass
0
5,000
10,000
15,000
20,000
25,000
30,000
2006 2007 2008 2009 2010 2011 2012 2013 2014 2015
Annual Solar Generation (GWh)
United States California NevadaData source: EIA

18
© 2017 Electric Power Research Institute, Inc. All rights reserved.
Future OpportunitiesFlexible DR beyond Fast
Flexible DR
DR 1.00
kw
Day-ahead
Schedule
Day-of Dispatch
Real-time
Dispatch
Operating Interval tNotification TimeframeAdvance
of Time t
DR 1.0 Fast
Flexible DR Examples
• Ramping Energy
• Balancing Energy
• Frequency Regulation

19
© 2017 Electric Power Research Institute, Inc. All rights reserved.
DR RoadmapAdvancing Stages of Capability
Source: EPRI Report 3002008225 (2016)
Stage Location Response Conditions
DR
1.0
Resource Adequacy System-wideAnnual System Peaks
(System-wide emergencies)
Forward Economics Generation or Energy NodeDay(s)-Ahead Economics
(DA Schedule)
Gri
d
Lo
ca
tio
nal D
R Distribution
ManagementDistribution Facility
Real-Time Conditions
(Overloads, Faults)
T&D Deferral Network NodeReal-time Conditions
(Congestion)
Ancillary Service
ReserveTransmission Facility
Contingency Event
(Major Outages)
DR
2.0
Balancing Resource Generation or Energy Node
Real-Time Conditions
(System Imbalance, Schedule
Deviations)
Cu
sto
mer
Lo
ca
tio
nal
DR Elastic Demand Customer Facility
Varies by Customer Choice
(e.g., Green Power, Local Power,
Premium Power, Free or Cheap Power)

20
© 2017 Electric Power Research Institute, Inc. All rights reserved.
Contact
Angela Chuang

21
© 2017 Electric Power Research Institute, Inc. All rights reserved.
Together…Shaping the Future of Electricity

“The 411 on DER’s”-What’s New, and What is
SCE’s Role?
Gary Barsley, Manager, Emerging Products
Southern California Edison
22

About SCE
CONFIDENTIAL 23

The Growth of DERs at SCE Customer Systems at SCE- Significant growth continues
• 220,000 projects for over 1700MWs of customer PV
• 360 projects for over 24 MWs of customer storage
• 150 projects for over 50 MWs of customer fuel cells
• 100,000 customer EVS
Utility Involvement- Significant activity
• EV Charge Ready Program – Phase 1 to install 1500 customer EV
chargers by end of 2018
• Multiple DER Market Solicitations (LCRs; PRP; etc)
• Major ongoing investments in “2-Way” smart grid
• Managing the impacts (and the infamous “Duck Curve”)
CONFIDENTIAL 24
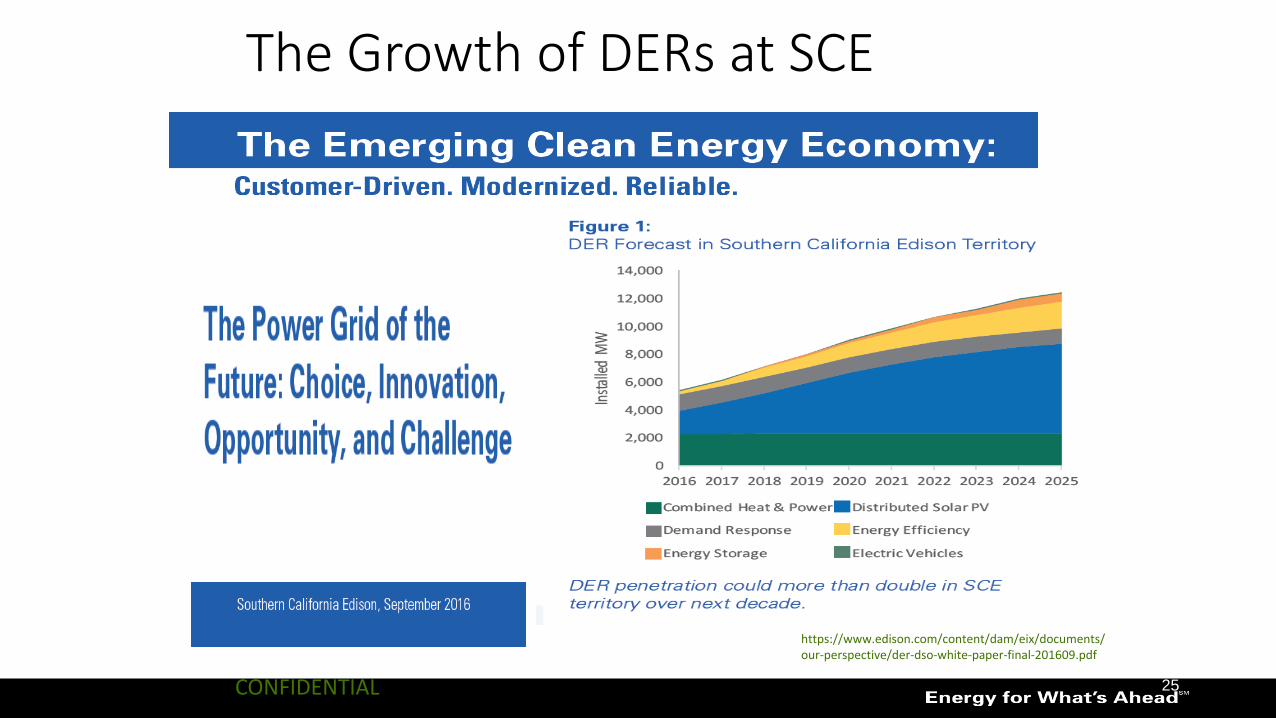
The Growth of DERs at SCE
CONFIDENTIAL 25
https://www.edison.com/content/dam/eix/documents/our-perspective/der-dso-white-paper-final-201609.pdf

What’s Driving DERs in our Area? Technology 411• Lower prices and more competitive markets• Added product capabilities• Potential utility grid benefits (locational; other support)
Policy / Regulatory 411• NEM and other Tariff Changes• CA ZNE aspirational goals• Potential new Utility Business Models• CA Statewide ET Model
Customer 411• Consumer-friendly access to new DERs• More customer choice • Added value to customers• DER Solicitations
CONFIDENTIAL 26
SCE Activities to Support DERsSCE is modernizing our grid to support this continued growth and integration of key clean technologies, collectively referred to as Distributed Energy Resources or DERs. These are:
• Distributed renewable gen resources: Solar power generated from rooftop solar PV panels or other customer energy resources.
• Energy efficiency: Reduced demand by improving the efficiency of homes and workplaces through improved technologies.
• Energy storage: Batteries that can be charged during off-peak times, and then discharged during peak times, to reduce peak energy needs.
• Electric vehicles: Plug-in cars and other innovative vehicles.
• Demand response: SCE’s Summer Advantage Incentive and similar incentive programs to reduce the peak use of electricity.
CONFIDENTIAL 27http://www.edison.com/home/innovation/grid-modernization-at-southern-california-edison.html

An Example of DER Activities at SCEZNE- Zero Net Energy Support
• Aggressive goals
• All new Res. construction to ZNE by 2020
• All new Comm. construction to ZNE by 2030
• 50% of existing Comm. buildings to ZNE by 2030
• More market participation & offerings
• Home builders, architects, equipment suppliers
• Utility assessment support
• Tech development, field deployment projects
CONFIDENTIAL 28

SCE’s ZNE Demonstration Projects*
*listing of relevant projects – not comprehensive
Project Name Sector Vintage Type Status
1 Low-Income Multifamily, Pomona Residential New ConstructionLow-Income Community In Progress
2 ZNE Schools Pilot (Prop 39) Commercial Retrofit Education In Progress
3 Low-Income Multifamily (LIMF), Lancaster Residential RetrofitLow-Income Community In Progress
4 ZNE Training Facility Retrofit, ETI in Commerce Commercial Retrofit Training Facility In Progress
5 Grid Integration of ZNE Communities, Fontana Residential New ConstructionProduction Community In Progress
6 ZNE Office, South Pasadena Commercial New Construction Office Development In Progress
7 ZNE New Home, Ontario Residential New Construction Production Home Complete
8 ZNE Recreation Facility Retrofit, UCSB Commercial Retrofit College Recreation Complete
9 Solar Decathlon Student Mentorship Residential New Construction Residential Education Complete
10 ABC Green Home 1.0, 2.0, 3.0 Residential New Construction Custom Homes In Progress
11 Irvine Smart Grid Demonstration (ISGD) Residential Retrofit Community Complete
12 Low-Income Retrofit, San Bernardino Residential Retrofit Low-Income Home Complete
13 Multifamily, Lake Forest Residential New Construction Multi Family In Progress
14 Multifamily, Ontario Residential Retrofit Low-Income In Progress

Grid Integration of ZNE Communities
Project Partners

Implemented ZNE Measures
Electric Heating and Water Heating
3.5 – 4.5 kW PV
All LED lighting
High Performance Envelope
Foam Insulation
Plus:• Plug load
controllers• Circuit-level
monitoring
Thermostats/HEMS

Designed to generate as much energy as it uses over the course of a year.
Net Zero Energy Homes
Thank You!
CONFIDENTIAL 33
Gary BarsleySouthern California Edison Emerging Products“[email protected]”

Distributed Generation Integration
Tony RafatiSan Diego Gas & Electric04/21/2017

Supply and Demand
Certain
vs
Uncertain
Predictable
vs
Unpredictable

The What?
Fast and dynamic swings in Distributed Generation output

The How?
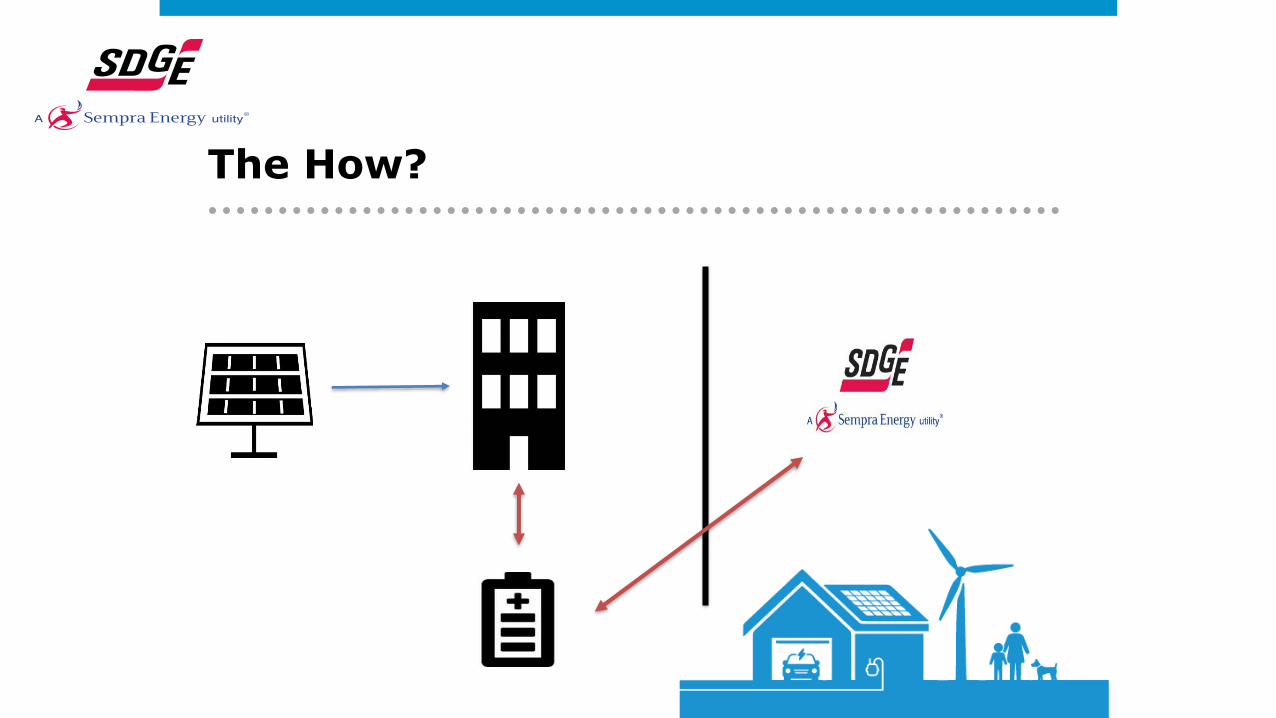
The How?

Regulatory 411
Beginning January 1st, 2018
Commercial CustomersA) agree not to use a prohibited resource to reduce load during a demand response event or B) in cases where the customer is required to use the prohibited resource for safety reasons, agree to a default adjustment.
Residential Customers:A new and separate provision shall be included in the tariff or contract for each program explaining the prohibition and requiring a residential customer to agree not to use a prohibited resource to reduce load during a demand response event.
D.16-09-056 issued on October 5, 2016
Questions

DISTRIBUTED ENERGY RESOURCESEMERGING TECHNOLOGY SUMMIT
APRIL 19-21, 2017
ONTARIO, CA
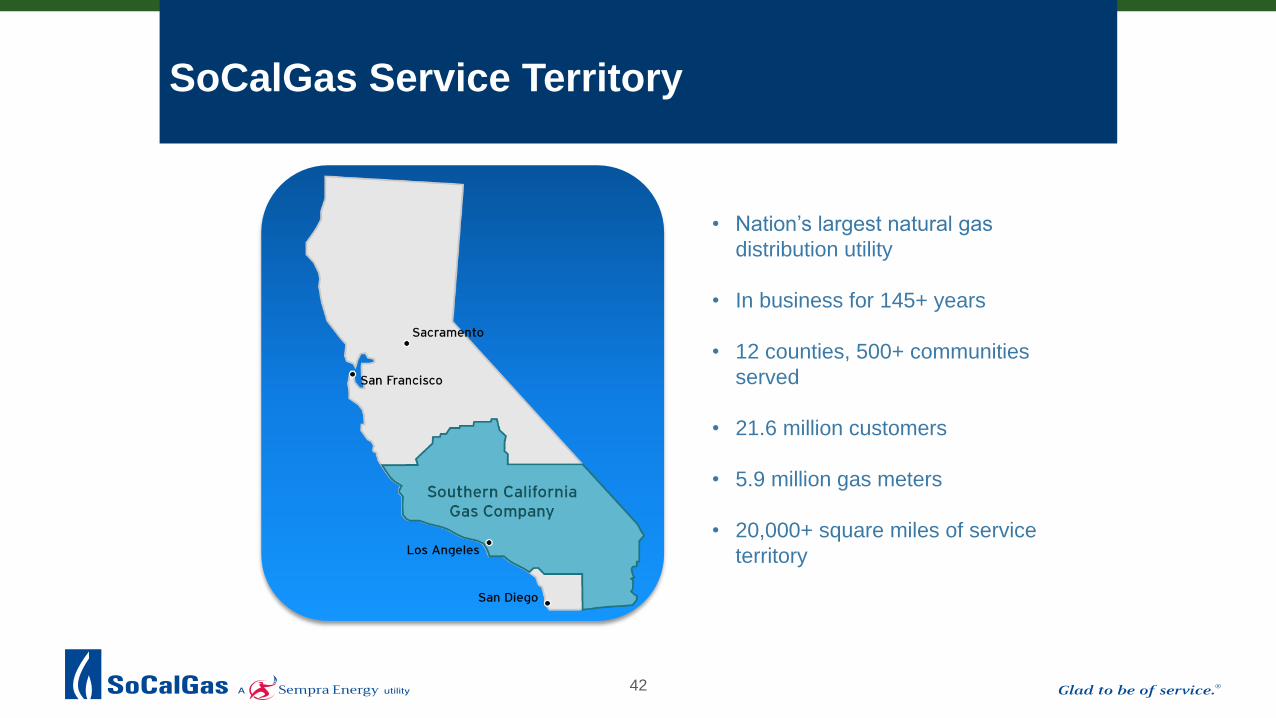
SoCalGas Service Territory
• Nation’s largest natural gas
distribution utility
• In business for 145+ years
• 12 counties, 500+ communities
served
• 21.6 million customers
• 5.9 million gas meters
• 20,000+ square miles of service
territory
42

The Natural Gas Advantage in DER
• Natural Gas Distributed Generation (DG) is a
DER with many benefits
• CHP efficiencies range 60-80%1
• Grid is 33% - 42% efficient1
• Lower environmental impacts
• Both GHG and Criteria Emissions
• Municipalities’ electric rates have increased
• California electric rates are 2nd highest in
contiguous United States2
1https://www.epa.gov/chp/chp-benefits2https://www.eia.gov/electricity/monthly/epm_table_grapher.cfm?t=epmt_5_6_a (10/14/16)
3

U.S NG-fueled DER - $30 billion market by 2030
• Decreasing technology costs,
favorable spark spreads, emission
mandates, and grid resiliency
concerns may create an incremental
market of $28 billion between 2015
and 2030 in small industrial and
commercial natural gas fueled DER
(CHP and fuel cells)
• Natural gas fueled DER developers
have traditionally targeted the public
sector leaving an opportunity to
capture growing private sector interest
44
Chart: “Distributed Generation Deployment Forecast” Navigant Consulting,
September 2014
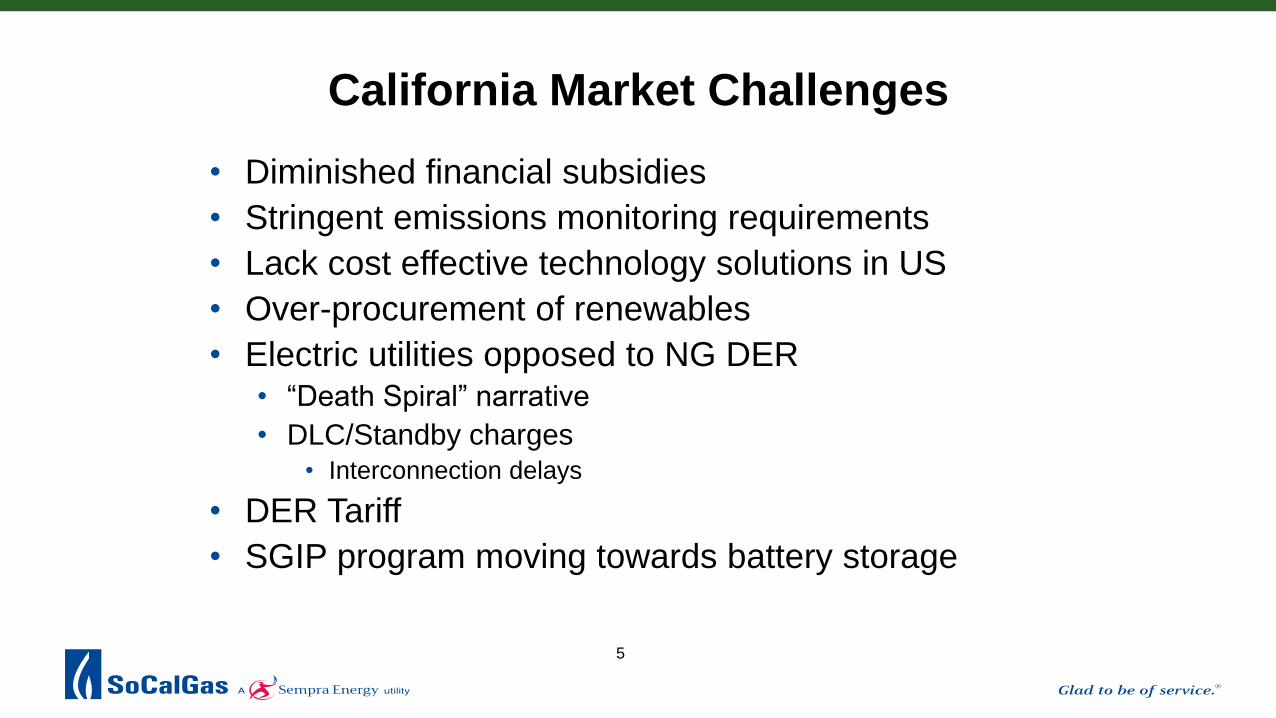
California Market Challenges
• Diminished financial subsidies
• Stringent emissions monitoring requirements
• Lack cost effective technology solutions in US
• Over-procurement of renewables
• Electric utilities opposed to NG DER• “Death Spiral” narrative
• DLC/Standby charges• Interconnection delays
• DER Tariff
• SGIP program moving towards battery storage
5

Regulatory / Legislative Challenges
• DER proceedings focused on batteries and solar
• CHP not seen as energy efficiency measure
• Source versus Site view
• Natural gas lumped in with other fossil fuels
• Natural gas is not considered a GHG reducing
solution
• Renewable natural gas not considered in
equations
6

Future of NG DER Technology
» CHP and Fuel Cell applications
▪ Smaller, more efficient, cheaper
▪ Cleaner
» Tri-Gen Technology
▪ Clean production of electricity, water and hydrogen
▪ Biogas and/or natural gas
▪ Efficiency of electrical generation for on-site use or grid support
▪ Water for on-site use
▪ Hydrogen for transportation and/or other energy use
» Power To Gas Storage – Battery?
▪ Enables production of renewables
▪ Encourages clean hydrogen
▪ Captures carbon
7

Future of NG DER Technology
» Renewable Gas
▪ Used with DER can produce a negative carbon footprint
▪ Unless we want to stop eating meat….Future!
» Community-Based CHP
▪ “Micro-Grid” type system
▪ Protection from grid issues
» What have we not developed yet?
▪ Technology neutrality is critical
▪ Give smart people target (financial, environmental and practical)
and then get out of the way!
7

Contact Info:
Ken Chawkins
Business/Policy Manager
Southern California Gas Company
Ph: (213) 244-3484
E-Mail: [email protected]
8