Embed Size (px)
Citation preview

Behavioral Sciences and the Law
Behav. Sci. Law 21: 713–736 (2003)
Published online in Wiley InterScience (www.interscience.wiley.com). DOI: 10.1002/bsl.568
The 4 Year Stability ofPsychopathic Traits inNon-Referred Youth
Paul J. Frick, Ph.D.,* Eva R. Kimonis, M.S.,Danielle M. Dandreaux, M.S., and Jamie M.Farell, M.S.
One significant limitation in research extending the
construct of psychopathy to youth has been the absence of
longitudinal studies testing the stability of psychopathic
traits prior to adulthood. To begin to address this limita-
tion, the current study estimated the stability of psycho-
pathic traits over a 4 year period in a sample of non-referred
children in the third, fourth, sixth, and seventh grades at
the first assessment. For parent ratings of psychopathic
traits, stability estimates using intra-class correlation coef-
ficients ranged from 0.80 to 0.88 across 2–4 years, with a
stability estimate of 0.93 across all four assessments. There
were also distinct trends in the patterns of stability found in
the sample. Specifically, children rated as being initially
high on these traits were more likely to be rated lower at
later assessments than was the case for children rated
initially low on these traits. Finally, the child’s level of
conduct problems, the socioeconomic status of the child’s
family, and the quality of parenting the child received were
the most consistent predictors of stability of psychopathic
traits. Copyright # 2003 John Wiley & Sons, Ltd.
Research extending the construct of psychopathy to youth has been quite promising
in a number of respects. For example, the presence of psychopathic features has been
proven to designate a subgroup of antisocial youth with more severe and more
aggressive patterns of antisocial behavior in forensic (Caputo, Frick, & Brodsky,
1999; Kruh, Frick, & Clements, in press), mental health (Christian, Frick, Hill, Tyler,
& Frazer, 1997), and community (Frick, Cornell, Barry, Bodin, & Dane, 2003;
Lynam, 1997) samples. Further, children with conduct problems who also show
psychopathic traits show a number of distinct characteristics compared to other
antisocial youth, mirroring research on antisocial adults with psychopathy
(Hare, 1998; Hart & Hare, 1997). For example, antisocial youth who also show
Copyright # 2003 John Wiley & Sons, Ltd.
*Correspondence to: Paul J. Frick, Department of Psychology, University of New Orleans, 2001 Geologyand Psychology Building, New Orleans, LA 70148, U.S.A. E-mail: [email protected] work was supported by grant MH55654 from the National Institute of Mental Health made to thefirst author.
Contract/grant sponsor: National Institute of Mental Health; contract/grant number: MH55654.
psychopathic traits demonstrate a stronger preference for novel, exciting, and dan-
gerous activities (Frick et al., 2003b; Frick, Lilienfeld, Ellis, Loney, & Silverthorn,
1999), are less sensitive to cues of punishment, especially when a reward-oriented
response set is primed (Barry et al., 2000; Fisher & Blair, 1998; Frick et al., 2003b)
and are less reactive to threatening and emotionally distressing stimuli (Blair, 1999;
Frick et al., 2003b; Loney, Frick, Clements, Ellis, & Kerlin, 2003).
Unfortunately, the research extending the construct of psychopathy to youth has
largely been cross-sectional in nature. As a result, there is limited evidence for the
predictive utility of psychopathic features prior to adulthood (Edens, Skeem, Cruise,
& Cauffman, 2001). There are several notable exceptions in which psychopathic
features have predicted subsequent delinquency, aggression, number of violent
offenses, and a shorter length of time to violent reoffending in institutionalized
antisocial youth (Brandt, Kennedy, Patrick, & Curtin, 1997; Forth, Hart, & Hare,
1990; Toupin, Mercier, Dery, Cote, & Hodgins, 1995). In one of the only studies to
test the predictive utility of psychopathic features in a non-referred sample of children,
Frick, Cornell, Barry, Bodin, and Dane (2003) reported that children with conduct
problems and psychopathic features showed more severe and more instrumental
aggression and had higher rates of self-reported delinquent acts one year later
compared with children with conduct problems but without psychopathic traits.
These results suggest that psychopathic features may designate an especially
severe, aggressive, and chronic type of disturbance in antisocial youth. However,
there are a number of limitations in this body of research. First, most studies have
relied on clinic-referred or forensic samples (except Frick et al., 2003a; Lynam,
1997) and focused on the adolescent age group (except Christian et al., 1997; Frick
et al., 2003a). Second, even the studies that have used prospective designs have had
limited follow-up periods, typically with follow-up periods of one (Frick et al.,
2003a) to two (Brandt et al., 1997; Forth et al., 1990) years. Third, while these few
prospective studies have tested the utility of psychopathic traits in youth for
predicting later antisocial and delinquent behavior, these studies have not tested
the stability of the actual traits associated with psychopathy.
While there is still much debate as to how best to conceptualize the core
dimensions of psychopathy (Hare, 2003), several recent factor analyses in adults
(Cooke & Michie, 2001) and children (Frick, Bodin, & Barry, 2000) have isolated
three core dimensions. One dimension focuses on a callous and unemotional
interpersonal style, the second dimension focuses on an inflated and egocentric
view of oneself, and the third focuses on an impulsive and antisocial lifestyle. A
recent critique of the literature extending the construct of psychopathy to youth
noted that some level of behavior in each of these dimensions is normative in youth,
particularly in adolescence (Seagrave & Grisso, 2002). As a result, the authors
suggested that, until research demonstrates that these traits designate a stable
dimension of personality in youth, comparable to the stability found in adult
samples, definitions of psychopathy run the risk of applying a potentially stigmatiz-
ing label to some youth who may only be showing a transient pattern of behavior
related to their developmental stage.
A number of important issues raised in this critique have been debated (see
Frick, 2002, Hart, Watt, & Vincent, 2002, & Lynam, 2002, for a more extended
discussion of these issues). One issue relates to the assumption that the stability of
psychopathic traits has been firmly established in adults. This assumption is largely
714 P. J. Frick et al.
Copyright # 2003 John Wiley & Sons, Ltd. Behav. Sci. Law 21: 713–736 (2003)
based on research showing that incarcerated adults with psychopathic traits often
do not respond to typical interventions (see, e.g., Ogloff, Wong, & Greenwood,
1990) and that these adults are at high risk for recidivism once released from prison
(see, e.g., Gendreau, Goggin, & Smith, 2002; Hemphill, Hare, & Wong, 1998;
Walters, 2003). However, recent reviews of the literature on the treatment of
psychopathy have called into question the extreme pessimism surrounding treat-
ment (Salekin, 2002; Skeem, Monahan, & Mulvey, 2003). More importantly, this
body of research does not provide a direct estimate of the stability of the core traits
associated with psychopathy in adults. One of the reasons for the paucity of
information on the stability of psychopathic traits is that the most widely used
method for assessing these traits relies heavily on historical information (Hare,
2003), making it difficult to assess changes in these traits over time. Therefore, with
three notable exceptions, the actual stability of these traits across adulthood has not
been tested.
First, Harpur and Hare (1994) compared the prevalence of diagnoses of
psychopathy and the mean level of psychopathic traits in six different age groups
of adult offenders, ranging in age from 16 to 70. These authors reported that overall
rates of psychopathy declined with age, especially after age 45. Also, this decline
tended to be stronger for the impulsive and antisocial lifestyle dimension of
psychopathy, whereas the average level of the interpersonal and affective traits of
psychopathy remained fairly stable across age groups. Importantly, this study was a
cross-sectional study showing cohort changes in the level of psychopathy and, thus,
did not test the stability of psychopathic traits directly. Second, Schroeder,
Schroeder, and Hare (1983) did directly assess stability in a sample of incarcerated
adults. These authors reported a stability coefficient of 0.89 for psychopathic traits
over a 10 months period. Although this does indicate substantial stability, the
follow-up period was rather limited. Third, in one of the best tests of the stability of
psychopathic traits in adults, Rutherford and colleagues (Rutherford, Cacciola,
Alterman, McKay, & Cook, 1999) reported 2 year stability estimates obtained in a
sample of 200 male and 25 female patients receiving methadone treatment for drug
abuse. The 2 year stability estimates reported in this study were 0.60 for men and
0.65 for women.
Taken together, there is not a great deal of evidence documenting the level of
stability of psychopathic traits in adult samples. However, even if one assumes that
these traits are relatively stable in adults, the contention that they should be
comparably stable in youth is still questionable. While there is some continuity in
personality traits across childhood (Buss, 1995), personality traits are generally
found to be less stable in children than in adults (see, e.g., McCrae et al., 2002;
Roberts & DelVecchio, 2000). This lower stability is not surprising, given the
developmental changes that are occurring in children that help to shape their
eventual personality. In fact, one of the primary motivations for extending the
construct of psychopathy to youth is to hopefully identify these traits when they are
more malleable (i.e. less stable) and amenable to treatment (Frick, 1998, 2001).
Thus, one would expect, and actually hope, that psychopathic traits are less stable in
youth and that factors could be identified that predict changes in these traits.
However, the level of stability could be so low that considering it a ‘‘personality’’
construct in children, which assumes at least a modest level of temporal stability, is
questionable (Buss, 1995).
Stability of childhood psychopathy 715
Copyright # 2003 John Wiley & Sons, Ltd. Behav. Sci. Law 21: 713–736 (2003)
Based on these considerations, the primary purpose of the study was to determine
the stability of psychopathic traits across late childhood and into adolescence.
However, a second goal of the study was to begin to test variables that might
influence the stability of these traits. It was difficult to make hypotheses on potential
predictors of stability, given the absence of research in the area. However, several
variables were tested as potential predictors of stability based on the following
theoretical considerations.
First, we tested whether psychopathic traits are more stable in the context of
significant antisocial behavior. As mentioned previously, most of the available
research on psychopathy in both adults and youth has focused on forensic or
clinic-referred samples. As a result, much of the available research only pertains to
psychopathic individuals who show high levels of antisocial and criminal behavior.
However, most theories of psychopathy recognize that psychopathic traits can be
present in individuals who do not show significant antisocial behavior (Cleckley,
1976; Hare, 1998; Lilienfeld & Andrews, 1996). In the current study, we test
whether the stability of these traits is influenced by the level of one’s antisocial
behavior. Second, as noted above, youth with psychopathic traits show character-
istics associated with a temperament that has been labeled as low fearfulness or low
behavioral inhibition (Frick & Morris, in press), such as seeking out novel and
dangerous activities and showing a reward dominant cognitive style. These char-
acteristics have been critical to many theoretical models to explain the potential
causes of psychopathy (Hare, 1998; Lykken, 1995; Patrick, 1994). However, it is
also possible that such measures of behavioral inhibition predict the stability of these
traits, with the most temperamentally vulnerable individuals showing the most
stable manifestations of psychopathy. Third, while psychopathy and antisocial
behavior are not interchangeable constructs, they are clearly related. Therefore,
some of the factors within the child (e.g. low intelligence) and factors within his or
her psychosocial context (e.g. low socioeconomic status, dysfunctional parenting
practices) that have been found to predict a more stable pattern of antisocial
behavior in youth (see Frick & Loney, 1999, for a review) may also be related to
the stability of the psychopathic traits. The potential importance of parenting factors
is particularly notable, given evidence that parenting has a strong influence on the
development of guilt, empathy, and other aspects of conscience in children (Frick &
Morris, in press; Hoffman, 1994; Kochanska, 1995).
METHOD
Participants
To address the primary study questions, a community sample of youth was
recruited. However, one problem with using a community sample of youth is the
need to ensure that there are significant numbers of participants who score high on
measures of psychopathic traits. While there are no normative studies estimating the
prevalence of these traits, only about one-quarter of adult prisoners (Hart & Hare,
1997) and about one-third of clinic-referred children (Christian et al., 1997) show
high levels of these traits. Therefore, rates in a non-referred sample are likely to be
quite low. Further, in order to test the potential effects of antisocial behavior on the
716 P. J. Frick et al.
Copyright # 2003 John Wiley & Sons, Ltd. Behav. Sci. Law 21: 713–736 (2003)
stability of these traits, there had to be enough participants high on psychopathic
traits with and without significant antisocial behavior to make comparisons. As a
result, a two-step stratified random sampling procedure was employed to over-
sample youth high on psychopathic traits and to ensure sufficient numbers of these
youth with and without conduct problems.
In the first step of subject recruitment, 4,000 parents of children in the third,
fourth, sixth, and seventh grades of two school systems in a moderate sized city in
the southeastern United States received announcements about the study. The two
school systems were chosen because one served the immediate urban area and the
second served the surrounding region that was predominantly suburban and rural.
Those parents who agreed to have their child participate in the study completed
consent forms and a screening questionnaire (Gadow & Sprafkin, 1995) that
assessed for the presence of DSM-IV symptoms of Oppositional Defiant Disorder
(ODD) and Conduct Disorder (CD; American Psychiatric Association, 2000).
Parents also completed a questionnaire that assessed for each of three core
dimensions of psychopathy (Frick & Hare, 2001). Following receipt of the parents’
consent forms and rating scales, the child’s teacher completed analogous ques-
tionnaires. For each child who participated in this initial phase of screening, his or
her teacher received $10 for educational supplies for the classroom. This first phase
yielded a sample of 1136 children with a mean age of 10.65 (SD¼ 1.60) that was
53% female, 77% Caucasian, 19% African-American, and 21% receiving special
education services, all of which closely matched the overall demographics of the two
school systems. The range of Duncan’s Socioeconomic Index (SEI; Hauser &
Featherman, 1977) was 0–92.3, with a mean of 47.20 (SD¼ 23.80).
In the second phase of recruitment, the sample of 1136 children was divided into
four groups based on combined parent and teacher ratings of conduct problem
symptoms and the callous–unemotional (CU) dimension of psychopathy (Frick
et al., 2000). The CU dimension was chosen for sample recruitment because it is the
dimension of psychopathy that is most independent from antisocial behavior (Frick,
O’Brien, Wootton, & McBurnett, 1994; Frick et al., 2000). This allowed for the
recruitment of a group of children high on psychopathic traits but low on conduct
problems. Further, elevated rates of CU traits and conduct problems were defined
as being above the upper quartile for the community sample, whereas normative
levels were defined as being at or below the mean of the sample. This ensured
divergence between groups defined as being high and low on these dimensions.
The first group was below the mean on both dimensions (n¼ 225), a second
group was at or above the upper quartile on the conduct problem measure but below
the mean on the measure of CU traits (n¼ 66), one group was at or above the upper
quartile on the measure of CU traits but below the mean on the measure of conduct
problems (n¼ 77), and the last group was above the upper quartile on both
dimensions (n¼ 128). These four groups were then stratified on gender, ethnicity,
and socioeconomic status. Next, 25 children in each of the four groups were
recruited to participate in the longitudinal portion of the study, ensuring that about
half of each group came from the younger and older cohorts. These children were
selected through a stratified random sampling procedure to ensure that the four
groups matched the group from which they were sampled on the three stratification
variables. Errors in data collection resulted in the loss of two participants from the
group high on conduct problems but low on the measure of CU traits. From this
Stability of childhood psychopathy 717
Copyright # 2003 John Wiley & Sons, Ltd. Behav. Sci. Law 21: 713–736 (2003)
recruitment procedure, participants were 98 children that fell into the four groups
described above. Twenty-one per cent of the children were African-American (the
only ethnic group represented other than Caucasian); 47% were girls; the average
Duncan’s SEI was 46.67 (SD¼ 19.96). Children in the sample had an average
Kaufman Brief Intelligence (K-BIT; Kaufman & Kaufman, 1990) composite score
of 104.83 (SD¼ 12.88).
This sample of 98 children was invited to participate in yearly assessments. A
summary of the measures and sources of information is provided in Table 1. The
child’s score on the measure of psychopathy collected during the community
screening (time 1) was used as the initial level of these traits. At the first follow-
up (time 2), a comprehensive assessment was conducted and it included all of the
potential predictors of stability used in analyses. The last three waves of data
collection (times 3, 4, and 5) involved repeated ratings of psychopathic traits.
Measures: Repeated Assessment of Psychopathic Traits
Antisocial Process Screening Device (APSD; Frick & Hare, 2001)
The APSD, formerly known as the Psychopathy Screening Device, is a 20-item
behavior rating scale that was completed by each child’s parent and teacher at the first
assessment and then by each child and his or her parent at the last three follow-up
assessments (see Table 1). The APSD was designed to measure the same traits as
those assessed by the Psychopathy Checklist—Revised (PCL-R; Hare, 2003).
However, on the APSD, these traits are placed in a rating scale format and rated as
0 (Not at all true), 1 (Sometimes true), or 2 (Definitely true). Also, some items from
the PCL-R were deleted because they were inappropriate for children (e.g. parasitic
lifestyle) or the wording of items was changed to be more developmentally appro-
priate (Frick et al., 1994; Frick & Hare, 2001). Also, at the initial assessment, the
APSD item related to criminal behavior was not included at the request of the
participating school systems. Factor analyses conducted on the items collected in the
full community screening sample of 1136 children, and replicated in a sample of
clinic-referred children, revealed three dimensions on the APSD: a seven-item
Narcissism dimension (‘‘thinks he/she is more important than others’’), a five-item
Impulsivity dimension (e.g. ‘‘acts without thinking’’), and a six-item Callous–
Unemotional dimension (‘‘is concerned about the feelings of others’’—reverse
scored) (Frick et al., 2000). One item, ‘‘lies easily and skillfully’’ did not show unique
or consistent loadings and was not included in the calculation of subscale scores.
The choice of informants for the APSD at each stage of data collection was based
on developmental considerations and findings from past research. Parents and
teachers were included as informants at the initial assessment because the majority
of the sample was pre-adolescent at this time and parents and teachers seem to be
optimal informants for this age group in the assessment of many areas of psycho-
logical adjustment (Kamphaus & Frick, 2002). Further, there is evidence for the
construct validity of these informants on the APSD for pre-adolescent samples
(Frick & Hare, 2001). However, at later follow-up assessments, much of the sample
had transitioned into adolescence, when the validity of teacher report decreases and
the validity of self-report increases in the assessment of most areas of psychological
718 P. J. Frick et al.
Copyright # 2003 John Wiley & Sons, Ltd. Behav. Sci. Law 21: 713–736 (2003)

Table
1.
Su
mm
ary
of
mea
sure
sacr
oss
waves
of
data
collec
tion
Con
stru
ctM
easu
reM
ethod
/in
form
an
ts
Tim
e1:
com
munity
wid
esc
reen
ing
Psy
chophath
ictr
ait
sA
nti
soci
al
Pro
cess
Scr
een
ing
Dev
ice
(AP
SD
:F
rick
&H
are
,2001)
Pare
nt
an
dT
each
erT
ime
2:
com
pre
hen
sive
ass
essm
ent
ofpre
dic
tors
ofst
abi
lity
Dem
ogra
ph
icvari
ab
les
Age/
eth
nic
ity/g
end
erP
are
nt
Du
nca
n’s
Soci
oec
on
om
icIn
dex
(Hau
ser
&F
eath
erm
an
,1977)
Pare
nt
Kau
fman
Bri
efIn
tellig
ence
Tes
t(K
-BIT
;K
au
fman
&K
au
fman
,1990)
Sta
nd
ard
ized
test
Beh
avio
ral
inh
ibit
ion
Com
pu
teri
zed
Rew
ard
Dom
inan
ceT
ask
(O’B
rien
&F
rick
,1996)
Lab
ora
tory
task
Ch
ild
ren
’sS
ensa
tion
See
kin
gS
cale
(SS
SC
;R
uss
oet
al.,
1993)
You
tha)
Thri
llan
dA
dven
ture
See
kin
gS
ubsc
ale
Con
du
ctpro
ble
ms/
an
tiso
cial
beh
avio
rD
iagn
ost
icIn
terv
iew
Sch
edu
lefo
rC
hild
ren
—IV
Ed
itio
n(S
haff
er,
Fis
her
,L
uca
s,D
ulc
an
,&
Sch
wab
-Sto
ne,
2000)
Pare
nt
an
dyou
tha)
Opposi
tion
al
Defi
an
tan
dC
on
du
ctD
isord
erS
ym
pto
ms
Sel
f-R
eport
of
Del
inq
uen
cysc
ale
(SR
D;
Ellio
tt&
Aget
on
,1980)
You
thP
are
nti
ng
pra
ctic
esA
lab
am
aP
are
nti
ng
Qu
esti
on
nair
e(S
hel
ton
,F
rick
,&
Woott
on
,1996)
Pare
nt
an
dyou
tha)
Posi
tive
Pare
nti
ng¼
Pare
nta
lIn
volv
emen
tan
dP
osi
tive
Rei
nfo
rcem
ent
b)
Neg
ati
ve
Pare
nti
ng¼
Poor
Mon
itori
ng/S
uper
vis
ion
,In
con
sist
ent
Dis
cip
lin
e,H
ars
hD
isci
plin
eT
imes
3–5:
follo
w-u
pass
essm
ents
Psy
chopath
ictr
ait
sA
nti
soci
al
Pro
cess
Scr
een
ing
Dev
ice
(AP
SD
:F
rick
&H
are
,2001)
Pare
nt
an
dyou
th
Stability of childhood psychopathy 719
Copyright # 2003 John Wiley & Sons, Ltd. Behav. Sci. Law 21: 713–736 (2003)

adjustment (Kamphaus & Frick, 2002). Again, a number of studies have supported
the construct validity of self-report on the APSD for adolescents (Loney et al., 2003;
Pardini, Lochman, & Frick, 2003; Silverthorn, Frick, & Reynolds, 2001). The
parent report was also collected at the follow-up assessments to maintain one
informant that was consistent across assessments.
The distributions, internal consistency estimates, and cross-informant correlations
for the APSD total score and subscales at each wave of data collection are reported in
Table 2. It is of note that the internal consistency estimates were generally moderate
to high for the parent and teacher scales. However, the internal consistency estimates
for the self-report scales were lower, especially for the individual subscales. The cross-
informant correlations, using the single measure intraclass correlation coefficient
(absolute agreement definition) ranged from 0.27 (Narcissism) to 0.39 (Impulsivity)
between parents and teachers and from 0.29 (time 4 Narcissism) to 0.57 (time 4
Impulsivity) between parents and children (all p< 0.01).
Measures: Predictors of Stability (Antisocial Behavior)
The NIMH Diagnostic Interview Schedule for Children—Version 4
(DISC-IV; Shaffer et al., 2000)
The parent and child report on the DISC-IV was used to assess for all symptoms
of ODD and CD at the time 2 comprehensive assessment. The DISC-IV is a
highly structured interview designed to be administered by lay interviewers with
Table 2. Descriptive statistics for dimensions of psychopathy across waves of data collection
Parent report Teacher (time 1)/youthreport (time 3, 4, 5)
Mean Std. Alpha Mean Std. Alpha Cross-informantAPSD scale ICC
Time 1 (n¼ 98)Total 10.48 6.74 0.89 11.14 8.51 0.92 0.36***Callous–Unemotional 2.70 2.50 0.76 3.66 2.97 0.82 0.34***Narcissism 3.23 2.98 0.82 3.28 3.57 0.90 0.27**Impulsivity 4.03 2.06 0.72 3.66 2.83 0.83 0.39***Time 3 (n¼ 92)Total 10.37 6.32 0.88 10.71 5.14 0.81 0.54***Callous–Unemotional 2.41 2.05 0.74 2.72 1.66 0.50 0.50***Narcissism 3.22 2.87 0.82 3.15 2.04 0.63 0.31**Impulsivity 4.08 2.10 0.73 4.13 2.01 0.68 0.54***Time 4 (n¼ 86)Total 10.37 6.50 0.89 11.54 5.24 0.80 0.54***Callous–Unemotional 2.43 2.04 0.75 3.05 1.87 0.60 0.52***Narcissism 3.43 2.69 0.80 3.53 2.10 0.63 0.29**Impulsivity 4.10 2.15 0.75 4.13 2.01 0.68 0.57***Time 5 (n¼ 79)Total 10.22 5.68 0.86 11.51 4.78 0.77 0.47***Callous–Unemotional 2.69 1.98 0.72 3.01 1.81 0.52 0.34**Narcissism 3.09 2.51 0.78 3.52 1.94 0.55 0.32**Impulsivity 3.88 1.98 0.63 4.10 1.79 0.60 0.39***
APSD, Antisocial Process Screening Device (Frick & Hare, 2001); ICC, single measure intraclasscorrelation coefficient (absolute agreement definition). *p<0.05; **p<0.01; ***p<0.001.
720 P. J. Frick et al.
Copyright # 2003 John Wiley & Sons, Ltd. Behav. Sci. Law 21: 713–736 (2003)
appropriate training. It has proven to be highly reliable on both the symptom and
diagnostic level (Lahey et al., 1994). Interviewers were a licensed psychologist or
advanced graduate students in psychology who were trained in standardized
administration procedures for the DISC. Symptoms were considered present if
endorsed by either the parent or child. The correlations between parent and child
report of ODD/CD symptoms was 0.25 ( p< 0.05) and the coefficient alpha for the
combined report of OCC/CD symptoms was 0.87 in the current sample.
Self-Report of Delinquency Scale (SRD; Elliott & Ageton, 1980)
The SRD assesses the child’s self-report of 36 illegal juvenile acts. It was developed
from a list of all offenses reported in the Uniform Crime Report with a juvenile base
rate of greater than 1% (Elliott & Huizinga, 1984). Due to the relatively young age of
the sample at the time 2 comprehensive assessment, the three items related to sexual
behavior were omitted from this scale. Consistent with past uses of the scale (see,
e.g., Krueger et al., 1994), a composite measure was created summing the number
of delinquent acts committed (with a possible range of 0–33). This composite had a
coefficient alpha of 0.74.
Measures: Predictors of Stability (Behavioral Inhibition)
Reward Dominance Task (O’Brien & Frick, 1996)
Participants’ sensitivity to punishment cues once a reward-oriented response set is
established was assessed using the paradigm employed in previous research with
adults (e.g., Newman, Patterson, & Kosson, 1987) and children (Daugherty &
Quay, 1991). A more complete description of the specific computer task can be
found elsewhere (O’Brien, Frick, & Lyman, 1994; O’Brien & Frick, 1996). The task
consists of four games and participants were allowed to earn prizes based on their
scores across all four games. In each game, a stimulus (e.g. a fisherman) appeared on
the screen and the child chose whether or not to press a key to view the other side of
the stimulus (e.g. reel in the fishing pole) or to press a key to stop the game. For each
game, there was a successful outcome (e.g. a fish) or an unsuccessful outcome (e.g.
no fish) on the other side of the stimulus. Each child began with 50 points, and a
point was either added or taken away, depending on the outcome of each trial. The
proportion of successful outcomes across each successive ten trials decreased from
90 to 0% over 100 trials. The total number of trials played was recorded and was
used as a dependent variable in the analyses because this serves as an index of
continued playing despite an increased ratio of punished (loss of point) to rewarded
(gain of point) trials. Across the four games, a forced 5 second pause between each
trial and the presence of a visual tally of the number of points won were varied in a
counterbalanced fashion. As in some previous studies, the forced pause appeared to
interrupt the reward dominant response set (Newman et al., 1987; O’Brien et al.,
1994). Therefore, only the two conditions in which there was no forced pause prior
to being allowed to play the next trial were used in analyses. As in previous uses of
this computer task (O’Brien et al., 1994; O’Brien & Frick, 1996), no effect of order
or order by condition interactions were found on the task.
Stability of childhood psychopathy 721
Copyright # 2003 John Wiley & Sons, Ltd. Behav. Sci. Law 21: 713–736 (2003)
Thrill and Adventure Seeking Subscale of the Sensation Seeking Scale for Children(SSS-C; Russo et al., 1993)
The SSS-C was used to measure participants’ preferences for novel and dangerous
activities. The scale was modified for use in the study. As in the original version of
the scale, participants chose between a pair of statements to indicate which was
more true of him/her. One statement (e.g. ‘‘I enjoy the feeling of riding my bike fast
down a big hill’’) describes sensation-seeking behaviors, whereas the other state-
ment describes a preference against sensation seeking behaviors (e.g. ‘‘Riding my
bike fast down a hill is scary for me’’). However, to increase the variance in scores,
the modified version also asked each child to rate how well the chosen behavior
described him or her by selecting either ‘‘sort of true for me’’ or ‘‘really true for me.’’
This modification created a four point scale for each item. The modified version of
SSS-C led to an internally consistent TAS subscale (alpha¼ 0.84). Although the full
SSS-C was administered, only the TAS scale was used in analyses. Its content
assesses fearlessness, the aspect of sensation seeking most specifically linked to
behavioral inhibition (Kagan & Snidman, 1991). Also, it is the scale from the SSS-C
that has been most strongly related to psychopathic traits in children (Frick et al.,
1994; Frick et al., 1999b).
Measures: Predictors of Stability (Parenting)
Alabama Parenting Questionnaire (APQ; Shelton et al., 1996)
The APQ includes 42 items assessing five parenting constructs that have been
consistently related to antisocial and delinquent behavior in past research (Shelton
et al., 1996). These constructs are parental involvement (10 items); parental use of
positive reinforcement (6 items); poor parental monitoring and supervision
(10 items), parental use of inconsistent discipline (6 items), and parental discipline
(10 items; 3 pertaining to corporal and 7 to non-corporal methods of discipline).
There are four assessment formats for the APQ. There is a global report in which
parenting behaviors are rated by the parents and children as to their typical
frequency on a five-point scale from 1 (‘‘Never’’) to 5 (‘‘Always’’). In the telephone
format, parents and children are called four times at least three days apart and asked
how often in the past three days each parenting behavior had taken place. The score
for each item is the average frequency across the four interviews.
Past research has indicated that the parenting constructs can be combined into
two composites: a positive parenting composite involving the parental involvement
and use of positive reinforcement scales and a negative composite involving the poor
monitoring and supervision, inconsistent discipline, and corporal punishment scales
(Shelton et al., 1996; Frick, Christian, Wootton, 1999a). To form these composites,
subscales were converted to z-scores and summed within each of the assessment
formats. To reduce the number of variables further, the composites of the global
report and interview formats were also combined for each informant. For the parent
report, the correlation between the global and interview formats for the positive
parenting composite was 0.44 ( p< 0.001) and that for the negative parenting
722 P. J. Frick et al.
Copyright # 2003 John Wiley & Sons, Ltd. Behav. Sci. Law 21: 713–736 (2003)

composite was 0.37 ( p< 0.001). For the child report, the correlations were 0.44
( p< 0.001) and 0.49 ( p< 0.001), respectively. However, the decision was made a
priori not to collapse across informants. This decision was based on past research
suggesting that the child report of positive parenting and the parent report of
negative parenting may be most strongly associated with problem behavior in late
childhood and early adolescence (Frick et al., 1999a). In the current sample, the
correlations between the child and parent reported composites were 0.44
( p< 0.001) and 0.26 ( p< 0.05) for the positive and negative parenting composites,
respectively.
Procedures
Using the stratified sampling procedure described above, parents and children who
participated in the community-wide screening were contacted and invited to
participate in a longitudinal study of children’s personality that included the
measures used in the current study (see Frick et al., 2003b, for a more complete
description of the full assessment procedures). Those who were contacted but
refused to participate were replaced by someone in the same group with similar
demographic characteristics until 25 participants had been recruited for each group.
Two participants were lost due to errors in data collection, and both came from the
high conduct problem and low CU traits group.
For the time 2 comprehensive assessment, participants were tested in two
sessions with the procedures standardized for all participants. The first session
started with an informed consent procedure conducted with the parent and child
together. They were then separated and parents were administered a semi-
structured interview to obtain demographic information, followed by the DISC-
IV interview and the APQ ratings. In a separate room, the children were adminis-
tered the K-BIT, followed by the youth version of the DISC-IV. At a second testing
session, the child completed all of the self-report questionnaires and the Reward
Dominance Task. Within one month of this assessment, all four APQ telephone
interviews were completed. Parents received $65.00 for their participation in the
comprehensive assessment procedures and the youth received a $15.00 gift certi-
ficate to either a local music store or book store. The remaining three follow-up
assessments took place as close to the 1 year anniversary of the initial assessment as
possible. To reduce attrition, the APSD measures were mailed to participants with a
self-addressed stamped envelope as part of the follow-up assessments. Parents and
youth were provided with separate return envelopes to increase the confidentiality of
each person’s responses. Parents and youth were also compensated for participation
in the follow-up assessments.
RESULTS
Attrition
Ninety-two per cent of the 98 participants at the time 2 comprehensive assessment
completed at least two of the follow-up assessments and 73% completed all
three. The average length of time between the initial screening assessment and first
Stability of childhood psychopathy 723
Copyright # 2003 John Wiley & Sons, Ltd. Behav. Sci. Law 21: 713–736 (2003)
follow-up assessment was 25.43 months (SD¼ 4.96). Subsequent follow-up assess-
ments were scheduled as close to the 1 year anniversary of the first follow-up
assessment as possible, with the average length between the follow-up assessments
being 12.63 months (SD¼ 1.82) and 13.38 months (SD¼ 2.82), respectively. This
led to the average length of time between the screening and the third follow-up
assessment being 50.91 (SD¼ 4.44). Importantly, there were no differences in
attrition rates between the groups high and low on CU traits, with 92% of both
groups completing at least two follow-up assessments and with 74% and 71%,
respectively, completing all three follow-up assessments. Seventy-nine participants
completed the last follow-up assessment and this group was compared with the 19
participants who participated in the time 2 comprehensive assessment but did not
complete the last follow-up on each of the predictors of stability tested in analyses.
The only variable on which the groups differed was on Duncan’s SEI
(t(df¼ 96)¼ 2.06, p< 0.04; eta-squared¼ 0.04), with the group not completing
the last assessment being from a significantly higher socioeconomic status
(M¼ 61.01; SD¼ 19.48) than the group completing the last follow-up assessment
(M¼ 48.80; SD¼ 19.70). None of the effects for other predictors of stability
approached significance, with effect sizes (eta-squared) ranging from 0.00 to 0.02.
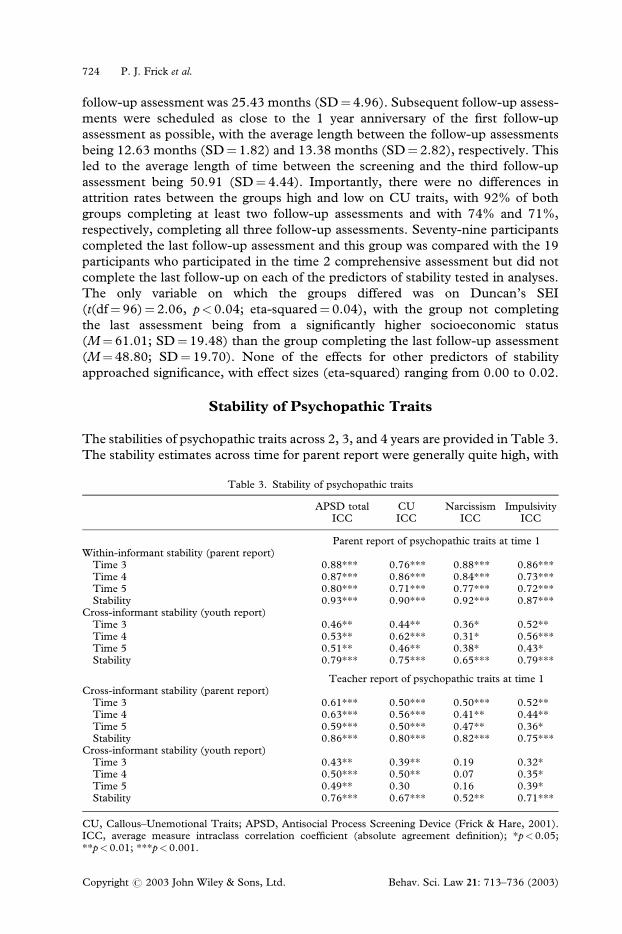
Stability of Psychopathic Traits
The stabilities of psychopathic traits across 2, 3, and 4 years are provided in Table 3.
The stability estimates across time for parent report were generally quite high, with
Table 3. Stability of psychopathic traits
APSD total CU Narcissism ImpulsivityICC ICC ICC ICC
Parent report of psychopathic traits at time 1Within-informant stability (parent report)
Time 3 0.88*** 0.76*** 0.88*** 0.86***Time 4 0.87*** 0.86*** 0.84*** 0.73***Time 5 0.80*** 0.71*** 0.77*** 0.72***Stability 0.93*** 0.90*** 0.92*** 0.87***
Cross-informant stability (youth report)Time 3 0.46** 0.44** 0.36* 0.52**Time 4 0.53** 0.62*** 0.31* 0.56***Time 5 0.51** 0.46** 0.38* 0.43*Stability 0.79*** 0.75*** 0.65*** 0.79***
Teacher report of psychopathic traits at time 1Cross-informant stability (parent report)
Time 3 0.61*** 0.50*** 0.50*** 0.52**Time 4 0.63*** 0.56*** 0.41** 0.44**Time 5 0.59*** 0.50*** 0.47** 0.36*Stability 0.86*** 0.80*** 0.82*** 0.75***
Cross-informant stability (youth report)Time 3 0.43** 0.39** 0.19 0.32*Time 4 0.50*** 0.50** 0.07 0.35*Time 5 0.49** 0.30 0.16 0.39*Stability 0.76*** 0.67*** 0.52** 0.71***
CU, Callous–Unemotional Traits; APSD, Antisocial Process Screening Device (Frick & Hare, 2001).ICC, average measure intraclass correlation coefficient (absolute agreement definition); *p<0.05;**p<0.01; ***p<0.001.
724 P. J. Frick et al.
Copyright # 2003 John Wiley & Sons, Ltd. Behav. Sci. Law 21: 713–736 (2003)
average measure intraclass correlation coefficient (absolute agreement definition)
estimates of 0.93 ( p< 0.001) across all time points for the total APSD scores.
Overall stability estimates ranged from 0.87 (Impulsivity) to 0.92 (Naricissism)
(both p< 0.001) for the individual scales. These coefficients suggest that a sub-
stantial amount of variance in parent ratings is consistent across time. The intraclass
correlation coefficients (ICC) for the four year stability of parenting ratings ranged
from 0.71 for the CU scale of the APSD to 0.80 for the total APSD score (all
p< 0.001).
The cross-informant stability estimates reported in Table 3 were lower but still
indicated a substantial amount of variance was consistent across time. For example,
the ICC stability estimates for parent report at time 1 predicting later youth self-
reports of psychopathy ranged from 0.65 for the Narcissism scale of the APSD to
0.79 for the total and the Impulsivity scale of the APSD (all p< 0.001). The four
year coefficients ranged from 0.38 ( p< 0.05) for Narcissism to 0.51 ( p< 0.001) for
the total score. Similarly, for teacher report at time 1 predicting later parent report,
the stability estimates ranged from 0.75 to 0.86 (all p< 0.01) across all assessments,
with the 4 year stability coefficients ranging from 0.36 ( p< 0.05) to 0.59
( p< 0.001). The cross-informant correlations for teacher report predicting later
youth self- report were somewhat more variable, due largely to the much lower
cross-informant stability for the Naricissism dimension, where there was an ICC of
0.52 ( p< 0.01) across all assessments, with a 4 year ICC of 0.16 (ns).
Importantly, these cross-informant stability coefficients confound variation in
stability with variation due to different raters. As noted in Table 2, the cross-
informant ICC for parent and teacher report on the APSD ranged from 0.27
( p< 0.001) for the Narcissism scale to 0.39 ( p< 0.001) for the total APSD score.
Across the three follow-up assessments, the average cross-informant ICC for parent
and youth report ranged from 0.31 for the Narcissism scale to 0.52 for the total
score. When the stability coefficients were corrected for attenuation based on these
estimates of cross-informant agreement (Ghiselli, Campbell, & Zedeck, 1981), all of
the overall estimates of stability met or exceeded 1.00 and only three of the
individual ICC estimates fell below 1.00. Such corrections could not be conducted
for the teacher reports predicting later self-report because there was no estimate of
concurrent correlations between teacher and self-reports. However, these analyses
suggest that much of the variation in the cross-informant correlations across time
could be attributed to the level of agreement between informants.
For these overall analyses of stability, the younger (grades 3 and 4 at the initial
assessment) and older (grades 5 and 6 at the initial assessment) cohorts were
collapsed to estimate stability. When separate stability estimates were conducted for
the two cohorts, very similar stability estimates were obtained for the parent ratings
across time. Specifically, the ICC across the four time points for the total APSD
score was 0.93 in the younger cohort and 0.91 in the older cohort (both p< 0.001)
and this was similar across the APSD subscales, with ICCs ranging from 0.91 to
0.92 in the younger cohort and 0.81 to 0.91 in the older cohort (all p< 0.001). For
teacher report predicting later parent report, the stability estimate was somewhat
stronger for the younger (0.89) than older (0.80) cohorts (both p< 0.001) and this
was largely due to the higher ICC estimates for the Impulsivity scale of the APSD in
the younger (0.81) compared with the older (0.64) cohort (both p< 0.001). For
both parent and teacher report predicting later youth self-report, the opposite
Stability of childhood psychopathy 725
Copyright # 2003 John Wiley & Sons, Ltd. Behav. Sci. Law 21: 713–736 (2003)

pattern was found, with stability estimates being somewhat lower in the younger
cohort than in the older cohort on the total APSD score (0.70 and 0.68 for the
younger cohort and 0.87 and 0.82 for the older cohort, respectively; all p< 0.001).
These lower estimates for cross-informant ratings in the younger cohort were fairly
consistent across the various APSD subscales.
The initial test of potential predictors of stability involved correlating each of the
hypothesized predictors with time 5 APSD scores, after controlling for time 1 APSD
scores. Thus, while not being direct predictors of stability, these analyses determine
whether variables were associated with change in APSD scores from the initial
assessment to the last follow-up. These partial correlations are provided in Table 4.
Only four variables predicted total APSD scores, after controlling for the initial level
of these traits. Socioeconomic status was negatively associated with later APSD
scores (�0.39, p< 0.01), whereas conduct problems (0.30, p< 0.05), total delin-
quency (0.23, p< 0.05), and the negative parenting composite (0.31, p< 0.05) were
all positively associated with later APSD scores. A similar pattern of results emerged
across APSD subscales. However, the partial correlations for total conduct pro-
blems and total delinquency did not reach significance in predicting CU traits (0.21
and 0.20) or impulsivity (0.14 and 0.17), although both were in the expected
direction. Also, socioeconomic status did not reach significance for predicting
impulsivity (�0.15), although it also showed the same trend as the other APSD
scales. Another consistent pattern of note is that the positive parenting composite by
child report was consistently negatively correlated with the APSD scores (ranging
from �0.11 to �0.22), although none of these correlations reached significance.
Table 4. Predictors of psychopathic traits controlling for initial level
Time 5 APSD scores
Time 2 predictors Total Callous–Unemotional Narcissism Impulsivity
DemographicAge �0.06 0.13 �0.14 �0.08Sex �0.15 �0.07 �0.12 �0.11Ethnicity �0.06 �0.06 �0.09 �0.06Socioeconomic status �0.39** �0.46*** �0.32* �0.15K-BIT Composite 0.09 �0.09 0.07 0.17
Antisocial/conductODD/CD symptoms 0.30* 0.21 0.32* 0.14Total delinquency 0.23* 0.20 0.06 0.17
Behavioral inhibitionReward Dominance 0.03 0.11 0.08 0.00Thrill-Seeking 0.05 �0.13 0.06 0.11
ParentingPositive Parenting (P) �0.07 �0.21 0.02 �0.03Positive Parenting (Y) �0.21 �0.21 �0.11 �0.22Negative Parenting (P) 0.31* 0.27* 0.29* 0.28*Negative Parenting (Y) 0.20 0.25* 0.18 0.08
Correlations reported in body of table are partial correlations controlling for time 1 scores from APSD.APSD, Antisocial Process Screening Device (Frick & Hare, 2001). Sex was coded Boy¼1 and Girl¼2;ethnicity was coded Caucasian¼1 and African American¼ 2; socioeconomic status, Duncan’sSocioeconomic Index (Hauser & Featherman, 1977); K-BIT, Composite Index from the KaufmanBrief Intelligence Test (Kaufman & Kaufman, 1990); ODD, Oppositional Defiant Disorder; CD,Conduct Disorder; (P) parent report; (Y) youth report; *p< 0.05; **p< 0.01; ***p< 0.001.
726 P. J. Frick et al.
Copyright # 2003 John Wiley & Sons, Ltd. Behav. Sci. Law 21: 713–736 (2003)

Patterns of Stability within the Sample
Previously, we provided our justification for oversampling groups of children with
CU traits and conduct problems. However, this methodology led to the recruitment
of extreme groups that distorted the distribution of CU traits in the sample. Given
the correlations among APSD dimensions (0.42–0.63, all p< 0.001, for parent
report at time 1 and 0.47–0.72, all p< 0.001, for teacher report at time 1), it is likely
that this methodology also distorted the distribution of all the APSD scales some-
what. Thus, a second method of assessing stability and determining predictors of
stability was used, which (i) utilized the extreme group sample recruitment design
and (ii) utilized normative cut-offs from the large community sample screened to
recruit the current study participants. Also, these analyses were limited to the 71
children who (i) were either above the upper quartile of the community sample
according to parental report of CU traits or at or below the mean according to
parental report of CU traits at the time 1 assessment and (ii) provided data at each of
the last three follow-up assessment points. This led to two groups of children, one
that was initially rated as being high on CU traits (n¼ 37) and one that was initially
rated as low on these traits (n¼ 34). Five patterns of stability were assessed for these
two groups. One pattern of stability (n¼ 24) included children who scored at or
below the full community sample mean on parental ratings of CU traits at all three of
the follow-up assessment points. Three additional groups designated those who
crossed the upper quartile of CU traits based on the full community sample mean at
either one (n¼ 6), two (n¼ 3), or all three (n¼ 11) follow-up assessments. A final
group consisted of those children who did not fall into any of these stability groups
(n¼ 27).
The distribution of these patterns of stability across the two groups differing on
their initial level of CU traits is provided in Table 5. As evidenced in this table, the
patterns of stability were not distributed equally across the two groups
(�2(df¼ 4)¼ 24.40, p< 0.001). Specifically, 83% (n¼ 20) of the group that showed
stable low scores across follow-up assessments were in the group who initially scored
low on CU traits. Further, all 11 of the children that exceeded the normative cut-off
at all three assessment points came from the group that was initially rated by parents
as high on CU traits. Also, it was less likely for children who initially scored low on
CU traits to obtain high scores at later assessment points than it was for children
Table 5. Continuity in children high and low on callous–unemotional traits at time 1
Time 1 status
Low callous–unemotional (n¼ 34) High callous–unemotional (n¼37)
n (column/row) n (column/row)
Stable low n¼20 (59%/83%) n¼4 (11%/17%)High at one follow-up n¼2 (6%/33%) n¼4 (11%/67%)High at two follow-ups n¼2 (6%/67%) n¼1 (3%/33%)High at three follow-ups n¼0 (0%/0%) n¼11 (30%/100%)Other n¼10 (29%/37%) n¼17 (46%/63%)
Relationship between time 1 status and stability groups was significant (�2 (df¼4)¼24.40, p< 0.001).
Stability of childhood psychopathy 727
Copyright # 2003 John Wiley & Sons, Ltd. Behav. Sci. Law 21: 713–736 (2003)
who were initially high on CU traits to score lower on these traits at later
assessments. Specifically, of those children who were initially rated low on CU
traits, only 4 (12%) were rated high on CU traits at any later point in time and only
19 (29%) even fell between the mean and upper quartile of the community sample at
any later assessment point. However, while it was rare for a child initially rated as
high on CU traits to score below the community sample mean at each follow-up
assessment (n¼ 4; 11%), a substantial number never crossed the normative cut-off
again at any of the follow-up assessments (n¼ 17; 46%).
Based on the patterns of stability reported in Table 5, there were eight children
who showed somewhat transitory elevations of CU traits, being rated as high on CU
traits by parents at the initial assessment but scoring below the community sample
mean at all assessment points or scoring high at only one follow-up point. In
contrast, there were 12 children who showed more stable patterns of CU traits,
initially being rated high and also being rated above the normative cut-off at two or
more follow-up assessments. These two groups of children were compared on all the
predictors of persistence to the 20 children who scored at or below the community
sample mean on CU traits at all assessment points. The only variables to differ-
entiate among these groups were socioeconomic status (F(2,37)¼ 6.88, p< 0.01;
eta-squared¼ 0.27), intelligence (F(2,37)¼ 5.87, p< 0.01; eta-squared¼ 0.24),
conduct problem symptoms (F(2,37)¼ 6.59, p< 0.01; eta-squared¼ 0.26), trials
played on the reward dominance task (F(2,37)¼ 3.81, p< 0.05; eta-
squared¼ 0.17), the positive parenting composite based on youth report
(F(2,35)¼ 3.43, p< 0.05; eta-squared¼ 0.16), and the negative parenting compo-
site based on youth report (F(2,35)¼ 5.91, p< 0.01; eta-squared¼ 0.25). Because
of the group differences in intelligence and socioeconomic status, the analyses for
the other variables that differentiated groups were repeated using intelligence and
socioeconomic status as covariates. The only two findings to remain significant were
for the level of conduct problems (F(4,35)¼ 4.61, p< 0.05; eta-squared¼ 0.21) and
the positive parenting composite based on youth report (F(4,33)¼ 3.57, p< 0.05;
eta-squared¼ 0.18).
The pattern of results for socioeconomic status, intelligence, and the two
variables that differentiated groups after controlling for these variables, are repre-
sented in Figure 1. As evident in this figure, the group that showed a decline in CU
traits (desisters) were very similar to the group that was low on CU traits (stable low)
across the entire study period. In fact, using Tukey’s procedures for pairwise
comparisons, there were no significant differences between these two groups on
any predictor of persistence. In contrast, the group that showed relatively stable
patterns of the CU traits (stable high) differed from the stable low group on all four
variables, and differed from the desister group on intelligence test scores and level of
conduct problems.
DISCUSSION
The primary purpose of the current study was to provide initial estimates of the
stability of psychopathic traits over an extended follow-up period (i.e. 4 years). For
parent report, which was the one method consistent across all follow-up assess-
ments, the composite index of psychopathic traits showed an average measure
728 P. J. Frick et al.
Copyright # 2003 John Wiley & Sons, Ltd. Behav. Sci. Law 21: 713–736 (2003)

intraclass correlation coefficient of 0.93 ( p< 0.001) across all time points, with
estimates ranging from 0.87 (Impulsivity) to 0.92 (Naricissism) (both p< 0.001) for
the individual dimensions of psychopathy. These coefficients suggest that a sub-
stantial amount of variance in parent ratings is consistent across time. Further, the
ICC estimates for the 4 year stability of parent ratings ranged from 0.71 for the CU
scale of the APSD to 0.80 for the Total APSD score (all p< 0.001). These
coefficients also indicate a substantial degree of stability in parent ratings, especially
given that these ICC estimates, in contrast to standard correlation coefficients, take
into account both changes in the relative ranking of a child’s scores across time and
also absolute changes in the child’s score over time.
To interpret these stability estimates, several comparisons can be made. First, as
reviewed in the introduction, there are few studies directly testing the stability of
psychopathic traits in adults. One such study reported 2 year stability estimates of
0.60 for men and 0.65 for women for total psychopathy scores (Rutherford et al.,
1999). While it is somewhat difficult to compare the ICC estimates obtained in the
current study with the correlation coefficients reported by Rutherford et al. (1999),
they do suggest that parent ratings of psychopathic traits in youth show comparable
or higher coefficients than those reported in adults. Second, the stability estimates
obtained in the current sample of youth can be compared with the stability of parent
ratings of other psychological traits in children. This is important for a number of
reasons. For example, it shows how comparable the stability of psychopathy is to
other forms of psychopathology in children. Further, it helps to determine whether
parents show variability in their ratings across time or whether their ratings are
inflated by stable perceptions that do not reflect actual changes in the child’s
adjustment. In two studies of the stability of parent ratings of children’s adjustment
in community samples over 3 years (ages 4–16; McConaughy, Stanger. &
Achenbach, 1992) or 4 years (ages 4–12; Verhulst, Koot, & Berden, 1990), the
mean stability estimates across different types of child adjustment were 0.46 (range
Figure 1. Variables that differentiated most and least stable groups. All variables are coverted to Z-scoresand the means for conduct problems and parenting are adjusted for the covariates intelligence and
socioeconomic status.
Stability of childhood psychopathy 729
Copyright # 2003 John Wiley & Sons, Ltd. Behav. Sci. Law 21: 713–736 (2003)

of 0.30–0.58) and 0.41 (range of 0.11–0.67), respectively. Again, these stability
estimates are much lower than those found for parent ratings of psychopathy in the
current study. Third, the estimates of stability obtained for psychopathic traits in the
current study can be compared with those found for other measures of personality in
both adults in children. A meta-analysis of 152 longitudinal studies providing 3,217
test–retest intervals reported average trait consistency of 0.31 for samples of children
and adolescents, 0.54 during the college years and young adulthood, 0.64 in middle
adulthood, and 0.74 between the ages of 50 and 70 (Roberts & DelVecchio, 2000).
Importantly, these meta-analytic estimates of the stability of personality traits were
adjusted to reflect a constant test–retest interval of 6.7 years, which is somewhat
longer than the 4 year interval used in the current study. However, the stability
estimates of psychopathic traits obtained in the current study appear to be somewhat
higher than is typically found for measures of personality in child and adolescent
samples and are comparable to those found in adult samples.
In the current study, the stability estimates were substantially lower when
different informants were used at initial and follow-up assessments. Specifically,
for parent-report predicting youth self-report of psychopathy, the overall stability
estimates ranged from 0.65 to 0.79 (all p< 0.01) for the various dimension of
psychopathy studied, with the 4 year ICC estimates ranging from 0.38 to 0.51.
However, these estimates confound variance related to temporal stability and
variance related to differences in raters. As noted in Table 2, the contemporaneous
cross-informant correlations on the dimensions of psychopathy were relatively
modest. Further, when the cross-informant stability coefficients were corrected
for attenuation based on the cross-informant reliability, it is clear that much of the
decrease in the magnitude of the stability estimates was due to differing reporters of
psychopathy.
The modest cross-informant correlations reported in this and other studies of
youth (see Frick & Hare, 2001, for a review) have sometimes been viewed as a
limitation in measures of psychopathic traits for youth (Seagrave & Grisso, 2002).
However, this level of cross-informant consistency is actually somewhat better than
is typically found when assessing childhood psychopathology, where correlations are
typically around 0.27 for parent and teacher ratings, around 0.25 for parent and
child self-report ratings, and around 0.20 for teacher and child self-report ratings
(Achenbach, McConaughy, & Howell, 1987). The cross-informant correlations
reported in the current study are, in fact, comparable to those found for differing
informants reporting on personality traits in adult samples. Specifically, the average
correlation between self- and spouse ratings of specific facets of personality ranged
from 0.24 to 0.66 with a mean of 0.39 in a sample of 47 married couples (McCrae,
Stone, Fagan, & Costa, 1998). Similarly, in a sample of college undergraduates
(n¼ 184), the average correlation between self-ratings of personality and ratings
made by parents, college acquaintances, and hometown acquaintances was reported
as being 0.37, 0.36, and 0.30, respectively (Funder, Kolar, & Blackman, 1995).
While these data support the stability of psychopathic traits in youth, they also
clearly indicate that there is some variability in the level of these traits across time.
Further, our data suggest that the pattern of change tends to be one in which some
youth high on psychopathic traits improve and show less severe levels of these traits
over time. It was less likely for youth who scored initially low on these traits in
childhood to develop significant levels of these traits later in childhood and
730 P. J. Frick et al.
Copyright # 2003 John Wiley & Sons, Ltd. Behav. Sci. Law 21: 713–736 (2003)

adolescence. The important question resulting from these findings is what factors
might predict these variations in stability? Our data suggest that factors related to
stability may be very different from the variables associated with initial levels of these
traits. Specifically, in the current sample (Frick et al., 2003b) and in other samples
(Barry et al., 2000; Blair, 1999; Fisher & Blair, 1998; Loney et al., 2003), measures
of behavioral inhibition (e.g. thrill seeking behavior, a reward dominant response
style) have been associated with psychopathic traits, especially the CU dimension.
However, in the current study, these measures showed little predictive utility after
controlling for initial levels of these traits.
Instead, the two most consistent predictors of stability across the different
methods for estimating stability were factors related to the child’s psychosocial
context, such as socioeconomic status and quality of parenting. These associations
may seem somewhat surprising, given past findings that measures of the quality of
parenting tend to be less related to the antisocial behavior of children with CU traits
than for children without these traits (Wootton, Frick, Shelton, & Silverthorn,
1999). However, this earlier study did not test the association between parenting
practices and CU traits, but focused on the association between parenting and
antisocial behavior in children with and without CU traits. Further, these results are
consistent with research demonstrating the importance of parenting in the devel-
opment of guilt and empathy and other aspects of conscience (Frick & Morris, in
press; Hoffman, 1994; Kochanska, 1995). Finally, it is quite possible that, although
a child’s temperament may play a larger role in placing a child at risk for problems in
conscience development (Frick & Morris, in press), the quality of later socialization
that is experienced by the child may play a more important role in determining
whether the child overcomes this risk later in development.
The only other variable to show some consistency in predicting the stability of
psychopathic traits in our non-referred sample was the child’s level of conduct
problems. That is, children with higher levels of conduct problem behavior tended
to have more stable levels of psychopathic traits, even after controlling for initial
levels of these traits. This finding suggest that studies examining psychopathic traits
in antisocial and criminal samples may overestimate the stability of these traits in
individuals who show less extreme antisocial behavior. Unfortunately, there is much
less research on individuals with psychopathic traits who do not also show antisocial
and criminal behavior (Hare, 1998; Lilienfeld & Andrews, 1996). However, our
findings suggest that this may be an important group to study, not only to determine
what prevents them from showing severe antisocial behavior despite their callous,
impulsive, and narcissistic traits, but also to determine what might make their
personality traits less stable over time. It is possible that chronically engaging in
antisocial, aggressive, and criminal behavior over time further desensitizes indivi-
duals to the consequences of their behavior on themselves and others, making their
callous personality traits more intractable.
All of these interpretations need to be made in the context of a number of
limitations. First, the current sample was very modest in size. This may have
prevented some significant predictors of stability from emerging due to a lack of
statistical power. Also, although there was little evidence for selective attrition, the
small initial sample magnifies the effects of even the minimal attrition that occurred
in our sample. The small sample also prevented us from using more sophisticated
statistical methods for estimating stability in our measure of psychopathic traits and
Stability of childhood psychopathy 731
Copyright # 2003 John Wiley & Sons, Ltd. Behav. Sci. Law 21: 713–736 (2003)

testing predictors of stability (e.g. latent growth curve methodology). Second, the
recruitment strategy was designed to ensure a significant number of children high on
psychopathic traits and a significant number of these children with and without
conduct problems. However, this strategy resulted in an atypical distribution of
scores in our sample, which could have influenced our correlations. Although we
tried to overcome this limitation by estimating stability and testing predictors of
stability using multiple methods, the atypical distribution created by this method of
recruitment could influence the generalizability of the results to other samples with
different distributions. For example, if the highest scorers on the measure of
psychopathy also show the highest level of stability, our sampling strategy that
oversampled such individuals could have inflated estimates of stability. On the other
hand, recruiting children with the highest scores increases the potential effects of
regression to the mean for later ratings and, thus, decreases the obtained stability
estimates. Third, the tests of predictors of stability were largely exploratory in
nature, given the absence of past research on such predictors. The nature of the
research question, as well as the modest sample size, led to our decision not to
control for inflated Type I rates in analyses. However, this methodology makes it
possible that some associations may not be replicated in other samples. Fourth, the
assessment of psychopathy relied on a rating scale method to assess psychopathy,
rather than on the strategy of combining interview results with historical records
used by the PCL-R (Hare, 2003). Because it does not rely on historical information,
this rating method allowed us to estimate change in scores across time. Further,
there is a body of research supporting the validity of this method of assessing
psychopathic traits in youth (Frick & Hare, 2001). However, it is unclear how well
these results will generalize to other methods of assessing psychopathy. Also, the
ratings at the follow-up assessment were conducted by mail and this may have
affected a child’s responses due to concerns about privacy.
A critically important limitation of the current findings is that, although our
results demonstrate substantial stability in psychopathic traits over a 4 year period in
older children and young adolescents, these data do not provide an estimate of how
many youth who score high on these traits in childhood will eventually meet
established criteria for a diagnosis of psychopathy as adults. Many of the concerns
about applying the construct of psychopathy to children are based on the possibility
that there will be an assumption that youth who score high on childhood measures of
psychopathy will be highly likely to be diagnosed as psychopathic as adults (Seagrave
& Grisso, 2002). Clearly, there are no data to determine the actual risk for adult
diagnoses in children who score high on psychopathic traits. More importantly,
there are important statistical, theoretical, and developmental issues to suggest that
one should expect very few children with psychopathic traits to be so diagnosed as
adults. First, as reviewed previously, much of the work on adult psychopathy has
focused on designating a small subgroup of incarcerated adults (Hart & Hare,
1997). As result, the existing diagnosis designates an outcome that is likely to be
found at a very low base rate in non-referred samples. Predicting very low base rate
phenomena is very difficult and almost always associated with high rates of false
positive predictions (Kraemer, 1992). Second, even in adults, there has been very
limited work on the expression of psychopathic traits in non-referred samples.
Further, there is still considerable debate as to whether these traits in samples of
individuals without severe antisocial behavior are measuring the same construct
732 P. J. Frick et al.
Copyright # 2003 John Wiley & Sons, Ltd. Behav. Sci. Law 21: 713–736 (2003)
(Hare, 1998; Lilienfeld & Andrews, 1996). As a result, even if these traits remain
stable into adulthood, this does not necessarily mean that this will strongly predict
the personality pattern associated with severe antisocial and violent behavior that
has been the focus of most of the research on psychopathy in adult samples. Third,
and perhaps most importantly, a hallmark of taking a developmental approach to
understanding psychopathological conditions is that, as one attempts to understand
the developmental processes that can lead to an outcome of interest, one should
assume that the pathways are changeable (Cicchetti & Rogosch, 1996). Further, the
earlier in development one attempts to study, the greater the degree of change that
should be expected. This is because of both the longer period of time during which
biological and contextual forces can operate to deflect children from a typical
pathway and the greater malleability of children’s personality earlier in development
(McCrae et al., 2002; Roberts & DelVecchio, 2000).
This last issue clearly illustrates both the great potential danger and the great
potential benefit of extending the construct of psychopathy to youth. If develop-
mental considerations are ignored, assumptions about the long term outcome of
these children can be made erroneously, with great potential consequences to the
child. If, however, the extension of the construct of psychopathy is made with
appropriate attention to developmental considerations, this research could provide
important information for designing more effective treatment for children with
severe conduct problems (Frick, 2001) and potentially prevent the development of a
personality disorder that can have a huge detrimental effect on society. Our findings
suggest that psychopathic traits are more stable than other problems in adjustment
experienced by youth and are comparable in stability to personality traits assessed in
adults. However, our results also indicate that some change in a child’s level of these
traits is possible over time and more research is needed to uncover what factors may
influence this change. Our exploratory results on predictors of stability suggest that
the factors influencing change may be quite different from those predicting the
initial level of psychopathic traits. Specifically, factors in the child’s psychosocial
ecology may play a more important role in the continuity of these traits than in the
initial risk for developing them. If such findings are replicated, they could have
important implications for designing more effective interventions for children with
psychopathic tendencies. Such interventions could focus not only on removing
factors that can place a child at risk for developing these traits, but also on factors
that may promote prosocial behavior in children who already manifest them.
REFERENCES
Achenbach, T. M., McConaughy, S. H., & Howell, C. T. (1987). Child/adolescent behavioral andemotional problems: Implications of cross-informant correlations for situational specificity. Psycholo-gical Bulletin, 101, 213–232.
American Psychiatric Association. (2000). The diagnostic and statistical manual of mental disorders (4thed.—text revision). Washington, DC: Author.
Barry, C. T., Frick, P. J., Grooms, T., McCoy, M. G., Ellis, M. L., & Loney, B. R. (2000). Theimportance of callous–unemotional traits for extending the concept of psychopathy to children. Journalof Abnormal Psychology, 109, 335–340.
Blair, R. J. R. (1999). Responsiveness to distress cues in the child with psychopathic tendencies.Personality and Individual Differences, 27, 135–145.
Brandt, J. R., Kennedy, W. A., Patrick, C. J., & Curtin, J. J. (1997). Assessment of psychopathy in apopulation of incarcerated adolescent offenders. Psychological Assessment, 9, 429–435.
Stability of childhood psychopathy 733
Copyright # 2003 John Wiley & Sons, Ltd. Behav. Sci. Law 21: 713–736 (2003)

Buss, A. H. (1995). Personality: Temperament, social behavior, and the self. Boston, MA: Allyn and Bacon.Caputo, A. A., Frick, P. J., & Brodsky, S. L. (1999). Family violence and juvenile sex offending: Potential
mediating roles of psychopathic traits and negative attitudes toward women. Criminal Justice andBehavior, 26, 338–356.
Christian, R. E., Frick, P. J., Hill, N. L., Tyler, L., & Frazer, D. R. (1997). Psychopathy and conductproblems in children: II. Implications for subtyping children with conduct problems. Journal of theAmerican Academy of Child and Adolescent Psychiatry, 36, 233–241.
Cicchetti, D., & Rogosch, F. A. (1996). Equifinality and mulifinality in developmental psychopathology.Development and Psychopathology, 8, 597–600.
Cleckley, H. (1976). The mask of sanity (5th ed.). St. Louis, MO: Mosby.Cooke, D. J., & Michie, C. (2001). Refining the construct of psychopathy: Towards a hierarchical model.
Psychological Assessment, 13, 171–188.Daugherty, T. K., & Quay, H. C. (1991). Response perseveration and delayed responding in childhood
behavior disorders. Journal of Child Psychology and Psychiatry, 32, 453–461.Edens, J., Skeem, J., Cruise, K., & Cauffman, E. (2001). The assessment of juvenile psychopathy and its
association with violence: A critical review. Behavioral Sciences and the Law, 19, 53–80.Elliott, D. S., & Ageton, S. S. (1980). Reconciling race and class differences in self-reported and official
estimates of delinquency. American Sociological Review, 45, 95–110.Elliott, D. S., & Huizinga, D. (1984). The relationship between delinquent behavior and ADM problems.
Boulder, CO: Behavioral Research Institute.Fisher, L., & Blair, R. J. R. (1998). Cognitive impairment and its relationship to psychopathic tendencies
in children with emotional and behavioral difficulties. Journal of Abnormal Child Psychology, 26, 511–519.
Forth, A. E., Hart, S. D., & Hare, R. D. (1990). Assessment of psychopathy in male young offenders.Psychological Assessment, 2, 342–344.
Frick, P. J. (1998). Conduct disorders and severe antisocial behavior. New York: Plenum.Frick, P. J. (2001). Effective interventions for children and adolescents with conduct disorder. The
Canadian Journal of Psychiatry, 46, 26–37.Frick, P. J. (2002). Juvenile psychopathy from a developmental perspective: Implications for construct
development and use in forensic assessments. Law and Human Behavior, 26, 247–253.Frick, P. J., Bodin, S. D., & Barry, C. T. (2000). Psychopathic traits and conduct problems in community
and clinic-referred samples of children: Further development of the Psychopathy Screening Device.Psychological Assessment, 12, 382–393.
Frick, P. J., Christian, R. C., & Wootton, J. M. (1999a). Age trends in the association between parentingpractices and conduct problems. Behavior Modification, 23, 106–128.
Frick, P. J., Cornell, A. H., Barry, C. T., Bodin, S. D., & Dane, H. A. (2003a). Callous–unemotionaltraits and conduct problems in the prediction of conduct problem severity, aggression, and self-reportof delinquency. Journal of Abnormal Child Psychology, 31, 457–470.
Frick, P. J., Cornell, A. H., Bodin, S. D., Dane, H. A., Barry, C. T., & Loney, B. R. (2003b). Callous–unemotional traits and developmental pathways to severe conduct problems. Developmental Psychology,39, 246–260.
Frick, P. J., & Hare, R. D. (2001). The antisocial process screening device (APSD). Toronto: Multi-HealthSystems.
Frick, P. J., Lilienfeld, S. O., Ellis, M. L., Loney, B. R., & Silverthorn, P. (1999b). The associationbetween anxiety and psychopathy dimensions in children. Journal of Abnormal Child Psychology, 27,381–390.
Frick, P. J., & Loney, B. R. (1999). Outcomes of children and adolescents with conduct disorder andoppositional defiant disorder. In H. C. Quay, & A. Hogan (Eds.), Handbook of disruptive behaviordisorders (pp. 507–524). New York: Plenum.
Frick, P. J., & Morris, A. S. (in press). Temperament and developmental pathways to severe conductproblems. Journal of Clinical Child and Adolescent Psychology.
Frick, P. J., O’Brien, B. S., Wootton, J. M., & McBurnett, K. (1994). Psychopathy and conduct problemsin children. Journal of Abnormal Psychology, 103, 700–707.
Funder, D. C., Kolar, D. C., & Blackman, M. C. (1995). Agreement among judges of personality:Interpersonal relations, similarity, and acquaintanceship. Journal of Personality and Social Psychology,69, 656–672.
Gadow, K. D., & Sprafkin, J. (1995). Manual for the Child Symptom Inventory (4th ed.). Stony Brook, NY:Checkmate Plus.
Gendreau, P., Goggin, C., & Smith, P. (2002). Is the PCL-R really the ‘‘unparalleled’ measure ofoffender risk? A lesson in knowledge accumulation. Criminal Justice and Behavior, 29, 397–426.
Ghiselli, E. E., Campbell, J. P., & Zedeck, S. (1981). Measurement theory for the behavioral sciences. SanFransisco: Freeman.
Hare, R. D. (1998). Psychopathy, affect, and behavior. In D. J. Cooke, A. E. Forth, & R. D. Hare (Eds.),Psychopathy: Theory, research, and implications for society (pp. 105–138). Dordrecht: Kluwer.
734 P. J. Frick et al.
Copyright # 2003 John Wiley & Sons, Ltd. Behav. Sci. Law 21: 713–736 (2003)
Hare, R. D. (2003). Hare Psychopathy Checklist—Revised (PCL-R): Second edition, technical manual.Toronto: Multi-Health Systems.
Harpur, T. J., & Hare, R. D. (1994). Assessment of psychopathy as a function of age. Journal of AbnormalPsychology, 103, 604–609.
Hart, S. D., & Hare, R. D. (1997). Psychopathy: Assessment and association with criminal conduct. InD. M. Stoff, J. Brieling, & J. Maser (Eds.), Handbook of antisocial behavior (pp. 22–35). New York:Wiley.
Hart, S. D., Watt, K. A., & Vincent, G. M. (2002). Commentary on Seagrave and Grisso: Impressions ofthe state of the art. Law and Human Behavior, 26, 241–246.
Hauser, R. M., & Featherman, D. L. (1977). The process of stratification. New York: Academic.Hemphill, J. F., Hare, R. D., & Wong, S. (1998). Psychopathy and recidivism: A review. Legal and
Criminological Psychology, 3, 139–170.Hoffman, M. L. (1994). Discipline and internalization. Developmental Psychology, 30, 26–28.Kagan, J., & Snidman, N. (1991). Temperamental factors in human development. American Psychologist,
46, 856–862.Kamphaus, R. W., & Frick, P. J. (2002). Clinical assessment of child and adolescent personality and behavior
(2nd ed.). Boston, MA: Allyn and Bacon.Kaufman, A. S., & Kaufman, N. L. (1990). Kaufman brief intelligence test manual. Circle Pines, MN:
American Guidance Service.Kochanska, G. (1995). Children’s temperament, mothers’ discipline, and security of attachment:
Multiple pathways to emerging internalization. Child Development, 66, 597–615.Kraemer, H. C. (1992). Evaluating medical tests. Newbury Park, CA: Sage.Krueger, R. F., Schmutte, P. S., Caspi, A., Moffitt, T. E., Campbell, K., & Silva, P. A. (1994).
Personality traits are linked to crime among men and women: Evidence from a birth cohort. Journal ofAbnormal Psychology, 103, 328–338.
Kruh, I. P., Frick, P. J., & Clements, C. B. (in press). Historical and personality correlates to the violencepatterns of juveniles tried as adults. Criminal Justice and Behavior.
Lahey, B. B., Applegate, B., Barkley, R. A., Garfinkel, B., McBurnett, K., Kerdyk, L., Greenhill, L.,Hynd, G. W., Frick, P. J., Newcorn, J., Biederman, J., Ollendick, T., Hart, E. L., Perez, D., Waldman,I., & Shaffer, D. (1994). DSM-IV field trials for oppositional defiant disorder and conduct disorder inchildren and adolescents. American Journal of Psychiatry, 151, 1163–1171.
Lilienfeld, S. O., & Andrews, B. P. (1996). Development and preliminary validation of a self-reportmeasure of psychopathic personality. Journal of Personality Assessment, 66, 488–524.
Loney, B. R., Frick, P. J., Clements, C. B., Ellis, M. L., & Kerlin, K. (2003). Callous–unemotional traits,impulsivity, and emotional processing in antisocial adolescents. Journal of Clinical Child and AdolescentPsychology, 32, 66–80.
Lykken, D. T. (1995). The antisocial personalities. Hillsdale, NJ: Erlbaum.Lynam, D. R. (1997). Pursuing the psychopath: Capturing the fledgling psychopath in a nomological net.
Journal of Abnormal Psychology, 106, 425–438.Lynam, D. R. (2002). Fledgling psychopathy: A view from personality theory. Law and Human Behavior,
26, 255–259.McConaughy, S., Stanger, C., & Achenbach, T. M. (1992). Three-year course of behavioral/emotional
problems in a national sample of 4- to 16-year olds: I. Agreement among informants. Journal of theAmerican Academy of Child and Adolescent Psychiatry, 31, 932–940.
McCrae, R. R., Costa, P. T., Terracciano, A., Parker, W. D., Mills, C. J., De Fruyt, F., & Mervielde, I.(2002). Personality trait development from age 12 to age 18: Longitudinal, cross-sectional, and cross-cultural analyses. Journal of Personality and Social Psychology, 83, 1456–1468.
McCrae, R. R., Stone, S. V., Fagan, P. J., Costa, P. T. (1998). Indentifying causes and disagreementbetween self-reports and spouse ratings of personality. Journal of Personality, 66, 285–312.
Newman, J. P., Patterson, C. M., & Kosson, D. S. (1987). Response perseveration in psychopaths.Journal of Abnormal Psychology, 96, 145–148.
O’Brien, B. S., & Frick, P. J. (1996). Reward dominance: Associations with anxiety, conduct problems,and psychopathy in children. Journal of Abnormal Child Psychology, 24, 223–240.
O’Brien, B. S., Frick, P. J., & Lyman, R. D. (1994). Reward dominance among children with disruptivebehavior disorders. Journal of Psychopathology and Behavioral Assessment, 16, 131–145.
Ogloff, J., Wong, S., & Greenwood, A. (1990). Treating criminal psychopaths in a therapeuticcommunity program. Behavioral Sciences and the Law, 8, 181–190.
Pardini, D. A., Lochman, J. E., & Frick, P. J. (2003). Callous/unemotional traits and social cognitiveprocesses in adjudicated youth. Journal of the American Academic of Child and Adolescent Psychiatry, 42,364–371.
Patrick, C. J. (1994). Emotion and psychopathy: Startling new insights. Psychophysiology, 31, 319–330.Roberts, B. W., & DelVecchio, W. F. (2000). The rank-order consistency of personality traits
from childhood to old age: A quantitative review of longitudinal studies. Psychological Bulletin, 126,3–25.
Stability of childhood psychopathy 735
Copyright # 2003 John Wiley & Sons, Ltd. Behav. Sci. Law 21: 713–736 (2003)

Russo, M. F., Stokes, G. S., Lahey, B. B., Christ, M. A. G., McBurnett, K., Loeber, R., Stouthamer-Loeber, M., & Green, S. M. (1993). A sensation-seeking scale for children: Further refinement andpsychometric development. Journal of Psychopathology and Behavioral Assessment, 15, 69–86.
Rutherford, M. J., Cacciola, J. S., Alterman, A. I., McKay, J. R., & Cook, T. G. (1999). Two-year test–retest reliability of the Psychopathy Checklist—Revised in methodone patients. Assessment, 6, 285–291.
Salekin, R. T. (2002). Psychopathy and therapeutic pessimism: Clinical lore or clinical reality? ClinicalPsychology Review, 22, 79–112.
Schroeder, M. L., Schroeder, K. G., & Hare, R. D. (1983). Generalizability of a checklist for theassessment of psychopathy. Journal of Consulting and Clinical Psychology, 51, 511–516.
Seagrave, D., & Grisso, T. (2002). Adolescent development and the measurement of juvenile ofpsychopathy. Law and Human Behavior, 26, 219–239.
Shaffer, D., Fisher, P., Lucas, C. P., Dulcan, M. K., & Schwab-Stone, M. E. (2000). NIMH diagnosticinterview schedule for children version IV (NIMH DISC-IV): Description, differences from previousversions, and reliability of some common diagnoses. Journal of the American Academy of Child andAdolescent Psychiatry, 39, 28–38.
Shelton, K. K., Frick, P. J., & Wootton, J. (1996). The assessment of parenting practices in families ofelementary school-aged children. Journal of Clinical Child Psychology, 25, 317–327.
Silverthorn, P., Frick, P. J., & Reynolds, R. (2001). Timing of onset and correlates of severe conductproblems in adjudicated girls and boys. Journal of Psychopathology and Behavioral Assessment, 23, 171–181.
Skeem, J. L., Monahan, J., & Mulvey, E. P. (2002). Psychopathy, treatment involvement, and subsequentviolence among civil psychiatric patients. Law and Human Behavior, 26, 577–603.
Toupin, J., Mercier, H., Dery, M., Cote, G., & Hodgins, S. (1995). Validity of the PCL-R foradolescents. Issues in Criminological and Legal Psychology, 24, 143–145.
Verhulst, F. C., Koot, H. M., & Berden, G. F. (1990). Four-year follow-up of an epidemiological sample.Journal of the American Academy of Child and Adolescent Psychiatry, 29, 440–448.
Walters, G. D. (2003). Predicting criminal justice outcomes with the Psychopathy Checklist and LifestyleCriminality Screening Form: A meta-analytic comparison. Behavioral Sciences and the Law, 21, 89–102.
Wootton, J. M., Frick, P. J., Shelton, K. K., & Silverthorn, P. (1997). Ineffective parenting and childhoodconduct problems: The moderating role of callous–unemotional traits. Journal of Consulting and ClinicalPsychology, 65, 301–308.
736 P. J. Frick et al.
Copyright # 2003 John Wiley & Sons, Ltd. Behav. Sci. Law 21: 713–736 (2003)