Embed Size (px)
Citation preview

Water Quality Conditions Associated with Cattle Grazing and Recreation on National Forest Lands
Leslie Roche1, Rob Atwill2, Randy Dahlgren3, Ken Tate1 1Plant Sciences, UC Davis; 2 School of Veterinary Medicine, UC Davis; 3Land, Air and
Water Resources, UC Davis
The 3rd Rustici Rangeland Science Symposium March 3-4, 2015 • UC Davis Conference Center
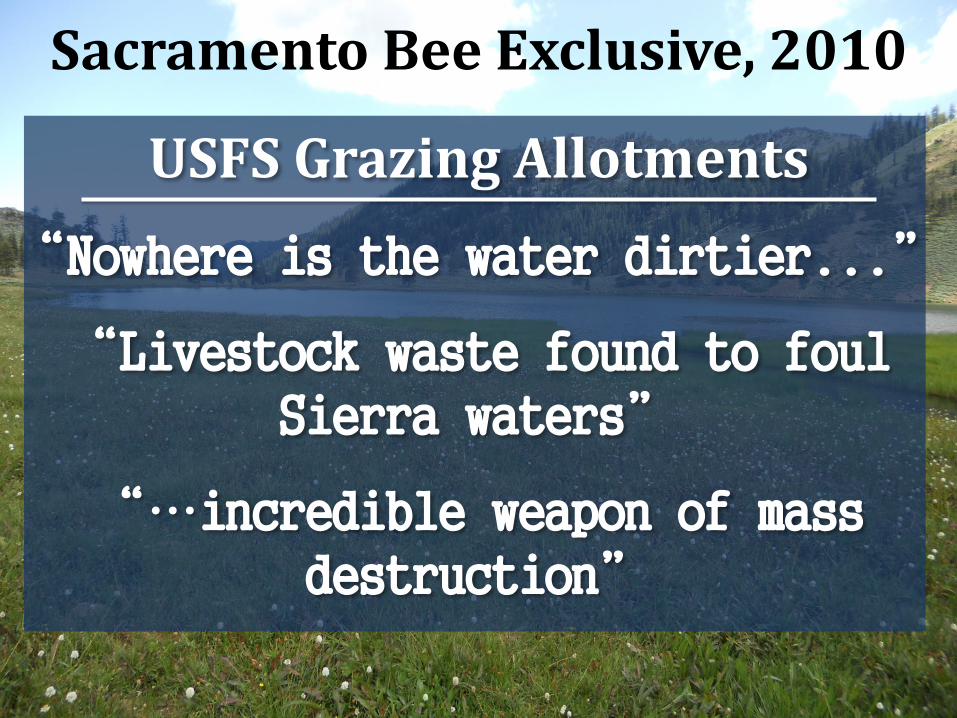
USFS Grazing Allotments
“Nowhere is the water dirtier...”
“Livestock waste found to foul Sierra waters”
“…incredible weapon of mass destruction”
Sacramento Bee Exclusive, 2010

• US Forest Service
• UC Davis
• UC Cooperative Extension
• USFS Permittees
• Regional Water Quality Control Boards
• Rangeland and Forest Stakeholders
Multi-Partner Collaboration

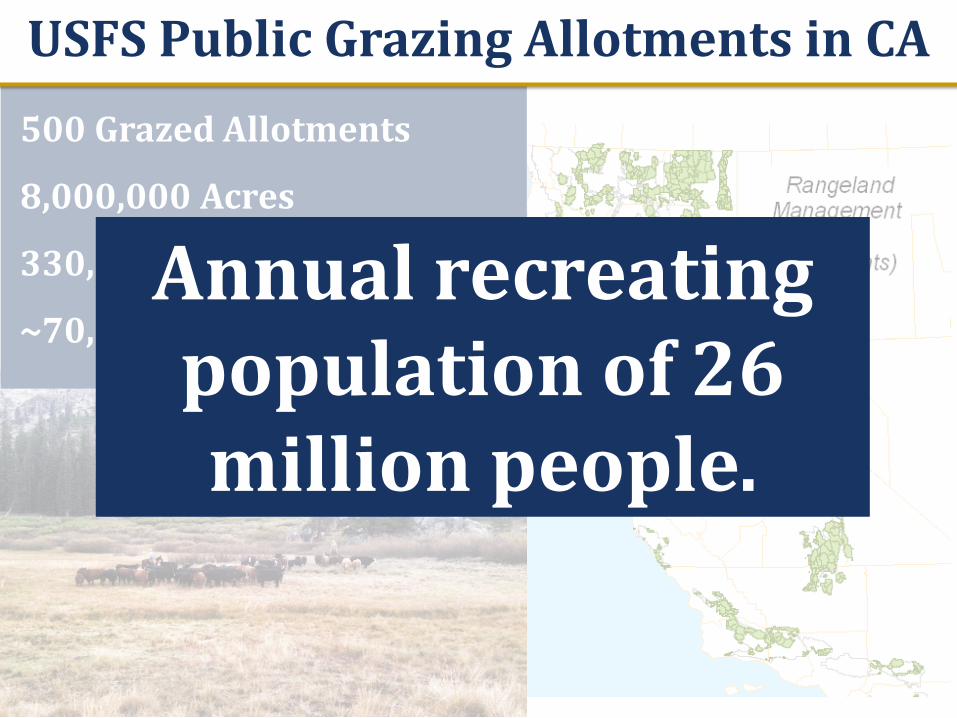
USFS Public Grazing Allotments in CA 500 Grazed Allotments
8,000,000 Acres
330,000 Animal Unit Months
~70,000 Head of Cattle
USFS Public Grazing Allotments in CA 500 Grazed Allotments
8,000,000 Acres
330,000 Animal Unit Months
~70,000 Head of Cattle
Annual recreating population of 26 million people.

Private Foothill Ranches & High Elevation Public Lands Connection
Sulak et al. 2008
Fall - Spring
Summer

Public Lands Grazing & Water Quality Objectives
1. Quantify fecal indicator bacteria and nutrient concentrations in surface waters.
2. Compare to a) Regulatory benchmarks, b) Recommended benchmarks for eutrophication concerns, and c) Estimates of nutrient background concentrations.
3. Examine relationships between water quality, environmental conditions, cattle grazing, and recreation.
Public lands cattle grazing degrading environmental
quality and putting human health at risk?

12 USFS public lands grazing allotments, 5 National Forests
• Klamath, Coast, Cascade, and Sierra Nevada Mountain Ranges.
• Represent diversity of climate, soil, vegetation, and resource use activities found across landscape.
• Study area: 320,000 acres.
• Elevation: 700-10,000 feet.
Public Lands Grazing & Water Quality Cross-sectional, Longitudinal Survey

12 USFS public lands grazing allotments, 5 National Forests
155 sample sites monitored monthly during grazing-recreation period (Jun-Nov, 2011).
Public Lands Grazing & Water Quality Cross-sectional, Longitudinal Survey
• Key Grazing Areas – Meadows/riparian areas cattle known to graze and occupy.

12 USFS public lands grazing allotments, 5 National Forests
155 sample sites monitored monthly during grazing-recreation period (Jun-Nov, 2011).
Public Lands Grazing & Water Quality Comprehensive Survey
• Recreation Areas – Developed/undeveloped campgrounds, swimming areas, trailheads.

12 USFS public lands grazing allotments, 5 National Forests
155 sample sites monitored monthly during grazing-recreation period (Jun-Nov, 2011).
Public Lands Grazing & Water Quality Comprehensive Survey
• No Concentrated Use Activities– Perennial flow tributary confluences with no concentrated use activities.

HC4
HC2
HC6
HC1
HC5
HC3
HC7
HC8 HC9
HC11 HC16
HC12
HC13
HC17
HC18
HC14
HC15 HC10
Sample Site Selection
Meadow: Key Grazing Areas
Campground
Meadows: Key Grazing Areas
Recreation – Swimming Areas
Watershed-scale source-search
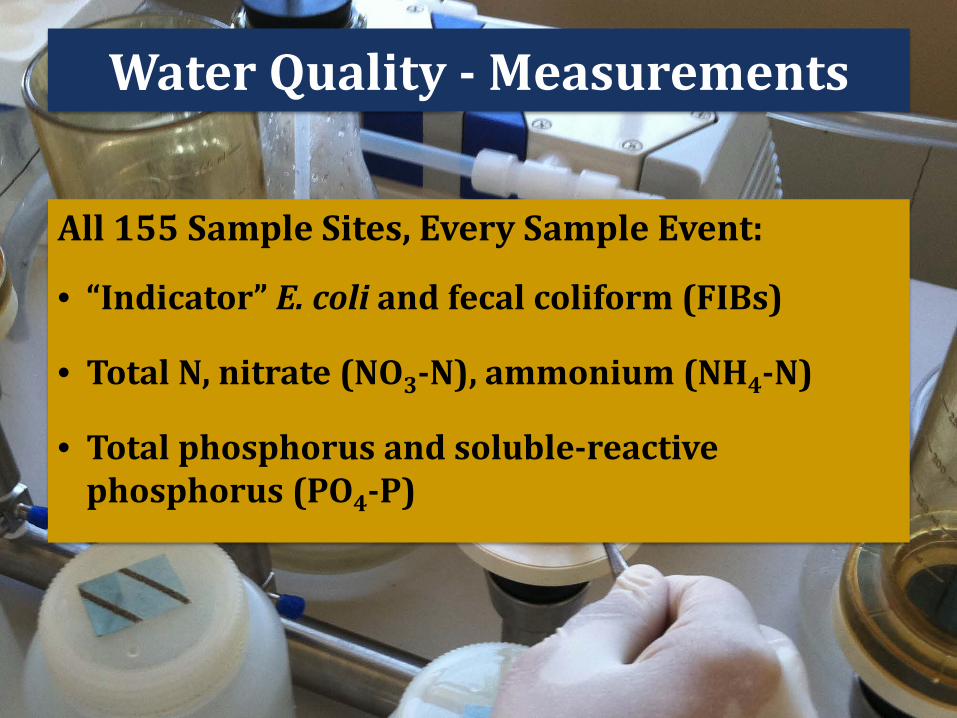
Water Quality - Measurements
All 155 Sample Sites, Every Sample Event:
• “Indicator” E. coli and fecal coliform (FIBs)
• Total N, nitrate (NO3-N), ammonium (NH4-N)
• Total phosphorus and soluble-reactive phosphorus (PO4-P)
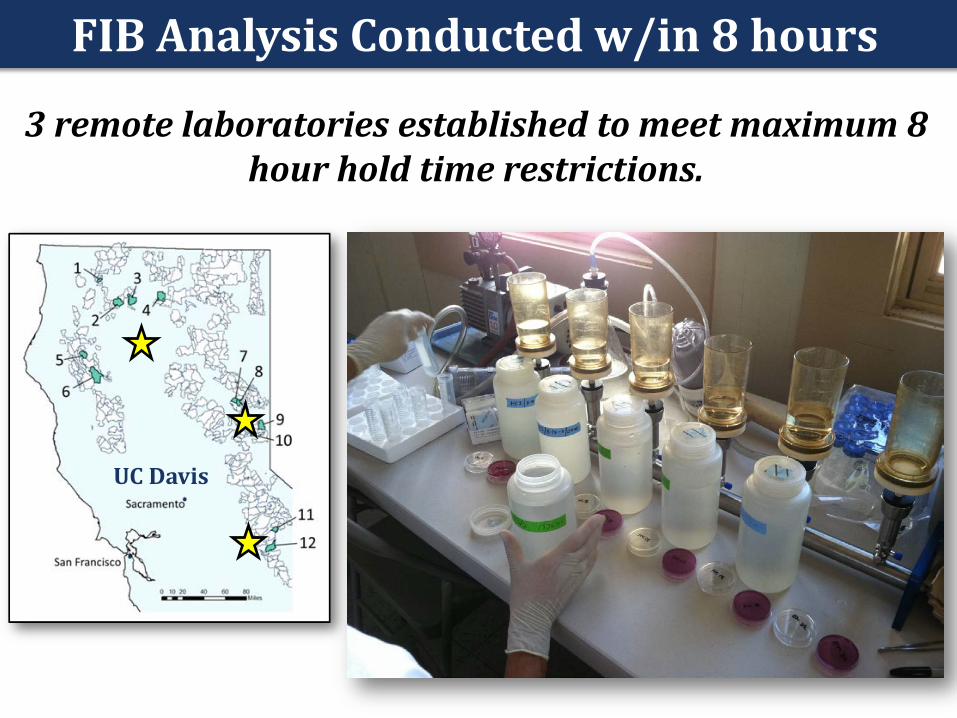
FIB Analysis Conducted w/in 8 hours
3 remote laboratories established to meet maximum 8 hour hold time restrictions.
UC Davis

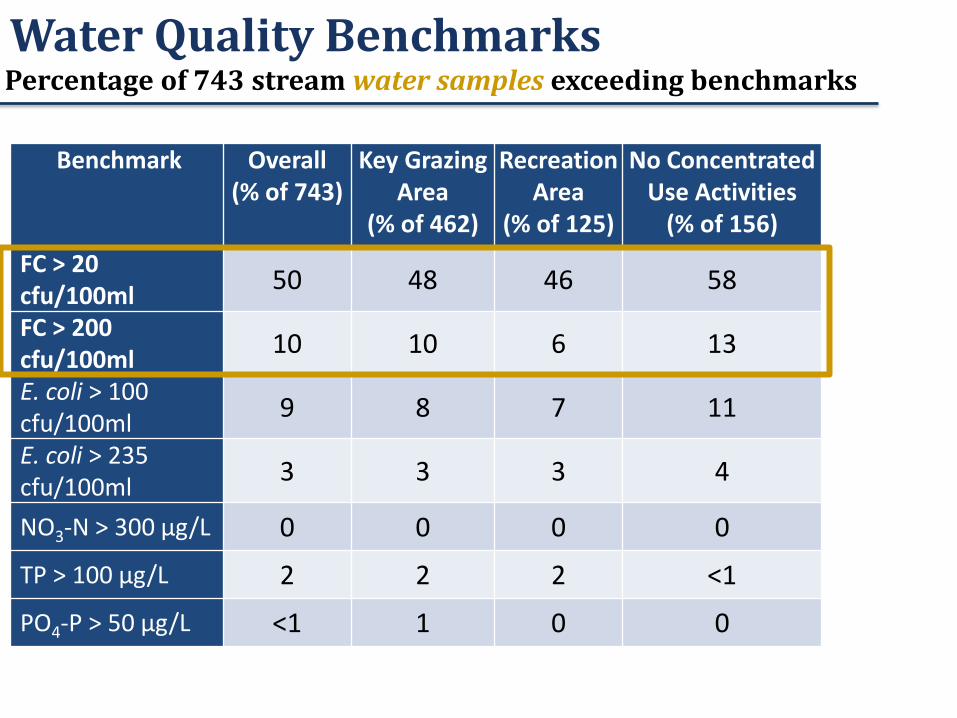
Water Quality Benchmarks
Benchmark Overall (% of 743)
Key Grazing Area
(% of 462)
Recreation Area
(% of 125)
No Concentrated Use Activities
(% of 156) FC > 20 cfu/100ml 50 48 46 58
FC > 200 cfu/100ml 10 10 6 13
E. coli > 100 cfu/100ml 9 8 7 11
E. coli > 235 cfu/100ml 3 3 3 4
NO3-N > 300 µg/L 0 0 0 0
TP > 100 µg/L 2 2 2 <1
PO4-P > 50 µg/L <1 1 0 0
Percentage of 743 stream water samples exceeding benchmarks

Mean FIB Concentrations Benchmark Key Grazing Area
(n = 462) Recreation Area
(n = 125) No Concentrated
Use Activities (n = 156)
FC (cfu 100/ml) 87 ± 12 a 55 ± 9 b 90 ± 12 a
E. coli (cfu 100/ml) 42 ± 6 a 29 ± 7 b 43 ± 8 a
No significant differences in FIB concentrations between key grazing areas and areas of no
concentrated use activities.

Mean FIB Concentrations Benchmark Key Grazing Area
(n = 462) Recreation Area
(n = 125) No Concentrated
Use Activities (n = 156)
FC (cfu 100/ml) 87 ± 12 a 55 ± 9 b 90 ± 12 a
E. coli (cfu 100/ml) 42 ± 6 a 29 ± 7 b 43 ± 8 a
FIB concentrations significantly lower at recreation areas.

Mean FIB Concentrations Benchmark Key Grazing Area
(n = 462) Recreation Area
(n = 125) No Concentrated
Use Activities (n = 156)
FC (cfu 100/ml) 87 ± 12 a 55 ± 9 b 90 ± 12 a
E. coli (cfu 100/ml) 42 ± 6 a 29 ± 7 b 43 ± 8 a
Mean FIB concentrations still below USEPA E. coli FIB-based benchmarks.
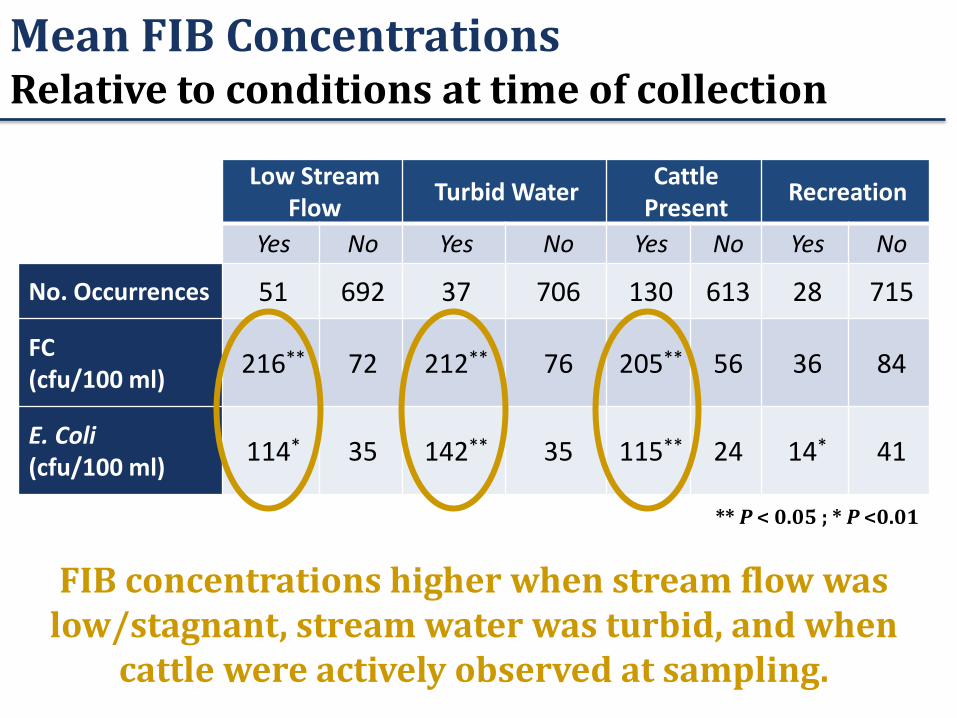
Low Stream Flow Turbid Water Cattle
Present Recreation
Yes No Yes No Yes No Yes No
No. Occurrences 51 692 37 706 130 613 28 715
FC (cfu/100 ml) 216** 72 212** 76 205** 56 36 84
E. Coli (cfu/100 ml) 114* 35 142** 35 115** 24 14* 41
FIB concentrations higher when stream flow was low/stagnant, stream water was turbid, and when
cattle were actively observed at sampling.
** P < 0.05 ; * P <0.01
Mean FIB Concentrations Relative to conditions at time of collection

Allotment-Level Mean FIB Concentrations
No statistically significant relationships between FIB and cattle density or precipitation.

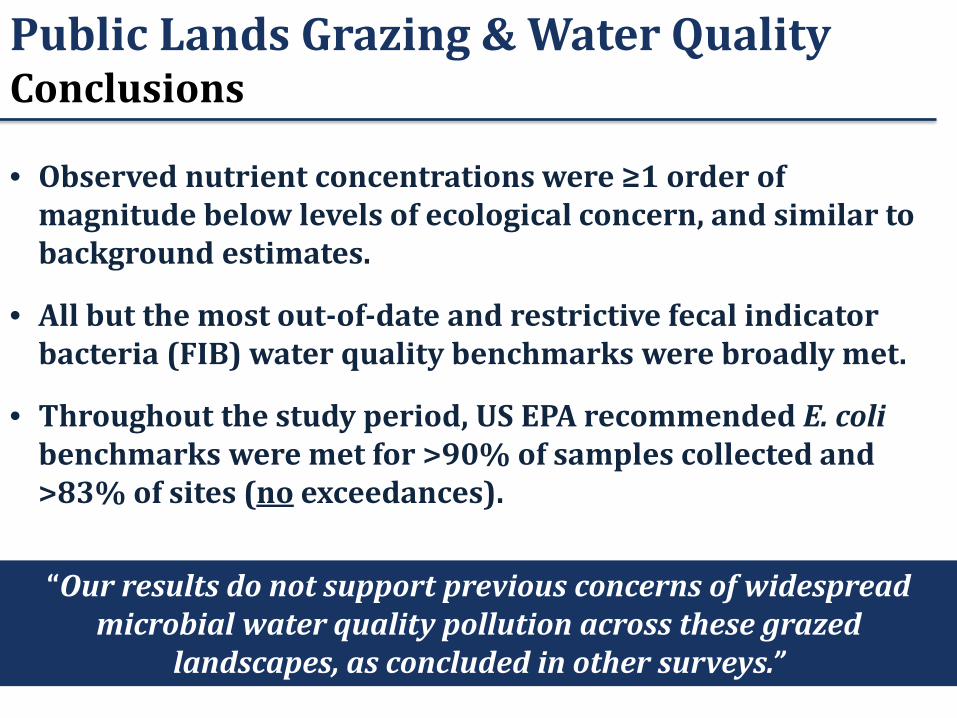
• Observed nutrient concentrations were ≥1 order of magnitude below levels of ecological concern, and similar to background estimates.
• All but the most out-of-date and restrictive fecal indicator bacteria (FIB) water quality benchmarks were broadly met.
• Throughout the study period, US EPA recommended E. coli benchmarks were met for >90% of samples collected and >83% of sites (no exceedances).
Public Lands Grazing & Water Quality Conclusions
“Our results do not support previous concerns of widespread microbial water quality pollution across these grazed
landscapes, as concluded in other surveys.”

1) Study results compared to regulatory and background water quality benchmarks based on current science and policy.
2) Land-use activities were directly compared on the same land units managed by a single agency (USFS).
3) To date, this study is the most comprehensive water quality survey in existence for National Forest public grazing lands, including an assessment of 7 water quality indicators at 155 sites across 5 National Forests.
Why are our conclusions different than other surveys?
3 important distinctions
Rangeland Watershed Laboratory Roche, L.M., L. Kromschroeder, E. R. Atwill, R.A. Dahlgren, and K.W. Tate. 2013.
Water Quality Conditions Associated with Cattle Grazing and Recreation on National Forest Lands. PLOS ONE 8(6): e68127.
http://rangelandwatersheds.ucdavis.edu