Embed Size (px)
Citation preview
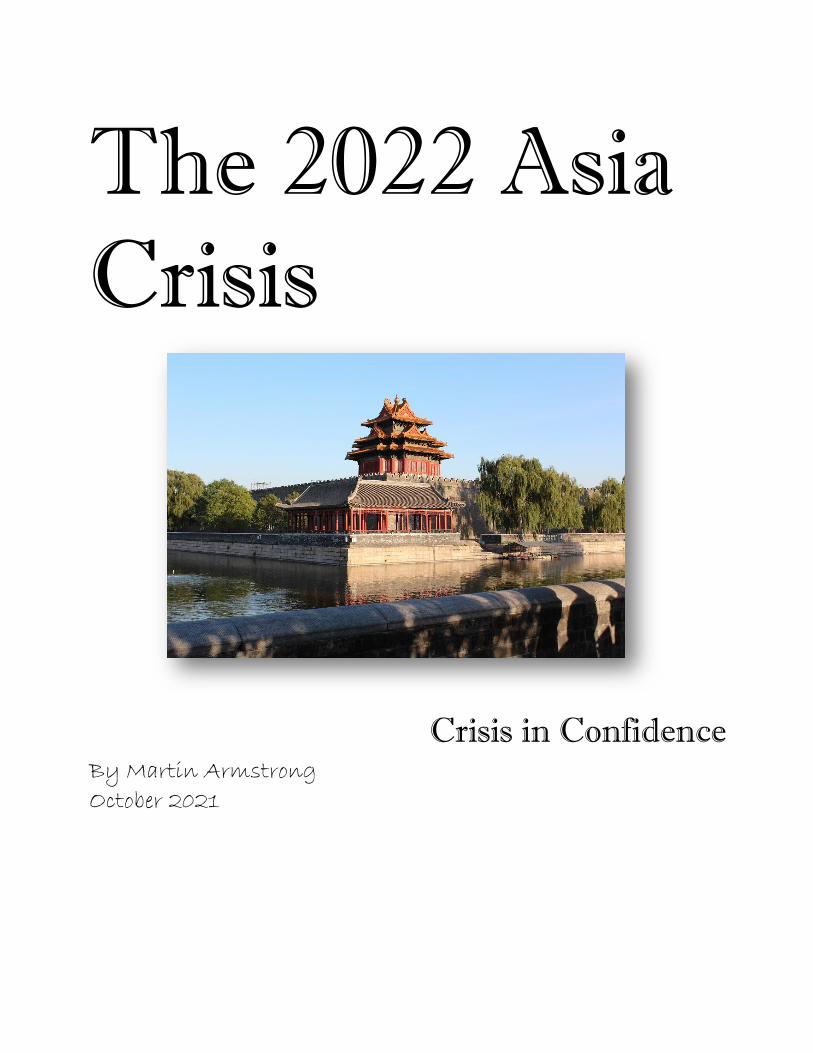
The 2022 Asia
Crisis
Crisis in Confidence
By Martin Armstrong
October 2021

Copyright – ALL RIGHTS STRICTLY RESERVED GLOBALLY
All publications of the publisher are COPYRIGHTED and REGISTERED by the license of Martin Armstrong
The material, concepts, research and graphic illustrations appearing within this publication are the EXCLUSIVE PROPERTY of Martin Armstrong and AE Global Solutions, Inc.
NO REPRODUCTION is permitted without the express WRITTEN consent of the publisher. AE Global Solutions, Inc. might grant permission to utilize in part the research published in its reports for recognized educational purposes of qualified universities or similar institutions when requests are made prior to utilization. Materials can be supplied to universities and similar institutions in most cases without charge. Other individuals, corporations, institutional or brokers within the financial community are strictly prohibited from reproducing in part or in whole any published materials of AE Global Solutions, Inc., its affiliates, associates or joint venture partners. Anyone wishing to apply for such permission must do so in writing for each and every such use.
AE Global Solutions, Inc and Martin Armstrong do not waive any of its rights under international copyright law in regard to its research, analysis or opinions. Anyone who violates the copyright of AE Global Solutions, Inc and Martin Armstrong shall be prosecuted to the full extent of the law.

DISCLAIMER The information contained in this report is NOT intended for speculation on any financial market referred to within this report. AE Global Solutions, Inc. makes no such warrantee regarding its opinions or forecasts in reference to the markets or economies discussed in this report. Anyone seeking consultation on economic future trends in a personal nature must do so under written contract.
This is neither a solicitation nor an offer to Buy or Sell any cash or derivative (such as futures, options, swaps, etc.) financial instrument on any of the described underlying markets. No representation is being made that any financial result will or is likely to achieve profits or losses similar to those discussed. The past performance of any trading system or methodology discussed here is not necessarily indicative of future results.
Futures, Options, and Currencies trading all have large potential rewards, but also large potential risk. You must be aware of the risks and be willing to accept them in order to invest in these complex markets. Don’t trade with money you can’t afford to lose and NEVER trade anything blindly. You must strive to understand the markets and to act upon your conviction when well researched.
Indeed, events can materialize rapidly and thus past performance of any trading system or methodology is not necessarily indicative of future results particularly when you understand we are going through an economic evolution process and that includes the rise and fall of various governments globally on an economic basis.
CFTC Rule 4.41 – Any simulated or hypothetical performance results have certain inherent limitations. While prices may appear within a given trading range, there is no guarantee that there will be enough liquidity (volume) to ensure that such trades could be actually executed. Hypothetical results thus can differ greatly from actual performance records, and do not represent actual trading since such trades have not actually been executed, these results may have under- or over-compensated for the impact, if any, of certain market factors, such as lack of liquidity. Simulated or hypothetical trading programs in general are also subject to the fact that they are designed with the benefit of hindsight and back testing. Such representations in theory could be altered by Acts of God or Sovereign Debt Defaults.
It should not be assumed that the methods, techniques, or indicators presented in this publication will be profitable or that they will not result in losses since this cannot be a full representation of all considerations and the evolution of economic and market development. Past results of any individual or trading strategy published are not indicative of future returns since all things cannot be considered for discussion purposes. In addition, the indicators, strategies, columns, articles and discussions (collectively, the “Information”) are provided for informational and educational purposes only and should not be construed as investment advice or a solicitation for money to manage since money management is not conducted. Therefore, by no means is this publication to be construed as a solicitation of any order to buy or sell. Accordingly, you should not rely solely on the Information in making any investment. Rather, you should use the Information only as a starting point for doing additional independent research in order to allow you to form your own opinion regarding investments. You should always check with your licensed financial advisor and tax advisor to determine the suitability of any such investment.
Copyright 2017 AE Global Solutions, Inc. and Martin A. Armstrong All Rights Reserved. Protected by copyright laws of the United States and international treaties.
This report may NOT be forwarded to any other party and remains the exclusive property of AE Global Solutions, Inc. And Martin Armstrong is merely leased to the recipient for educational purposes.

Contents China & Debt Crisis .............................................................................................................................................. 1
China’s Property Boom ...................................................................................................................................16
MONETARY CRISIS CYCLE ....................................................................................................................26
SHANGHAI COMPOSITE ..................................................................................................................................27
YEARLY ANALYSIS PERSPECTIVE .............................................................................................................28
YEARLY TECHNICAL ANALYSIS ...........................................................................................................29
YEARLY TIMING ANALYSIS .....................................................................................................................30
YEARLY DIRECTIONAL CHANGES .....................................................................................................30
YEARLY VOLATILITY ....................................................................................................................................30
YEARLY PANIC CYCLES ..........................................................................................................................31
THE BROADER LONGER-TERM VIEW...............................................................................................31
INDICATING RANGE STUDY .................................................................................................................31
TRADING ENVELOPE STUDY .................................................................................................................31
STOCHASTICS................................................................................................................................................32
ENERGY MODELS .......................................................................................................................................32
REVERSAL COMMENTARY ....................................................................................................................32
YEARLY FIBONACCI PROJECTIONS IN TIME ...............................................................................32
YEARLY FIBONACCI RETRACEMENTS & PERCENTAGE MOVEMENTS ..........................33
Fibonacci Percentage Golden Ratio Movements: ............................................................33
ECONOMIC CONFIDENCE MODEL CORRELATION .............................................................33
YEARLY CURRENCY CORRELATION ................................................................................................34
QUARTERLY ANALYSIS PERSPECTIVE....................................................................................................35
HEDGING MODEL ......................................................................................................................................35
QUARTERLY CURRENCY CORRELATION .......................................................................................36
MONTHLY ANALYSIS PERSPECTIVE .......................................................................................................36
MONTHLY CURRENCY CORRELATION...........................................................................................36
MONTHLY BROADER TREND VIEW ...................................................................................................37
MONTHLY TURNING POINTS .................................................................................................................38
MONTHLY DIRECTIONAL CHANGES ...............................................................................................38
MONTHLY VOLATILITY ..............................................................................................................................38
MONTHLY PANIC CYCLES ....................................................................................................................39
MONTHLY BULLISH REVERSALS ...........................................................................................................39
MONTHLY BEARISH REVERSALS ..........................................................................................................39
HEDGING MODEL ......................................................................................................................................39
MARKET RISK FACTOR .............................................................................................................................40
Shanghai Composite Risk Table ......................................................................................................40
HONG KONG CASH SHARE INDEX ...........................................................................................................41
YEARLY ANALYSIS PERSPECTIVE .............................................................................................................42
YEARLY TECHNICAL ANALYSIS ...........................................................................................................43
YEARLY TIMING ANALYSIS .....................................................................................................................44
YEARLY DIRECTIONAL CHANGES .....................................................................................................44
YEARLY VOLATILITY ....................................................................................................................................45
YEARLY PANIC CYCLES ..........................................................................................................................45
THE BROADER LONGER-TERM VIEW...............................................................................................45
INDICATING RANGE STUDY .................................................................................................................45
TRADING ENVELOPE STUDY .................................................................................................................46
STOCHASTICS................................................................................................................................................46
ENERGY MODELS .......................................................................................................................................46
REVERSAL COMMENTARY ....................................................................................................................46
YEARLY FIBONACCI PROJECTIONS IN TIME ...............................................................................46
YEARLY FIBONACCI RETRACEMENTS & PERCENTAGE MOVEMENTS ..........................47
Fibonacci Percentage Golden Ratio Movements: ............................................................47
ECONOMIC CONFIDENCE MODEL CORRELATION .............................................................47
YEARLY CURRENCY CORRELATION ................................................................................................48
QUARTERLY ANALYSIS PERSPECTIVE....................................................................................................48
HEDGING MODEL ......................................................................................................................................49
QUARTERLY CURRENCY CORRELATION .......................................................................................49
MONTHLY LEVEL ..............................................................................................................................................50
MONTHLY BROADER TREND VIEW ...................................................................................................50
MONTHLY TURNING POINTS .................................................................................................................51
MONTHLY DIRECTIONAL CHANGES ...............................................................................................51
MONTHLY VOLATILITY ..............................................................................................................................51
MONTHLY PANIC CYCLES ....................................................................................................................52
MONTHLY BULLISH REVERSALS ...........................................................................................................52
MONTHLY BEARISH REVERSALS ..........................................................................................................52
HEDGING MODEL ......................................................................................................................................52
MONTHLY CURRENCY CORRELATION...........................................................................................53
NIKKEI TOKYO INDEX CASH ...........................................................................................................................54
YEARLY ANALYSIS PERSPECTIVE ........................................................................................................55
YEARLY TECHNICAL ANALYSIS ...........................................................................................................56
YEARLY TIMING ANALYSIS .....................................................................................................................57
YEARLY DIRECTIONAL CHANGES .....................................................................................................57
YEARLY VOLATILITY ....................................................................................................................................57
THE BROADER LONGER-TERM VIEW...............................................................................................57
YEARLY OUTSIDE COMMENT ...............................................................................................................57
INDICATING RANGE STUDY .................................................................................................................57
TRADING ENVELOPE STUDY .................................................................................................................58
STOCHASTICS................................................................................................................................................58
ENERGY MODELS .......................................................................................................................................58
REVERSAL COMMENTARY ....................................................................................................................58
YEARLY FIBONACCI PROJECTIONS IN TIME ...............................................................................59
YEARLY FIBONACCI RETRACEMENTS & PERCENTAGE MOVEMENTS ..........................59
Fibonacci Percentage Golden Ratio Movements: ............................................................59
ECONOMIC CONFIDENCE MODEL CORRELATION .............................................................60
YEARLY CURRENCY CORRELATION ................................................................................................60
QUARTERLY ANALYSIS PERSPECTIVE....................................................................................................61
HEDGING MODEL ......................................................................................................................................61
QUARTERLY CURRENCY CORRELATION .......................................................................................62
MONTHLY LEVEL ..............................................................................................................................................63
MONTHLY BROADER TREND VIEW ...................................................................................................63
MONTHLY TURNING POINTS .................................................................................................................64
MONTHLY DIRECTIONAL CHANGES ...............................................................................................64
MONTHLY VOLATILITY ..............................................................................................................................64
MONTHLY BULLISH REVERSALS ...........................................................................................................65
MONTHLY BEARISH REVERSALS ..........................................................................................................65
HEDGING MODEL ......................................................................................................................................65
MONTHLY CURRENCY CORRELATION...........................................................................................66
MARKET RISK FACTOR .............................................................................................................................67
INDIA BOMBAY STOCK EXCHANGE INDEX CASH ...........................................................................68
YEARLY ANALYSIS PERSPECTIVE ........................................................................................................69
YEARLY TECHNICAL ANALYSIS ...........................................................................................................69
YEARLY TIMING ANALYSIS .....................................................................................................................70
YEARLY VOLATILITY ....................................................................................................................................70
THE BROADER LONGER-TERM VIEW...............................................................................................70
INDICATING RANGE STUDY .................................................................................................................71
TRADING ENVELOPE STUDY .................................................................................................................71
STOCHASTICS................................................................................................................................................71
ENERGY MODELS .......................................................................................................................................71
SUPERPOSITION............................................................................................................................................72
YEARLY FIBONACCI PROJECTIONS IN TIME ...............................................................................72
YEARLY FIBONACCI RETRACEMENTS & PERCENTAGE MOVEMENTS ..........................72
Fibonacci Percentage Golden Ratio Movements: ............................................................73
ECONOMIC CONFIDENCE MODEL CORRELATION .............................................................73
QUARTERLY ANALYSIS PERSPECTIVE....................................................................................................73
HEDGING MODEL ......................................................................................................................................74
MONTHLY LEVEL ..............................................................................................................................................75
MONTHLY BROADER TREND VIEW ...................................................................................................75
MONTHLY TURNING POINTS .................................................................................................................76
MONTHLY VOLATILITY ..............................................................................................................................76
MONTHLY BULLISH REVERSALS ...........................................................................................................76
MONTHLY BEARISH REVERSALS ..........................................................................................................77
MONTHLY ANALYSIS PERSPECTIVE ...................................................................................................77
HEDGING MODEL ......................................................................................................................................77
MARKET RISK FACTOR .............................................................................................................................78
KOREA KOSPI 200 INDEX ................................................................................................................................79
YEARLY ANALYSIS PERSPECTIVE .............................................................................................................80
YEARLY TECHNICAL ANALYSIS ...........................................................................................................81
YEARLY TIMING ANALYSIS .....................................................................................................................81
YEARLY DIRECTIONAL CHANGES .....................................................................................................82
YEARLY VOLATILITY ....................................................................................................................................82
THE BROADER LONGER-TERM VIEW...............................................................................................82
YEARLY OUTSIDE COMMENT ...............................................................................................................82
INDICATING RANGE STUDY .................................................................................................................82
TRADING ENVELOPE STUDY .................................................................................................................83
STOCHASTICS................................................................................................................................................83
ENERGY MODELS .......................................................................................................................................83
REVERSAL COMMENTARY ....................................................................................................................83
YEARLY FIBONACCI PROJECTIONS IN TIME ...............................................................................83
YEARLY FIBONACCI RETRACEMENTS & PERCENTAGE MOVEMENTS ..........................84
Fibonacci Percentage Golden Ratio Movements: ............................................................84
ECONOMIC CONFIDENCE MODEL CORRELATION .............................................................84
YEARLY CURRENCY CORRELATION ................................................................................................85
QUARTERLY ANALYSIS PERSPECTIVE....................................................................................................85
HEDGING MODEL ......................................................................................................................................86
QUARTERLY CURRENCY CORRELATION .......................................................................................87
MONTHLY LEVEL ..............................................................................................................................................87
MONTHLY ANALYSIS PERSPECTIVE ...................................................................................................87
MONTHLY BROADER TREND VIEW ...................................................................................................88
MONTHLY TURNING POINTS .................................................................................................................88
MONTHLY DIRECTIONAL CHANGES ...............................................................................................89
MONTHLY VOLATILITY ..............................................................................................................................89
MONTHLY BULLISH REVERSALS ...........................................................................................................89
MONTHLY BEARISH REVERSALS ..........................................................................................................89
HEDGING MODEL ......................................................................................................................................89
MONTHLY CURRENCY CORRELATION...........................................................................................90
MARKET RISK FACTOR .............................................................................................................................91
MALAYSIA STOCK INDEX CASH ..................................................................................................................92
YEARLY ANALYSIS PERSPECTIVE .............................................................................................................93
YEARLY TECHNICAL ANALYSIS ...........................................................................................................94
YEARLY TIMING ANALYSIS .....................................................................................................................94
YEARLY DIRECTIONAL CHANGES .....................................................................................................95
YEARLY VOLATILITY ....................................................................................................................................95
YEARLY PANIC CYCLES ..........................................................................................................................95
THE BROADER LONGER-TERM VIEW...............................................................................................95
INDICATING RANGE STUDY .................................................................................................................95
TRADING ENVELOPE STUDY .................................................................................................................96
STOCHASTICS................................................................................................................................................96
ENERGY MODELS .......................................................................................................................................96
YEARLY FIBONACCI PROJECTIONS IN TIME ...............................................................................96
YEARLY FIBONACCI RETRACEMENTS & PERCENTAGE MOVEMENTS ..........................97
ECONOMIC CONFIDENCE MODEL CORRELATION .............................................................97
YEARLY CURRENCY CORRELATION ................................................................................................98
QUARTERLY ANALYSIS PERSPECTIVE....................................................................................................98
HEDGING MODEL ......................................................................................................................................99
QUARTERLY CURRENCY CORRELATION .......................................................................................99
MONTHLY LEVEL ........................................................................................................................................... 100
MONTHLY BROADER TREND VIEW ................................................................................................ 100
MONTHLY TURNING POINTS .............................................................................................................. 101
MONTHLY DIRECTIONAL CHANGES ............................................................................................ 101
MONTHLY VOLATILITY ........................................................................................................................... 102
MONTHLY PANIC CYCLES ................................................................................................................. 102
MONTHLY BULLISH REVERSALS ........................................................................................................ 102
MONTHLY BEARISH REVERSALS ....................................................................................................... 102
HEDGING MODEL ................................................................................................................................... 102
MONTHLY CURRENCY CORRELATION........................................................................................ 104
MARKET RISK FACTOR .......................................................................................................................... 104
SINGAPORE CASH SHARE INDEX ............................................................................................................ 105
YEARLY ANALYSIS PERSPECTIVE .......................................................................................................... 106
YEARLY TECHNICAL ANALYSIS ........................................................................................................ 107
YEARLY TIMING ANALYSIS .................................................................................................................. 108
YEARLY DIRECTIONAL CHANGES .................................................................................................. 108
YEARLY VOLATILITY ................................................................................................................................. 108
THE BROADER LONGER-TERM VIEW............................................................................................ 109
INDICATING RANGE STUDY .............................................................................................................. 109
TRADING ENVELOPE STUDY .............................................................................................................. 109
STOCHASTICS............................................................................................................................................. 110
ENERGY MODELS .................................................................................................................................... 110
YEARLY FIBONACCI PROJECTIONS IN TIME ............................................................................ 110
YEARLY FIBONACCI RETRACEMENTS & PERCENTAGE MOVEMENTS ....................... 110
Fibonacci Percentage Golden Ratio Movements: ......................................................... 111
ECONOMIC CONFIDENCE MODEL CORRELATION .......................................................... 111
YEARLY CURRENCY CORRELATION ............................................................................................. 111
QUARTERLY ANALYSIS PERSPECTIVE................................................................................................. 112
HEDGING MODEL ................................................................................................................................... 112
QUARTERLY CURRENCY CORRELATION .................................................................................... 113
MONTHLY LEVEL ........................................................................................................................................... 113
MONTHLY BROADER TREND VIEW ................................................................................................ 113
MONTHLY TURNING POINTS .............................................................................................................. 114
MONTHLY DIRECTIONAL CHANGES ............................................................................................ 114
MONTHLY VOLATILITY ........................................................................................................................... 114
MONTHLY BULLISH REVERSALS ........................................................................................................ 114
MONTHLY BEARISH REVERSALS ....................................................................................................... 114
HEDGING MODEL ................................................................................................................................... 115
MONTHLY CURRENCY CORRELATION........................................................................................ 116
MARKET RISK FACTOR .......................................................................................................................... 116
THAILAND SET INDEX ....................................................................................................................................... 117
YEARLY ANALYSIS PERSPECTIVE .......................................................................................................... 118
YEARLY TECHNICAL ANALYSIS ........................................................................................................ 119
YEARLY TIMING ANALYSIS .................................................................................................................. 119
YEARLY DIRECTIONAL CHANGES .................................................................................................. 120
YEARLY VOLATILITY ................................................................................................................................. 120
THE BROADER LONGER-TERM VIEW............................................................................................ 120
INDICATING RANGE STUDY .............................................................................................................. 120
TRADING ENVELOPE STUDY .............................................................................................................. 121
STOCHASTICS............................................................................................................................................. 121
ENERGY MODELS .................................................................................................................................... 121
REVERSAL COMMENTARY ................................................................................................................. 121
YEARLY FIBONACCI PROJECTIONS IN TIME ............................................................................ 122
YEARLY FIBONACCI RETRACEMENTS & PERCENTAGE MOVEMENTS ....................... 122
Fibonacci Percentage Golden Ratio Movements: ......................................................... 123
ECONOMIC CONFIDENCE MODEL CORRELATION .......................................................... 123
YEARLY CURRENCY CORRELATION ............................................................................................. 123
QUARTERLY ANALYSIS PERSPECTIVE................................................................................................. 124
HEDGING MODEL ................................................................................................................................... 124
QUARTERLY CURRENCY CORRELATION .................................................................................... 125
MONTHLY LEVEL ........................................................................................................................................... 126
MONTHLY BROADER TREND VIEW ................................................................................................ 126
MONTHLY TURNING POINTS .............................................................................................................. 127
MONTHLY DIRECTIONAL CHANGES ............................................................................................ 127
MONTHLY VOLATILITY ........................................................................................................................... 128
MONTHLY BULLISH REVERSALS ........................................................................................................ 128
MONTHLY BEARISH REVERSALS ....................................................................................................... 128
HEDGING MODEL ................................................................................................................................... 128
Monthly Level ........................................................................................................................................... 129
MONTHLY CURRENCY CORRELATION........................................................................................ 129
MARKET RISK FACTOR .......................................................................................................................... 130
TAIWAN STOCK INDEX CASH .................................................................................................................... 131
YEARLY ANALYSIS PERSPECTIVE .......................................................................................................... 133
YEARLY TECHNICAL ANALYSIS ........................................................................................................ 133
YEARLY TIMING ANALYSIS .................................................................................................................. 134
YEARLY DIRECTIONAL CHANGES .................................................................................................. 134
YEARLY VOLATILITY ................................................................................................................................. 134
YEARLY PANIC CYCLES ....................................................................................................................... 135
THE BROADER LONGER-TERM VIEW............................................................................................ 135
YEARLY OUTSIDE COMMENT ............................................................................................................ 135
INDICATING RANGE STUDY .............................................................................................................. 135
TRADING ENVELOPE STUDY .............................................................................................................. 136
STOCHASTICS............................................................................................................................................. 136
ENERGY MODELS .................................................................................................................................... 136
REVERSAL COMMENTARY ................................................................................................................. 136
YEARLY FIBONACCI PROJECTIONS IN TIME ............................................................................ 136
YEARLY FIBONACCI RETRACEMENTS & PERCENTAGE MOVEMENTS ....................... 137
Fibonacci Percentage Golden Ratio Movements: ......................................................... 137
ECONOMIC CONFIDENCE MODEL CORRELATION .......................................................... 137
YEARLY CURRENCY CORRELATION ............................................................................................. 138
QUARTERLY ANALYSIS PERSPECTIVE................................................................................................. 138
HEDGING MODEL ................................................................................................................................... 138
QUARTERLY CURRENCY CORRELATION .................................................................................... 139
MONTHLY LEVEL ........................................................................................................................................... 140
MONTHLY BROADER TREND VIEW ................................................................................................ 140
MONTHLY TURNING POINTS .............................................................................................................. 141
MONTHLY DIRECTIONAL CHANGES ............................................................................................ 141
MONTHLY VOLATILITY ........................................................................................................................... 141
MONTHLY PANIC CYCLES ................................................................................................................. 142
MONTHLY BULLISH REVERSALS ........................................................................................................ 142
MONTHLY BEARISH REVERSALS ....................................................................................................... 142
MONTHLY ANALYSIS PERSPECTIVE ................................................................................................ 142

China & Debt Crisis
HEDGING MODEL ................................................................................................................................... 142
MONTHLY CURRENCY CORRELATION........................................................................................ 144
MARKET RISK FACTOR .......................................................................................................................... 144
Conclusion ........................................................................................................................................................... 145
China & Debt Crisis
1
China & Debt Crisis
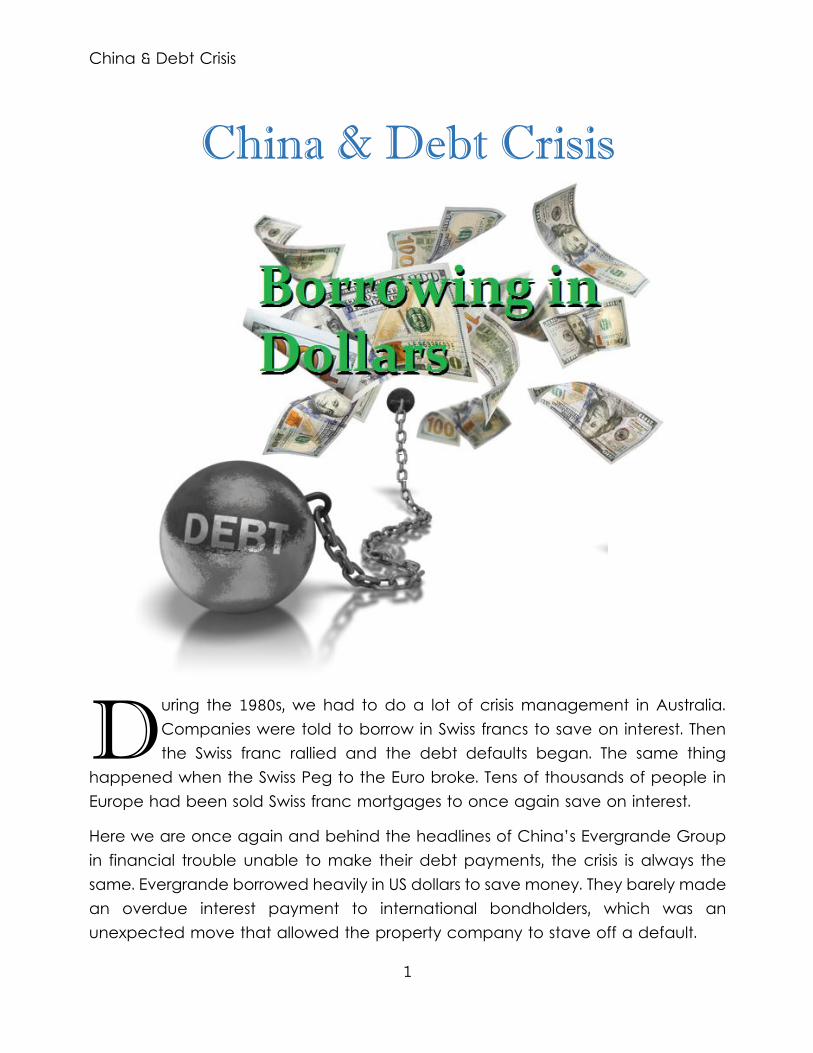
uring the 1980s, we had to do a lot of crisis management in Australia. Companies were told to borrow in Swiss francs to save on interest. Then the Swiss franc rallied and the debt defaults began. The same thing
happened when the Swiss Peg to the Euro broke. Tens of thousands of people in Europe had been sold Swiss franc mortgages to once again save on interest.
Here we are once again and behind the headlines of China’s Evergrande Group in financial trouble unable to make their debt payments, the crisis is always the same. Evergrande borrowed heavily in US dollars to save money. They barely made an overdue interest payment to international bondholders, which was an unexpected move that allowed the property company to stave off a default.
D
China & Debt Crisis
2
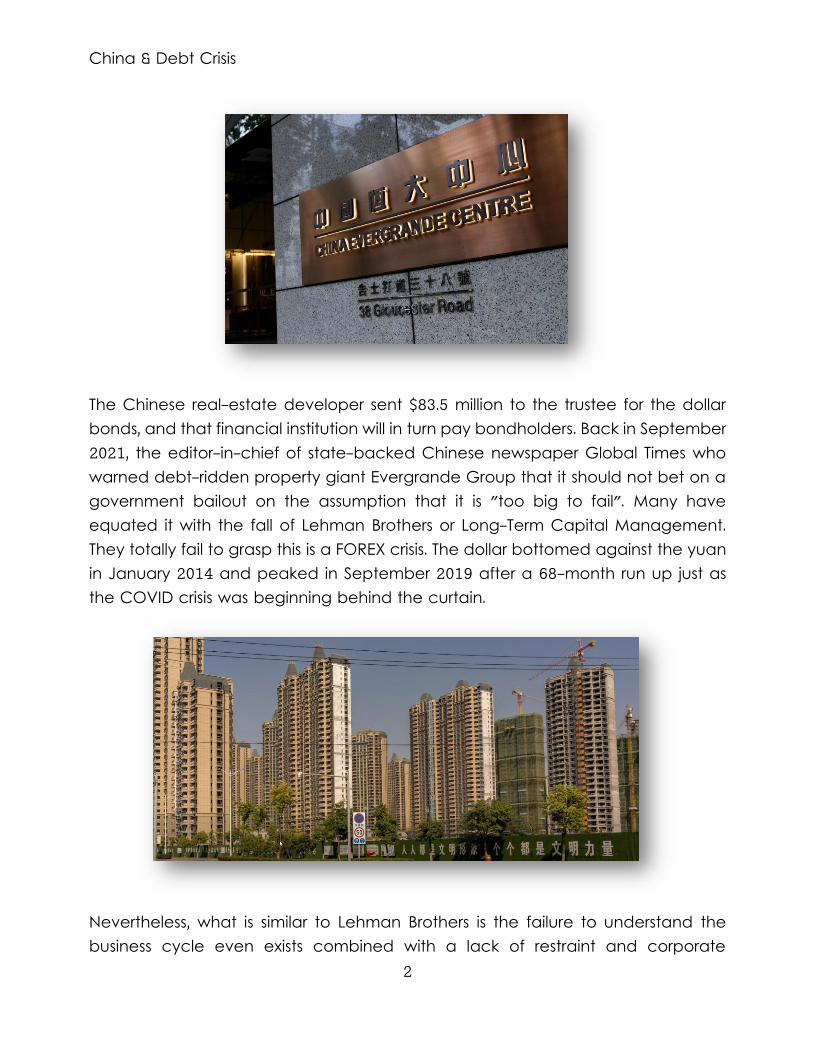
The Chinese real-estate developer sent $83.5 million to the trustee for the dollar bonds, and that financial institution will in turn pay bondholders. Back in September 2021, the editor-in-chief of state-backed Chinese newspaper Global Times who warned debt-ridden property giant Evergrande Group that it should not bet on a government bailout on the assumption that it is "too big to fail". Many have equated it with the fall of Lehman Brothers or Long-Term Capital Management. They totally fail to grasp this is a FOREX crisis. The dollar bottomed against the yuan in January 2014 and peaked in September 2019 after a 68-month run up just as the COVID crisis was beginning behind the curtain.
Nevertheless, what is similar to Lehman Brothers is the failure to understand the business cycle even exists combined with a lack of restraint and corporate
China & Debt Crisis
3
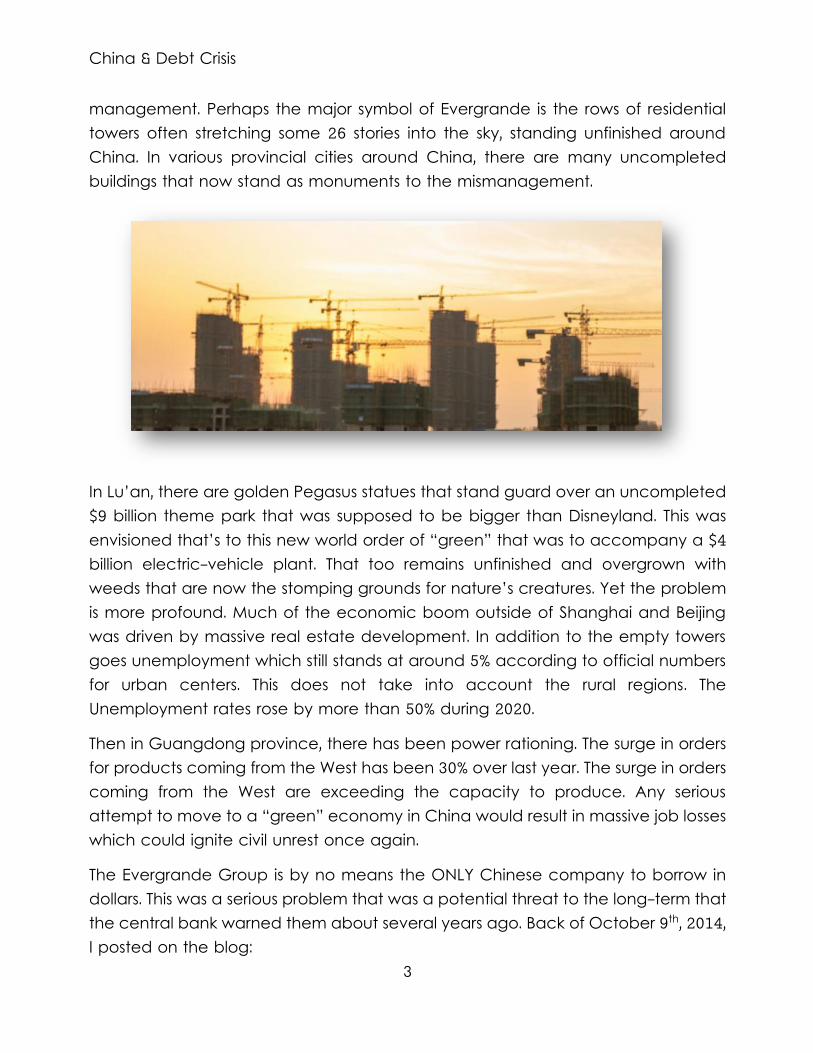
management. Perhaps the major symbol of Evergrande is the rows of residential towers often stretching some 26 stories into the sky, standing unfinished around China. In various provincial cities around China, there are many uncompleted buildings that now stand as monuments to the mismanagement.
In Lu’an, there are golden Pegasus statues that stand guard over an uncompleted $9 billion theme park that was supposed to be bigger than Disneyland. This was envisioned that’s to this new world order of “green” that was to accompany a $4 billion electric-vehicle plant. That too remains unfinished and overgrown with weeds that are now the stomping grounds for nature’s creatures. Yet the problem is more profound. Much of the economic boom outside of Shanghai and Beijing was driven by massive real estate development. In addition to the empty towers goes unemployment which still stands at around 5% according to official numbers for urban centers. This does not take into account the rural regions. The Unemployment rates rose by more than 50% during 2020.
Then in Guangdong province, there has been power rationing. The surge in orders for products coming from the West has been 30% over last year. The surge in orders coming from the West are exceeding the capacity to produce. Any serious attempt to move to a “green” economy in China would result in massive job losses which could ignite civil unrest once again.
The Evergrande Group is by no means the ONLY Chinese company to borrow in dollars. This was a serious problem that was a potential threat to the long-term that the central bank warned them about several years ago. Back of October 9th, 2014, I posted on the blog:
China & Debt Crisis
4
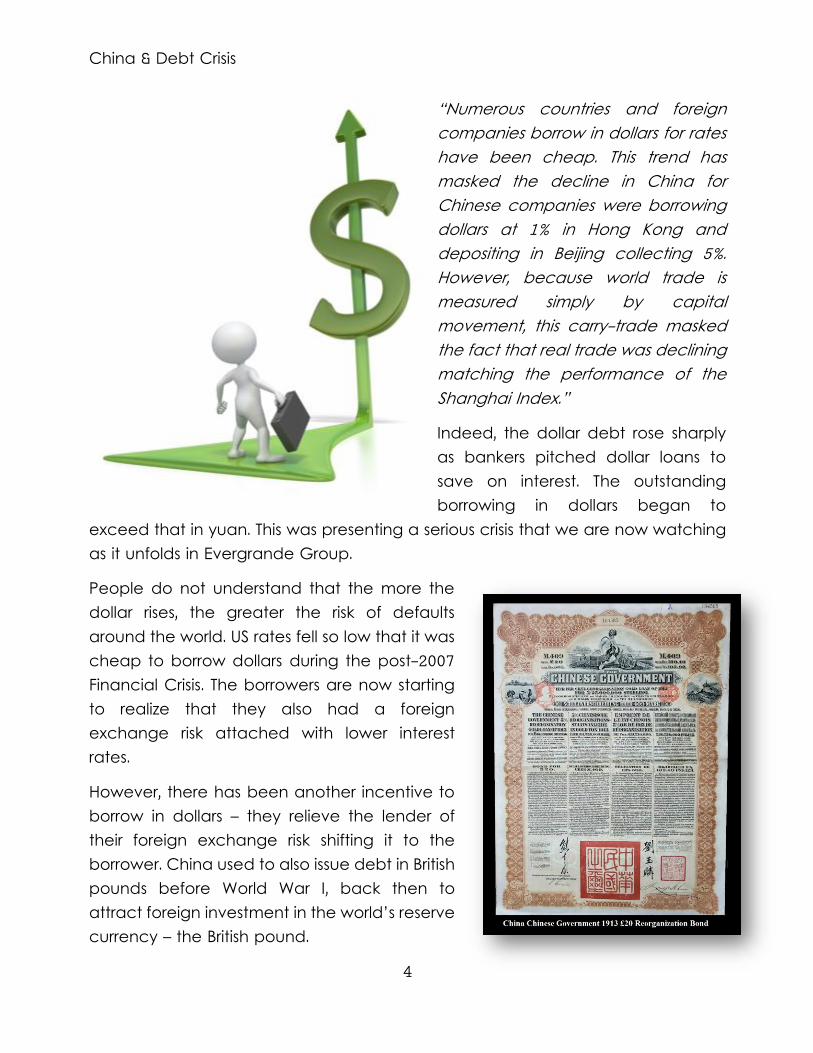
“Numerous countries and foreign companies borrow in dollars for rates have been cheap. This trend has masked the decline in China for Chinese companies were borrowing dollars at 1% in Hong Kong and depositing in Beijing collecting 5%. However, because world trade is measured simply by capital movement, this carry-trade masked the fact that real trade was declining matching the performance of the Shanghai Index.”
Indeed, the dollar debt rose sharply as bankers pitched dollar loans to save on interest. The outstanding borrowing in dollars began to
exceed that in yuan. This was presenting a serious crisis that we are now watching as it unfolds in Evergrande Group.
People do not understand that the more the dollar rises, the greater the risk of defaults around the world. US rates fell so low that it was cheap to borrow dollars during the post-2007 Financial Crisis. The borrowers are now starting to realize that they also had a foreign exchange risk attached with lower interest rates.
However, there has been another incentive to borrow in dollars – they relieve the lender of their foreign exchange risk shifting it to the borrower. China used to also issue debt in British pounds before World War I, back then to attract foreign investment in the world’s reserve currency – the British pound.
China & Debt Crisis
5
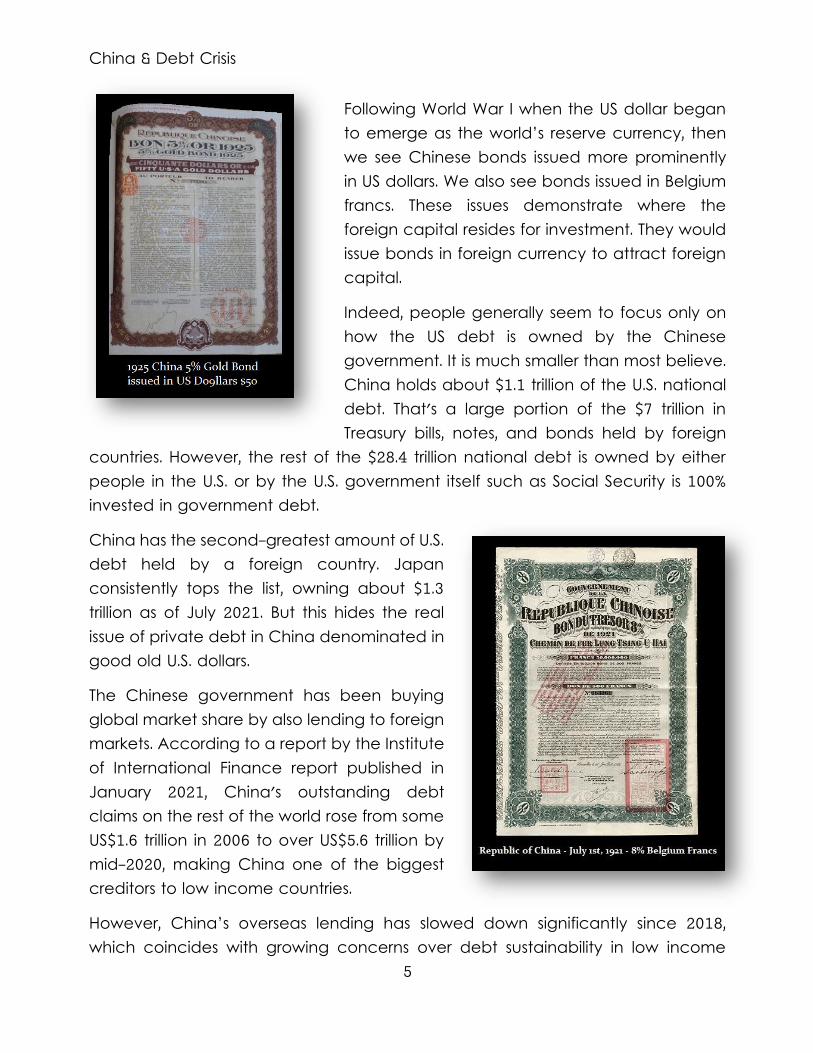
Following World War I when the US dollar began to emerge as the world’s reserve currency, then we see Chinese bonds issued more prominently in US dollars. We also see bonds issued in Belgium francs. These issues demonstrate where the foreign capital resides for investment. They would issue bonds in foreign currency to attract foreign capital.
Indeed, people generally seem to focus only on how the US debt is owned by the Chinese government. It is much smaller than most believe. China holds about $1.1 trillion of the U.S. national debt. That's a large portion of the $7 trillion in Treasury bills, notes, and bonds held by foreign
countries. However, the rest of the $28.4 trillion national debt is owned by either people in the U.S. or by the U.S. government itself such as Social Security is 100% invested in government debt.
China has the second-greatest amount of U.S. debt held by a foreign country. Japan consistently tops the list, owning about $1.3 trillion as of July 2021. But this hides the real issue of private debt in China denominated in good old U.S. dollars.
The Chinese government has been buying global market share by also lending to foreign markets. According to a report by the Institute of International Finance report published in January 2021, China's outstanding debt claims on the rest of the world rose from some US$1.6 trillion in 2006 to over US$5.6 trillion by mid-2020, making China one of the biggest creditors to low income countries.
However, China’s overseas lending has slowed down significantly since 2018, which coincides with growing concerns over debt sustainability in low income
China & Debt Crisis
6
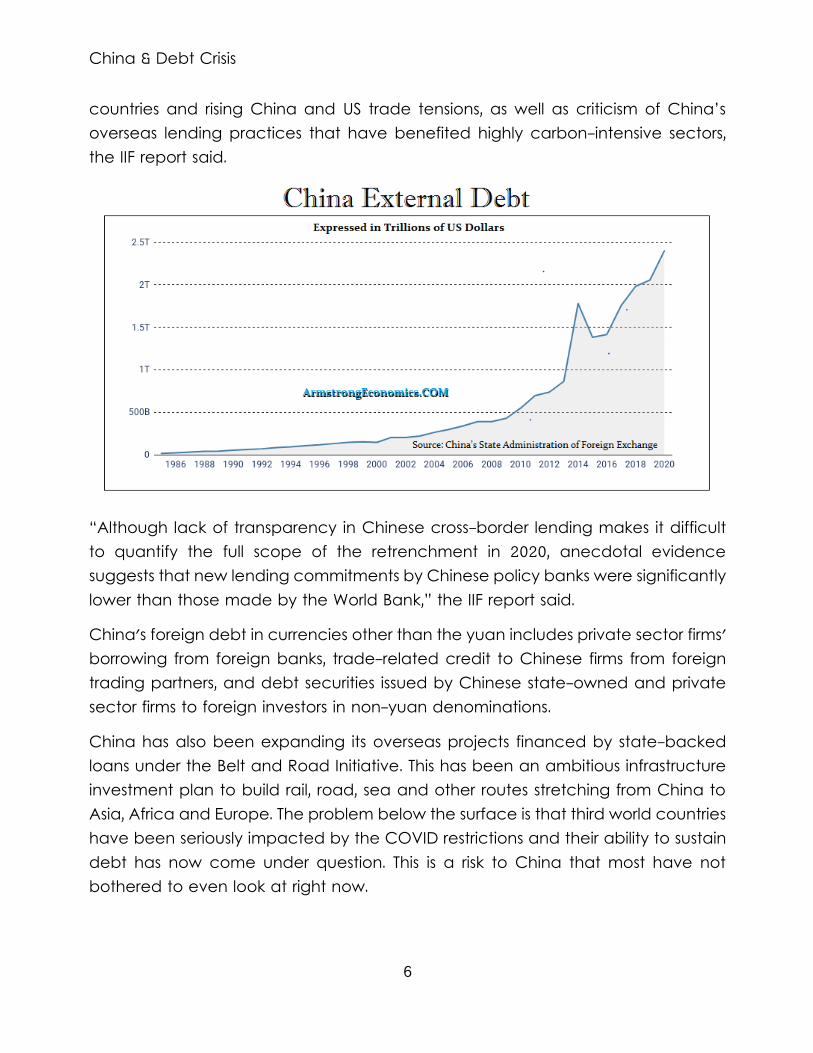
countries and rising China and US trade tensions, as well as criticism of China’s overseas lending practices that have benefited highly carbon-intensive sectors, the IIF report said.
“Although lack of transparency in Chinese cross-border lending makes it difficult to quantify the full scope of the retrenchment in 2020, anecdotal evidence suggests that new lending commitments by Chinese policy banks were significantly lower than those made by the World Bank,” the IIF report said.
China's foreign debt in currencies other than the yuan includes private sector firms' borrowing from foreign banks, trade-related credit to Chinese firms from foreign trading partners, and debt securities issued by Chinese state-owned and private sector firms to foreign investors in non-yuan denominations.
China has also been expanding its overseas projects financed by state-backed loans under the Belt and Road Initiative. This has been an ambitious infrastructure investment plan to build rail, road, sea and other routes stretching from China to Asia, Africa and Europe. The problem below the surface is that third world countries have been seriously impacted by the COVID restrictions and their ability to sustain debt has now come under question. This is a risk to China that most have not bothered to even look at right now.
China & Debt Crisis
7
China's outstanding debt claims on the rest of the world increased from about US$1.6 trillion in 2006 to more than US$5.6 trillion as of mid-2020, making China one of the biggest creditors to low-income countries. This is the devil in the details. Combine this with the fact that China's debt levels also rose significantly during 2020 as a result of looser fiscal policy in an effort to help revive the coronavirus-hit economy. Interestingly, the Chinese government has since said debt reduction is now a priority in preventing more bad debt from building up. What we have to understand is that most of the people in the central bank actually have experience rather than just academic degrees. My meetings with the People's Bank of China were a real eye-opener contrary to the West which is plagued by academics has only increased the risk for the years ahead.
Household debt to GDP declined for the first time on a quarterly basis since 2012. This is also warning that we have a trend toward stagflation thanks to COVID regulations worldwide that ensures costs will rise faster than economic growth. The peak in 2020 reached 62.2% at the end of that year. The decline began during the first quarter of 2021. Within the household debt category, consumer loans rose from 13.4% in late 2020 to 13.9% during the first quarter of 2021. This is again warning that we are expecting a decline in real economic growth even in China.
China & Debt Crisis
8
Public debt to GDP fell the most in the first quarter of 2021 which was the sharpest decline of all debt sectors declining from 25.6% at the end of 2020 to 24.7% during the first quarter of 2021. When we look at the outstanding foreign debt, which includes US dollar debt, this reached the staggering level of US$2.4 trillion at the end of 2020. This was a sharp increase of 4% compared with the total at the end of September 2020. Once again, we see debt rising sharply with economic growth decline.
Most of China's local government debt is held by state-owned or state-controlled financial institutions as is the case in the United States. China's local governments have relied on off-balance-sheet borrowing through local government financing vehicles (LGFVs) which most of these are not reported lacking any transparency. Even Standard & Poor's ventured an estimate back in 2018 that this might be in the area of 30 to 40 trillion yuan which would be about $ 6.265 trillion approaching the level of the U.S. national debt by itself. Nonetheless, according to the Ministry of Finance, outstanding local government debt totaled 26.6 trillion yuan at the end of April 2021, or about $4.1 trillion.
Chinese sovereign debt is normally held by domestic institutional investors such as policy banks and commercial banks that are typically state-owned. This is a similar situation in the West where reserves of banks must be held in government bonds. However, in China, these banks’ investment and lending practices support government policies.
China & Debt Crisis
9
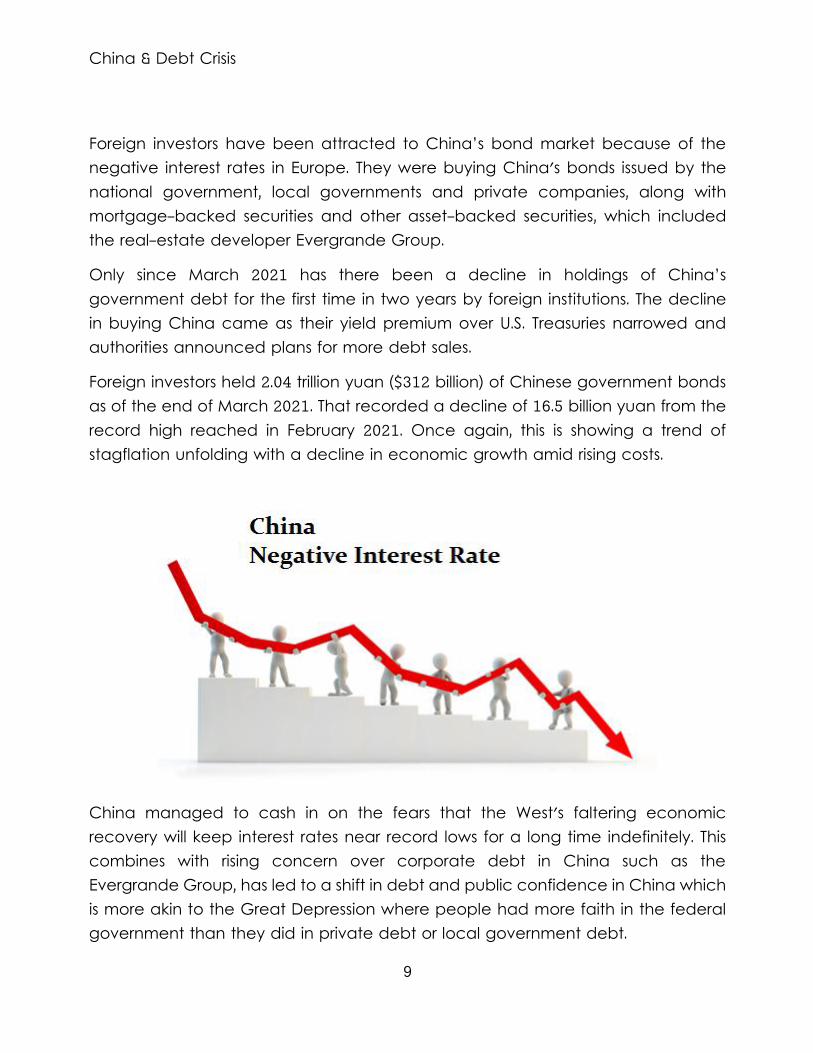
Foreign investors have been attracted to China’s bond market because of the negative interest rates in Europe. They were buying China's bonds issued by the national government, local governments and private companies, along with mortgage-backed securities and other asset-backed securities, which included the real-estate developer Evergrande Group.
Only since March 2021 has there been a decline in holdings of China’s government debt for the first time in two years by foreign institutions. The decline in buying China came as their yield premium over U.S. Treasuries narrowed and authorities announced plans for more debt sales.
Foreign investors held 2.04 trillion yuan ($312 billion) of Chinese government bonds as of the end of March 2021. That recorded a decline of 16.5 billion yuan from the record high reached in February 2021. Once again, this is showing a trend of stagflation unfolding with a decline in economic growth amid rising costs.
China managed to cash in on the fears that the West's faltering economic recovery will keep interest rates near record lows for a long time indefinitely. This combines with rising concern over corporate debt in China such as the Evergrande Group, has led to a shift in debt and public confidence in China which is more akin to the Great Depression where people had more faith in the federal government than they did in private debt or local government debt.
China & Debt Crisis
10
The Chinese government issued debt at a negative interest rate for the first time in November 2020 in a bond sale that attracted significant investor interest. Deutsche Bank (DB) was one of the banks that helped arrange the transaction. Interestingly, European investors bought the bulk of the Chinese sovereign debt as they seek to gain exposure to the only major global economy expected to grow this year.
The Chinese sale, which attracted final orders of about €16 billion ($18.9 billion) for the €4 billion ($4.7 billion) worth of bonds on offer, included 5-year debt priced with a yield of minus 0.152%. China also sold 10-year and 15-year bonds with yields below 1%. The buyers were central banks, sovereign wealth funds, and global asset managers trying to diversify out of Europe. European investors accounted for 85% of the 15-year debt and about two thirds of the shorter-dated bonds, according to Deutsche Bank.
European investors seized the opportunity to invest in debt at yields higher than what's available in Europe, where the central bank has slashed interest rates to record lows and pumped over one trillion euros into financial markets to cushion the blow from the pandemic. Yields on five-year German government bonds fell to around a negative 0.75%. The deep concerns rising in the Eurozone over the decline in human rights and the forced lockdowns have severely damaged the future expectations of any economic recovery before 2024.
China & Debt Crisis
11
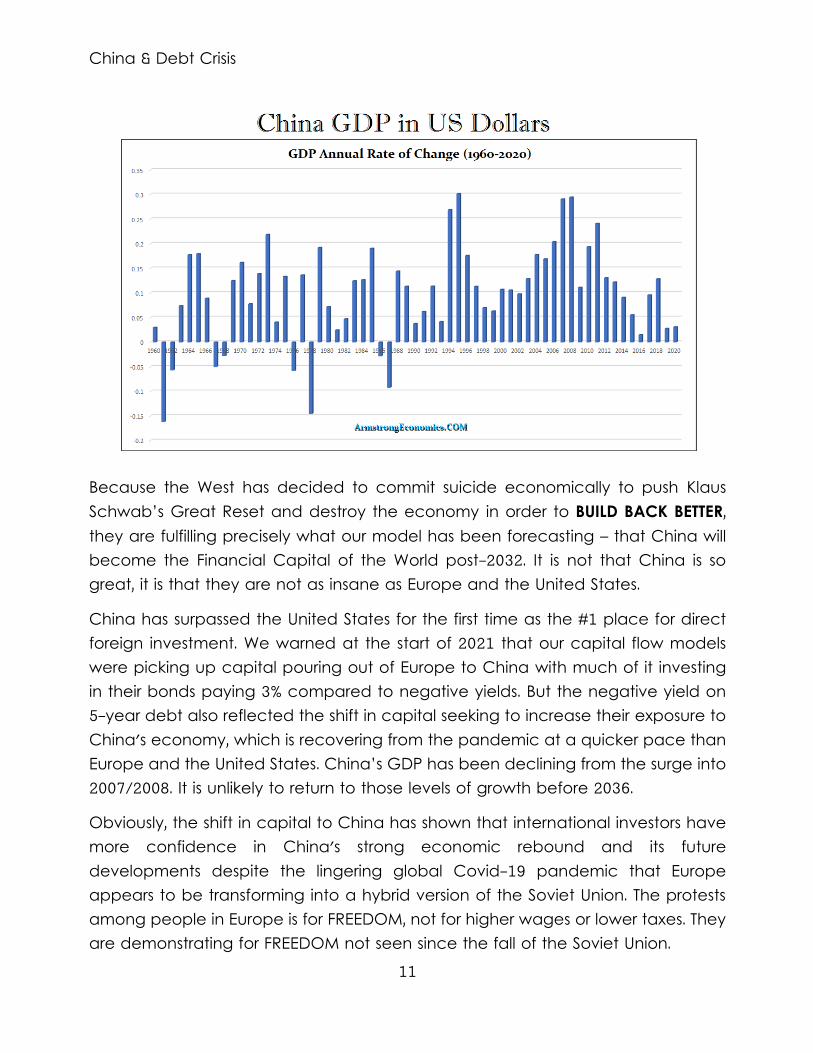
Because the West has decided to commit suicide economically to push Klaus Schwab’s Great Reset and destroy the economy in order to BUILD BACK BETTER, they are fulfilling precisely what our model has been forecasting – that China will become the Financial Capital of the World post-2032. It is not that China is so great, it is that they are not as insane as Europe and the United States.
China has surpassed the United States for the first time as the #1 place for direct foreign investment. We warned at the start of 2021 that our capital flow models were picking up capital pouring out of Europe to China with much of it investing in their bonds paying 3% compared to negative yields. But the negative yield on 5-year debt also reflected the shift in capital seeking to increase their exposure to China's economy, which is recovering from the pandemic at a quicker pace than Europe and the United States. China’s GDP has been declining from the surge into 2007/2008. It is unlikely to return to those levels of growth before 2036.
Obviously, the shift in capital to China has shown that international investors have more confidence in China's strong economic rebound and its future developments despite the lingering global Covid-19 pandemic that Europe appears to be transforming into a hybrid version of the Soviet Union. The protests among people in Europe is for FREEDOM, not for higher wages or lower taxes. They are demonstrating for FREEDOM not seen since the fall of the Soviet Union.

China & Debt Crisis
12
Asia's economies are bouncing back while the West is headed in the exact opposite direction. Following a historic contraction in the first quarter of 2020, China's economy has rebounded rapidly, with industrial production and retail sales increasing strongly. Meanwhile, restrictions in Europe with restricting movement and demanding there is to be a COVID pass when in fact being vaccinated neither prevents getting COVID nor spreads it. There is no medical logic behind this restriction and it appears that the objective is to simply to further the destruction of the economy as set forth by Klaus Schwab’s World Economic Forum Agenda 2030 to build back better.
The United States has a more difficult time for the President lacks the same level of power that is taking place in Europe. Hence, Biden cannot mandate for the entire country.
China & Debt Crisis
13
The Chinese bond market is now the second-largest behind that of the United States. Since 2016, China has become accessible to foreign investors through government-controlled schemes such as the Bond Connect program and the Qualified Foreign Institutional Investor scheme.
Foreign investors, including wealth managers, mutual funds, family offices and hedge funds, held 3.62 trillion yuan worth of Chinese bonds at the end of April, making up around 3.4% of all bonds traded in the interbank market of which 58% are federal and just less than 30% were policy bank bonds, according to data from the People's Bank of China.
China's domestic debt has been growing faster than GDP and to counter that trend during the Great Financial Crisis of 2007-2009, Beijing unleashed a 4 trillion-yuan (US$586 billion) stimulus package in 2008 to boost its economy. That only led to a surge in borrowing by local governments and state-owned firms. By 2016, China was trying to reduce financial risks promoted by its central bank. The 2020 COVID Pandemic sharply reduced world trade which only sent its debt to GDP rising once again.
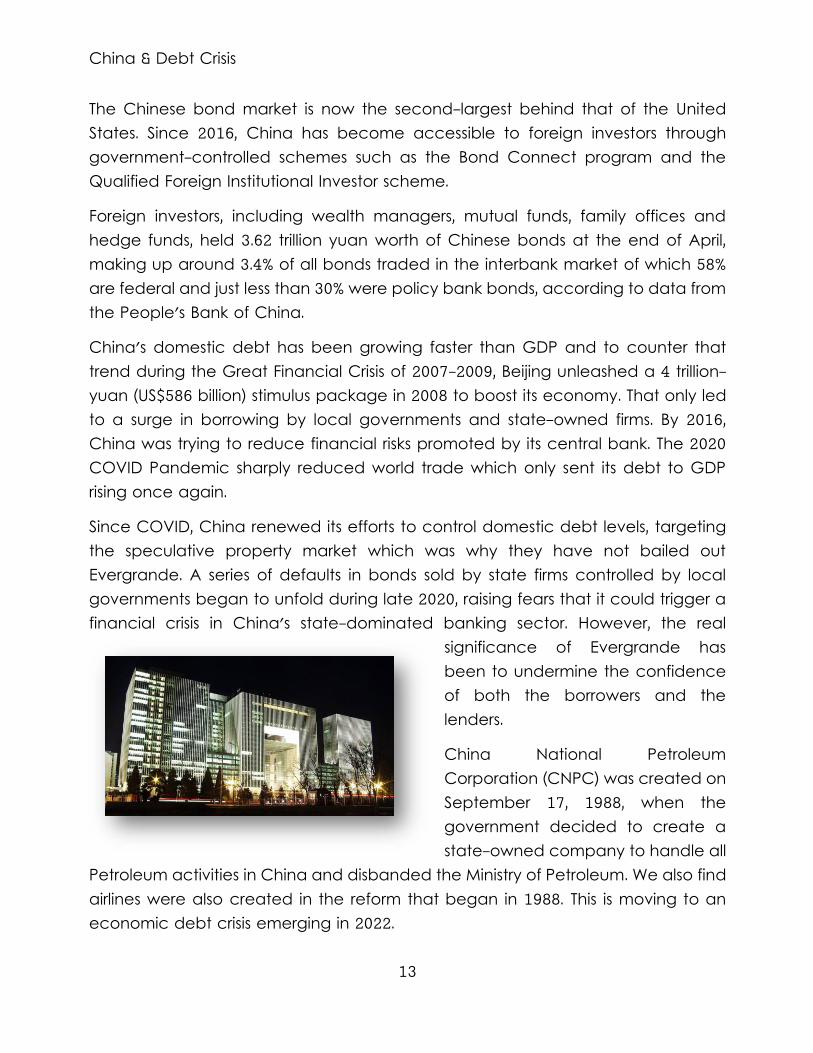
Since COVID, China renewed its efforts to control domestic debt levels, targeting the speculative property market which was why they have not bailed out Evergrande. A series of defaults in bonds sold by state firms controlled by local governments began to unfold during late 2020, raising fears that it could trigger a financial crisis in China's state-dominated banking sector. However, the real
significance of Evergrande has been to undermine the confidence of both the borrowers and the lenders.
China National Petroleum Corporation (CNPC) was created on September 17, 1988, when the government decided to create a state-owned company to handle all
Petroleum activities in China and disbanded the Ministry of Petroleum. We also find airlines were also created in the reform that began in 1988. This is moving to an economic debt crisis emerging in 2022.

China & Debt Crisis
14
China's external debt level is tied to its foreign policy objectives under the Belt and Road Initiative. Yet China's increasing overseas lending has raised questions about whether it should continue to receive loans from the World Bank as a developing country.
The United States, as the largest shareholder of the World Bank, has objected to lending anything to China. The World Bank has criticized China's lending efforts to fund its belt and road infrastructure projects, saying the loans leave weaker countries with "excessive debt and low-quality projects".
Just this past April 2021, China's finance minister, Liu Kun, Malpass stressed that it was important to find "lasting solutions to the unsustainable debt burdens of the world's poorest countries", urging China to focus on "debt transparency and the need for full participation in debt treatments by bondholders and private creditors, as well as all official bilateral creditors".
Therefore, the Debt Crisis emerging in China has a two-prong problem. As they have lent to third world countries to create their new modern version of the silk road, such countries are unable to sustain those debts. Then there has been the extensive dollar denominated debt taken on by Chinese companies assuming the low US rates were a bargain without understanding FX risk.
China & Debt Crisis
15
This is what I have been warning about. As Europe continues to lose GDP because it is following the 2030 Agenda of Schwab, there is little hope that the European economy will reach bottom before 2038. The long-term damage is significant and it will not be easy to rebuild.
Those who constantly harp about the dollar and U.S. debt being the worst by size while ignoring the ability to service that debt, the risk of a dollar rally remains intact and that presents FX risk to China.
A rise in the dollar means trade friction, protectionism, and emerging market crisis of debt defaults all combine to create the worst-case scenario into the future. As the defaults mount, the dollar will be sent even higher. Add the instability of the Eurozone, and you end up with dollar vertigo!!!!

China’s Property Boom
16
China’s Property Boom
he Real Estate Boom in China has baffled just about every analyst on the face of the earth chalking it up to just a speculative bubble like the tulips. But now they have also been stunned by the sharp rise in real estate
around the world thanks to COVID. There is a common thread that run through all of this – the alternative to government.
In China, people coming out of communism had the opportunity to own property and thus it unfolded as a mad rush. The communism revolution in Russia was really successful because the people were emerging out of serfdom in 1861 and this owned nothing. The idea of just confiscating all the property and reallocating it sounded like a nice solution. The problem was, it took experience to manage the food production not bureaucrats simply making rules.
The peak in property development ran its course. From the reforms of the late 1980s, the property boom in China ran the full course of 31.4 years – a Pi Cycle. This has run its course and the excitement of owning something in China is starting to fade and bring this with it, the real estate developers.
T
China’s Property Boom
17
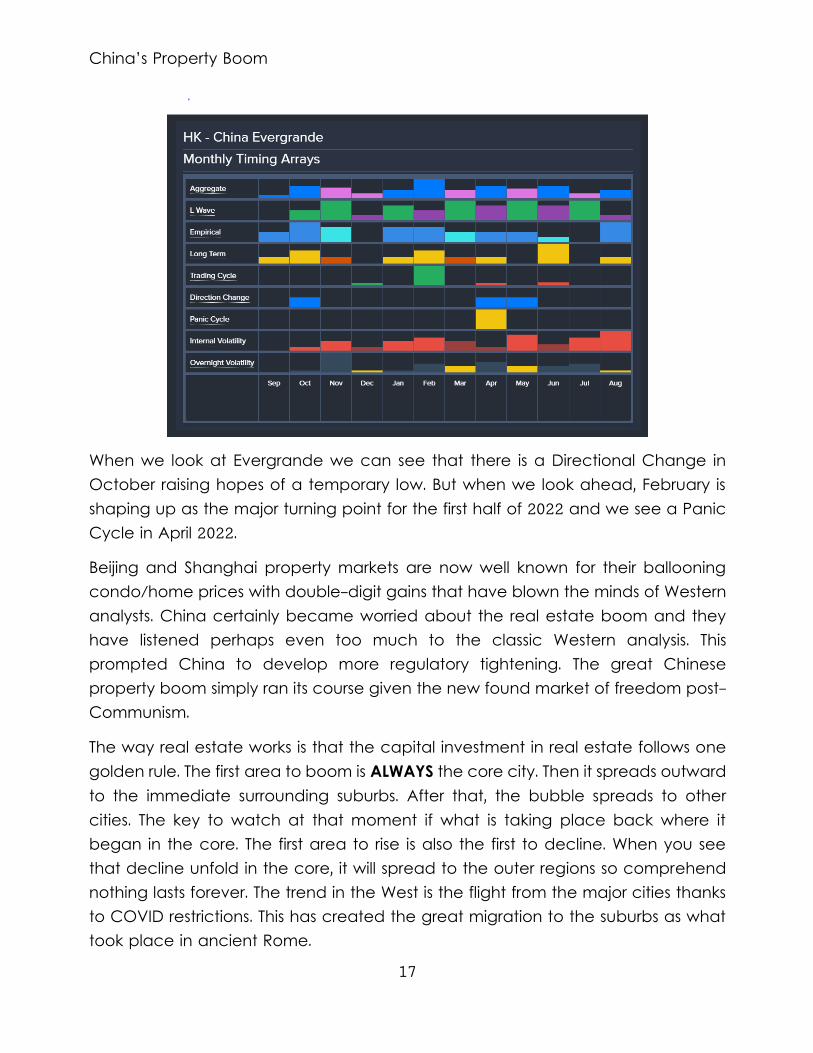
When we look at Evergrande we can see that there is a Directional Change in October raising hopes of a temporary low. But when we look ahead, February is shaping up as the major turning point for the first half of 2022 and we see a Panic Cycle in April 2022.
Beijing and Shanghai property markets are now well known for their ballooning condo/home prices with double-digit gains that have blown the minds of Western analysts. China certainly became worried about the real estate boom and they have listened perhaps even too much to the classic Western analysis. This prompted China to develop more regulatory tightening. The great Chinese property boom simply ran its course given the new found market of freedom post-Communism.
The way real estate works is that the capital investment in real estate follows one golden rule. The first area to boom is ALWAYS the core city. Then it spreads outward to the immediate surrounding suburbs. After that, the bubble spreads to other cities. The key to watch at that moment if what is taking place back where it began in the core. The first area to rise is also the first to decline. When you see that decline unfold in the core, it will spread to the outer regions so comprehend nothing lasts forever. The trend in the West is the flight from the major cities thanks to COVID restrictions. This has created the great migration to the suburbs as what took place in ancient Rome.
China’s Property Boom
18
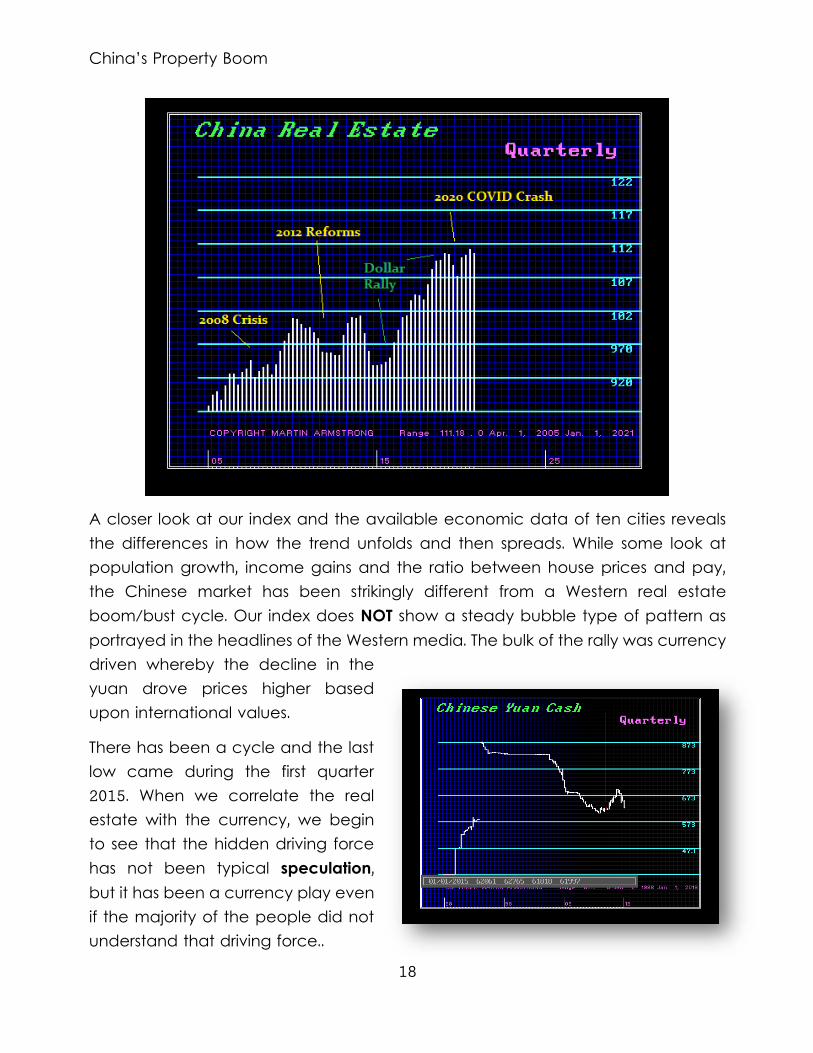
A closer look at our index and the available economic data of ten cities reveals the differences in how the trend unfolds and then spreads. While some look at population growth, income gains and the ratio between house prices and pay, the Chinese market has been strikingly different from a Western real estate boom/bust cycle. Our index does NOT show a steady bubble type of pattern as portrayed in the headlines of the Western media. The bulk of the rally was currency driven whereby the decline in the yuan drove prices higher based upon international values.
There has been a cycle and the last low came during the first quarter 2015. When we correlate the real estate with the currency, we begin to see that the hidden driving force has not been typical speculation, but it has been a currency play even if the majority of the people did not understand that driving force..
China’s Property Boom
19
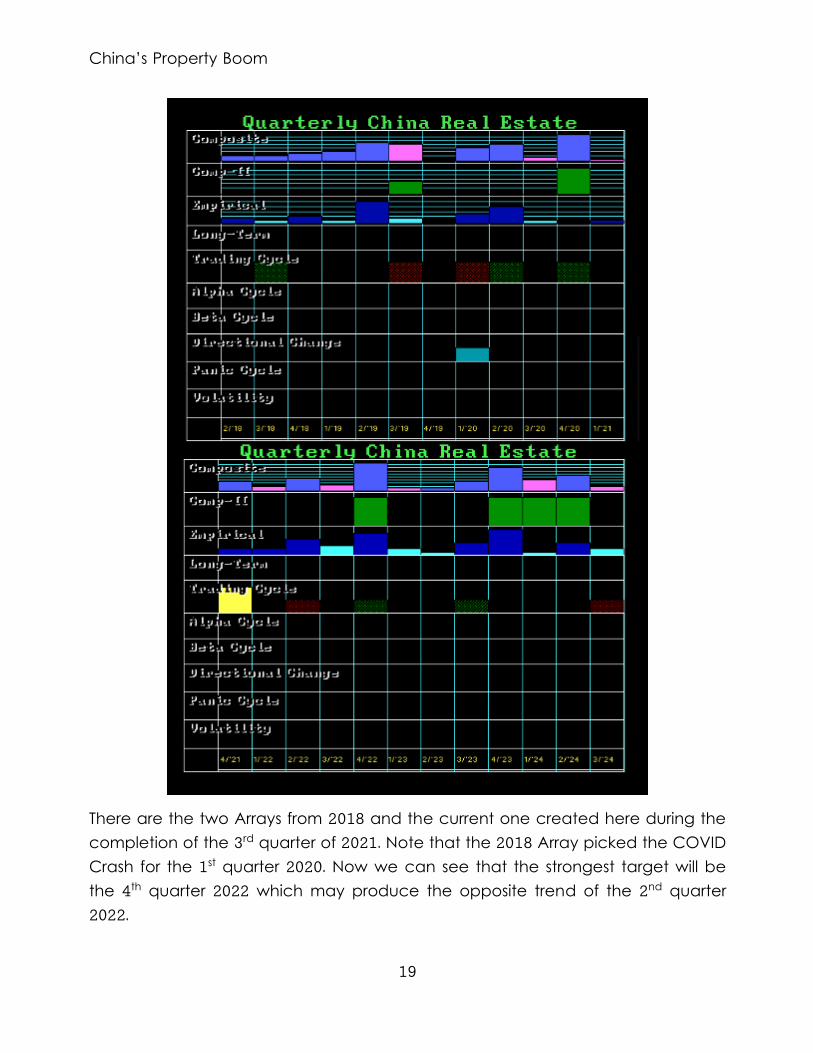
There are the two Arrays from 2018 and the current one created here during the completion of the 3rd quarter of 2021. Note that the 2018 Array picked the COVID Crash for the 1st quarter 2020. Now we can see that the strongest target will be the 4th quarter 2022 which may produce the opposite trend of the 2nd quarter 2022.
China’s Property Boom
20
The main driving force in China that has sent capital running into property has also been the desire to get off the grid. President Xi Jinping reiterating that “houses are built to be lived in, not for speculation”. We should expect that this will now prepare to correct and that the advance has been slowing.
The government has been monitoring some 70 regional real estate markets very closely on the basis of their national or regional relevance, how the economic factors perform could indicate which are more at risk from a sudden reversal of property-market fortunes.
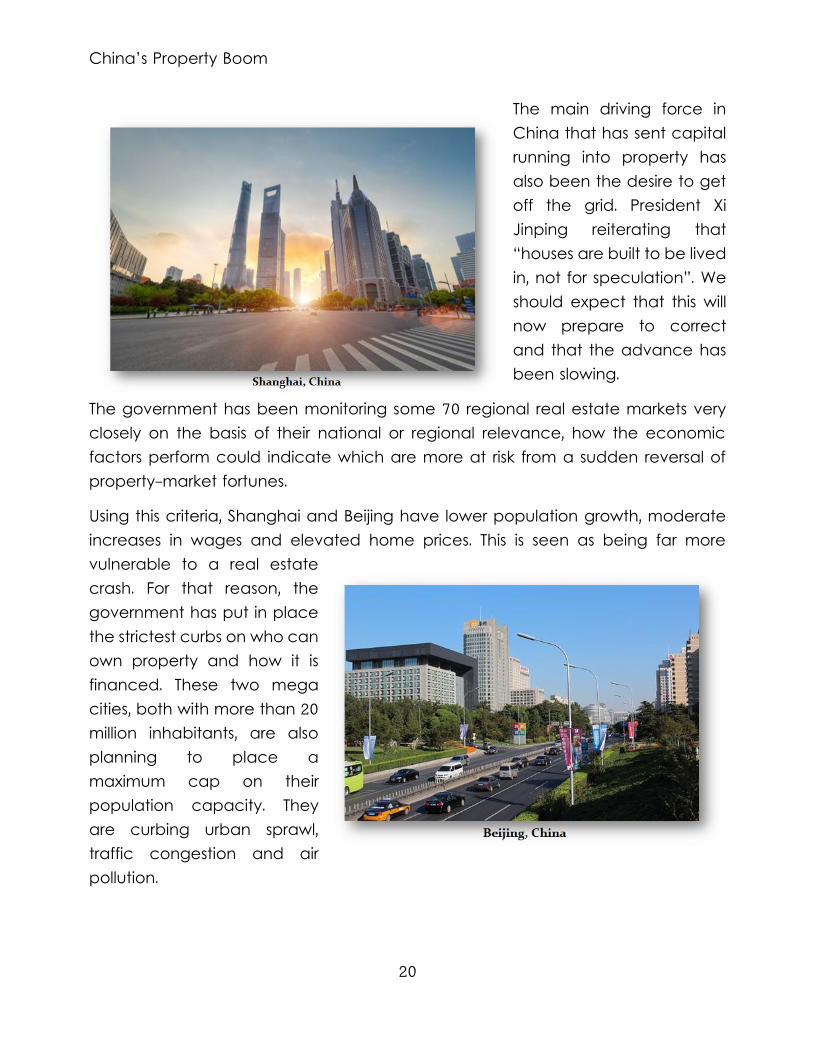
Using this criteria, Shanghai and Beijing have lower population growth, moderate increases in wages and elevated home prices. This is seen as being far more vulnerable to a real estate crash. For that reason, the government has put in place the strictest curbs on who can own property and how it is financed. These two mega cities, both with more than 20 million inhabitants, are also planning to place a maximum cap on their population capacity. They are curbing urban sprawl, traffic congestion and air pollution.
China’s Property Boom
21
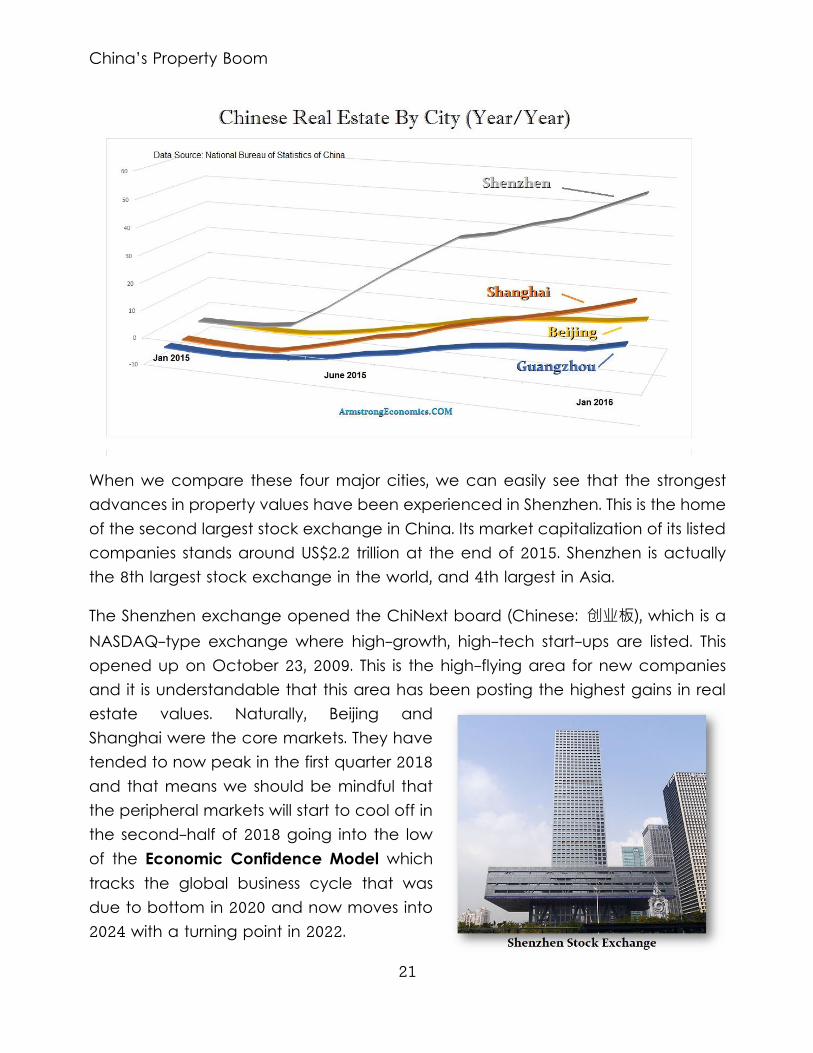
When we compare these four major cities, we can easily see that the strongest advances in property values have been experienced in Shenzhen. This is the home of the second largest stock exchange in China. Its market capitalization of its listed companies stands around US$2.2 trillion at the end of 2015. Shenzhen is actually the 8th largest stock exchange in the world, and 4th largest in Asia.
The Shenzhen exchange opened the ChiNext board (Chinese: 创业板), which is a NASDAQ-type exchange where high-growth, high-tech start-ups are listed. This opened up on October 23, 2009. This is the high-flying area for new companies and it is understandable that this area has been posting the highest gains in real estate values. Naturally, Beijing and Shanghai were the core markets. They have tended to now peak in the first quarter 2018 and that means we should be mindful that the peripheral markets will start to cool off in the second-half of 2018 going into the low of the Economic Confidence Model which tracks the global business cycle that was due to bottom in 2020 and now moves into 2024 with a turning point in 2022.
China’s Property Boom
22
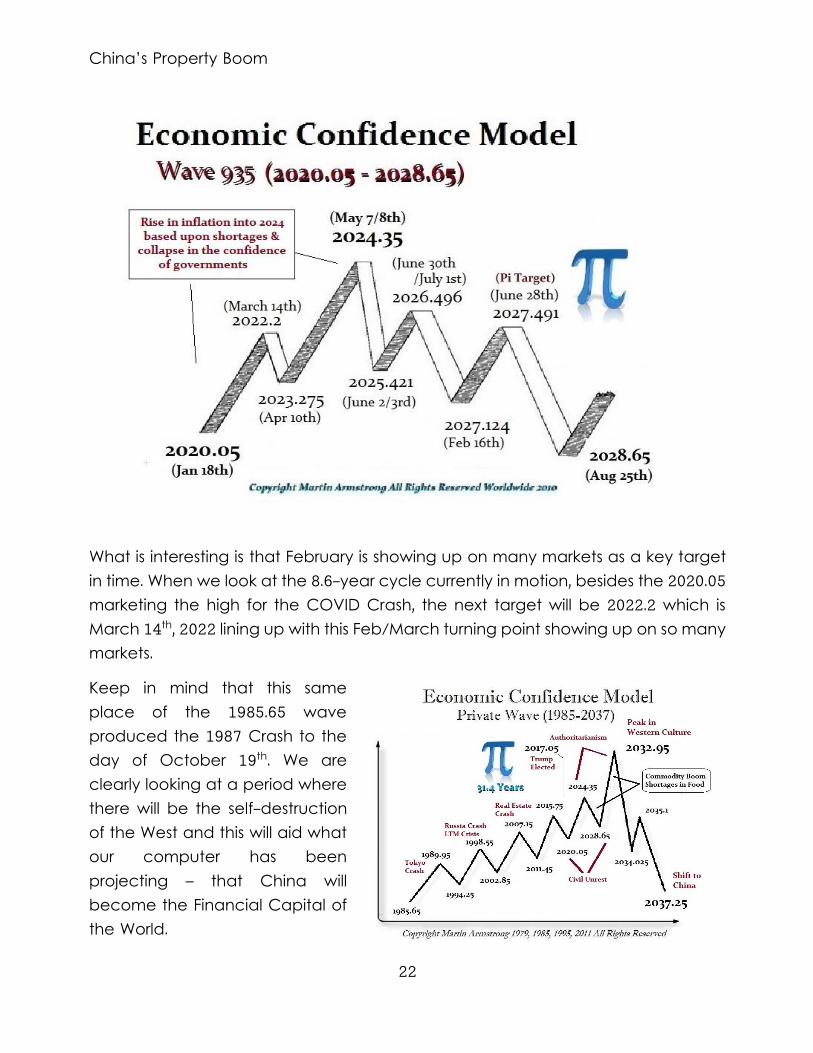
What is interesting is that February is showing up on many markets as a key target in time. When we look at the 8.6-year cycle currently in motion, besides the 2020.05 marketing the high for the COVID Crash, the next target will be 2022.2 which is March 14th, 2022 lining up with this Feb/March turning point showing up on so many markets.
Keep in mind that this same place of the 1985.65 wave produced the 1987 Crash to the day of October 19th. We are clearly looking at a period where there will be the self-destruction of the West and this will aid what our computer has been projecting – that China will become the Financial Capital of the World.
China’s Property Boom
23
China is on its way to reaching the title of the Financial Capital of the World post-2032 and it is becoming self-evident that the West is on its way to create economic suicide, The Financial Capital of the World has always migrated with the rise and fall of empires, nations, and city states. After the fall of Rome in the West, Byzantine survived as the financial Capital of the World until it too committed economic suicide. Then it passed to Asia moving to India, the source of the spice trade. It moved from there to China until it was taken by the British.
Meanwhile, in Europe, the French began to rise under Charlemagne and with the fall of France, there was the rise of the Holy Roman Empire. When the New World was discovered by Columbus, Spain rose to the Financial Capital of the World. The entire reason why Columbus set sail was to find a quicker route to the Financial Capital of the World which was perceived to be India. But Spain became a serial defaulter in 1557 followed by 1570, 1575, 1596, 1607, and 1647 ending in a 3rd world status. The collapse of the Hungary-Austrian Empire took place in 1683 with the Arab siege.
The Financial Capital moved to Germany with the Protestant Reformation and then to the Dutch. They eventually handed that to the British who then in turn lost that title following World War I as it passed to the United States.
China’s Property Boom
24
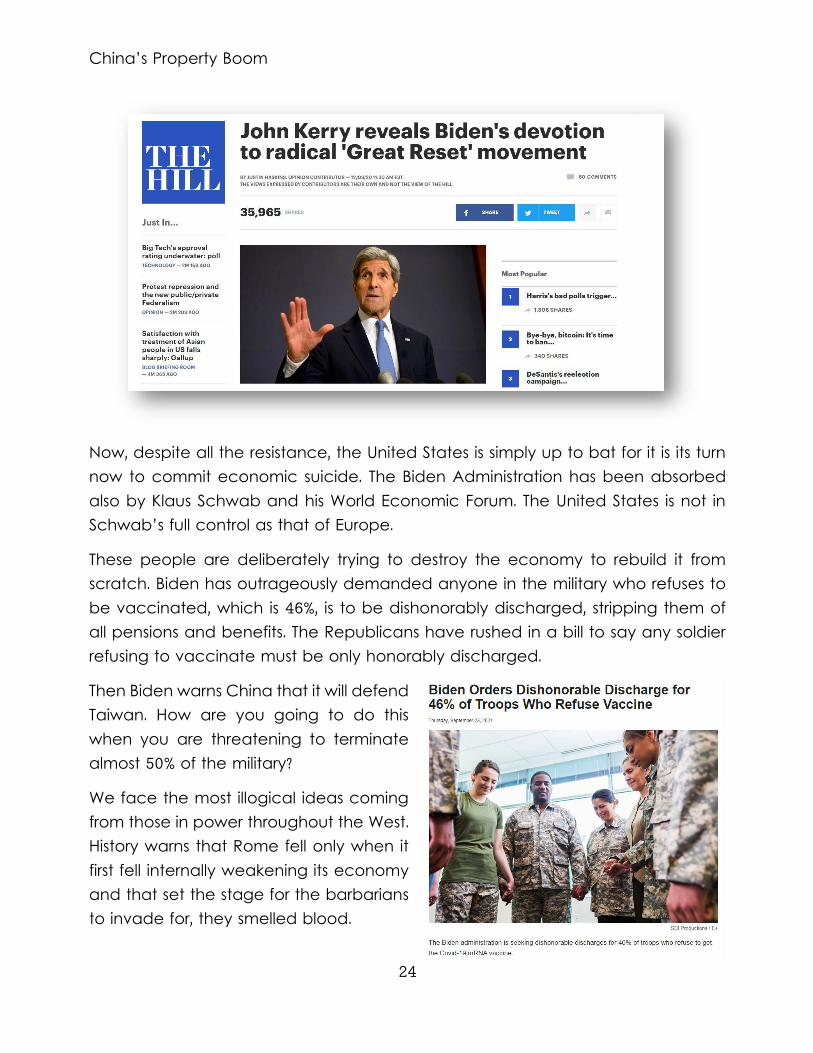
Now, despite all the resistance, the United States is simply up to bat for it is its turn now to commit economic suicide. The Biden Administration has been absorbed also by Klaus Schwab and his World Economic Forum. The United States is not in Schwab’s full control as that of Europe.
These people are deliberately trying to destroy the economy to rebuild it from scratch. Biden has outrageously demanded anyone in the military who refuses to be vaccinated, which is 46%, is to be dishonorably discharged, stripping them of all pensions and benefits. The Republicans have rushed in a bill to say any soldier refusing to vaccinate must be only honorably discharged.
Then Biden warns China that it will defend Taiwan. How are you going to do this when you are threatening to terminate almost 50% of the military?
We face the most illogical ideas coming from those in power throughout the West. History warns that Rome fell only when it first fell internally weakening its economy and that set the stage for the barbarians to invade for, they smelled blood.
China’s Property Boom
25
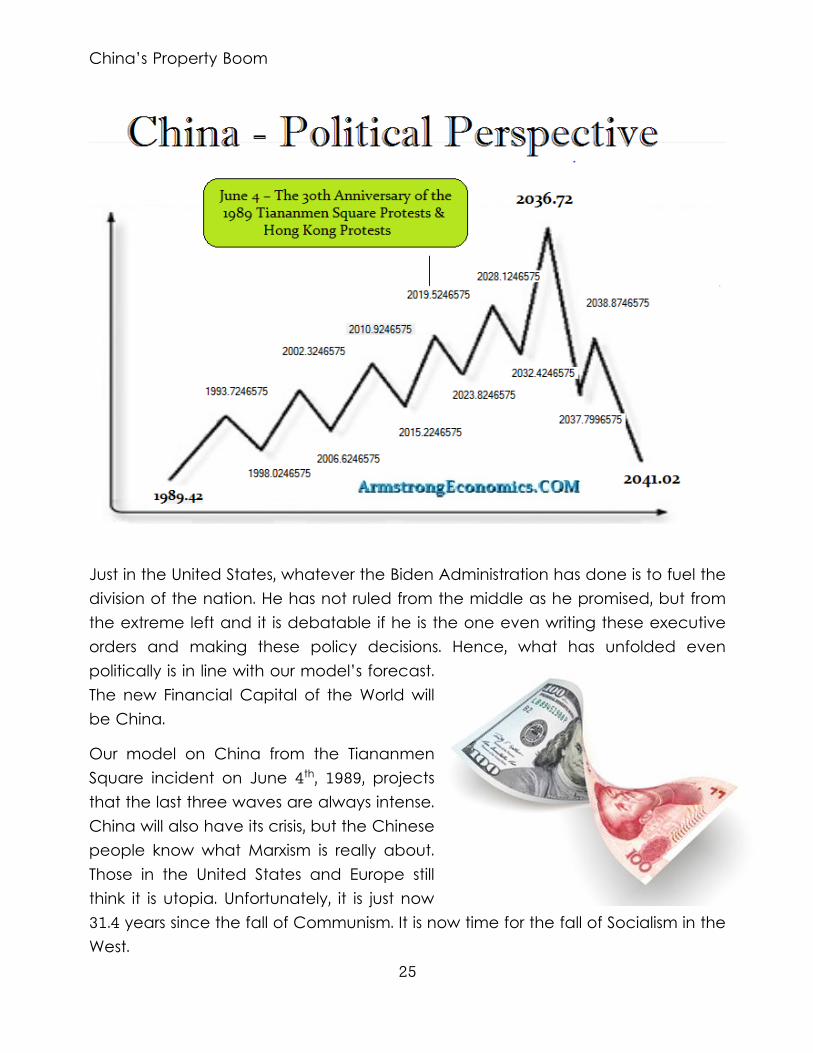
Just in the United States, whatever the Biden Administration has done is to fuel the division of the nation. He has not ruled from the middle as he promised, but from the extreme left and it is debatable if he is the one even writing these executive orders and making these policy decisions. Hence, what has unfolded even politically is in line with our model’s forecast. The new Financial Capital of the World will be China.
Our model on China from the Tiananmen Square incident on June 4th, 1989, projects that the last three waves are always intense. China will also have its crisis, but the Chinese people know what Marxism is really about. Those in the United States and Europe still think it is utopia. Unfortunately, it is just now 31.4 years since the fall of Communism. It is now time for the fall of Socialism in the West.
China’s Property Boom
26
The Socrates Generated Commentary
For Asia
MONETARY CRISIS CYCLE
Unquestionably, there remains a risk that we could see a monetary reform beginning as early as this year going into 2023/2024. This is being caused by a broader expanding Sovereign Debt Crisis as central banks are fighting to prevent short-term interest rates from rising. While the peripheral economies begin to move into economic chaos, the main central banks are experiencing pressure on short-term rates dur to inflation to rise and concerns unfolding with respect to credit risk. Keep in mind that as short-term interest rates rise in the free markets, the costs of sustaining the sovereign debts of nations will explode and this will result in contributing to the monetary crisis overall going into the conclusion by 2032. We are looking at a split in private v public rates which will become more drastic post-2022. This is also leading to the pressure to cancel paper currencies and adopt digital currencies to track spending and income.
Shanghai Composite
27
Shanghai Composite
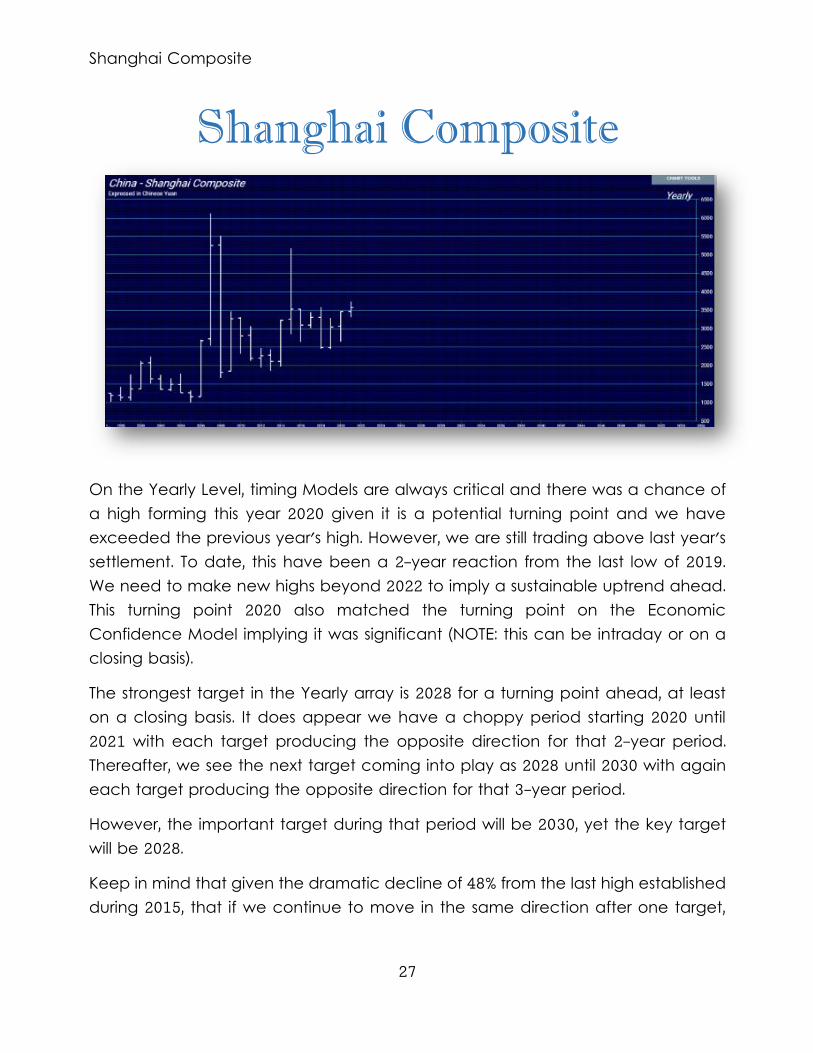
On the Yearly Level, timing Models are always critical and there was a chance of a high forming this year 2020 given it is a potential turning point and we have exceeded the previous year's high. However, we are still trading above last year's settlement. To date, this have been a 2-year reaction from the last low of 2019. We need to make new highs beyond 2022 to imply a sustainable uptrend ahead. This turning point 2020 also matched the turning point on the Economic Confidence Model implying it was significant (NOTE: this can be intraday or on a closing basis).
The strongest target in the Yearly array is 2028 for a turning point ahead, at least on a closing basis. It does appear we have a choppy period starting 2020 until 2021 with each target producing the opposite direction for that 2-year period. Thereafter, we see the next target coming into play as 2028 until 2030 with again each target producing the opposite direction for that 3-year period.
However, the important target during that period will be 2030, yet the key target will be 2028.
Keep in mind that given the dramatic decline of 48% from the last high established during 2015, that if we continue to move in the same direction after one target,
Shanghai Composite
28
then the move will not subside until the next target in time is reached. We have elected 1 Bearish Reversal from the last high thus far to date.
The historical perspective in the Shanghai Composite included a rally from 2008 moving into a major high for 2015, from which the market has been in a bearish trend since then moving into the low in 2019 forming a declining trend of 4 years bottoming at 2440907. On the other hand, we have not elected any Yearly Bearish Reversal to date from the turning point of 2007, which tends to warn that the 2015 high will stand. Notwithstanding, we have a reactionary rally in play since the 2019 low, which tends to imply the market would at least hold temporarily only above that low. Presently, we have elected 2 Bullish Reversals suggesting that this reaction low will hold at least provisionally for now.
The price action subsequent to the 2019 low produced a Knee-Jerk Reaction rally into 2020. The last Yearly Reversal to be elected was a Bullish at the close of 2020.
This market remains in a positive position on the weekly to yearly levels of our indicating models. From a Historical Perspective, ever since the low of 2005, there have been 2 major lows with each being higher than the previous which is indicative of a protracted long-term bull market. The last major low was established back in 2008 with the high forming during 2007. This decline has thus been 1 year. We have exceeded the previous high of 2020, which was 3465729 implying we may have at least a temporary low in place for now and we have not exceeded the previous major high of 6124044. On the other hand, we have not elected any Yearly Bearish Reversal to date from the turning point of 2007.
The last major low took place during 2005 which was 16 years ago. However, the last near-term low took place just 2 years ago in 2019.
YEARLY ANALYSIS PERSPECTIVE
Factually, in Shanghai Composite, the last important low formed back in 2008, there was a rally into the important high established during 2015 which has exceeded the pure reactionary phase with a bull market run do far for seven years. Since the major high in this market, we have seen a post high consolidation period for the past five years. We have elected one Yearly Bearish Reversal from that high of 2015 warning that the uptrend has shifted at least into a confirmed consolidation phase. During the post high correction period, we did make a
Shanghai Composite
29
correction low during 2019 and we have elected two Bullish Reversals from that low implying the market is showing some strength.
Recently on the yearly level, the market has rallied exceeding last year's high reaching 3731687 intraday and we are still trading above 3465729 right now with a positive undertone. Since the post-high correction low made during 2019, the market has rallied for one year which means we are still in a reactionary phase back up.
Right now, as stated, the market is trading above last year's high of 3465729. From that major high, we have elected one Yearly Bearish Reversal at 2541524. However, we have seen a correction from that high for 4 years forming the low during 2019. Right now, the market is trading bullish above our yearly momentum indicators warning that support begins down at 3450495.
Examining the yearly time level, we can now see that there is a 45% risk on the upside, where we show a clear downside risk factor at 40%. From a risk perspective, resistance on a closing basis stands at 5179001 whereas the risk on the downside begins at 2134016.
YEARLY TECHNICAL ANALYSIS
2021/01/01... 2701078 4298102 4468802 2022/01/01... 2807506 4630062 4350570 2023/01/01... 2913934 4962022 4232338 2024/01/01... 3020362 5293982 4114107 2025/01/01... 3126790 5625942 3995875 2026/01/01... 3233218 5957902 3877644 2027/01/01... 3339646 6289862 3759412
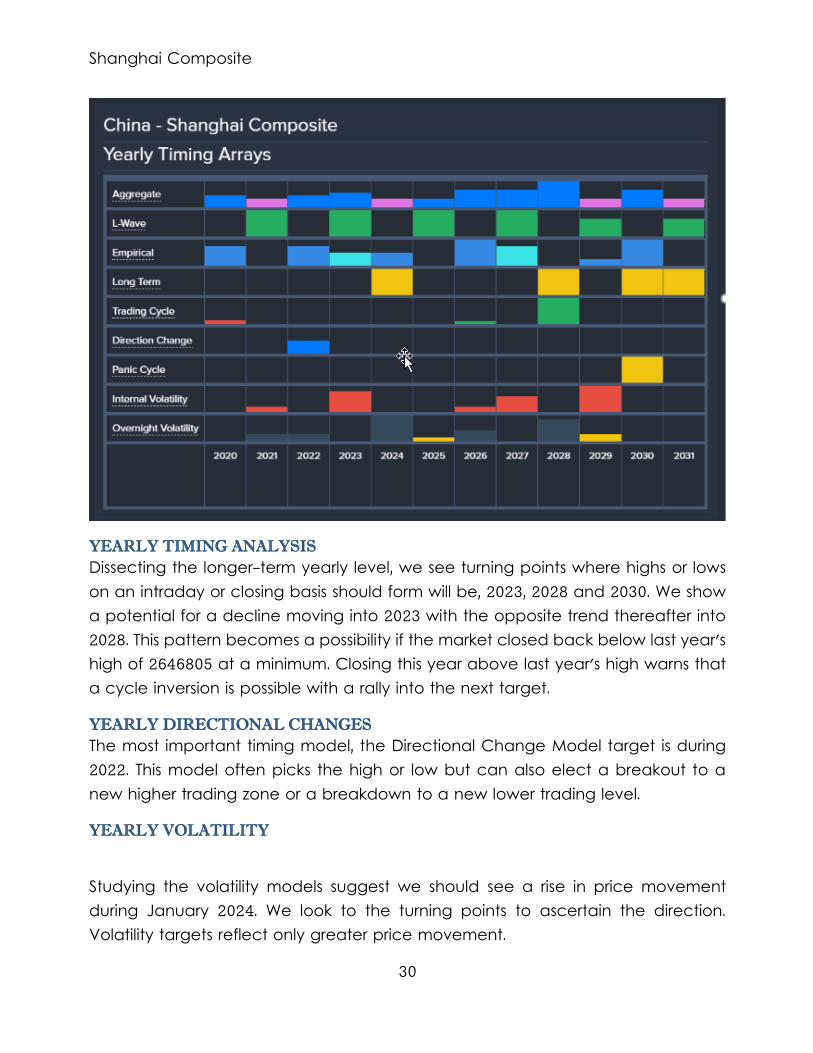
Shanghai Composite
30
YEARLY TIMING ANALYSIS
Dissecting the longer-term yearly level, we see turning points where highs or lows on an intraday or closing basis should form will be, 2023, 2028 and 2030. We show a potential for a decline moving into 2023 with the opposite trend thereafter into 2028. This pattern becomes a possibility if the market closed back below last year's high of 2646805 at a minimum. Closing this year above last year's high warns that a cycle inversion is possible with a rally into the next target.
YEARLY DIRECTIONAL CHANGES
The most important timing model, the Directional Change Model target is during 2022. This model often picks the high or low but can also elect a breakout to a new higher trading zone or a breakdown to a new lower trading level.
YEARLY VOLATILITY
Studying the volatility models suggest we should see a rise in price movement during January 2024. We look to the turning points to ascertain the direction. Volatility targets reflect only greater price movement.
Shanghai Composite
31
YEARLY PANIC CYCLES
Nevertheless, our Panic Cycle target, for the next period to watch is during 2030. This is beyond the peak in the next Economic Confidence Model due in 2024. Keep in mind that a Panic Cycle differs from just volatility. This can be either an outside reversal or a sharp move in only one direction. Panic Cycles can be either up or down. Watch the Stochastics and the reversals to determine the best indication of the potential direction.
THE BROADER LONGER-TERM VIEW
Perceptibly, the long-term expectation in Shanghai Composite remains positive since we are trading above last year's high. Presently, we have made a reaction low in 2008 which was a 1-year decline. Since that reaction low of 2008, this market has bounced for 13 years with this year exceeding last year's high. To date, this market has not breached any long-term support which begins at 1307394 on an annual closing basis. Overhead key resistance within this trend stands on a closing basis at 5179001, while support immediately lies down at 1307394 on an intraday basis.
INDICATING RANGE STUDY
Solely focusing on only the indicating ranges on the Yearly level in the Shanghai Composite, this market remains moderately bullish currently with underlying support beginning at 2638302 and overhead resistance forming above at 3538689. The market is trading closer to the resistance level at this time.
Yearly Indicating Ranges
Immediate Trend .......... bullish Short-Term Momentum ...... neutral Short-Term Trend ......... bullish Intermediate Momentum .... bullish Intermedia Trend ......... bullish Long-Term Trend .......... bullish Cyclical Strength ........ neutral
TRADING ENVELOPE STUDY
NORMAL YEARLY TRADING ENVELOPE

Shanghai Composite
32
Last Close Was. 3414453 Envelope Top... 3466110 Internal AvgL.. 2638348 Internal AvgH.. 3678278 Envelope Btm... 2169842
STOCHASTICS
The Stochastics are in a mixed position. Keep in mind that this type of indicator tends to be more of a confirmation tool rather than a leading forecasting tool. Thus, it is more often than not just a lagging indicator.
ENERGY MODELS
Looking at our Energy Models on the Yearly level, the historical high took place back in 2018 whereas the actual market high in price unfolded back in 2007. This is rather indicative of the fact that the broader term means that eventually higher highs will be carved out in the future. When Energy peaks BEFORE the high, this is indicative of a major high and a serious change in trend is likely to follow. Immediately, our model continues to decline turning negative but the market bottomed 11 years ago and is holding. This is warning that this low may hold at least temporarily for now.
REVERSAL COMMENTARY
On our Yearly Hypothetical Models, clearly, we see that we have Yearly Bearish Reversals that would be generated if we see another new high penetrating 3731687. These Tentative Hypothetical Bearish Reversals would rest at 1047834, 1161907, 1974382, and 2449197, whereas a close below the previous low 2646805 would tend to suggest that these Tentative Hypothetical Reversals will then become fixed as long as the high holds thereafter for at least several days. Moreover, the election of any of these Tentative Hypothetical Bearish Reversals during this next session would signal a decline is unfolding and that such a high may stand. However, if we continue to make new highs, then these Tentative Hypothetical Reversals will be replaced by a new set until the high becomes fixed.
YEARLY FIBONACCI PROJECTIONS IN TIME
These are the Fibonacci Time targets for potential turning points ahead calculated from the 01/01/2015 HIGH:
Shanghai Composite
33
Mon. 01/01/2018 Wed. 01/01/2020 Sun. 01/01/2023 Sat. 01/01/2028 Tue. 01/01/2036 Fri. 01/01/2049 Wed. 01/01/2070 Wed. 01/01/2104 Tue. 01/01/2159
Note: Once more, these are purely Fibonacci projections in Time. They should not be used independently, but they are more important as a correlation tool when the line up with the targets from our Timing Arrays.
YEARLY FIBONACCI RETRACEMENTS & PERCENTAGE MOVEMENTS
Here are the Fibonacci Percentage Retracements from the previous HIGH at 5178191
23% | 3956138 38% | 3200122 61% | 1978069 78% | 1108133
Fibonacci Percentage Golden Ratio Movements:
3% | 2018/01/01 5% | 2020/01/01 8% | 2023/01/01 13% | 2028/01/01 21% | 2036/01/01 34% | 2049/01/01 55% | 2070/01/01 89% | 2104/01/01
ECONOMIC CONFIDENCE MODEL CORRELATION
Here in Shanghai Composite, we do find that this particular market has correlated with our Economic Confidence Model in the past. Our next ECM target remains
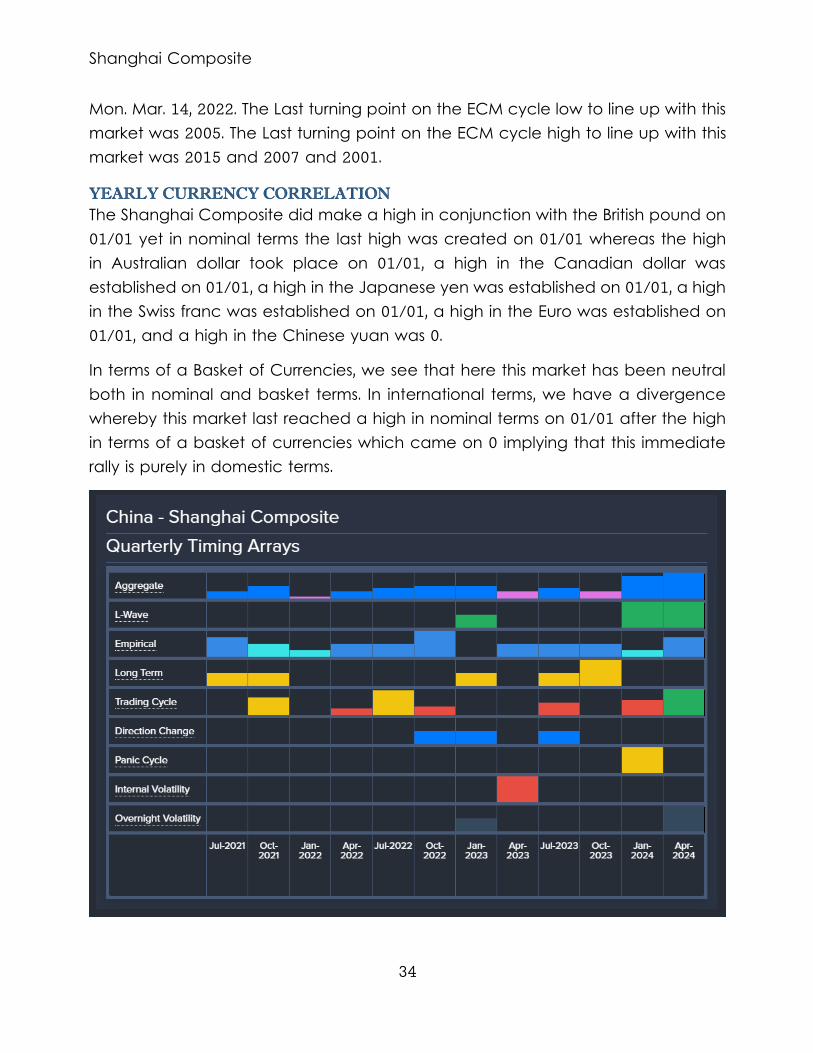
Shanghai Composite
34
Mon. Mar. 14, 2022. The Last turning point on the ECM cycle low to line up with this market was 2005. The Last turning point on the ECM cycle high to line up with this market was 2015 and 2007 and 2001.
YEARLY CURRENCY CORRELATION
The Shanghai Composite did make a high in conjunction with the British pound on 01/01 yet in nominal terms the last high was created on 01/01 whereas the high in Australian dollar took place on 01/01, a high in the Canadian dollar was established on 01/01, a high in the Japanese yen was established on 01/01, a high in the Swiss franc was established on 01/01, a high in the Euro was established on 01/01, and a high in the Chinese yuan was 0.
In terms of a Basket of Currencies, we see that here this market has been neutral both in nominal and basket terms. In international terms, we have a divergence whereby this market last reached a high in nominal terms on 01/01 after the high in terms of a basket of currencies which came on 0 implying that this immediate rally is purely in domestic terms.
Shanghai Composite
35
QUARTERLY ANALYSIS PERSPECTIVE
HEDGING MODEL
From the Quarterly Hedging Model employing only the Reversal System, we are currently long since during the Fourth Quarter 2020 on that close when we reversed our hedge position in this market. This position should be maintained provided this market remains on a Quarterly closing basis above the next Bearish Reversal on this level 3016530. If you want to reduce the exit strategy then use the next Monthly Reversal if we reach the timing objectives.
The Stochastics are in a mixed position. Keep in mind that this type of indicator tends to be more of a confirmation tool rather than a leading forecasting tool. Thus, it is more often than not just a lagging indicator.
On the Quarterly Level, our first target for a turning point is The Fourth Quarter 2021 with the opposite trend implied thereafter into the First Quarter 2022 (NOTE: this can be intraday or on a closing basis).
The strongest target in the Quarterly array is the Second Quarter 2024 for a turning point ahead, at least on a closing basis. It does appear we have a choppy period starting the Third Quarter 2021 until the First Quarter 2022, but we do have a key target arriving also on the Fourth Quarter 2021 with each target producing the opposite direction for that 3-quarter period. Thereafter, we see the next target coming into play as the First Quarter 2023 until the Fourth Quarter 2023, but while we have a target arriving also on the Third Quarter 2023, the key target remains the First Quarter 2023 with again each target producing the opposite direction for that 4-quarter period.
Keep in mind that given the sharp decline of 11% from the last high established the First Quarter 2021, that if we continue to move in the same direction after one target, then the move will not subside until the next target in time is reached. We have NOT elected any Bearish Reversals thus far to date. The first Quarterly Bearish Reversal comes into play at 3016530. There are 3 Quarterly Directional Change targets starting from the Fourth Quarter 2022 to the First Quarter 2023 warning of a potential choppy swing period for these few Quarters. Don't forget, a Directional Change can also be a sharp dramatic move in the same direction, not just a change in direction.
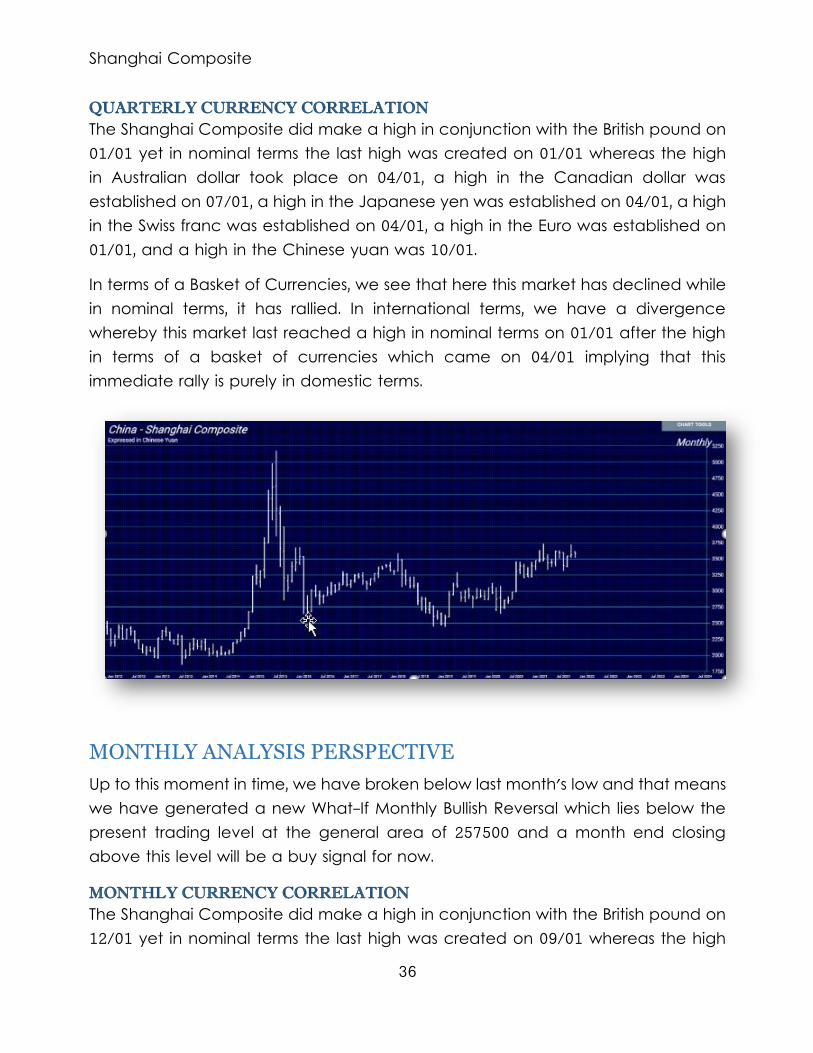
Shanghai Composite
36
QUARTERLY CURRENCY CORRELATION
The Shanghai Composite did make a high in conjunction with the British pound on 01/01 yet in nominal terms the last high was created on 01/01 whereas the high in Australian dollar took place on 04/01, a high in the Canadian dollar was established on 07/01, a high in the Japanese yen was established on 04/01, a high in the Swiss franc was established on 04/01, a high in the Euro was established on 01/01, and a high in the Chinese yuan was 10/01.
In terms of a Basket of Currencies, we see that here this market has declined while in nominal terms, it has rallied. In international terms, we have a divergence whereby this market last reached a high in nominal terms on 01/01 after the high in terms of a basket of currencies which came on 04/01 implying that this immediate rally is purely in domestic terms.
MONTHLY ANALYSIS PERSPECTIVE
Up to this moment in time, we have broken below last month's low and that means we have generated a new What-If Monthly Bullish Reversal which lies below the present trading level at the general area of 257500 and a month end closing above this level will be a buy signal for now.
MONTHLY CURRENCY CORRELATION
The Shanghai Composite did make a high in conjunction with the British pound on 12/01 yet in nominal terms the last high was created on 09/01 whereas the high
Shanghai Composite
37
in Australian dollar took place on 04/01, a high in the Canadian dollar was established on 06/01, a high in the Japanese yen was established on 05/01, a high in the Swiss franc was established on 05/01, a high in the Euro was established on 07/01, and a high in the Chinese yuan was 06/01.
In terms of a Basket of Currencies, we see that here this market has rallied both in nominal and basket terms. In international terms, we have a divergence whereby this market last reached a high in nominal terms on 09/01 after the high in terms of a basket of currencies which came on 05/01 implying that this immediate rally is purely in domestic terms.
MONTHLY BROADER TREND VIEW
Looking at a broader time horizon, this market is in an uptrend position on all our monthly indicators for the near-term trend. We see here the trend has been moving up for the past 2 months. The previous low of 3312720 made during July on the Monthly level has held and only a break of 3367640 on a closing basis would warn of a technical near-term change in trend. The previous high made during September on the Monthly level at 3723850 remains significant technically and only exceeding that level on a closing basis would suggest a reversal in the immediate trend. However, we still remain below key resistance 3626360 on a closing basis.
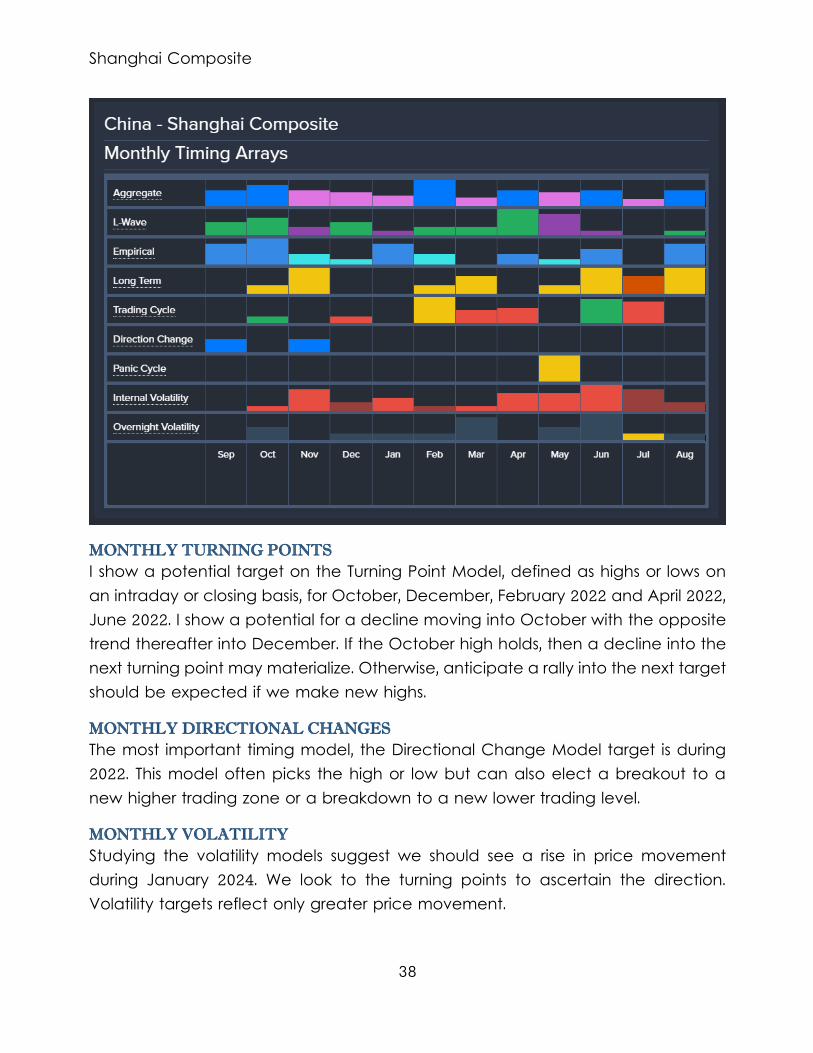
Shanghai Composite
38
MONTHLY TURNING POINTS
I show a potential target on the Turning Point Model, defined as highs or lows on an intraday or closing basis, for October, December, February 2022 and April 2022, June 2022. I show a potential for a decline moving into October with the opposite trend thereafter into December. If the October high holds, then a decline into the next turning point may materialize. Otherwise, anticipate a rally into the next target should be expected if we make new highs.
MONTHLY DIRECTIONAL CHANGES
The most important timing model, the Directional Change Model target is during 2022. This model often picks the high or low but can also elect a breakout to a new higher trading zone or a breakdown to a new lower trading level.
MONTHLY VOLATILITY
Studying the volatility models suggest we should see a rise in price movement during January 2024. We look to the turning points to ascertain the direction. Volatility targets reflect only greater price movement.
Shanghai Composite
39
MONTHLY PANIC CYCLES
Nevertheless, our Panic Cycle target, for the next period to watch is during 2030. This is beyond the peak in the next Economic Confidence Model due in 2024. Keep in mind that a Panic Cycle differs from just volatility. This can be either an outside reversal or a sharp move in only one direction. Panic Cycles can be either up or down. Watch the Stochastics and the reversals to determine the best indication of the potential direction.
MONTHLY BULLISH REVERSALS
The key Monthly Bullish Reversal stands overhead at 3577621. If this market rallies on a monthly closing basis above this level, then a breakout becomes possible. If we exceed that Reversal, then the next key resistance level to watch will be the next Monthly Bullish Reversal at 5179001.
MONTHLY BEARISH REVERSALS
The key Monthly Bearish Reversal below the market remains at 3446546. If this is breached on a monthly closing basis, then a further decline becomes entirely possible. If we penetrate that Reversal on a closing basis, then the next key support level to watch will be the next Monthly Bearish Reversal lies at 3384699.
HEDGING MODEL
From the Monthly Hedging Model employing only the Reversal System, we are currently long since August on that close when we reversed our hedge position in this market. This position should be maintained provided this market remains on a Monthly closing basis above the next Bearish Reversal on this level 3446546. If you want to reduce the exit strategy then use the next Weekly Reversal if we reach the timing objectives.
The Stochastics are on the short term are in a negative position. Keep in mind that this type of indicator tends to be more of a confirmation tool rather than a leading forecasting tool. Thus, it is more often than not just a lagging indicator.
On the Monthly Level, timing Models are always critical and there is a chance of a decline moving into October with the opposite trend implied thereafter into January 2022. However, a break of this current month's trading range of would warn of a possible cycle inversion given we have a target this month. (NOTE: this can be intraday or on a closing basis).
Shanghai Composite
40
The strongest target in the Monthly array is February 2022 for a turning point ahead, at least on a closing basis. It does appear we have a choppy period starting September until October with each target producing the opposite direction for that 2-month period. We have Monthly Directional Change targets due in September and November. Don't forget, a Directional Change can also be a sharp dramatic move in the same direction, not just a change in direction.
Monthly Level Indicator Description... Trend Immediate Trend ........... BULLISH Short-Term Momentum ....... - Neutral - Short-Term Trend .......... BULLISH Intermediate Momentum ..... - Neutral - Intermediate Trend ........ BULLISH Long-Term Trend ........... BULLISH Cyclical Strength.......... BULLISH Broader Trend ............. BULLISH Long-Term Cyclical Trend .. BULLISH
MARKET RISK FACTOR
Shanghai Composite Risk Table
----------------- UPSIDE RISK ----- DOWNSIDE RISK ---
MONTHLY....... 3577621 | 0.264% | 3446546 | 3.408% | QUARTERLY..... 3587033 | 0.528% | 3016530 | 15.46% | YEARLY........ 5179001 | 45.14% | 2134016 | 40.19% |
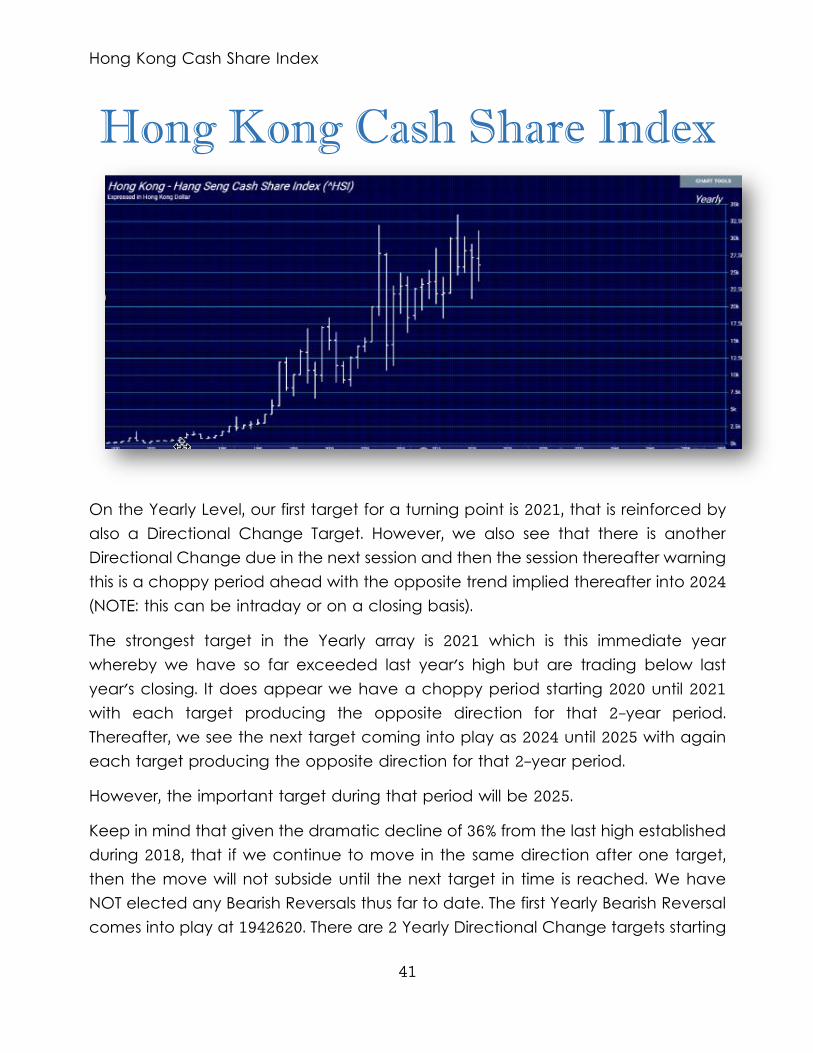
Hong Kong Cash Share Index
41
Hong Kong Cash Share Index
On the Yearly Level, our first target for a turning point is 2021, that is reinforced by also a Directional Change Target. However, we also see that there is another Directional Change due in the next session and then the session thereafter warning this is a choppy period ahead with the opposite trend implied thereafter into 2024 (NOTE: this can be intraday or on a closing basis).
The strongest target in the Yearly array is 2021 which is this immediate year whereby we have so far exceeded last year's high but are trading below last year's closing. It does appear we have a choppy period starting 2020 until 2021 with each target producing the opposite direction for that 2-year period. Thereafter, we see the next target coming into play as 2024 until 2025 with again each target producing the opposite direction for that 2-year period.
However, the important target during that period will be 2025.
Keep in mind that given the dramatic decline of 36% from the last high established during 2018, that if we continue to move in the same direction after one target, then the move will not subside until the next target in time is reached. We have NOT elected any Bearish Reversals thus far to date. The first Yearly Bearish Reversal comes into play at 1942620. There are 2 Yearly Directional Change targets starting
Hong Kong Cash Share Index
42
from 2021 to 2022 warning of a potential choppy swing period for these few Years. Don't forget, a Directional Change can also be a sharp dramatic move in the same direction, not just a change in direction.
The historical perspective in the Hong Kong Cash Share Index included a rally from 2011 moving into a major high for 2018, from which the market has been in a bearish trend since then moving into the low in 2020 forming a reactionary trend of 2 years bottoming at 2113926. On the other hand, we have not elected any Yearly Bearish Reversal to date from the turning point of 2018, which tends to warn that the 2018 high could still be challenged until we elect a Yearly Bearish Reversal. Notwithstanding, we have a reactionary rally in play since the 2020 low, which tends to imply the market would at least hold temporarily only above that low. Presently, we have elected 4 Bullish Reversals suggesting that this reaction low will hold at least provisionally for now.
Curiously, the market has been only consolidating since that 2020 low and has been unable to exceed the high of that year while holding the low. The last Yearly Reversal to be elected was a Bullish at the close of 2020.
This market remains in a positive position on the weekly to yearly levels of our indicating models. From a Historical Perspective, ever since the low of 1967, there have been 4 major lows with each being higher than the previous which is indicative of a protracted long-term bull market. The last major low was established back in 2011 with the high forming during 2018. This decline has thus been-7 year. We have exceeded the previous high of 2020, which was 2917492 implying we may have at least a temporary low in place for now and we have not exceeded the previous major high of 3348408. On the other hand, we have not elected any Yearly Bearish Reversal to date from the turning point of 2018.
The last major low took place during 1998 which was 23 years ago. However, the last near-term low took place just 1 years ago in 2020.
YEARLY ANALYSIS PERSPECTIVE
Factually, in Hong Kong Cash Share Index, the last important low formed back in 2011, there was a rally into the important high established during 2018 which has exceeded the pure reactionary phase with a bull market run do far for seven
Hong Kong Cash Share Index
43
years. Since the major high in this market, we have seen a post high consolidation period for the past two years. We have not elected any Yearly Bearish Reversals from that high of 2018. During the post high consolidation period, we did make a correction low during 2020 and we have elected ALL four Bullish Reversals from that low implying new highs are likely.
Recently on the yearly level, the market has rallied exceeding last year's high reaching 3118336 intraday. To date, we have a 2-year reaction low in place as of 2020, which warns that there is a potential for a rally failing to make new lows below 2113926. However, the highest closing was during 2017 at 2991915 whereas the intraday high formed in 2018.
Currently, the market is trading neutral within last year's trading range of 2917492 to 2113926. Overall, the market has been in a long-term bullish trend. We have not elected any Yearly Bearish Reversals from that major high. However, we have seen a correction from that high for 2 years forming the low during 2020.
Examining the yearly time level, we can now see that there is a 30% risk on the upside, where we show a clear downside risk factor at 20%. From a risk perspective, resistance on a closing basis stands at 3195850 whereas the risk on the downside begins at 1942620.
YEARLY TECHNICAL ANALYSIS
2021/01/01... 2303036 2606111 3644763 3869176 4438688 2022/01/01... 2398068 2563987 3800962 3965815 4527463 2023/01/01... 2493099 2521863 3957161 4062454 4616238 2024/01/01... 2588131 2479740 4113360 4159093 4705013 2025/01/01... 2683162 2437616 4269558 4255732 4793788 2026/01/01... 2778193 2395493 4425757 4352371 4882563 2027/01/01... 2873225 2353369 4581956 4449010 4971338
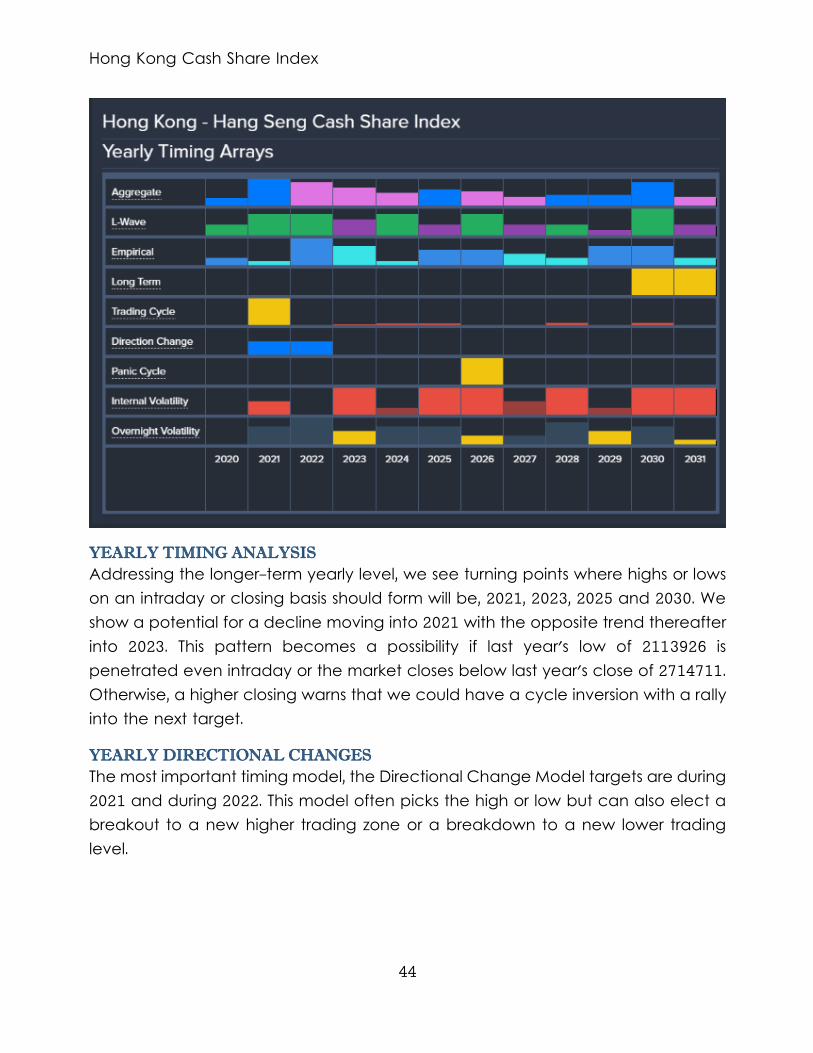
Hong Kong Cash Share Index
44
YEARLY TIMING ANALYSIS
Addressing the longer-term yearly level, we see turning points where highs or lows on an intraday or closing basis should form will be, 2021, 2023, 2025 and 2030. We show a potential for a decline moving into 2021 with the opposite trend thereafter into 2023. This pattern becomes a possibility if last year's low of 2113926 is penetrated even intraday or the market closes below last year's close of 2714711. Otherwise, a higher closing warns that we could have a cycle inversion with a rally into the next target.
YEARLY DIRECTIONAL CHANGES
The most important timing model, the Directional Change Model targets are during 2021 and during 2022. This model often picks the high or low but can also elect a breakout to a new higher trading zone or a breakdown to a new lower trading level.
Hong Kong Cash Share Index
45
YEARLY VOLATILITY
Aiming on the volatility models suggest we should see a rise in price movement during January 2028. We look to the turning points to ascertain the direction. Volatility targets reflect only greater price movement.
YEARLY PANIC CYCLES
Nevertheless, our Panic Cycle target, for the next period to watch is during 2026. This is beyond the peak in the next Economic Confidence Model due in 2024. Keep in mind that a Panic Cycle differs from just volatility. This can be either an outside reversal or a sharp move in only one direction. Panic Cycles can be either up or down. Watch the Stochastics and the reversals to determine the best indication of the potential direction.
THE BROADER LONGER-TERM VIEW
Logically, the long-term outlook view recognizes that the current bearish progression in Hong Kong Cash Share Index reflects only a temporary reaction within a broader bull market trend since we have not elected any Yearly sell signals on our model. Furthermore, the Hong Kong Cash Share Index remains somewhat neutral at this present moment trading within last year's range of 2917492 and 2113926. Presently, we have made a reaction low in 2020 which was a 2-year decline. Since that reaction low of 2020, this market has bounced up to now this year, but it remains still within last year's trading range of 2917492 to 2113926. We are trading below last year's high of 2917492 at this time.
INDICATING RANGE STUDY
Solely focusing on only the indicating ranges on the Yearly level in the Hong Kong Cash Share Index, this market remains in a bullish position at this time with the underlying support beginning at 2436400.
Yearly Indicating Ranges Immediate Trend .......... neutral Short-Term Momentum ...... bullish Short-Term Trend ......... bullish Intermediate Momentum .... bullish Intermedia Trend ......... bullish Long-Term Trend .......... bullish Cyclical Strength ........ bullish
Hong Kong Cash Share Index
46
TRADING ENVELOPE STUDY
NORMAL YEARLY TRADING ENVELOPE Last Close Was. 2714711 Envelope Top... 2860364 Internal AvgL.. 2214788 Internal AvgH.. 2877919 Envelope Btm... 1790634
STOCHASTICS
The Stochastics are in a mixed position. Keep in mind that this type of indicator tends to be more of a confirmation tool rather than a leading forecasting tool. Thus, it is more often than not just a lagging indicator.
ENERGY MODELS
Looking at our Energy Models on the Yearly level, the historical high took place back in 2018 whereas the actual market high in price unfolded back in 2018.
REVERSAL COMMENTARY
On our Yearly Hypothetical Models, clearly, we see that we have Yearly Bearish Reversals that would be generated if we see another new high penetrating 3118336. These Tentative Hypothetical Bearish Reversals would rest at 900025, 1484397, 2113761, and 2454064, whereas a close below the previous low 2113926 would tend to suggest that these Tentative Hypothetical Reversals will then become fixed as long as the high holds thereafter for at least several days. Moreover, the election of any of these Tentative Hypothetical Bearish Reversals during this next session would signal a decline is unfolding and that such a high may stand. However, if we continue to make new highs, then these Tentative Hypothetical Reversals will be replaced by a new set until the high becomes fixed.
YEARLY FIBONACCI PROJECTIONS IN TIME
These are the Fibonacci Time targets for potential turning points ahead calculated from the 01/01/2018 HIGH:
Fri. 01/01/2021 Sun. 01/01/2023 Thu. 01/01/2026 Wed. 01/01/2031 Sat. 01/01/2039
Hong Kong Cash Share Index
47
Mon. 01/01/2052 Sun. 01/01/2073 Sun. 01/01/2107 Sat. 01/01/2162 Note: Once more, these are purely Fibonacci projections in Time. They should not be used independently, but they are more important as a correlation tool when the line up with the targets from our Timing Arrays.
YEARLY FIBONACCI RETRACEMENTS & PERCENTAGE MOVEMENTS
Here are the Fibonacci Percentage Retracements from the previous HIGH at 3348408
23% | 2558184 38% | 2069316 61% | 1279092 78% | 716559
Fibonacci Percentage Golden Ratio Movements:
3% | 2021/01/01 5% | 2023/01/01 8% | 2026/01/01 13% | 2031/01/01 21% | 2039/01/01 34% | 2052/01/01 55% | 2073/01/01 89% | 2107/01/01
ECONOMIC CONFIDENCE MODEL CORRELATION
Here in Hong Kong Cash Share Index, we do find that this particular market has correlated with our Economic Confidence Model in the past. The Last turning point on the ECM cycle low to line up with this market was 2020 and 2011 and 1998. The Last turning point on the ECM cycle high to line up with this market was 2018 and 2015 and 2010 and 2007 and 2000 and 1994.
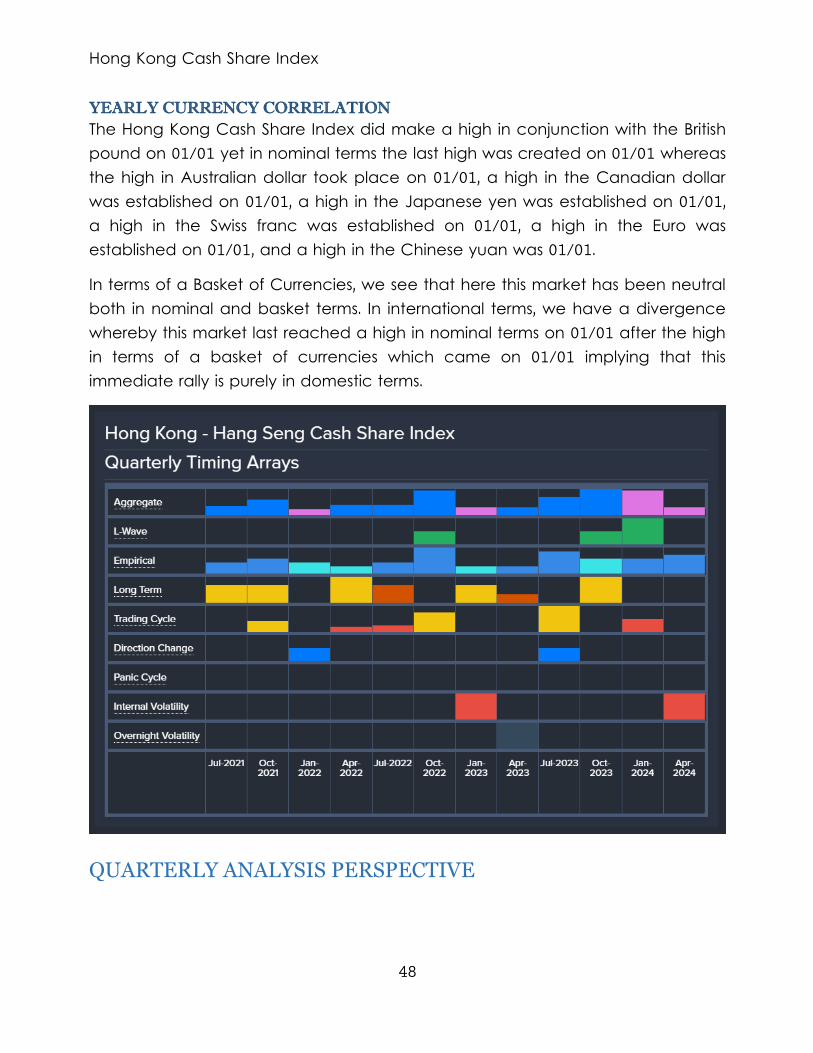
Hong Kong Cash Share Index
48
YEARLY CURRENCY CORRELATION
The Hong Kong Cash Share Index did make a high in conjunction with the British pound on 01/01 yet in nominal terms the last high was created on 01/01 whereas the high in Australian dollar took place on 01/01, a high in the Canadian dollar was established on 01/01, a high in the Japanese yen was established on 01/01, a high in the Swiss franc was established on 01/01, a high in the Euro was established on 01/01, and a high in the Chinese yuan was 01/01.
In terms of a Basket of Currencies, we see that here this market has been neutral both in nominal and basket terms. In international terms, we have a divergence whereby this market last reached a high in nominal terms on 01/01 after the high in terms of a basket of currencies which came on 01/01 implying that this immediate rally is purely in domestic terms.
QUARTERLY ANALYSIS PERSPECTIVE
Hong Kong Cash Share Index
49
HEDGING MODEL
From the Quarterly Hedging Model employing only the Reversal System, we are currently short since during the Third Quarter 2019 on that close when we reversed our hedge position in this market. This position should be maintained provided this market remains on a Quarterly closing basis below the next Bullish Reversal on this level 2678270. If you want to reduce the exit strategy then use the next Monthly Reversal if we reach the timing objectives.
The Stochastics are in a mixed position. Keep in mind that this type of indicator tends to be more of a confirmation tool rather than a leading forecasting tool. Thus, it is more often than not just a lagging indicator. Nevertheless, the short-term oscillator is entering a crash mode suggesting we may see a decline from here.
On the Quarterly Level, our first target for a turning point is The Fourth Quarter 2021 with the opposite trend implied thereafter into the First Quarter 2022 which is a Directional Change (NOTE: this can be intraday or on a closing basis).
The strongest target in the Quarterly array is the Fourth Quarter 2023 for a turning point ahead, at least on a closing basis. It does appear we have a choppy period starting the Third Quarter 2021 until the First Quarter 2022, but we do have a key target arriving also on the Fourth Quarter 2021 with each target producing the opposite direction for that 3-quarter period.
Keep in mind that given the significant decline of 23% from the last high established the First Quarter 2021, that if we continue to move in the same direction after one target, then the move will not subside until the next target in time is reached. We have elected 1 Bearish Reversal from the last high thus far to date. We have overall 2 Quarterly Directional Change targets ahead and 1 that also aligns with a main turning points on the top line of the Array. Therefore, the target of should be an important target. This target in time is the First Quarter 2022. Directional Change targets that align with the top line for turning points often unfold as the main cyclical events. Don't forget, a Directional Change can also be a sharp dramatic move in the same direction, not just a change in direction.
QUARTERLY CURRENCY CORRELATION
The Hong Kong Cash Share Index did make a high in conjunction with the British pound on 01/01 yet in nominal terms the last high was created on 01/01 whereas the high in Australian dollar took place on 01/01, a high in the Canadian dollar
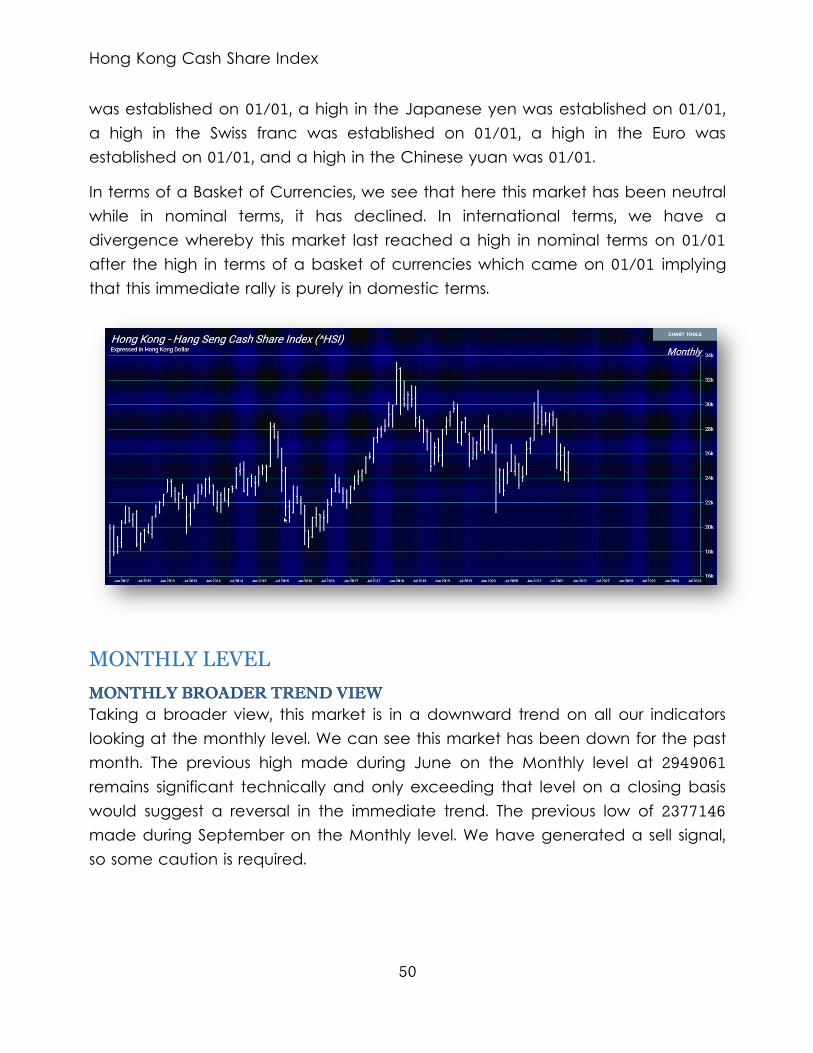
Hong Kong Cash Share Index
50
was established on 01/01, a high in the Japanese yen was established on 01/01, a high in the Swiss franc was established on 01/01, a high in the Euro was established on 01/01, and a high in the Chinese yuan was 01/01.
In terms of a Basket of Currencies, we see that here this market has been neutral while in nominal terms, it has declined. In international terms, we have a divergence whereby this market last reached a high in nominal terms on 01/01 after the high in terms of a basket of currencies which came on 01/01 implying that this immediate rally is purely in domestic terms.
MONTHLY LEVEL
MONTHLY BROADER TREND VIEW
Taking a broader view, this market is in a downward trend on all our indicators looking at the monthly level. We can see this market has been down for the past month. The previous high made during June on the Monthly level at 2949061 remains significant technically and only exceeding that level on a closing basis would suggest a reversal in the immediate trend. The previous low of 2377146 made during September on the Monthly level. We have generated a sell signal, so some caution is required.
Hong Kong Cash Share Index
51
MONTHLY TURNING POINTS
I show a potential target on the Turning Point Model, defined as highs or lows on an intraday or closing basis, for December, February 2022 and April 2022, June 2022. I show a potential for a decline moving into December with the opposite trend thereafter into February 2022. Looking ahead at December, a continued advance becomes possible if this month's high is penetrated intraday.
MONTHLY DIRECTIONAL CHANGES
The most important timing model, the Directional Change Model targets are during 2021 and during 2022. This model often picks the high or low but can also elect a breakout to a new higher trading zone or a breakdown to a new lower trading level.
MONTHLY VOLATILITY
Aiming on the volatility models suggest we should see a rise in price movement during January 2028. We look to the turning points to ascertain the direction. Volatility targets reflect only greater price movement.
Hong Kong Cash Share Index
52
MONTHLY PANIC CYCLES
Nevertheless, our Panic Cycle target, for the next period to watch is during 2026. This is beyond the peak in the next Economic Confidence Model due in 2024. Keep in mind that a Panic Cycle differs from just volatility. This can be either an outside reversal or a sharp move in only one direction. Panic Cycles can be either up or down. Watch the Stochastics and the reversals to determine the best indication of the potential direction.
MONTHLY BULLISH REVERSALS
The key Monthly Bullish Reversal stands overhead at 2476690. If this market rallies on a monthly closing basis above this level, then a breakout becomes possible. If we exceed that Reversal, then the next key resistance level to watch will be the next Monthly Bullish Reversal at 3019120.
MONTHLY BEARISH REVERSALS
The key Monthly Bearish Reversal below the market remains at 2367440. If this is breached on a monthly closing basis, then a further decline becomes entirely possible. If we penetrate that Reversal on a closing basis, then the next key support level to watch will be the next Monthly Bearish Reversal lies at 2353980.
HEDGING MODEL
From the Monthly Hedging Model employing only the Reversal System, we are currently short since July on that close when we reversed our hedge position in this market. This position should be maintained provided this market remains on a Monthly closing basis below the next Bullish Reversal on this level 2476690. If you want to reduce the exit strategy then use the next Weekly Reversal if we reach the timing objectives.
The Stochastics are all in a bearish position. Keep in mind that this type of indicator tends to be more of a confirmation tool rather than a leading forecasting tool. Thus, it is more often than not just a lagging indicator.
On the Monthly Level, with respect to time, there was a prospect of a turning point arriving September with an opposite move at least on a closing basis into the next target date of December. The last event was a low formed on September suggesting that the first target is likely to be an initial high especially if the market opens higher or holds above 2377146 intraday. (NOTE: this can be intraday or on a closing basis).
Hong Kong Cash Share Index
53
The strongest target in the Monthly array is August 2022 for a turning point ahead, at least on a closing basis.
Keep in mind that given the sharp decline of 19% from the last high established June, that if we continue to move in the same direction after one target, then the move will not subside until the next target in time is reached. We have elected 3 Bearish Reversals from the last high thus far to date. We have Monthly Directional Change targets due in September and December. Don't forget, a Directional Change can also be a sharp dramatic move in the same direction, not just a change in direction.
Monthly Level Indicator Description... Trend Immediate Trend ........... (Bearish) Short-Term Momentum ....... (Bearish) Short-Term Trend .......... (Bearish) Intermediate Momentum ..... (Bearish) Intermediate Trend ........ - Neutral - Long-Term Trend ........... (Bearish) Cyclical Strength.......... (Bearish) Broader Trend ............. (Bearish) Long-Term Cyclical Trend .. - Neutral -
MONTHLY CURRENCY CORRELATION
The Hong Kong Cash Share Index did make a high in conjunction with the British pound on 07/01 yet in nominal terms the last high was created on 02/01 whereas the high in Australian dollar took place on 07/01, a high in the Canadian dollar was established on 07/01, a high in the Japanese yen was established on 07/01, a high in the Swiss franc was established on 07/01, a high in the Euro was established on 07/01, and a high in the Chinese yuan was 07/01.
In terms of a Basket of Currencies, we see that here this market has been neutral while in nominal terms, it has rallied. In international terms, we have a divergence whereby this market last reached a high in nominal terms on 02/01 after the high in terms of a basket of currencies which came on 07/01 implying that this immediate rally is purely in domestic terms.
Nikkei Tokyo Index Cash
54
Nikkei Tokyo Index Cash
On the Yearly Level, with respect to time, there was a prospect of an Outside Reversal to the upside in 2020 yet since this market has exceeded the 2020 high, then a further rally is possible into the next target of 2021. So far this year, the market has exceeded the 2020 high of 2760252 and it remains above that level on a closing basis. To date, we have not elected any Monthly Bearish Reversals from the September high. The next Monthly Bearish Reversal to focus on lies at 2738502. A closing below our Momentum Projection standing at 2900931 will signal that we have a pullback possibly into the next turning point due in 2021 leaving was 2020 as a temporary high. Yet, this market is still holding our Momentum support level resting at 1573603, indicating the broader trend has not been negated at this moment. This turning point 2020 also matched the turning point on the Economic Confidence Model implying it was significant (NOTE: this can be intraday or on a closing basis).
The strongest target in the Yearly array is 2031 for a turning point ahead, at least on a closing basis. It does appear we have a choppy period starting 2020 until 2022 with each target producing the opposite direction for that 3-year period. Thereafter, we see the next target coming into play as 2024 until 2028, but we do have a key target arriving also 2025 with again each target producing the opposite direction for that 5-year period.
Nikkei Tokyo Index Cash
55
However, the important target during that period will be 2025.
Keep in mind that given the significant decline of 21% from the last high established during 2020, that if we continue to move in the same direction after one target, then the move will not subside until the next target in time is reached. We have NOT elected any Bearish Reversals thus far to date. The first Yearly Bearish Reversal comes into play at 1486400.
The NIKKEI Tokyo Index Cash has continued to make new historical highs over the course of the rally from 2011 moving into 2021. However, this last portion of the rally has taken place over 10 years from the last important low formed during 2011. Prominently, we have elected three Bullish Reversals to date.
This market remains in a positive position on the weekly to yearly levels of our indicating models. From a Historical Perspective, this market was in a bullish trend since the major low took place back in 1965 with the high forming during 1989 amounting to a 24-year bull market. Following that high, the market has consolidated for 31 years. On the other hand, we have elected one short-term Yearly Bearish Reversal to date from the turning point of 1989.
The last major low took place during 2008 which was 13 years ago. There is a very good probability that this year will form a major high. Indeed, so far this year has rallied above last year's high of 2760252 reaching 3079578.
YEARLY ANALYSIS PERSPECTIVE
Factually, in NIKKEI Tokyo Index Cash, the last important low formed back in 2011, there was a rally into the important high established during 2020 which has exceeded the pure reactionary phase with a bull market run do far for nine years.
Recently on the yearly level, the market has rallied exceeding last year's high reaching 3079578 intraday and we are still trading above 2760252 right now with a positive undertone. At this moment, the market is trading still holding above support in a bullish posture.
Right now, as stated, the market is trading above last year's high of 2760252. Overall, the market has been in a long-term bullish trend. We have not elected any Yearly Bearish Reversals from that major high. Right now, the market is trading bullish above our yearly momentum indicators warning that support begins down at 2338215.
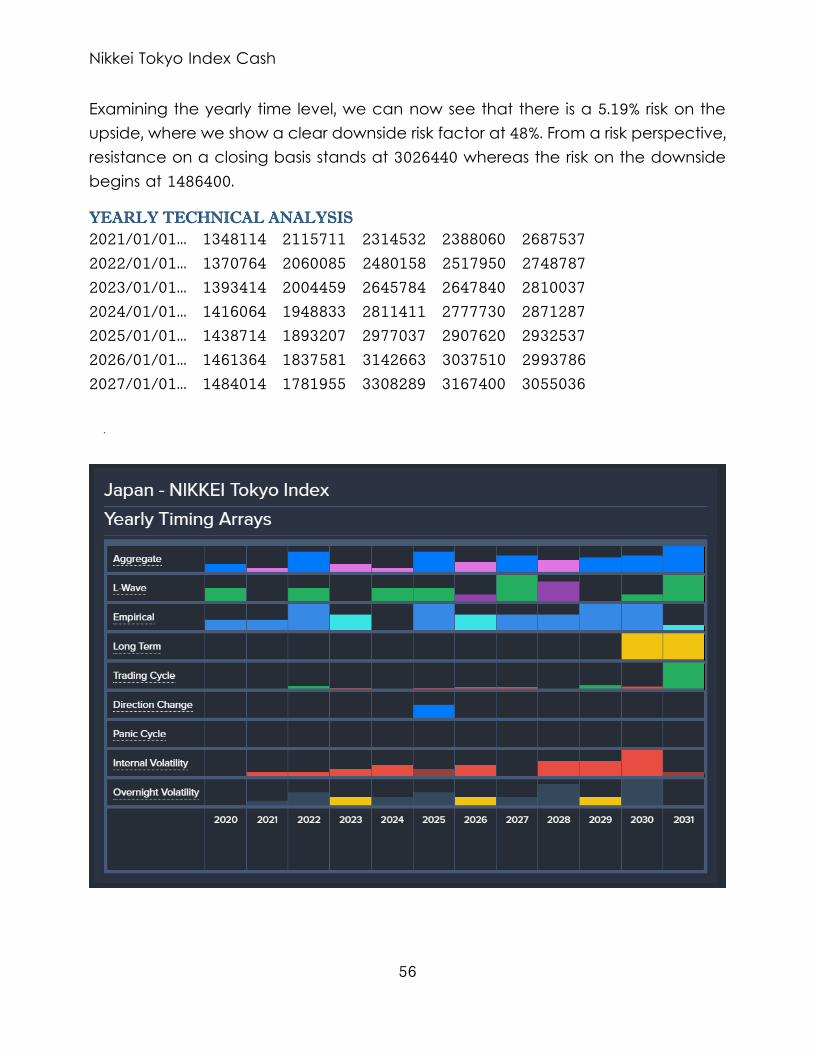
Nikkei Tokyo Index Cash
56
Examining the yearly time level, we can now see that there is a 5.19% risk on the upside, where we show a clear downside risk factor at 48%. From a risk perspective, resistance on a closing basis stands at 3026440 whereas the risk on the downside begins at 1486400.
YEARLY TECHNICAL ANALYSIS
2021/01/01... 1348114 2115711 2314532 2388060 2687537 2022/01/01... 1370764 2060085 2480158 2517950 2748787 2023/01/01... 1393414 2004459 2645784 2647840 2810037 2024/01/01... 1416064 1948833 2811411 2777730 2871287 2025/01/01... 1438714 1893207 2977037 2907620 2932537 2026/01/01... 1461364 1837581 3142663 3037510 2993786 2027/01/01... 1484014 1781955 3308289 3167400 3055036
Nikkei Tokyo Index Cash
57
YEARLY TIMING ANALYSIS
Addressing the longer-term yearly level, we see turning points where highs or lows on an intraday or closing basis should form will be, 2022, 2025, 2027 and 2031. We show a potential for a decline moving into 2022 with the opposite trend thereafter into 2025. This pattern becomes a possibility if the market closed back below last year's high of 1635819 at a minimum. Closing this year above last year's high warns that a cycle inversion is possible with a rally into the next target.
YEARLY DIRECTIONAL CHANGES
The most important timing model, the Directional Change Model target is during 2025. This model often picks the high or low but can also elect a breakout to a new higher trading zone or a breakdown to a new lower trading level.
YEARLY VOLATILITY
Aiming on the volatility models suggest we should see a rise in price movement during January 2030. We look to the turning points to ascertain the direction. Volatility targets reflect only greater price movement.
THE BROADER LONGER-TERM VIEW
Logically, the long-term expectation in NIKKEI Tokyo Index Cash remains positive since we are trading above last year's high. Presently, we have made a reaction low in 2008 which was a 19-year decline. Since that reaction low of 2008, this market has bounced for 13 years with this year exceeding last year's high. Historically, this market experienced a Phase Transition from the low of 1965 to the high of 1989 which amounted to about a 3700% advance. We have entered a consolidation phase on the yearly level by closing below 1155805 on an annual basis. Support on a closing basis now lies at 695640.
YEARLY OUTSIDE COMMENT
A closing above last year's high of 2760252 will warn of perhaps new highs into next year. A closing below that number would warn that this year could be just a temporary high.
INDICATING RANGE STUDY
Solely focusing on only the indicating ranges on the Yearly level in the NIKKEI Tokyo Index Cash, this market remains in a bullish position at this time with the underlying support beginning at 2091079.
Yearly Indicating Ranges
Nikkei Tokyo Index Cash
58
Immediate Trend .......... bullish Short-Term Momentum ...... bullish Short-Term Trend ......... bullish Intermediate Momentum .... bullish Intermedia Trend ......... bullish Long-Term Trend .......... bullish Cyclical Strength ........ bullish
TRADING ENVELOPE STUDY
NORMAL YEARLY TRADING ENVELOPE
Last Close Was. 2744417
Envelope Top... 2323240 Internal AvgL.. 1752737 Internal AvgH.. 2258576 Envelope Btm... 973008 STOCHASTICS
The Stochastics are in a mixed position. Keep in mind that this type of indicator tends to be more of a confirmation tool rather than a leading forecasting tool. Thus, it is more often than not just a lagging indicator.
ENERGY MODELS
Looking at our Energy Models on the Yearly level, the historical high took place back in 1990 whereas the actual market high in price unfolded back in 1989. This is rather indicative of the fact that the broader term means that eventually higher highs will be carved out in the future. When Energy peaks BEFORE the high, this is indicative of a major high and a serious change in trend is likely to follow.
REVERSAL COMMENTARY
On our Yearly Hypothetical Models, clearly, we see that we have Yearly Bearish Reversals that would be generated if we see another new high penetrating 3079578. These Tentative Hypothetical Bearish Reversals would rest at 1312261, 1388511, 1404554, and 1894858, whereas a close below the previous low 1635819 would tend to suggest that these Tentative Hypothetical Reversals will then become fixed as long as the high holds thereafter for at least several days. Moreover, the election of any of these Tentative Hypothetical Bearish Reversals
Nikkei Tokyo Index Cash
59
during this next session would signal a decline is unfolding and that such a high may stand. However, if we continue to make new highs, then these Tentative Hypothetical Reversals will be replaced by a new set until the high becomes fixed.
YEARLY FIBONACCI PROJECTIONS IN TIME
These are the Fibonacci Time targets for potential turning points ahead calculated from the 01/01/2020 HIGH:
Sun. 01/01/2023 Wed. 01/01/2025 Sat. 01/01/2028 Sat. 01/01/2033 Tue. 01/01/2041 Thu. 01/01/2054 Tue. 01/01/2075 Wed. 01/01/2109 Mon. 01/01/2164
Note: Once more, these are purely Fibonacci projections in Time. They should not be used independently, but they are more important as a correlation tool when the line up with the targets from our Timing Arrays.
YEARLY FIBONACCI RETRACEMENTS & PERCENTAGE MOVEMENTS
Here are the Fibonacci Percentage Retracements from the previous HIGH at 2760252
23% | 2108832 38% | 1705836 61% | 1054416 78% | 590694
Fibonacci Percentage Golden Ratio Movements:
3% | 2023/01/01 5% | 2025/01/01 8% | 2028/01/01 13% | 2033/01/01 21% | 2041/01/01

Nikkei Tokyo Index Cash
60
34% | 2054/01/01 55% | 2075/01/01 89% | 2109/01/01
ECONOMIC CONFIDENCE MODEL CORRELATION
Here in NIKKEI Tokyo Index Cash, we do find that this particular market has correlated with our Economic Confidence Model in the past. The Last turning point on the ECM cycle low to line up with this market was 2020 and 2011 and 1998. The Last turning point on the ECM cycle high to line up with this market was 2020 and 2015 and 2010 and 2007 and 2000 and 1996.
YEARLY CURRENCY CORRELATION
The NIKKEI Tokyo Index Cash did make a high in conjunction with the British pound on 01/01 yet in nominal terms the last high was created on 01/01 whereas the high in Australian dollar took place on 01/01, a high in the Canadian dollar was established on 01/01, a high in the Japanese yen was established on 01/01, a high in the Swiss franc was established on 01/01, a high in the Euro was established on 01/01, and a high in the Chinese yuan was 01/01.
In terms of a Basket of Currencies, we see that here this market has been neutral both in nominal and basket terms. In international terms, we have a divergence whereby this market last reached a high in nominal terms on 01/01 after the high in terms of a basket of currencies which came on 01/01 implying that this immediate rally is purely in domestic terms.
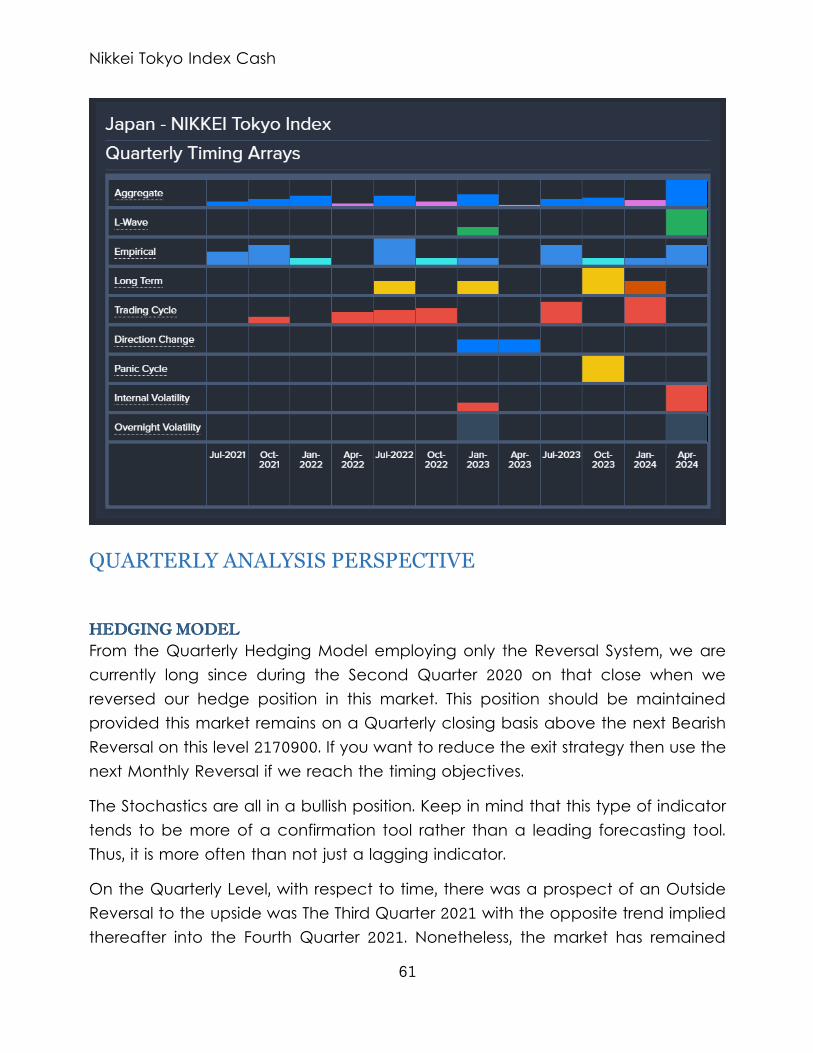
Nikkei Tokyo Index Cash
61
QUARTERLY ANALYSIS PERSPECTIVE
HEDGING MODEL
From the Quarterly Hedging Model employing only the Reversal System, we are currently long since during the Second Quarter 2020 on that close when we reversed our hedge position in this market. This position should be maintained provided this market remains on a Quarterly closing basis above the next Bearish Reversal on this level 2170900. If you want to reduce the exit strategy then use the next Monthly Reversal if we reach the timing objectives.
The Stochastics are all in a bullish position. Keep in mind that this type of indicator tends to be more of a confirmation tool rather than a leading forecasting tool. Thus, it is more often than not just a lagging indicator.
On the Quarterly Level, with respect to time, there was a prospect of an Outside Reversal to the upside was The Third Quarter 2021 with the opposite trend implied thereafter into the Fourth Quarter 2021. Nonetheless, the market has remained
Nikkei Tokyo Index Cash
62
weak trading more towards the support level. A closing above 1738940 will signal a further rally into the next target. (NOTE: this can be intraday or on a closing basis).
The strongest target in the Quarterly array is the Second Quarter 2024 for a turning point ahead, at least on a closing basis. It does appear we have a choppy period starting the Third Quarter 2021 until the Second Quarter 2023, but we do have a key target arriving also on the First Quarter 2023 with each target producing the opposite direction for that 8-quarter period. There are 2 Quarterly Directional Change targets starting from the First Quarter 2023 to the Second Quarter 2023 warning of a potential choppy swing period for these few Quarters. Don't forget, a Directional Change can also be a sharp dramatic move in the same direction, not just a change in direction.
QUARTERLY CURRENCY CORRELATION
The NIKKEI Tokyo Index Cash did make a high in conjunction with the British pound on 01/01 yet in nominal terms the last high was created on 07/01 whereas the high in Australian dollar took place on 01/01, a high in the Canadian dollar was established on 01/01, a high in the Japanese yen was established on 01/01, a high in the Swiss franc was established on 01/01, a high in the Euro was established on 01/01, and a high in the Chinese yuan was 01/01.
In terms of a Basket of Currencies, we see that here this market has been neutral while in nominal terms, it has declined. In international terms, we have a divergence whereby this market last reached a high in nominal terms on 07/01 after the high in terms of a basket of currencies which came on 01/01 implying that this immediate rally is purely in domestic terms.
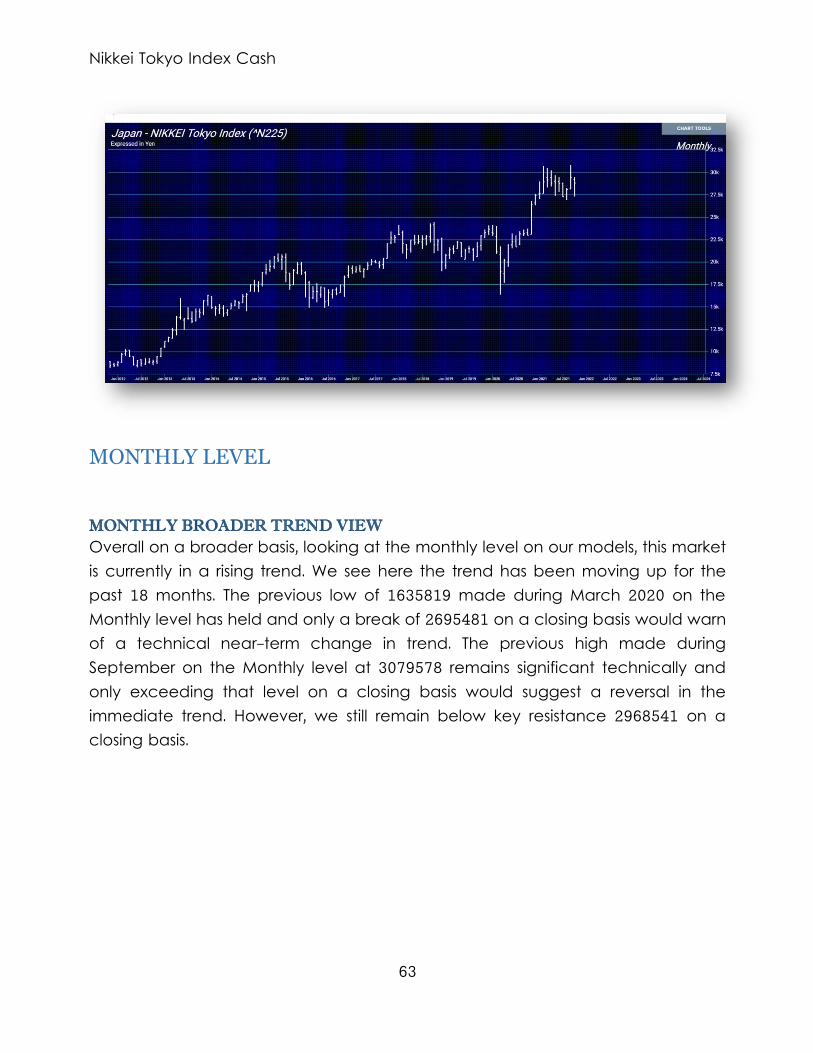
Nikkei Tokyo Index Cash
63
MONTHLY LEVEL
MONTHLY BROADER TREND VIEW
Overall on a broader basis, looking at the monthly level on our models, this market is currently in a rising trend. We see here the trend has been moving up for the past 18 months. The previous low of 1635819 made during March 2020 on the Monthly level has held and only a break of 2695481 on a closing basis would warn of a technical near-term change in trend. The previous high made during September on the Monthly level at 3079578 remains significant technically and only exceeding that level on a closing basis would suggest a reversal in the immediate trend. However, we still remain below key resistance 2968541 on a closing basis.
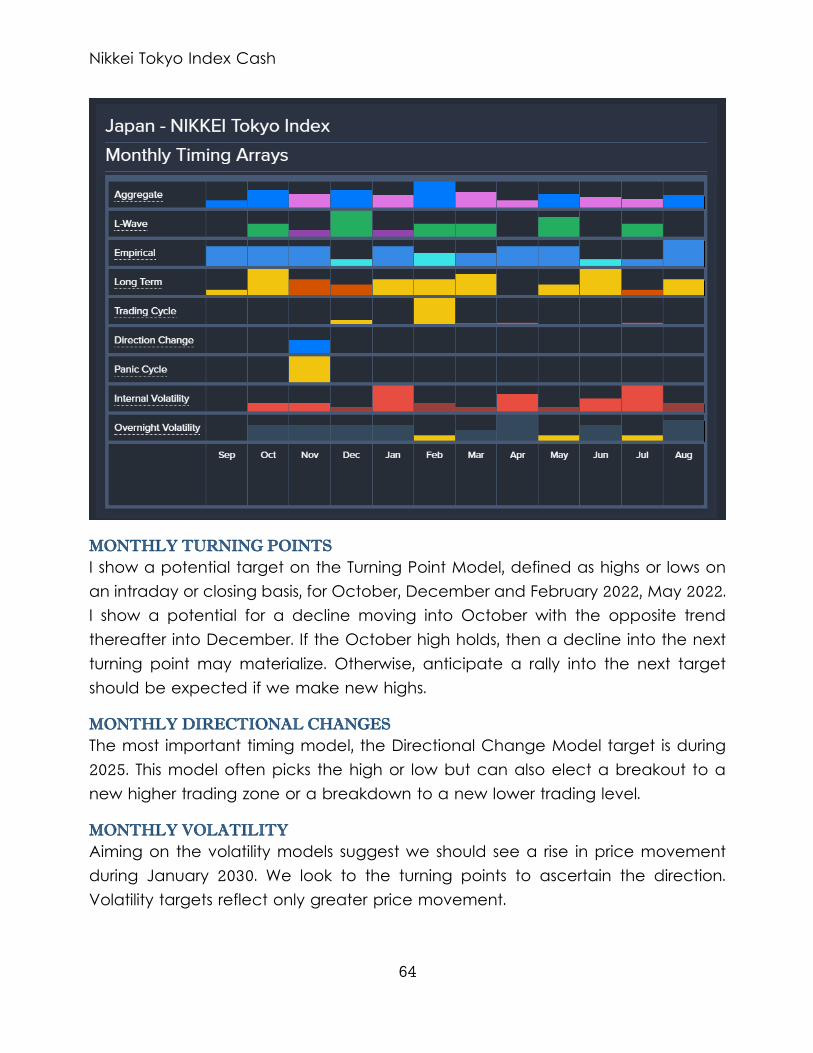
Nikkei Tokyo Index Cash
64
MONTHLY TURNING POINTS
I show a potential target on the Turning Point Model, defined as highs or lows on an intraday or closing basis, for October, December and February 2022, May 2022. I show a potential for a decline moving into October with the opposite trend thereafter into December. If the October high holds, then a decline into the next turning point may materialize. Otherwise, anticipate a rally into the next target should be expected if we make new highs.
MONTHLY DIRECTIONAL CHANGES
The most important timing model, the Directional Change Model target is during 2025. This model often picks the high or low but can also elect a breakout to a new higher trading zone or a breakdown to a new lower trading level.
MONTHLY VOLATILITY
Aiming on the volatility models suggest we should see a rise in price movement during January 2030. We look to the turning points to ascertain the direction. Volatility targets reflect only greater price movement.
Nikkei Tokyo Index Cash
65
MONTHLY BULLISH REVERSALS
The key Monthly Bullish Reversal stands overhead at 3048600. If this market rallies on a monthly closing basis above this level, then a breakout becomes possible. If we exceed that Reversal, then the next key resistance level to watch will be the next Monthly Bullish Reversal at 3137160.
MONTHLY BEARISH REVERSALS
The key Monthly Bearish Reversal below the market remains at 2738502. If this is breached on a monthly closing basis, then a further decline becomes entirely possible. If we penetrate that Reversal on a closing basis, then the next key support level to watch will be the next Monthly Bearish Reversal lies at 2700200.
HEDGING MODEL
From the Monthly Hedging Model employing only the Reversal System, we are currently long since May 2020 on that close when we reversed our hedge position in this market. This position should be maintained provided this market remains on a Monthly closing basis above the next Bearish Reversal on this level 2738502. If you want to reduce the exit strategy then use the next Weekly Reversal if we reach the timing objectives.
The Stochastics are in a mixed position. Keep in mind that this type of indicator tends to be more of a confirmation tool rather than a leading forecasting tool. Thus, it is more often than not just a lagging indicator. Nevertheless, the short-term oscillator is entering a crash mode suggesting we may see a decline from here.
On the Monthly Level, with respect to time, there is a prospect of a decline moving into October with the opposite trend implied thereafter into November which is also a Panic Cycle and a Directional Change (NOTE: this can be intraday or on a closing basis).
The strongest target in the Monthly array is February 2022 for a turning point ahead, at least on a closing basis. It does appear we have a choppy period starting September until February 2022 with each target producing the opposite direction for that 6-month period. Thereafter, we see the next target coming into play as April 2022 until May 2022 with again each target producing the opposite direction for that 2-month period.
Nikkei Tokyo Index Cash
66
However, the important target during that period will be May 2022. Still, when we look at the next higher time level, we see that a high formed during Quarterly. We have NOT elected any Bearish Reversals thus far to date. The first Monthly Bearish Reversal comes into play at 2738502. We have a Monthly Directional Change target due in November. This lines up with a turning point so in this case we can see at least an intraday event, or a turning point based on the close. Immediately, we see a Panic Cycle also due on this target so there could be an outside reversal or just a sharp move in one direction. When these two align, sometimes the Panic Cycle can affect the next target. Our volatility models also target this date as well. We also see a convergence in the Array with both the Directional Change and Panic Cycle lining up for the same target of November. This intensifies the importance of this target as an event on the horizon. Don't forget, a Directional Change can also be a sharp dramatic move in the same direction, not just a change in direction.
Monthly Level Indicator Description... Trend Immediate Trend ........... BULLISH Short-Term Momentum ....... - Neutral - Short-Term Trend .......... - Neutral - Intermediate Momentum ..... - Neutral - Intermediate Trend ........ BULLISH Long-Term Trend ........... BULLISH Cyclical Strength.......... BULLISH Broader Trend ............. BULLISH Long-Term Cyclical Trend .. BULLISH
MONTHLY CURRENCY CORRELATION
The NIKKEI Tokyo Index Cash did make a high in conjunction with the British pound on 07/01 yet in nominal terms the last high was created on 09/01 whereas the high in Australian dollar took place on 07/01, a high in the Canadian dollar was established on 07/01, a high in the Japanese yen was established on 07/01, a high in the Swiss franc was established on 07/01, a high in the Euro was established on 07/01, and a high in the Chinese yuan was 07/01.

Nikkei Tokyo Index Cash
67
In terms of a Basket of Currencies, we see that here this market has been neutral both in nominal and basket terms. In international terms, we have a divergence whereby this market last reached a high in nominal terms on 09/01 after the high in terms of a basket of currencies which came on 07/01 implying that this immediate rally is purely in domestic terms.
MARKET RISK FACTOR
NIKKEI Tokyo Index Cash Risk Table ----------------- UPSIDE RISK ----- DOWNSIDE RISK --- MONTHLY....... 2957990 | 2.811% | 2738502 | 4.817% | QUARTERLY..... 3026440 | 5.19% | 2170900 | 24.54% | YEARLY........ 3026440 | 5.19% | 1486400 | 48.33% |
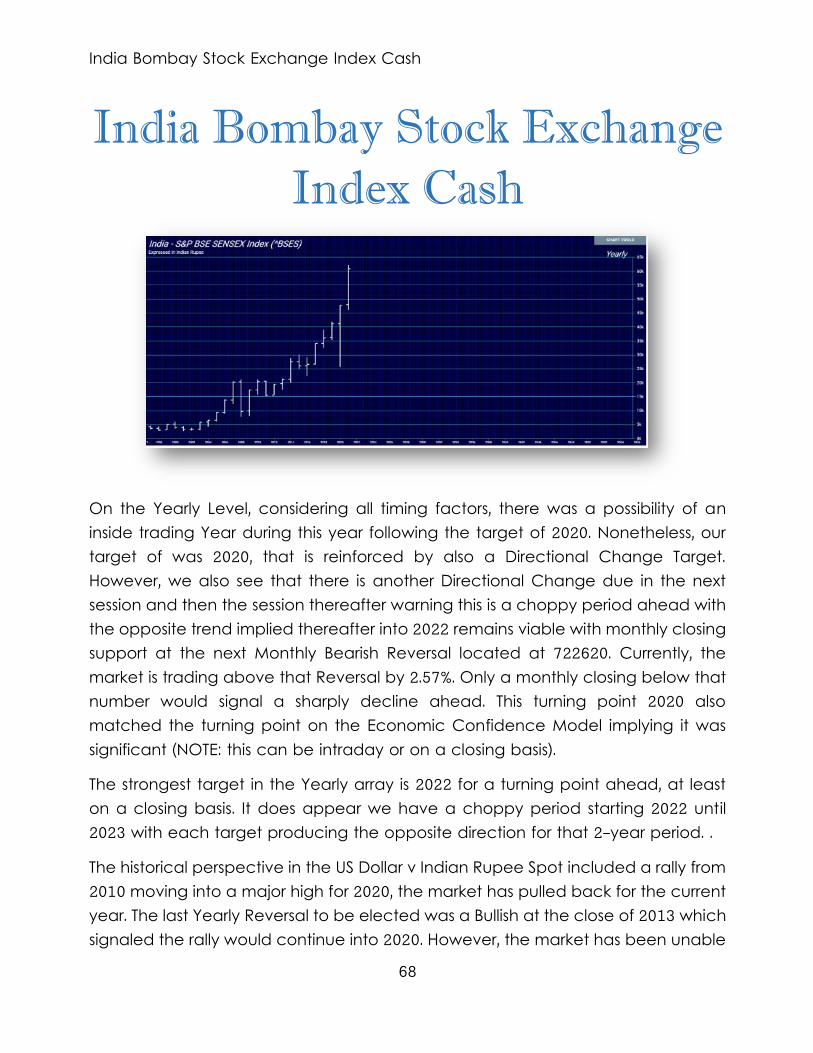
India Bombay Stock Exchange Index Cash
68
India Bombay Stock Exchange
Index Cash
On the Yearly Level, considering all timing factors, there was a possibility of an inside trading Year during this year following the target of 2020. Nonetheless, our target of was 2020, that is reinforced by also a Directional Change Target. However, we also see that there is another Directional Change due in the next session and then the session thereafter warning this is a choppy period ahead with the opposite trend implied thereafter into 2022 remains viable with monthly closing support at the next Monthly Bearish Reversal located at 722620. Currently, the market is trading above that Reversal by 2.57%. Only a monthly closing below that number would signal a sharply decline ahead. This turning point 2020 also matched the turning point on the Economic Confidence Model implying it was significant (NOTE: this can be intraday or on a closing basis).
The strongest target in the Yearly array is 2022 for a turning point ahead, at least on a closing basis. It does appear we have a choppy period starting 2022 until 2023 with each target producing the opposite direction for that 2-year period. .
The historical perspective in the US Dollar v Indian Rupee Spot included a rally from 2010 moving into a major high for 2020, the market has pulled back for the current year. The last Yearly Reversal to be elected was a Bullish at the close of 2013 which signaled the rally would continue into 2020. However, the market has been unable
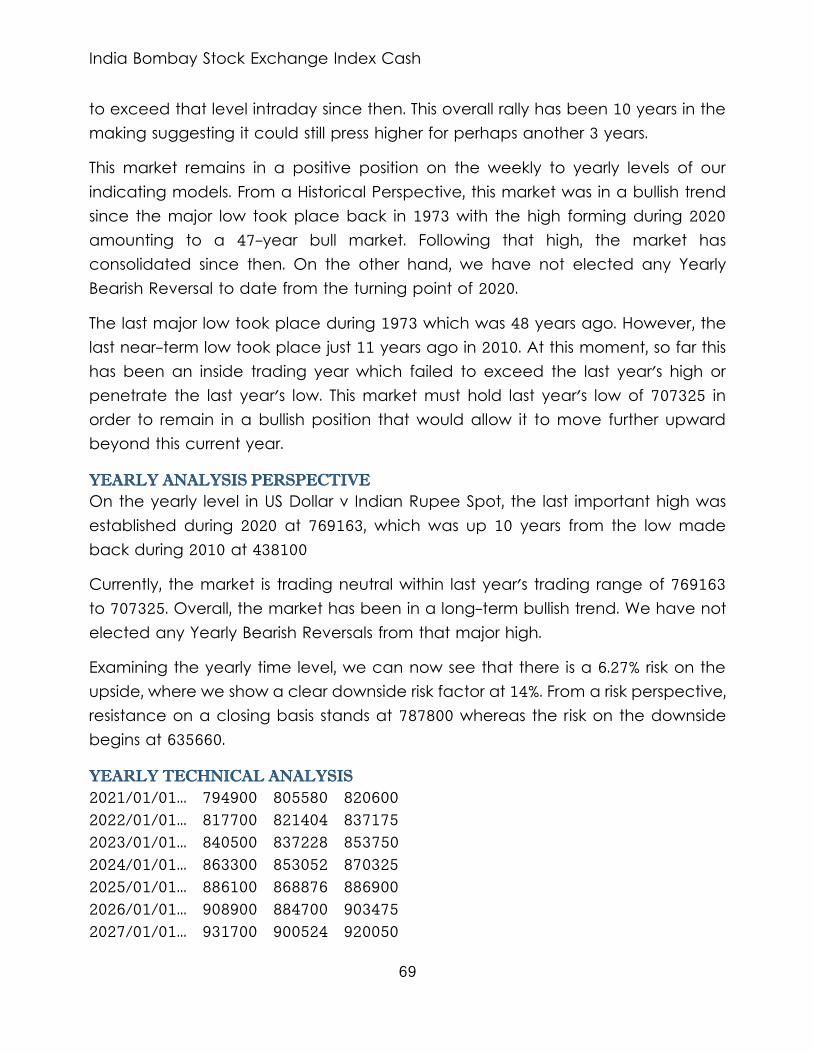
India Bombay Stock Exchange Index Cash
69
to exceed that level intraday since then. This overall rally has been 10 years in the making suggesting it could still press higher for perhaps another 3 years.
This market remains in a positive position on the weekly to yearly levels of our indicating models. From a Historical Perspective, this market was in a bullish trend since the major low took place back in 1973 with the high forming during 2020 amounting to a 47-year bull market. Following that high, the market has consolidated since then. On the other hand, we have not elected any Yearly Bearish Reversal to date from the turning point of 2020.
The last major low took place during 1973 which was 48 years ago. However, the last near-term low took place just 11 years ago in 2010. At this moment, so far this has been an inside trading year which failed to exceed the last year's high or penetrate the last year's low. This market must hold last year's low of 707325 in order to remain in a bullish position that would allow it to move further upward beyond this current year.
YEARLY ANALYSIS PERSPECTIVE
On the yearly level in US Dollar v Indian Rupee Spot, the last important high was established during 2020 at 769163, which was up 10 years from the low made back during 2010 at 438100
Currently, the market is trading neutral within last year's trading range of 769163 to 707325. Overall, the market has been in a long-term bullish trend. We have not elected any Yearly Bearish Reversals from that major high.
Examining the yearly time level, we can now see that there is a 6.27% risk on the upside, where we show a clear downside risk factor at 14%. From a risk perspective, resistance on a closing basis stands at 787800 whereas the risk on the downside begins at 635660.
YEARLY TECHNICAL ANALYSIS
2021/01/01... 794900 805580 820600 2022/01/01... 817700 821404 837175 2023/01/01... 840500 837228 853750 2024/01/01... 863300 853052 870325 2025/01/01... 886100 868876 886900 2026/01/01... 908900 884700 903475 2027/01/01... 931700 900524 920050
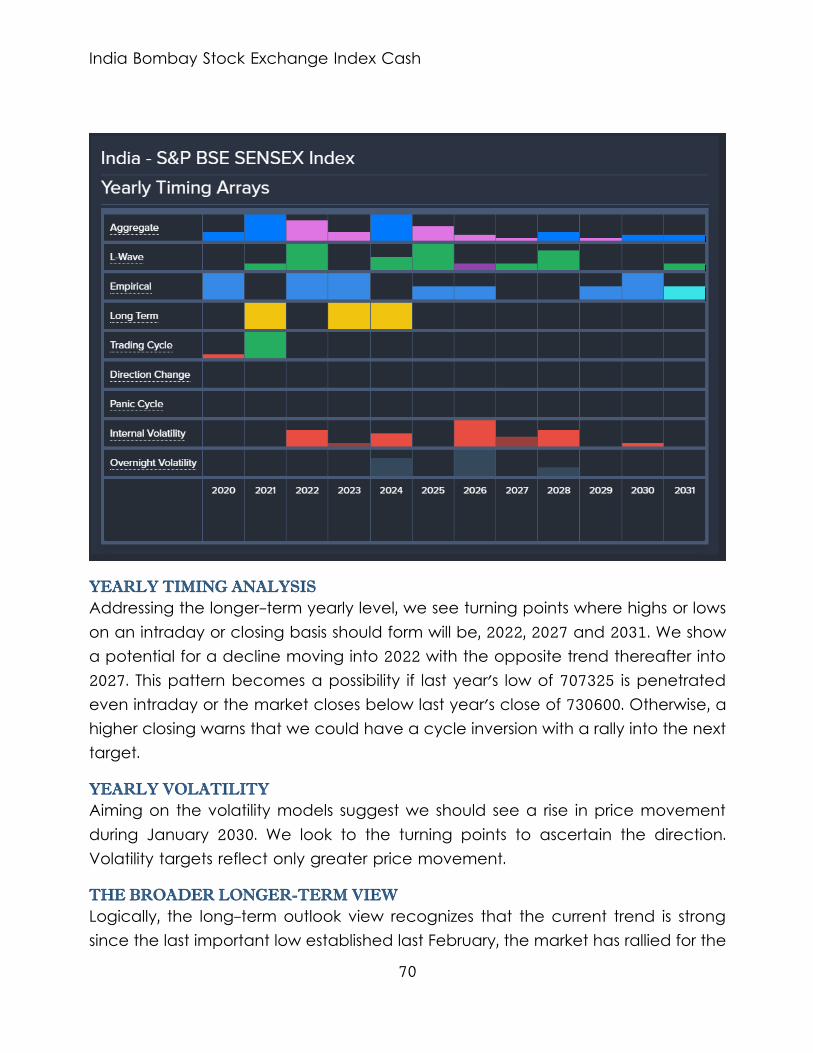
India Bombay Stock Exchange Index Cash
70
YEARLY TIMING ANALYSIS
Addressing the longer-term yearly level, we see turning points where highs or lows on an intraday or closing basis should form will be, 2022, 2027 and 2031. We show a potential for a decline moving into 2022 with the opposite trend thereafter into 2027. This pattern becomes a possibility if last year's low of 707325 is penetrated even intraday or the market closes below last year's close of 730600. Otherwise, a higher closing warns that we could have a cycle inversion with a rally into the next target.
YEARLY VOLATILITY
Aiming on the volatility models suggest we should see a rise in price movement during January 2030. We look to the turning points to ascertain the direction. Volatility targets reflect only greater price movement.
THE BROADER LONGER-TERM VIEW
Logically, the long-term outlook view recognizes that the current trend is strong since the last important low established last February, the market has rallied for the
India Bombay Stock Exchange Index Cash
71
past 2 months and we have exceeded last month's high. Furthermore, the US Dollar v Indian Rupee Spot remains somewhat neutral at this present moment trading within last year's range of 769163 and 707325. We are trading below last year's high of 769163 at this time.
INDICATING RANGE STUDY
Solely focusing on only the indicating ranges on the Yearly level in the US Dollar v Indian Rupee Spot, this market remains in a bullish position at this time with the underlying support beginning at 683513.
Yearly Indicating Ranges Immediate Trend .......... bullish Short-Term Momentum ...... bullish Short-Term Trend ......... bullish Intermediate Momentum .... bullish Intermedia Trend ......... bullish Long-Term Trend .......... bullish Cyclical Strength ........ bullish
TRADING ENVELOPE STUDY
NORMAL YEARLY TRADING ENVELOPE Last Close Was. 730600 Envelope Top... 718197 Internal AvgL.. 663840 Internal AvgH.. 702900 Envelope Btm... 488947
STOCHASTICS
The Stochastics are in a mixed position. Keep in mind that this type of indicator tends to be more of a confirmation tool rather than a leading forecasting tool. Thus, it is more often than not just a lagging indicator.
ENERGY MODELS
Looking at our Energy Models on the Yearly level, Immediately, our model continues to rally suggesting that a strong rally is likely.
India Bombay Stock Exchange Index Cash
72
SUPERPOSITION
----------------------------------------------
RARE SUPER POSITION EVENT We have elected Long-Term Weekly Bullish Reversal the week of September 27th, which has been negated by and Intermediate Bearish Reversal in a Superposition Event warning that this may prove to be a high. ----------------------------------------------
YEARLY FIBONACCI PROJECTIONS IN TIME
These are the Fibonacci Time targets for potential turning points ahead calculated from the 01/01/2020 HIGH:
Sun. 01/01/2023 Wed. 01/01/2025 Sat. 01/01/2028 Sat. 01/01/2033 Tue. 01/01/2041 Thu. 01/01/2054 Tue. 01/01/2075 Wed. 01/01/2109 Mon. 01/01/2164
Note: Once more, these are purely Fibonacci projections in Time. They should not be used independently, but they are more important as a correlation tool when the line up with the targets from our Timing Arrays.
YEARLY FIBONACCI RETRACEMENTS & PERCENTAGE MOVEMENTS
Here are the Fibonacci Percentage Retracements from the previous HIGH at 769163
23% | 587640 38% | 475343 61% | 293820 78% | 164601
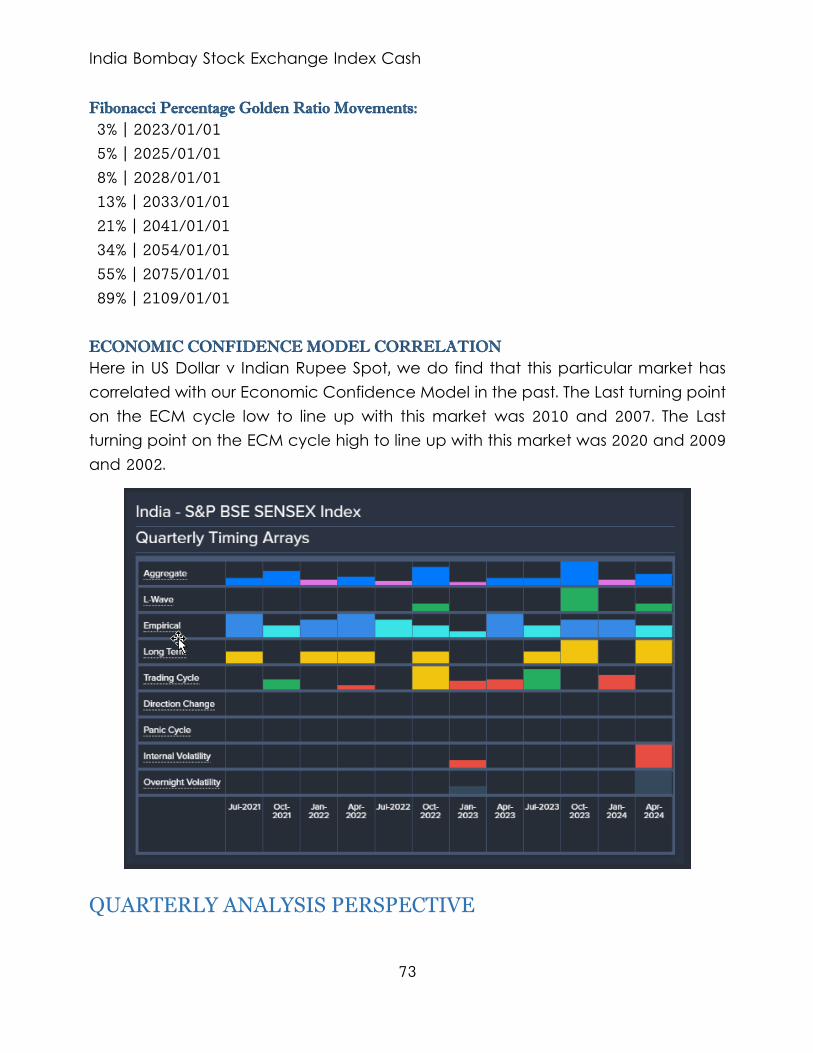
India Bombay Stock Exchange Index Cash
73
Fibonacci Percentage Golden Ratio Movements:
3% | 2023/01/01 5% | 2025/01/01 8% | 2028/01/01 13% | 2033/01/01 21% | 2041/01/01 34% | 2054/01/01 55% | 2075/01/01 89% | 2109/01/01
ECONOMIC CONFIDENCE MODEL CORRELATION
Here in US Dollar v Indian Rupee Spot, we do find that this particular market has correlated with our Economic Confidence Model in the past. The Last turning point on the ECM cycle low to line up with this market was 2010 and 2007. The Last turning point on the ECM cycle high to line up with this market was 2020 and 2009 and 2002.
QUARTERLY ANALYSIS PERSPECTIVE
India Bombay Stock Exchange Index Cash
74
HEDGING MODEL
From the Quarterly Hedging Model employing only the Reversal System, we are currently long since during the First Quarter 2021 on that close when we reversed our hedge position in this market. This position should be maintained provided this market remains on a Quarterly closing basis above the next Bearish Reversal on this level 683470. If you want to reduce the exit strategy then use the next Monthly Reversal if we reach the timing objectives.
The Stochastics are in a mixed position. Keep in mind that this type of indicator tends to be more of a confirmation tool rather than a leading forecasting tool. Thus, it is more often than not just a lagging indicator. Nevertheless, the short-term oscillator is entering a crash mode suggesting we may see a decline from here.
On the Quarterly Level, our first target for a turning point was The Third Quarter 2021 with a possible further decline thereafter into the Fourth Quarter 2021 (NOTE: this can be intraday or on a closing basis).
The strongest target in the Quarterly array is the Fourth Quarter 2023 for a turning point ahead, at least on a closing basis. It does appear we have a choppy period starting the Third Quarter 2021 until the Second Quarter 2022, but while we have a target arriving also on the First Quarter 2022, the key target remains the Third Quarter 2021 with each target producing the opposite direction for that 4-quarter period. We have a Quarterly Directional Change target due in the Fourth Quarter 2021. This lines up with a turning point so in this case we can see at least an intraday event, or a turning point based on the close. Don't forget, a Directional Change can also be a sharp dramatic move in the same direction, not just a change in direction.
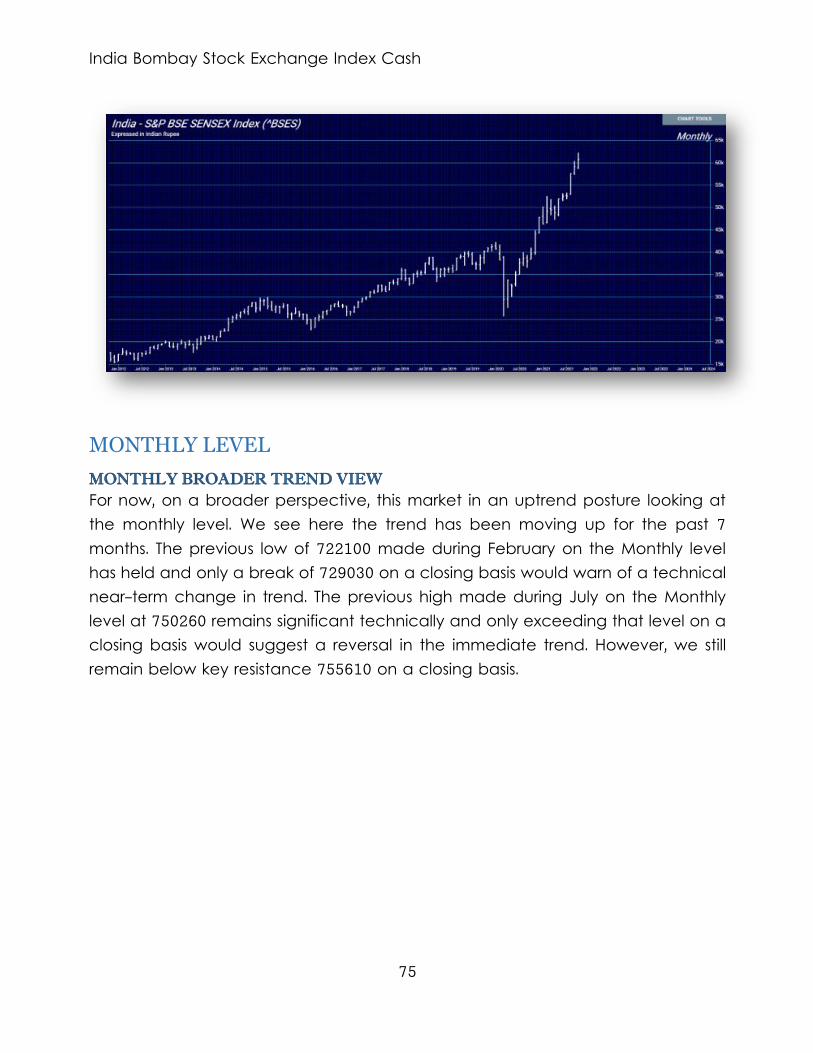
India Bombay Stock Exchange Index Cash
75
MONTHLY LEVEL
MONTHLY BROADER TREND VIEW
For now, on a broader perspective, this market in an uptrend posture looking at the monthly level. We see here the trend has been moving up for the past 7 months. The previous low of 722100 made during February on the Monthly level has held and only a break of 729030 on a closing basis would warn of a technical near-term change in trend. The previous high made during July on the Monthly level at 750260 remains significant technically and only exceeding that level on a closing basis would suggest a reversal in the immediate trend. However, we still remain below key resistance 755610 on a closing basis.
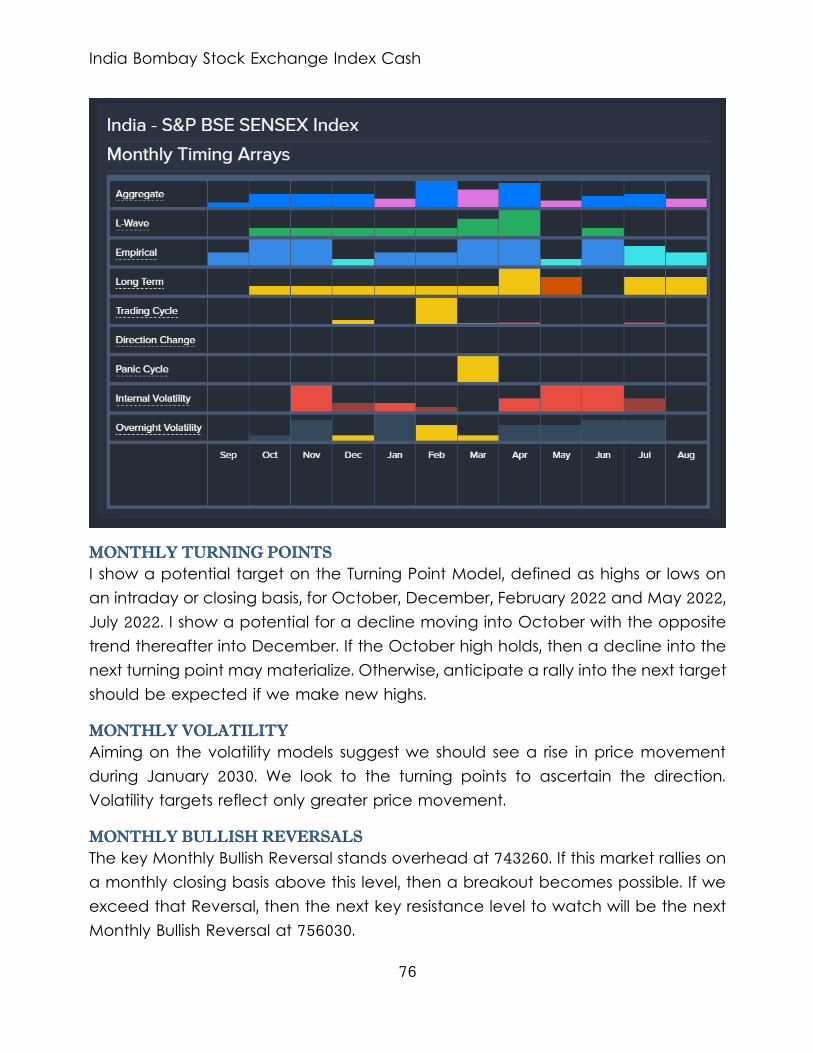
India Bombay Stock Exchange Index Cash
76
MONTHLY TURNING POINTS
I show a potential target on the Turning Point Model, defined as highs or lows on an intraday or closing basis, for October, December, February 2022 and May 2022, July 2022. I show a potential for a decline moving into October with the opposite trend thereafter into December. If the October high holds, then a decline into the next turning point may materialize. Otherwise, anticipate a rally into the next target should be expected if we make new highs.
MONTHLY VOLATILITY
Aiming on the volatility models suggest we should see a rise in price movement during January 2030. We look to the turning points to ascertain the direction. Volatility targets reflect only greater price movement.
MONTHLY BULLISH REVERSALS
The key Monthly Bullish Reversal stands overhead at 743260. If this market rallies on a monthly closing basis above this level, then a breakout becomes possible. If we exceed that Reversal, then the next key resistance level to watch will be the next Monthly Bullish Reversal at 756030.
India Bombay Stock Exchange Index Cash
77
MONTHLY BEARISH REVERSALS
The key Monthly Bearish Reversal below the market remains at 722620. If this is breached on a monthly closing basis, then a further decline becomes entirely possible. If we penetrate that Reversal on a closing basis, then the next key support level to watch will be the next Monthly Bearish Reversal lies at 722000.
MONTHLY ANALYSIS PERSPECTIVE
Up to this moment in time, we have exceeded last month's high so we have therefore generated a new What If Monthly Bearish Reversal which lies above the present trading level at the general area of 742210 warning that this rally has still not punched through important overhead resistance. A month end closing beneath this level will keep this market in a bearish tone.
HEDGING MODEL
From the Monthly Hedging Model employing only the Reversal System, we are currently long since August on that close when we reversed our hedge position in this market. This position should be maintained provided this market remains on a Monthly closing basis above the next Bearish Reversal on this level 722620. If you want to reduce the exit strategy then use the next Weekly Reversal if we reach the timing objectives.
The Stochastics are all in a bullish position. Keep in mind that this type of indicator tends to be more of a confirmation tool rather than a leading forecasting tool. Thus, it is more often than not just a lagging indicator. Nevertheless, the short-term oscillator is entering a breakout mode suggesting we may see a rally unfold.
On the Monthly Level, considering all timing factors, there is a possibility of a rally moving into October, that is reinforced by also a Directional Change Target. However, we also see that there is another Directional Change due in the next session and then the session thereafter warning this is a choppy period ahead with a continued rally if this session's high 743550 is exceeded moving thereafter into November (NOTE: this can be intraday or on a closing basis).
The strongest target in the Monthly array is February 2022 for a turning point ahead, at least on a closing basis. It does appear we have a choppy period starting September until February 2022 with each target producing the opposite direction for that 6-month period. Thereafter, we see the next target coming into play as
India Bombay Stock Exchange Index Cash
78
April 2022 until May 2022 with again each target producing the opposite direction for that 2-month period.
However, the important target during that period will be May 2022. Still, when we look at the next higher time level, we see that an inside trading session formed during Quarterly. We have overall 2 Monthly Directional Change targets ahead which align with a main turning points on the top line of the Array. Therefore, the targets of October should be an important target. Directional Change targets that align with the top line for turning points often unfold as the main cyclical events. Don't forget, a Directional Change can also be a sharp dramatic move in the same direction, not just a change in direction.
Monthly Level Indicator Description... Trend Immediate Trend ........... - Neutral - Short-Term Momentum ....... - Neutral - Short-Term Trend .......... - Neutral - Intermediate Momentum ..... BULLISH Intermediate Trend ........ - Neutral - Long-Term Trend ........... BULLISH Cyclical Strength.......... BULLISH Broader Trend ............. BULLISH Long-Term Cyclical Trend .. BULLISH
MARKET RISK FACTOR
US Dollar v Indian Rupee Spot Risk Table ----------------- UPSIDE RISK ----- DOWNSIDE RISK --- MONTHLY....... 743260 | 0.269% | 722620 | 2.514% | QUARTERLY..... 769170 | 3.765% | 683470 | 7.796% | YEARLY........ 787800 | 6.278% | 635660 | 14.24% |
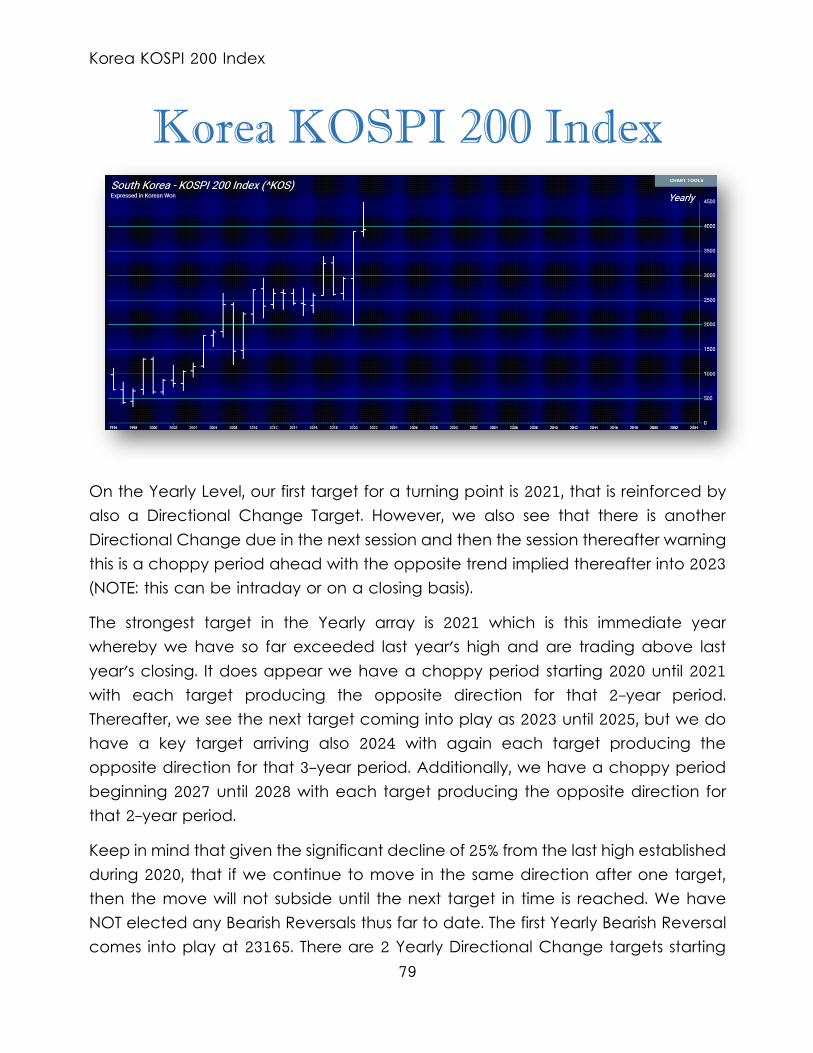
Korea KOSPI 200 Index
79
Korea KOSPI 200 Index
On the Yearly Level, our first target for a turning point is 2021, that is reinforced by also a Directional Change Target. However, we also see that there is another Directional Change due in the next session and then the session thereafter warning this is a choppy period ahead with the opposite trend implied thereafter into 2023 (NOTE: this can be intraday or on a closing basis).
The strongest target in the Yearly array is 2021 which is this immediate year whereby we have so far exceeded last year's high and are trading above last year's closing. It does appear we have a choppy period starting 2020 until 2021 with each target producing the opposite direction for that 2-year period. Thereafter, we see the next target coming into play as 2023 until 2025, but we do have a key target arriving also 2024 with again each target producing the opposite direction for that 3-year period. Additionally, we have a choppy period beginning 2027 until 2028 with each target producing the opposite direction for that 2-year period.
Keep in mind that given the significant decline of 25% from the last high established during 2020, that if we continue to move in the same direction after one target, then the move will not subside until the next target in time is reached. We have NOT elected any Bearish Reversals thus far to date. The first Yearly Bearish Reversal comes into play at 23165. There are 2 Yearly Directional Change targets starting
Korea KOSPI 200 Index
80
from 2021 to 2022 warning of a potential choppy swing period for these few Years. Don't forget, a Directional Change can also be a sharp dramatic move in the same direction, not just a change in direction.
The KOSPI 200 Index Cash has continued to make new historical highs over the course of the rally from 1998 moving into 2021. Prominently, we have elected two Bullish Reversals to date.
This market remains in a positive position on the weekly to yearly levels of our indicating models. From a Historical Perspective, this market was in a protracted bullish trend since the major low took place back in 1998 with the high forming during 2020. On the other hand, we have not elected any Yearly Bearish Reversal to date from the turning point of 2020.
The last major low took place during 1998 which was 23 years ago. However, the last near-term low took place just 1 years ago in 2020.
YEARLY ANALYSIS PERSPECTIVE
Strategically, in KOSPI 200 Index Cash, the last important low was established in 1998 from which we have rallied into the major high established during 2020 which was a bullish run for twenty-two years. Longer-term, the major cyclical low was formed back in 1998 which was a broad bull market run for twenty-two years.
Recently on the yearly level, the market has rallied exceeding last year's high reaching 44904 intraday and we are still trading above 39004 right now with a positive undertone. At this moment, the market is trading still holding above support in a bullish posture. This market came to test the Yearly Bearish Reversal at 23165 bottoming at 19627 but failed to close below it.
Right now, as stated, the market is trading above last year's high of 39004. Overall, the market has been in a long-term bullish trend. We have not elected any Yearly Bearish Reversals from that major high. Right now, the market is trading bullish above our yearly momentum indicators warning that support begins down at 33959.
Examining the yearly time level, we can now see that there is a 22% risk on the upside, where we show a clear downside risk factor at 41%. From a risk perspective,
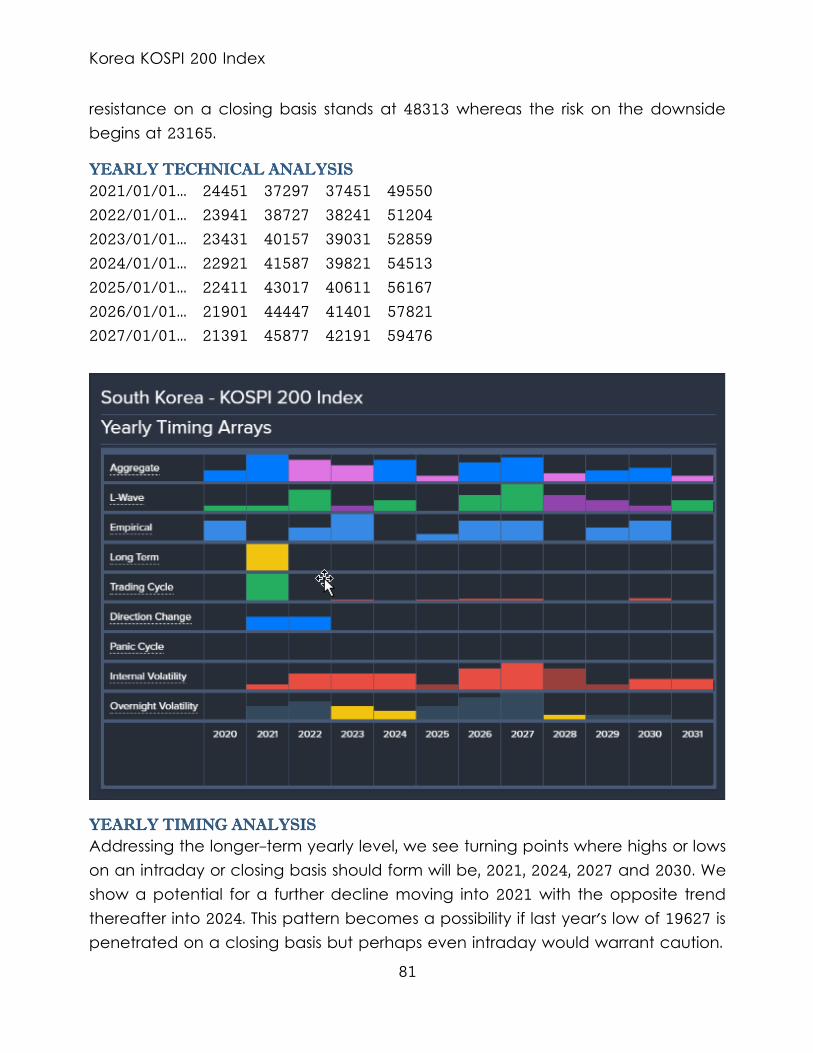
Korea KOSPI 200 Index
81
resistance on a closing basis stands at 48313 whereas the risk on the downside begins at 23165.
YEARLY TECHNICAL ANALYSIS
2021/01/01... 24451 37297 37451 49550 2022/01/01... 23941 38727 38241 51204 2023/01/01... 23431 40157 39031 52859 2024/01/01... 22921 41587 39821 54513 2025/01/01... 22411 43017 40611 56167 2026/01/01... 21901 44447 41401 57821 2027/01/01... 21391 45877 42191 59476
YEARLY TIMING ANALYSIS
Addressing the longer-term yearly level, we see turning points where highs or lows on an intraday or closing basis should form will be, 2021, 2024, 2027 and 2030. We show a potential for a further decline moving into 2021 with the opposite trend thereafter into 2024. This pattern becomes a possibility if last year's low of 19627 is penetrated on a closing basis but perhaps even intraday would warrant caution.
Korea KOSPI 200 Index
82
YEARLY DIRECTIONAL CHANGES
The most important timing model, the Directional Change Model targets are during 2021 and during 2022. This model often picks the high or low but can also elect a breakout to a new higher trading zone or a breakdown to a new lower trading level.
YEARLY VOLATILITY
Aiming on the volatility models suggest we should see a rise in price movement during January 2027. We look to the turning points to ascertain the direction. Volatility targets reflect only greater price movement.
THE BROADER LONGER-TERM VIEW
Logically, the long-term forecast view recognizes that the current directional movement since the low made back in March 2020 has been an extended Bullish trend in KOSPI 200 Index Cash. This trend remains in motion as long as we hold above 25730 on a monthly closing basis. It is incredibly important to identify the broader trend for that is the underlying tone. It is wise to take position counter-trend only with this understanding of what you are doing. We need to see a monthly closing back above 43225 to confirm the uptrend will recommence.
YEARLY OUTSIDE COMMENT
A closing above last year's high of 39004 will warn of perhaps new highs into next year. A closing below that number would warn that this year could be just a temporary high.
INDICATING RANGE STUDY
Solely focusing on only the indicating ranges on the Yearly level in the KOSPI 200 Index Cash, this market remains in a bullish position at this time with the underlying support beginning at 27283.
Yearly Indicating Ranges Immediate Trend .......... bullish Short-Term Momentum ...... bullish Short-Term Trend ......... bullish Intermediate Momentum .... bullish Intermedia Trend ......... bullish Long-Term Trend .......... bullish Cyclical Strength ........ neutral
Korea KOSPI 200 Index
83
TRADING ENVELOPE STUDY
NORMAL YEARLY TRADING ENVELOPE Last Close Was. 38929 Envelope Top... 32358 Internal AvgL.. 23784 Internal AvgH.. 31117 Envelope Btm... 20256
STOCHASTICS
The Stochastics are all in a bullish position. Keep in mind that this type of indicator tends to be more of a confirmation tool rather than a leading forecasting tool. Thus, it is more often than not just a lagging indicator.
ENERGY MODELS
Looking at our Energy Models on the Yearly level, the historical high took place back in 2011 whereas the actual market high in price unfolded back in 2020. When Energy peaks BEFORE the price high, this is indicative of a major important high is forming and that we may see a serious change in trend to the downside thereafter.
REVERSAL COMMENTARY
On our Yearly Hypothetical Models, clearly, we see that we have Yearly Bearish Reversals that would be generated if we see another new high penetrating 44904. These Tentative Hypothetical Bearish Reversals would rest at 5654, 15389, 23943, and 25907, whereas a close below the previous low 19627 would tend to suggest that these Tentative Hypothetical Reversals will then become fixed as long as the high holds thereafter for at least several days. Moreover, the election of any of these Tentative Hypothetical Bearish Reversals during this next session would signal a decline is unfolding and that such a high may stand. However, if we continue to make new highs, then these Tentative Hypothetical Reversals will be replaced by a new set until the high becomes fixed.
YEARLY FIBONACCI PROJECTIONS IN TIME
These are the Fibonacci Time targets for potential turning points ahead calculated from the 01/01/2020 HIGH:
Korea KOSPI 200 Index
84
Sun. 01/01/2023 Wed. 01/01/2025 Sat. 01/01/2028 Sat. 01/01/2033 Tue. 01/01/2041 Thu. 01/01/2054 Tue. 01/01/2075 Wed. 01/01/2109 Mon. 01/01/2164 Note: Once more, these are purely Fibonacci projections in Time. They should not be used independently, but they are more important as a correlation tool when the line up with the targets from our Timing Arrays.
YEARLY FIBONACCI RETRACEMENTS & PERCENTAGE MOVEMENTS
Here are the Fibonacci Percentage Retracements from the previous HIGH at 39004 23% | 29799 38% | 24104 61% | 14900 78% | 8347 Fibonacci Percentage Golden Ratio Movements:
3% | 2023/01/01 5% | 2025/01/01 8% | 2028/01/01 13% | 2033/01/01 21% | 2041/01/01 34% | 2054/01/01 55% | 2075/01/01 89% | 2109/01/01
ECONOMIC CONFIDENCE MODEL CORRELATION
Here in KOSPI 200 Index Cash, we do find that this particular market has correlated with our Economic Confidence Model in the past. The Last turning point on the ECM cycle low to line up with this market was 2020 and 2001 and 1998. The Last
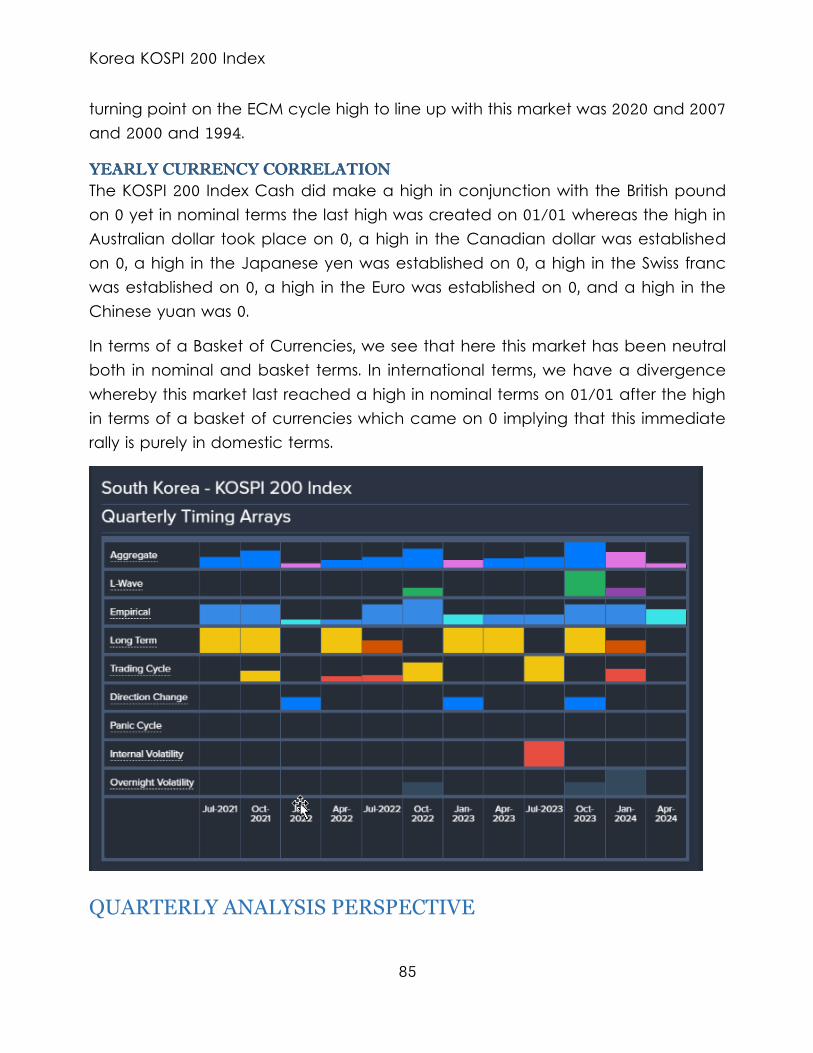
Korea KOSPI 200 Index
85
turning point on the ECM cycle high to line up with this market was 2020 and 2007 and 2000 and 1994.
YEARLY CURRENCY CORRELATION
The KOSPI 200 Index Cash did make a high in conjunction with the British pound on 0 yet in nominal terms the last high was created on 01/01 whereas the high in Australian dollar took place on 0, a high in the Canadian dollar was established on 0, a high in the Japanese yen was established on 0, a high in the Swiss franc was established on 0, a high in the Euro was established on 0, and a high in the Chinese yuan was 0.
In terms of a Basket of Currencies, we see that here this market has been neutral both in nominal and basket terms. In international terms, we have a divergence whereby this market last reached a high in nominal terms on 01/01 after the high in terms of a basket of currencies which came on 0 implying that this immediate rally is purely in domestic terms.
QUARTERLY ANALYSIS PERSPECTIVE
Korea KOSPI 200 Index
86
HEDGING MODEL
From the Quarterly Hedging Model employing only the Reversal System, we are currently long since during the Second Quarter 2020 on that close when we reversed our hedge position in this market. This position should be maintained provided this market remains on a Quarterly closing basis above the next Bearish Reversal on this level 26070. If you want to reduce the exit strategy then use the next Monthly Reversal if we reach the timing objectives.
The Stochastics are in a mixed position. Keep in mind that this type of indicator tends to be more of a confirmation tool rather than a leading forecasting tool. Thus, it is more often than not just a lagging indicator. Nevertheless, the short-term oscillator is entering a crash mode suggesting we may see a decline from here.
On the Quarterly Level, our first target for a turning point is The Fourth Quarter 2021 with the opposite trend implied thereafter into the First Quarter 2022 which is a Directional Change (NOTE: this can be intraday or on a closing basis).
The strongest target in the Quarterly array is the Fourth Quarter 2023 for a turning point ahead, at least on a closing basis. It does appear we have a choppy period starting the Third Quarter 2021 until the First Quarter 2022, but we do have a key target arriving also on the Fourth Quarter 2021 with each target producing the opposite direction for that 3-quarter period. Thereafter, we see the next target coming into play as the Fourth Quarter 2022 until the First Quarter 2023 with again each target producing the opposite direction for that 2-quarter period.
Keep in mind that given the sharp decline of 11% from the last high established the First Quarter 2021, that if we continue to move in the same direction after one target, then the move will not subside until the next target in time is reached. We have NOT elected any Bearish Reversals thus far to date. The first Quarterly Bearish Reversal comes into play at 26070. We have overall 3 Quarterly Directional Change targets ahead which align with a main turning points on the top line of the Array. Therefore, the targets of the Fourth Quarter 2023 should be an important target. Directional Change targets that align with the top line for turning points often unfold as the main cyclical events. Don't forget, a Directional Change can also be a sharp dramatic move in the same direction, not just a change in direction.

Korea KOSPI 200 Index
87
QUARTERLY CURRENCY CORRELATION
The KOSPI 200 Index Cash did make a high in conjunction with the British pound on 01/01 yet in nominal terms the last high was created on 01/01 whereas the high in Australian dollar took place on 01/01, a high in the Canadian dollar was established on 01/01, a high in the Japanese yen was established on 01/01, a high in the Swiss franc was established on 01/01, a high in the Euro was established on 01/01, and a high in the Chinese yuan was 01/01.
In terms of a Basket of Currencies, we see that here this market has been neutral both in nominal and basket terms. In international terms, we have a divergence whereby this market last reached a high in nominal terms on 01/01 after the high in terms of a basket of currencies which came on 01/01 implying that this immediate rally is purely in domestic terms.
MONTHLY LEVEL
MONTHLY ANALYSIS PERSPECTIVE
Up to this moment in time, we have broken below last month's low and that means we have generated a new What-If Monthly Bullish Reversal which lies above the present trading level at the general area of 44231 warning that this decline has still not punched through important overhead resistance. A monthly closing beneath this level will keep this market in a bearish tone.
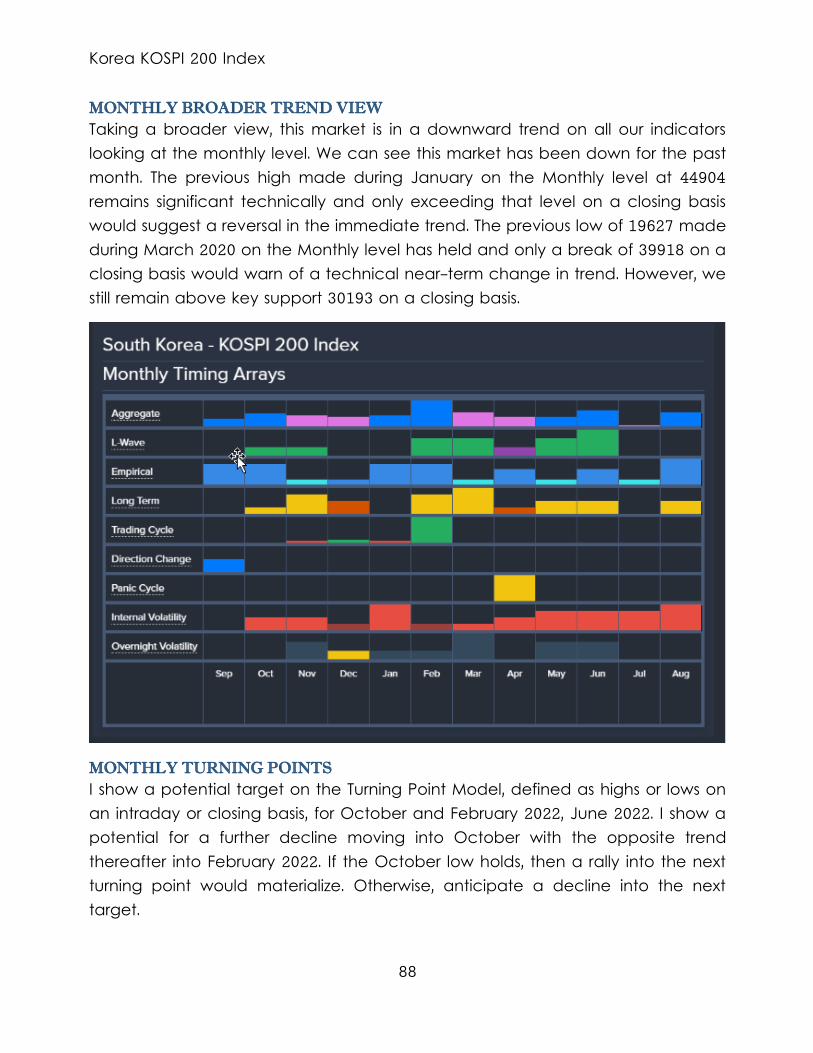
Korea KOSPI 200 Index
88
MONTHLY BROADER TREND VIEW
Taking a broader view, this market is in a downward trend on all our indicators looking at the monthly level. We can see this market has been down for the past month. The previous high made during January on the Monthly level at 44904 remains significant technically and only exceeding that level on a closing basis would suggest a reversal in the immediate trend. The previous low of 19627 made during March 2020 on the Monthly level has held and only a break of 39918 on a closing basis would warn of a technical near-term change in trend. However, we still remain above key support 30193 on a closing basis.
MONTHLY TURNING POINTS
I show a potential target on the Turning Point Model, defined as highs or lows on an intraday or closing basis, for October and February 2022, June 2022. I show a potential for a further decline moving into October with the opposite trend thereafter into February 2022. If the October low holds, then a rally into the next turning point would materialize. Otherwise, anticipate a decline into the next target.
Korea KOSPI 200 Index
89
MONTHLY DIRECTIONAL CHANGES
The most important timing model, the Directional Change Model targets are during 2021 and during 2022. This model often picks the high or low but can also elect a breakout to a new higher trading zone or a breakdown to a new lower trading level.
MONTHLY VOLATILITY
Aiming on the volatility models suggest we should see a rise in price movement during January 2027. We look to the turning points to ascertain the direction. Volatility targets reflect only greater price movement.
MONTHLY BULLISH REVERSALS
The key Monthly Bullish Reversal stands overhead at 43670. If this market rallies on a monthly closing basis above this level, then a breakout becomes possible. If we exceed that Reversal, then the next key resistance level to watch will be the next Monthly Bullish Reversal at 44900.
MONTHLY BEARISH REVERSALS
The key Monthly Bearish Reversal below the market remains at 30155. If this is breached on a monthly closing basis, then a further decline becomes entirely possible. If we penetrate that Reversal on a closing basis, then the next key support level to watch will be the next Monthly Bearish Reversal lies at 24990.
HEDGING MODEL
From the Monthly Hedging Model employing only the Reversal System, we are currently long since June 2020 on that close when we reversed our hedge position in this market. This position should be maintained provided this market remains on a Monthly closing basis above the next Bearish Reversal on this level 30155. If you want to reduce the exit strategy then use the next Weekly Reversal if we reach the timing objectives.
The Stochastics are in a mixed position. Keep in mind that this type of indicator tends to be more of a confirmation tool rather than a leading forecasting tool. Thus, it is more often than not just a lagging indicator.
On the Monthly Level, timing Models are always critical and there is a chance of a further decline moving into October with the opposite trend implied thereafter into December. However, a break of this current month's trading range of 40052 -
Korea KOSPI 200 Index
90
39414 would warn of a possible cycle inversion given we have a target this month. (NOTE: this can be intraday or on a closing basis).
The strongest target in the Monthly array is February 2022 for a turning point ahead, at least on a closing basis. It does appear we have a choppy period starting September until October with each target producing the opposite direction for that 2-month period.
Keep in mind that given the sharp decline of 11% from the last high established January, that if we continue to move in the same direction after one target, then the move will not subside until the next target in time is reached. We have NOT elected any Bearish Reversals thus far to date. The first Monthly Bearish Reversal comes into play at 30155. We have a Monthly Directional Change target due in September. This lines up with a turning point so in this case we can see at least an intraday event, or a turning point based on the close. Don't forget, a Directional Change can also be a sharp dramatic move in the same direction, not just a change in direction.
Monthly Level Indicator Description... Trend Immediate Trend ........... - Neutral - Short-Term Momentum ....... (Bearish) Short-Term Trend .......... (Bearish) Intermediate Momentum ..... - Neutral - Intermediate Trend ........ BULLISH Long-Term Trend ........... BULLISH Cyclical Strength.......... BULLISH Broader Trend ............. BULLISH Long-Term Cyclical Trend .. BULLISH
MONTHLY CURRENCY CORRELATION
The KOSPI 200 Index Cash did make a high in conjunction with the British pound on 07/01 yet in nominal terms the last high was created on 01/01 whereas the high in Australian dollar took place on 07/01, a high in the Canadian dollar was established on 07/01, a high in the Japanese yen was established on 07/01, a high in the Swiss franc was established on 07/01, a high in the Euro was established on 07/01, and a high in the Chinese yuan was 07/01.
Korea KOSPI 200 Index
91
In terms of a Basket of Currencies, we see that here this market has been neutral while in nominal terms, it has rallied. In international terms, we have a divergence whereby this market last reached a high in nominal terms on 01/01 after the high in terms of a basket of currencies which came on 07/01 implying that this immediate rally is purely in domestic terms.
MARKET RISK FACTOR
KOSPI 200 Index Cash Risk Table ----------------- UPSIDE RISK ----- DOWNSIDE RISK --- MONTHLY....... 43670 | 10.61% | 30155 | 23.61% | QUARTERLY..... 51962 | 31.61% | 26070 | 33.96% | YEARLY........ 48313 | 22.37% | 23165 | 41.32% |
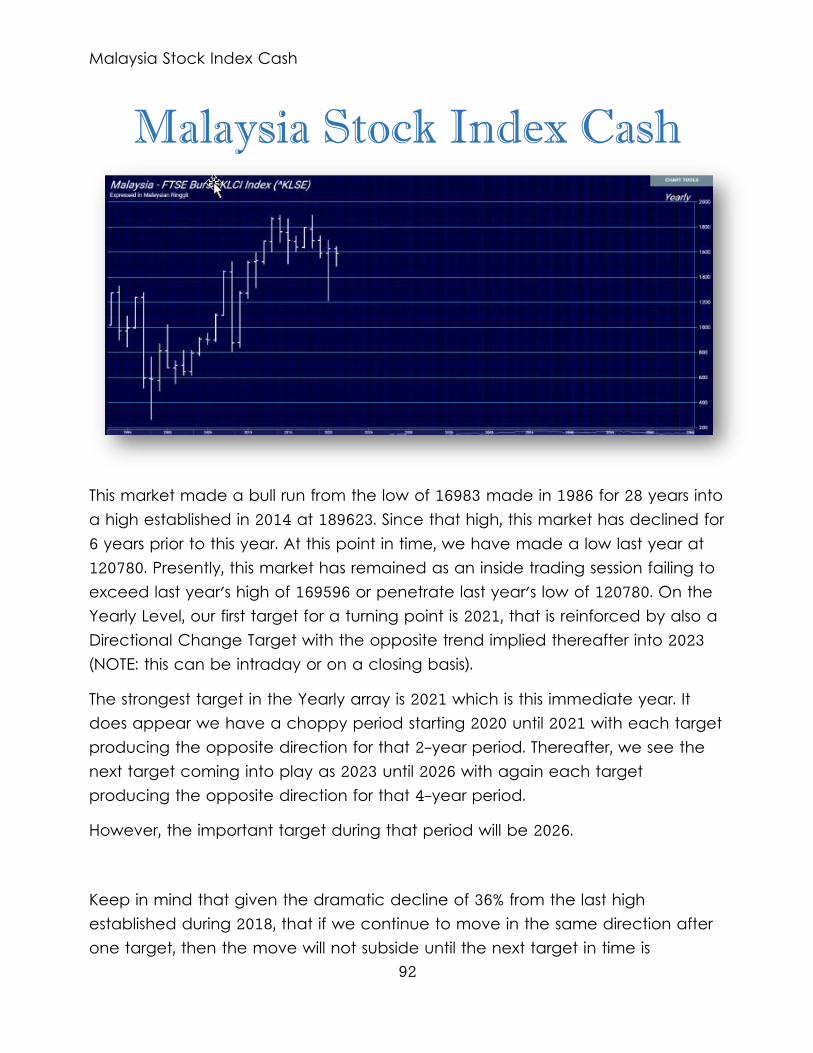
Malaysia Stock Index Cash
92
Malaysia Stock Index Cash
This market made a bull run from the low of 16983 made in 1986 for 28 years into a high established in 2014 at 189623. Since that high, this market has declined for 6 years prior to this year. At this point in time, we have made a low last year at 120780. Presently, this market has remained as an inside trading session failing to exceed last year's high of 169596 or penetrate last year's low of 120780. On the Yearly Level, our first target for a turning point is 2021, that is reinforced by also a Directional Change Target with the opposite trend implied thereafter into 2023 (NOTE: this can be intraday or on a closing basis).
The strongest target in the Yearly array is 2021 which is this immediate year. It does appear we have a choppy period starting 2020 until 2021 with each target producing the opposite direction for that 2-year period. Thereafter, we see the next target coming into play as 2023 until 2026 with again each target producing the opposite direction for that 4-year period.
However, the important target during that period will be 2026.
Keep in mind that given the dramatic decline of 36% from the last high established during 2018, that if we continue to move in the same direction after one target, then the move will not subside until the next target in time is
Malaysia Stock Index Cash
93
reached. We have elected 1 Bearish Reversal from the last high thus far to date. We have a Yearly Directional Change target due in 2021. This lines up with a turning point so in this case we can see at least an intraday event, or a turning point based on the close. Our volatility models also target this date as well. Don't forget, a Directional Change can also be a sharp dramatic move in the same direction, not just a change in direction.
While the historical perspective of the of this market included a decline from the major high established back in 2014 moving into a major low in 2020, the market has bounced back for the last year. The last Yearly Reversal to be elected was a Bearish at the close of 2019.
This market remains in a positive position on the weekly to yearly levels of our indicating models. From a Historical Perspective, ever since the low of 1986, there have been 3 major lows with each being higher than the previous which is indicative of a protracted long-term bull market. The last major low was established back in 2020 with the high forming during 2014. This decline has thus been 6 years so from a timing perspective, this may be a panic cycle low and caution is warranted. We are currently trading neutral within the yearly range of 189623 to 167182 but more so on the weaker side. Even so, we have not elected any Yearly Bearish Reversal to date from the turning point of 2014.
The last major low took place during 2020 which was last year. .
YEARLY ANALYSIS PERSPECTIVE
On the yearly level in Malaysia Stock Index Cash, the last important low was established during 2020 at 120780, which was down 6 years from the high made back during 2014 at 189623. To date, we have a 6-year low in place as of 2020, which warns that there is a potential for a rally failing to make new lows below 120780. However, the highest closing was during 2013 at 186696 whereas the intraday high formed in 2014.
Currently, the market is trading neutral within last year's trading range of 169596 to 120780. Overall, the market has been in a long-term bearish trend. At this time, the market is trading in a bearish position below our yearly momentum indicators warning resistance starts at 163067.
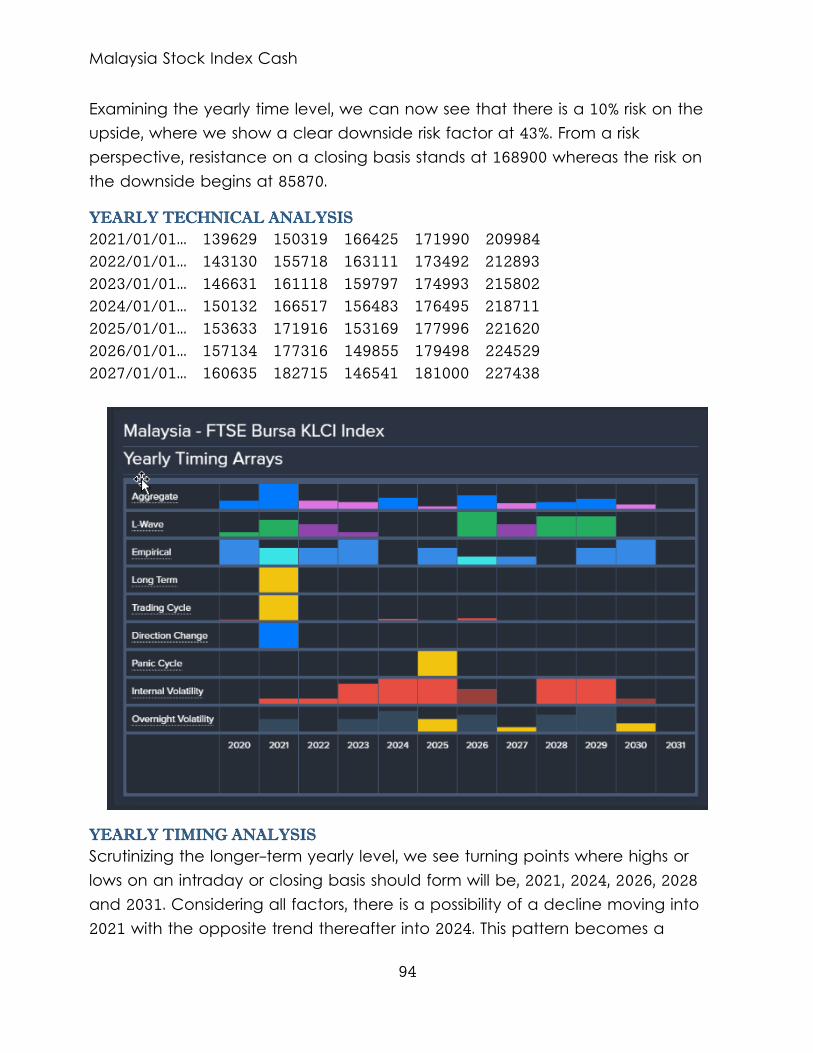
Malaysia Stock Index Cash
94
Examining the yearly time level, we can now see that there is a 10% risk on the upside, where we show a clear downside risk factor at 43%. From a risk perspective, resistance on a closing basis stands at 168900 whereas the risk on the downside begins at 85870.
YEARLY TECHNICAL ANALYSIS
2021/01/01... 139629 150319 166425 171990 209984 2022/01/01... 143130 155718 163111 173492 212893 2023/01/01... 146631 161118 159797 174993 215802 2024/01/01... 150132 166517 156483 176495 218711 2025/01/01... 153633 171916 153169 177996 221620 2026/01/01... 157134 177316 149855 179498 224529 2027/01/01... 160635 182715 146541 181000 227438
YEARLY TIMING ANALYSIS
Scrutinizing the longer-term yearly level, we see turning points where highs or lows on an intraday or closing basis should form will be, 2021, 2024, 2026, 2028 and 2031. Considering all factors, there is a possibility of a decline moving into 2021 with the opposite trend thereafter into 2024. This pattern becomes a
Malaysia Stock Index Cash
95
possibility if last year's low of 120780 is penetrated even intraday or the market closes below last year's close of 164441. Otherwise, a higher closing warns that we could have a cycle inversion with a rally into the next target.
YEARLY DIRECTIONAL CHANGES
Focusing an important timing model, the Directional Change Model target is during 2021. This model often picks the high or low but can also elect a breakout to a new higher trading zone or a breakdown to a new lower trading level.
YEARLY VOLATILITY
Glancing at the volatility models suggest we should see a rise in price movement during January 2030. We look to the turning points to ascertain the direction. Volatility targets reflect only greater price movement.
YEARLY PANIC CYCLES
Focusing on the potential for sharp movement, our Panic Cycle target, for the next period to watch is during 2031. This is beyond the peak in the next Economic Confidence Model due in 2024. Keep in mind that a Panic Cycle differs from just volatility. This can be either an outside reversal or a sharp move in only one direction. Panic Cycles can be either up or down. Watch the Stochastics and the reversals to determine the best indication of the potential direction.
THE BROADER LONGER-TERM VIEW
Obviously, the broader-term outlook view recognizes that the current bullish progression in Malaysia Stock Index Cash reflects a major low may be forming since we have not elected any Yearly sell signals on our model. Furthermore, the Malaysia Stock Index Cash remains somewhat neutral at this present moment trading within last year's range of 169596 and 120780. Presently, we have made a reaction low in 2020 which was a 6-year decline. Since that reaction low of 2020, this market has bounced up to now this year, but it remains still within last year's trading range of 169596 to 120780. We are trading below last year's high of 169596 at this time.
INDICATING RANGE STUDY
Focusing on our perspective using the indicating ranges on the Yearly level in the Malaysia Stock Index Cash, this market remains moderately bullish currently with
Malaysia Stock Index Cash
96
underlying support beginning at 160092 and overhead resistance forming above at 168895. The market is trading closer to the resistance level at this time.
Yearly Indicating Ranges Immediate Trend .......... neutral Short-Term Momentum ...... neutral Short-Term Trend ......... neutral Intermediate Momentum .... neutral Intermedia Trend ......... bullish Long-Term Trend .......... bullish Cyclical Strength ........ bullish
TRADING ENVELOPE STUDY
NORMAL YEARLY TRADING ENVELOPE Last Close Was. 164441 Envelope Top... 199528 Internal AvgL.. 152295 Internal AvgH.. 180199 Envelope Btm... 116950 STOCHASTICS
The Stochastics are on the short term are in a negative position. Keep in mind that this type of indicator tends to be more of a confirmation tool rather than a leading forecasting tool. Thus, it is more often than not just a lagging indicator.
ENERGY MODELS
Looking at our Energy Models on the Yearly level, the historical high took place back in 2014 whereas the actual market high in price unfolded back in 2014.
YEARLY FIBONACCI PROJECTIONS IN TIME
These are the Fibonacci Time targets for potential turning points ahead calculated from the 01/01/2020 LOW:
Sun. 01/01/2023 Wed. 01/01/2025 Sat. 01/01/2028 Sat. 01/01/2033 Tue. 01/01/2041 Thu. 01/01/2054
Malaysia Stock Index Cash
97
Tue. 01/01/2075 Wed. 01/01/2109 Mon. 01/01/2164
Note: Once more, these are purely Fibonacci projections in Time. They should not be used independently, but they are more important as a correlation tool when the line up with the targets from our Timing Arrays.
YEARLY FIBONACCI RETRACEMENTS & PERCENTAGE MOVEMENTS
Here are the Fibonacci Percentage Retracements from the previous LOW at 120780
23% | 149284 38% | 166918 61% | 195422 78% | 215713 Fibonacci Percentage Golden Ratio Movements:
3% | 2023/01/01 5% | 2025/01/01 8% | 2028/01/01 13% | 2033/01/01 21% | 2041/01/01 34% | 2054/01/01 55% | 2075/01/01 89% | 2109/01/01 144% | 2164/01/01 ECONOMIC CONFIDENCE MODEL CORRELATION
Here in Malaysia Stock Index Cash, we do find that this particular market has correlated with our Economic Confidence Model in the past. The Last turning point on the ECM cycle low to line up with this market was 2020 and 2015 and 2001 and 1998. The Last turning point on the ECM cycle high to line up with this market was 2018 and 2000 and 1994.
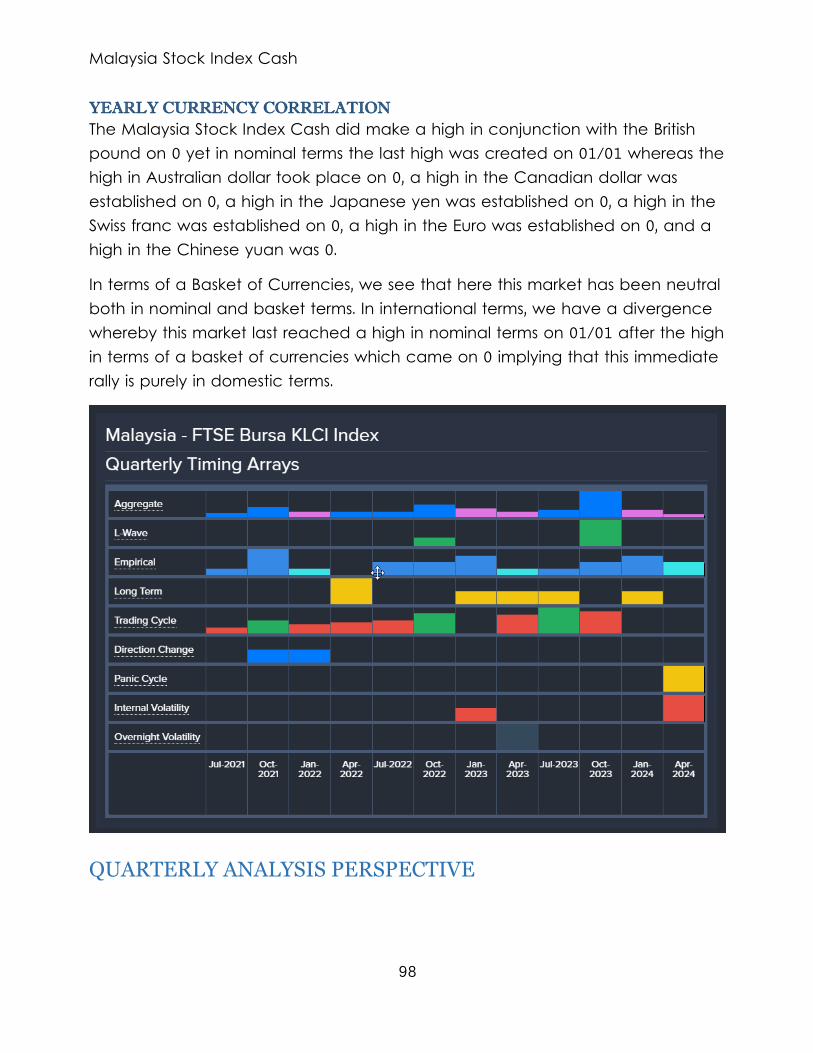
Malaysia Stock Index Cash
98
YEARLY CURRENCY CORRELATION
The Malaysia Stock Index Cash did make a high in conjunction with the British pound on 0 yet in nominal terms the last high was created on 01/01 whereas the high in Australian dollar took place on 0, a high in the Canadian dollar was established on 0, a high in the Japanese yen was established on 0, a high in the Swiss franc was established on 0, a high in the Euro was established on 0, and a high in the Chinese yuan was 0.
In terms of a Basket of Currencies, we see that here this market has been neutral both in nominal and basket terms. In international terms, we have a divergence whereby this market last reached a high in nominal terms on 01/01 after the high in terms of a basket of currencies which came on 0 implying that this immediate rally is purely in domestic terms.
QUARTERLY ANALYSIS PERSPECTIVE
Malaysia Stock Index Cash
99
HEDGING MODEL
By means of our Quarterly Hedging Model using only the Reversal System, we are currently short since during the Third Quarter 2019 on that close when we reversed our hedge position in this market. This position should be maintained provided this market remains on a Quarterly closing basis below the next Bullish Reversal on this level 161802. If you want to reduce the exit strategy then use the next Monthly Reversal if we reach the timing objectives.
The Stochastics are all in a bullish position. Keep in mind that this type of indicator tends to be more of a confirmation tool rather than a leading forecasting tool. Thus, it is more often than not just a lagging indicator. Nevertheless, the short-term oscillator is entering a crash mode suggesting we may see a decline from here.
On the Quarterly Level, our first target for a turning point is The Fourth Quarter 2021, that is reinforced by also a Directional Change Target. However, we also see that there is another Directional Change due in the next session with the opposite trend implied thereafter into the Fourth Quarter 2022 (NOTE: this can be intraday or on a closing basis).
The strongest target in the Quarterly array is the First Quarter 2024 for a turning point ahead, at least on a closing basis. It does appear we have a choppy period starting the Third Quarter 2021 until the Fourth Quarter 2021 with each target producing the opposite direction for that 2-quarter period.
Keep in mind that given the sharp decline of 12% from the last high established the Fourth Quarter 2020, that if we continue to move in the same direction after one target, then the move will not subside until the next target in time is reached. We have elected 4 Bearish Reversals from the last high thus far to date. There are 2 Quarterly Directional Change targets starting from the Fourth Quarter 2021 to the First Quarter 2022 warning of a potential choppy swing period for these few Quarters. Don't forget, a Directional Change can also be a sharp dramatic move in the same direction, not just a change in direction.
QUARTERLY CURRENCY CORRELATION
The Malaysia Stock Index Cash did make a high in conjunction with the British pound on 01/01 yet in nominal terms the last high was created on 10/01 whereas the high in Australian dollar took place on 01/01, a high in the
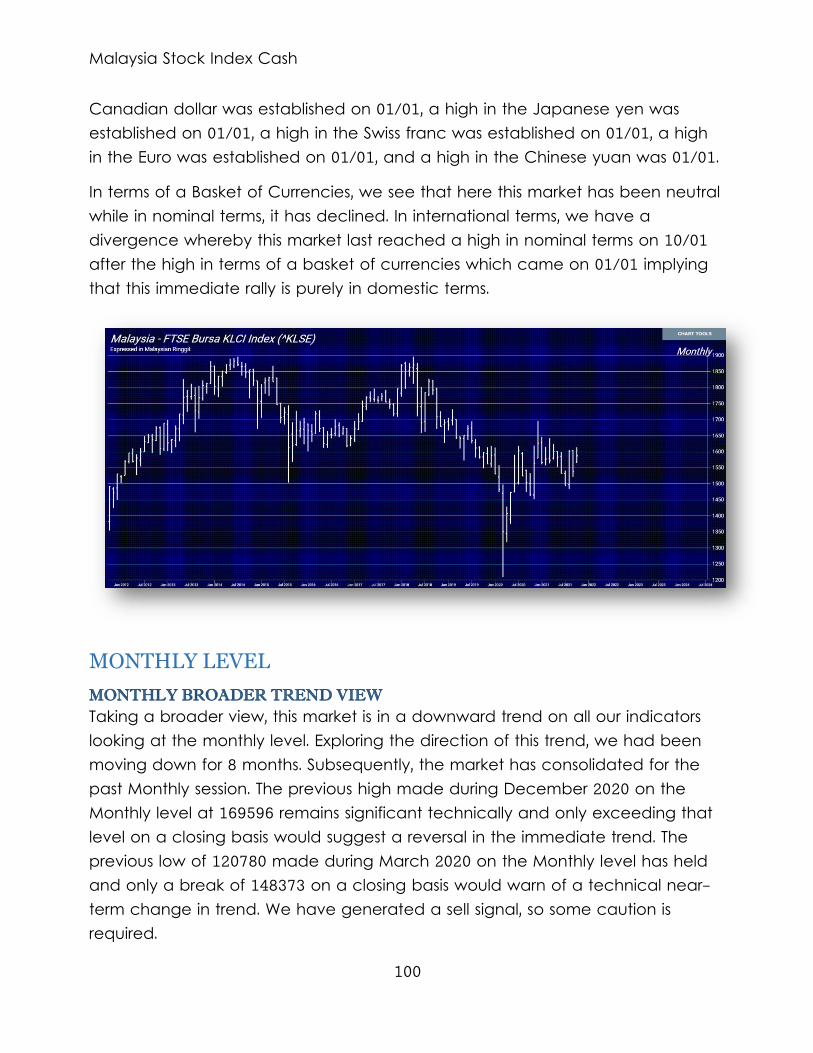
Malaysia Stock Index Cash
100
Canadian dollar was established on 01/01, a high in the Japanese yen was established on 01/01, a high in the Swiss franc was established on 01/01, a high in the Euro was established on 01/01, and a high in the Chinese yuan was 01/01.
In terms of a Basket of Currencies, we see that here this market has been neutral while in nominal terms, it has declined. In international terms, we have a divergence whereby this market last reached a high in nominal terms on 10/01 after the high in terms of a basket of currencies which came on 01/01 implying that this immediate rally is purely in domestic terms.
MONTHLY LEVEL
MONTHLY BROADER TREND VIEW
Taking a broader view, this market is in a downward trend on all our indicators looking at the monthly level. Exploring the direction of this trend, we had been moving down for 8 months. Subsequently, the market has consolidated for the past Monthly session. The previous high made during December 2020 on the Monthly level at 169596 remains significant technically and only exceeding that level on a closing basis would suggest a reversal in the immediate trend. The previous low of 120780 made during March 2020 on the Monthly level has held and only a break of 148373 on a closing basis would warn of a technical near-term change in trend. We have generated a sell signal, so some caution is required.
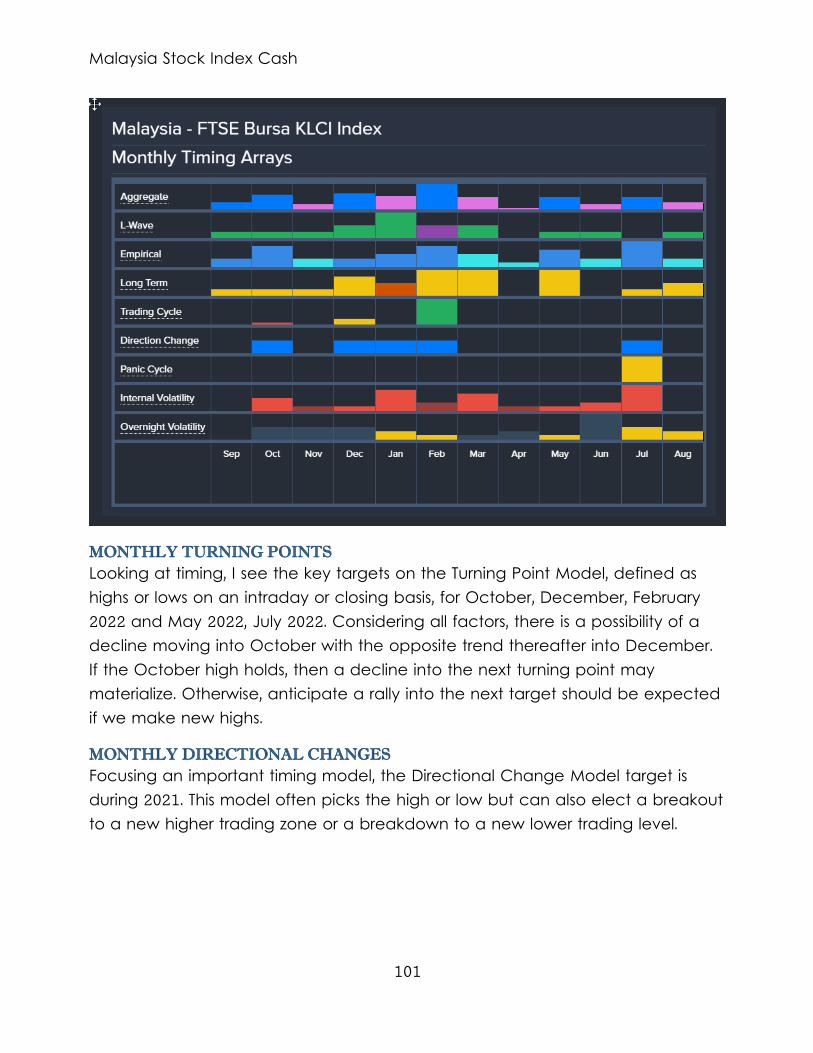
Malaysia Stock Index Cash
101
MONTHLY TURNING POINTS
Looking at timing, I see the key targets on the Turning Point Model, defined as highs or lows on an intraday or closing basis, for October, December, February 2022 and May 2022, July 2022. Considering all factors, there is a possibility of a decline moving into October with the opposite trend thereafter into December. If the October high holds, then a decline into the next turning point may materialize. Otherwise, anticipate a rally into the next target should be expected if we make new highs.
MONTHLY DIRECTIONAL CHANGES
Focusing an important timing model, the Directional Change Model target is during 2021. This model often picks the high or low but can also elect a breakout to a new higher trading zone or a breakdown to a new lower trading level.

Malaysia Stock Index Cash
102
MONTHLY VOLATILITY
Glancing at the volatility models suggest we should see a rise in price movement during January 2030. We look to the turning points to ascertain the direction. Volatility targets reflect only greater price movement.
MONTHLY PANIC CYCLES
Focusing on the potential for sharp movement, our Panic Cycle target, for the next period to watch is during 2031. This is beyond the peak in the next Economic Confidence Model due in 2024. Keep in mind that a Panic Cycle differs from just volatility. This can be either an outside reversal or a sharp move in only one direction. Panic Cycles can be either up or down. Watch the Stochastics and the reversals to determine the best indication of the potential direction.
MONTHLY BULLISH REVERSALS
The key Monthly Bullish Reversal stands overhead at 163920. If this market rallies on a monthly closing basis above this level, then a breakout becomes possible. If we exceed that Reversal, then the next key resistance level to watch will be the next Monthly Bullish Reversal at 169600.
MONTHLY BEARISH REVERSALS
The key Monthly Bearish Reversal below the market remains at 131680. If this is breached on a monthly closing basis, then a further decline becomes entirely possible. If we penetrate that Reversal on a closing basis, then the next key support level to watch will be the next Monthly Bearish Reversal lies at 120770.
HEDGING MODEL
Using our Monthly Hedging Model based on the Reversal System exclusively, we are currently long since August on that close when we reversed our hedge position in this market. This position should be maintained provided this market remains on a Monthly closing basis above the next Bearish Reversal on this level 131680. If you want to reduce the exit strategy then use the next Weekly Reversal if we reach the timing objectives.
The Stochastics are all in a bearish position. Keep in mind that this type of indicator tends to be more of a confirmation tool rather than a leading forecasting tool. Thus, it is more often than not just a lagging indicator.
Malaysia Stock Index Cash
103
Nevertheless, the short-term oscillator is entering a crash mode suggesting we may see a decline from here.
On the Monthly Level, regarding the timing, there is a reasonable potential of a decline moving into October, that is reinforced by also a Directional Change Target. However, we also see that there is another Directional Change due in the next session and then the session thereafter warning this is a choppy period ahead with the opposite trend implied thereafter into November (NOTE: this can be intraday or on a closing basis).
The strongest target in the Monthly array is February 2022 for a turning point ahead, at least on a closing basis. It does appear we have a choppy period starting September until February 2022 with each target producing the opposite direction for that 6-month period. Thereafter, we see the next target coming into play as April 2022 until July 2022 with again each target producing the opposite direction for that 4-month period.
However, the important target during that period will be July 2022. Still, when we look at the next higher time level, we see that a high formed during Quarterly.
Keep in mind that given the sharp decline of 10% from the last high established December 2020, that if we continue to move in the same direction after one target, then the move will not subside until the next target in time is reached. We have elected 3 Bearish Reversals from the last high thus far to date. There are 5 Monthly Directional Change targets starting from October to February 2022 suggesting a choppy coiling period for 3 Months. We also see a convergence in the Array with both the Directional Change and Panic Cycle lining up for the same target of July 2022. This amplifies the importance of this target as an event on the horizon. Don't forget, a Directional Change can also be a sharp dramatic move in the same direction, not just a change in direction.
Monthly Level Indicator Description... Trend Immediate Trend ........... - Neutral - Short-Term Momentum ....... (Bearish) Short-Term Trend .......... (Bearish) Intermediate Momentum ..... (Bearish)
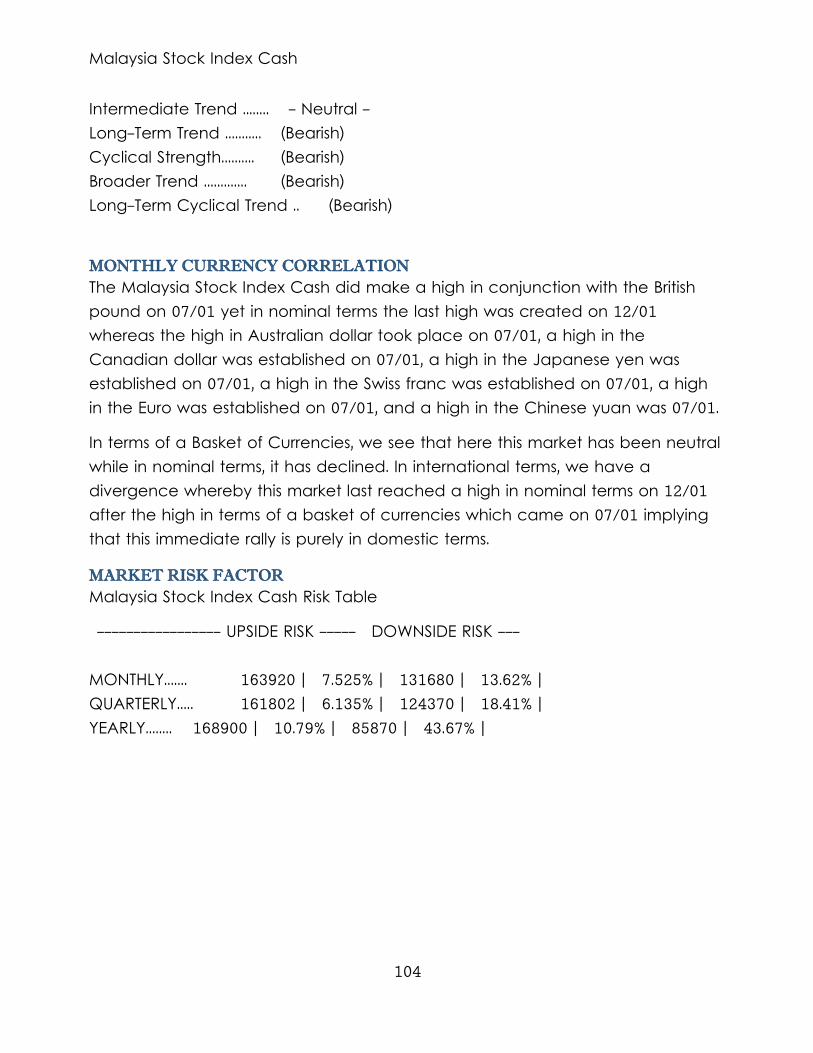
Malaysia Stock Index Cash
104
Intermediate Trend ........ - Neutral - Long-Term Trend ........... (Bearish) Cyclical Strength.......... (Bearish) Broader Trend ............. (Bearish) Long-Term Cyclical Trend .. (Bearish)
MONTHLY CURRENCY CORRELATION
The Malaysia Stock Index Cash did make a high in conjunction with the British pound on 07/01 yet in nominal terms the last high was created on 12/01 whereas the high in Australian dollar took place on 07/01, a high in the Canadian dollar was established on 07/01, a high in the Japanese yen was established on 07/01, a high in the Swiss franc was established on 07/01, a high in the Euro was established on 07/01, and a high in the Chinese yuan was 07/01.
In terms of a Basket of Currencies, we see that here this market has been neutral while in nominal terms, it has declined. In international terms, we have a divergence whereby this market last reached a high in nominal terms on 12/01 after the high in terms of a basket of currencies which came on 07/01 implying that this immediate rally is purely in domestic terms.
MARKET RISK FACTOR
Malaysia Stock Index Cash Risk Table
----------------- UPSIDE RISK ----- DOWNSIDE RISK --- MONTHLY....... 163920 | 7.525% | 131680 | 13.62% | QUARTERLY..... 161802 | 6.135% | 124370 | 18.41% | YEARLY........ 168900 | 10.79% | 85870 | 43.67% |
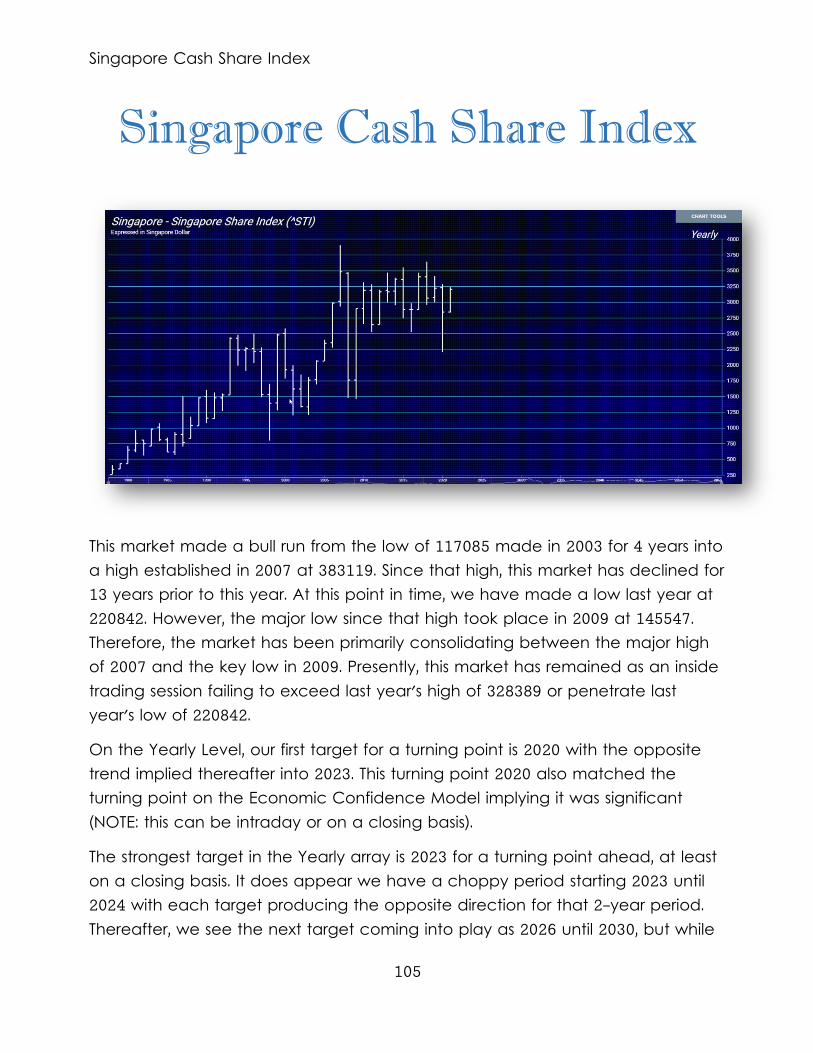
Singapore Cash Share Index
105
Singapore Cash Share Index
This market made a bull run from the low of 117085 made in 2003 for 4 years into a high established in 2007 at 383119. Since that high, this market has declined for 13 years prior to this year. At this point in time, we have made a low last year at 220842. However, the major low since that high took place in 2009 at 145547. Therefore, the market has been primarily consolidating between the major high of 2007 and the key low in 2009. Presently, this market has remained as an inside trading session failing to exceed last year's high of 328389 or penetrate last year's low of 220842.
On the Yearly Level, our first target for a turning point is 2020 with the opposite trend implied thereafter into 2023. This turning point 2020 also matched the turning point on the Economic Confidence Model implying it was significant (NOTE: this can be intraday or on a closing basis).
The strongest target in the Yearly array is 2023 for a turning point ahead, at least on a closing basis. It does appear we have a choppy period starting 2023 until 2024 with each target producing the opposite direction for that 2-year period. Thereafter, we see the next target coming into play as 2026 until 2030, but while
Singapore Cash Share Index
106
we have a target arriving also on 2028, the key target remains 2026 with again each target producing the opposite direction for that 5-year period.
Keep in mind that given the dramatic decline of 39% from the last high established during 2018, that if we continue to move in the same direction after one target, then the move will not subside until the next target in time is reached. We have elected 1 Bearish Reversal from the last high thus far to date.
The historical perspective in the Singapore Cash Share Index included a rally from 2009 moving into a major high for 2018, from which the market has been in a bearish trend since then moving into the low in 2020 forming a reactionary trend of 2 years bottoming at 220842. Distinctly, we have not elected any Yearly Bearish Reversal to date from the turning point of 2007, which tends to warn that the 2018 high will stand. Notwithstanding, we have a reactionary rally in play since the 2020 low, which tends to imply the market would at least hold temporarily only above that low. Presently, we have elected 1 Bullish Reversal suggesting that this reaction low will hold at least provisionally for now.
Curiously, the market has been only consolidating since that 2020 low and has been unable to exceed the high of that year while holding the low. The last Yearly Reversal to be elected was a Rare Yearly Superposition Event on the closing of 2020 meaning it elected. Here we elected short-term Bullish Reversal and closed lower against short-term Bearish Reversal.
This market remains in a positive position on the weekly to yearly levels of our indicating models. From a Historical Perspective, ever since the low of 2003, there have been 2 major lows with each being higher than the previous which is indicative of a protracted long-term bull market. The last major low was established back in 2009 with the high forming during 2007. This decline has thus been 2 years. We are currently trading neutral within the yearly range of 383119 to 289166 but more so on the weaker side. Distinctly, we have not elected any Yearly Bearish Reversal to date from the turning point of 2007.
The last major low took place during 2020 which was last year. .
YEARLY ANALYSIS PERSPECTIVE
On the yearly level in Singapore Cash Share Index, the last important high was established during 2018 at 364165, which was up 9 years from the low made
Singapore Cash Share Index
107
back during 2009 at 145547. To date, we have a 2-year reaction low in place as of 2009, so we have consolidated for the past 11 years since that event. This implies that we have exceeded a plain reaction period with the high forming at 364165 during 2018. The market has generated a moderate sell signal from this reaction high signaling caution ahead. However, the highest closing was during 2017 at 340292 whereas the intraday high formed in 2018.
Currently, the market is trading neutral within last year's trading range of 328389 to 220842. From that major high, we have elected one Yearly Bearish Reversal at 295300. However, we have seen a correction from that high for 2 years forming the low during 2020.
Examining the yearly time level, we can now see that there is a 4.74% risk on the upside, where we show a clear downside risk factor at 17%. From a risk perspective, resistance on a closing basis stands at 319580 whereas the risk on the downside begins at 252180.
YEARLY TECHNICAL ANALYSIS
2021/01/01... 329484 333885 2022/01/01... 344812 330368 2023/01/01... 360141 326851 2024/01/01... 375469 323335 2025/01/01... 390797 319818 2026/01/01... 406125 316301 2027/01/01... 421453 312784
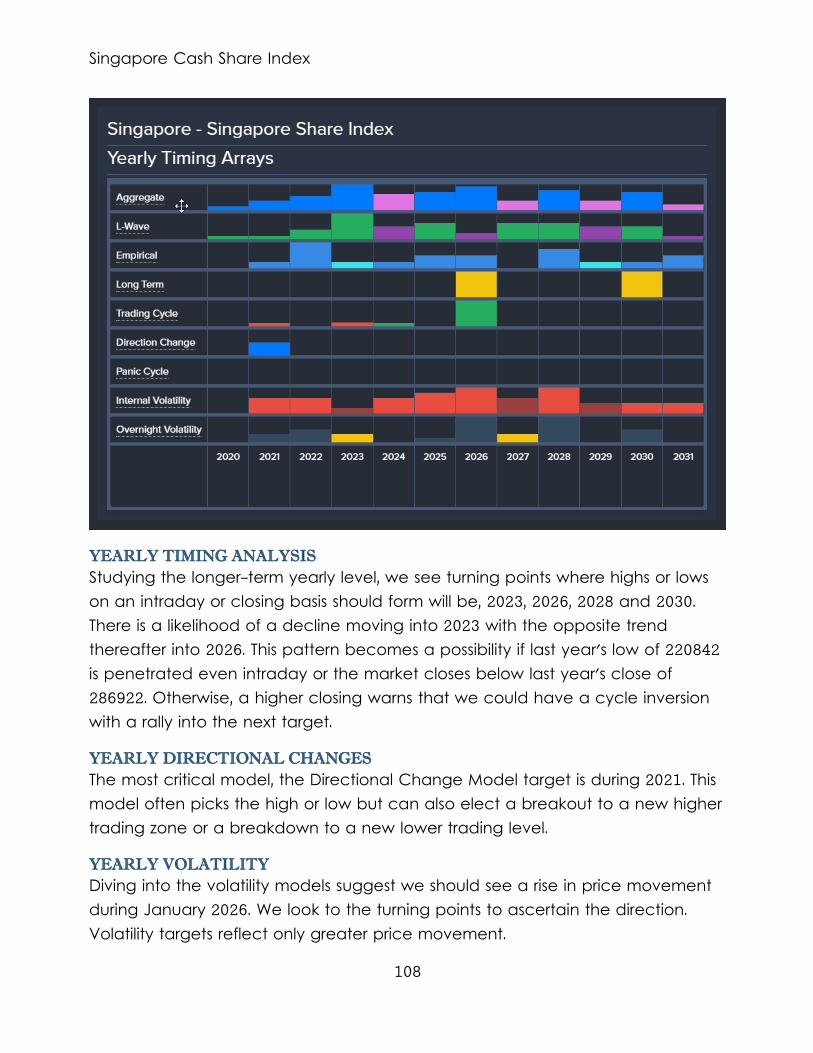
Singapore Cash Share Index
108
YEARLY TIMING ANALYSIS
Studying the longer-term yearly level, we see turning points where highs or lows on an intraday or closing basis should form will be, 2023, 2026, 2028 and 2030. There is a likelihood of a decline moving into 2023 with the opposite trend thereafter into 2026. This pattern becomes a possibility if last year's low of 220842 is penetrated even intraday or the market closes below last year's close of 286922. Otherwise, a higher closing warns that we could have a cycle inversion with a rally into the next target.
YEARLY DIRECTIONAL CHANGES
The most critical model, the Directional Change Model target is during 2021. This model often picks the high or low but can also elect a breakout to a new higher trading zone or a breakdown to a new lower trading level.
YEARLY VOLATILITY
Diving into the volatility models suggest we should see a rise in price movement during January 2026. We look to the turning points to ascertain the direction. Volatility targets reflect only greater price movement.
Singapore Cash Share Index
109
THE BROADER LONGER-TERM VIEW
Manifestly, the longstanding expectation in Singapore Cash Share Index remains somewhat neutral at best as the major high of 2007 has not been exceeded. To date, we have seen a protracted decline for the last overall 14 years. We have held last year's low of 220842. The main correction low after the 2007 high took place in 2009. The decline from the 2007 high was 2 years. This collapse to new recent lows has been rather dramatic thus far dropping 62% from the high of 2007 established at 383119 down to immediate low at 145547 of 2009. There has remained a risk of pushing the decline into in real terms adjusted for inflation.
INDICATING RANGE STUDY
Solely focusing on only the indicating ranges on the Yearly level in the Singapore Cash Share Index, this market remains moderately bullish currently with underlying support beginning at 264635 and overhead resistance forming above at 298077. The market is trading closer to the resistance level at this time.
Yearly Indicating Ranges Immediate Trend .......... bearish Short-Term Momentum ...... neutral Short-Term Trend ......... neutral Intermediate Momentum .... neutral Intermedia Trend ......... bullish Long-Term Trend .......... neutral Cyclical Strength ........ neutral
TRADING ENVELOPE STUDY
NORMAL YEARLY TRADING ENVELOPE Last Close Was. 286922 Envelope Top... 426792 Internal AvgL.. 271112 Internal AvgH.. 338780 Envelope Btm... 165862
Singapore Cash Share Index
110
STOCHASTICS
The Stochastics are in a mixed position. Keep in mind that this type of indicator tends to be more of a confirmation tool rather than a leading forecasting tool. Thus, it is more often than not just a lagging indicator. Nevertheless, the short-term oscillator is entering a crash mode suggesting we may see a decline from here.
ENERGY MODELS
Looking at our Energy Models on the Yearly level, the historical high took place back in 2016 whereas the actual market high in price unfolded back in 2007. This is rather indicative of the fact that the broader term means that eventually higher highs will be carved out in the future. When Energy peaks BEFORE the high, this is indicative of a major high and a serious change in trend is likely to follow.
YEARLY FIBONACCI PROJECTIONS IN TIME
These are the Fibonacci Time targets for potential turning points ahead calculated from the 01/01/2018 HIGH:
Fri. 01/01/2021 Sun. 01/01/2023 Thu. 01/01/2026 Wed. 01/01/2031 Sat. 01/01/2039 Mon. 01/01/2052 Sun. 01/01/2073 Sun. 01/01/2107 Sat. 01/01/2162
Note: Once more, these are purely Fibonacci projections in Time. They should not be used independently, but they are more important as a correlation tool when the line up with the targets from our Timing Arrays.
YEARLY FIBONACCI RETRACEMENTS & PERCENTAGE MOVEMENTS
Here are the Fibonacci Percentage Retracements from the previous HIGH at 364165
Singapore Cash Share Index
111
23% | 278222 38% | 225054 61% | 139111 78% | 77931
Fibonacci Percentage Golden Ratio Movements:
3% | 2021/01/01 5% | 2023/01/01 8% | 2026/01/01 13% | 2031/01/01 21% | 2039/01/01 34% | 2052/01/01 55% | 2073/01/01 89% | 2107/01/01
ECONOMIC CONFIDENCE MODEL CORRELATION
Here in Singapore Cash Share Index, we do find that this particular market has correlated with our Economic Confidence Model in the past. The Last turning point on the ECM cycle low to line up with this market was 2020 and 2009. The Last turning point on the ECM cycle high to line up with this market was 2018 and 2015 and 2007.
YEARLY CURRENCY CORRELATION
The Singapore Cash Share Index did make a high in conjunction with the British pound on 0 yet in nominal terms the last high was created on 01/01 whereas the high in Australian dollar took place on 0, a high in the Canadian dollar was established on 0, a high in the Japanese yen was established on 0, a high in the Swiss franc was established on 0, a high in the Euro was established on 0, and a high in the Chinese yuan was 0.
In terms of a Basket of Currencies, we see that here this market has been neutral both in nominal and basket terms. In international terms, we have a divergence whereby this market last reached a high in nominal terms on 01/01 after the high in terms of a basket of currencies which came on 0 implying that this immediate rally is purely in domestic terms.
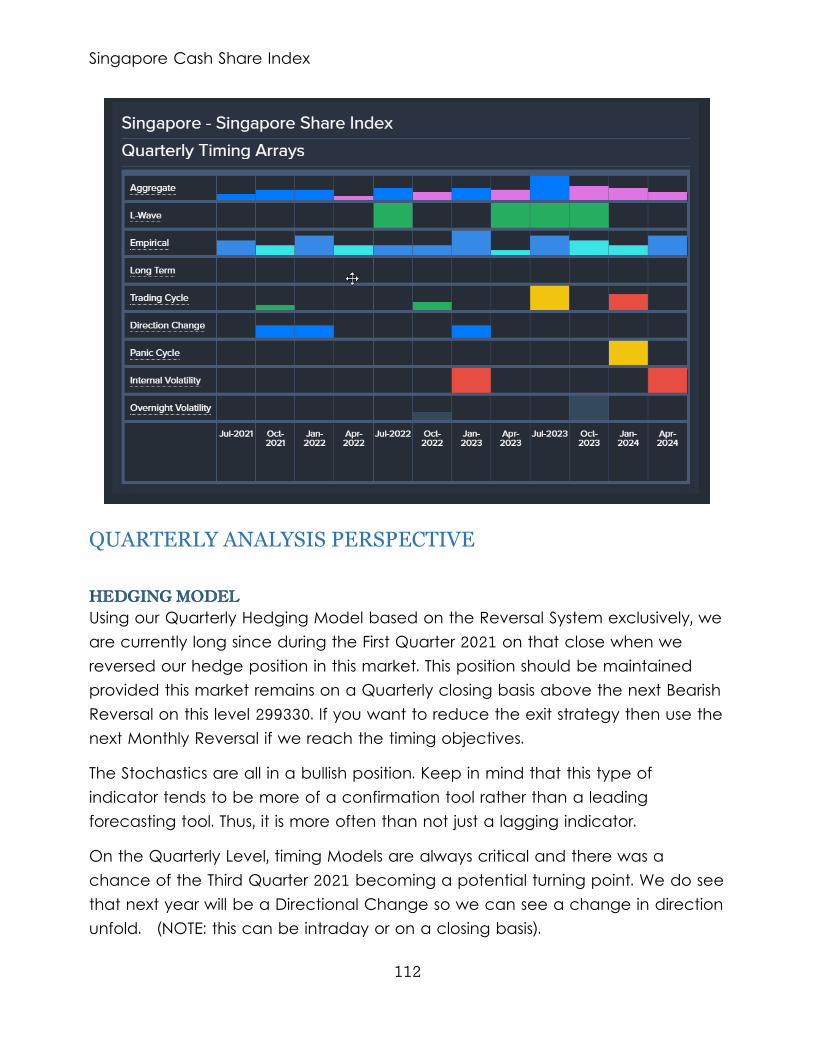
Singapore Cash Share Index
112
QUARTERLY ANALYSIS PERSPECTIVE
HEDGING MODEL
Using our Quarterly Hedging Model based on the Reversal System exclusively, we are currently long since during the First Quarter 2021 on that close when we reversed our hedge position in this market. This position should be maintained provided this market remains on a Quarterly closing basis above the next Bearish Reversal on this level 299330. If you want to reduce the exit strategy then use the next Monthly Reversal if we reach the timing objectives.
The Stochastics are all in a bullish position. Keep in mind that this type of indicator tends to be more of a confirmation tool rather than a leading forecasting tool. Thus, it is more often than not just a lagging indicator.
On the Quarterly Level, timing Models are always critical and there was a chance of the Third Quarter 2021 becoming a potential turning point. We do see that next year will be a Directional Change so we can see a change in direction unfold. (NOTE: this can be intraday or on a closing basis).
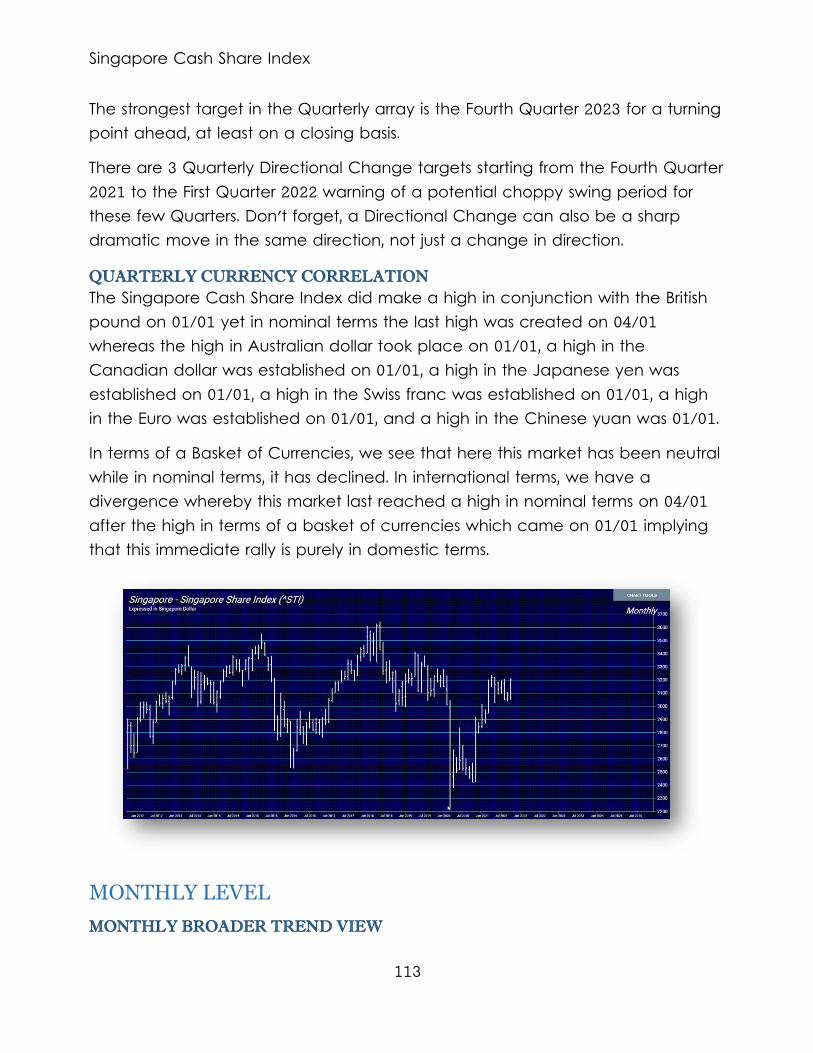
Singapore Cash Share Index
113
The strongest target in the Quarterly array is the Fourth Quarter 2023 for a turning point ahead, at least on a closing basis.
There are 3 Quarterly Directional Change targets starting from the Fourth Quarter 2021 to the First Quarter 2022 warning of a potential choppy swing period for these few Quarters. Don't forget, a Directional Change can also be a sharp dramatic move in the same direction, not just a change in direction.
QUARTERLY CURRENCY CORRELATION
The Singapore Cash Share Index did make a high in conjunction with the British pound on 01/01 yet in nominal terms the last high was created on 04/01 whereas the high in Australian dollar took place on 01/01, a high in the Canadian dollar was established on 01/01, a high in the Japanese yen was established on 01/01, a high in the Swiss franc was established on 01/01, a high in the Euro was established on 01/01, and a high in the Chinese yuan was 01/01.
In terms of a Basket of Currencies, we see that here this market has been neutral while in nominal terms, it has declined. In international terms, we have a divergence whereby this market last reached a high in nominal terms on 04/01 after the high in terms of a basket of currencies which came on 01/01 implying that this immediate rally is purely in domestic terms.
MONTHLY LEVEL
MONTHLY BROADER TREND VIEW
Singapore Cash Share Index
114
Looking at a broader time horizon, this market is in an uptrend position on all our monthly indicators for the near-term trend. We see here the trend has been moving up for the past 18 months. The previous low of 220842 made during March 2020 on the Monthly level has held and only a break of 305024 on a closing basis would warn of a technical near-term change in trend. The previous high made during April on the Monthly level at 323723 remains significant technically and only exceeding that level on a closing basis would suggest a reversal in the immediate trend. We have generated a buy signal so some caution is required.
MONTHLY TURNING POINTS
My key targets in time on the Turning Point Model, defined as highs or lows on an intraday or closing basis, for November, February 2022 and May 2022. Regarding the various factors, I see a strong potential of a decline moving into November with the opposite trend thereafter into February 2022. Looking ahead at November, a continued advance becomes possible if this month's high is penetrated intraday.
MONTHLY DIRECTIONAL CHANGES
Nevertheless, the most critical model, the Directional Change Model target is during 2021. This model often picks the high or low but can also elect a breakout to a new higher trading zone or a breakdown to a new lower trading level.
MONTHLY VOLATILITY
Exploring the volatility models suggest we should see a rise in price movement during January 2026. We look to the turning points to ascertain the direction. Volatility targets reflect only greater price movement.
MONTHLY BULLISH REVERSALS
The key Monthly Bullish Reversal stands overhead at 323730. If this market rallies on a monthly closing basis above this level, then a breakout becomes possible. If we exceed that Reversal, then the next key resistance level to watch will be the next Monthly Bullish Reversal at 323530.
MONTHLY BEARISH REVERSALS
The key Monthly Bearish Reversal below the market remains at 279260. If this is breached on a monthly closing basis, then a further decline becomes entirely
Singapore Cash Share Index
115
possible. If we penetrate that Reversal on a closing basis, then the next key support level to watch will be the next Monthly Bearish Reversal lies at 247820.
HEDGING MODEL
By means of our Monthly Hedging Model using only the Reversal System, we are currently long since September on that close when we reversed our hedge position in this market. This position should be maintained provided this market remains on a Monthly closing basis above the next Bearish Reversal on this level 279260. If you want to reduce the exit strategy then use the next Weekly Reversal if we reach the timing objectives.
The Stochastics are in a mixed position. Keep in mind that this type of indicator tends to be more of a confirmation tool rather than a leading forecasting tool. Thus, it is more often than not just a lagging indicator. Nevertheless, the short-term oscillator is entering a crash mode suggesting we may see a decline from here.
On the Monthly Level, timing Models are always critical and there was a chance of a low moving into September, that is reinforced by also a Directional Change Target. However, we also see that there is another Directional Change due in the next session and then the session thereafter warning this is a choppy period ahead given that the previous session was an outside reversal to the downside and it closed below the previous low with the opposite trend implied thereafter into December (NOTE: this can be intraday or on a closing basis).
The strongest target in the Monthly array is February 2022 for a turning point ahead, at least on a closing basis. It does appear we have a choppy period starting February 2022 until March 2022 with each target producing the opposite direction for that 2-month period. There are 3 Monthly Directional Change targets starting from September to October warning of a potential choppy swing period for these few Months. Don't forget, a Directional Change can also be a sharp dramatic move in the same direction, not just a change in direction.
Monthly Level Indicator Description... Trend Immediate Trend ........... - Neutral - Short-Term Momentum ....... (Bearish) Short-Term Trend .......... (Bearish)
Singapore Cash Share Index
116
Intermediate Momentum ..... - Neutral - Intermediate Trend ........ BULLISH Long-Term Trend ........... - Neutral - Cyclical Strength.......... (Bearish) Broader Trend ............. - Neutral - Long-Term Cyclical Trend .. BULLISH
MONTHLY CURRENCY CORRELATION
The Singapore Cash Share Index did make a high in conjunction with the British pound on 07/01 yet in nominal terms the last high was created on 04/01 whereas the high in Australian dollar took place on 07/01, a high in the Canadian dollar was established on 07/01, a high in the Japanese yen was established on 07/01, a high in the Swiss franc was established on 07/01, a high in the Euro was established on 07/01, and a high in the Chinese yuan was 07/01.
In terms of a Basket of Currencies, we see that here this market has been neutral while in nominal terms, it has rallied. In international terms, we have a divergence whereby this market last reached a high in nominal terms on 04/01 after the high in terms of a basket of currencies which came on 07/01 implying that this immediate rally is purely in domestic terms.
MARKET RISK FACTOR
Singapore Cash Share Index Risk Table ----------------- UPSIDE RISK ----- DOWNSIDE RISK --- MONTHLY....... 323390 | 5.99% | 279260 | 8.472% | QUARTERLY..... 328480 | 7.659% | 299330 | 1.894% | YEARLY........ 319580 | 4.742% | 252180 | 17.34% |
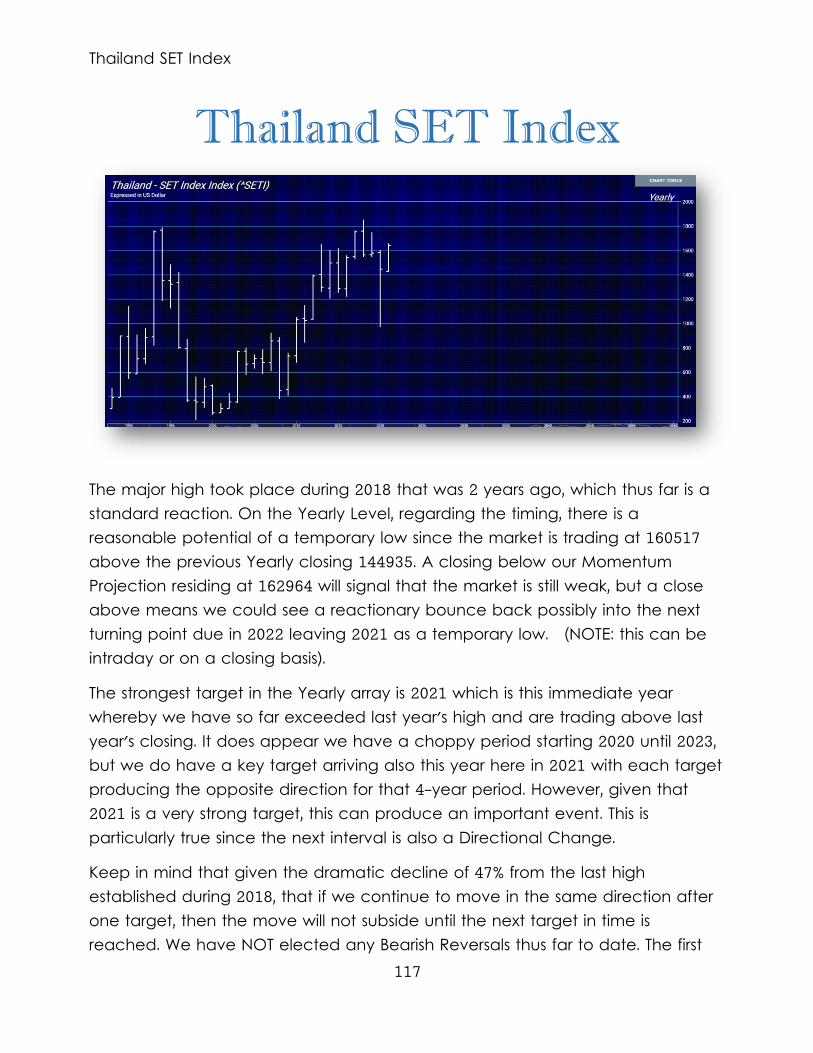
Thailand SET Index
117
Thailand SET Index
The major high took place during 2018 that was 2 years ago, which thus far is a standard reaction. On the Yearly Level, regarding the timing, there is a reasonable potential of a temporary low since the market is trading at 160517 above the previous Yearly closing 144935. A closing below our Momentum Projection residing at 162964 will signal that the market is still weak, but a close above means we could see a reactionary bounce back possibly into the next turning point due in 2022 leaving 2021 as a temporary low. (NOTE: this can be intraday or on a closing basis).
The strongest target in the Yearly array is 2021 which is this immediate year whereby we have so far exceeded last year's high and are trading above last year's closing. It does appear we have a choppy period starting 2020 until 2023, but we do have a key target arriving also this year here in 2021 with each target producing the opposite direction for that 4-year period. However, given that 2021 is a very strong target, this can produce an important event. This is particularly true since the next interval is also a Directional Change.
Keep in mind that given the dramatic decline of 47% from the last high established during 2018, that if we continue to move in the same direction after one target, then the move will not subside until the next target in time is reached. We have NOT elected any Bearish Reversals thus far to date. The first
Thailand SET Index
118
Yearly Bearish Reversal comes into play at 120530. There are 2 Yearly Directional Change targets starting from 2021 to 2022 warning of a potential choppy swing period for these few Years. We also see a convergence in the Array with both the Directional Change and Panic Cycle lining up for the same target of 2021. This underscores the importance of this target as an event on the horizon. Don't forget, a Directional Change can also be a sharp dramatic move in the same direction, not just a change in direction.
While the historical perspective of the of this market included a decline from the major high established back in 2018 moving into a major low in 2020, the market has bounced back for the last year. The last Yearly Reversal to be elected was a Bearish at the close of 2020.
This market remains in a positive position on the weekly to yearly levels of our indicating models. From a Historical Perspective, ever since the low of 1982, there have been 3 major lows with each being higher than the previous which is indicative of a protracted long-term bull market. The last major low was established back in 2020 with the high forming during 2018. This decline has thus been 2 years. We have exceeded the previous high of 2020, which was 160443 implying we may have at least a temporary low in place for now and we have not exceeded the previous major high of 185251. Even so, we have not elected any Yearly Bearish Reversal to date from the turning point of 2018.
The last major low took place during 2020 which was last year. .
YEARLY ANALYSIS PERSPECTIVE
On the yearly level in Thailand SET Index, the last important low was established during 2020 at 96908, which was down 2 years from the high made back during 2018 at 185251. To date, we have a 2-year reaction low in place as of 2020, which warns that there is a potential for a rally failing to make new lows below 96908. However, the highest closing was during 2017 at 175371 whereas the intraday high formed in 2018.
Right now, as stated, the market is trading above last year's high of 160443. Overall, the market has been in a long-term bearish trend.
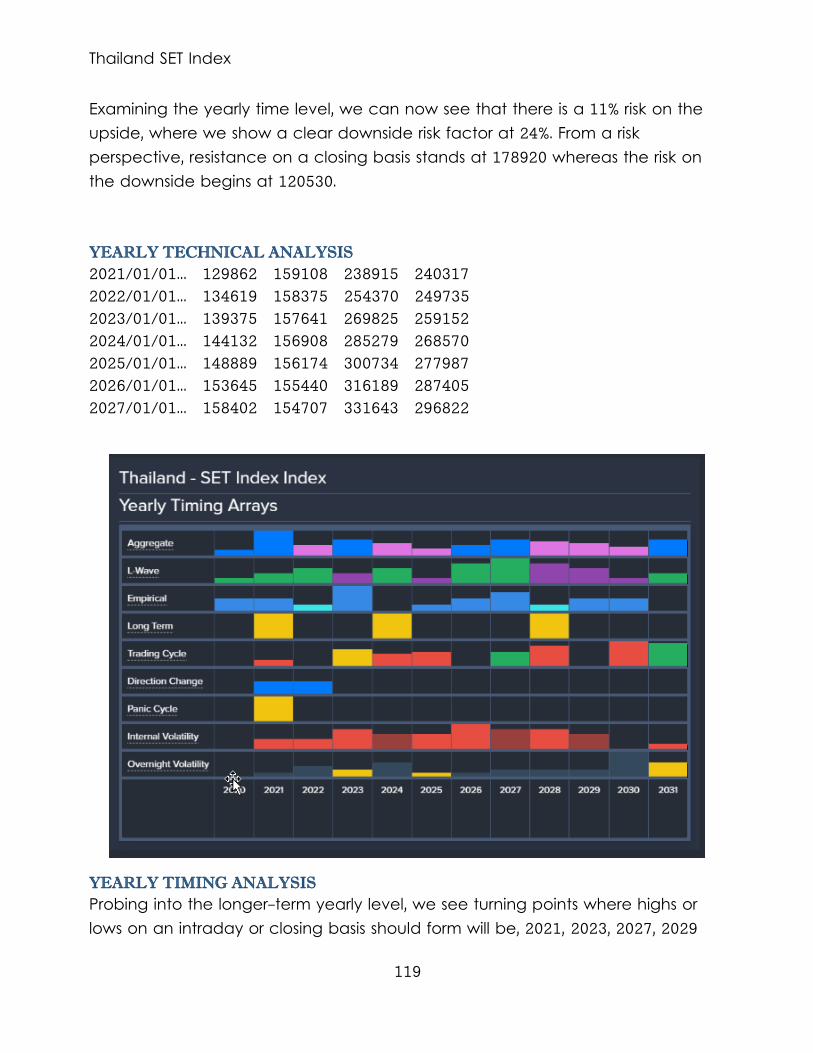
Thailand SET Index
119
Examining the yearly time level, we can now see that there is a 11% risk on the upside, where we show a clear downside risk factor at 24%. From a risk perspective, resistance on a closing basis stands at 178920 whereas the risk on the downside begins at 120530.
YEARLY TECHNICAL ANALYSIS
2021/01/01... 129862 159108 238915 240317 2022/01/01... 134619 158375 254370 249735 2023/01/01... 139375 157641 269825 259152 2024/01/01... 144132 156908 285279 268570 2025/01/01... 148889 156174 300734 277987 2026/01/01... 153645 155440 316189 287405 2027/01/01... 158402 154707 331643 296822
YEARLY TIMING ANALYSIS
Probing into the longer-term yearly level, we see turning points where highs or lows on an intraday or closing basis should form will be, 2021, 2023, 2027, 2029
Thailand SET Index
120
and 2031. Centering on the patterns unfolding, we do see a prospect of a decline moving into 2021 with the opposite trend thereafter into 2023. This pattern becomes a possibility if the market closed back below last year's high of 96908 at a minimum. Closing this year above last year's high warns that a cycle inversion is possible with a rally into the next target.
YEARLY DIRECTIONAL CHANGES
Nevertheless, the most critical model, the Directional Change Model targets are during 2021 and during 2022. This model often picks the high or low but can also elect a breakout to a new higher trading zone or a breakdown to a new lower trading level.
YEARLY VOLATILITY
Exploring the volatility models suggest we should see a rise in price movement during January 2024. We look to the turning points to ascertain the direction. Volatility targets reflect only greater price movement.
THE BROADER LONGER-TERM VIEW
Perceptibly, the long-term enquiry view recognizes that the current bearish progression in Thailand SET Index reflects only a temporary reaction within a broader bull market trend since we have not elected any Yearly sell signals on our model. Furthermore, the Thailand SET Index remains positive since we are trading above last year's high. Presently, we have made a reaction low in 2020 which was a 2-year decline. Since that reaction low of 2020, this market has bounced up to now this year with this year exceeding last year's high. We are trading above last year's high of 160443, but at the very least this market must close above that to maintain a bullish posture. A year-end closing below 152878 will signal a resumption of the decline whereas a closing below 126007 will signal it is possible to penetrate last year's low of 96908.
INDICATING RANGE STUDY
Focusing on our perspective using the indicating ranges on the Yearly level in the Thailand SET Index, this market remains moderately bullish currently with underlying support beginning at 140286 and overhead resistance forming above at 155832. The market is trading closer to the support level at this time.
Thailand SET Index
121
Yearly Indicating Ranges
Immediate Trend .......... bearish Short-Term Momentum ...... neutral Short-Term Trend ......... bullish Intermediate Momentum .... bearish Intermedia Trend ......... bullish Long-Term Trend .......... bullish Cyclical Strength ........ bullish
TRADING ENVELOPE STUDY
NORMAL YEARLY TRADING ENVELOPE
Last Close Was. 144935 Envelope Top... 157144 Internal AvgL.. 136173 Internal AvgH.. 167863 Envelope Btm... 98374
STOCHASTICS
The Stochastics are on the short term are in a positive position. Keep in mind that this type of indicator tends to be more of a confirmation tool rather than a leading forecasting tool. Thus, it is more often than not just a lagging indicator. Nevertheless, the short-term oscillator is entering a crash mode suggesting we may see a decline from here.
ENERGY MODELS
Looking at our Energy Models on the Yearly level, the historical high took place back in 1994 whereas the actual market high in price unfolded back in 2018. When Energy peaks BEFORE the price high, this is indicative of a major important high is forming and that we may see a serious change in trend to the downside thereafter.
REVERSAL COMMENTARY
Turning to our Yearly Hypothetical Models, clearly, we see that we have Yearly Bearish Reversals that would be generated if we see another new high penetrating 165808. These Tentative Hypothetical Bearish Reversals would rest at 30875, 58792, 120545, and 154662, whereas a close below the previous low
Thailand SET Index
122
96908 would tend to suggest that these Tentative Hypothetical Reversals will then become fixed as long as the high holds thereafter for at least several days. Moreover, the election of any of these Tentative Hypothetical Bearish Reversals during this next session would signal a decline is unfolding and that such a high may stand. However, if we continue to make new highs, then these Tentative Hypothetical Reversals will be replaced by a new set until the high becomes fixed.
YEARLY FIBONACCI PROJECTIONS IN TIME
These are the Fibonacci Time targets for potential turning points ahead calculated from the 01/01/2020 LOW:
Sun. 01/01/2023 Wed. 01/01/2025 Sat. 01/01/2028 Sat. 01/01/2033 Tue. 01/01/2041 Thu. 01/01/2054 Tue. 01/01/2075 Wed. 01/01/2109 Mon. 01/01/2164
Note: Once more, these are purely Fibonacci projections in Time. They should not be used independently, but they are more important as a correlation tool when the line up with the targets from our Timing Arrays.
YEARLY FIBONACCI RETRACEMENTS & PERCENTAGE MOVEMENTS
Here are the Fibonacci Percentage Retracements from the previous LOW at 96908
23% | 119778 38% | 133927 61% | 156797 78% | 173078
Thailand SET Index
123
Fibonacci Percentage Golden Ratio Movements:
3% | 2023/01/01 5% | 2025/01/01 8% | 2028/01/01 13% | 2033/01/01 21% | 2041/01/01 34% | 2054/01/01 55% | 2075/01/01 89% | 2109/01/01 144% | 2164/01/01
ECONOMIC CONFIDENCE MODEL CORRELATION
Here in Thailand SET Index, we do find that this particular market has correlated with our Economic Confidence Model in the past. The Last turning point on the ECM cycle low to line up with this market was 2020 and 1998. The Last turning point on the ECM cycle high to line up with this market was 2018 and 2013 and 2007 and 1994.
YEARLY CURRENCY CORRELATION
The Thailand SET Index did make a high in conjunction with the British pound on 0 yet in nominal terms the last high was created on 01/01 whereas the high in Australian dollar took place on 0, a high in the Canadian dollar was established on 0, a high in the Japanese yen was established on 0, a high in the Swiss franc was established on 0, a high in the Euro was established on 0, and a high in the Chinese yuan was 0.
In terms of a Basket of Currencies, we see that here this market has been neutral both in nominal and basket terms. In international terms, we have a divergence whereby this market last reached a high in nominal terms on 01/01 after the high in terms of a basket of currencies which came on 0 implying that this immediate rally is purely in domestic terms.
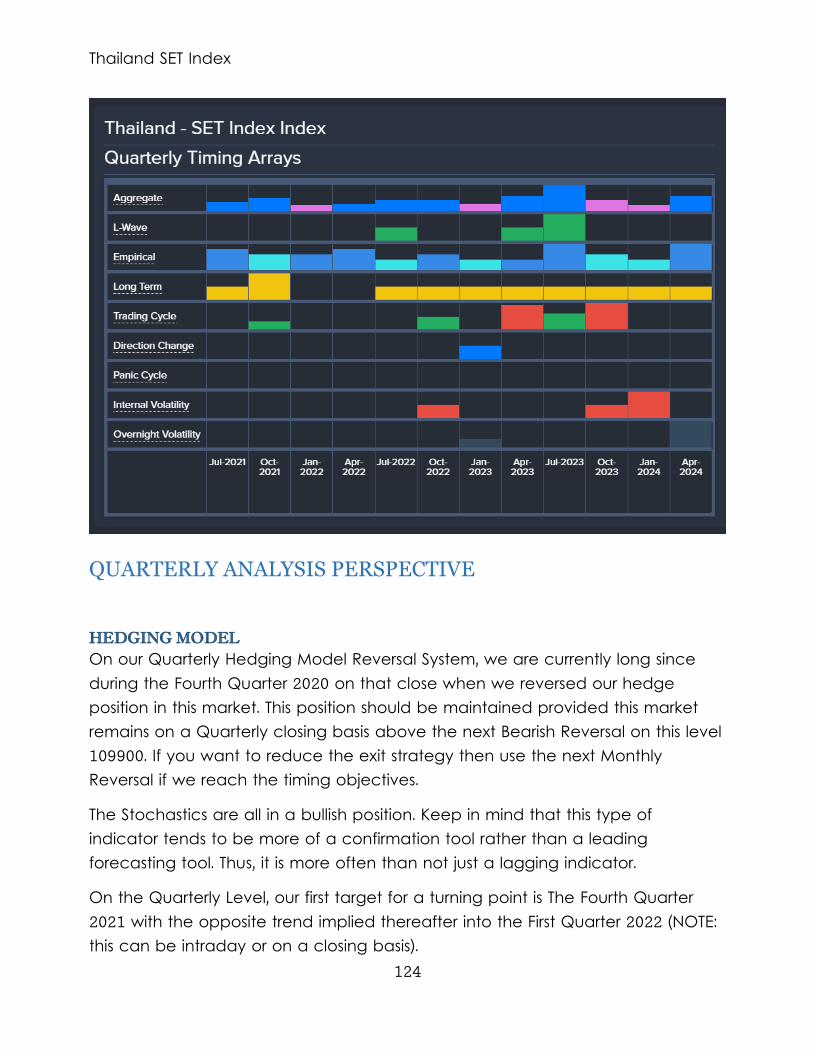
Thailand SET Index
124
QUARTERLY ANALYSIS PERSPECTIVE
HEDGING MODEL
On our Quarterly Hedging Model Reversal System, we are currently long since during the Fourth Quarter 2020 on that close when we reversed our hedge position in this market. This position should be maintained provided this market remains on a Quarterly closing basis above the next Bearish Reversal on this level 109900. If you want to reduce the exit strategy then use the next Monthly Reversal if we reach the timing objectives.
The Stochastics are all in a bullish position. Keep in mind that this type of indicator tends to be more of a confirmation tool rather than a leading forecasting tool. Thus, it is more often than not just a lagging indicator.
On the Quarterly Level, our first target for a turning point is The Fourth Quarter 2021 with the opposite trend implied thereafter into the First Quarter 2022 (NOTE: this can be intraday or on a closing basis).

Thailand SET Index
125
The strongest target in the Quarterly array is the Third Quarter 2023 for a turning point ahead, at least on a closing basis. It does appear we have a choppy period starting the Third Quarter 2021 until the First Quarter 2022, but we do have a key target arriving also on the Fourth Quarter 2021 with each target producing the opposite direction for that 3-quarter period. Thereafter, we see the next target coming into play as the Fourth Quarter 2022 until the First Quarter 2023 with again each target producing the opposite direction for that 2-quarter period.
Keep in mind that given the sharp decline of 13% from the last high established the Third Quarter 2019, that if we continue to move in the same direction after one target, then the move will not subside until the next target in time is reached. We have elected 4 Bearish Reversals from the last high thus far to date. We have a Quarterly Directional Change target due in the First Quarter 2023. This lines up with a turning point so in this case we can see at least an intraday event, or a turning point based on the close. Our volatility models also target this date as well. Don't forget, a Directional Change can also be a sharp dramatic move in the same direction, not just a change in direction.
QUARTERLY CURRENCY CORRELATION
The Thailand SET Index did make a high in conjunction with the British pound on 01/01 yet in nominal terms the last high was created on 01/01 whereas the high in Australian dollar took place on 01/01, a high in the Canadian dollar was established on 01/01, a high in the Japanese yen was established on 01/01, a high in the Swiss franc was established on 01/01, a high in the Euro was established on 01/01, and a high in the Chinese yuan was 01/01.
In terms of a Basket of Currencies, we see that here this market has been neutral while in nominal terms, it has declined. In international terms, we have a divergence whereby this market last reached a high in nominal terms on 01/01 after the high in terms of a basket of currencies which came on 01/01 implying that this immediate rally is purely in domestic terms.
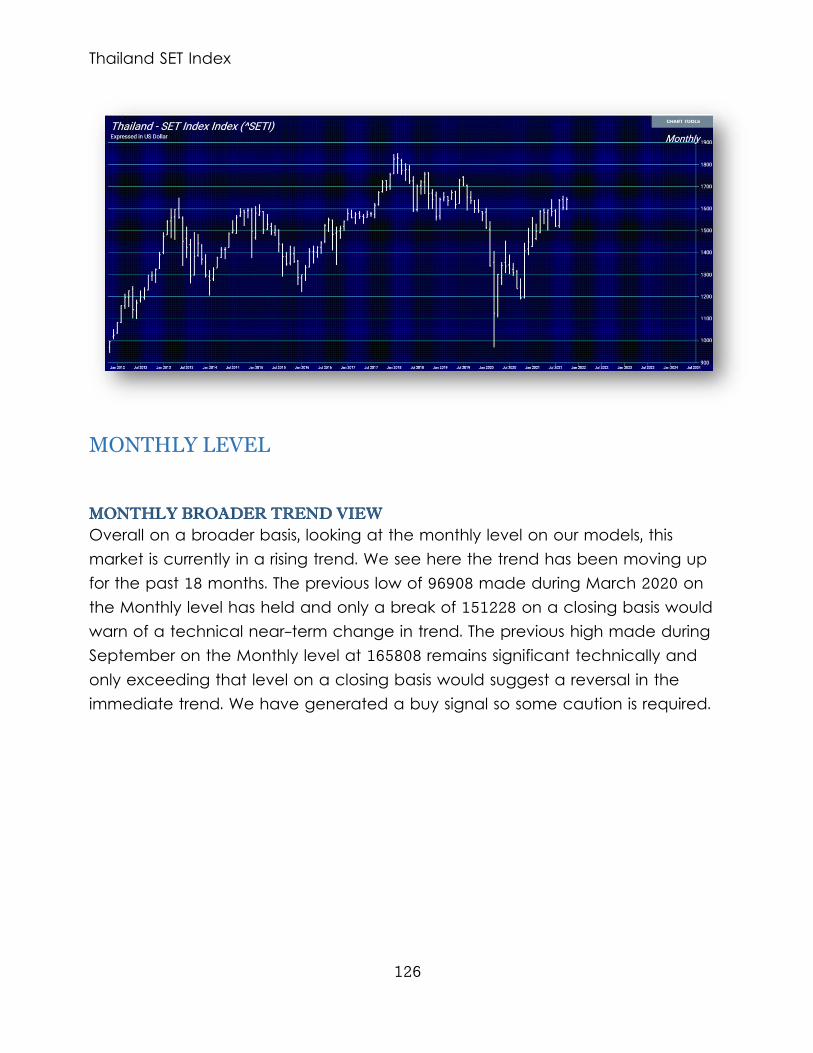
Thailand SET Index
126
MONTHLY LEVEL
MONTHLY BROADER TREND VIEW
Overall on a broader basis, looking at the monthly level on our models, this market is currently in a rising trend. We see here the trend has been moving up for the past 18 months. The previous low of 96908 made during March 2020 on the Monthly level has held and only a break of 151228 on a closing basis would warn of a technical near-term change in trend. The previous high made during September on the Monthly level at 165808 remains significant technically and only exceeding that level on a closing basis would suggest a reversal in the immediate trend. We have generated a buy signal so some caution is required.
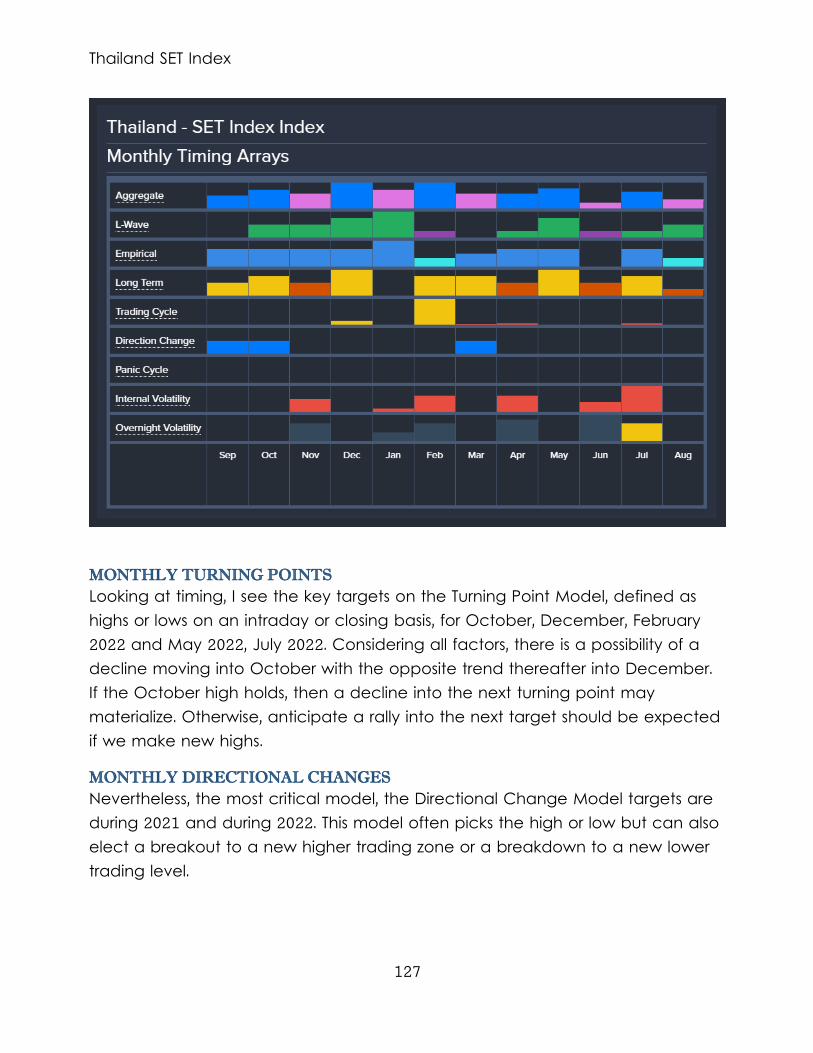
Thailand SET Index
127
MONTHLY TURNING POINTS
Looking at timing, I see the key targets on the Turning Point Model, defined as highs or lows on an intraday or closing basis, for October, December, February 2022 and May 2022, July 2022. Considering all factors, there is a possibility of a decline moving into October with the opposite trend thereafter into December. If the October high holds, then a decline into the next turning point may materialize. Otherwise, anticipate a rally into the next target should be expected if we make new highs.
MONTHLY DIRECTIONAL CHANGES
Nevertheless, the most critical model, the Directional Change Model targets are during 2021 and during 2022. This model often picks the high or low but can also elect a breakout to a new higher trading zone or a breakdown to a new lower trading level.
Thailand SET Index
128
MONTHLY VOLATILITY
Exploring the volatility models suggest we should see a rise in price movement during January 2024. We look to the turning points to ascertain the direction. Volatility targets reflect only greater price movement.
MONTHLY BULLISH REVERSALS
The key Monthly Bullish Reversal stands overhead at 168900. If this market rallies on a monthly closing basis above this level, then a breakout becomes possible. If we exceed that Reversal, then the next key resistance level to watch will be the next Monthly Bullish Reversal at 173590.
MONTHLY BEARISH REVERSALS
The key Monthly Bearish Reversal below the market remains at 157900. If this is breached on a monthly closing basis, then a further decline becomes entirely possible. If we penetrate that Reversal on a closing basis, then the next key support level to watch will be the next Monthly Bearish Reversal lies at 138810.
HEDGING MODEL
From the Monthly Hedging Model employing only the Reversal System, we are currently long since August on that close when we reversed our hedge position in this market. This position should be maintained provided this market remains on a Monthly closing basis above the next Bearish Reversal on this level 157900. If you want to reduce the exit strategy then use the next Weekly Reversal if we reach the timing objectives.
The Stochastics are on the short term are in a positive position. Keep in mind that this type of indicator tends to be more of a confirmation tool rather than a leading forecasting tool. Thus, it is more often than not just a lagging indicator.
On the Monthly Level, regarding the timing, there is a reasonable potential of a decline moving into October, that is reinforced by also a Directional Change Target. However, we also see that there is another Directional Change due in the next session with the opposite trend implied thereafter into November. However, a break of this current month's trading range of 160948 - 159332 would warn of a possible cycle inversion given we have a target this month. (NOTE: this can be intraday or on a closing basis).
Thailand SET Index
129
The strongest target in the Monthly array is December for a turning point ahead, at least on a closing basis. It does appear we have a choppy period starting September until February 2022, but we do have a key target arriving also on December with each target producing the opposite direction for that 6-month period. However, given that December is a very strong target, this can produce an important event. Thereafter, we see the next target coming into play as May 2022 until July 2022 with again each target producing the opposite direction for that 3-month period. There are 3 Monthly Directional Change targets starting from September to October warning of a potential choppy swing period for these few Months. Don't forget, a Directional Change can also be a sharp dramatic move in the same direction, not just a change in direction.
Monthly Level Indicator Description... Trend Immediate Trend ........... - Neutral - Short-Term Momentum ....... - Neutral - Short-Term Trend .......... BULLISH Intermediate Momentum ..... BULLISH Intermediate Trend ........ BULLISH Long-Term Trend ........... (Bearish) Cyclical Strength.......... (Bearish) Broader Trend ............. - Neutral - Long-Term Cyclical Trend .. BULLISH
MONTHLY CURRENCY CORRELATION
The Thailand SET Index did make a high in conjunction with the British pound on 07/01 yet in nominal terms the last high was created on 09/01 whereas the high in Australian dollar took place on 07/01, a high in the Canadian dollar was established on 07/01, a high in the Japanese yen was established on 07/01, a high in the Swiss franc was established on 07/01, a high in the Euro was established on 07/01, and a high in the Chinese yuan was 07/01.
In terms of a Basket of Currencies, we see that here this market has been neutral both in nominal and basket terms. In international terms, we have a divergence whereby this market last reached a high in nominal terms on 09/01 after the high
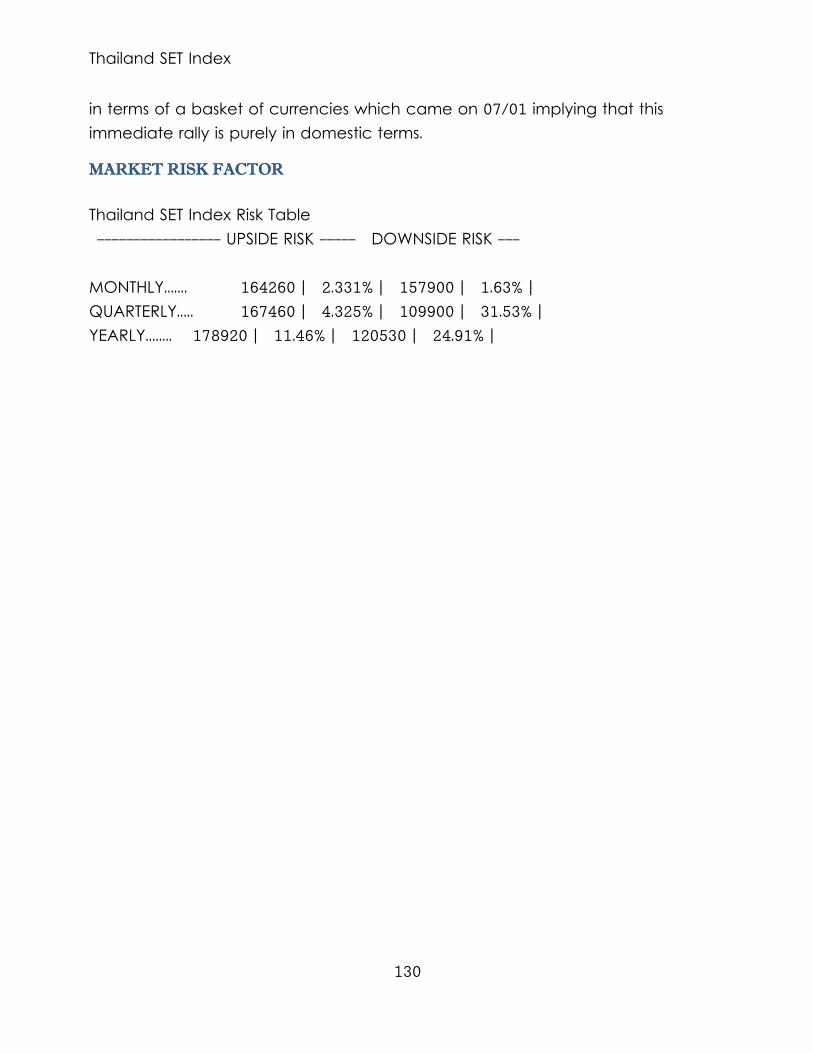
Thailand SET Index
130
in terms of a basket of currencies which came on 07/01 implying that this immediate rally is purely in domestic terms.
MARKET RISK FACTOR
Thailand SET Index Risk Table ----------------- UPSIDE RISK ----- DOWNSIDE RISK --- MONTHLY....... 164260 | 2.331% | 157900 | 1.63% | QUARTERLY..... 167460 | 4.325% | 109900 | 31.53% | YEARLY........ 178920 | 11.46% | 120530 | 24.91% |

Taiwan Stock Index Cash
131
Taiwan Stock Index Cash
This market made a bull run from the low of 12591 made in 1972 for 48 years into a high established in 2020 at 1469544. Last year was an outside reversal to the upside after reaching a low at 852363. It was also a record high for this series. Presently, this market has rallied exceeding last year's high of 1469544 reaching 1803419 while holding last year's low of 852363. On the Yearly Level, regarding the timing, there was a reasonable potential of an Outside Reversal to the upside in 2020 yet since this market has exceeded the 2020 high, then a further rally is possible into the next target of 2021 which is a Directional Change. So far this year, the market has exceeded the 2020 high of 1469544 and it remains above that level on a closing basis. Yet there appears to be a significant change in trend arriving in 2024. To date, we have not elected any Monthly Bearish Reversals from the July high. The next Monthly Bearish Reversal to focus on lies at 1508980. Maintaining a closing above our Momentum Projection standing at 1596637 will signal that the market is still with broader trend support right now. However, since this year has exceeded last year's high, then a closing at year-end below this momentum number could warn of a temporary high and the next turning point could be a low in 2021. This turning point 2020 also matched the turning point on the
Taiwan Stock Index Cash
132
Economic Confidence Model implying it was significant (NOTE: this can be intraday or on a closing basis). The strongest target in the Yearly array is 2024 for a turning point ahead, at least on a closing basis. It does appear we have a choppy period starting 2020 until 2026, but we do have a key target arriving also 2024 with each target producing the opposite direction for that 7-year period. However, given that 2024 is a very strong target, this can produce an important event. This is particularly true since the next interval is also a Directional Change. Keep in mind that given the sharp decline of 13% from the last high established during 2020, that if we continue to move in the same direction after one target, then the move will not subside until the next target in time is reached. We have NOT elected any Bearish Reversals thus far to date. The first Yearly Bearish Reversal comes into play at 762770. The Taiwan Stock Index Cash has continued to make new historical highs over the course of the rally from 2008 moving into 2021, which has been a run of 13 years warning that timing wise a pause remains possible. This market remains in a positive position on the weekly to yearly levels of our indicating models. From a Historical Perspective, ever since the low of 1974, there have been 3 major lows with each being higher than the previous which is indicative of a protracted long-term bull market. The last major low was established back in 2008 with the high forming during 2020. This decline has thus been-12 year. We have exceeded the last year's high of 1469544 and are currently trading above it closing currently at 1657089. Nevertheless, we have not elected any Yearly Bearish Reversal to date from the turning point of 2020. The last major low took place during 2001 which was 20 years ago. However, the last near-term low took place just 1 years ago in 2020.
Taiwan Stock Index Cash
133
YEARLY ANALYSIS PERSPECTIVE
Factually, in Taiwan Stock Index Cash, the last important low formed back in 2008, there was a rally into the important high established during 2020 which has exceeded the pure reactionary phase with a bull market run do far for twelve years. Recently on the yearly level, the market has rallied exceeding last year's high reaching 1803419 intraday and we are still trading above 1469544 right now with a positive undertone. At this moment, the market is trading still holding above support in a bullish posture. Right now, as stated, the market is trading above last year's high of 1469544. Overall, the market has been in a long-term bullish trend. We have not elected any Yearly Bearish Reversals from that major high. Right now, the market is trading bullish above our yearly momentum indicators warning that support begins down at 1088265. Examining the yearly time level, we can now see that there is a -.00% risk on the upside, where we show a clear downside risk factor at 53%. From a risk perspective, resistance on a closing basis stands at 1649753 whereas the risk on the downside begins at 762770. YEARLY TECHNICAL ANALYSIS
2021/01/01... 501722 1419882 1593268 2022/01/01... 509890 1467289 1636647 2023/01/01... 518058 1514695 1680026 2024/01/01... 526225 1562102 1723405 2025/01/01... 534393 1609509 1766783 2026/01/01... 542561 1656915 1810162 2027/01/01... 550728 1704322 1853541
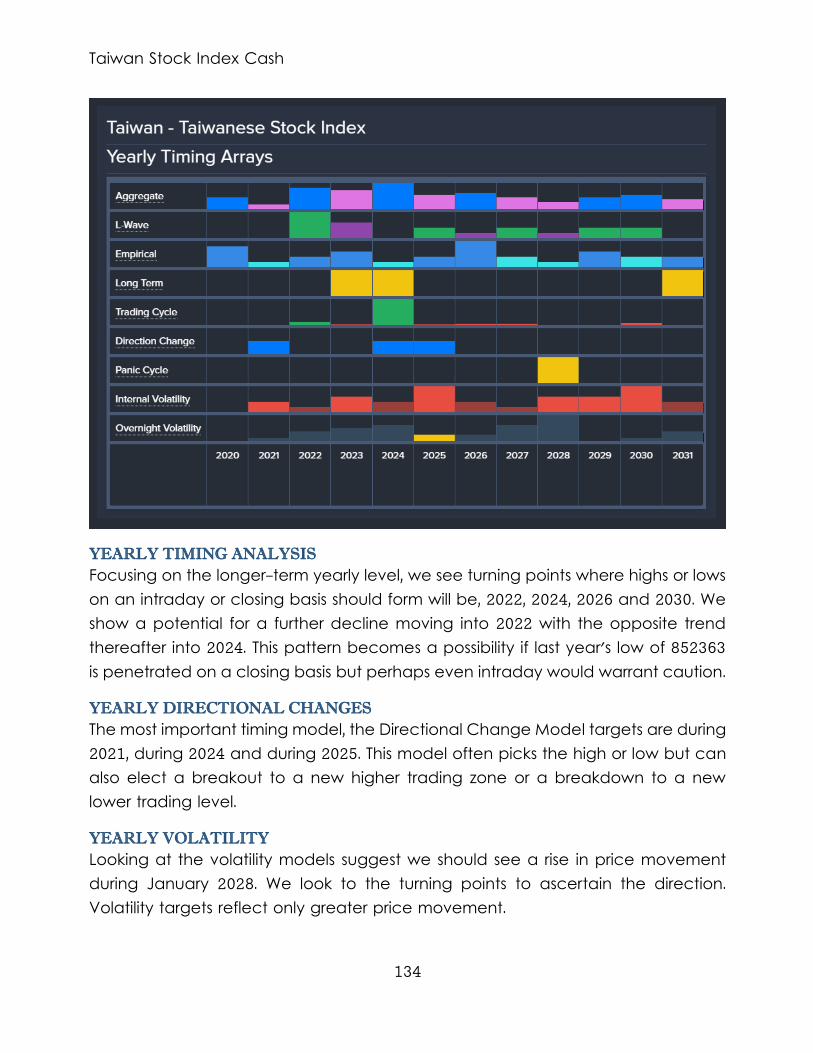
Taiwan Stock Index Cash
134
YEARLY TIMING ANALYSIS
Focusing on the longer-term yearly level, we see turning points where highs or lows on an intraday or closing basis should form will be, 2022, 2024, 2026 and 2030. We show a potential for a further decline moving into 2022 with the opposite trend thereafter into 2024. This pattern becomes a possibility if last year's low of 852363 is penetrated on a closing basis but perhaps even intraday would warrant caution.
YEARLY DIRECTIONAL CHANGES
The most important timing model, the Directional Change Model targets are during 2021, during 2024 and during 2025. This model often picks the high or low but can also elect a breakout to a new higher trading zone or a breakdown to a new lower trading level.
YEARLY VOLATILITY
Looking at the volatility models suggest we should see a rise in price movement during January 2028. We look to the turning points to ascertain the direction. Volatility targets reflect only greater price movement.
Taiwan Stock Index Cash
135
YEARLY PANIC CYCLES
Nevertheless, our Panic Cycle target, for the next period to watch is during 2028. This is beyond the peak in the next Economic Confidence Model due in 2024. Keep in mind that a Panic Cycle differs from just volatility. This can be either an outside reversal or a sharp move in only one direction. Panic Cycles can be either up or down. Watch the Stochastics and the reversals to determine the best indication of the potential direction.
THE BROADER LONGER-TERM VIEW
Noticeably, the long-term outlook view recognizes that the current directional movement since the low made back in March 2020 has been an extended Bullish trend in Taiwan Stock Index Cash. This trend remains in motion as long as we hold above 852363 on a monthly closing basis. It is incredibly important to identify the broader trend for that is the underlying tone. It is wise to take position counter-trend only with this understanding of what you are doing. We need to see a monthly closing back above 1657917 to confirm the uptrend will recommence.
YEARLY OUTSIDE COMMENT
A closing above last year's high of 1469544 will warn of perhaps new highs into next year. A closing below that number would warn that this year could be just a temporary high.
INDICATING RANGE STUDY
From a perspective using the indicating ranges on the Yearly level in the Taiwan Stock Index Cash, this market remains in a bullish position at this time with the underlying support beginning at 1025610.
Yearly Indicating Ranges
Immediate Trend .......... bullish Short-Term Momentum ...... bullish Short-Term Trend ......... bullish Intermediate Momentum .... bullish Intermedia Trend ......... bullish Long-Term Trend .......... bullish Cyclical Strength ........ bullish
Taiwan Stock Index Cash
136
TRADING ENVELOPE STUDY
NORMAL YEARLY TRADING ENVELOPE
Last Close Was. 1468770
Envelope Top... 1126761 Internal AvgL.. 882148 Internal AvgH.. 1114463 Envelope Btm... 705371
STOCHASTICS
The Stochastics are all in a bullish position. Keep in mind that this type of indicator tends to be more of a confirmation tool rather than a leading forecasting tool. Thus, it is more often than not just a lagging indicator.
ENERGY MODELS
Looking at our Energy Models on the Yearly level, the historical high took place back in 1998 whereas the actual market high in price unfolded back in 2020. When Energy peaks BEFORE the price high, this is indicative of a major important high is forming and that we may see a serious change in trend to the downside thereafter.
REVERSAL COMMENTARY
Employing our Yearly Hypothetical Models, clearly, we see that we have Yearly Bearish Reversals that would be generated if we see another new high penetrating 1803419. These Tentative Hypothetical Bearish Reversals would rest at 542265, 623249, 823043, and 940070, whereas a close below the previous low 852363 would tend to suggest that these Tentative Hypothetical Reversals will then become fixed as long as the high holds thereafter for at least several days. Moreover, the election of any of these Tentative Hypothetical Bearish Reversals during this next session would signal a decline is unfolding and that such a high may stand. However, if we continue to make new highs, then these Tentative Hypothetical Reversals will be replaced by a new set until the high becomes fixed.
YEARLY FIBONACCI PROJECTIONS IN TIME
These are the Fibonacci Time targets for potential turning points ahead calculated from the 01/01/2020 HIGH:
Taiwan Stock Index Cash
137
Sun. 01/01/2023 Wed. 01/01/2025 Sat. 01/01/2028 Sat. 01/01/2033 Tue. 01/01/2041 Thu. 01/01/2054 Tue. 01/01/2075 Wed. 01/01/2109 Mon. 01/01/2164 Note: Once more, these are purely Fibonacci projections in Time. They should not be used independently, but they are more important as a correlation tool when the line up with the targets from our Timing Arrays.
YEARLY FIBONACCI RETRACEMENTS & PERCENTAGE MOVEMENTS
Here are the Fibonacci Percentage Retracements from the previous HIGH at 1469544
23% | 1122732 38% | 908178 61% | 561366 78% | 314482 Fibonacci Percentage Golden Ratio Movements:
3% | 2023/01/01 5% | 2025/01/01 8% | 2028/01/01 13% | 2033/01/01 21% | 2041/01/01 34% | 2054/01/01 55% | 2075/01/01 89% | 2109/01/01 ECONOMIC CONFIDENCE MODEL CORRELATION
Here in Taiwan Stock Index Cash, we do find that this particular market has correlated with our Economic Confidence Model in the past. The Last turning point on the ECM cycle low to line up with this market was 2020 and 2001. The Last
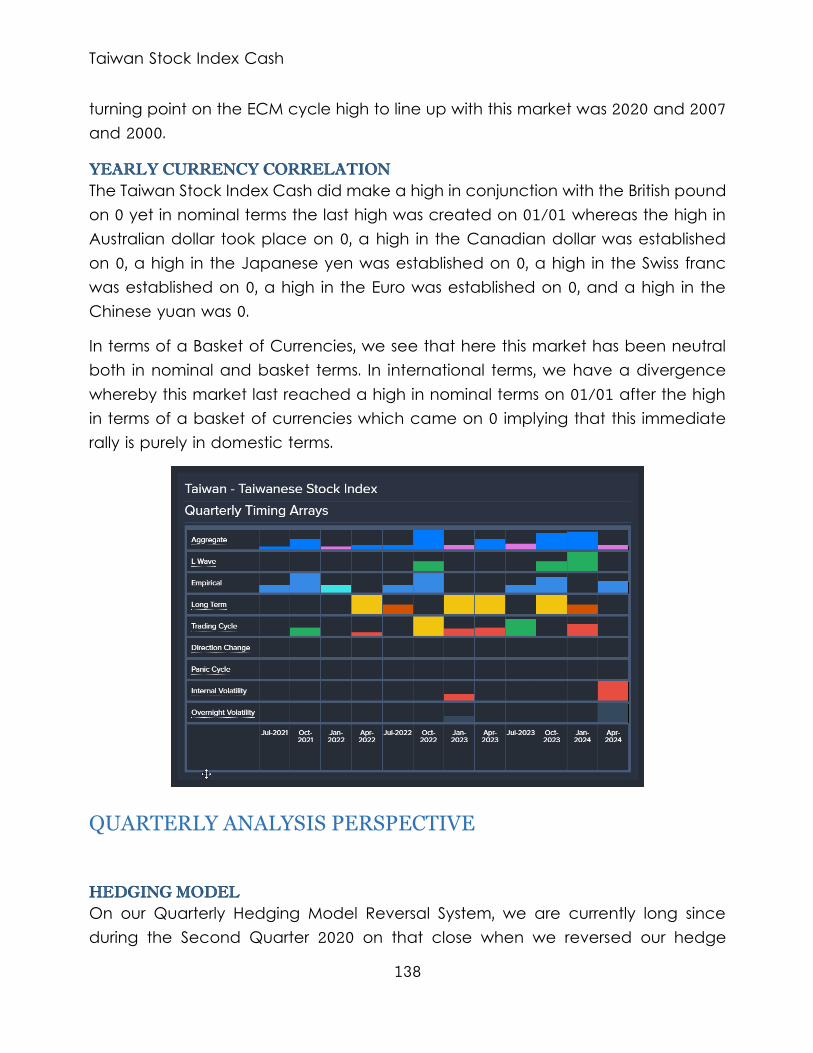
Taiwan Stock Index Cash
138
turning point on the ECM cycle high to line up with this market was 2020 and 2007 and 2000.
YEARLY CURRENCY CORRELATION
The Taiwan Stock Index Cash did make a high in conjunction with the British pound on 0 yet in nominal terms the last high was created on 01/01 whereas the high in Australian dollar took place on 0, a high in the Canadian dollar was established on 0, a high in the Japanese yen was established on 0, a high in the Swiss franc was established on 0, a high in the Euro was established on 0, and a high in the Chinese yuan was 0.
In terms of a Basket of Currencies, we see that here this market has been neutral both in nominal and basket terms. In international terms, we have a divergence whereby this market last reached a high in nominal terms on 01/01 after the high in terms of a basket of currencies which came on 0 implying that this immediate rally is purely in domestic terms.
QUARTERLY ANALYSIS PERSPECTIVE
HEDGING MODEL
On our Quarterly Hedging Model Reversal System, we are currently long since during the Second Quarter 2020 on that close when we reversed our hedge
Taiwan Stock Index Cash
139
position in this market. This position should be maintained provided this market remains on a Quarterly closing basis above the next Bearish Reversal on this level 1018003. If you want to reduce the exit strategy then use the next Monthly Reversal if we reach the timing objectives.
The Stochastics are in a mixed position. Keep in mind that this type of indicator tends to be more of a confirmation tool rather than a leading forecasting tool. Thus, it is more often than not just a lagging indicator. Nevertheless, the short-term oscillator is entering a crash mode suggesting we may see a decline from here.
On the Quarterly Level, our first target for a turning point is The Fourth Quarter 2021 with the opposite trend implied thereafter into the First Quarter 2022 (NOTE: this can be intraday or on a closing basis).
The strongest target in the Quarterly array is the Fourth Quarter 2022 for a turning point ahead, at least on a closing basis. It does appear we have a choppy period starting the Third Quarter 2021 until the First Quarter 2022, but we do have a key target arriving also on the Fourth Quarter 2021 with each target producing the opposite direction for that 3-quarter period. Thereafter, we see the next target coming into play as the Fourth Quarter 2022 until the Third Quarter 2023, but while we have a target arriving also on the Second Quarter 2023, the key target remains the Fourth Quarter 2022 with again each target producing the opposite direction for that 4-quarter period.
QUARTERLY CURRENCY CORRELATION
The Taiwan Stock Index Cash did make a high in conjunction with the British pound on 01/01 yet in nominal terms the last high was created on 07/01 whereas the high in Australian dollar took place on 01/01, a high in the Canadian dollar was established on 01/01, a high in the Japanese yen was established on 01/01, a high in the Swiss franc was established on 01/01, a high in the Euro was established on 01/01, and a high in the Chinese yuan was 01/01.
In terms of a Basket of Currencies, we see that here this market has been neutral both in nominal and basket terms. In international terms, we have a divergence whereby this market last reached a high in nominal terms on 07/01 after the high in terms of a basket of currencies which came on 01/01 implying that this immediate rally is purely in domestic terms.
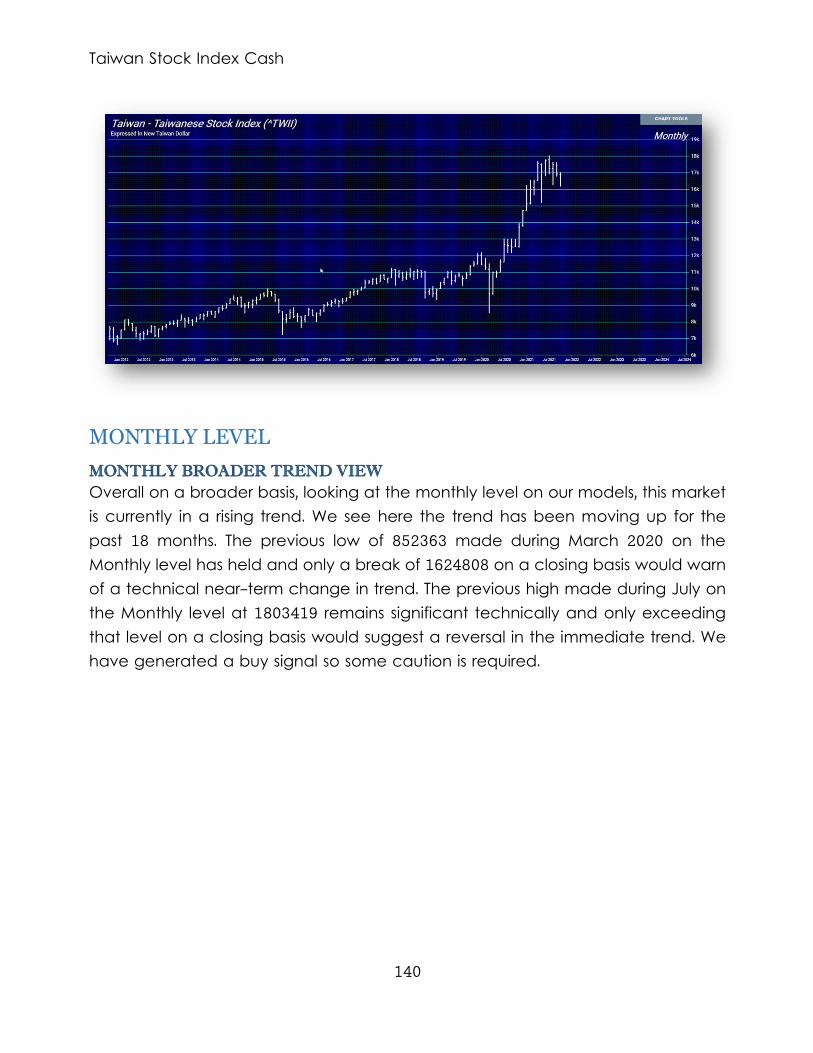
Taiwan Stock Index Cash
140
MONTHLY LEVEL
MONTHLY BROADER TREND VIEW
Overall on a broader basis, looking at the monthly level on our models, this market is currently in a rising trend. We see here the trend has been moving up for the past 18 months. The previous low of 852363 made during March 2020 on the Monthly level has held and only a break of 1624808 on a closing basis would warn of a technical near-term change in trend. The previous high made during July on the Monthly level at 1803419 remains significant technically and only exceeding that level on a closing basis would suggest a reversal in the immediate trend. We have generated a buy signal so some caution is required.
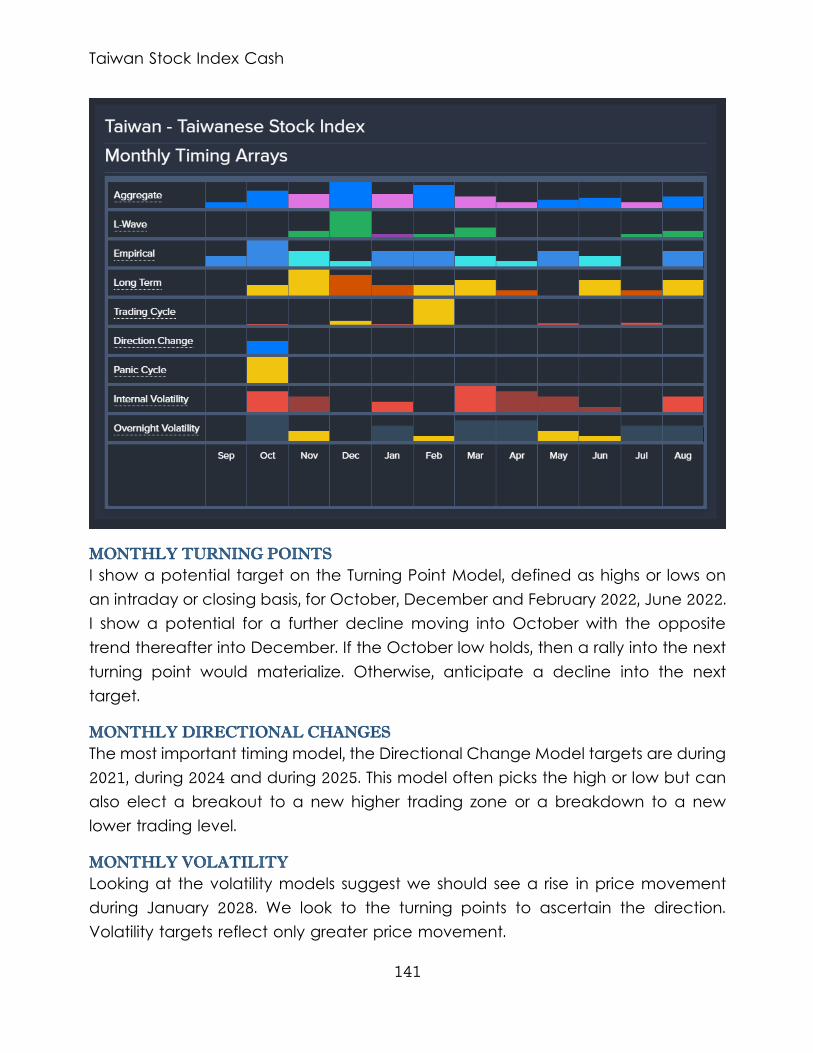
Taiwan Stock Index Cash
141
MONTHLY TURNING POINTS
I show a potential target on the Turning Point Model, defined as highs or lows on an intraday or closing basis, for October, December and February 2022, June 2022. I show a potential for a further decline moving into October with the opposite trend thereafter into December. If the October low holds, then a rally into the next turning point would materialize. Otherwise, anticipate a decline into the next target.
MONTHLY DIRECTIONAL CHANGES
The most important timing model, the Directional Change Model targets are during 2021, during 2024 and during 2025. This model often picks the high or low but can also elect a breakout to a new higher trading zone or a breakdown to a new lower trading level.
MONTHLY VOLATILITY
Looking at the volatility models suggest we should see a rise in price movement during January 2028. We look to the turning points to ascertain the direction. Volatility targets reflect only greater price movement.
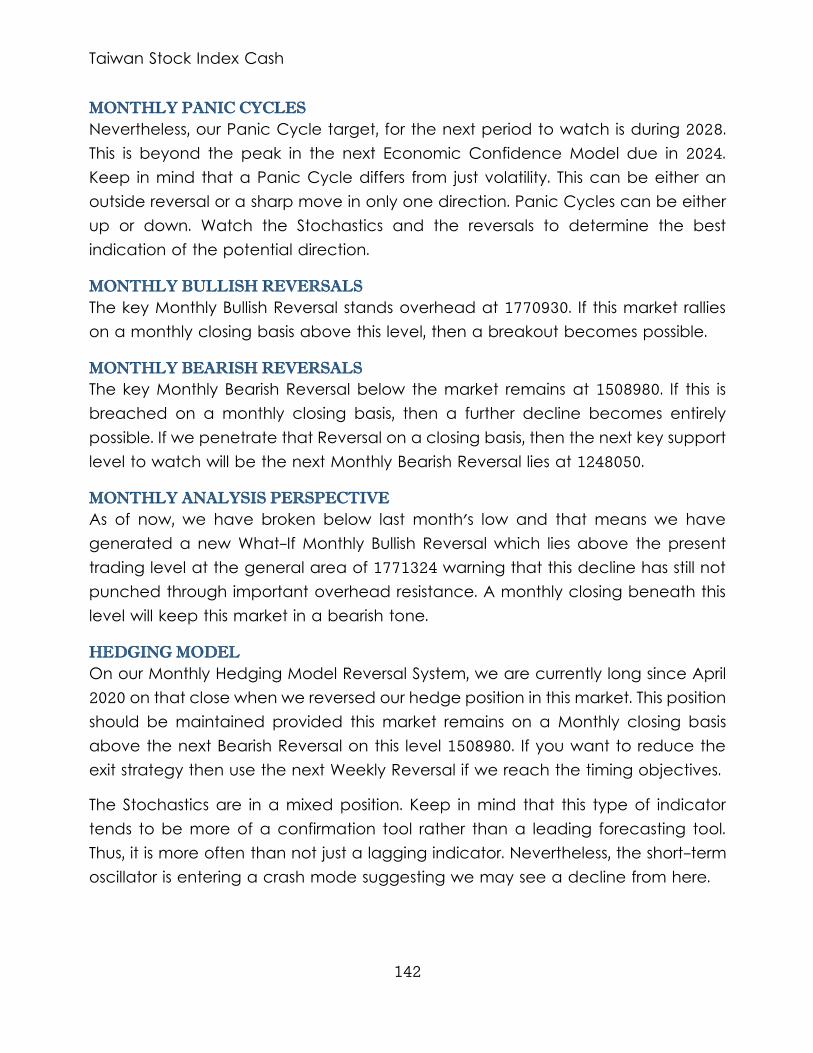
Taiwan Stock Index Cash
142
MONTHLY PANIC CYCLES
Nevertheless, our Panic Cycle target, for the next period to watch is during 2028. This is beyond the peak in the next Economic Confidence Model due in 2024. Keep in mind that a Panic Cycle differs from just volatility. This can be either an outside reversal or a sharp move in only one direction. Panic Cycles can be either up or down. Watch the Stochastics and the reversals to determine the best indication of the potential direction.
MONTHLY BULLISH REVERSALS
The key Monthly Bullish Reversal stands overhead at 1770930. If this market rallies on a monthly closing basis above this level, then a breakout becomes possible.
MONTHLY BEARISH REVERSALS
The key Monthly Bearish Reversal below the market remains at 1508980. If this is breached on a monthly closing basis, then a further decline becomes entirely possible. If we penetrate that Reversal on a closing basis, then the next key support level to watch will be the next Monthly Bearish Reversal lies at 1248050.
MONTHLY ANALYSIS PERSPECTIVE
As of now, we have broken below last month's low and that means we have generated a new What-If Monthly Bullish Reversal which lies above the present trading level at the general area of 1771324 warning that this decline has still not punched through important overhead resistance. A monthly closing beneath this level will keep this market in a bearish tone.
HEDGING MODEL
On our Monthly Hedging Model Reversal System, we are currently long since April 2020 on that close when we reversed our hedge position in this market. This position should be maintained provided this market remains on a Monthly closing basis above the next Bearish Reversal on this level 1508980. If you want to reduce the exit strategy then use the next Weekly Reversal if we reach the timing objectives.
The Stochastics are in a mixed position. Keep in mind that this type of indicator tends to be more of a confirmation tool rather than a leading forecasting tool. Thus, it is more often than not just a lagging indicator. Nevertheless, the short-term oscillator is entering a crash mode suggesting we may see a decline from here.
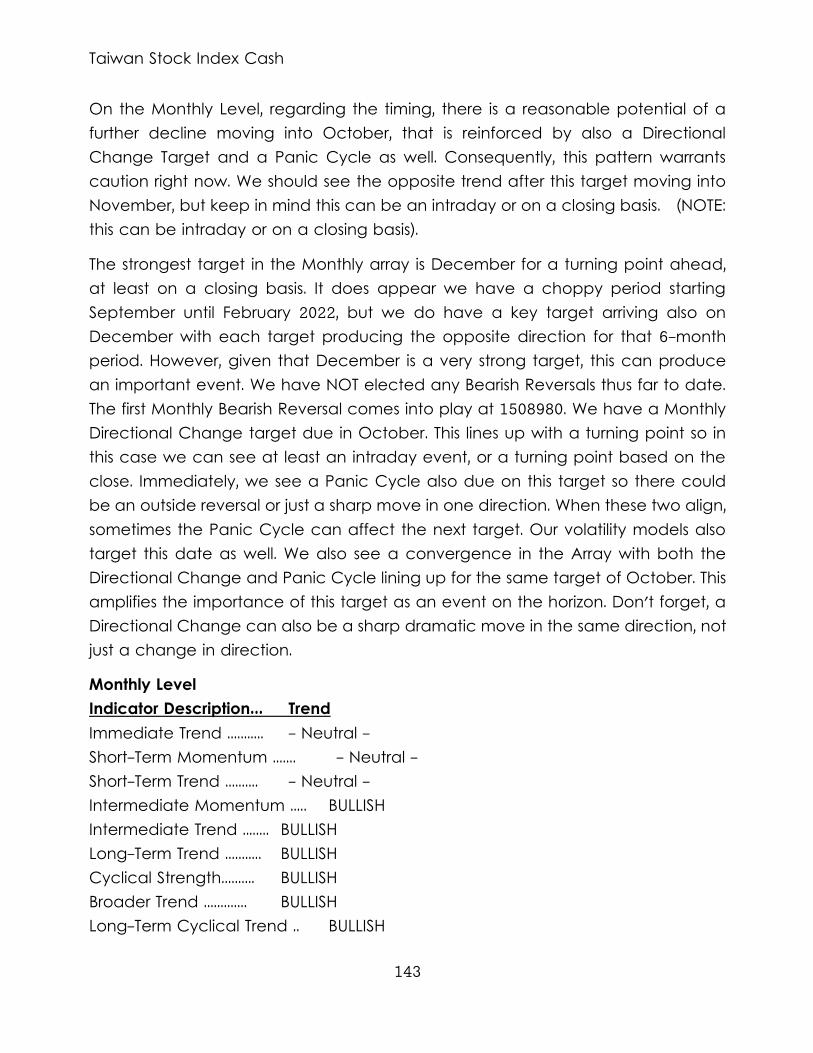
Taiwan Stock Index Cash
143
On the Monthly Level, regarding the timing, there is a reasonable potential of a further decline moving into October, that is reinforced by also a Directional Change Target and a Panic Cycle as well. Consequently, this pattern warrants caution right now. We should see the opposite trend after this target moving into November, but keep in mind this can be an intraday or on a closing basis. (NOTE: this can be intraday or on a closing basis).
The strongest target in the Monthly array is December for a turning point ahead, at least on a closing basis. It does appear we have a choppy period starting September until February 2022, but we do have a key target arriving also on December with each target producing the opposite direction for that 6-month period. However, given that December is a very strong target, this can produce an important event. We have NOT elected any Bearish Reversals thus far to date. The first Monthly Bearish Reversal comes into play at 1508980. We have a Monthly Directional Change target due in October. This lines up with a turning point so in this case we can see at least an intraday event, or a turning point based on the close. Immediately, we see a Panic Cycle also due on this target so there could be an outside reversal or just a sharp move in one direction. When these two align, sometimes the Panic Cycle can affect the next target. Our volatility models also target this date as well. We also see a convergence in the Array with both the Directional Change and Panic Cycle lining up for the same target of October. This amplifies the importance of this target as an event on the horizon. Don't forget, a Directional Change can also be a sharp dramatic move in the same direction, not just a change in direction.
Monthly Level Indicator Description... Trend Immediate Trend ........... - Neutral - Short-Term Momentum ....... - Neutral - Short-Term Trend .......... - Neutral - Intermediate Momentum ..... BULLISH Intermediate Trend ........ BULLISH Long-Term Trend ........... BULLISH Cyclical Strength.......... BULLISH Broader Trend ............. BULLISH Long-Term Cyclical Trend .. BULLISH
Taiwan Stock Index Cash
144
MONTHLY CURRENCY CORRELATION
The Taiwan Stock Index Cash did make a high in conjunction with the British pound on 07/01 yet in nominal terms the last high was created on 07/01 whereas the high in Australian dollar took place on 07/01, a high in the Canadian dollar was established on 07/01, a high in the Japanese yen was established on 07/01, a high in the Swiss franc was established on 07/01, a high in the Euro was established on 07/01, and a high in the Chinese yuan was 07/01.
In terms of a Basket of Currencies, we see that here this market has been neutral both in nominal and basket terms. In international terms, we have a divergence whereby this market last reached a high in nominal terms on 07/01 after the high in terms of a basket of currencies which came on 07/01 implying that this immediate rally is purely in domestic terms.
MARKET RISK FACTOR
Taiwan Stock Index Cash Risk Table
----------------- UPSIDE RISK ----- DOWNSIDE RISK --- MONTHLY....... 1770930 | 6.869% | 1508980 | 8.937% | QUARTERLY..... 1898696 | 14.58% | 1018003 | 38.56% | YEARLY........ 1649753 | -.44% | 762770 | 53.96% |
Conclusion
145
Conclusion
here is no question that the Financial Capital of the World is shifting to China and the West seems determined to follow the Agenda 2030 coming from Klaus Schwab’s World Economic Forum. Some have asked if
Schwab’s date of 2030 was intended to defeat our Economic Confidence Model’s target of 2032. All I can say is he is well aware of our forecasts. Klaus even went to Marcus Vetter to make his film after watching the Forecaster.
The longer-term view will indeed still be this shift to China for the people know the evils of Communism and now that they own property, it will not be so easy to reinstate Schwab’s idea of restoring Marxism but with an elite club that retains ownership instead of the state. This is a very critical aspect for China for it will be compelled to develop its domestic economy and turn inward. The success of such a status depends ENTIRELY upon the development of its domestic consumer economy. Rome lasted for a very long-term because it had the consumer economy that all the provinces wanted to sell to Rome.
T

Conclusion
146
China would do well to abandon the Western economic system altogether and avoid creating sovereign debt that only competes with the private sector. But we are too late for that agenda. Rome neither had a central bank nor a national debt. It funded itself by the production of new coinage. It is not “inflationary” for a government to fund itself by the creation of money provided it keeps that cost under 5% of GDP.
The rise of China is coming at the expense of the decline of the West by its own mismanagement. The theory that it was less inflationary to borrow than to print was a day when the debt itself was not yet collateral for loans in a formal marketplace. Today, debt is collateral and it can be borrowed on and used as cash that simply pays interest. China will displace the West for 309.6 years if it also rejects the idea of creating perpetual debt that is never paid off and a constant rise in taxes. There should be no federal income taxes and any tax paid should be confined to local taxes for infrastructure. These are the lessons history teaches if we care to listen.
The year 2022 will be significant from two primary angles. First, it will be 3 years of this COVID Pandemic which has been used to set the stage for Schwab’s Great Reset. Trying to scare people that the planet will end by 2050 just did not cut it. Rolling our Greta, a 16-year old whose speeches were written and she would read her scripts before important audiences fails to muster action. They needed to threaten people’s lives immediate to get the political change they wanted.
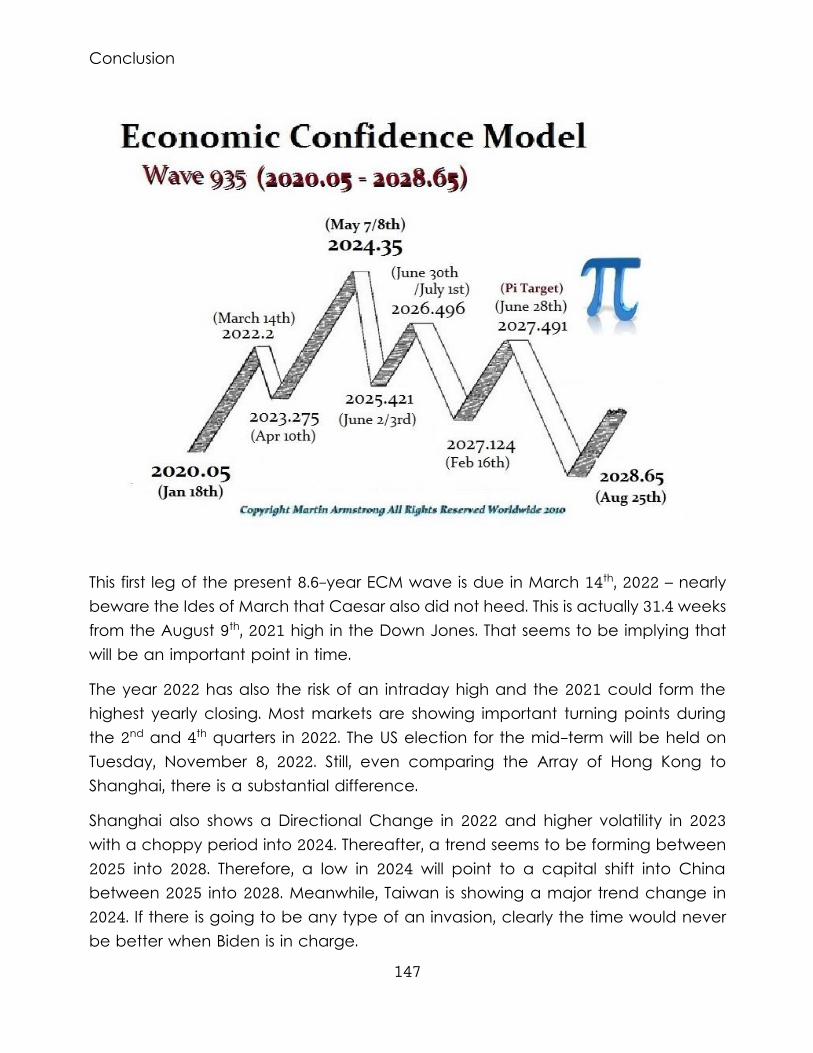
Conclusion
147
This first leg of the present 8.6-year ECM wave is due in March 14th, 2022 – nearly beware the Ides of March that Caesar also did not heed. This is actually 31.4 weeks from the August 9th, 2021 high in the Down Jones. That seems to be implying that will be an important point in time.
The year 2022 has also the risk of an intraday high and the 2021 could form the highest yearly closing. Most markets are showing important turning points during the 2nd and 4th quarters in 2022. The US election for the mid-term will be held on Tuesday, November 8, 2022. Still, even comparing the Array of Hong Kong to Shanghai, there is a substantial difference.
Shanghai also shows a Directional Change in 2022 and higher volatility in 2023 with a choppy period into 2024. Thereafter, a trend seems to be forming between 2025 into 2028. Therefore, a low in 2024 will point to a capital shift into China between 2025 into 2028. Meanwhile, Taiwan is showing a major trend change in 2024. If there is going to be any type of an invasion, clearly the time would never be better when Biden is in charge.