Embed Size (px)
Citation preview
THE 2020 CENSUS OF AMERICAN
RELIGION

THE 2020 CENSUS OF AMERICAN
RELIGION

AcknowledgmentsThe survey was made possible by generous support from the Arcus Foundation, the Evelyn and Walter Haas, Jr. Fund, the Gill Foundation, and Unitarian Universalist Veatch Program at Shelter Rock. The report was written by:
• Robert P. Jones, PhD, CEO
• Natalie Jackson, PhD, Director of Research
• Diana Orcés, PhD, Research Associate
• Ian Huff, Research Associate
Additionally, the authors would like to thank:
• Sean Sands, Chief of Staff
• Douglas Barclay, Digital Content Associate
• Tim Duffy, Design
• Mackenzie Boughey, Research Intern
We would also like to thank Kivvit for providing communications outreach.
PRRI 1023 15th Street NW, 9th Floor Washington D.C. 20005 www.prri.org
For more information, contact [email protected]
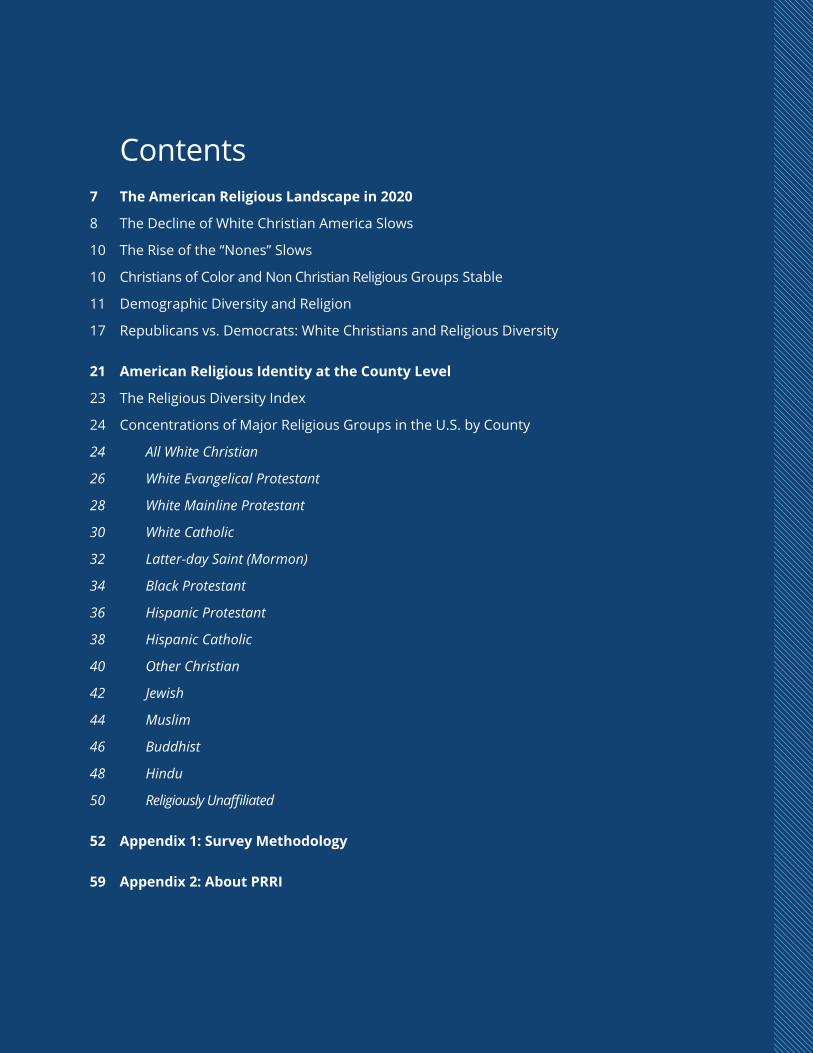
Contents7 The American Religious Landscape in 2020
8 The Decline of White Christian America Slows
10 The Rise of the “Nones” Slows
10 Christians of Color and Non Christian Religious Groups Stable
11 Demographic Diversity and Religion
17 Republicans vs. Democrats: White Christians and Religious Diversity
21 American Religious Identity at the County Level
23 The Religious Diversity Index
24 Concentrations of Major Religious Groups in the U.S. by County
24 All White Christian
26 White Evangelical Protestant
28 White Mainline Protestant
30 White Catholic
32 Latter-day Saint (Mormon)
34 Black Protestant
36 Hispanic Protestant
38 Hispanic Catholic
40 Other Christian
42 Jewish
44 Muslim
46 Buddhist
48 Hindu
50 ReligiouslyUnaffiliated
52 Appendix 1: Survey Methodology
59 Appendix 2: About PRRI


THE 2020 CENSUS OF AMERICAN RELIGION 7
The American Religious Landscape in 2020According to PRRI’s 2020 American Values Atlas, seven in ten Americans (70%) identify as Christian, including more than four in ten who identify as white Christian and more than one-quarter who identify as Christian of color. Nearly one in four Americans (23%) are religiously unaffiliated, and 5% identify with non-Christian religions.1
1 Throughout this report, the term “white” signifies respondents who identify as white or Caucasian and do not identify as Hispanic or Latino. “Christian of color” includes Christians who identify as Black, Hispanic, Asian or Pacific Islander American, Native American, multiracial, or any other nonwhite race or ethnicity. “Religiously unaffiliated” includes those who claim no religion in particular, atheists, agnostics, and spiritual but not religious Americans. “Non-Christian religious” includes Jews, Muslims, Hindus, Buddhists, Unitarian Universalists, and adherents of any other world religion. “Latter-Day Saint (Mormon)” refers to the Church of Jesus Christ of Latter-Day Saints.
FIGURE 1. The American Religious Landscape in 2020Percent who identify as:
Source: PRRI 2020 American Values Atlas.
White evangelical Protestant
White mainline (non-evangelical) Protestant
White Catholic
Latter-day Saint (Mormon)
Orthodox Christian
Black Protestant
Hispanic Protestant
Other Protestant of color
Hispanic Catholic
Other Catholic of color
Jehovah’s Witness
Jewish
Muslim
Buddhist
Hindu
Unitarian/Universalist
Other Religion
Unaffiliated
Don’t know/Refused
14
16
12
10.574
4
8
21
111
0.50.2
1
23
2

8 THE 2020 CENSUS OF AMERICAN RELIGION
The most substantial cultural and political divides are between white Christians and Christians of color. More than four in ten Americans (44%) identify as white Christian, including white evangelical Protestants (14%), white mainline (non-evangelical) Protestants (16%), and white Catholics (12%), as well as small percentages who identify as Latter-day Saint (Mormon), Jehovah’s Witness, and Orthodox Christian.2 Christians of color include Hispanic Catholics (8%), Black Protestants (7%), Hispanic Protestants (4%), other Protestants of color (4%), and other Catholics of color (2%).3 The rest of religiously affiliated Americans belong to non-Christian groups, including 1% who are Jewish, 1% Muslim, 1% Buddhist, 0.5% Hindu, and 1% who identify with other religions. Religiously unaffiliated Americans comprise those who do not claim any particular religious affiliation (17%) and those who identify as atheist (3%) or agnostic (3%).
The Decline of White Christian America Slows Over the last few decades, the proportion of the U.S. population that is white Christian has declined by nearly one-third. As recently as 1996, almost two-thirds of Americans (65%) identified as white and Christian. By 2006, that had declined to 54%, and by 2017 it was down to 43%.4 The proportion of white Christians hit a low point in 2018, at 42%, and rebounded slightly in 2019 and 2020, to 44%. That tick upward indicates the decline is slowing from its pace of losing roughly 11% per decade.
The slight increase in white Christians between 2018 and 2020 was driven primarily by an uptick in the proportion of white mainline (non-evangelical) Protestants and a stabilization in the proportion of white Catholics. Since 2007, white mainline (non-evangelical) Protestants have declined from 19% of the population to a low of 13% in 2016, but the last three years have seen small but steady increases, up to 16% in 2020. White Catholics have also declined from a high point of 16% of the population in 2008, and their low point of 11% occurred in 2018. It is unclear if the bump back up to 12% in 2020 indicates a new trend.
2 All respondents who identify as Christian are then asked: “Would you describe yourself as a ‘born again’ or ‘evangelical Christian,’ or not?” Respondents who self-identify as white, non-Hispanic, Protestant and identify as born-again or evangelical are categorized as white evangelical Protestants. Respondents who self-identify as white, non-Hispanic, Protestant and do not identify as born-again or evangelical are categorized as white mainline Protestants..
3 Other Protestants of color include Protestants who are Asian or Pacific Islander American, Native American, multiracial, or any other race or ethnicity not listed. Other Catholics of color include Catholics who are Black, Asian or Pacific Islander American, Native American, multiracial, or any other race or ethnicity not listed. These groups are combined due to small sample sizes that prevent individual analysis.
4 https://www.prri.org/research/american-religious-landscape-christian-religiously-unaffiliated/#page-section-2

THE 2020 CENSUS OF AMERICAN RELIGION 9
Since 2006, white evangelical Protestants have experienced the most precipitous drop in affiliation, shrinking from 23% of Americans in 2006 to 14% in 2020. That proportion has generally held steady since 2017 (15% in 2017, 2018, and 2019).
2010 2011 2012 2013 20142006 2007 2008 2009 2015 2016 2017 2018 20202019
FIGURE 2. Decline of White Christians, Rise of the Unaffiliated Trends StabilizePercent who identify as:
White CatholicWhite mainline (non-evangelical) Protestant
White evangelical Protestant Unaffiliated
Sources: Pew Religion and Public Life Survey, 2006-2009; PRRI Surveys 2010-2012; PRRI, PRRI American Values Atlas, 2013-2020.
22.52321.4
20.8 20.8 21.319.9
19
21.1 21.522.7
23.6
25.3 25.524
23.3
17.5 18.317.3 16.8
15.3 15.3 15.216.4
14.5
11.7
14.7
12
13.5
10.9
13.3
11.3
12.8
11.4
13.3
12.1
13.7
13
14.2
12.3
14.915.5
14.414.2
15.517.5
1819 19.517
19.417.8
16.1
16 15.6 16.114.7
13.9
0
30
25
20
15
10
5

10 THE 2020 CENSUS OF AMERICAN RELIGION
The Rise of the “Nones” Slows Disaffiliating white Christians have fueled the growth of the religiously unaffiliated during this period. Only 16% of Americans reported being religiously unaffiliated in 2007; this proportion rose to 19% by 2012, and then gained roughly a percentage point each year from 2012 to 2017. Reflecting the patterns above, the proportion of religiously unaffiliated Americans hit a high point of 26% in 2018 but has since slightly declined, to 23% in 2020.
The increase in proportion of religiously unaffiliated Americans has occurred across all age groups but has been most pronounced among young Americans. In 1986, only 10% of those ages 18–29 identified as religiously unaffiliated. In 2016, that number had increased to 38%, and declined slightly in 2020, to 36%.
Christians of Color and Non Christian Religious Groups StableIn 2020, around one in four Americans were Christians of color (26%). This share is relatively similar compared to that in 2016 (25%) and has grown only slightly since 2006 (23%). Individual groups of Christians of color, including Black Protestants, Hispanic Protestants, Hispanic Catholics, Black Catholics, Asian American and Pacific Islander (AAPI) Christians, multiracial Christians, and Native American Christians, have shifted by single percentage points between 2006 and 2020.
FIGURE 3. More Young Adults are Unaffiliated Today Than in the Past Religiously unaffiliated, by age cohort, 1986-2020
1996 2006 202020160
10
20
25
30-4918-29
Sources: General Social Survey, 1986, 1996, 2006; PRRI American Values Atlas, 2016, 2020.
30
15
5
35
1986
40
65+50-64
108
3 3
20
12
75
23
17
38
26
18
12
36
25
181413
8

THE 2020 CENSUS OF AMERICAN RELIGION 11
The share of non-Christian religious groups has also remained steady between 2020 (4%), 2016 (4%), and 2006 (5%). No non-Christian religious group has grown or declined significantly in size since 2006.
Demographic Diversity and Religion
Young Americans Are More Religiously Diverse
Americans ages 18–29 are the most religiously diverse age group. Although a majority (54%) are Christian, only 28% are white Christians (including 12% who are white mainline Protestants, 8% who are white Catholics, and 7% who are white evangelical Protestants), while 26% are Christians of color (including 9% who are Hispanic Catholics, 5% who are Hispanic Protestants, 5% who are Black Protestants, 2% who are multiracial Christians, 2% who are AAPI Christians, and 1% who are Native American Christians). More than one-third of young Americans (36%) are religiously unaffiliated, and the remainder are Jewish (2%), Muslim (2%), Buddhist (1%), Hindu (1%), or another religion (1%).
Don’t know/Refused
Unaffiliated
Other world religions
Jewish
Other Christian
Hispanic Catholic
Hispanic Protestant
Black Protestant
Latter-day Saint (Mormon)
White Catholic
White mainline Protestant
White evangelical Protestant
0
70
80
90
60
50
40
30
20
10
FIGURE 4. A Generational Sea Change in Religious AffiliationPercent who identify as:
Source: PRRI 2020 American Values Atlas.
100
30-4918-29 65+50-64
7
12
8
5
5
36
6
9
5
12
17
10
7
5
25
6
10
3
17
17
14
9
3
18
7
7
3
22
20
15
8
14
6
5
3
12 THE 2020 CENSUS OF AMERICAN RELIGION
The proportion of white Christians increases proportionally as age increases. Among those ages
30–49, 41% are white Christian, as are half of those ages 50–64 (50%) and a majority of Americans
65 and older (59%). These increases are offset by sharp declines in the proportion of religiously
unaffiliated Americans in each age group. While more than one-third of Americans under the age
of 30 are religiously unaffiliated (36%), that proportion drops to one in four (25%) among those
ages 30–49, to 18% among those ages 50–64, and to only 14% among those ages 65 and older.
The proportions of Christians of color and non-Christian religious people feature more modest
shifts. While the numbers are small, African American Protestants make up 8% of Americans
ages 65 and older but only 5% of Americans under the age of 30. By contrast, the proportions of
Hispanic Protestants, Hispanic Catholics, and adherents to other world religions are significantly
higher among younger Americans than among people over 65.
Americans ages 65 and older are the only group whose religious profile has changed
significantly since 2013. Among Americans 65 and older, the proportion of white evangelical
Protestants dropped from 26% in 2013
to 22% in 2020, and the proportion of
white Catholics dropped from 18% in
2013 to 15% in 2020. By contrast, the
proportion of religiously unaffiliated
seniors increased from 11% in 2013 to
14% in 2020.
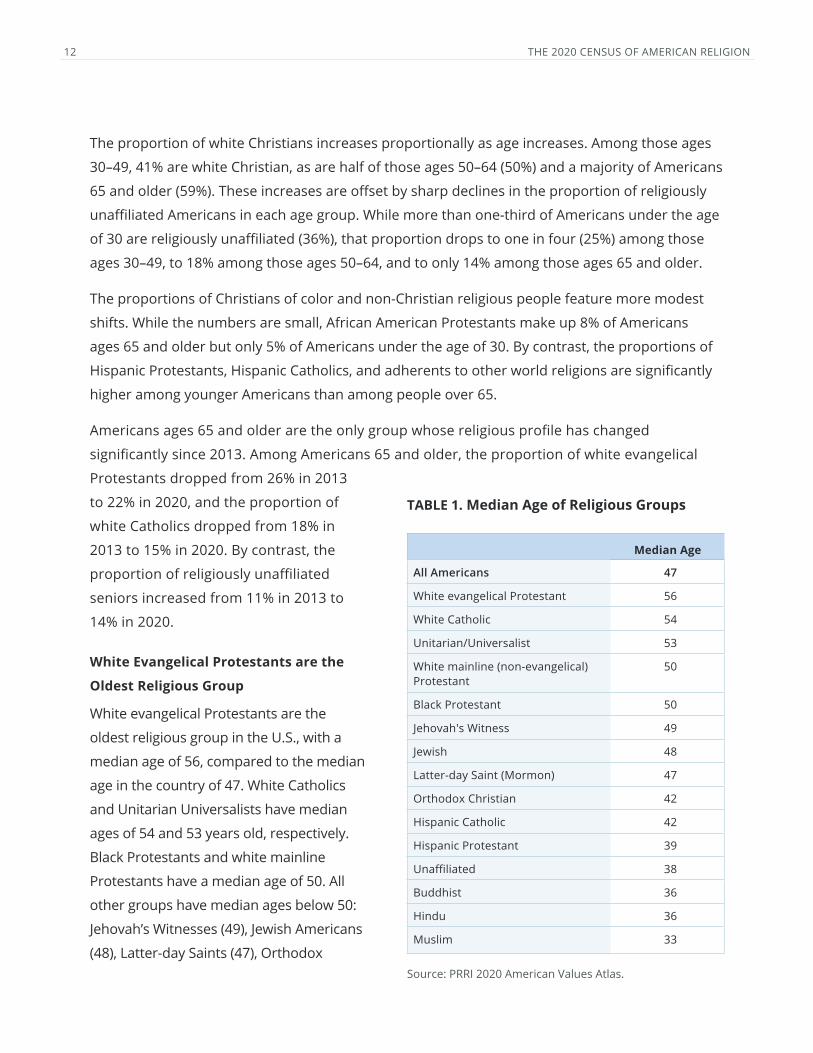
White Evangelical Protestants are the
Oldest Religious Group
White evangelical Protestants are the
oldest religious group in the U.S., with a
median age of 56, compared to the median
age in the country of 47. White Catholics
and Unitarian Universalists have median
ages of 54 and 53 years old, respectively.
Black Protestants and white mainline
Protestants have a median age of 50. All
other groups have median ages below 50:
Jehovah’s Witnesses (49), Jewish Americans
(48), Latter-day Saints (47), Orthodox
TABLE 1. Median Age of Religious Groups
Median Age
All Americans 47
White evangelical Protestant 56
White Catholic 54
Unitarian/Universalist 53
White mainline (non-evangelical) Protestant
50
Black Protestant 50
Jehovah's Witness 49
Jewish 48
Latter-day Saint (Mormon) 47
Orthodox Christian 42
Hispanic Catholic 42
Hispanic Protestant 39
Unaffiliated 38
Buddhist 36
Hindu 36
Muslim 33
Source: PRRI 2020 American Values Atlas.
THE 2020 CENSUS OF AMERICAN RELIGION 13
Christians (42), Hispanic Catholics (42), Hispanic Protestants (39), religiously unaffiliated people (38),
Buddhists (36), Hindus (36), and Muslims (33). In the youngest groups, one-third of Hindu (33%) and
Buddhist (34%) Americans and 42% of Muslim Americans are in the 18–29 age category.
Since 2013, the median age of most religious groups has increased slightly, with the exceptions
of white mainline Protestants and Jewish Americans. The median age of Black Protestants
has increased most, from 45 in 2013 to 50 in 2020. Other groups with substantial median age
increases include Hispanic Protestants (from 35 to 39), white evangelical Protestants (from 53 to
56), Latter-day Saints (from 44 to 47), Hispanic Catholics (from 39 to 42), and Hindu Americans
(from 33 to 36). Other groups have remained steady or increased in median age at a similar level
to the country as a whole (from 46 to 48).
The median age of white mainline Protestants and Jewish Americans has decreased over the
same period. In 2013, the median age for white mainline Protestants was 52, and in 2020 it was
50. Jewish Americans have decreased in median age from 52 in 2013 to 48 in 2020.
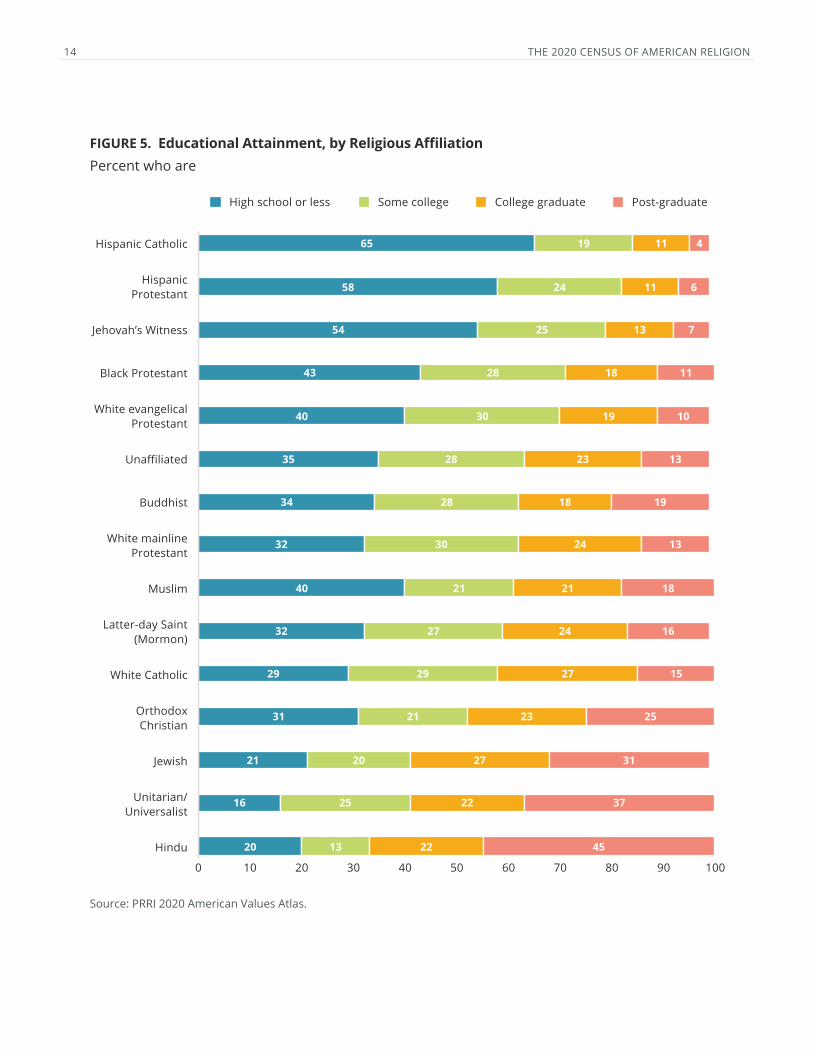
Hindu, Unitarian/Universalist, and Jewish Americans Most Likely to Have College Degrees
Educational attainment varies considerably across religious groups. Majorities of Hindu (67%),
Unitarian Universalist (59%), and Jewish (58%) Americans have four-year college degrees or
higher. Four in ten or more Orthodox Christians (48%), white Catholics (42%), and Latter-day
Saints (40%) also have at least a four-year college degree. More than one-third of Muslims (39%),
white mainline Protestants (37%), Buddhists (37%), and the religiously unaffiliated (36%) have
at least a four-year college degree. Three in ten white evangelical Protestants (29%) and Black
Protestants (29%) hold college degrees, while one in five or less Jehovah’s Witnesses (20%),
Hispanic Protestants (17%), and Hispanic Catholics (15%) do.
14 THE 2020 CENSUS OF AMERICAN RELIGION
FIGURE 5. Educational Attainment, by Religious Affiliation Percent who are
Source: PRRI 2020 American Values Atlas.
0 10 20 30 40 50 10080 907060
High school or less Some college College graduate
White mainline Protestant
Jewish
Unitarian/Universalist
Muslim
Buddhist
White Catholic
Hindu
Latter-day Saint (Mormon)
Jehovah’s Witness
Unaffiliated
Black Protestant
Hispanic Protestant
Orthodox Christian
White evangelical Protestant
Hispanic Catholic
Post-graduate
65
58
54
43
40
35
34
32
40
32
29
31
21
16
20
19
24
25
28
30
28
28
30
21
27
29
21
20
25
13
11
11
13
18
19
23
18
24
21
24
27
23
27
22
22
4
6
7
11
10
13
19
13
18
16
15
25
31
37
45

THE 2020 CENSUS OF AMERICAN RELIGION 15
Race/Ethnicity and Religious Affiliation
A large majority (71%) of white Americans identify as Christian. Half (50%) are Protestant, including 23% who identify as evangelical and 27% who are mainline Protestant. Another 19% are Catholic, 2% are Latter-day Saint, and less than 1% each are Jehovah’s Witnesses or Orthodox Christians. Most non-Christian white Americans are religiously unaffiliated (23%), with 2% who are Jewish and less than 1% who are Muslim, Buddhist, Hindu, or another religion. Compared to 2013, white Americans are slightly less Christian overall (74% in 2013) and more likely to be unaffiliated (22% in 2013).
Black Americans are also mostly Christian (72%). More than six in ten (63%) are Protestant, including 35% who identify as evangelical and 28% who identify as non-evangelical Protestants. Seven percent of Black Americans are Catholic, while 2% are Muslim and 2% are Buddhist,
0
70
80
90
60
50
40
30
20
10
FIGURE 6. Religious Affiliation, by Race/Ethnicity Percent who identify as:
Source: PRRI 2020 American Values Atlas.
100
Evangelical Protestant
Non-evangelical Protestant
Other world religions
Catholic
Jewish
Unaffiliated
Other Christian
Don’t know/Refused
Black, non-Hispanic
White, non-Hispanic
Native American
HispanicMultiracial Asian or Pacific
Islander
35
28
7
21
4
23
27
19
23
14
10
50
19
10
10
10
34
3
29
28
11
19
28
4
7
23
18
11
34
3
6
4

16 THE 2020 CENSUS OF AMERICAN RELIGION
2% are another religion, and 1% are Jehovah’s Witnesses; less than 1% identify as Latter-day Saint, Orthodox Christian, Jewish, or Hindu. More than one in five (21%) Black Americans are religiously unaffiliated. More Black Americans identified as Christian in 2013 (79%) and fewer said they were religiously unaffiliated (16% in 2013).
Three in four Hispanic Americans (76%) identify as Christian, and half (50%) are Catholic. About one in four (24%) identify as Protestant, including 14% who say they are evangelical and 10% who identify as non-evangelical Protestant. About 1% or less identity with other religious groups. About one in five (19%) are religiously unaffiliated. As with Black and white Americans, more Hispanic Americans identified as Christian (79%) and less as unaffiliated (18%) in 2013.
Asian American and Pacific Islander Americans are as likely to be religiously unaffiliated (34%) as they are to be Christian (34%). The Christian subset includes one in five (20%) who are Protestant (10% evangelical, 10% non-evangelical), 10% who are Catholic, 1% who are Latter-day Saint, and 1% who are Orthodox Christian. Three in ten (29%) Asian or Pacific Islander Americans belong to a non-Christian religion, including 11% who are Hindu, 9% who are Buddhist, and 8% who are Muslim. Less than 1% are Jewish, and 1% belong to another religion. There are no significant differences in religious affiliation in 2013 and 2020 for AAPI Americans.
A majority (55%) of multiracial Americans are Christian. More than four in ten (41%) identify as Protestant (including 23% who are evangelical and 18% who are non-evangelical), while 11% are Catholic, 1% are Latter-day Saint, and 1% are Orthodox Christians. Two percent of multiracial Americans are Buddhist, and 1% each are Jewish, Muslim, and Hindu. Another 2% affiliate with another religion. More than one-third (34%) are religiously unaffiliated. There have been no substantial shifts in religious affiliation among multiracial Americans since 2014.5
Six in ten Native Americans (60%) identify as Christian, mostly comprised of 47% who are Protestant (28% evangelical, 19% non-evangelical). An additional 11% are Catholic, 1% are Latter-day Saint, and 1% are Jehovah’s Witnesses. Two percent identify with another religion, 1% each are Jewish and Muslim, and less than 1% are Hindu and Buddhist. Nearly three in ten Native Americans (28%) are religiously unaffiliated. There have been no substantial shifts in religious affiliation among Native Americans since 2013.
5 Multiracial was separated as its own category for the first time in the 2014 American Values Atlas data.

THE 2020 CENSUS OF AMERICAN RELIGION 17
Republicans vs. Democrats: White Christians and Religious DiversityBoth major political parties are majority Christian, with 83% of Republicans and 69% of Democrats identifying as Christian. The biggest difference in the religious makeup of self-identified Republicans and Democrats is the proportion of white Christians compared to Christians of color and the religiously unaffiliated. Two-thirds of Republicans (68%) identify as white and Christian, compared to 39% of Democrats. Among Republicans, 29% are white evangelical Protestants, 22% are white mainline Protestants, and 15% are white Catholics. Among Democrats, those numbers fall to 9%, 16%, and 13%, respectively.
By contrast, 13% of Democrats are Black Protestants, 10% are Hispanic Catholics, and 4% are Hispanic Protestants, compared to only 2%, 3%, and 3%, respectively, among Republicans. Nearly one in four Democrats (23%) are religiously unaffiliated, compared to 13% of Republicans.
The religious makeup of Democrats generally resembles that of younger Americans ages 18–29, who are 27% white Christian, 26% Christian of color, 7% another religion, and 36% unaffiliated, and ages 30–49, who are 40% white Christian, 32% Christian of color, 4% another religion, and 23% unaffiliated. The Republican breakdown is more akin to groups of Americans over age 65, who are 59% white Christian, 20% Christian of color, 4% another religion, and 14% unaffiliated. Notably, no age group is as white and Christian as Republicans.
9 3216 13 5 23
FIGURE 7. Religious Affiliation, by Party and AgePercent who identify as:
Source: PRRI 2020 American Values Atlas.
0 10 20 30 40 50 10080 907060
30-49
Republican
50-64
Democrat
65+
18-29 7 12 8 26 7 36
12 2817 10 4 25
17 17 14 26 3 18
22 20 15 20 4 14
29 22 15 14 3 13
White Catholic
White mainline Protestant
White evangelical Protestant
UnaffiliatedOther religion
Christian of color

18 THE 2020 CENSUS OF AMERICAN RELIGION
Shares of Religiously Unaffiliated Increasing in Both Parties
Shifts since 2013 in the religious composition of both the Republican Party and the Democratic Party follow a similar trend: a decline in the share of Christians and a corresponding increase in the share of religiously unaffiliated Americans.
Among Republicans, most of this decline is among white evangelical Protestants, who have declined from 37% of the party in 2006 to 34% in 2013 and are now down to a low of 29% in 2020. Other groups of white Christian Republicans have not shifted quite as dramatically. White mainline Protestants made up 22% of the party in 2006, reached a low of 18% in 2018 and rebounded to 22% in 2020. White Catholics declined from 20% in 2006 to 17% in 2013, and have remained relatively stable since that time, making up 15% of the party in 2020.
0
70
80
90
60
50
40
30
20
10
FIGURE 8. Shift in Religious Affiliation 2006 to 2020, by Party Affiliation Percent who identify as:
Sources: Pew 2006 Survey, PRRI 2020 American Values Atlas.
100
Republican Democrat
22
20
4
5Unaffiliated
Other world religions
Jewish
Other Christian
Hispanic Catholic
Hispanic Protestant
Black Protestant
Latter-day Saint (Mormon)
White Catholic
White mainline Protestant
White evangelical Protestant
Republican Democrat
3
37
3
16
16
18
6
8
17
3
22
15
13
33
29
6
13
13
23
10
6
16
4
9
3
4
9
2006 2020

THE 2020 CENSUS OF AMERICAN RELIGION 19
The share of religiously unaffiliated people among Republicans has increased dramatically. In 2006, just 4% of Republicans identified as unaffiliated. That proportion more than doubled to 10% in 2013 and continued to grow to 13% in 2020.
The Democratic Party has seen a slight decline in the share of Black Protestants and an increasing proportion of religiously unaffiliated members. In both 2006 and 2013, 18% of Democrats identified as Black Protestants. Starting in 2017, that share began declining: from 17% in 2017 to 15% in 2018 and 13% in 2020. The share of unaffiliated Democrats also more than doubled between 2006 (9%) and 2013 (22%). From 2013 to 2018 (28%), the share of unaffiliated Democrats grew slightly each year, before dropping to 23% in 2020. The decline in unaffiliated Democrats from 2018 to 2020 is offset by an increase in white mainline Protestants (12% in 2018 and 16% in 2020), consistent with the overall trend of increasing white mainline Protestant affiliation among all Americans.


THE 2020 CENSUS OF AMERICAN RELIGION 21
American Religious Identity at the County Level PRRI has been collecting and aggregating data on religious diversity in America continuously since 2013. The combined dataset contains interviews with 459,822 Americans across all 50 states from 2013 to 2019. This dataset was merged with American Community Survey (ACS) data on 3,142 counties across all 50 states to produce, for the first time, a rigorous estimate of the religious demographics of every county in the U.S.6 Because there is no measure of religious affiliation on the ACS or any other U.S. Census Bureau product, this PRRI Census of American Religion is the most comprehensive resource available on religious diversity in America.
Index of Religious DiversityTo measure religious diversity in the United States, this report uses an index developed to measure variations in the concentration of global religious populations. The index is calculated so that a score of 1 signifies complete diversity—every religious group is of equal size—and a score of 0 indicates a complete lack of diversity and one religious group comprises the entire population of a given county.7
• The average religious diversity score by county in the U.S. is 0.625.
• Religious diversity is highest in urban areas. The 10 highest religious diversity scores are:
○ Kings County, New York (0.897)
○ Queens County, New York (0.896)
○ Montgomery County, Maryland (0.880)
○ Navajo County, Arizona (0.876)
○ Santa Clara County, California (0.876)
○ Middlesex County, New Jersey (0.875)
○ Rockland County, New York (0.869)
○ New York County, New York (0.868)
6 See Appendix 1 for full methodology.7 The religious diversity for each state was calculated using the Religious Diversity Index, a variant of the
Herfindahl-Hirschman Index, a widely used measure of diversity among human and biological populations. See “The Herfindahl-Hirschman Index: A Concentration Measure Taking the Consumer’s Point of View,” Charles R. Laine, The Antitrust Bulletin, June 22, 1995.
22 THE 2020 CENSUS OF AMERICAN RELIGION
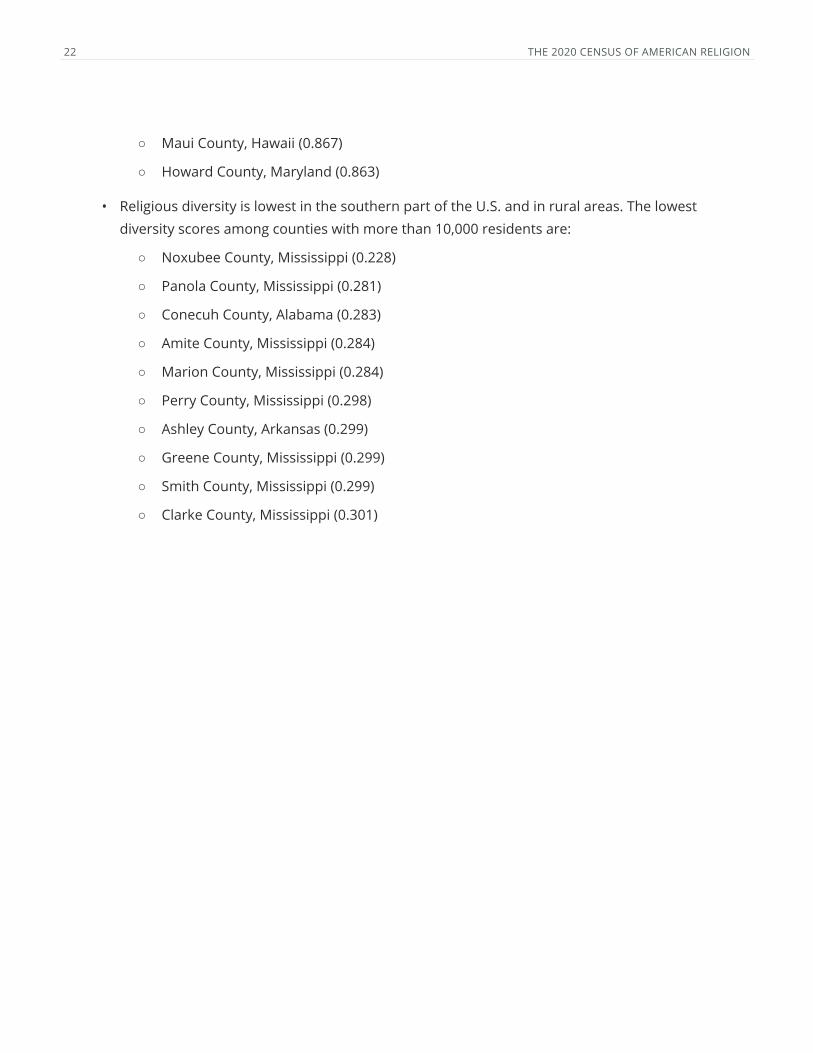
○ Maui County, Hawaii (0.867)
○ Howard County, Maryland (0.863)
• Religious diversity is lowest in the southern part of the U.S. and in rural areas. The lowest diversity scores among counties with more than 10,000 residents are:
○ Noxubee County, Mississippi (0.228)
○ Panola County, Mississippi (0.281)
○ Conecuh County, Alabama (0.283)
○ Amite County, Mississippi (0.284)
○ Marion County, Mississippi (0.284)
○ Perry County, Mississippi (0.298)
○ Ashley County, Arkansas (0.299)
○ Greene County, Mississippi (0.299)
○ Smith County, Mississippi (0.299)
○ Clarke County, Mississippi (0.301)

THE 2020 CENSUS OF AMERICAN RELIGION 23
Source: PRRI 2020 Census of American Religion.
0.2 0.9
FIGURE 9. The Religious Diversity Index, by County
24 THE 2020 CENSUS OF AMERICAN RELIGION
Concentrations of Major Religious Groups in the U.S. All White Christian
• White Christians make up 44% of the U.S. population as of 2020.
• White Christians are spread throughout the country but are most heavily concentrated in counties in the Midwest. The 10 highest concentrations of white Christians in counties with more than 10,000 residents are:
○ Lyon County, Iowa (87%)
○ Meeker County, Minnesota (86%)
○ Redwood County, Minnesota (86%)
○ Mercer County, Ohio (86%)
○ Madison County, Idaho (85%)
○ Campbell County, Tennessee (85%)
○ Osage County, Missouri (84%)
○ Somerset County, Pennsylvania (84%)
○ Wayne County, Tennessee (84%)
○ Wilkes County, North Carolina (83%)
• The median age of white Christian adults is 53. This is older than the median age of 47 for all Americans, and much older than non-Christian groups and religiously unaffiliated Americans.
• Around one-third of white Christians (33%) live in urban areas, 43% live in suburban areas, and 24% live in rural areas.
• White Christians tilt Republican: 39% identify as Republican, 31% identify as Democrat, and 28% identify as independent.

THE 2020 CENSUS OF AMERICAN RELIGION 25
Source: PRRI 2020 Census of American Religion.
0% 90%
FIGURE 10. White Christian Identity, by CountyWhite Christian includes those who identify as white evangelical Protestant, white mainline Protestant, and white Catholic, as well as small percentages who identify as Latter-day Saint, Jehovah’s Witness, and Orthodox Christian.

26 THE 2020 CENSUS OF AMERICAN RELIGION
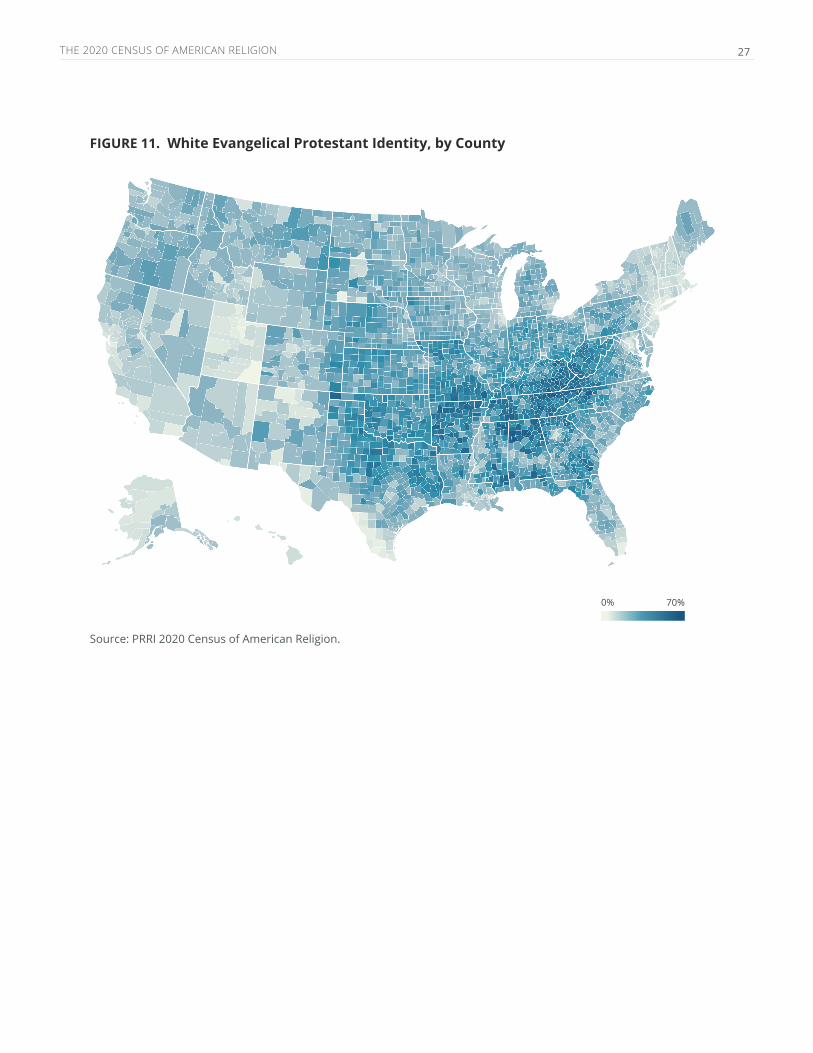
White Evangelical Protestant• White evangelical Protestants make up 14% of the U.S. population as of 2020.
• Large shares of white evangelical Protestants are spread through the country but are most heavily concentrated in counties in the South and lower Midwest. The 10 highest concentrations of white evangelical Protestants in counties with more than 10,000 residents are:
○ Marion County, Alabama (64%)
○ Campbell County, Tennessee (63%)
○ Johnson County, Tennessee (63%)
○ Fayette County, Alabama (63%)
○ McCreary County, Kentucky (62%)
○ Scott County, Tennessee (62%)
○ Cullman County, Alabama (62%)
○ Cocke County, Tennessee (61%)
○ Prentiss County, Mississippi (61%)
○ Wilkes County, North Carolina (60%)
• The median age of white evangelical Protestant adults is 56, older than the median ages of all Americans (47) and all white Christians (53).
• Three in ten white evangelical Protestants (30%) live in urban areas, 41% live in suburban areas, and 29% live in rural areas.
• White evangelical Protestants are heavily Republican: 51% identify as Republican, 22% identify as Democrat, and 25% identify as independent.
THE 2020 CENSUS OF AMERICAN RELIGION 27
Source: PRRI 2020 Census of American Religion.
0% 70%
FIGURE 11. White Evangelical Protestant Identity, by County

28 THE 2020 CENSUS OF AMERICAN RELIGION
White Mainline Protestant• White mainline protestants make up 16% of the U.S. population as of 2020.
• White mainline Protestants are spread around the country but are most heavily concentrated in counties in the Midwest. The 10 highest concentrations of white mainline Protestants in counties with more than 10,000 residents are:
○ Pope County, Minnesota (37%)
○ Chippewa County, Minnesota (37%)
○ Stutsman County, North Dakota (35%)
○ Clayton County, Iowa (35%)
○ Dunn County, Wisconsin (35%)
○ O’Brien County, Iowa (34%)
○ Faribault County, Minnesota (34%)
○ Otter Tail County, Minnesota (34%)
○ Fillmore County, Minnesota (34%)
○ Mille Lacs County, Minnesota (34%)
• The median age of white mainline Protestant adults is 50. This is older than the median age of all Americans (47), but somewhat younger than the median age of all white Christians (53).
• Around one-third of white mainline Protestants (35%) live in urban areas, 42% live in suburban areas, and 23% live in rural areas.
• White mainline Protestants are politically mixed: 33% identify as Republican, 35% identify as Democrat, and 30% identify as independent.

THE 2020 CENSUS OF AMERICAN RELIGION 29
Source: PRRI 2020 Census of American Religion.
0% 50%
FIGURE 12. White Mainline Protestant Identity, by County

30 THE 2020 CENSUS OF AMERICAN RELIGION
White Catholic• White Catholics make up 12% of the U.S. population as of 2020.
• White Catholics are most heavily concentrated in counties in the Northeast and Midwest and in southern Louisiana. The 10 highest concentrations of white Catholics in counties with more than 10,000 residents are:
○ Dubuque County, Iowa (45%)
○ Lackawanna County, Pennsylvania (45%)
○ Vermilion Parish, Louisiana (41%)
○ Calumet County, Wisconsin (41%)
○ Clinton County, New York (40%)
○ St. Martin Parish, Louisiana (40%)
○ Bristol County, Massachusetts (39%)
○ Lafourche Parish, Louisiana (39%)
○ Stearns County, Minnesota (38%)
○ Gloucester County, New Jersey (38%)
• The median age of white Catholic adults is 54. This is higher than the median age of 47 for all Americans and the same as the median age of 53 for all white Christians.
• 33% of white Catholics live in urban areas, 48% live in suburban areas, and 19% live in rural areas.
• White Catholics are skew slightly toward the Democratic side: 38% identify as Democrat, 32% identify as Republican, and 28% identify as independent.

THE 2020 CENSUS OF AMERICAN RELIGION 31
Source: PRRI 2020 Census of American Religion.
0% 50%
FIGURE 13. White Catholic Identity, by County

32 THE 2020 CENSUS OF AMERICAN RELIGION
Latter-day Saint (Mormon) • Latter-day Saints make up 1% of the U.S. population as of 2020.
• Latter-day Saints are most heavily concentrated in Utah. The 10 highest concentrations of Latter-day Saints in counties with more than 10,000 residents are:
○ Utah County, Utah (72%)
○ Madison County, Idaho (68%)
○ Cache County, Utah (64%)
○ Juab County, Utah (63%)
○ Millard County, Utah (63%)
○ Morgan County, Utah (61%)
○ Sanpete County, Utah (61%)
○ Box Elder County, Utah (60%)
○ Sevier County, Utah (58%)
○ Tooele County, Utah (58%)
• The median age of Latter-day Saints adults is 47, the same as the median age of 47 for all Americans, but younger than the median age of 53 for all white Christians.
• 30% of Latter-day Saints live in urban areas, 42% live in suburban areas, and 28% live in rural areas.
• Latter-day Saints generally identify as Republicans or independents: 39% identify as Republican, 16% identify as Democrat, and 42% identify as independent.

THE 2020 CENSUS OF AMERICAN RELIGION 33
Source: PRRI 2020 Census of American Religion.
0% 90%
FIGURE 14. Latter-day Saint (Mormon)
34 THE 2020 CENSUS OF AMERICAN RELIGION
Black Protestant • Black Protestants make up 7% of the U.S. population as of 2020.
• Black Protestants are most heavily concentrated in the South and Southeast, particularly in the Deep South. The 10 highest concentrations of Black Protestants in counties with more than 10,000 residents are:
○ Holmes County, Mississippi (68%)
○ Noxubee County, Mississippi (66%)
○ Bullock County, Alabama (63%)
○ Macon County, Alabama (62%)
○ Coahoma County, Mississippi (61%)
○ Leflore County, Mississippi (59%)
○ Sumter County, Alabama (59%)
○ Washington County, Mississippi (57%)
○ Sunflower County, Mississippi (57%)
○ Williamsburg County, South Carolina (55%)
• The median age of Black Protestant adults is 50, the same as white mainline Protestants (50), but slightly higher than the median for all Americans (47) and higher than most religious groups, except for white Catholics (54) and white evangelical Protestants (56).
• Around half of Black Protestants (48%) live in urban areas, while fewer live in suburban areas (37%) and rural areas (15%).
• Black Protestants are overwhelmingly Democratic: 65% identify as Democrat, 7% identify as Republican, and 26% identify as independent.

THE 2020 CENSUS OF AMERICAN RELIGION 35
Source: PRRI 2020 Census of American Religion.
0% 70%
FIGURE 15. Black Protestant Identity, by County

36 THE 2020 CENSUS OF AMERICAN RELIGION
Hispanic Protestant • Hispanic Protestants make up 4% of the U.S. population as of 2020.
• Hispanic Protestants are primarily concentrated in the Southwest and the West, particularly along the border between Texas and Mexico. The 10 highest concentrations of Hispanic Protestants in counties with more than 10,000 residents are:
○ Hidalgo County, Texas (21%)
○ Maverick County, Texas (20%)
○ Zavala County, Texas (18%)
○ Cameron County, Texas (18%)
○ Zapata County, Texas (17%)
○ Kleberg County, Texas (17%)
○ San Miguel County, New Mexico (17%)
○ Duval County, Texas (17%)
○ Dimmit County, Texas (17%)
○ Webb County, Texas (17%)
• The median age of Hispanic Protestant adults is 39, lower than the median for all Americans (47), and the lowest median age of all Christian groups.
• Hispanic Protestants are evenly split between urban areas (45%) and suburban areas (43%), while just 12% live in rural areas.
• Hispanic Protestants are primarily independent or Democratic: One in five (20%) Hispanic Protestants identify as Republican, 33% identify as Democrat, and 42% identify as independent.

THE 2020 CENSUS OF AMERICAN RELIGION 37
Source: PRRI 2020 Census of American Religion.
0% 20%
FIGURE 16. Hispanic Protestant Identity, by County
38 THE 2020 CENSUS OF AMERICAN RELIGION
Hispanic Catholic• Hispanic Catholics make up 8% of the U.S. population as of 2020.
• Hispanic Catholics primarily live in the Southwest and the West, particularly along the border between Texas and Mexico and in California. The 10 highest concentrations of Hispanic Catholics in counties with more than 10,000 residents are:
○ Zapata County, Texas (59%)
○ Starr County, Texas (58%)
○ Webb County, Texas (57%)
○ Maverick County, Texas (55%)
○ Santa Cruz County, Arizona (52%)
○ Zavala County, Texas (52%)
○ Duval County, Texas (51%)
○ Cameron County, Texas (51%)
○ Imperial County, California (50%)
○ Hidalgo County, Texas (49%)
• The median age of Hispanic Catholic adults is 42, lower than the median for all Americans (47). Hispanic Catholics are younger than most white religious groups but a bit older than non-Christian groups.
• More than four in ten Hispanic Catholics live in urban (46%) and suburban areas (43%), while only one in ten (10%) live in rural areas.
• Hispanic Catholics generally identify as Democrats or independents: One in ten Hispanic Catholics identify as Republican (10%), about four in ten identify as Democrat (41%), and about four in ten identify as independent (42%).

THE 2020 CENSUS OF AMERICAN RELIGION 39
Source: PRRI 2020 Census of American Religion.
0% 60%
FIGURE 17. Hispanic Catholic Identity, by County
40 THE 2020 CENSUS OF AMERICAN RELIGION
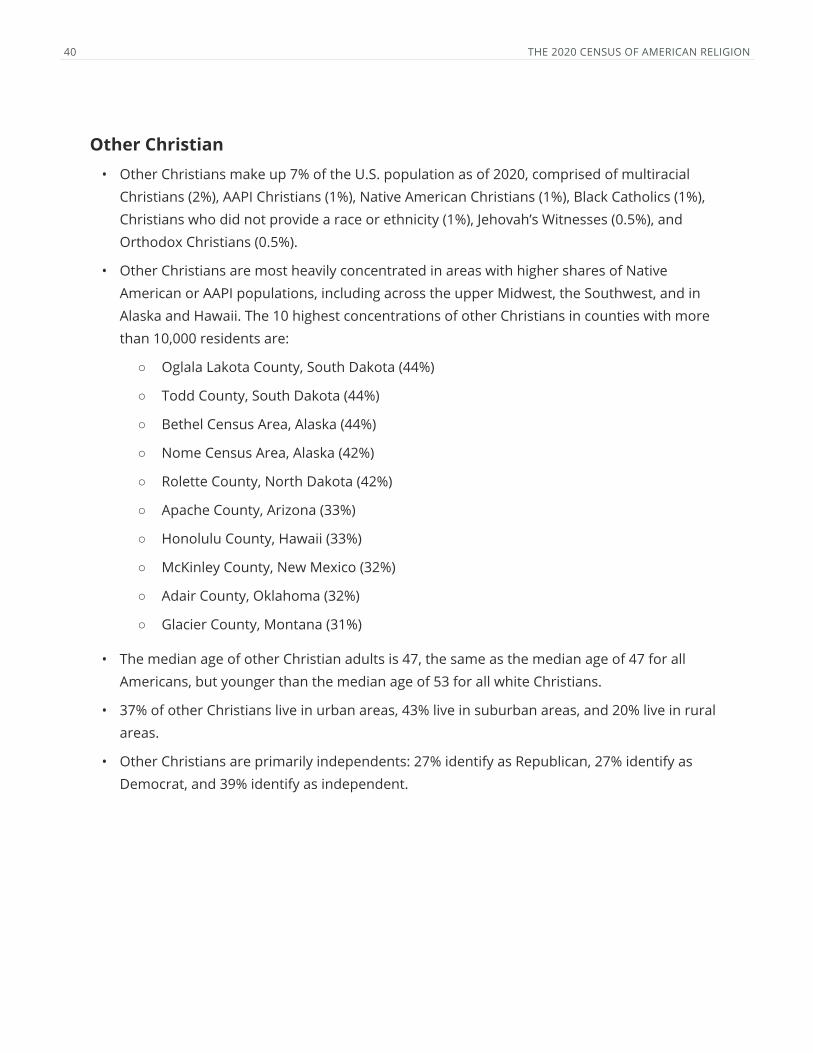
Other Christian• Other Christians make up 7% of the U.S. population as of 2020, comprised of multiracial
Christians (2%), AAPI Christians (1%), Native American Christians (1%), Black Catholics (1%), Christians who did not provide a race or ethnicity (1%), Jehovah’s Witnesses (0.5%), and Orthodox Christians (0.5%).
• Other Christians are most heavily concentrated in areas with higher shares of Native American or AAPI populations, including across the upper Midwest, the Southwest, and in Alaska and Hawaii. The 10 highest concentrations of other Christians in counties with more than 10,000 residents are:
○ Oglala Lakota County, South Dakota (44%)
○ Todd County, South Dakota (44%)
○ Bethel Census Area, Alaska (44%)
○ Nome Census Area, Alaska (42%)
○ Rolette County, North Dakota (42%)
○ Apache County, Arizona (33%)
○ Honolulu County, Hawaii (33%)
○ McKinley County, New Mexico (32%)
○ Adair County, Oklahoma (32%)
○ Glacier County, Montana (31%)
• The median age of other Christian adults is 47, the same as the median age of 47 for all Americans, but younger than the median age of 53 for all white Christians.
• 37% of other Christians live in urban areas, 43% live in suburban areas, and 20% live in rural areas.
• Other Christians are primarily independents: 27% identify as Republican, 27% identify as Democrat, and 39% identify as independent.

THE 2020 CENSUS OF AMERICAN RELIGION 41
Source: PRRI 2020 Census of American Religion.
0% 50%
FIGURE 18. Other Christian Identity, by CountyOther Christian includes those who identify as multiracial Christian, AAPI Christian, Native American Christian, Black Catholic, Latter-day Saint, Christian who did not provide a race or ethnicity, Jehovah’s Witness, and Orthodox Christian.

42 THE 2020 CENSUS OF AMERICAN RELIGION
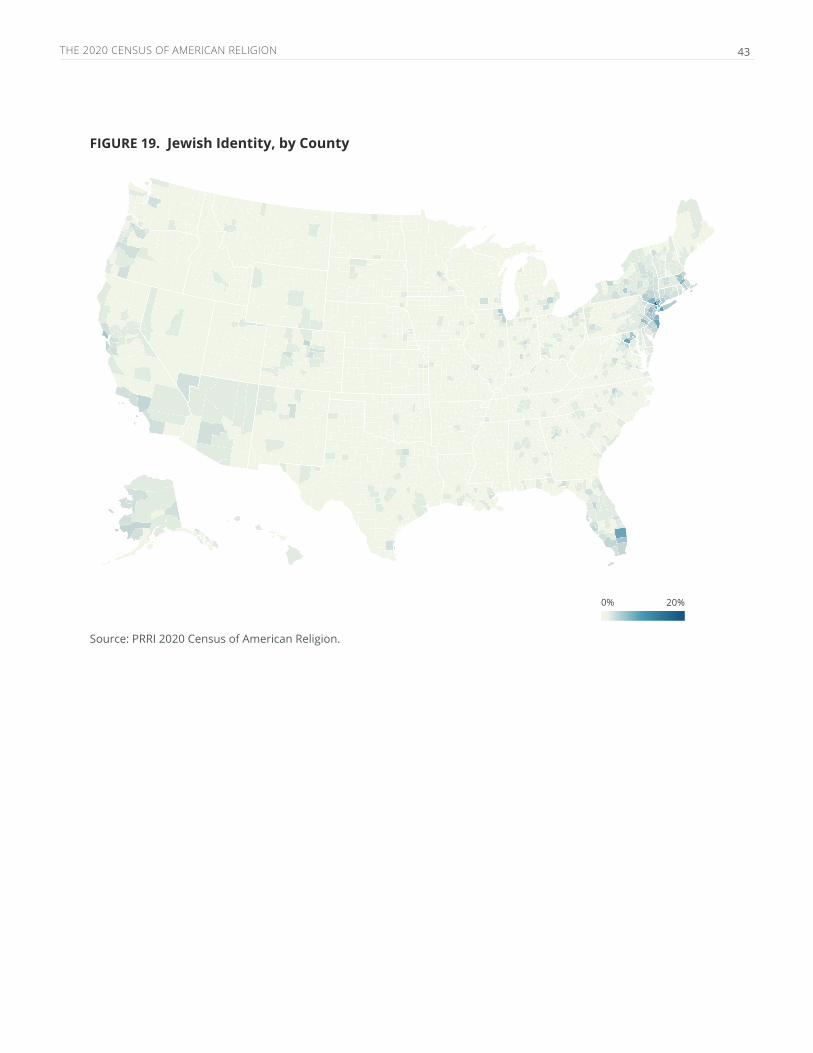
Jewish• Jewish Americans make up 1% of the U.S. population as of 2020.
• Jewish Americans are primarily concentrated in the Northeast and areas around New York City. The 10 highest concentrations of Jewish Americans in counties with more than 10,000 residents are:
○ Rockland County, New York (18%)
○ Kings County, New York (12%)
○ Nassau County, New York (10%)
○ Montgomery County, Maryland (9%)
○ New York County, New York (9%)
○ Palm Beach County, Florida (9%)
○ Ocean County, New Jersey (9%)
○ Bergen County, New Jersey (8%)
○ Westchester County, New York (7%)
○ Orange County, New York (7%)
• The median age of Jewish American adults is 48, slightly higher than the median for all Americans (47). Jewish Americans are younger than most Christian groups, but older than other non-Christian groups.
• A majority (51%) of Jewish Americans live in suburban areas, while four in ten (40%) live in urban areas, and only 8% live in rural areas.
• About one in five (22%) Jewish Americans identify as Republican, 44% identify as Democrat, and about three in ten (31%) identify as independent.
THE 2020 CENSUS OF AMERICAN RELIGION 43
Source: PRRI 2020 Census of American Religion.
0% 20%
FIGURE 19. Jewish Identity, by County

44 THE 2020 CENSUS OF AMERICAN RELIGION
Muslim• Muslim Americans make up 1% of the U.S. population as of 2020.
• Muslim Americans are primarily concentrated in major metropolitan areas, particularly in the New York City area. The 10 highest concentrations of Muslim Americans in counties with more than 10,000 residents are:
○ Queens County, New York (5%)
○ Kings County, New York (4%)
○ Alexandria City, Virginia (4%)
○ Essex County, New Jersey (4%)
○ Philadelphia County, Pennsylvania (4%)
○ Hudson County, New Jersey (4%)
○ Bronx County, New York (4%)
○ Wayne County, Michigan (4%)
○ Montgomery County, Maryland (3%)
○ New York County, New York (3%)
• The median age of Muslim American adults is 33, significantly lower than the median for all Americans (47), and among the youngest of all religious groups.
• Nearly half of Muslim Americans live in urban (46%) and suburban areas (46%), and only 9% live in rural areas.
• Muslim Americans are predominantly independent or Democrat: 11% of Muslim Americans identify as Republican, 46% identify as Democrat, and 36% identify as independent.

THE 2020 CENSUS OF AMERICAN RELIGION 45
Source: PRRI 2020 Census of American Religion.
0% 5%
FIGURE 20. Muslim Identity, by County

46 THE 2020 CENSUS OF AMERICAN RELIGION
Buddhist • Buddhist Americans make up 1% of the U.S. population as of 2020.
• Buddhist Americans are primarily concentrated in Hawaii and the West Coast, particularly in the San Francisco Bay Area. The 10 highest concentrations of Buddhist Americans in counties with more than 10,000 residents are:
○ Hawaii County, Hawaii (5%)
○ Maui County, Hawaii (5%)
○ San Francisco County, California (4%)
○ Kauai County, Hawaii (4%)
○ Honolulu Country, Hawaii (4%)
○ Alameda County, California (3%)
○ San Mateo County, California (3%)
○ Santa Clara County, California (3%)
○ Queens County, New York (2%)
○ New York County, New York (2%)
• The median age of Buddhist American adults is 36, significantly lower than the median for all Americans (47) and among the youngest of all religious groups.
• More than four in ten Buddhist Americans (44%) live in suburban areas, about four in ten (41%) live in urban areas, and 14% live in rural areas.
• Buddhist Americans are primarily independents or Democrats: 18% of Buddhist Americans identify as Republican, 33% identify as Democrat, and 44% identify as independent.

THE 2020 CENSUS OF AMERICAN RELIGION 47
Source: PRRI 2020 Census of American Religion.
0% 5%
FIGURE 21. Buddhist Identity, By County
48 THE 2020 CENSUS OF AMERICAN RELIGION
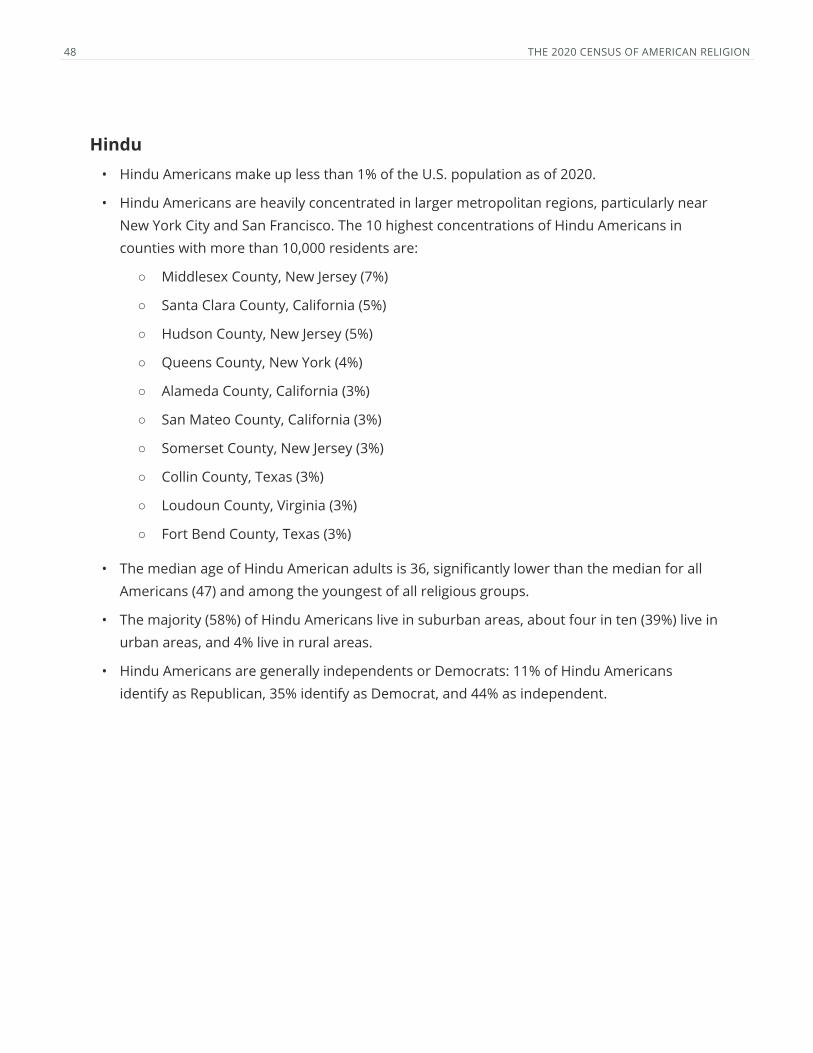
Hindu• Hindu Americans make up less than 1% of the U.S. population as of 2020.
• Hindu Americans are heavily concentrated in larger metropolitan regions, particularly near New York City and San Francisco. The 10 highest concentrations of Hindu Americans in counties with more than 10,000 residents are:
○ Middlesex County, New Jersey (7%)
○ Santa Clara County, California (5%)
○ Hudson County, New Jersey (5%)
○ Queens County, New York (4%)
○ Alameda County, California (3%)
○ San Mateo County, California (3%)
○ Somerset County, New Jersey (3%)
○ Collin County, Texas (3%)
○ Loudoun County, Virginia (3%)
○ Fort Bend County, Texas (3%)
• The median age of Hindu American adults is 36, significantly lower than the median for all Americans (47) and among the youngest of all religious groups.
• The majority (58%) of Hindu Americans live in suburban areas, about four in ten (39%) live in urban areas, and 4% live in rural areas.
• Hindu Americans are generally independents or Democrats: 11% of Hindu Americans identify as Republican, 35% identify as Democrat, and 44% as independent.

THE 2020 CENSUS OF AMERICAN RELIGION 49
Source: PRRI 2020 Census of American Religion.
0% 7%
FIGURE 22. Hindu Identity, by County
50 THE 2020 CENSUS OF AMERICAN RELIGION
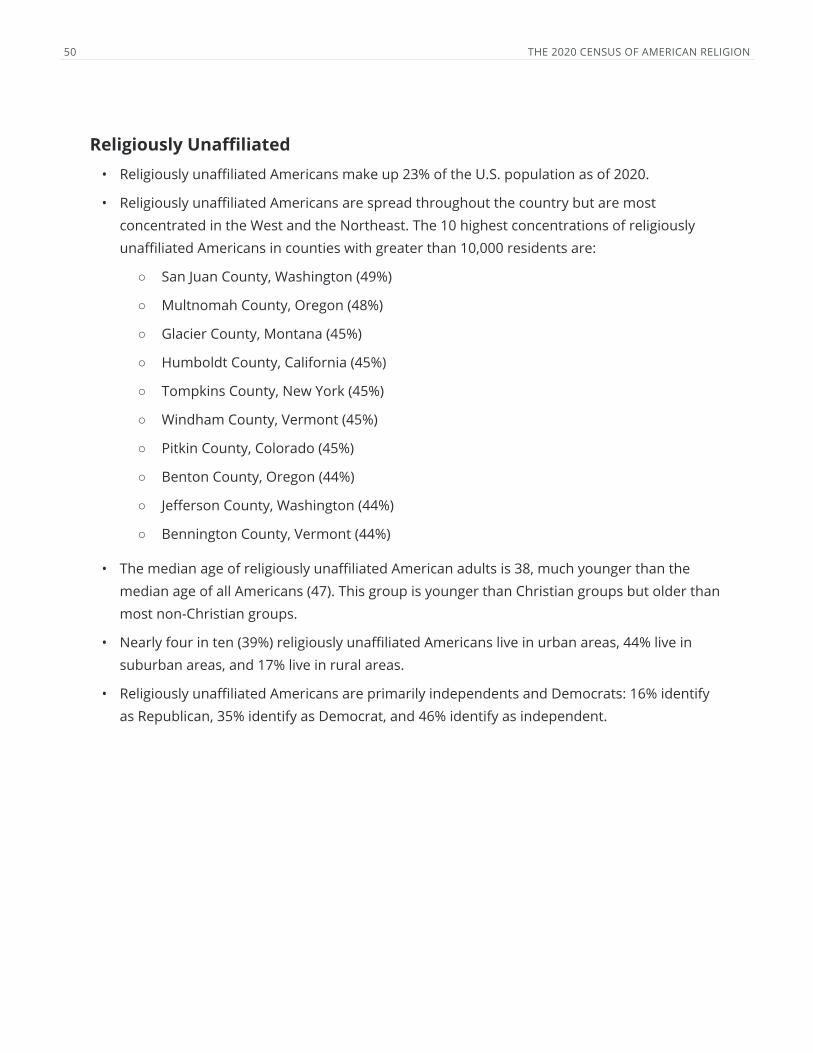
Religiously Unaffiliated• Religiously unaffiliated Americans make up 23% of the U.S. population as of 2020.
• Religiously unaffiliated Americans are spread throughout the country but are most concentrated in the West and the Northeast. The 10 highest concentrations of religiously unaffiliated Americans in counties with greater than 10,000 residents are:
○ San Juan County, Washington (49%)
○ Multnomah County, Oregon (48%)
○ Glacier County, Montana (45%)
○ Humboldt County, California (45%)
○ Tompkins County, New York (45%)
○ Windham County, Vermont (45%)
○ Pitkin County, Colorado (45%)
○ Benton County, Oregon (44%)
○ Jefferson County, Washington (44%)
○ Bennington County, Vermont (44%)
• The median age of religiously unaffiliated American adults is 38, much younger than the median age of all Americans (47). This group is younger than Christian groups but older than most non-Christian groups.
• Nearly four in ten (39%) religiously unaffiliated Americans live in urban areas, 44% live in suburban areas, and 17% live in rural areas.
• Religiously unaffiliated Americans are primarily independents and Democrats: 16% identify as Republican, 35% identify as Democrat, and 46% identify as independent.

THE 2020 CENSUS OF AMERICAN RELIGION 51
Source: PRRI 2020 Census of American Religion.
0% 50%
FIGURE 23. Religiously Unaffiliated, by County
52 THE 2020 CENSUS OF AMERICAN RELIGION
Appendix 1: Survey MethodologyAmerican Values Atlas 2020The 2020 American Values Atlas (AVA) is a project of PRRI. Results for all demographic, religious affiliation, and political affiliation questions were based on 50,334 bilingual telephone interviews (including 35,212 cell phone interviews) conducted between January 7, 2020 and December 20, 2020 by professional interviewers under the direction of SSRS. National results for questions on specific issues are based on a subset of 10,052 telephone interviews (including 6,981 cell phone interviews) conducted in 10 weeks spread across the year. State level results for questions on specific issues are based on the national subset plus an oversample of 10 key states in 30 additional weeks, resulting in 23,536 interviews across all 50 states plus the District of Columbia (including 16,848 cell phone interviews). Key states include Arizona, California, Florida, Georgia, Michigan, North Carolina, New Mexico, Ohio, Texas, and Utah. The survey was made possible by generous support from the Arcus Foundation, the Evelyn and Walter Haas, Jr. Fund, the Gill Foundation, and Unitarian Universalist Veatch Program at Shelter Rock.
Throughout 2020, at least 1,000 interviews were completed each week, with about 700 interviews conducted among respondents on their cell phones. Each week, interviewing occurred over a five- or six-day period, starting Tuesdays or Wednesdays and going through Sunday or Monday. The selection of respondents within households was accomplished by randomly requesting to speak with the youngest adult male or female currently living in the household.
Data collection was based on stratified, single-stage, random-digit-dialing (RDD) of landline telephone households and randomly generated cell phone numbers. The sample was designed to represent the total U.S. adult population from all 50 states, including Hawaii and Alaska, and the District of Columbia. The landline and cell phone samples were provided by Marketing Systems Group.
The weighting was accomplished in two separate stages. The first stage of weighting corrects for different probabilities of selection associated with the number of adults in each household and each respondent’s telephone usage patterns. In the second stage, sample demographics were balanced to match target population parameters for gender, age, education, race and Hispanic ethnicity, region (U.S. Census definitions), population density, and telephone usage. The population density parameter was derived from 2010 Census data. The telephone usage parameter came from an analysis of the January-June 2018 National Health Interview Survey. All other weighting parameters were derived from an analysis of the U.S. Census Bureau’s March 2018 Current Population Survey.

THE 2020 CENSUS OF AMERICAN RELIGION 53
The sample weighting was accomplished using iterative proportional fitting (IFP), a process that simultaneously balances the distributions of all variables. Weights are trimmed so that they do not exceed 4.0 or fall below 0.25 to prevent individual interviews from having too much influence on the final results. The use of these weights in statistical analysis ensures that the demographic characteristics of the sample closely approximate the demographic characteristics of the target populations.
The table below shows the sample sizes for all 50 states for both sample and issue subsample. The margin of error for the total sample is +/- 0.5 percentage points at the 95% level of confidence. The margin of error for the national issue subsample is +/- 1.1 percentage points at the 95% level of confidence. The design effect of 1.3 is included in the margins of error. In addition to sampling error, surveys may also be subject to error or bias due to question wording, context, and order effects.
TABLE A1. State Sample Sizes
State Total Sample Issue Subsample
United States 50,334 10,052
United States plus 10 state oversamples 50,334 23,536
Alabama 753 152
Alaska 186 29
Arizona 1,126 888
Arkansas 439 85
California 5,415 4,474
Colorado 991 192
Connecticut 521 115
Delaware 192 61
District of Columbia 226 74
Florida 3,613 2,918
Georgia 1,770 1,495
Hawaii 176 59
Idaho 349 63
Illinois 1,577 295
Indiana 1,083 217
Iowa 528 108
Kansas 425 82
Kentucky 711 147
Louisiana 549 114
Maine 214 46

54 THE 2020 CENSUS OF AMERICAN RELIGION
State Total Sample Issue Subsample
United States 50,334 10,052
United States plus 10 state oversamples 50,334 23,536
Maryland 1,037 195
Massachusetts 1,017 195
Michigan 1,670 1,357
Minnesota 886 164
Mississippi 286 58
Missouri 816 144
Montana 254 29
Nebraska 348 68
Nevada 492 109
New Hampshire 238 62
New Jersey 1,344 288
New Mexico 397 316
New York 3,079 586
North Carolina 1,730 1,421
North Dakota 151 46
Ohio 1,894 1,549
Oklahoma 529 112
Oregon 839 176
Pennsylvania 2,053 399
Rhode Island 139 40
South Carolina 944 183
South Dakota 144 53
Tennessee 1,005 209
Texas 3,440 2,808
Utah 554 448
Vermont 115 39
Virginia 1,555 299
Washington 1,310 309
West Virginia 296 51
Wisconsin 823 168
Wyoming 105 41

THE 2020 CENSUS OF AMERICAN RELIGION 55
PRRI Census of American Religion MethodologyThe 2013-2019 American Values Atlas (AVA) is a project of PRRI. Results for all demographic, religious affiliation, and political affiliation questions were based on 53,474 bilingual telephone interviews (including 33,708 cell phone interviews) conducted between January 2, 2019 and December 30, 2019 by professional interviewers under the direction of SSRS. The complete 2013-2019 dataset contains 453,822 interviews. The survey was made possible by generous support from the Arcus Foundation, the E. Rhodes & Leona B. Carpenter Foundation, the Evelyn and Walter Haas, Jr. Fund, the Gill Foundation, and Unitarian Universalist Veatch Program at Shelter Rock.
Each year, at least 1,000 interviews were completed each week, with percentages of cell phone interviews increasing over the years to 70% in 2019. Each week, interviewing occurred over a five- or six-day period, starting Tuesdays or Wednesdays and going through Sunday or Monday. The selection of respondents within households was accomplished by randomly requesting to speak with the youngest adult male or female currently living in the household.
Data collection was based on stratified, single-stage, random-digit-dialing (RDD) of landline telephone households and randomly generated cell phone numbers. The sample was designed to represent the total U.S. adult population from all 50 states, including Hawaii and Alaska, and the District of Columbia. The landline and cell phone samples were provided by Marketing Systems Group.
The weighting was accomplished in two separate stages. The first stage of weighting corrects for different probabilities of selection associated with the number of adults in each household and each respondent’s telephone usage patterns. In the second stage, sample demographics were balanced to match target population parameters for gender, age, education, race and Hispanic ethnicity, region (U.S. Census definitions), population density, and telephone usage. The population density parameter was derived from 2010 Census data. The telephone usage parameter came from an analysis of the National Health Interview Survey. All other weighting parameters were derived from an analysis of the U.S. Census Bureau’s Current Population Survey.
The sample weighting was accomplished using iterative proportional fitting (IFP), a process that simultaneously balances the distributions of all variables. Weights are trimmed so that they do not exceed 4.0 or fall below 0.25 to prevent individual interviews from having too much influence on the final results. The use of these weights in statistical analysis ensures that the demographic characteristics of the sample closely approximate the demographic characteristics of the target populations.
The table below shows the sample sizes for all 50 states for both the 2019 sample and overall 2013-2019 dataset. The margin of error for the total sample is +/- 0.4 percentage points at the

56 THE 2020 CENSUS OF AMERICAN RELIGION
95% level of confidence. The margin of error for issue subsample is +/- 0.6 percentage points at the 95% level of confidence. The design effect for the total sample and the issue subsample is 1.3. In addition to sampling error, surveys may also be subject to error or bias due to question wording, context, and order effects.
TABLE A2. State Sample Sizes (2013)
State 2013-2019 Total Sample
United States 459,822
Alabama 7,035
Alaska 2,467
Arizona 9,361
Arkansas 4,428
California 44,482
Colorado 7,891
Connecticut 4,806
Delaware 1,431
District of Columbia 1,420
Florida 28,498
Georgia 13,932
Hawaii 1,797
Idaho 2,829
Illinois 15,620
Indiana 10,506
Iowa 5,926
Kansas 4,715
Kentucky 6,887
Louisiana 6,361
Maine 2,580
Maryland 8,012
Massachusetts 8,640
Michigan 14,385
Minnesota 8,9947
Mississippi 3,955
Missouri 9,555
Montana 2,380
Nebraska 3,388
Nevada 4,278
New Hampshire 2,113

THE 2020 CENSUS OF AMERICAN RELIGION 57
State 2013-2019 Total Sample
United States 459,822
New Jersey 11,964
New Mexico 3,395
New York 30,288
North Carolina 15,937
North Dakota 1,548
Ohio 18,232
Oklahoma 5,527
Oregon 7,378
Pennsylvania 20,823
Rhode Island 1,543
South Carolina 7,322
South Dakota 1,561
Tennessee 10,069
Texas 31,107
Utah 4,891
Vermont 1,347
Virginia 12,946
Washington 10,761
West Virginia 3,489
Wisconsin 9,863
Wyoming 1,206
County-Level Model MethodologyPRRI worked with NORC to use the American Values Atlas survey data from 2013-2019, which includes interviews with random samples of 459,822 U.S. adults (ages 18 and over) to generate county-level estimates for each religious affiliation in 3,142 counties in all 50 states, plus the District of Columbia, using a technique called small area estimation modeling. NORC has developed and implemented small area estimation models on a number of key projects for government and social science surveys. The estimates have varying measurement error based on the size of the county and the number of surveys completed in each county. Smaller counties have larger measurement error.
The small area modeling approach for this project modeled weighted survey estimates of each religious affiliation by county and year. Since the distribution of religious denominations are correlated across time, the small area model captures county-level correlations across time

58 THE 2020 CENSUS OF AMERICAN RELIGION
via a time-series component to improve estimates for the most current year. Furthermore, the model incorporates external auxiliary data (that is predictive of the distribution of religious denominations) at the county-level from the 2014-2018 5-year American Community Survey. The best set of predictors for each religious denomination was selected using a variable selection approach known as LASSO. Model-based estimates for each religious denomination and county were generated using a standard small area estimation approach referred to as “Empirical Best Linear Unbiased Prediction”. Finally, model-based estimates for each religious denomination were generated for all counties in the U.S., not limited to counties with survey data.
THE 2020 CENSUS OF AMERICAN RELIGION 59
Appendix 2: About PRRI PRRI PRRI is a nonprofit, nonpartisan organization dedicated to research at the intersection of religion, values, and public life.
Our mission is to help journalists, opinion leaders, scholars, clergy, and the general public better understand debates on public policy issues and the role of religion and values in American public life by conducting high quality public opinion surveys and qualitative research.
PRRI is a member of the American Association for Public Opinion Research (AAPOR), the American Political Science Association (APSA), and the American Academy of Religion (AAR), and follows the highest research standards of independence and academic excellence.
We are also a member organization of the National Council on Public Polls, an association of polling organizations established in 1969, which sets the highest professional standards for public opinion researchers. PRRI is also a supporting organization of the Transparency Initiative at AAPOR, an initiative to place the value of openness at the center of the public opinion research profession.
As a nonpartisan, independent research organization, PRRI does not take positions on, nor do we advocate for, particular policies. Research supported by our funders reflects PRRI’s commitment to independent inquiry and academic rigor. Research findings and conclusions are never altered to accommodate other interests, including those of funders, other organizations, or government bodies and officials.
History
Since PRRI’s founding in 2009, our research has become a standard source of trusted in- formation among journalists, scholars, policy makers, clergy, and the general public. PRRI research has been cited in thousands of media stories and academic publications and plays a leading role in deepening public understanding of the changing religious landscape and its role in shaping American politics.
For a full list of recent projects, see our research page: http://www.prri.org/research/
PRRI also maintains a lively online presence on Facebook (http://www.facebook.com/prripoll) and Twitter (http://www.twitter.com/prripoll).

PRRI 1023 15th Street NW, 9th Floor Washington D.C. 20005 www.prri.org