Embed Size (px)
Citation preview
The 2017 global data management benchmark report
Report
Page II | The 2017 global data management benchmark report
Table of contents:
Methodology .......................................................................................................................................................................................III
Foreword ..............................................................................................................................................................................................1
Good data is good for business .....................................................................................................................................................2
Powering opportunities ..........................................................................................................................................................2
Leveraging customer data ....................................................................................................................................................3
Trusted data is essential .................................................................................................................................................................4
Challenges for accurate data ...............................................................................................................................................4
A look at modern data management ...........................................................................................................................................6
The current state of data management ............................................................................................................................6
Central control of data quality..............................................................................................................................................8
Department influence on data handling ...........................................................................................................................9
Department investment in data technology ................................................................................................................. 10
The benefits of data quality investments ................................................................................................................................ 11
The road to proactive data quality ............................................................................................................................................. 12
What data management projects do we expect in 2017? .................................................................................................. 13
Data cleansing ....................................................................................................................................................................... 13
Data integration ..................................................................................................................................................................... 13
Data migration ....................................................................................................................................................................... 14
Data preparation ................................................................................................................................................................... 14
Data enrichment.................................................................................................................................................................... 14
Data analytics......................................................................................................................................................................... 14
New roles for 2017 ......................................................................................................................................................................... 15
Conclusion ........................................................................................................................................................................................ 16
In Perspective: Mastering your 2017 data management priorities ................................................................................. 17
About Experian Data Quality ....................................................................................................................................................... 19
The 2017 global data management benchmark report | Page III
MethodologyExperian Data Quality has once again conducted a survey to look at global trends in data quality. This study looks at how data practitioners are leveraging and managing their data to generate actionable insight and how data management practices are changing over time.
Produced by Loudhouse for Experian Data Quality in November 2016, the study polled more than 1,400 people across eight countries around the globe. A variety of roles from all areas of the organization were surveyed, including information technology, data management, marketing, customer service, sales, operations, and more. Respondents were chosen based on their visibility into their organization’s customer or prospect data management practices. Organizations that were surveyed came from a variety of industries including IT, telecommunications, manufacturing, retail, business services, financial services, healthcare, public sector, education, utilities, and more.
Page 1 | The 2017 global data management benchmark report
ForewordBusinesses today talk a great deal about being data driven. But what does that mean? While there’s no doubt that organizations are collecting and generating more information than ever before, simply having a lot of data does not make a business data driven.
Organizations need to be able to effectively leverage their information to make decisions and drive new initiatives. Data sources exist in silos, however, which often makes it difficult to get a complete picture of an organization’s data assets, and a lack of governance means data must be cleansed and standardized before it can used. For these reasons, among others, business leaders today find it hard to trust their organizations’ data assets.
Without a foundational level of confidence in their data, organizations adopt manual processes and workarounds to augment their information—and this introduces room for error. We found that more than half of organizations globally say that a lack of trust in their data contributes to increased risk of non-compliance and regulatory penalties, as well as a downturn in customer loyalty. To become truly data-driven, organizations need information they can trust.
Generating trusted information isn’t always easy, though. On average, organizations around the globe believe that 27 percent of their current customer and prospect data is inaccurate. While businesses want to take control of their data
assets and leverage information for specific departmental purposes like segmentation or reducing risk, they are doing so with legacy data management practices that do not govern and control distributed data.
Further, the IT department is often the gatekeeper, pulling or querying data at the request of business users when they may not always know the context under which certain data was created, nor do they know the intended uses for the data down the road.
Good data is good for business. We find that when organizations make improvements to their data, they see positive results. However, organizations need to speak a common language around data and prove its value so that investments can be made in data management practices.
This year, our annual global data management benchmark report is focused on how data is being used within organizations and how the quality of that data impacts business priorities. By exploring some of the trends in data management, as well as some of the opportunities, we hope to provide clarity for those embarking on data management programs, and offer tips for improving programs that are already in place—enabling you to tackle your major priorities in the upcoming year.
Thomas Schutz, SVP and General Manager of Experian Data Quality
The 2017 global data management benchmark report | Page 2
Good data is good for businessData is fundamental to your organization, and the quality of that data is critical to your success. So it should come as no surprise that an overwhelming majority (more than 95%) of U.S. organizations say that they use data to power business opportunities. And if that’s not enough, another 84 percent of U.S. organizations say that they believe data is an integral part of forming a business strategy. Clearly, data has the potential to shape your organization. But, only good data can shape it for the better.
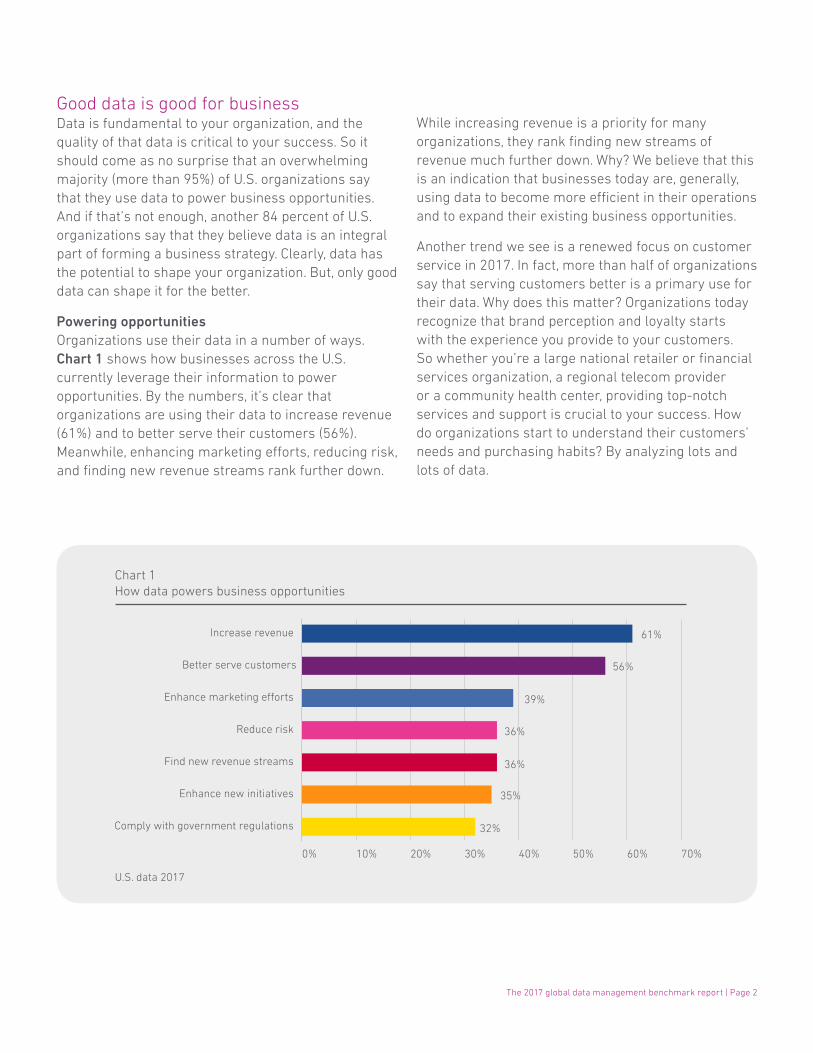
Powering opportunitiesOrganizations use their data in a number of ways. Chart 1 shows how businesses across the U.S. currently leverage their information to power opportunities. By the numbers, it’s clear that organizations are using their data to increase revenue (61%) and to better serve their customers (56%). Meanwhile, enhancing marketing efforts, reducing risk, and finding new revenue streams rank further down.
While increasing revenue is a priority for many organizations, they rank finding new streams of revenue much further down. Why? We believe that this is an indication that businesses today are, generally, using data to become more efficient in their operations and to expand their existing business opportunities.
Another trend we see is a renewed focus on customer service in 2017. In fact, more than half of organizations say that serving customers better is a primary use for their data. Why does this matter? Organizations today recognize that brand perception and loyalty starts with the experience you provide to your customers. So whether you’re a large national retailer or financial services organization, a regional telecom provider or a community health center, providing top-notch services and support is crucial to your success. How do organizations start to understand their customers’ needs and purchasing habits? By analyzing lots and lots of data.
61%
56%
39%
36%
36%
35%
32%
U.S. data 2017
Chart 1How data powers business opportunities
0% 10% 20% 30% 40% 50% 60% 70%
Comply with government regulations
Enhance new initiatives
Find new revenue streams
Reduce risk
Enhance marketing e�orts
Better serve customers
Increase revenue
Page 3 | The 2017 global data management benchmark report
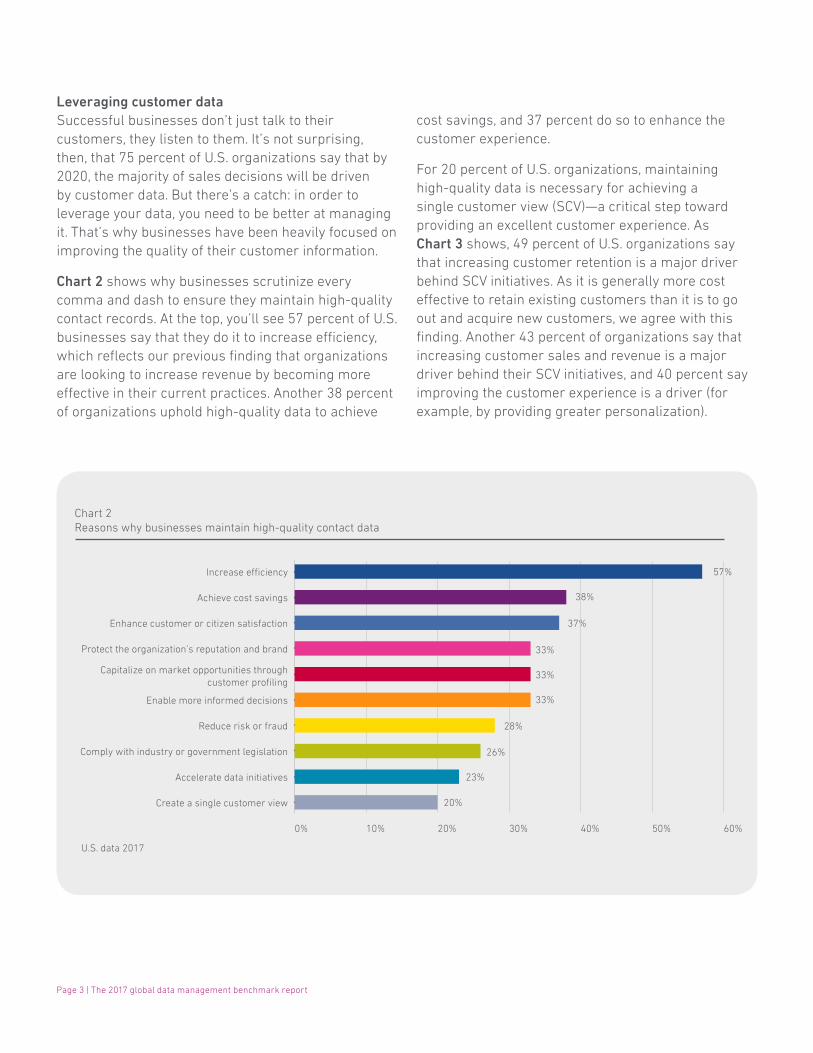
Leveraging customer dataSuccessful businesses don’t just talk to their customers, they listen to them. It’s not surprising, then, that 75 percent of U.S. organizations say that by 2020, the majority of sales decisions will be driven by customer data. But there’s a catch: in order to leverage your data, you need to be better at managing it. That’s why businesses have been heavily focused on improving the quality of their customer information.
Chart 2 shows why businesses scrutinize every comma and dash to ensure they maintain high-quality contact records. At the top, you’ll see 57 percent of U.S. businesses say that they do it to increase efficiency, which reflects our previous finding that organizations are looking to increase revenue by becoming more effective in their current practices. Another 38 percent of organizations uphold high-quality data to achieve
cost savings, and 37 percent do so to enhance the customer experience.
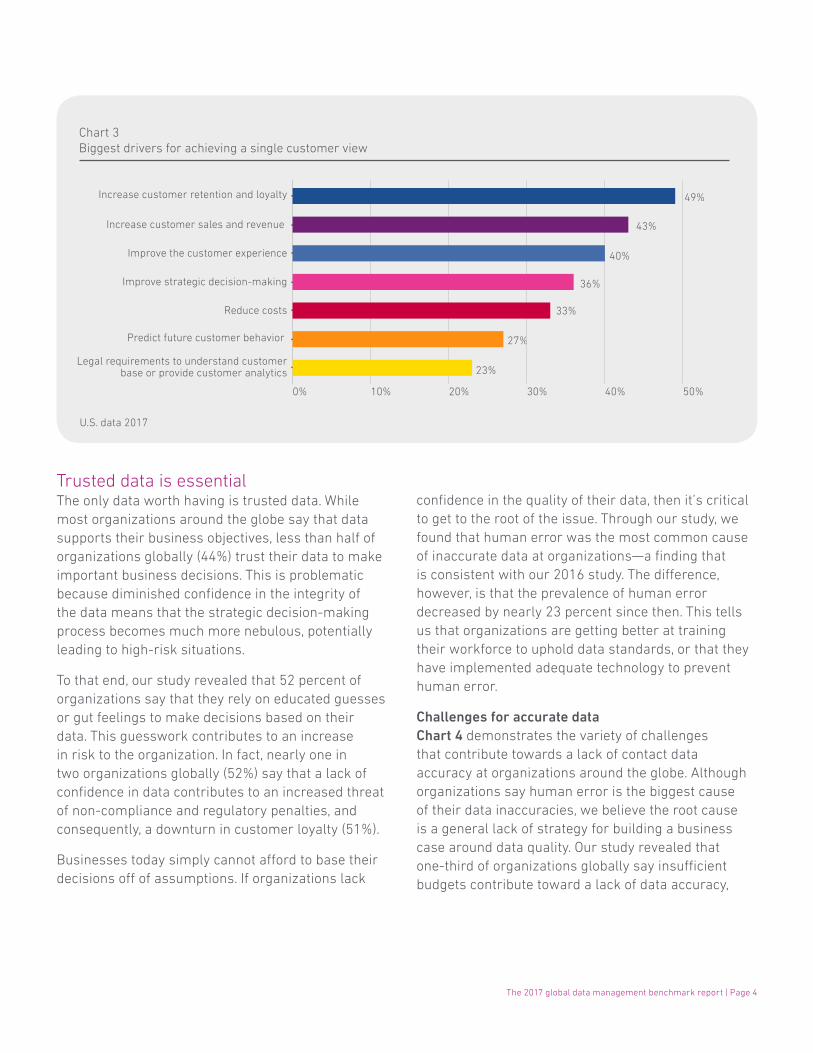
For 20 percent of U.S. organizations, maintaining high-quality data is necessary for achieving a single customer view (SCV)—a critical step toward providing an excellent customer experience. As Chart 3 shows, 49 percent of U.S. organizations say that increasing customer retention is a major driver behind SCV initiatives. As it is generally more cost effective to retain existing customers than it is to go out and acquire new customers, we agree with this finding. Another 43 percent of organizations say that increasing customer sales and revenue is a major driver behind their SCV initiatives, and 40 percent say improving the customer experience is a driver (for example, by providing greater personalization).
57%
38%
37%
33%
33%
33%
28%
26%
23%
20%9%
Chart 2Reasons why businesses maintain high-quality contact data
U.S. data 2017
0% 10% 20% 30% 40% 50% 60%
Create a single customer view
Accelerate data initiatives
Comply with industry or government legislation
Reduce risk or fraud
Enable more informed decisions
Capitalize on market opportunities throughcustomer profiling
Protect the organization’s reputation and brand
Enhance customer or citizen satisfaction
Achieve cost savings
Increase e�ciency
The 2017 global data management benchmark report | Page 4
Trusted data is essentialThe only data worth having is trusted data. While most organizations around the globe say that data supports their business objectives, less than half of organizations globally (44%) trust their data to make important business decisions. This is problematic because diminished confidence in the integrity of the data means that the strategic decision-making process becomes much more nebulous, potentially leading to high-risk situations.
To that end, our study revealed that 52 percent of organizations say that they rely on educated guesses or gut feelings to make decisions based on their data. This guesswork contributes to an increase in risk to the organization. In fact, nearly one in two organizations globally (52%) say that a lack of confidence in data contributes to an increased threat of non-compliance and regulatory penalties, and consequently, a downturn in customer loyalty (51%).
Businesses today simply cannot afford to base their decisions off of assumptions. If organizations lack
23%
27%
33%
36%
40%
43%
49%
Chart 3Biggest drivers for achieving a single customer view
U.S. data 2017
0% 10% 20% 30% 40% 50%
Legal requirements to understand customerbase or provide customer analytics
Predict future customer behavior
Reduce costs
Improve strategic decision-making
Improve the customer experience
Increase customer sales and revenue
Increase customer retention and loyalty
confidence in the quality of their data, then it’s critical to get to the root of the issue. Through our study, we found that human error was the most common cause of inaccurate data at organizations—a finding that is consistent with our 2016 study. The difference, however, is that the prevalence of human error decreased by nearly 23 percent since then. This tells us that organizations are getting better at training their workforce to uphold data standards, or that they have implemented adequate technology to prevent human error.
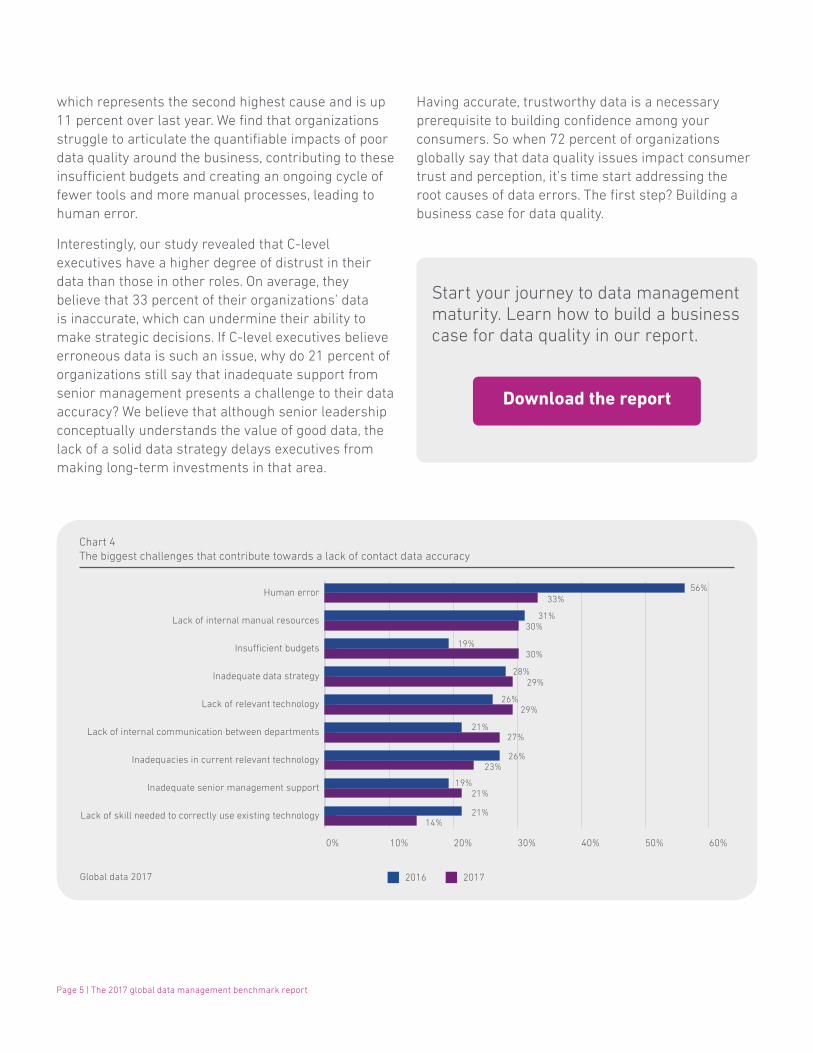
Challenges for accurate dataChart 4 demonstrates the variety of challenges that contribute towards a lack of contact data accuracy at organizations around the globe. Although organizations say human error is the biggest cause of their data inaccuracies, we believe the root cause is a general lack of strategy for building a business case around data quality. Our study revealed that one-third of organizations globally say insufficient budgets contribute toward a lack of data accuracy,
Page 5 | The 2017 global data management benchmark report
which represents the second highest cause and is up 11 percent over last year. We find that organizations struggle to articulate the quantifiable impacts of poor data quality around the business, contributing to these insufficient budgets and creating an ongoing cycle of fewer tools and more manual processes, leading to human error.
Interestingly, our study revealed that C-level executives have a higher degree of distrust in their data than those in other roles. On average, they believe that 33 percent of their organizations’ data is inaccurate, which can undermine their ability to make strategic decisions. If C-level executives believe erroneous data is such an issue, why do 21 percent of organizations still say that inadequate support from senior management presents a challenge to their data accuracy? We believe that although senior leadership conceptually understands the value of good data, the lack of a solid data strategy delays executives from making long-term investments in that area.
Having accurate, trustworthy data is a necessary prerequisite to building confidence among your consumers. So when 72 percent of organizations globally say that data quality issues impact consumer trust and perception, it’s time start addressing the root causes of data errors. The first step? Building a business case for data quality.
14%
21%
23%
27%
29%
29%
30%
30%
33%
Chart 4The biggest challenges that contribute towards a lack of contact data accuracy
Global data 2017
0% 10% 20% 30% 40% 50% 60%
Lack of skill needed to correctly use existing technology
Inadequate senior management support
Inadequacies in current relevant technology
Lack of internal communication between departments
Lack of relevant technology
Inadequate data strategy
Insu�cient budgets
Lack of internal manual resources
Human error 56%
31%
19%
28%
26%
21%
26%
19%
21%
20172016
Start your journey to data management maturity. Learn how to build a business case for data quality in our report.
Download the report
The 2017 global data management benchmark report | Page 6
A look at modern data managementThe data management space is constantly evolving to cope with the overwhelming volume and breadth of data that is being created. Organizations today hope to use their data to increase revenue and better serve their customers—but that requires good governance. To that end, our study reveals that more than half (51%) of organizations globally believe that their current data governance programs are ineffective. In order to use their data successfully, organizations will need to get a lot better at governing—and managing—their data.
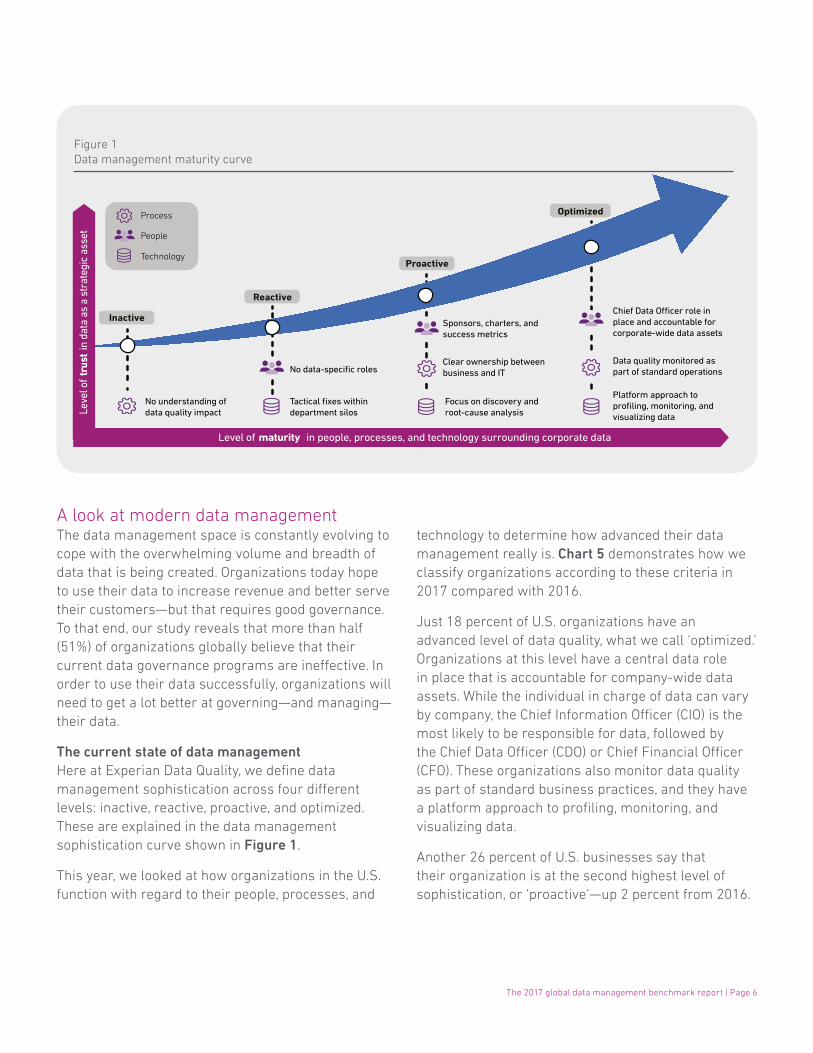
The current state of data managementHere at Experian Data Quality, we define data management sophistication across four different levels: inactive, reactive, proactive, and optimized. These are explained in the data management sophistication curve shown in Figure 1.
This year, we looked at how organizations in the U.S. function with regard to their people, processes, and
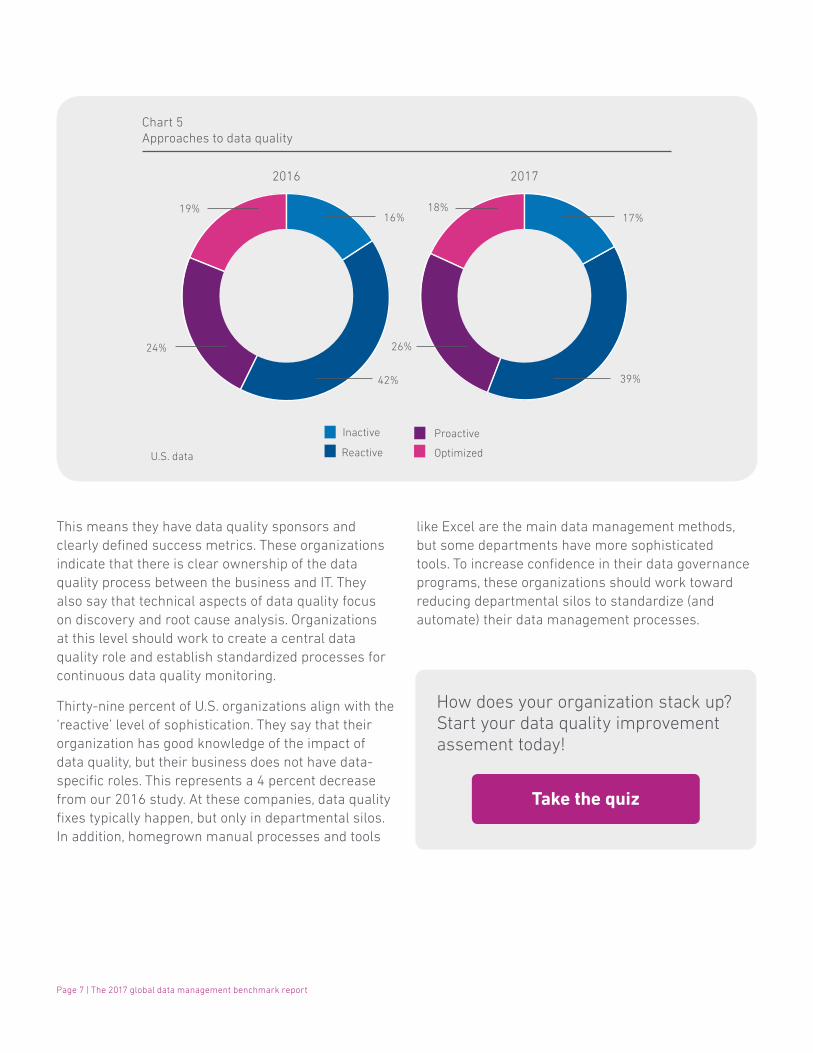
technology to determine how advanced their data management really is. Chart 5 demonstrates how we classify organizations according to these criteria in 2017 compared with 2016.
Just 18 percent of U.S. organizations have an advanced level of data quality, what we call ‘optimized.’ Organizations at this level have a central data role in place that is accountable for company-wide data assets. While the individual in charge of data can vary by company, the Chief Information Officer (CIO) is the most likely to be responsible for data, followed by the Chief Data Officer (CDO) or Chief Financial Officer (CFO). These organizations also monitor data quality as part of standard business practices, and they have a platform approach to profiling, monitoring, and visualizing data.
Another 26 percent of U.S. businesses say that their organization is at the second highest level of sophistication, or ‘proactive’—up 2 percent from 2016.
Chief Data O�cer role in place and accountable for corporate-wide data assets
Data quality monitored aspart of standard operations
Platform approach to profiling, monitoring, and visualizing data
Sponsors, charters, and success metrics
Clear ownership between business and IT
Focus on discovery and root-cause analysis
No data-specific roles
Tactical fixes within department silos
No understanding of data quality impact
Process
People
Technology
Inactive
Reactive
Proactive
Optimized
Leve
l of
trus
t in
dat
a as
a s
trat
egic
ass
et
Level of maturity in people, processes, and technology surrounding corporate data
Figure 1Data management maturity curve
Page 7 | The 2017 global data management benchmark report
This means they have data quality sponsors and clearly defined success metrics. These organizations indicate that there is clear ownership of the data quality process between the business and IT. They also say that technical aspects of data quality focus on discovery and root cause analysis. Organizations at this level should work to create a central data quality role and establish standardized processes for continuous data quality monitoring.
Thirty-nine percent of U.S. organizations align with the ‘reactive’ level of sophistication. They say that their organization has good knowledge of the impact of data quality, but their business does not have data-specific roles. This represents a 4 percent decrease from our 2016 study. At these companies, data quality fixes typically happen, but only in departmental silos. In addition, homegrown manual processes and tools
Optimized
Proactive
Reactive
Inactive
Chart 5Approaches to data quality
18%19%
26%24%
17%16%
39%42%
20172016
U.S. data
like Excel are the main data management methods, but some departments have more sophisticated tools. To increase confidence in their data governance programs, these organizations should work toward reducing departmental silos to standardize (and automate) their data management processes.
How does your organization stack up? Start your data quality improvement assement today!
Take the quiz
The 2017 global data management benchmark report | Page 8
Lastly, 17 percent of U.S. organizations are at the ‘inactive’ level, where an understanding of data quality impacts is patchy around the business, data quality fixes sometimes happen, and Excel or manual processes are the primary data management methods used by the organization. This represents a 1 percent increase from our 2016 study. Organizations at this level should work to evangelize the importance of data quality within their business and develop standardized processes for fixing and monitoring data quality issues moving forward.
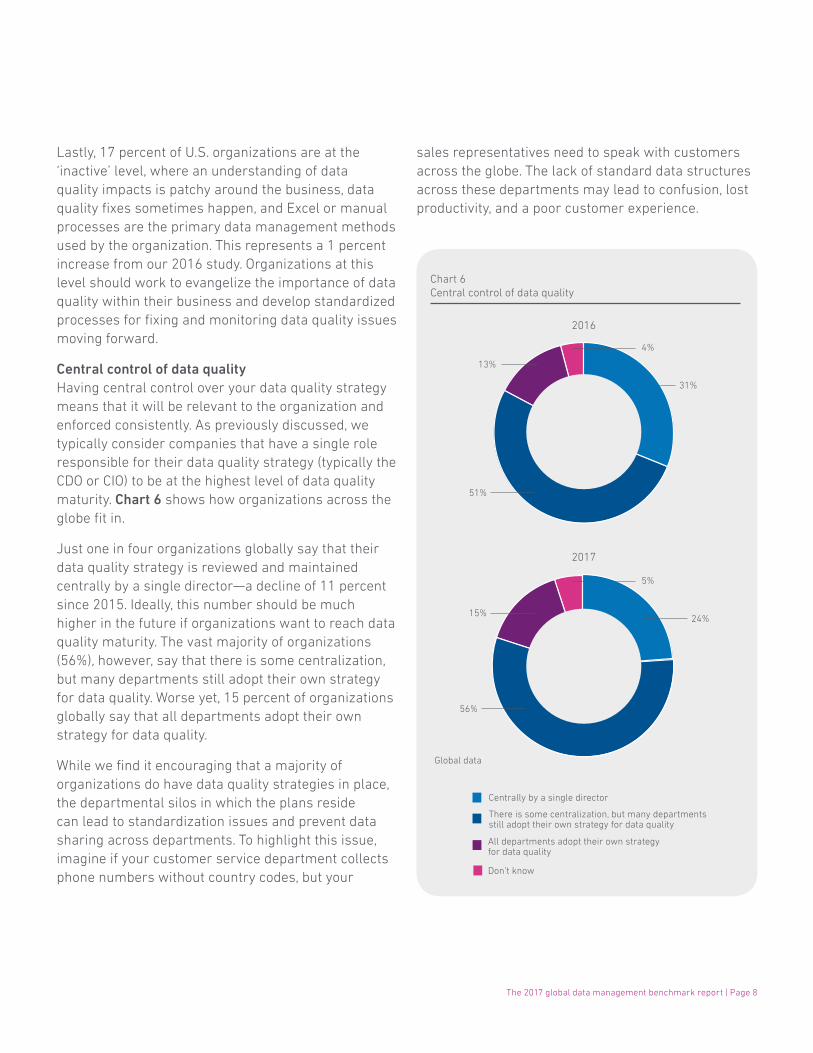
Central control of data qualityHaving central control over your data quality strategy means that it will be relevant to the organization and enforced consistently. As previously discussed, we typically consider companies that have a single role responsible for their data quality strategy (typically the CDO or CIO) to be at the highest level of data quality maturity. Chart 6 shows how organizations across the globe fit in.
Just one in four organizations globally say that their data quality strategy is reviewed and maintained centrally by a single director—a decline of 11 percent since 2015. Ideally, this number should be much higher in the future if organizations want to reach data quality maturity. The vast majority of organizations (56%), however, say that there is some centralization, but many departments still adopt their own strategy for data quality. Worse yet, 15 percent of organizations globally say that all departments adopt their own strategy for data quality.
While we find it encouraging that a majority of organizations do have data quality strategies in place, the departmental silos in which the plans reside can lead to standardization issues and prevent data sharing across departments. To highlight this issue, imagine if your customer service department collects phone numbers without country codes, but your Don’t know
All departments adopt their own strategyfor data quality
There is some centralization, but many departmentsstill adopt their own strategy for data quality
Centrally by a single director
Chart 6Central control of data quality
15%
13%
56%
51%
24%
31%
5%
4%
2017
2016
Global data
sales representatives need to speak with customers across the globe. The lack of standard data structures across these departments may lead to confusion, lost productivity, and a poor customer experience.
Page 9 | The 2017 global data management benchmark report
Department influence on data handlingThe importance of information technology (IT) departments in the creation of robust data management programs cannot be understated. Our study revealed, however, that 70 percent of organizations globally believe that the responsibility for ongoing data quality should ultimately lie with the business, with occasional help from IT. This belief reflects the sentiment that data needs to be fit for purpose. Because the IT department may not always know the context under which certain data was created, nor do they know the intended uses for the data down the road, the business users are really the ones who can determine whether a dataset is good or not.
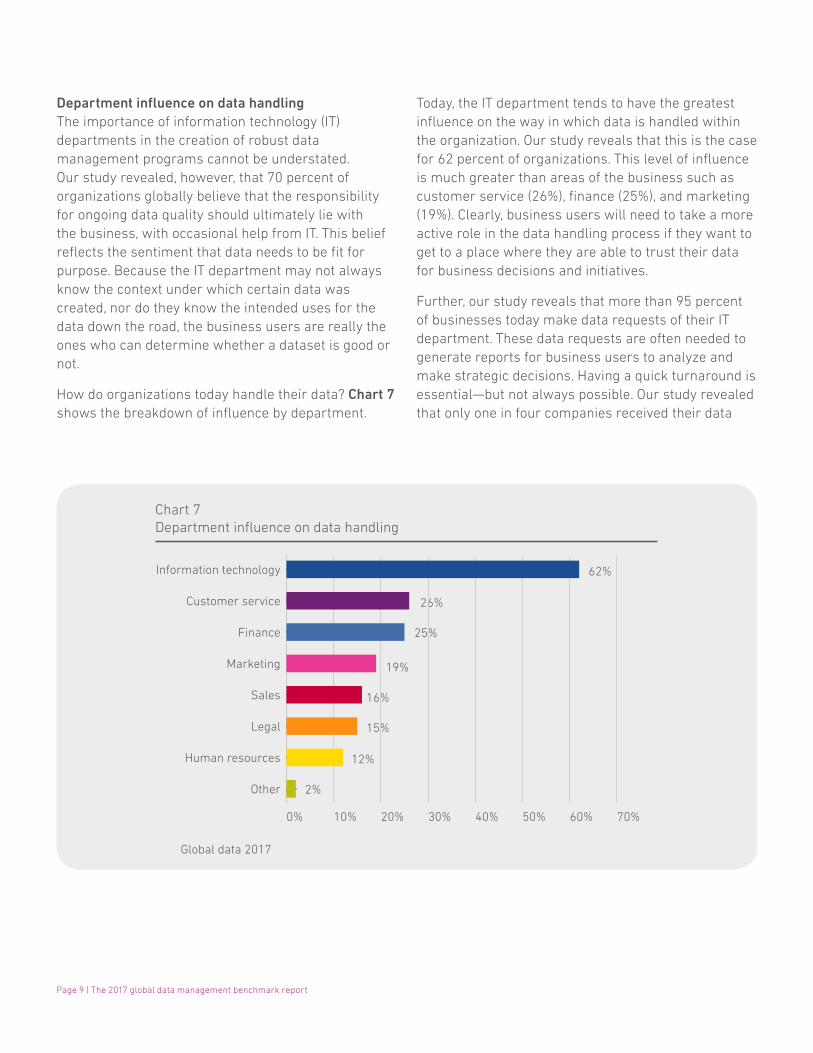
How do organizations today handle their data? Chart 7 shows the breakdown of influence by department.
Today, the IT department tends to have the greatest influence on the way in which data is handled within the organization. Our study reveals that this is the case for 62 percent of organizations. This level of influence is much greater than areas of the business such as customer service (26%), finance (25%), and marketing (19%). Clearly, business users will need to take a more active role in the data handling process if they want to get to a place where they are able to trust their data for business decisions and initiatives.
Further, our study reveals that more than 95 percent of businesses today make data requests of their IT department. These data requests are often needed to generate reports for business users to analyze and make strategic decisions. Having a quick turnaround is essential—but not always possible. Our study revealed that only one in four companies received their data
62%
26%
25%
19%
16%
12%
15%
2%
Chart 7Department influence on data handling
Global data 2017
0% 10% 20% 30% 40% 50% 60% 70%
Other
Human resources
Legal
Sales
Marketing
Finance
Customer service
Information technology

The 2017 global data management benchmark report | Page 10
in just a few hours, and more than 70 percent of businesses have to wait a day or longer to receive their requested data from their IT department. In today’s fast-paced environment, can you afford to wait around?
Department investment in data technologyBecause the IT department typically plays such a large role in the handling of data, it comes as no surprise that the IT department tends to spend the most money on data technology and data management platforms. According to our study, 53 percent of organizations say their IT department makes the primary investment in these technologies. Chart 8 shows where other departments fit in when it comes to spending on data technology. Specific lines of the business, such as finance, data and insight, marketing, and sales invest in data technology at a much lower rate.
This is where a central role like a CIO or CDO is needed to help bridge the gap between IT and the
lines of business to ensure all needs are being met. This centralized role can lead the investment in data management technology that enables business users to access the data with minimal IT involvement while ensuring governance policies are upheld. According to our study, 37 percent of organizations globally spend a majority of their time just preparing data for analysis. This represents a significant loss in productivity, as expensive resources are spending most of their time cleansing data rather than analyzing it. Our study shows that with the right data management solution in place, 83 percent of organizations have seen some improvement in employee efficiency.
Investing in the right tools means you can empower business users to make data-driven decisions while also freeing up IT resources to focus their time on additional revenue-generating or strategic projects for the business. It’s a winning proposition.
2%
3%
5%
5%
5%
5%
8%
9%
53%
Chart 8Department investment in data technology
Global data 2017
0% 10% 20% 30% 40% 50% 60%
Legal and compliance
Human resources
Research and development
Sales
Marketing
Customer service
Data/insight
Finance
Information technology
Page 11 | The 2017 global data management benchmark report
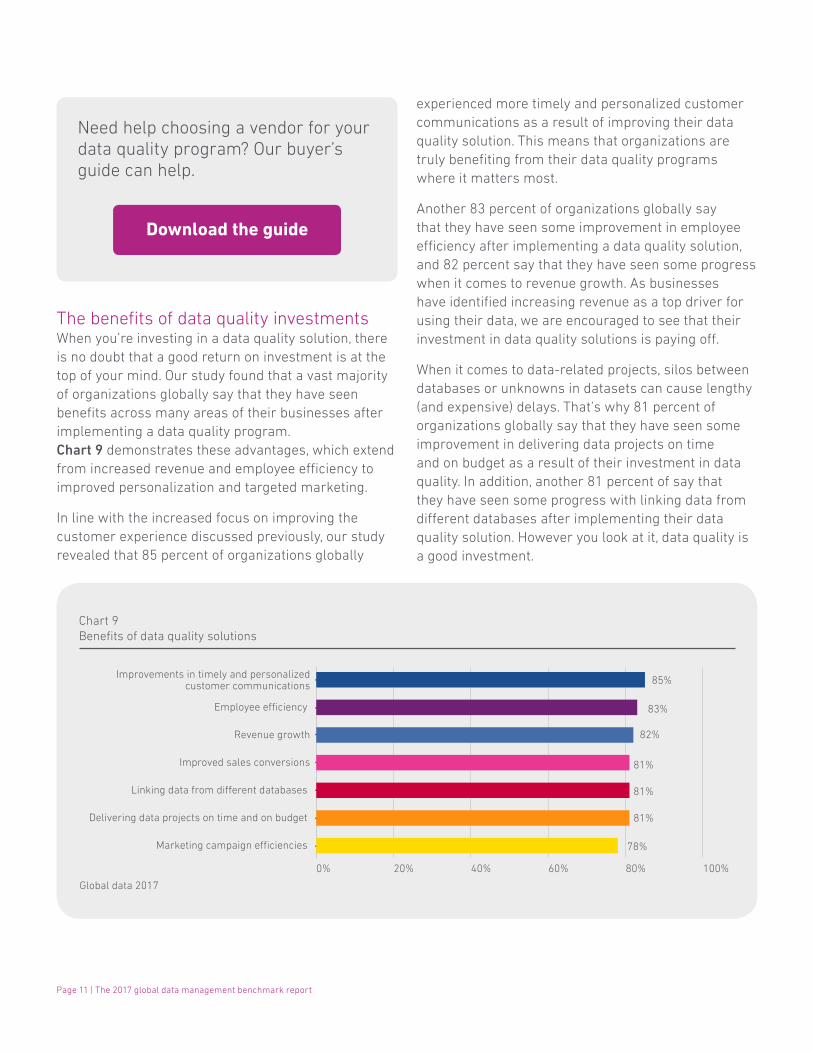
The benefits of data quality investmentsWhen you’re investing in a data quality solution, there is no doubt that a good return on investment is at the top of your mind. Our study found that a vast majority of organizations globally say that they have seen benefits across many areas of their businesses after implementing a data quality program. Chart 9 demonstrates these advantages, which extend from increased revenue and employee efficiency to improved personalization and targeted marketing.
In line with the increased focus on improving the customer experience discussed previously, our study revealed that 85 percent of organizations globally
experienced more timely and personalized customer communications as a result of improving their data quality solution. This means that organizations are truly benefiting from their data quality programs where it matters most.
Another 83 percent of organizations globally say that they have seen some improvement in employee efficiency after implementing a data quality solution, and 82 percent say that they have seen some progress when it comes to revenue growth. As businesses have identified increasing revenue as a top driver for using their data, we are encouraged to see that their investment in data quality solutions is paying off.
When it comes to data-related projects, silos between databases or unknowns in datasets can cause lengthy (and expensive) delays. That’s why 81 percent of organizations globally say that they have seen some improvement in delivering data projects on time and on budget as a result of their investment in data quality. In addition, another 81 percent of say that they have seen some progress with linking data from different databases after implementing their data quality solution. However you look at it, data quality is a good investment.
Need help choosing a vendor for your data quality program? Our buyer’s guide can help.
Download the guide
78%
81%
81%
81%
82%
83%
85%
Chart 9Benefits of data quality solutions
Global data 2017
0% 20% 40% 60% 80% 100%
Marketing campaign eciencies
Delivering data projects on time and on budget
Linking data from di�erent databases
Improved sales conversions
Revenue growth
Employee eciency
Improvements in timely and personalizedcustomer communications
The 2017 global data management benchmark report | Page 12
The road to proactive data qualityThe Idaho Transportation DepartmentThe Idaho Transportation Department is a government organization responsible for providing the state’s 1.6 million residents with safe, efficient mobility as well as economic opportunities through improved connectivity.
ObjectiveProviding top-tier services to residents is at the heart of the Idaho Transportation Department’s mission. To meet their goal, the department needs to have a consolidated view of its residents. But information that is spread across siloed databases prevents the department from accurately matching DMV customer records.
To further complicate matters, the department’s mainframe data table structure is non-relational, so every record in the mainframe represents one transaction. This means that if a resident owns three vehicles, they will have three records even though they are the same person.
In an effort to consolidate duplicate records for individuals, the Transportation Department lobbied for the state of Idaho to put legislation in place that requires residents to provide unique identifying information (such as a Social Security number or driver’s license number) to the department. The legislation passed in 2010.
SolutionIn 2016, they started conversations with Experian Data Quality because they were interested in address verification and matching capabilities. While these solutions take care of the performance issues the department was experiencing, they still needed to solve for the operational demands that limit their current solution. After a seeing a demo of Experian Pandora, the department felt they might have found their answer.
Learn how the Idaho Transportation Department is proactive with their approach to data quality.
Read more
ResultsSignificant reduction in the number of records The Idaho Transportation Department is well on its way to achieving its goal of having one record per DMV customer. Through previous efforts, the department was able to go from 20 million to 8 million records. Their goal with Experian Data Quality is to have fewer than 3 million records in their database.
Improved efficiency and transparencyBuilt-in visualization capabilities help the department communicate data issues with more clarity than they previously could. As a result, the department has become much more proactive in its approach to data quality, and it has implemented rules in its new system to ensure that the quality of the data is maintained over time.
“The developers working with the data were aware of the issues, but Experian Pandora gave us a way to highlight a bunch of different problems that can be easily displayed or made visible to others.”
– Carin Pluto, Database Analyst, Senior Idaho Transportation Department
Page 13 | The 2017 global data management benchmark report
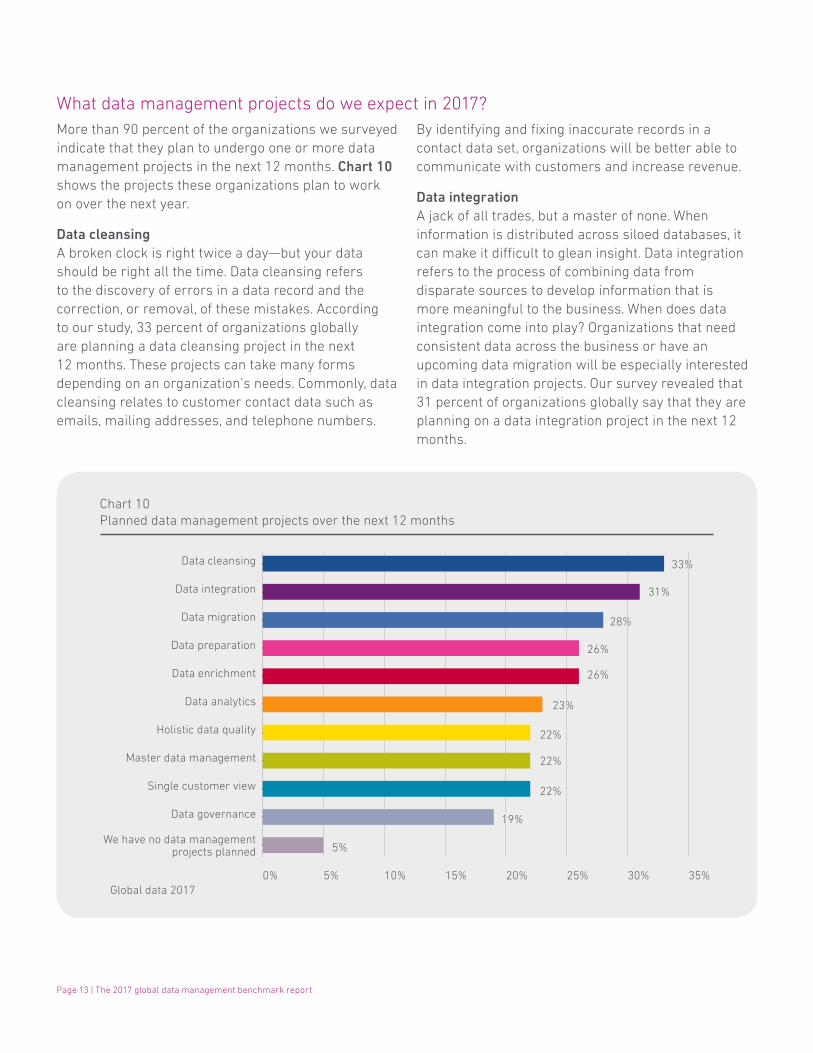
More than 90 percent of the organizations we surveyed indicate that they plan to undergo one or more data management projects in the next 12 months. Chart 10 shows the projects these organizations plan to work on over the next year.
Data cleansingA broken clock is right twice a day—but your data should be right all the time. Data cleansing refers to the discovery of errors in a data record and the correction, or removal, of these mistakes. According to our study, 33 percent of organizations globally are planning a data cleansing project in the next 12 months. These projects can take many forms depending on an organization’s needs. Commonly, data cleansing relates to customer contact data such as emails, mailing addresses, and telephone numbers.
By identifying and fixing inaccurate records in a contact data set, organizations will be better able to communicate with customers and increase revenue.
Data integrationA jack of all trades, but a master of none. When information is distributed across siloed databases, it can make it difficult to glean insight. Data integration refers to the process of combining data from disparate sources to develop information that is more meaningful to the business. When does data integration come into play? Organizations that need consistent data across the business or have an upcoming data migration will be especially interested in data integration projects. Our survey revealed that 31 percent of organizations globally say that they are planning on a data integration project in the next 12 months.
5%
19%
22%
22%
22%
23%
26%
26%
28%
31%
33%
Chart 10Planned data management projects over the next 12 months
Global data 20170% 5% 10% 15% 20% 25% 30% 35%
We have no data managementprojects planned
Data governance
Single customer view
Master data management
Holistic data quality
Data analytics
Data enrichment
Data preparation
Data migration
Data integration
Data cleansing
What data management projects do we expect in 2017?
The 2017 global data management benchmark report | Page 14
Data migrationThey say you can’t teach an old dog new tricks, but that’s exactly what makes data migrations so advantageous. The term refers to the transfer of information between storage systems or data formats. For many organizations, the volume and breadth of data entering their databases have placed a strain on legacy systems, spurring a wave of modernization efforts. Looking forward to the next 12 months, 28 percent of companies say that they plan to start data migration projects.
That said, we also found that data migration projects can be difficult to finish on time and on budget. In fact, almost half of organizations (40%) say that data quality issues cause delays for migration projects. A lack of standardization, not enough manpower, ineffective tools, and a lack of budget are also cited as contributing factors. Keep migration projects on track by placing a strong emphasis on data quality, investing in tools to prepare the data, and striking a good balance between IT and business stakeholders involved in the project.
Data preparationMeasure twice, cut once. This is the driving principle behind data preparation projects. By following an iterative, agile process, organizations can cleanse, transform, and standardize their raw data into curated datasets. While data preparation is often used for analytics and business intelligence efforts, self-service data preparation is also being used as part of data migration efforts. According to our study, 26 percent of organizations globally are planning on starting a data preparation project in the next 12 months.
Recently, the trend for more business users to manage data has driven greater interest in automated or self-service data preparation—and it’s no wonder why. As previously discussed, our study revealed that 41 percent of organizations spend a majority of their time preparing data for insight. Automating this process will help to reduce the time spent preparing data and improve employee efficiency.
Data enrichmentKnowledge is power. Organizations today realize the importance of creating a good customer experience, so it’s important to learn as much about their consumers as they can. That’s why 26 percent of organizations globally are planning on starting a data enrichment project in the next 12 months. With data enrichment, organizations can append a variety of data attributes—such as demographic, behavioral, or life event information—to their existing customer records. With greater insight into their customers’ needs and habits, they can start building a single customer view, improve their customer experience, and increase business performance through better targeting.
Data analyticsIt’s time to walk the walk. Over the next 12 months, organizations will continue to look at data analytics to power their business opportunities. Data has become a leading means by which business decisions are being made—a majority of organizations (76%) globally say that data is an integral part of forming their business strategy. To that end, our survey revealed that nearly one quarter of organizations (23%) say they will begin an analytics project over the next year.
As business users increasingly demand access to data for analytics, we will see a growing need for more robust data governance, which we see as the catalyst for renewed IT engagement. Additionally, business users will need intuitive, easy-to-use solutions that enable them to navigate a growing number of multi-structured data sources to derive insight. As 47 percent of businesses say they spend most of their time analyzing data, these businesses will begin to look for innovative solutions in the form of smart self-service data preparation and smart data discovery tools that enable easier data analytics.
Page 15 | The 2017 global data management benchmark report
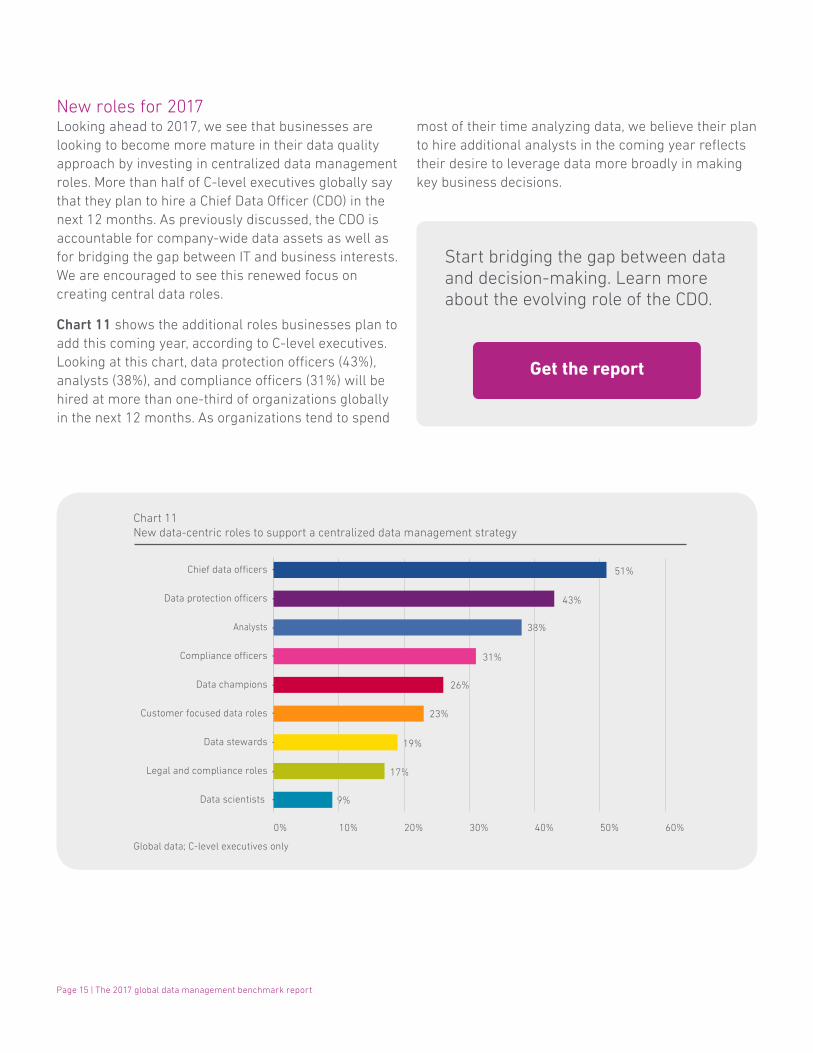
New roles for 2017Looking ahead to 2017, we see that businesses are looking to become more mature in their data quality approach by investing in centralized data management roles. More than half of C-level executives globally say that they plan to hire a Chief Data Officer (CDO) in the next 12 months. As previously discussed, the CDO is accountable for company-wide data assets as well as for bridging the gap between IT and business interests. We are encouraged to see this renewed focus on creating central data roles.
Chart 11 shows the additional roles businesses plan to add this coming year, according to C-level executives. Looking at this chart, data protection officers (43%), analysts (38%), and compliance officers (31%) will be hired at more than one-third of organizations globally in the next 12 months. As organizations tend to spend
most of their time analyzing data, we believe their plan to hire additional analysts in the coming year reflects their desire to leverage data more broadly in making key business decisions.
9%
17%
19%
23%
26%
31%
38%
43%
51%
Chart 11New data-centric roles to support a centralized data management strategy
Global data; C-level executives only
0% 10% 20% 30% 40% 50% 60%
Data scientists
Legal and compliance roles
Data stewards
Customer focused data roles
Data champions
Compliance o�cers
Analysts
Data protection o�cers
Chief data o�cers
Start bridging the gap between data and decision-making. Learn more about the evolving role of the CDO.
Get the report
The 2017 global data management benchmark report | Page 16
ConclusionAs organizations strive to call themselves ‘data driven,’ the need for increased governance and data management practices will become even more important. At the forefront of priorities this year, increasing revenue and better serving customers emerge as the two key areas where data will play a major role. To achieve these aims, establishing a foundational level of trust in this data will be a necessary prerequisite.
How do you build confidence in your data? With a strong focus on good governance and data quality. While a majority of organizations today tend to be in the middle of the pack when it comes to their data management maturity, we see their shared desire to add central data roles as a step in the right direction. In the year ahead, a continued emphasis on data quality will ensure these organizations harness their data adequately to power opportunities for themselves and for their customers.
Let's get started
Interested to learn how Experian Data Quality can help you better manage your data? Get in touch with us today.
Page 17 | The 2017 global data management benchmark report
In Perspective Mastering your 2017 data management priorities
By Roger Yeh, Senior Technical Consultant, Experian Data Quality
Page 18 | The 2017 global data management benchmark report
Master Data Management (MDM) is a huge buzzword in boardrooms around the world. Organizations today collect and generate massive amounts of data, and the belief is that MDM is required to make any sense of it. Many see MDM as this magical solution that allows business users to leverage business data. And they’re right. But that’s like saying you would hire Shaquille O'Neal just so he can help you replace light bulbs in high ceilings or clean the gutters.
What many don’t consider is that MDM is often overkill for what the organization actually wants to accomplish. Frequently, I see a big disconnect between all that an MDM solution can offer and a company’s strategy, and specifically data strategy. For instance, are they trying to build a single customer view or consolidating records in their database? If that’s the case, more likely than not they’d be better off with a data matching or data integration solution. It’s important to frame MDM in the perspective of what your goals are and identifying other options that might make more sense.
MDM as a solution tends to circulate among C-level sponsors who hear this term lauded at industry events and among analyst communities. Sometimes it can seem like everyone is doing MDM. In fact, our research reveals that 33 percent of C-level executives believe MDM is a priority for their organizations. But what our study also shows is that only 19 percent of management-level employees agree with them. This tells me that while executives at the C-level think they need an MDM solution, the people who are in the weeds know they really require something smaller and simpler to meet their goals.
When it comes to choosing MDM, it’s also important to consider the return on investment. The typical MDM solution can take anywhere from 6 months (best case scenario) to a year or longer to get up and running. And, because it could potentially touch every area of the business, you will need to get consensus and
buy-in from a lot of stakeholders. This heavy time investment is compounded by the fact that MDM solutions come with a hefty price tag. Generally speaking, for most things you’re trying to achieve, a cost-benefit analysis of the money and time it takes to implement MDM will probably reveal that the costs outweigh the benefits.
What’s my advice? When embarking on your data projects for 2017, really think about your end goals. Perhaps what you really want is a way to quickly query and join a few data sources and create ad hoc analyses. While having an MDM solution would undoubtedly help with this effort, can you wait a year? Asking these types of questions will help you to determine whether you need a full-blown MDM solution, or whether a couple of smaller solutions would better suit your needs. While there definitely will be instances in which MDM is your best option, odds are you may find yourself in a situation where the latter makes sense.
Empower business users and see faster time to value. Learn how Experian Pandora could be the right solution for you.
Learn more
The 2017 global data management benchmark report | Page 19
About Experian Data QualityExperian Data Quality is a global leader in providing data quality software and services to organizations of all sizes. We help our clients to proactively manage the quality of their data through world-class validation, matching, enrichment, and profiling capabilities. With flexible software-as-a-service and on-premise deployment models, Experian Data Quality software allows organizations around the world to truly connect with their customers by delivering intelligent interactions, every time.
Established in 1990, with offices throughout the United States, Europe and Asia Pacific, Experian Data Quality has more than 13,500 clients worldwide in retail, finance, education, insurance, government, healthcare and other sectors. For more information, visit edq.com.
© 2017 Experian Information Solutions, Inc. • All rights reserved
Experian and the Experian marks used herein are trademarks or registered trademarks of Experian Information Solutions, Inc. Other product and company names mentioned herein are the property of their respective owners.
Experian Data Quality125 Summer StreetBoston, MA 02110T: 1 888 727 8822www.edq.com