Embed Size (px)
Citation preview

THE 2016 EUROPEAN
SMALL AND MID CAP OUTLOOK
2016 edition

Preface . . . . . . . . . . . . . . . . . . . . . . . . . . . . . . . . . . . . . . . . . . . . . . . . . . . . . . . . . . . . . . . . . . . . . . . . . . . . . . . . . . . . . . . . . . . . . . . . . . . . . . . . . . . . . . . . . . . . . . . . . . . . . . . . . . . . . . . . . . . . . . . . . . . . . . . . . . . . . 3
Study highlights . . . . . . . . . . . . . . . . . . . . . . . . . . . . . . . . . . . . . . . . . . . . . . . . . . . . . . . . . . . . . . . . . . . . . . . . . . . . . . . . . . . . . . . . . . . . . . . . . . . . . . . . . . . . . . . . . . . . . . . . . . . . . . . . . . . . . . . . . . . . . . . . . .5
Introduction . . . . . . . . . . . . . . . . . . . . . . . . . . . . . . . . . . . . . . . . . . . . . . . . . . . . . . . . . . . . . . . . . . . . . . . . . . . . . . . . . . . . . . . . . . . . . . . . . . . . . . . . . . . . . . . . . . . . . . . . . . . . . . . . . . . . . . . . . . . . . . . . . . . . . . . . . .7
I. Small and mid caps continue to outperform .. . . . . . . . . . . . . . . . . . . . . . . . . . . . . . . . . . . . . . . . . . . . . . . . . . . . . . . . . . . . . . . . . . . . . . . . . . . . . 9
II. Small and mid caps: market performance = economic performance? . . . . . . . . . . . . . . . . . . . . .17
III. European market structure: a fixation on large caps! . . . . . . . . . . . . . . . . . . . . . . . . . . . . . . . . . . . . . . . . . . . . . . . . . . . . . . . . . . .27
Country focus . . . . . . . . . . . . . . . . . . . . . . . . . . . . . . . . . . . . . . . . . . . . . . . . . . . . . . . . . . . . . . . . . . . . . . . . . . . . . . . . . . . . . . . . . . . . . . . . . . . . . . . . . . . . . . . . . . . . . . . . . . . . . . . . . . . . . . . . . . . . . . . . . . . . .35
Conclusions and proposals . . . . . . . . . . . . . . . . . . . . . . . . . . . . . . . . . . . . . . . . . . . . . . . . . . . . . . . . . . . . . . . . . . . . . . . . . . . . . . . . . . . . . . . . . . . . . . . . . . . . . . . . . . . . . . . . . . . . . . . . . 47
Appendix: methodology & typology . . . . . . . . . . . . . . . . . . . . . . . . . . . . . . . . . . . . . . . . . . . . . . . . . . . . . . . . . . . . . . . . . . . . . . . . . . . . . . . . . . . . . . . . . . . . . . . . . . . . . . .51
SUMMARY
2
4
5
6
12
20
27
36
39
PREFACE
If you enjoy walking in the hearts of European capitals, you could not have missed
the impressive trend of standardization over the last 15 years that has totally
transformed these landscapes.
Gap, Starbucks, Apple, Zara, McDonald’s, H&M: whether you spend the weekend
in Madrid, Rome, London or Berlin, you’ll inevitably find these large global brands
on your path. So what about the local brands that aroused your curiosity and gave
you the feeling of being somewhere else? To find these local brands today you must
head off the beaten path, far away from the city centres.
It would appear that the European stock markets have experienced a trend similar
in all aspects: everything today in the European stock market ecosystem tends to
be in favour of large market caps at the expense of small caps. In fact, there have
never been so many large caps and the total market capitalization they represent
has never been so high.
Large caps quite naturally benefit from the privileged position of those who pay
for others: in an industry where fees are based on volumes, 7% of the largest
capitalizations represent 80% of total market capitalization. It is therefore only
normal that they receive all the attention they deserve. However, by focusing
on them alone, and, above all, by continuing, to neglect small caps and further
complicating their existence, the European market is gradually losing its vitality and
force; and ultimately, its attractiveness.
Today, the risk that market inertia ends up weakening the entrepreneurial fabric
is significant. Not only because the support of the stock market ecosystem with
regards to the more recently listed companies is deteriorating but also because
European markets: undersize me!
2
3
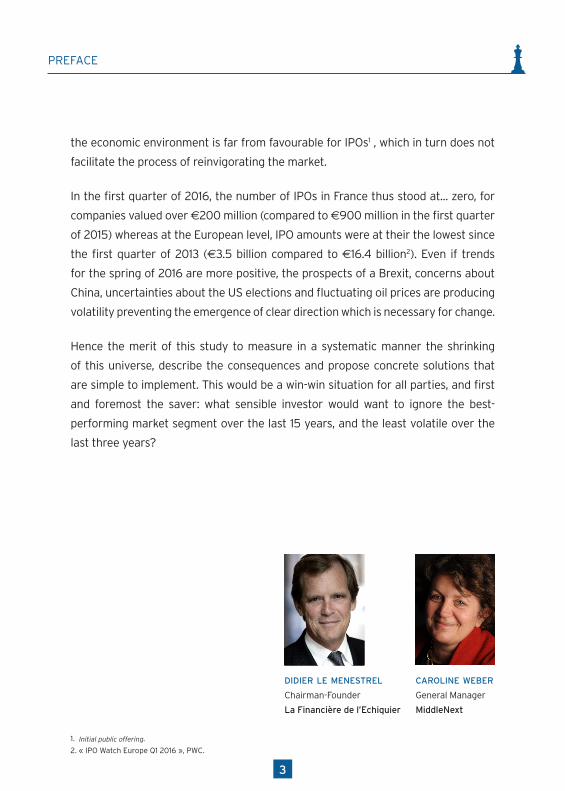
didier le menestrel
Chairman-Founder
La Financière de l’Echiquier
caroline weber
General Manager
MiddleNext
the economic environment is far from favourable for IPOs1 , which in turn does not
facilitate the process of reinvigorating the market.
In the first quarter of 2016, the number of IPOs in France thus stood at... zero, for
companies valued over €200 million (compared to €900 million in the first quarter
of 2015) whereas at the European level, IPO amounts were at their the lowest since
the first quarter of 2013 (€3.5 billion compared to €16.4 billion2). Even if trends
for the spring of 2016 are more positive, the prospects of a Brexit, concerns about
China, uncertainties about the US elections and fluctuating oil prices are producing
volatility preventing the emergence of clear direction which is necessary for change.
Hence the merit of this study to measure in a systematic manner the shrinking
of this universe, describe the consequences and propose concrete solutions that
are simple to implement. This would be a win-win situation for all parties, and first
and foremost the saver: what sensible investor would want to ignore the best-
performing market segment over the last 15 years, and the least volatile over the
last three years?
PREFACE
1. Initial public offering.
2. « IPO Watch Europe Q1 2016 », PWC.
2
4
3
2
1
4
Stock market and economic performances
- The net outperformance of small and mid caps over the last 15 years both at European and the national level, was confirmed
- The last three years have experienced an unprecedented trend where volatility levels for the small and mid cap segments versus large caps has been reversed
- The economic performances of small and mid caps coincide with overall stock market performances and have considerably outperformed the large-cap segment
European market structure
- The momentum generated by listing shares on the market is real for all segments
- The number of listed companies in Europe has stopped declining for the last two years
- Over a ten-year period, 20% to 25% of companies moved up to the next larger segment
- The upward flows existing between the four stock segments highlight the vital role of small caps in providing the foundations for the entire European ecosystem
A worrisome shrinking supply
- The market structure continues to favour large caps – a situation which contributes to both the ageing and decline in number of listed companies.
- The micro cap segment is continuing to contract, a disturbing sign for the vitality of the entire ecosystem
- The risk of a gradual decline in flows between market segments remains unchanged over the long-term in the absence of renewed momentum for IPOs in the micro/small cap segment.
STUDY HIGHLIGHTS
STUDY HIGHLIGHTS
5
For the second consecutive year, the European Small and Mid Cap Outlook produced by the MiddleNext Research Institute and La Financière de l’Echiquier (LFDE) interprets the major trends of the European stock exchange ecosystem and analyses its dynamics and consequences.
The first study of this series3, published last year offered four major findings for the 2000-2014 period:
Small and mid caps («Smids»), even when including their risk differential, achieved a significant stock market and economic outperformance, relative to large caps
Large caps – 7% of listed companies, though 80% of trading volume – constitute the economic engine driving the ecosystem
The number of listed large caps is dependent on the momentum of the Smids segment: 50% of today’s large caps were Smids 15 years ago
The number of small caps has been declining significantly since 2007, constituting a long-term risk for the European stock market ecosystem
These four findings resulted in a first conclusion: the financial market represents a rather conventional system whose future depends on start-ups or in other words the momentum of the micro, small and mid cap segments. Interdependencies exist between each stakeholder, to the benefit of all.
The long-term future of the stock market system thus depends on the number of listed small and mid caps whereas the economic model of this ecosystem in the short-term depends on the number of listed large caps.
It is therefore essential that measures be taken to preserve the balance of these interdependent relationships.
The second study of this series updates and analyses stock market (I) and economic (II) performances for asset classes and also the European market structure for small and mid caps (III) with the aim of identifying the major challenges. It concludes by proposing lines of action for improvements.
3. Last year’s full study may be consulted at the following websites www.lfde.com and www.middlenext.com
1
2
3
4
INTRODUCTION
INTRODUCTION
6
I. SMALL AND MID CAPS CONTINUE TO OUTPERFORM
In 2015, small and mid caps confirmed their supremacy in terms of stock market performance over the last 10 years but not only: indeed, our study confirms that investor perception of risk is the same for the different market segments – a unique phenomenon, counter-intuitive in nature that has not been previously observed.
The analysis which follows provides an update of the comparison of stock market performances for the different small, mid and large4 cap indexes over ten years (from 31 December 2005 to 31 December 2015) and three years (from 31 December 2012 to 31 December 2015). This comparison is based on the study of different European benchmarks and also available national benchmarks.
1. Small caps: consistently better performances… and today with less risk!
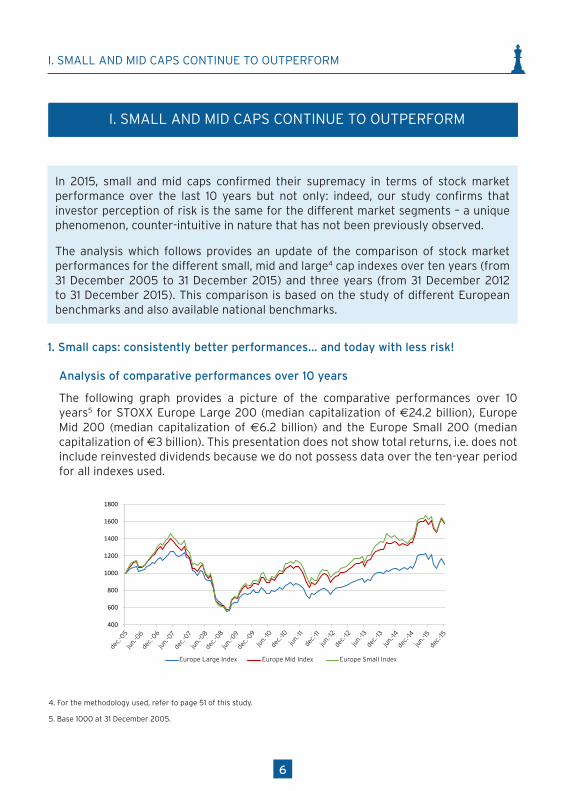
Analysis of comparative performances over 10 years
The following graph provides a picture of the comparative performances over 10 years5 for STOXX Europe Large 200 (median capitalization of €24.2 billion), Europe Mid 200 (median capitalization of €6.2 billion) and the Europe Small 200 (median capitalization of €3 billion). This presentation does not show total returns, i.e. does not include reinvested dividends because we do not possess data over the ten-year period for all indexes used.
5
I. La performance boursière : les Small et Mid confirment Intro L’analyse qui suit permet d’observer plusieurs phénomènes. Elle est une mise à jour de la performance boursière comparée des différents indices Small, Mid et Large sur 10 ans (31 décembre 2005 au 31 décembre 2015) et sur 3 ans (31 décembre 2012 au 31 décembre 2015). Elle s’appuie sur l’étude des indices européens puis sur celle des indices nationaux disponibles.
1. Les indices européens : les Small, plus de performance… et moins de risque ! Analyse des performances comparées sur 10 ans Le graphique ci-dessous présente les performances comparées sur 10 ans2 des indices STOXX : l’indice Large 200 (capitalisation médiane de 24,2 milliards d’euros), l’indice Mid 200 (capitalisation médiane de 6,2 milliards d’euros) et l’indice Small 200 (capitalisation médiane de 3 milliards d’euros). Ils n’apparaissent pas ici en total return, c’est-à-dire qu’ils n’intègrent pas les dividendes réinvestis, car nous ne disposons pas sur 10 ans de cette information sur tous les indices utilisés.
Ces 10 dernières années peuvent être résumées ainsi :
2 base 1 000 au 31 décembre 2005
400
600
800
1000
1200
1400
1600
1800
Indice Large Europe Indice Mid Europe Indice Small Europe
4. For the methodology used, refer to page 51 of this study.
5. Base 1000 at 31 December 2005.
I. SMALL AND MID CAPS CONTINUE TO OUTPERFORM
dec.-
05ju
n.-0
6de
c.-06
jun.
-07
jun.
-08
dec.-
07
dec.-
08
jun.
-10
dec.-
09
jun.
-11
jun.
-09
dec.-
10
dec.-
12
jun.
-14
dec.-
13
jun.
-12
jun.
-15
jun.
-13
dec.-
11
dec.-
14
dec.-
15
Europe Large Index Europe Mid Index Europe Small Index
I. SMALL AND MID CAPS CONTINUE TO OUTPERFORM
7
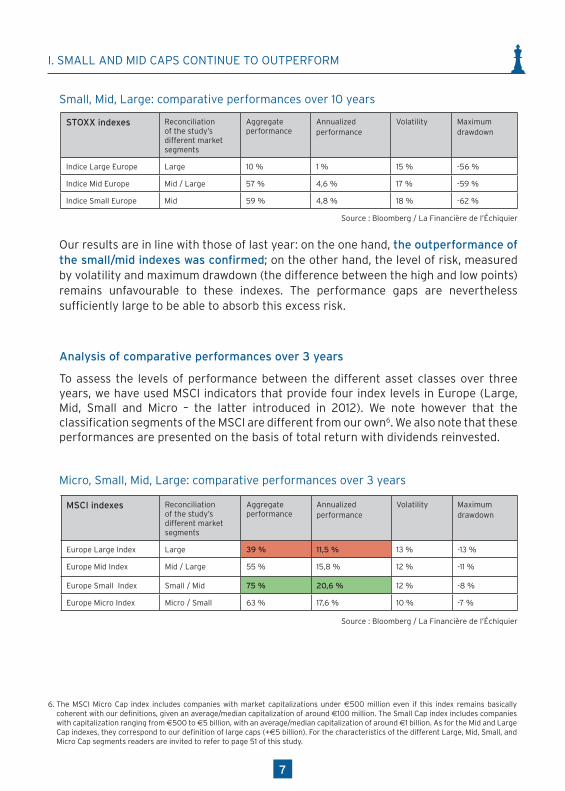
Small, Mid, Large: comparative performances over 10 years
STOXX indexes Reconciliation of the study’s different market segments
Aggregate performance
Annualized performance
Volatility Maximumdrawdown
Indice Large Europe Large 10 % 1 % 15 % -56 %
Indice Mid Europe Mid / Large 57 % 4,6 % 17 % -59 %
Indice Small Europe Mid 59 % 4,8 % 18 % -62 %
Source : Bloomberg / La Financière de l’Échiquier
Our results are in line with those of last year: on the one hand, the outperformance of the small/mid indexes was confirmed; on the other hand, the level of risk, measured by volatility and maximum drawdown (the difference between the high and low points) remains unfavourable to these indexes. The performance gaps are nevertheless sufficiently large to be able to absorb this excess risk.
Analysis of comparative performances over 3 years
To assess the levels of performance between the different asset classes over three years, we have used MSCI indicators that provide four index levels in Europe (Large, Mid, Small and Micro – the latter introduced in 2012). We note however that the classification segments of the MSCI are different from our own6. We also note that these performances are presented on the basis of total return with dividends reinvested.
Micro, Small, Mid, Large: comparative performances over 3 years
MSCI indexes Reconciliation of the study’s different market segments
Aggregate performance
Annualized performance
Volatility Maximumdrawdown
Europe Large Index Large 39 % 11,5 % 13 % -13 %
Europe Mid Index Mid / Large 55 % 15,8 % 12 % -11 %
Europe Small Index Small / Mid 75 % 20,6 % 12 % -8 %
Europe Micro Index Micro / Small 63 % 17,6 % 10 % -7 %
Source : Bloomberg / La Financière de l’Échiquier
I. SMALL AND MID CAPS CONTINUE TO OUTPERFORM
6. The MSCI Micro Cap index includes companies with market capitalizations under €500 million even if this index remains basically coherent with our definitions, given an average/median capitalization of around €100 million. The Small Cap index includes companies with capitalization ranging from €500 to €5 billion, with an average/median capitalization of around €1 billion. As for the Mid and Large Cap indexes, they correspond to our definition of large caps (+€5 billion). For the characteristics of the different Large, Mid, Small, and Micro Cap segments readers are invited to refer to page 51 of this study.
8
The performance of indexes remains largely in favour of Small/Mid caps, with the latter once again reaching the highest step of the podium followed by Micro/Small Caps and finally the Mid/Large caps. It is also interesting to note that results for the MSCI segmentation are considerably better for the Mid Cap index compared to Large Caps.
However, the most remarkable development is the reversal in the level of volatility: over this three-year period, large caps have represented the riskiest assets versus microcap s as the least volatile. This shift is visible both at the level of volatility and maximum drawdowns. This phenomenon that goes against conventional financial market theories represents a unique trend over the last 15 years in Europe.
These results are similar over the same period when using the STOXX indexes.
2. The national indexes: Germany takes the lead
Analysis of comparative performances over 10 years
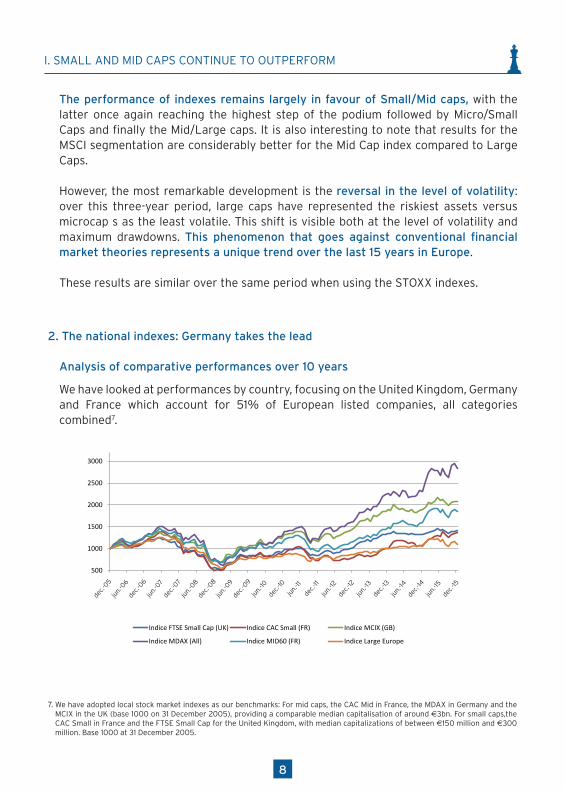
We have looked at performances by country, focusing on the United Kingdom, Germany and France which account for 51% of European listed companies, all categories combined7.
7
également intéressant de constater que la segmentation de MSCI présente des résultats sensiblement supérieurs pour l’indice Mid par rapport à celui des Large. La taille a donc généré un rendement décroissant sur les années 2012-2015 sur cet univers de Large. L’évolution la plus remarquable observée réside dans l’inversion du niveau de risque : sur ces 3 dernières années, les Large étaient la classe d’actifs la plus risquée et les Micro la moins volatile. Une constatation visible tant sur le niveau de volatilité que sur les maximum drawdowns. Ce phénomène, qui va à l’encontre des théories financières classiques, est unique au cours des 15 dernières années en Europe. Nous n’observons aucune inversion du niveau de risque entre 2000 et 2010. Ces résultats sont par ailleurs indépendants du fournisseur d’indices : nous obtenons les mêmes données pour la même période en utilisant l’indice STOXX.
2. Les indices nationaux : avantage Allemagne Analyse des performances comparées sur 10 ans Le Royaume-Uni, l’Allemagne et la France regroupent 51 % des sociétés européennes cotées, toutes catégories confondues. Les indices de référence que nous avons sélectionnés sont les indices des bourses locales. Pour les Mid : le CAC Mid en France, le MDAX en Allemagne et le FSTE 250 au Royaume-Uni4, qui proposent une capitalisation médiane similaire autour de 3 000 millions d’euros. Pour les Small : le CAC Small en France, et le FTSE Small Cap pour le Royaume-Uni avec des capitalisations médianes comprises entre 150 et 300 millions d’euros.
4 base 1000 au 31 décembre 2005
500
1000
1500
2000
2500
3000
Indice FTSE Small Cap (UK) Indice CAC Small (FR) Indice MCIX (GB)
Indice MDAX (All) Indice MID60 (FR) Indice Large Europe
I. SMALL AND MID CAPS CONTINUE TO OUTPERFORM
7. We have adopted local stock market indexes as our benchmarks: For mid caps, the CAC Mid in France, the MDAX in Germany and the MCIX in the UK (base 1000 on 31 December 2005), providing a comparable median capitalisation of around €3bn. For small caps,the CAC Small in France and the FTSE Small Cap for the United Kingdom, with median capitalizations of between €150 million and €300 million. Base 1000 at 31 December 2005.
dec.-
05
dec.-
08
dec.-
12
jun.
-07
jun.
-10
jun.
-14
dec.-
06
dec.-
09
dec.-
13
jun.
-08
jun.
-12
jun.
-11
jun.
-15
jun.
-06
jun.
-09
jun.
-13
dec.-
07
dec.-
11
dec.-
10
dec.-
14
dec.-
15
9
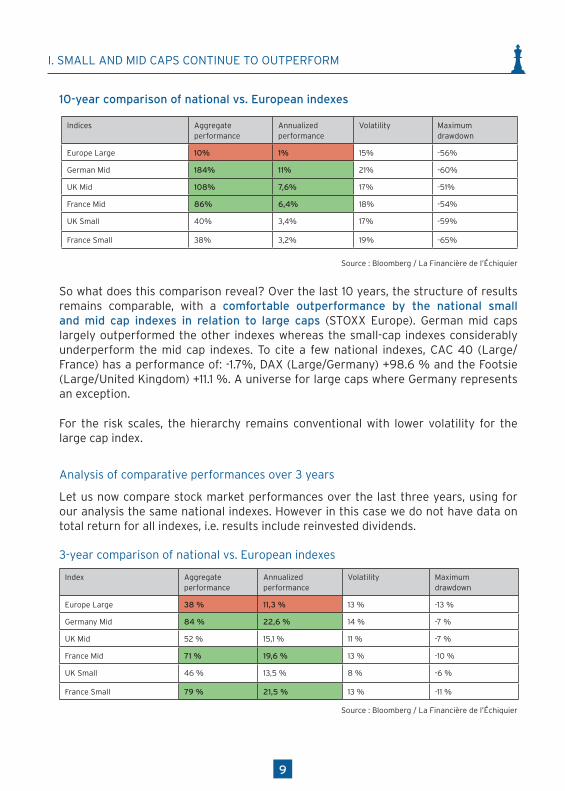
10-year comparison of national vs. European indexes
Indices Aggregate performance
Annualized performance
Volatility Maximumdrawdown
Europe Large 10% 1% 15% -56%
German Mid 184% 11% 21% -60%
UK Mid 108% 7,6% 17% -51%
France Mid 86% 6,4% 18% -54%
UK Small 40% 3,4% 17% -59%
France Small 38% 3,2% 19% -65%
Source : Bloomberg / La Financière de l’Échiquier
So what does this comparison reveal? Over the last 10 years, the structure of results remains comparable, with a comfortable outperformance by the national small and mid cap indexes in relation to large caps (STOXX Europe). German mid caps largely outperformed the other indexes whereas the small-cap indexes considerably underperform the mid cap indexes. To cite a few national indexes, CAC 40 (Large/France) has a performance of: -1.7%, DAX (Large/Germany) +98.6 % and the Footsie (Large/United Kingdom) +11.1 %. A universe for large caps where Germany represents an exception.
For the risk scales, the hierarchy remains conventional with lower volatility for the large cap index.
Analysis of comparative performances over 3 years
Let us now compare stock market performances over the last three years, using for our analysis the same national indexes. However in this case we do not have data on total return for all indexes, i.e. results include reinvested dividends.
3-year comparison of national vs. European indexes
Index Aggregate performance
Annualized performance
Volatility Maximumdrawdown
Europe Large 38 % 11,3 % 13 % -13 %
Germany Mid 84 % 22,6 % 14 % -7 %
UK Mid 52 % 15,1 % 11 % -7 %
France Mid 71 % 19,6 % 13 % -10 %
UK Small 46 % 13,5 % 8 % -6 %
France Small 79 % 21,5 % 13 % -11 %
Source : Bloomberg / La Financière de l’Échiquier
I. SMALL AND MID CAPS CONTINUE TO OUTPERFORM
The result of this comparison is clear: performances remain largely in favour of small cap and mid cap indexes, with the United Kingdom lagging behind.
The underperformance of the UK mid cap and small cap indexes in relation to their German and French equivalents was concentrated in 2015 with the significant weighting of listed companies in the commodities sectors adversely impacting these indexes. The significant number of delistings carried out since September 2015 by US investors in anticipation of the possibility of the Brexit provides an additional explanation for this trend.
With respect to the risk structure, we note the same alignment with equivalent or even lower, levels of volatility for mid and small cap indexes, which confirms our analysis at the European level. Levels for maximum drawdowns were also surprisingly lower.
It is worth considering these trends over time: the upcoming six-month periods will confirm the cyclical or structural nature of this trend.
3. The risk alignment: a cyclical phenomenon?
We have emphasized that the level of volatility between the different indexes represents an unprecedented development in Europe. How can this be explained? Three factors may be suggested:
• The policy of «risk-free» rates close to zero of the European Central Bank (ECB). Initiated in 2010, this policy coincided with the first signs of an alignment in the level of risks in Europe. Because «safety» was no longer considered profitable, it was no longer valued by the stock market, and risk premiums were aligned in consequence
• The smallest exposure of small and mid caps to global economic turbulence, particularly to emerging countries, with China at the top of the list. Chinese growth was perceived by markets, particularly in 2015, as a major stress factor, largely impacting the performance of the biggest large cap stocks
• Activity of Exchange-Traded Funds (ETF) that concerned primarily large caps. Listed ETFs represented 3.4% of assets under management in December 20158 and 9.3% of trading volume, or a turnover ratio of 1 for 3. By extrapolation, active management represents 96.6% of equities under management and 90.7% of trading volumes, or a ratio of less than 1. While we do not possess scientific data on this subject, we do know however that ETFs are largely concentrated in ultra-liquid assets and that in consequence small and mid cap stocks are not concerned by these products. According to a study9 by Kepler Cheuvreux on large cap indexes, the correlation within the DJ STOXX 50 in 2015 reached a peak, exceeding the previous stress levels of 2008 and 2011. Furthermore, the higher the correlation of companies comprising
I. SMALL AND MID CAPS CONTINUE TO OUTPERFORM
8. Source : European Monthly ETF Market Review, Deutsche Bank9. Source : Quant Trading Guide, 2016
10
11
the index, the greater the drawdowns. It would accordingly appear that the increase in ETFs and assets under management, however marginal, causes greater volatility (by a factor of 3) and increases the potential drawdown rate – two key factors in the perception of risk.
Is this a temporary phenomenon or a new permanent situation? We will pay particular attention to the question over the coming years.
I. SMALL AND MID CAPS CONTINUE TO OUTPERFORM
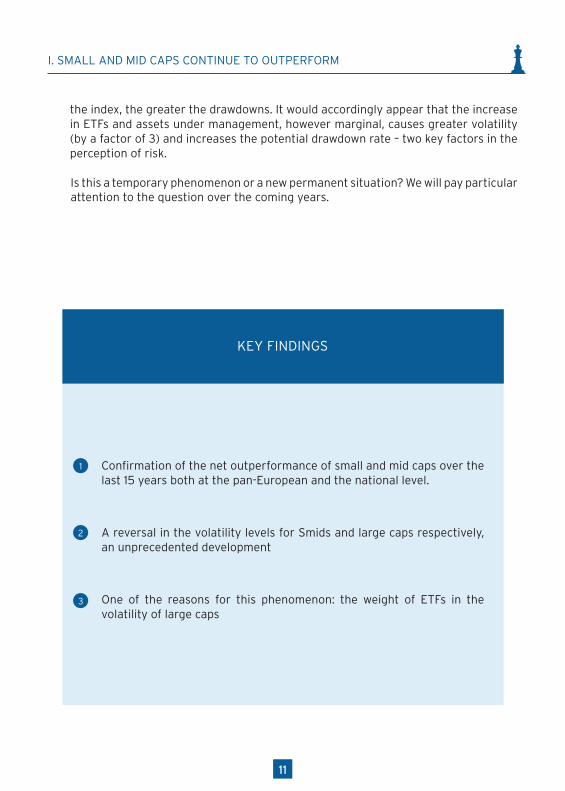
Confirmation of the net outperformance of small and mid caps over the last 15 years both at the pan-European and the national level.
A reversal in the volatility levels for Smids and large caps respectively, an unprecedented development
One of the reasons for this phenomenon: the weight of ETFs in the volatility of large caps
KEY FINDINGS
1
2
3
11
1212
II. SMALL AND MID CAPS: STOCK MARKET PERFORMANCE = ECONOMIC PERFORMANCE ?
II. SMALL AND MID CAPS:STOCK MARKET PERFORMANCE = ECONOMIC PERFORMANCE?
After analyzing the stock market performance of small and mid caps, and demonstrating the net outperformance of small and mid caps over the 2005-2015 period, we will now analyze their economic behaviour and its possible link to their stock market performance.
1. An instructive sample
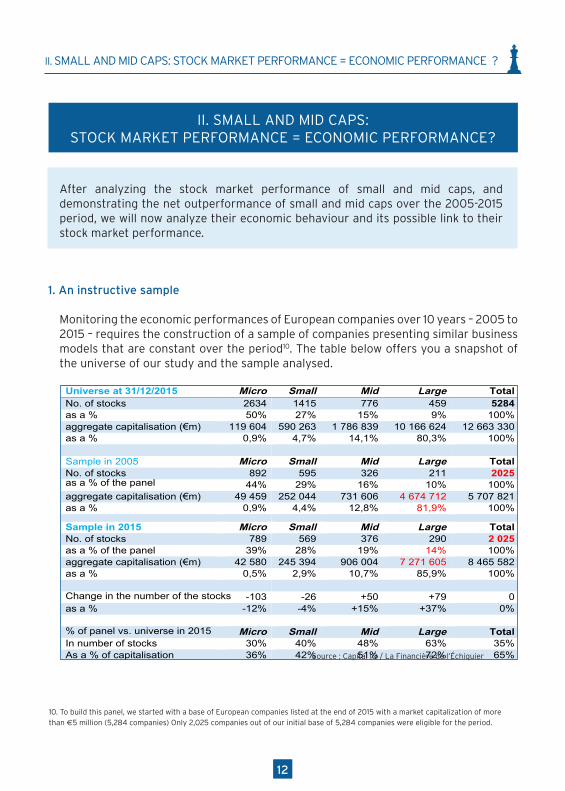
Monitoring the economic performances of European companies over 10 years – 2005 to 2015 – requires the construction of a sample of companies presenting similar business models that are constant over the period10. The table below offers you a snapshot of the universe of our study and the sample analysed.
9
II. Small et Mid
cap : perform
ance boursièr
e = performance économique ?
Après avoir analysé la performance boursière des Small et Mid, et révélé la nette surperformance des petites et moyennes valeurs sur la période 2005-2015, analysons à présent leur comportement économique et le lien éventuel avec leur performance boursière. 1 – Un échantillon révélateur Le suivi de la performance économique des sociétés européennes sur 10 ans – de 2005 à 2015 – a nécessité la construction d’un échantillon composé de sociétés présentant des modèles économiques similaires et constants sur la période8. Le tableau ci-dessous vous livre la photographie de l’univers de notre étude et de l’échantillon analysé.
Universe at 31/12/2015 Micro Small Mid Large Total No. of stocks 2634 1415 776 459 5284 as a % 50% 27% 15% 9% 100% aggregate capitalisation (€m) 119 604 590 263 1 786 839 10 166 624 12 663 330 as a % 0,9% 4,7% 14,1% 80,3% 100%
Sample in 2005 Micro Small Mid Large Total No. of stocks 892 595 326 211 2025 as a % of the panel 44% 29% 16% 10% 100% aggregate capitalisation (€m) 49 459 252 044 731 606 4 674 712 5 707 821 as a % 0,9% 4,4% 12,8% 81,9% 100%
Sample in 2015 Micro Small Mid Large Total No. of stocks 789 569 376 290 2 025 as a % of the panel 39% 28% 19% 14% 100% aggregate capitalisation (€m) 42 580 245 394 906 004 7 271 605 8 465 582 as a % 0,5% 2,9% 10,7% 85,9% 100%
Change in the number of the stocks -103 -26 +50 +79 0 as a % -12% -4% +15% +37% 0%
% of panel vs. universe in 2015 Micro Small Mid Large Total In number of stocks 30% 40% 48% 63% 35% As a % of capitalisation 36% 42% 51% 72% 65%
8 Pour construire cet échantillon, nous avons pris pour base les sociétés européennes cotées fin 2015 de plus de 5M€ de capitalisation boursières (5 284 sociétés). Seules 2 025 sociétés sur les 5 284 de notre base initiale sont éligibles sur la période.
A retenir
▪ La confirmation de la nette surperformance des Small et Mid depuis 15 ans, tant auniveau paneuropéen qu’au niveau national▪ L’inversion du risque entre les Smids et lesLarge sur les trois dernières années, un phénomène inédit▪ Une des raisons explicatives de ce phénomène à creuser : le poids des ETF dans lavolatilité des Large
Source : Capital IQ / La Financière de l’Échiquier
10. To build this panel, we started with a base of European companies listed at the end of 2015 with a market capitalization of more than €5 million (5,284 companies) Only 2,025 companies out of our initial base of 5,284 companies were eligible for the period.
1312
The change in this sample at constant scope over 10 years clearly highlights the existence of the phenomenon of communicating vessels between the different market segments. It also shows the micro and small cap segment contracting in favour of the mid and large cap segment, with the latter displaying growth in the number of stock of nearly 40%.
2. Economic performances of the sample (2005-2015)
Let us now look at he two main figures for this selection of 2,025 companies in two ways:
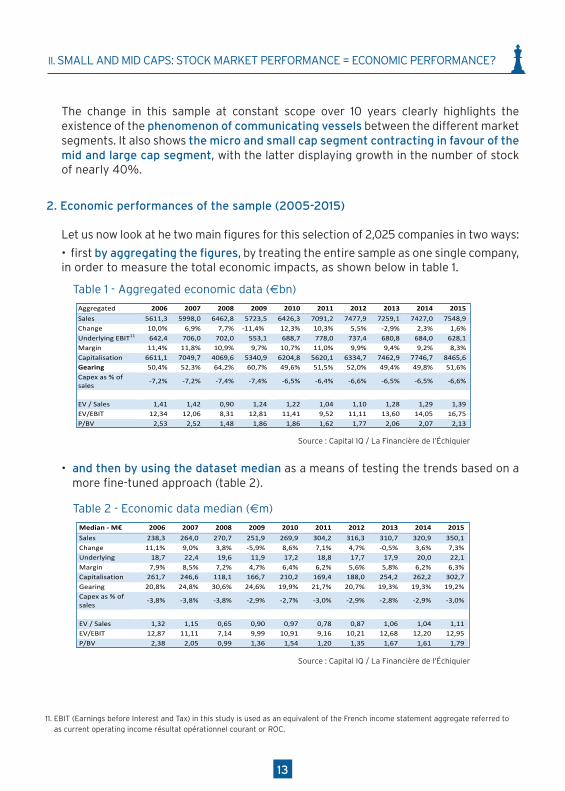
• first by aggregating the figures, by treating the entire sample as one single company, in order to measure the total economic impacts, as shown below in table 1.
Table 1 - Aggregated economic data (€bn)
10
Echantillonen2005 Micro Small Mid Large TotalNombredevaleurs 892 595 326 211 2025en%dupanel 44% 29% 16% 10% 100%Capitalisationagrégée(M€) 49459 252044 731606 4674712 5707821en% 0,9% 4,4% 12,8% 81,9% 100%
Echantillonen2015 Micro Small Mid Large TotalNombredevaleurs 789 569 376 290 2025en%dupanel 39% 28% 19% 14% 100%Capitalisationagrégée(M€) 42580 245394 906004 7271605 8465582en% 0,5% 2,9% 10,7% 85,9% 100%
Variationennombredevaleurs -103 -26 +50 +79 0en% -12% -4% +15% +37% 0%
%panelvsuniversen2015 Micro Small Mid Large TotalEnnombredevaleurs 30% 40% 48% 63% 35%En%capitalisation 36% 42% 51% 72% 65%
L’évolution de cet échantillon à périmètre constant sur 10 ansrévèle nettement le phénomène de vasescommunicantsexistantentrelesdifférentssegments.IlrévèleégalementlacontractiondessegmentsMicroetSmallauprofitdessegmentsMidetLarge, cedernier segmentaffichantuneprogressiondeprèsde40%ennombredevaleurs.ee2–Performanceséconomiquesdel’échantillon(2005-2015) Regardonsàprésentlesprincipauxchiffresdeces2025sociétésdedeuxfaçons:
• d’aborden agrégeant les chiffres, comme s’il s’agissait d’une seule etmême société, afin demesurerl’impactéconomiqueglobal–c’estletableau1ci-dessous,
• enutilisantensuitelesdonnéesmédianesafindepouvoirvaliderlestendancesavecuneapprocheplusfine(tableau2).
Tableau1-Donnéeséconomiquesagrégées(milliardsd’euros) Aggregated 2006 2007 2008 2009 2010 2011 2012 2013 2014 2015
Sales 5611,3 5998,0 6462,8 5723,5 6426,3 7091,2 7477,9 7259,1 7427,0 7548,9Change 10,0% 6,9% 7,7% -11,4% 12,3% 10,3% 5,5% -2,9% 2,3% 1,6%UnderlyingEBIT11 642,4 706,0 702,0 553,1 688,7 778,0 737,4 680,8 684,0 628,1Margin 11,4% 11,8% 10,9% 9,7% 10,7% 11,0% 9,9% 9,4% 9,2% 8,3%Capitalisation 6611,1 7049,7 4069,6 5340,9 6204,8 5620,1 6334,7 7462,9 7746,7 8465,6Gearing 50,4% 52,3% 64,2% 60,7% 49,6% 51,5% 52,0% 49,4% 49,8% 51,6%Capexas%ofsales
-7,2% -7,2% -7,4% -7,4% -6,5% -6,4% -6,6% -6,5% -6,5% -6,6%
EV/Sales 1,41 1,42 0,90 1,24 1,22 1,04 1,10 1,28 1,29 1,39EV/EBIT 12,34 12,06 8,31 12,81 11,41 9,52 11,11 13,60 14,05 16,75P/BV 2,53 2,52 1,48 1,86 1,86 1,62 1,77 2,06 2,07 2,13
11ROC:résultatopérationnelcourant.
Source : Capital IQ / La Financière de l’Échiquier
• and then by using the dataset median as a means of testing the trends based on a more fine-tuned approach (table 2).
Table 2 - Economic data median (€m)
11
Source:CapitalIQ/LaFinancièredel’Echiquier
Tableau2-Donnéeséconomiquesmédianes(millionsd’euros) Median-M€ 2006 2007 2008 2009 2010 2011 2012 2013 2014 2015
Sales 238,3 264,0 270,7 251,9 269,9 304,2 316,3 310,7 320,9 350,1Change 11,1% 9,0% 3,8% -5,9% 8,6% 7,1% 4,7% -0,5% 3,6% 7,3%Underlying 18,7 22,4 19,6 11,9 17,2 18,8 17,7 17,9 20,0 22,1Margin 7,9% 8,5% 7,2% 4,7% 6,4% 6,2% 5,6% 5,8% 6,2% 6,3%Capitalisation 261,7 246,6 118,1 166,7 210,2 169,4 188,0 254,2 262,2 302,7Gearing 20,8% 24,8% 30,6% 24,6% 19,9% 21,7% 20,7% 19,3% 19,3% 19,2%Capexas%ofsales
-3,8% -3,8% -3,8% -2,9% -2,7% -3,0% -2,9% -2,8% -2,9% -3,0%
EV/Sales 1,32 1,15 0,65 0,90 0,97 0,78 0,87 1,06 1,04 1,11EV/EBIT 12,87 11,11 7,14 9,99 10,91 9,16 10,21 12,68 12,20 12,95P/BV 2,38 2,05 0,99 1,36 1,54 1,20 1,35 1,67 1,61 1,79 Source : Capital IQ / La Financière de l’Echiquier Quelsenseignementscesdonnéeslivrent-elles?
- Le cycle croissance / crise / reprise suit son cours jusqu’en 2011. En 2012, la croissance fléchit
brutalement; la récession est sensible en 2013 (en données agrégées et médianes). 2014 et 2015renouent avec la reprise,marquée toutefois par une fortedisparité sur deux indicateurs: les donnéesagrégéesprésententunefaibleprogressionetendécélération,alorsquelesdonnéesmédianesaffichentune croissance dynamique et en accélération. Statistiquement, cette disparité révèle des progressionsd’activitédespluspetitessociétésrelativementfortes.
- L’évolutionduniveaudemargeopérationnelle etpar conséquentduniveaude résultatopérationnelcourant est en revanche plus consensuelle: en agrégé, les marges baissent et le volume de résultatopérationnelgénéréen2015estleplusbassurnotrehistorique(endépitd’uneprogressionduvolumede47%duvolumeagrégéetde70%duvolumemédian).L’effondrementdesrésultatsdespétrolièresaindéniablement un impact significatif sur ces données agrégées. Cependant, la pression est égalementparticulièrement visible, avec un résultat opérationnelmédian de 22millions d’euros en 2015, soit leniveaude2007!
- Les niveaux de capitalisation sont en revanche au plus haut, poussant les multiples de VE/ROC ausommet,quecesoitsurlesdonnéesagrégéesousurlesdonnéesmédianes.Lesmultiplesdestructures(VE/CA et P/AN) restent en dessous des pics de 2006/2007 mais au niveau supérieur de la périodeétudiée,alorsquelesniveauxdecroissanceetdemargenesontpaslesmêmesqu’ilyadixans.
3–Performanceéconomique=performanceboursièreL’analyse des performances boursières en Europe l’a démontré dans notre première partie: lesperformancesdes indices des valeursmoyennes sont nettement supérieures à celles des indices des grandessociétés. Cette surperformance se vérifie-t-elle au niveau économique? Pour analyser les performances
Source : Capital IQ / La Financière de l’Échiquier
II. SMALL AND MID CAPS: STOCK MARKET PERFORMANCE = ECONOMIC PERFORMANCE?
11. EBIT (Earnings before Interest and Tax) in this study is used as an equivalent of the French income statement aggregate referred to as current operating income résultat opérationnel courant or ROC.
14
II. SMALL AND MID CAPS: STOCK MARKET PERFORMANCE = ECONOMIC PERFORMANCE?
What conclusions does this data offer?
- The boom, bust, and recovery cycle followed on its normal course until 2011. In 2012, there was an abrupt reversal in growth with a strong recession in 2013 (based on aggregated and median data). 2014 and 2015 inaugurated a return to growth though with significant disparities between the two indicators: aggregate data showed weak gains and a slowing pace whereas median data displayed robust and accelerating growth. Statistically, this disparity reflects the relatively strong growth of the smaller companies.
- The change in the level of the operating margin and in consequence the level of EBIT is in contrast much more moderate: on an aggregate basis, margins are declining and the volume of operating profit in 2015 is at the lowest level or our historic reference period (despite a 47% increase in aggregate volume and a 70% increase in median volume). The collapse of oil and gas sector stocks clearly had a significant impact on this aggregated data. However, pressure was also particularly visible with a median operating profit of €22 million in 2015, i.e. in line with the level of 2007!
- The level of capitalization in contrast reached a peak, pushing EV/EBIT multiples to the roof, both for aggregate and median data. Multiples for the structures (EV/Sales and P/BV) remained below the peaks of 2006/2007 though at the higher level of period covered by the study, even though the levels for growth and margin are not the same as 10 years ago.
3. Economic performance = stock market performance
The analysis of stock market performances in Europe demonstrated in the first part of our study that the performances of mid cap indexes significantly outperform indexes for large caps. Is this outperformance also reflected at the economic level? To analyse economic performance, and because we have homogenized our dataset, we have selected as indicator of reference sales rather than market capitalization, while retaining the same data ranges.
In order to obtain a simpler and more legible comparison, we limited the number of economic indicators used. For each of the four segments12, we used sales and operating profit, recalculated from a base of 100 in 2004 while selecting market capitalization as the performance indicator.
12. The principle used to build the segments was just as simple: we used sales volume for 2005 to create the four segments with the number of companies remaining constant over the period studied (2005/2015).
15
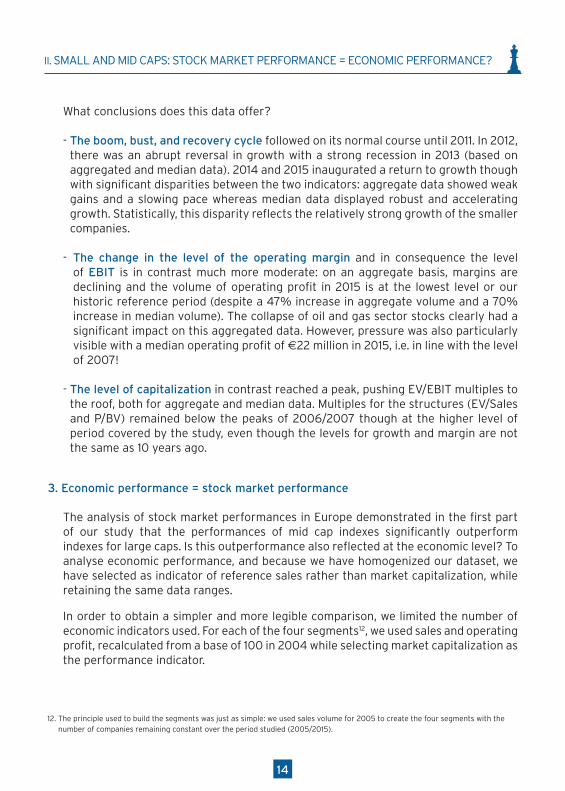
The entire panel
12
agrégées. Cependant, la pression est également très visible avec un résultat opérationnel médian de 22M€ en 2015, soit le niveau de 2007 !
- Les niveaux de capitalisations sont en revanche au plus haut, poussant les multiples de VE/ROC au sommet, que ce soit sur les données agrégées ou médianes. Les multiples de structures (VE/CA et P/AN) restent en dessous des pics de 2006/2007 mais dans le rang supérieur sur notre historique alors que, comme nous venons de le voir, les niveaux de croissance et les niveaux de marge ne sont pas les mêmes qu’il y a 10 ans.
3 – Performance économique des quatre segments Nous l’avons vu dans l’analyse des performances boursières en Europe : celles des indices valeurs moyennes sont nettement supérieures à celles des indices des grandes sociétés. Regardons à présent si cette surperformance se vérifie économiquement. Pour analyser les performances économiques et parce que nous voulons homogénéiser notre échantillon au maximum, nous utilisons cette fois le chiffre d’affaires comme indicateur de tri, en lieu et place de la capitalisation boursière, en conservant les mêmes fourchettes. Afin de réaliser une comparaison aussi simple que possible, nous utilisons seulement deux indicateurs économiques – le chiffre d’affaires et le résultat opérationnel – recalculés en base 100 en 2005 pour chacun des segments (Micro, Small, Mid et Large). Le mode de calcul de la performance économique est simple : nous additionnons le chiffre d’affaires des sociétés pour obtenir en volume la création/destruction de richesse de chacun des segments. Le principe de construction des quatre segments est tout aussi simple : nous utilisons le volume d’activité de 2005 pour générer les quatre segments qui restent donc à sociétés constantes pendant ces 10 années (2006/2015). Le panel dans son intégralité :
L’évolution graphique est très lisible : le volume d’activité stagne depuis 2012 et l’évolution du résultat opérationnel agrégé retombe quasiment à son niveau de 2005 en base 100. Le segment des Micro
Sales volume has stagnated since 2012. The trend for aggregate operating profit has virtually declined to its 2005 level with a base of 100. We will see further the full impact of large caps which drag these two indicators down.
The micro cap segment
13
La configuration graphique de l’évolution du niveau d’activité et de celui du résultat opérationnel du segment des Micro montre le dynamisme de cette classe d’actifs. Les indices de performances terminent 2015 sur un niveau de 280/300, soit un triplement en 10 ans. Le segment des Small
Les tendances graphiques du segment des Small marquent des performances également remarquable avec des indices qui frôlent le doublement sur la période et encore une bonne résilience dans les phases de stress (2009 et 2013). Le segment des Mid
La taille des entreprises augmentent encore d’un cran, les courbes s’aplatissent mais les tendances restent excellentes sur la période pour ce sous panel de Mid. Le segment des Large
Stagnation à partir de 2012 sur l’indice d’activité, effondrement de l’indice de résultat opérationnel qui tombe en dessous de son niveau de 2005 en 2015, mauvais temps pour les Large européennes. Ce graphique consolidé masque cependant comme toujours des situations très diverses mais expliquent tout de même les écarts de performances boursières entre les Large et les autres segments de la cote.
The level of activity and operating profit for the micro cap segment highlights the strong momentum of this asset class. The performance indicators ended 2015 at a level between 280 and 300, or up threefold in 10 years.
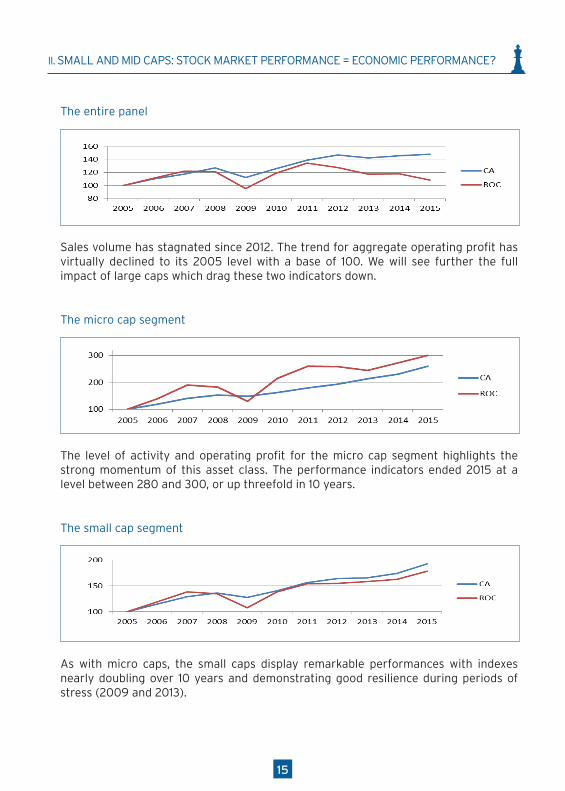
The small cap segment
13
La configuration graphique de l’évolution du niveau d’activité et de celui du résultat opérationnel du segment des Micro montre le dynamisme de cette classe d’actifs. Les indices de performances terminent 2015 sur un niveau de 280/300, soit un triplement en 10 ans. Le segment des Small
Les tendances graphiques du segment des Small marquent des performances également remarquable avec des indices qui frôlent le doublement sur la période et encore une bonne résilience dans les phases de stress (2009 et 2013). Le segment des Mid
La taille des entreprises augmentent encore d’un cran, les courbes s’aplatissent mais les tendances restent excellentes sur la période pour ce sous panel de Mid. Le segment des Large
Stagnation à partir de 2012 sur l’indice d’activité, effondrement de l’indice de résultat opérationnel qui tombe en dessous de son niveau de 2005 en 2015, mauvais temps pour les Large européennes. Ce graphique consolidé masque cependant comme toujours des situations très diverses mais expliquent tout de même les écarts de performances boursières entre les Large et les autres segments de la cote.
As with micro caps, the small caps display remarkable performances with indexes nearly doubling over 10 years and demonstrating good resilience during periods of stress (2009 and 2013).
II. SMALL AND MID CAPS: STOCK MARKET PERFORMANCE = ECONOMIC PERFORMANCE?
16
The mid cap segment
13
La configuration graphique de l’évolution du niveau d’activité et de celui du résultat opérationnel du segment des Micro montre le dynamisme de cette classe d’actifs. Les indices de performances terminent 2015 sur un niveau de 280/300, soit un triplement en 10 ans. Le segment des Small
Les tendances graphiques du segment des Small marquent des performances également remarquable avec des indices qui frôlent le doublement sur la période et encore une bonne résilience dans les phases de stress (2009 et 2013). Le segment des Mid
La taille des entreprises augmentent encore d’un cran, les courbes s’aplatissent mais les tendances restent excellentes sur la période pour ce sous panel de Mid. Le segment des Large
Stagnation à partir de 2012 sur l’indice d’activité, effondrement de l’indice de résultat opérationnel qui tombe en dessous de son niveau de 2005 en 2015, mauvais temps pour les Large européennes. Ce graphique consolidé masque cependant comme toujours des situations très diverses mais expliquent tout de même les écarts de performances boursières entre les Large et les autres segments de la cote.
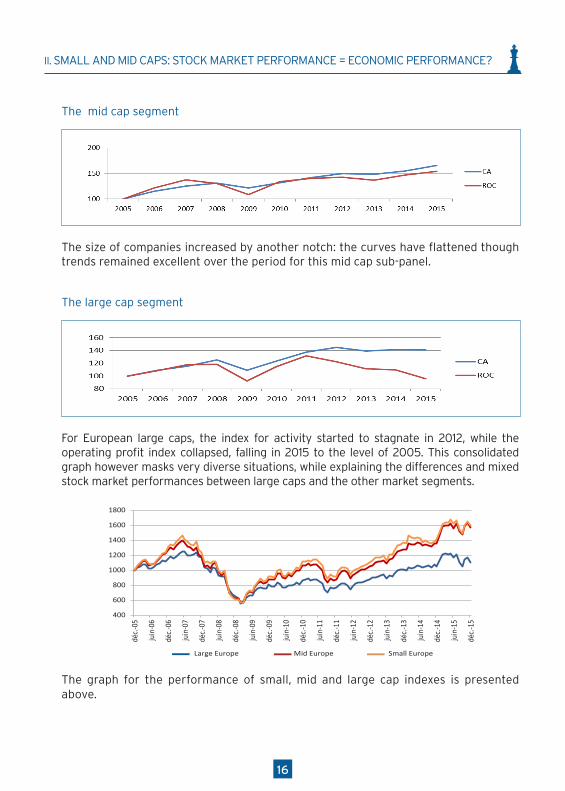
The size of companies increased by another notch: the curves have flattened though trends remained excellent over the period for this mid cap sub-panel.
The large cap segment
13
La configuration graphique de l’évolution du niveau d’activité et de celui du résultat opérationnel du segment des Micro montre le dynamisme de cette classe d’actifs. Les indices de performances terminent 2015 sur un niveau de 280/300, soit un triplement en 10 ans. Le segment des Small
Les tendances graphiques du segment des Small marquent des performances également remarquable avec des indices qui frôlent le doublement sur la période et encore une bonne résilience dans les phases de stress (2009 et 2013). Le segment des Mid
La taille des entreprises augmentent encore d’un cran, les courbes s’aplatissent mais les tendances restent excellentes sur la période pour ce sous panel de Mid. Le segment des Large
Stagnation à partir de 2012 sur l’indice d’activité, effondrement de l’indice de résultat opérationnel qui tombe en dessous de son niveau de 2005 en 2015, mauvais temps pour les Large européennes. Ce graphique consolidé masque cependant comme toujours des situations très diverses mais expliquent tout de même les écarts de performances boursières entre les Large et les autres segments de la cote.
For European large caps, the index for activity started to stagnate in 2012, while the operating profit index collapsed, falling in 2015 to the level of 2005. This consolidated graph however masks very diverse situations, while explaining the differences and mixed stock market performances between large caps and the other market segments.
400
600
800
1000
1200
1400
1600
1800
déc.-
05
juin
-06
déc.-
06
juin
-07
déc.-
07
juin
-08
déc.-
08
juin
-09
déc.-
09
juin
-10
déc.-
10
juin
-11
déc.-
11
juin
-12
déc.-
12
juin
-13
déc.-
13
juin
-14
déc.-
14
juin
-15
déc.-
15
Indice Large Europe Indice Mid Europe Indice Small Europe
The graph for the performance of small, mid and large cap indexes is presented above.
II. SMALL AND MID CAPS: STOCK MARKET PERFORMANCE = ECONOMIC PERFORMANCE?
17
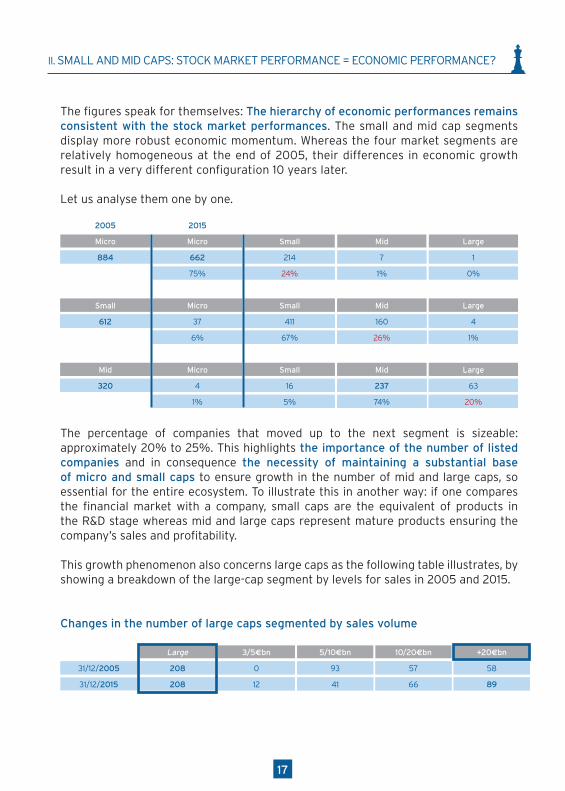
The figures speak for themselves: The hierarchy of economic performances remains consistent with the stock market performances. The small and mid cap segments display more robust economic momentum. Whereas the four market segments are relatively homogeneous at the end of 2005, their differences in economic growth result in a very different configuration 10 years later.
Let us analyse them one by one.
20152005
MicroMicro Small Mid Large
662884 214 7 1
75% 24% 1% 0%
662884 214 7 1
75% 24% 1% 0%
MicroSmall Small Mid Large
662884 214 7 1
75% 24% 1% 0%
37612 411 160 4
6% 67% 26% 1%
MicroSmall Small Mid Large
662884 214 7 1
75% 24% 1% 0%
37612 411 160 4
6% 67% 26% 1%
MicroSmall Small Mid Large
662884 214 7 1
75% 24% 1% 0%
37612 411 160 4
6% 67% 26% 1%
MicroMid Small Mid Large
662884 214 7 1
75% 24% 1% 0%
4320 16 237 63
1% 5% 74% 20%
The percentage of companies that moved up to the next segment is sizeable: approximately 20% to 25%. This highlights the importance of the number of listed companies and in consequence the necessity of maintaining a substantial base of micro and small caps to ensure growth in the number of mid and large caps, so essential for the entire ecosystem. To illustrate this in another way: if one compares the financial market with a company, small caps are the equivalent of products in the R&D stage whereas mid and large caps represent mature products ensuring the company’s sales and profitability.
This growth phenomenon also concerns large caps as the following table illustrates, by showing a breakdown of the large-cap segment by levels for sales in 2005 and 2015.
Changes in the number of large caps segmented by sales volume
Large 3/5ebn 5/10ebn 10/20ebn
662884 214 7 1
75% 24% 1% 0%
20831/12/2005 0 93 57
208 12 41 6631/12/2015
+20ebn
1
0%
58
89
II. SMALL AND MID CAPS: STOCK MARKET PERFORMANCE = ECONOMIC PERFORMANCE?
At constant scope, growth for companies with more than €5 billion in sales in 2005 is clear: the attrition of the base of this segment (€5 billion/€10 billion range) is substantial, in favour of the higher segments. In 10 years, the number of companies with more than €20 billion in sales increase 53% within our panel.
These figures highlight two points:
- Momentum produced by listing shares on the market applies equally to large groups
- Stock-picking is fundamental for small and mid caps
We note that large cap indexes underperform whereas the some of these large caps show remarkable momentum. The weight of certain stocks in large cap indexes crushes the performances of the most dynamic companies, highlighting the strategic importance of stock-picking in the large cap universe as well.
A comparison of 2005 and 2015 EBIT presents a clear contrast between certain sectors like energy (BP, Royal Dutch, ENI, Total, etc), telecommunications (Vodafone, Orange, Telecom Italia, Telefonica, etc), pharmaceuticals (AstraZeneca for example) or retailers (Carrefour SA), with other companies such as Roche Holding, Bayer, LVMH or Air Liquide, creating both wealth and value.
II. SMALL AND MID CAPS: STOCK MARKET PERFORMANCE = ECONOMIC PERFORMANCE?
1918
19
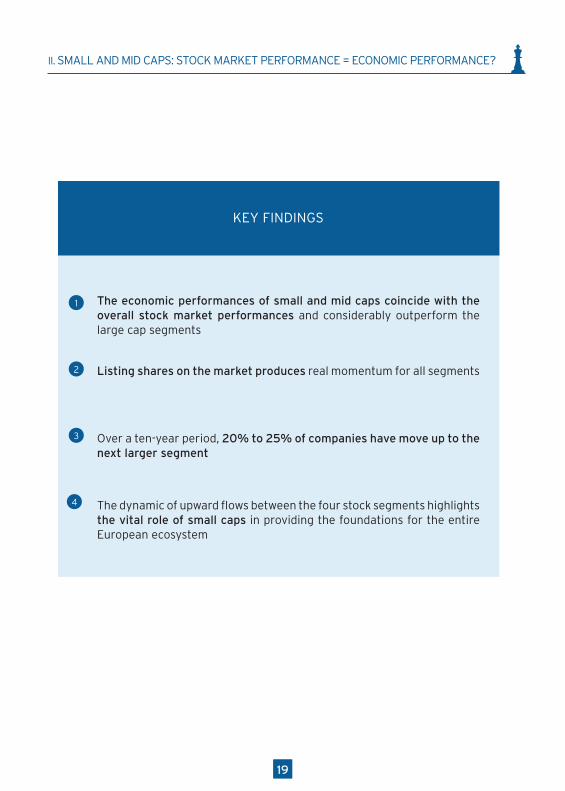
The economic performances of small and mid caps coincide with the overall stock market performances and considerably outperform the large cap segments
Listing shares on the market produces real momentum for all segments
Over a ten-year period, 20% to 25% of companies have move up to the next larger segment
The dynamic of upward flows between the four stock segments highlights the vital role of small caps in providing the foundations for the entire European ecosystem
KEY FINDINGS
1
2
3
4
19
II. SMALL AND MID CAPS: STOCK MARKET PERFORMANCE = ECONOMIC PERFORMANCE?
2020
III. EUROPEAN MARKET STRUCTURE: A FIXATION ON LARGE CAPS!
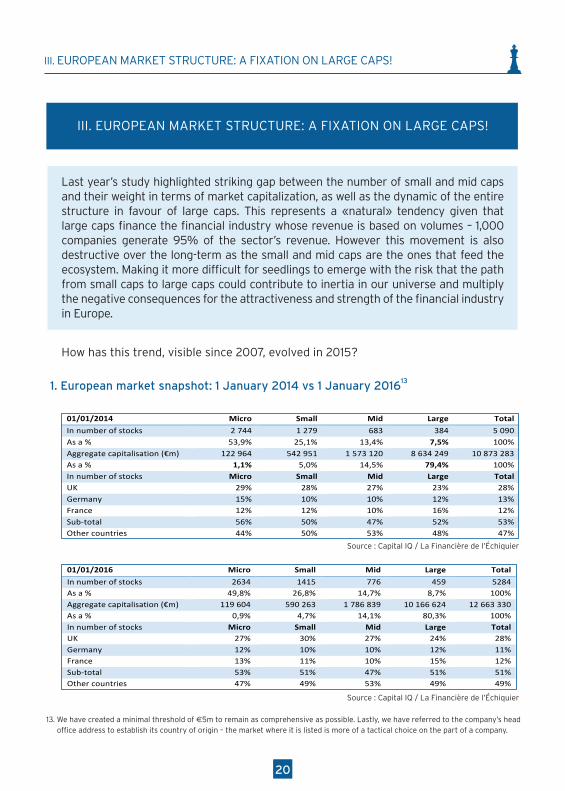
Last year’s study highlighted striking gap between the number of small and mid caps and their weight in terms of market capitalization, as well as the dynamic of the entire structure in favour of large caps. This represents a «natural» tendency given that large caps finance the financial industry whose revenue is based on volumes – 1,000 companies generate 95% of the sector’s revenue. However this movement is also destructive over the long-term as the small and mid caps are the ones that feed the ecosystem. Making it more difficult for seedlings to emerge with the risk that the path from small caps to large caps could contribute to inertia in our universe and multiply the negative consequences for the attractiveness and strength of the financial industry in Europe.
How has this trend, visible since 2007, evolved in 2015?
1. European market snapshot: 1 January 2014 vs 1 January 201613
14
III.Structuredumarchéeuropéen:toutsurlesLarge!L’étude de l’an dernier relevait le hiatus criant entre le nombre de Small etMid et leur poids en termes decapitalisationboursière,ainsiquelemouvementdetoutelastructurepourfavoriserlesLarge.Unmouvement«naturel»puisquece sontcesdernièresqui financent l’industrie financière,qui fonctionnesur lesvolumes–1000sociétésgénèrent95%duchiffred’affairesdusecteur.Maisunmouvementpotentiellementdestructeuràlongterme,carlesSmalletMidnourrissentl’écosystème.Rendreplusdifficilel’éclosiondesjeunespoussesoulechemindesSmallverslesLargerisquedefavoriserl’inertiedenotreuniversetdemultiplier lesconséquencesnégativespourl’attractivitéetlapuissancedel’industriefinancièreenEurope.Commentcettetendance,observéedepuis2007,a-t-elleévoluéen2015?1–Photographiedumarchéeuropéenau1erjanvier2014(publiédansxxxx)etau1erjanvier201612 01/01/2014 Micro Small Mid Large Total
Innumberofstocks 2744 1279 683 384 5090Asa% 53,9% 25,1% 13,4% 7,5% 100%Aggregatecapitalisation(€m) 122964 542951 1573120 8634249 10873283Asa% 1,1% 5,0% 14,5% 79,4% 100%Innumberofstocks Micro Small Mid Large TotalUK 29% 28% 27% 23% 28%Germany 15% 10% 10% 12% 13%France 12% 12% 10% 16% 12%Sub-total 56% 50% 47% 52% 53%Othercountries 44% 50% 53% 48% 47%Sources:CapitalIQ/LaFinancièredel’Echiquier
12Nousavonsinstauréunseuilminimal(5M€)pourresteraussiexhaustifsquepossible.Nousutilisonslesiègesocialdel’entreprisepourdéterminersonappartenanceàunpays–lecritèredelaplacedecotationétantunchoixtactiquedelapartdesentreprises.
Source : Capital IQ / La Financière de l’Échiquier
15
01/01/2016 Micro Small Mid Large Total
Innumberofstocks 2634 1415 776 459 5284Asa% 49,8% 26,8% 14,7% 8,7% 100%Aggregatecapitalisation(€m) 119604 590263 1786839 10166624 12663330Asa% 0,9% 4,7% 14,1% 80,3% 100%Innumberofstocks Micro Small Mid Large TotalUK 27% 30% 27% 24% 28%Germany 12% 10% 10% 12% 11%France 13% 11% 10% 15% 12%Sub-total 53% 51% 47% 51% 51%Othercountries 47% 49% 53% 49% 49%Sources:CapitalIQ/LaFinancièredel’Echiquier
Aprèsunebaisseimportanteentre2007et2013(-20%),lenombredesociétéseuropéennescotéesaprogressécesdeuxdernièresannées(de5090à5284).C’estunebonnesurprisecarlafaibledynamiquedesopérationsdefusions/acquisitionslaissaitcraindreunenouvellebaisse.Néanmoins, cemouvement favorise essentiellement les Large: il n’y a jamais eu autant de grandes valeurscotéessurlemarchéeuropéen,etlacapitalisationglobaledumarchén’ajamaisétéaussihaute.La structuredumarchéeuropéense rapprochedecellede l’an2000,avecdesMicro sous lepourcentetdesLargequidépassent80%delacapitalisationeuropéenne(82,4%en2000vs77,6%en2007).Quantàlarépartitiongéographiquedumarché,elleévoluedefaçondisparateselonlespays:
- leRoyaume-Unimaintientsapartdemarché,- l’Allemagneperd2pointsdepartsdemarché(ennombredesociétéscotées)auprofitdesautrespays
européens,maissonpoidsrestestableenpourcentagedelacapitalisationeuropéenne(-0,3%à13%),- laFranceconservesapartdemarchégrâceauxMicro,maisperdduterrainsurtouslesautressegments.
Elleestégalementstableenpourcentagedelacapitalisationeuropéenne(14,4%).2–Quelsenseignementstirerdesentrées/sortiesdelacoteen2014et2015?Notre première information clé concerne donc la progression du nombre de sociétés européennes cotées dequelque194sociétésendeuxans–unepremièredepuis2007.Regardons de manière plus détaillée les sociétés entrantes, les sociétés sortantes et le solde. Où lesintroductionsenbourseont-elleslieu?Surquelsegmentdelacote?Dequelssegmentsdelacotelesretraitssont-ilsoriginaires?Nombredesociétéscotéesau31/12/2013 5090
Sociétéssortiesen2014et2015 -493
Sociétéscotéesen2014et2015 682
Ajustement+/-duseuilde5M€decapitalisation13 5
Nombredesociétéscotéesau31/12/2015 5284
13 L’ajustementdecinqsociétéssurleseuildes5M€n’estqu’unsolde.Enréalité,cesontprèsde200sociétésquisontpasséessousle
seuildes5M€entre2013et2015,etdonc205sociétésquiontsuivilechemininverse.
Source : Capital IQ / La Financière de l’Échiquier
13. We have created a minimal threshold of €5m to remain as comprehensive as possible. Lastly, we have referred to the company’s head office address to establish its country of origin – the market where it is listed is more of a tactical choice on the part of a company.
III. EUROPEAN MARKET STRUCTURE: A FIXATION ON LARGE CAPS!
2120
After declining significantly between 2007 and 2013 (-20%), the number of listed European companies has risen in the last two years (from 5,090 to 5,284). This was a good surprise as the weak level of M&A activity raised concerns about the possibility of a new decline.
Nevertheless, this trend favoured primarily large caps; There has never been such a large number of large caps listed on the European market, and total market capitalization has never been so high.
The structure of the European market is approaching that of year 2000 with micro caps accounting for only 1% whereas large caps represent more than 80% of total European market capitalization (82.4% in 2000 versus 77.6% in 2007).
As for the geographical breakdown of the market, trends have varied according to country:
- The UK has maintained its market share
- Germany lost 2 points in market share (in number of companies) in favour of other European countries, though its weight remained stable as a percentage of European market capitalization (-0.3% to 13%)
- France also maintained its market share thanks to micro caps though lost ground in other segments. It has also remained stable as a percentage of European market capitalization (14.4%)
2. What observations can be drawn from the listings/delistings in 2014 and 2015?
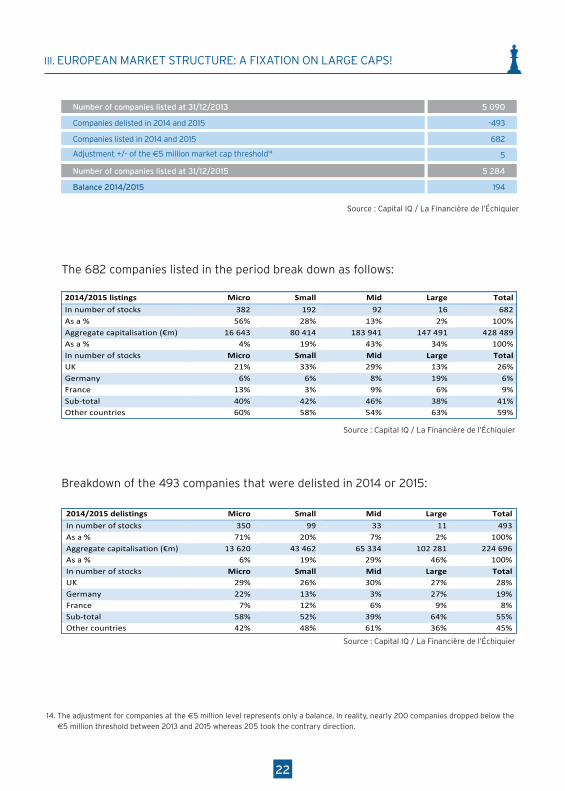
The first key information accordingly concerns the net increase in the number of European listed companies, with 194 companies added in two years – the first time this has occurred since 2007.
Let us now take a more detailed look at newly listed companies, delisted companies and the net change. Where were these companies listed? And in what market segment? What market segments accounted for the delistings?
III. EUROPEAN MARKET STRUCTURE: A FIXATION ON LARGE CAPS!
Small Large
884 1612 4
Number of companies listed at 31/12/2013 5 090
884 1Companies delisted in 2014 and 2015 -493
Small Large
884 1612 4
Companies listed in 2014 and 2015 682
884 1Adjustment +/- of the €5 million market cap threshold14 5
Small Large
884 1612 4
Number of companies listed at 31/12/2015 5 284
884 1Balance 2014/2015 194
Source : Capital IQ / La Financière de l’Échiquier
The 682 companies listed in the period break down as follows:
16
Solde2014/2015 194Sources:CapitalIQ/LaFinancièredel’Echiquier
Les682sociétésentrantesserépartissentdelamanièresuivante: 2014/2015listings Micro Small Mid Large Total
Innumberofstocks 382 192 92 16 682Asa% 56% 28% 13% 2% 100%Aggregatecapitalisation(€m) 16643 80414 183941 147491 428489Asa% 4% 19% 43% 34% 100%Innumberofstocks Micro Small Mid Large TotalUK 21% 33% 29% 13% 26%Germany 6% 6% 8% 19% 6%France 13% 3% 9% 6% 9%Sub-total 40% 42% 46% 38% 41%Othercountries 60% 58% 54% 63% 59%
Répartitiondes493sociétésquiontquittélacoteen2014ou2015:2014/2015delistings Micro Small Mid Large Total
Innumberofstocks 350 99 33 11 493Asa% 71% 20% 7% 2% 100%Aggregatecapitalisation(€m) 13620 43462 65334 102281 224696Asa% 6% 19% 29% 46% 100%Innumberofstocks Micro Small Mid Large TotalUK 29% 26% 30% 27% 28%Germany 22% 13% 3% 27% 19%France 7% 12% 6% 9% 8%Sub-total 58% 52% 39% 64% 55%Othercountries 42% 48% 61% 36% 45%
Lesoldedesintroductions,lessortiesdeboursedéduites,augmentédestransfertsd’unsegmentversl’autre: Changeinthenumberofcompaniesbetween2013and2015
Micro Small Mid Large Total
Delistings -350 -99 -33 -11 -493Listings 382 192 92 16 682Netchangesfromtransfersbetweensegments -142 43 34 70 5Netbalance -110 136 93 75 194Netbalancebycountry Micro Small Mid Large TotalUK -82 56 30 19 23Germany -83 10 8 10 -55France 12 13 6 7 38Sub-total -153 79 44 36 6Othercountries 43 57 49 39 188
Qu’observe-t-onàpartirdecestableauxdedonnées?
Source : Capital IQ / La Financière de l’Échiquier
Breakdown of the 493 companies that were delisted in 2014 or 2015:
16
Solde2014/2015 194Sources:CapitalIQ/LaFinancièredel’Echiquier
Les682sociétésentrantesserépartissentdelamanièresuivante: 2014/2015listings Micro Small Mid Large Total
Innumberofstocks 382 192 92 16 682Asa% 56% 28% 13% 2% 100%Aggregatecapitalisation(€m) 16643 80414 183941 147491 428489Asa% 4% 19% 43% 34% 100%Innumberofstocks Micro Small Mid Large TotalUK 21% 33% 29% 13% 26%Germany 6% 6% 8% 19% 6%France 13% 3% 9% 6% 9%Sub-total 40% 42% 46% 38% 41%Othercountries 60% 58% 54% 63% 59%
Répartitiondes493sociétésquiontquittélacoteen2014ou2015:2014/2015delistings Micro Small Mid Large Total
Innumberofstocks 350 99 33 11 493Asa% 71% 20% 7% 2% 100%Aggregatecapitalisation(€m) 13620 43462 65334 102281 224696Asa% 6% 19% 29% 46% 100%Innumberofstocks Micro Small Mid Large TotalUK 29% 26% 30% 27% 28%Germany 22% 13% 3% 27% 19%France 7% 12% 6% 9% 8%Sub-total 58% 52% 39% 64% 55%Othercountries 42% 48% 61% 36% 45%
Lesoldedesintroductions,lessortiesdeboursedéduites,augmentédestransfertsd’unsegmentversl’autre: Changeinthenumberofcompaniesbetween2013and2015
Micro Small Mid Large Total
Delistings -350 -99 -33 -11 -493Listings 382 192 92 16 682Netchangesfromtransfersbetweensegments -142 43 34 70 5Netbalance -110 136 93 75 194Netbalancebycountry Micro Small Mid Large TotalUK -82 56 30 19 23Germany -83 10 8 10 -55France 12 13 6 7 38Sub-total -153 79 44 36 6Othercountries 43 57 49 39 188
Qu’observe-t-onàpartirdecestableauxdedonnées?
Source : Capital IQ / La Financière de l’Échiquier
14. The adjustment for companies at the €5 million level represents only a balance. In reality, nearly 200 companies dropped below the €5 million threshold between 2013 and 2015 whereas 205 took the contrary direction.
III. EUROPEAN MARKET STRUCTURE: A FIXATION ON LARGE CAPS!
22
2323
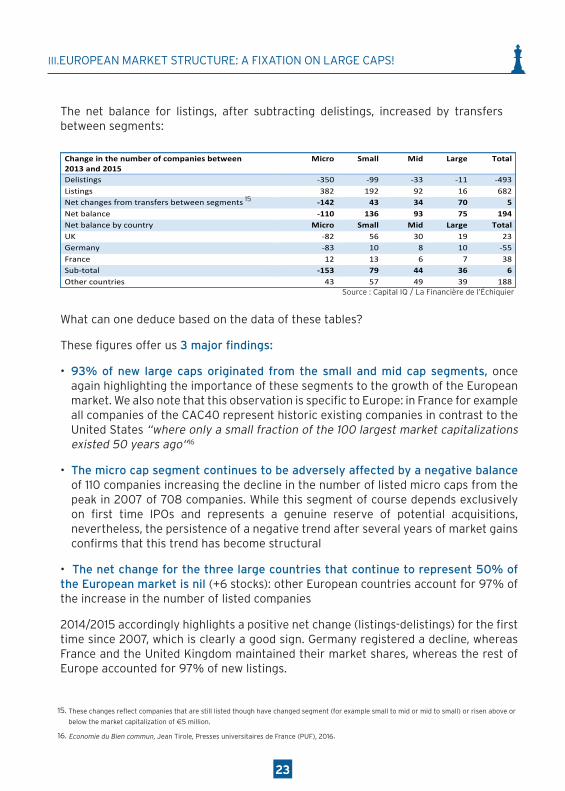
The net balance for listings, after subtracting delistings, increased by transfers between segments:
16
Solde2014/2015 194Sources:CapitalIQ/LaFinancièredel’Echiquier
Les682sociétésentrantesserépartissentdelamanièresuivante: 2014/2015listings Micro Small Mid Large Total
Innumberofstocks 382 192 92 16 682Asa% 56% 28% 13% 2% 100%Aggregatecapitalisation(€m) 16643 80414 183941 147491 428489Asa% 4% 19% 43% 34% 100%Innumberofstocks Micro Small Mid Large TotalUK 21% 33% 29% 13% 26%Germany 6% 6% 8% 19% 6%France 13% 3% 9% 6% 9%Sub-total 40% 42% 46% 38% 41%Othercountries 60% 58% 54% 63% 59%
Répartitiondes493sociétésquiontquittélacoteen2014ou2015:2014/2015delistings Micro Small Mid Large Total
Innumberofstocks 350 99 33 11 493Asa% 71% 20% 7% 2% 100%Aggregatecapitalisation(€m) 13620 43462 65334 102281 224696Asa% 6% 19% 29% 46% 100%Innumberofstocks Micro Small Mid Large TotalUK 29% 26% 30% 27% 28%Germany 22% 13% 3% 27% 19%France 7% 12% 6% 9% 8%Sub-total 58% 52% 39% 64% 55%Othercountries 42% 48% 61% 36% 45%
Lesoldedesintroductions,lessortiesdeboursedéduites,augmentédestransfertsd’unsegmentversl’autre: Changeinthenumberofcompaniesbetween2013and2015
Micro Small Mid Large Total
Delistings -350 -99 -33 -11 -493Listings 382 192 92 16 682Netchangesfromtransfersbetweensegments -142 43 34 70 5Netbalance -110 136 93 75 194Netbalancebycountry Micro Small Mid Large TotalUK -82 56 30 19 23Germany -83 10 8 10 -55France 12 13 6 7 38Sub-total -153 79 44 36 6Othercountries 43 57 49 39 188
Qu’observe-t-onàpartirdecestableauxdedonnées?
Source : Capital IQ / La Financière de l’Échiquier
What can one deduce based on the data of these tables?
These figures offer us 3 major findings:
• 93% of new large caps originated from the small and mid cap segments, once again highlighting the importance of these segments to the growth of the European market. We also note that this observation is specific to Europe: in France for example all companies of the CAC40 represent historic existing companies in contrast to the United States “where only a small fraction of the 100 largest market capitalizations existed 50 years ago“16
• The micro cap segment continues to be adversely affected by a negative balance of 110 companies increasing the decline in the number of listed micro caps from the peak in 2007 of 708 companies. While this segment of course depends exclusively on first time IPOs and represents a genuine reserve of potential acquisitions, nevertheless, the persistence of a negative trend after several years of market gains confirms that this trend has become structural
• The net change for the three large countries that continue to represent 50% of the European market is nil (+6 stocks): other European countries account for 97% of the increase in the number of listed companies
2014/2015 accordingly highlights a positive net change (listings-delistings) for the first time since 2007, which is clearly a good sign. Germany registered a decline, whereas France and the United Kingdom maintained their market shares, whereas the rest of Europe accounted for 97% of new listings.
III.EUROPEAN MARKET STRUCTURE: A FIXATION ON LARGE CAPS!
15. These changes reflect companies that are still listed though have changed segment (for example small to mid or mid to small) or risen above or
below the market capitalization of €5 million.
16. Economie du Bien commun, Jean Tirole, Presses universitaires de France (PUF), 2016.
15
3 – An ageing market: a cyclical or structural phenomena?
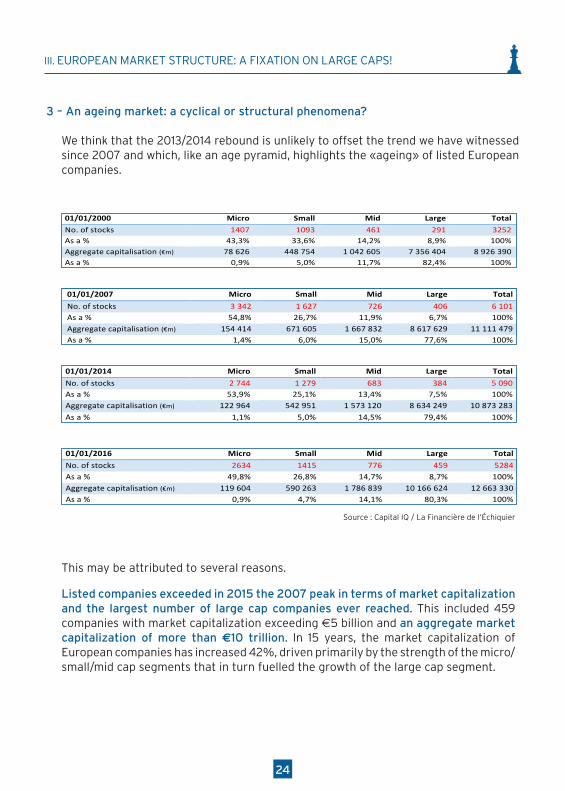
We think that the 2013/2014 rebound is unlikely to offset the trend we have witnessed since 2007 and which, like an age pyramid, highlights the «ageing» of listed European companies.
17
Ceschiffresnouslivrent3enseignementsmajeurs:• 93% des nouvelles Large proviennent des segments Small et Mid, soulignant une fois encore
l’importance de ces segments pour la progression du marché européen. Notons que ce constat estspécifique à l’Europe: en France, toutes les sociétés du CAC40 proviennent d’entreprises anciennes,contrairement aux Etats-Unis, «où seule une faible fraction des 100 plus grandes capitalisationsboursièresexistaientilyacinquanteans»14;
• lesMicrosouffrenttoujoursd’unsoldenégatifde110sociétés,portant labaissedunombredeMicrocotées, depuis le pic de 2007, à 708 sociétés. Ce segment dépend certes exclusivement des nouvellesintroductionsetconstitueunvéritableréservoiràacquisitions.Cependantlapersistanced’unevariationnégative,aprèsplusieursannéesdemarchéhaussier,prouvequelatendancedevientstructurelle;
• le solde net des trois grands pays qui pèsent encore 50% dumarché européen est presque nul (+6valeurs):97%delaprogressiondunombredesociétécotéesproviennentdesautrespayseuropéens.
2014/2015marquedonc un solde (introductions-retraits) positif, le premier depuis 2007, et c’est assurémentunebonnenouvelle.L’Allemagneestenbaisse,laFranceetleRoyaume-Uniconserventleurspartsdemarché,tandisquelerestedel’Europereprésente97%desnouvellescotations.3–Levieillissementdelacote:phénomèneconjonctureloustructurel?Nouspensonsquelerebondde2013/2014n’estpasdenatureàenrayerlemouvementauquelnousassistionsdepuis 2007etqui, à l’imaged’unepyramidedes âges, révèleun«vieillissement»des sociétéseuropéennescotéesenbourse. 01/01/2000 Micro Small Mid Large Total
No.ofstocks 1407 1093 461 291 3252Asa% 43,3% 33,6% 14,2% 8,9% 100%Aggregatecapitalisation(€m) 78626 448754 1042605 7356404 8926390Asa% 0,9% 5,0% 11,7% 82,4% 100%
01/01/2007 Micro Small Mid Large Total
No.ofstocks 3342 1627 726 406 6101Asa% 54,8% 26,7% 11,9% 6,7% 100%Aggregatecapitalisation(€m) 154414 671605 1667832 8617629 11111479Asa% 1,4% 6,0% 15,0% 77,6% 100%
01/01/2014 Micro Small Mid Large Total
No.ofstocks 2744 1279 683 384 5090Asa% 53,9% 25,1% 13,4% 7,5% 100%Aggregatecapitalisation(€m) 122964 542951 1573120 8634249 10873283
Asa% 1,1% 5,0% 14,5% 79,4% 100%
14 EconomieduBiencommun,JeanTirole,PressesuniversitairesdeFrance(PUF),2016.
18
01/01/2016 Micro Small Mid Large Total
No.ofstocks 2634 1415 776 459 5284Asa% 49,8% 26,8% 14,7% 8,7% 100%Aggregatecapitalisation(€m) 119604 590263 1786839 10166624 12663330Asa% 0,9% 4,7% 14,1% 80,3% 100%
Sources:CapitalIQ/LaFinancièredel’Echiquier
Plusieursraisonsàcela.Lessociétéscotéesontdépassé,courant2015,lepicde2007entermesdevalorisationboursièreetprésententlenombredegrandesvaleursleplusimportantjamaisatteint,avec459sociétéscapitalisantplusde5milliardsd’euros et représentant une capitalisation agrégée de plus de 10 000 milliards d’euros. En 15 ans, lacapitalisationboursièredessociétéseuropéennescotéesaprogresséde42%notammentgrâceaudynamismedessegmentsMicro/Small/MidquiontnourrilesegmentdesLarge.Lephénomènedevieillissementdessociétéscotéessepoursuitdepuis2007–unphénomènevisibleàlafoisdans la progression des compartimentsMid et Large qui atteignent un pic (en nombre et en capitalisationagrégée)nourrisparlestransfertsd’uncompartimentàl’autre,alorsmêmequelaperformancedesindicesaétésoutenueaucoursdeces2années.Enboutdechaîne,lecompartimentdesMicro,quidépenduniquementdesintroductionsenbourse,continuedesecontracterenraisondunombredesortiesplusimportantes,qu’ellessoientliéesàdesopérationsdefusions-acquisitionsouàlacroissanced’entreprisesbasculantdanslecompartimentdesSmall.Cesegmentsecontractedepuis8ansetatteintdeux«plusbas»depuislepicde2007,ennombreetencapitalisationagrégée.LesSmallmarquent un rebondpar rapport aupoint bas de 2014, profitant doncd’un flux d’introductions enbourseetd’unfluxducompartimentMicro.Ellesrestenttoutefoisen-deçàdupicde2007àlafoisennombreetencapitalisation.Cerebondnepermetdoncpasd’endigueràcestadelephénomènederétrécissementdelabasedelapyramide(Micro/Small) que nous observons depuis 2007 et qui va nécessairement impacter le haut de la pyramide(Mid/Large)dansletemps.4–BilanetprojectionLe nombre de sociétés européennes cotées a endigué au cours des 2 dernières années sa décrue observéedepuis 2007. Cette stabilisation est la bienvenuemême si la diminution du segment desMicro se poursuitdepuis2014,ennombred’entreprisescommeencapitalisation.Afindécembre2015,ilaccusaitunebaissedeplusde20%parrapportà2007.LescompartimentsMidetLargecontinuentdepercevoir lebénéficede lafortecroissancedescompartimentsMicro/Smalldesannées2000.L’inertieétanttrèsforte,cemécanismedevraitperdureraucoursdesprochainesannées.LesMicro/Smallcotéesaucoursdes10-15dernièresannéesvontcontinuerd’apporterunfluxdebelleshistoiresdecroissanceaucoursdesprochainesannéeset faireprogresser lenombredeMid/Large.Lerisque
Source : Capital IQ / La Financière de l’Échiquier
This may be attributed to several reasons.
Listed companies exceeded in 2015 the 2007 peak in terms of market capitalization and the largest number of large cap companies ever reached. This included 459 companies with market capitalization exceeding €5 billion and an aggregate market capitalization of more than €10 trillion. In 15 years, the market capitalization of European companies has increased 42%, driven primarily by the strength of the micro/small/mid cap segments that in turn fuelled the growth of the large cap segment.
III. EUROPEAN MARKET STRUCTURE: A FIXATION ON LARGE CAPS!
24
2525
Listed companies have continued to age since 2007 — a phenomenon reflected both by the growth of the mid and large cap segments that have reached a peak (in number and aggregate capitalization) fuelled by transfers from one segment to another, whereas the performance of indexes has remained robust over the last two years.
In the end, the micro cap segment which depends exclusively on IPOs, is continuing to contract due to a larger number of delistings whether linked to M&A activity or the companies’ growth resulting in their transfer to the small cap segment. This segment has been contracting for the last eight years, reaching a «low» in 2007 in number of stock and aggregate capitalization.
The small cap segment rebounded from the low of 2014, benefiting an inflow of IPOs and transfers from the micro cap segment. It nevertheless remains under the peak of 2007 in both number and market capitalization.
This rebound however is not sufficient to stem at this stage the narrowing pyramid base (micro/small) witnessed this since 2007 and which will invariably have an impact on the top of the pyramid (mid/large) in time;
4 – Summary and forecasts
The number of European listed companies over the last two years has started to stem the decline experienced since 2007. This stabilization is of course welcome even if the decline in the micro cap segment has been continuing since 2014, in number of stocks as in market capitalization. At the end of December 2015, this segment registered a decline of more than 20% in relation to 2007.
The mid and large cap segments continue to receive a boost from the strong growth in the micro/small cap segments in the 2000s. Because the inertia is very strong, this mechanism is expected to persist over the coming years. Listed micro/small caps over the last 10-15 years will continue to produce a pipeline of growth success stories over the coming years and growth in the number of mid and large caps. The risk of a gradual reduction in this flow remains intact over the long-term as long as there is not a resumption in the flow of IPOs in the micro and small cap segments.
The good news however is that this phenomenon is expected to have a positive impact on financial market trading volume. Indeed, the increase in market capitalizations is accompanied by growth in trading volume and in consequence fees for brokerage
III.EUROPEAN MARKET STRUCTURE: A FIXATION ON LARGE CAPS!
2626
firms. This development has been masked by declining brokerage rates between 2010 and 2010, though it would seem that since 2010, the trend has largely stabilized. We note that the a solid intermediation industry is indispensable for the efficiency of the European economy.
The decline in the number of European listed companies that began in 2007 has started to subside
The market structure continues to favour large caps – a situation which contributes to both the ageing and decline in number of listed companies
The microcap segment is continuing to contract, a disturbing sign for the vitality of the entire ecosystem
The risk of the gradual decline in flows between market segments remains unchanged over the long-term as long as there is not a more significant resumption in the trend for IPOs in the micro/small cap segment
KEY FINDINGS
1
2
3
4
III. EUROPEAN MARKET STRUCTURE: A FIXATION ON LARGE CAPS!
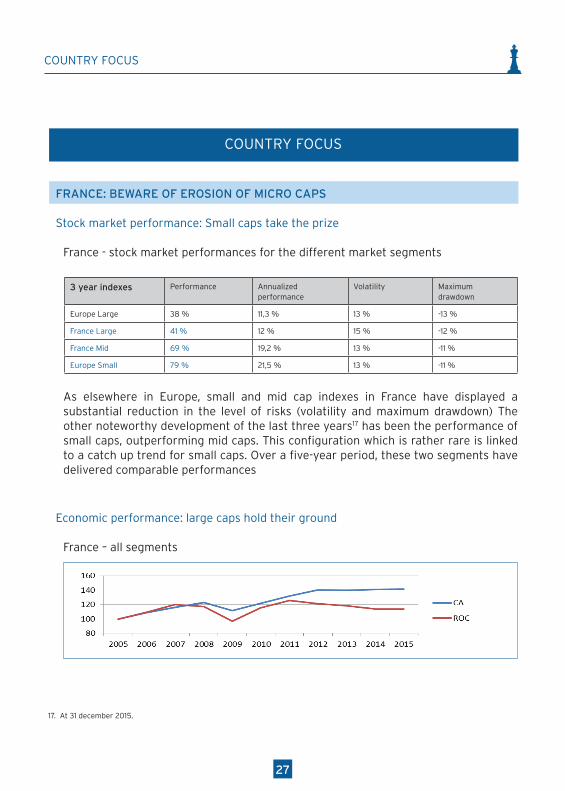
2726
COUNTRY FOCUS
COUNTRY FOCUS
FRANCE: BEWARE OF EROSION OF MICRO CAPS
Stock market performance: Small caps take the prize
France - stock market performances for the different market segments
3 year indexes Performance Annualizedperformance
Volatility Maximumdrawdown
Europe Large 38 % 11,3 % 13 % -13 %
France Large 41 % 12 % 15 % -12 %
France Mid 69 % 19,2 % 13 % -11 %
Europe Small 79 % 21,5 % 13 % -11 %
As elsewhere in Europe, small and mid cap indexes in France have displayed a substantial reduction in the level of risks (volatility and maximum drawdown) The other noteworthy development of the last three years17 has been the performance of small caps, outperforming mid caps. This configuration which is rather rare is linked to a catch up trend for small caps. Over a five-year period, these two segments have delivered comparable performances
Economic performance: large caps hold their ground
France – all segments
France: attention à l’érosion des Micro Performance boursière : la palme aux Small France : performances boursières des différents segments
Indices 3 ans Performance Performance
annualisée Volatilité Maximum
drawdown Large Europe 38% 11,3% 13% -13% Large France 41% 12,0% 15% -12% Mid France 69% 19,2% 13% -11% Small France 79% 21,5% 13% -11%
Comme ailleurs en Europe, les indices Small et Mid de la France font montre d’une forte baisse des niveaux de risque (volatilité, maximum drawdown). L’autre élément notable de ces 3 dernières années1 est la performance des Small, supérieure à celle des Mid. Cette configuration, plutôt rare, est liée à un rattrapage des Small. Sur 5 ans, les performances des deux segments sont équivalentes. Performance économique : les Large en résistance France – tous segments
France – Small
France – Large
1 Au 31 décembre 2015.
Commentaire [LS1]: Expliquer pourquoi ?
17. At 31 december 2015.
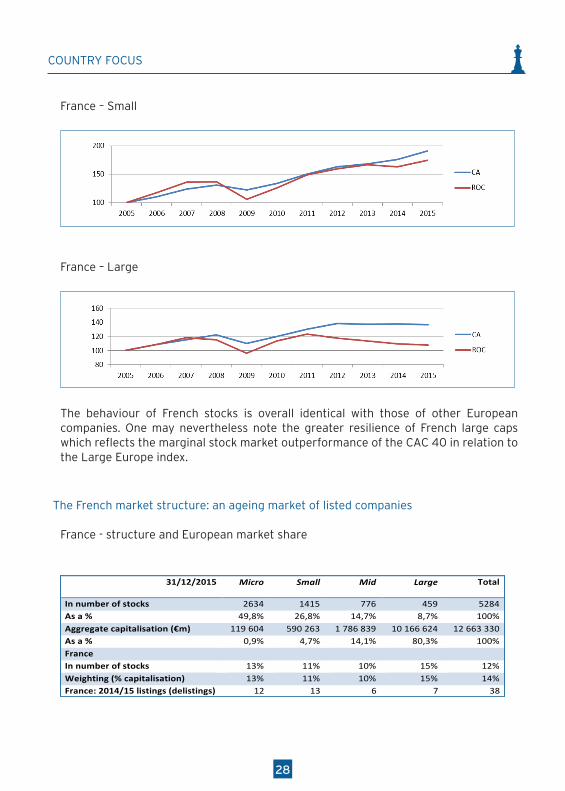
28
France – Small
France: attention à l’érosion des Micro Performance boursière : la palme aux Small France : performances boursières des différents segments
Indices 3 ans Performance Performance
annualisée Volatilité Maximum
drawdown Large Europe 38% 11,3% 13% -13% Large France 41% 12,0% 15% -12% Mid France 69% 19,2% 13% -11% Small France 79% 21,5% 13% -11%
Comme ailleurs en Europe, les indices Small et Mid de la France font montre d’une forte baisse des niveaux de risque (volatilité, maximum drawdown). L’autre élément notable de ces 3 dernières années1 est la performance des Small, supérieure à celle des Mid. Cette configuration, plutôt rare, est liée à un rattrapage des Small. Sur 5 ans, les performances des deux segments sont équivalentes. Performance économique : les Large en résistance France – tous segments
France – Small
France – Large
1 Au 31 décembre 2015.
Commentaire [LS1]: Expliquer pourquoi ?
France – Large
Le comportement des valeurs françaises est globalement identique à celui des autres sociétés européennes. On observe toutefois une meilleure résistance des Larges françaises, qui se traduit par une légère surperformance boursière du CAC 40 par rapport à l’indice Large Europe.
Structure du marché français : le vieillissement de la cote en marche
France : structure et part de marché européenne 31/12/2015 Micro Small Mid Large Total
In number of stocks 2634 1415 776 459 5284 as a % 49,8% 26,8% 14,7% 8,7% 100% Aggregate capitalisation (€m) 119 604 590 263 1 786 839 10 166
624 12 663
330 as a % 0,9% 4,7% 14,1% 80,3% 100% France In number of stocks 13% 11% 10% 15% 12% Weighting (% capitalisation) 13% 11% 10% 15% 14% France: 2014/15 listings (delistings)
12 13 6 7 38
La France conserve son rang et reste positive sur tous les segments de la cote, en 2014-2015, en termes d’entrées et de sorties. En revanche, la baisse du nombre de sociétés comparée au pic de 2007 est de l’ordre de 13%, dont -20% pour les seules Micro.
The behaviour of French stocks is overall identical with those of other European companies. One may nevertheless note the greater resilience of French large caps which reflects the marginal stock market outperformance of the CAC 40 in relation to the Large Europe index.
The French market structure: an ageing market of listed companies
France - structure and European market share
Le comportement des valeurs françaises est globalement identique à celui des autres sociétés
européennes.OnobservetoutefoisunemeilleurerésistancedesLargesfrançaises,quisetraduitparunelégèresurperformanceboursièreduCAC40parrapportàl’indiceLargeEurope.
Structuredumarchéfrançais:levieillissementdelacoteenmarcheFrance:structureetpartdemarchéeuropéenne
31/12/2015 Micro Small Mid Large Total
Innumberofstocks 2634 1415 776 459 5284Asa% 49,8% 26,8% 14,7% 8,7% 100%Aggregatecapitalisation(€m) 119604 590263 1786839 10166624 12663330Asa% 0,9% 4,7% 14,1% 80,3% 100%France Innumberofstocks 13% 11% 10% 15% 12%Weighting(%capitalisation) 13% 11% 10% 15% 14%France:2014/15listings(delistings) 12 13 6 7 38
La France conserve son rang et reste positive sur tous les segments de la cote, en 2014-2015, en
termesd’entrées et de sorties. En revanche, la baissedunombrede sociétés comparée aupic de2007estdel’ordrede13%,dont-20%pourlesseulesMicro.
COUNTRY FOCUS
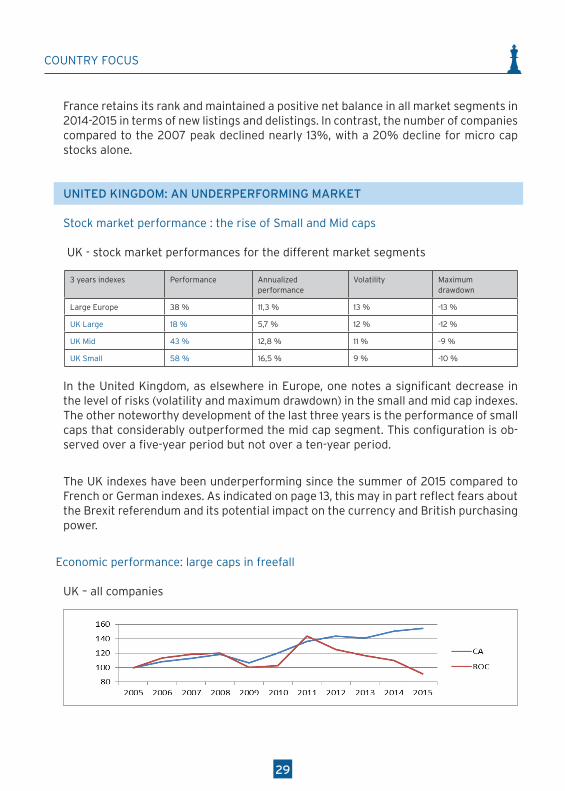
29
France retains its rank and maintained a positive net balance in all market segments in 2014-2015 in terms of new listings and delistings. In contrast, the number of companies compared to the 2007 peak declined nearly 13%, with a 20% decline for micro cap stocks alone.
UNITED KINGDOM: AN UNDERPERFORMING MARKET
Stock market performance : the rise of Small and Mid caps
UK - stock market performances for the different market segments
3 years indexes Performance Annualized performance
Volatility Maximumdrawdown
Large Europe 38 % 11,3 % 13 % -13 %
UK Large 18 % 5,7 % 12 % -12 %
UK Mid 43 % 12,8 % 11 % -9 %
UK Small 58 % 16,5 % 9 % -10 %
In the United Kingdom, as elsewhere in Europe, one notes a significant decrease in the level of risks (volatility and maximum drawdown) in the small and mid cap indexes. The other noteworthy development of the last three years is the performance of small caps that considerably outperformed the mid cap segment. This configuration is ob-served over a five-year period but not over a ten-year period.
The UK indexes have been underperforming since the summer of 2015 compared to French or German indexes. As indicated on page 13, this may in part reflect fears about the Brexit referendum and its potential impact on the currency and British purchasing power.
Economic performance: large caps in freefall
UK – all companies
Le Royaume-Uni : un marché sous-performant Performance boursière : the rise of Small and Mid Royaume-Uni : performances boursières des différents segments
Indices 3 ans Performance Performance
annualisée Volatilité Maximum drawdown
Large Europe 38% 11,3% 13% -13% Large Royaume-Uni 18% 5,7% 12% -12% Mid Royaume-Uni 43% 12,8% 11% -9% Small Royaume-Uni 58% 16,5% 9% -10%
Au Royaume-Uni comme ailleurs en Europe, on remarque une forte baisse des niveaux de risque (volatilité, maximum drawdown) sur les indices Small et Mid. L’autre élément notable sur les 3 dernières années est la performance des Small, bien supérieure à celle des Mid. C’est une configuration que l’on retrouve sur 5 ans mais pas sur 10. Les indices britanniques sous-performent depuis l’été 2015 les autres indices France ou Allemagne. Comme nous l’avons écrit en page XX, l’une des explications est la crainte du referendum sur le Brexit et ses impacts potentiels sur la devise et le pouvoir d’achat des britanniques. Performance économique : les Large en chute libre Royaume-Uni – toutes les sociétés
Royaume-Uni – Small
Royaume-Uni – Large
COUNTRY FOCUS
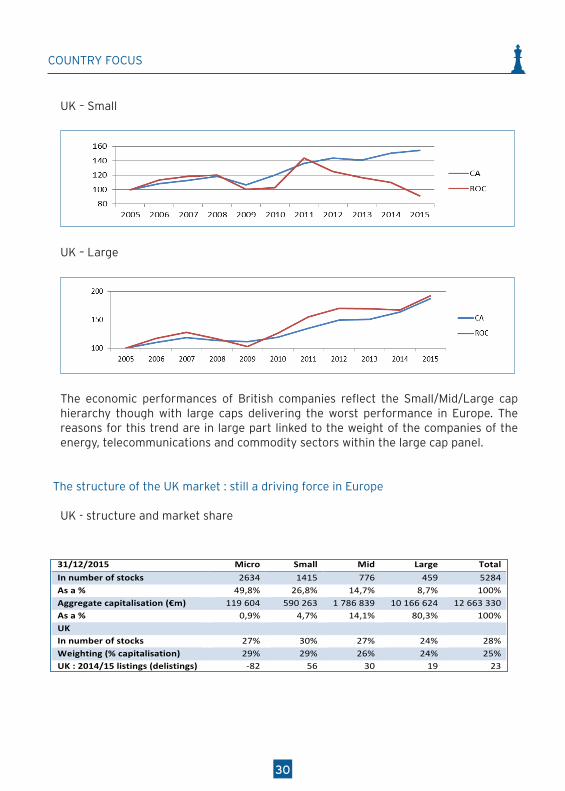
30
UK – Small
Le Royaume-Uni : un marché sous-performant Performance boursière : the rise of Small and Mid Royaume-Uni : performances boursières des différents segments
Indices 3 ans Performance Performance
annualisée Volatilité Maximum drawdown
Large Europe 38% 11,3% 13% -13% Large Royaume-Uni 18% 5,7% 12% -12% Mid Royaume-Uni 43% 12,8% 11% -9% Small Royaume-Uni 58% 16,5% 9% -10%
Au Royaume-Uni comme ailleurs en Europe, on remarque une forte baisse des niveaux de risque (volatilité, maximum drawdown) sur les indices Small et Mid. L’autre élément notable sur les 3 dernières années est la performance des Small, bien supérieure à celle des Mid. C’est une configuration que l’on retrouve sur 5 ans mais pas sur 10. Les indices britanniques sous-performent depuis l’été 2015 les autres indices France ou Allemagne. Comme nous l’avons écrit en page XX, l’une des explications est la crainte du referendum sur le Brexit et ses impacts potentiels sur la devise et le pouvoir d’achat des britanniques. Performance économique : les Large en chute libre Royaume-Uni – toutes les sociétés
Royaume-Uni – Small
Royaume-Uni – Large
UK – Large
Le Royaume-Uni : un marché sous-performant Performance boursière : the rise of Small and Mid Royaume-Uni : performances boursières des différents segments
Indices 3 ans Performance Performance
annualisée Volatilité Maximum drawdown
Large Europe 38% 11,3% 13% -13% Large Royaume-Uni 18% 5,7% 12% -12% Mid Royaume-Uni 43% 12,8% 11% -9% Small Royaume-Uni 58% 16,5% 9% -10%
Au Royaume-Uni comme ailleurs en Europe, on remarque une forte baisse des niveaux de risque (volatilité, maximum drawdown) sur les indices Small et Mid. L’autre élément notable sur les 3 dernières années est la performance des Small, bien supérieure à celle des Mid. C’est une configuration que l’on retrouve sur 5 ans mais pas sur 10. Les indices britanniques sous-performent depuis l’été 2015 les autres indices France ou Allemagne. Comme nous l’avons écrit en page XX, l’une des explications est la crainte du referendum sur le Brexit et ses impacts potentiels sur la devise et le pouvoir d’achat des britanniques. Performance économique : les Large en chute libre Royaume-Uni – toutes les sociétés
Royaume-Uni – Small
Royaume-Uni – Large
The economic performances of British companies reflect the Small/Mid/Large cap hierarchy though with large caps delivering the worst performance in Europe. The reasons for this trend are in large part linked to the weight of the companies of the energy, telecommunications and commodity sectors within the large cap panel.
The structure of the UK market : still a driving force in Europe
UK - structure and market share
OnretrouvedanslesperformanceséconomiquesdessociétésbritanniqueslahiérarchieSmall/Mid/LargemaisavecdesLargequiprésententlapireperformanceenEurope.Lesraisonsde
cetteévolutionsontnotammentàchercherdanslepoidsdesentreprisesd’énergie,detélécommunicationsetdematièrespremièresauseindecepaneldeLarge.
Structuredumarchébritannique:unmoteurtoujoursdynamiquepourl’EuropeRoyaume-Uni:structureetpartdemarchéeuropéenne
31/12/2015 Micro Small Mid Large Total
Innumberofstocks 2634 1415 776 459 5284Asa% 49,8% 26,8% 14,7% 8,7% 100%Aggregatecapitalisation(€m) 119604 590263 1786839 10166624 12663330Asa% 0,9% 4,7% 14,1% 80,3% 100%UK Innumberofstocks 27% 30% 27% 24% 28%Weighting(%capitalisation) 29% 29% 26% 24% 25%UK:2014/15listings(delistings) -82 56 30 19 23
LeRoyaume-UniperddupoidsenEuropedepuisledébutdesannées2000,périodeouelleétaitultradominanteavecprèsde38%departdemarché.Cespartsdemarchéontétéacquisesparles
autrespayseuropéenssachantquelaFranceetl’Allemagneontglobalementconservéleursplaces.Riend’alarmantcependantcarleRoyaume-Uniaunefortecultureboursièreetsondynamismeresteunmoteurpourl’Europe.
COUNTRY FOCUS
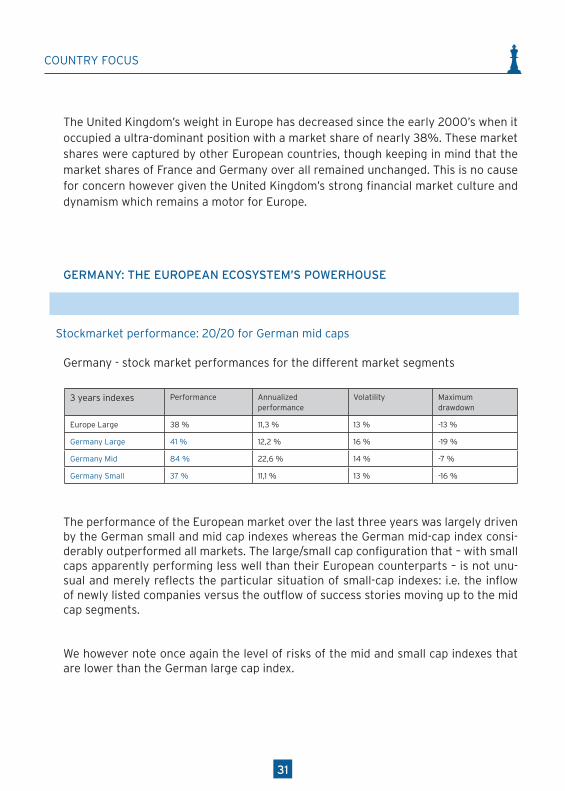
31
The United Kingdom’s weight in Europe has decreased since the early 2000’s when it occupied a ultra-dominant position with a market share of nearly 38%. These market shares were captured by other European countries, though keeping in mind that the market shares of France and Germany over all remained unchanged. This is no cause for concern however given the United Kingdom’s strong financial market culture and dynamism which remains a motor for Europe.
GERMANY: THE EUROPEAN ECOSYSTEM’S POWERHOUSE
Stockmarket performance: 20/20 for German mid caps
Germany - stock market performances for the different market segments
3 years indexes Performance Annualizedperformance
Volatility Maximumdrawdown
Europe Large 38 % 11,3 % 13 % -13 %
Germany Large 41 % 12,2 % 16 % -19 %
Germany Mid 84 % 22,6 % 14 % -7 %
Germany Small 37 % 11,1 % 13 % -16 %
The performance of the European market over the last three years was largely driven by the German small and mid cap indexes whereas the German mid-cap index consi-derably outperformed all markets. The large/small cap configuration that – with small caps apparently performing less well than their European counterparts – is not unu-sual and merely reflects the particular situation of small-cap indexes: i.e. the inflow of newly listed companies versus the outflow of success stories moving up to the mid cap segments.
We however note once again the level of risks of the mid and small cap indexes that are lower than the German large cap index.
COUNTRY FOCUS
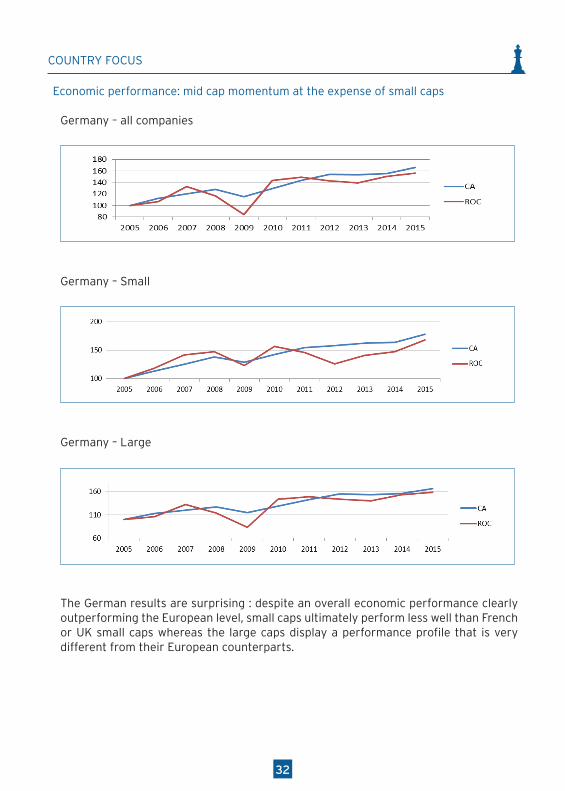
32
Economic performance: mid cap momentum at the expense of small caps
Germany – all companies
L’Allemagne: locomotive de l’écosystème européen Performance boursière : le Mid allemand reçues 20/20 Allemagne : performances boursières des différents segments
Indices 3 ans Performance Performance
annualisée Volatilité Maximum drawdown
Large Europe 38% 11,3% 13% -13% Large Allemagne 41% 12,2% 16% -19% Mid Allemagne 84% 22,6% 14% -7% Small Allemagne 37% 11,1% 13% -16%
Les indices Large et Small allemands ont globalement « fait » la performance du marché européen au cours des 3 dernières années, tandis que l’indice Mid allemand a tout pulvérisé. La configuration Large / Small – avec des Small qui performent apparemment bien moins bien que leurs consœurs européennes – n’est pas rare et s’explique simplement par la situation spéciale des indices Small : ils absorbent les nouveaux entrants et perdent leurs success stories qui passent en Mid. Notons une nouvelle fois le niveau de risque des indices Mid et Small qui sont inférieurs à celui de l’indice Large allemand. Performance économique : la dynamique des Mid dessert les Small Allemagne – toutes les sociétés
Allemagne – Small
Allemagne – Large
Germany – Small
L’Allemagne: locomotive de l’écosystème européen Performance boursière : le Mid allemand reçues 20/20 Allemagne : performances boursières des différents segments
Indices 3 ans Performance Performance
annualisée Volatilité Maximum drawdown
Large Europe 38% 11,3% 13% -13% Large Allemagne 41% 12,2% 16% -19% Mid Allemagne 84% 22,6% 14% -7% Small Allemagne 37% 11,1% 13% -16%
Les indices Large et Small allemands ont globalement « fait » la performance du marché européen au cours des 3 dernières années, tandis que l’indice Mid allemand a tout pulvérisé. La configuration Large / Small – avec des Small qui performent apparemment bien moins bien que leurs consœurs européennes – n’est pas rare et s’explique simplement par la situation spéciale des indices Small : ils absorbent les nouveaux entrants et perdent leurs success stories qui passent en Mid. Notons une nouvelle fois le niveau de risque des indices Mid et Small qui sont inférieurs à celui de l’indice Large allemand. Performance économique : la dynamique des Mid dessert les Small Allemagne – toutes les sociétés
Allemagne – Small
Allemagne – Large
Germany – Large
Les résultats sur l’Allemagne sont étonnants : malgré une performance économique globale clairement au dessus du niveau européen, les Small souffrent finalement plus que les Small françaises ou anglaises tandis que les Large qui font apparaître un profil de performance très différentes de ses consœurs européennes. Structure : l’assèchement des Micro Allemagne : structure et part de marché européenne
31/12/2015 Micro Small Mid Large Total Nombre de valeurs 2634 1415 776 459 5284 en % 49,8% 26,8% 14,7% 8,7% 100% Capitalisation agrégée (M€) 119 604 590 263 1 786 839 10 166
624 12 663
330 en % 0,9% 4,7% 14,1% 80,3% 100% Allemagne En nombre de valeurs 12% 10% 10% 12% 11% En poids (% capitalisation) 13% 9% 10% 14% 13% Allemagne : entrées - sorties 2014/15
-83 10 8 10 -55
La forte baisse du nombre de Micro absorbe une activité globalement en ligne sur les autres segments. L’Allemagne conserve sa part de marché en Europe si on regarde les poids mais en nombre de sociétés cotées la tendance n’est pas bonne.
The German results are surprising : despite an overall economic performance clearly outperforming the European level, small caps ultimately perform less well than French or UK small caps whereas the large caps display a performance profile that is very different from their European counterparts.
COUNTRY FOCUS
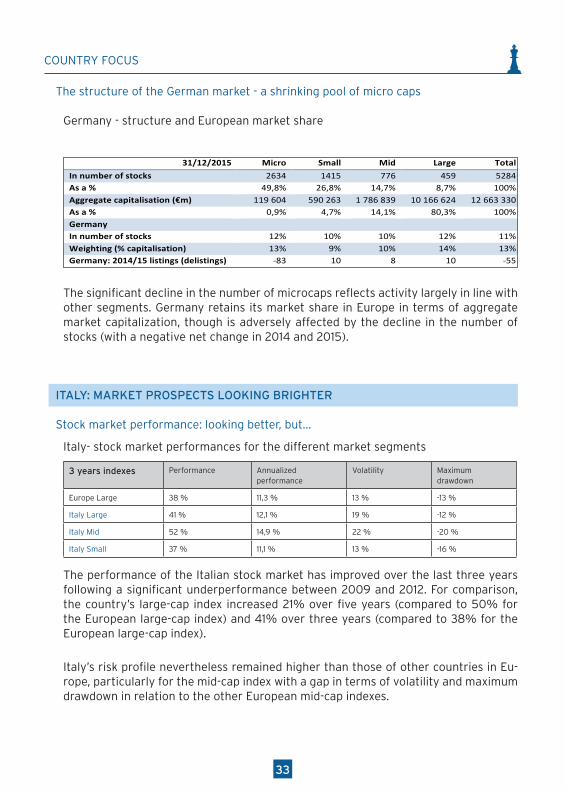
33
The structure of the German market - a shrinking pool of micro caps
Germany - structure and European market share
Lesrésultatssurl’Allemagnesontétonnants:malgréuneperformanceéconomiqueglobale
clairementaudessusduniveaueuropéen,lesSmallsouffrentfinalementplusquelesSmallfrançaisesouanglaisestandisquelesLargequifontapparaîtreunprofildeperformancetrèsdifférentesdesesconsœurseuropéennes.
Structure:l’assèchementdesMicro
Allemagne:structureetpartdemarchéeuropéenne
31/12/2015 Micro Small Mid Large Total
Innumberofstocks 2634 1415 776 459 5284Asa% 49,8% 26,8% 14,7% 8,7% 100%Aggregatecapitalisation(€m) 119604 590263 1786839 10166624 12663330Asa% 0,9% 4,7% 14,1% 80,3% 100%Germany Innumberofstocks 12% 10% 10% 12% 11%Weighting(%capitalisation) 13% 9% 10% 14% 13%Germany:2014/15listings(delistings) -83 10 8 10 -55
LafortebaissedunombredeMicroabsorbeuneactivitéglobalementenlignesurlesautres
segments.L’AllemagneconservesapartdemarchéenEuropesionregardelespoidsmaisennombredesociétéscotéeslatendancen’estpasbonne.
The significant decline in the number of microcaps reflects activity largely in line with other segments. Germany retains its market share in Europe in terms of aggregate market capitalization, though is adversely affected by the decline in the number of stocks (with a negative net change in 2014 and 2015).
ITALY: MARKET PROSPECTS LOOKING BRIGHTER
Stock market performance: looking better, but…
Italy- stock market performances for the different market segments
3 years indexes Performance Annualized performance
Volatility Maximumdrawdown
Europe Large 38 % 11,3 % 13 % -13 %
Italy Large 41 % 12,1 % 19 % -12 %
Italy Mid 52 % 14,9 % 22 % -20 %
Italy Small 37 % 11,1 % 13 % -16 %
The performance of the Italian stock market has improved over the last three years following a significant underperformance between 2009 and 2012. For comparison, the country’s large-cap index increased 21% over five years (compared to 50% for the European large-cap index) and 41% over three years (compared to 38% for the European large-cap index).
Italy’s risk profile nevertheless remained higher than those of other countries in Eu-rope, particularly for the mid-cap index with a gap in terms of volatility and maximum drawdown in relation to the other European mid-cap indexes.
COUNTRY FOCUS
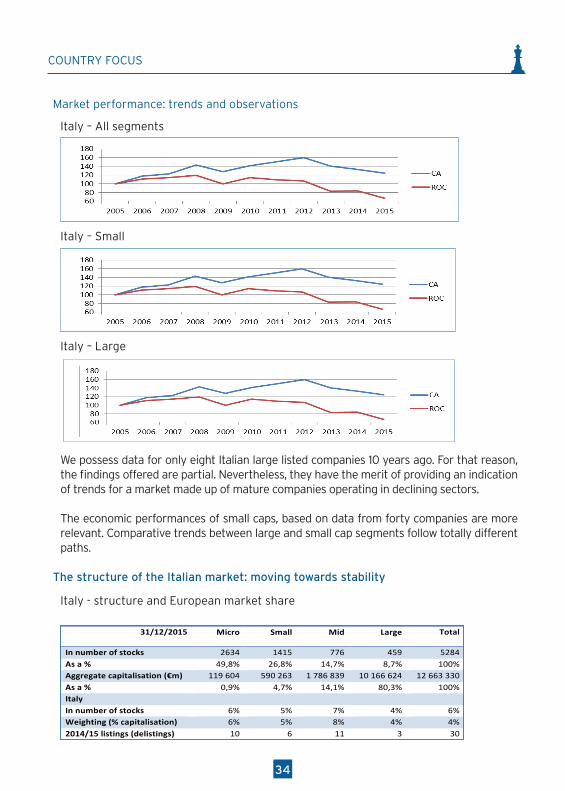
34
Market performance: trends and observations
Italy – All segments
Italie : la performance boursière reprend des couleurs Performance boursière : du mieux, mais… Italie : performances boursières sur les différents segments
Indice 3 ans Performance Performance
annualisée Volatilité Maximum drawdown
Large Europe 38% 11,3% 13% -13% Large Italie 41% 12,1% 19% -12% Mid Italie 52% 14,9% 22% -20% Small Italie 37% 11,1% 13% -16%
La performance du marché italien a repris des couleurs au cours des 3 dernières années après une forte contre-performance entre 2009 et 2012. Pour mémoire, l’indice Large du pays progresse de 21% sur 5 ans (contre 50% pour l’indice Large européen) et de 41% sur 3 ans (contre 38% pour l’indice Large européen). L’échelle de risque de l’Italie reste cependant supérieure à celle constatée ailleurs en Europe, tout particulièrement pour l’indice Mid dont la volatilité et le maximum drawdown s’écartent des autres indices Mid en Europe. Performance économique : tendances et observations Italie – tous les segments
Italie – Small
Italie – Large
Italy – Small
Italie : la performance boursière reprend des couleurs Performance boursière : du mieux, mais… Italie : performances boursières sur les différents segments
Indice 3 ans Performance Performance
annualisée Volatilité Maximum drawdown
Large Europe 38% 11,3% 13% -13% Large Italie 41% 12,1% 19% -12% Mid Italie 52% 14,9% 22% -20% Small Italie 37% 11,1% 13% -16%
La performance du marché italien a repris des couleurs au cours des 3 dernières années après une forte contre-performance entre 2009 et 2012. Pour mémoire, l’indice Large du pays progresse de 21% sur 5 ans (contre 50% pour l’indice Large européen) et de 41% sur 3 ans (contre 38% pour l’indice Large européen). L’échelle de risque de l’Italie reste cependant supérieure à celle constatée ailleurs en Europe, tout particulièrement pour l’indice Mid dont la volatilité et le maximum drawdown s’écartent des autres indices Mid en Europe. Performance économique : tendances et observations Italie – tous les segments
Italie – Small
Italie – Large
Italy – Large
Italie : la performance boursière reprend des couleurs Performance boursière : du mieux, mais… Italie : performances boursières sur les différents segments
Indice 3 ans Performance Performance
annualisée Volatilité Maximum drawdown
Large Europe 38% 11,3% 13% -13% Large Italie 41% 12,1% 19% -12% Mid Italie 52% 14,9% 22% -20% Small Italie 37% 11,1% 13% -16%
La performance du marché italien a repris des couleurs au cours des 3 dernières années après une forte contre-performance entre 2009 et 2012. Pour mémoire, l’indice Large du pays progresse de 21% sur 5 ans (contre 50% pour l’indice Large européen) et de 41% sur 3 ans (contre 38% pour l’indice Large européen). L’échelle de risque de l’Italie reste cependant supérieure à celle constatée ailleurs en Europe, tout particulièrement pour l’indice Mid dont la volatilité et le maximum drawdown s’écartent des autres indices Mid en Europe. Performance économique : tendances et observations Italie – tous les segments
Italie – Small
Italie – Large
We possess data for only eight Italian large listed companies 10 years ago. For that reason, the findings offered are partial. Nevertheless, they have the merit of providing an indication of trends for a market made up of mature companies operating in declining sectors.
The economic performances of small caps, based on data from forty companies are more relevant. Comparative trends between large and small cap segments follow totally different paths.
The structure of the Italian market: moving towards stability
Italy - structure and European market share
Nousnedisposonsdedonnéesquepour8Largeitaliennescotéesilya10ans.Lesenseignements
livrésnesontdoncquepartiels. Ilsontnéanmoins leméritederévéler les tendancesd’unmarchécomposédesociétésmatures,intervenantsurdessecteursdéclinants.
Les performances économiques des Small, établies sur la base des données d’une quarantained’entreprises, sont plus pertinentes. Les tendances comparées entre les segments Large et Smallprennentdescheminstotalementopposés.
Structuredumarchéitalien:lastabilitéaurendez-vous
Italie:structureetpartdemarchéeuropéenne
31/12/2015 Micro Small Mid Large Total
Innumberofstocks 2634 1415 776 459 5284Asa% 49,8% 26,8% 14,7% 8,7% 100%Aggregatecapitalisation(€m) 119604 590263 1786839 10166624 12663330Asa% 0,9% 4,7% 14,1% 80,3% 100%Italy Innumberofstocks 6% 5% 7% 4% 6%Weighting(%capitalisation) 6% 5% 8% 4% 4%2014/15listings(delistings) 10 6 11 3 30
Unetrentainedesociétésontnourrilacotelocaleen2014et2015.Lapartdemarchéitalienneresteainsistablesurlapériode2013-2015.
Lesautrespaysd’EuropeEspagne:dejeunespoussesprometteuses
COUNTRY FOCUS
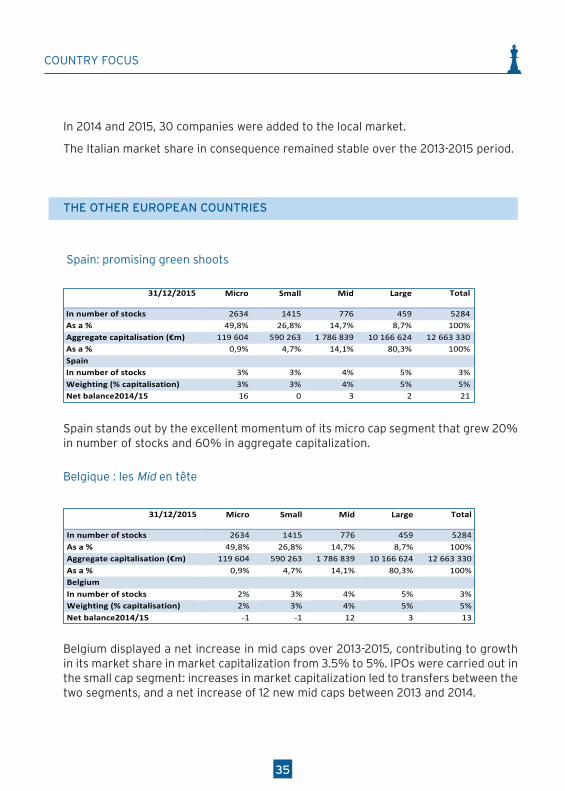
35
In 2014 and 2015, 30 companies were added to the local market.
The Italian market share in consequence remained stable over the 2013-2015 period.
THE OTHER EUROPEAN COUNTRIES
Spain: promising green shoots
31/12/2015 Micro Small Mid Large Total
Innumberofstocks 2634 1415 776 459 5284Asa% 49,8% 26,8% 14,7% 8,7% 100%Aggregatecapitalisation(€m) 119604 590263 1786839 10166624 12663330Asa% 0,9% 4,7% 14,1% 80,3% 100%Spain Innumberofstocks 3% 3% 4% 5% 3%Weighting(%capitalisation) 3% 3% 4% 5% 5%Netbalance2014/15 16 0 3 2 21
L’EspagnesedistingueparlabelledynamiquedesonsegmentMicro,quiprogressede20%en
nombreetdeplusde60%encapitalisationagrégée.Belgique:lesMidentête
31/12/2015 Micro Small Mid Large Total
Innumberofstocks 2634 1415 776 459 5284Asa% 49,8% 26,8% 14,7% 8,7% 100%Aggregatecapitalisation(€m) 119604 590263 1786839 10166624 12663330Asa% 0,9% 4,7% 14,1% 80,3% 100%Belgium Innumberofstocks 2% 3% 4% 5% 3%Weighting(%capitalisation) 2% 3% 4% 5% 5%Netbalance2014/15 -1 -1 12 3 13
LaBelgiqueafficheunenetteprogressiondesMidsurlapériode2013-2015,luipermettantdefaireprogressersapartdemarchéencapitalisationboursièrede3,5à5%.Lesintroductionsenbourseont
été réaliséespardesSmall: laprogressiondescapitalisationsagénéréun transfertentre lesdeuxsegments,ainsiqu’ununsoldenetde12nouvellesMidentre2013et2014.
Spain stands out by the excellent momentum of its micro cap segment that grew 20% in number of stocks and 60% in aggregate capitalization.
Belgique : les Mid en tête
31/12/2015 Micro Small Mid Large Total
Innumberofstocks 2634 1415 776 459 5284Asa% 49,8% 26,8% 14,7% 8,7% 100%Aggregatecapitalisation(€m) 119604 590263 1786839 10166624 12663330Asa% 0,9% 4,7% 14,1% 80,3% 100%Spain Innumberofstocks 3% 3% 4% 5% 3%Weighting(%capitalisation) 3% 3% 4% 5% 5%Netbalance2014/15 16 0 3 2 21
L’EspagnesedistingueparlabelledynamiquedesonsegmentMicro,quiprogressede20%en
nombreetdeplusde60%encapitalisationagrégée.Belgique:lesMidentête
31/12/2015 Micro Small Mid Large Total
Innumberofstocks 2634 1415 776 459 5284Asa% 49,8% 26,8% 14,7% 8,7% 100%Aggregatecapitalisation(€m) 119604 590263 1786839 10166624 12663330Asa% 0,9% 4,7% 14,1% 80,3% 100%Belgium Innumberofstocks 2% 3% 4% 5% 3%Weighting(%capitalisation) 2% 3% 4% 5% 5%Netbalance2014/15 -1 -1 12 3 13
LaBelgiqueafficheunenetteprogressiondesMidsurlapériode2013-2015,luipermettantdefaireprogressersapartdemarchéencapitalisationboursièrede3,5à5%.Lesintroductionsenbourseont
été réaliséespardesSmall: laprogressiondescapitalisationsagénéréun transfertentre lesdeuxsegments,ainsiqu’ununsoldenetde12nouvellesMidentre2013et2014.
Belgium displayed a net increase in mid caps over 2013-2015, contributing to growth in its market share in market capitalization from 3.5% to 5%. IPOs were carried out in the small cap segment: increases in market capitalization led to transfers between the two segments, and a net increase of 12 new mid caps between 2013 and 2014.
COUNTRY FOCUS
CONCLUSIONS AND PROPOSALS
The 2016 European small and mid cap overview confirms overall the trends highlighted in last year’s study, with the addition of several new striking points.
• The continuing domination of small and mid caps in terms of economic and stock market performances with, in addition, an alignment in risk levels (volatility/maximum drawdown) which a priori represents a historical precedent
• The historic peak of European listed large caps in number of stock and volume. Profiting from the continuing inflow from the mid cap segment, itself supplied by IPOs in the early 2000s, it in consequence surpassed the last peak of 2007
• The haemorrhaging in the number of listed companies has been stemmed with a marginal rebound after 7 years of decline, with the exception of the micro cap segment, the fertile seedbed for the ecosystem, is continuing to subside
The market is in consequence continuing its ageing process. This is characterized in the short-term by an increased percentage of mid and large caps and the contraction of the micro and small cap segments setting the stage in the long-term for a contraction of the overall market if these trends persist.
The mechanism of communicating vessels between the different segments, based on the principle of ascending flows which guarantees the market’s equilibrium and future, depends on the amplitude of the base comprised of smaller cap stocks. The economic growth of micro, small and mid-cap stocks contribute to the overall market’s renewal. The larger the base, the greater the number of entrepreneurial success stories. In light of these statistics, estimates for their number is promising: at the scale of our sample, this would concern 20% to 25% of the companies within a 10-year time frame. Today however this principle is being severely tested.
CONCLUSIONS AND PROPOSALS
36
373736
CONCLUSIONS AND PROPOSALS
However, the stakes are high. The pyramid structure of the financial market in terms of number of listed stocks must be maintained to ensure a renewal of market leaders. The large caps guarantee the global attractiveness of the financial market, finance the infrastructure and contribute to the efficient operations of the market. Accordingly, the very large caps account for 7% of the total, 80% of market capitalization but also and above all 85% to 90% of trading volume. The leaders create wealth which benefits all market stakeholders. Brokerage companies, for example, provide essential services to companies to raise capital and to asset management companies to manage the savings of individuals.
Understanding these mechanisms is essential for developing a favourable environment for this European dynamic. The apparent tendency of the regulator to partition flows by segment has already had negative consequences: in time, it creates a risk of depleting resources that are already low for financial analysis allocated to the most neglected segments, namely the micro and small caps. Continuing to cover these small and mid caps and IPOs is nevertheless essential to the long-term renewal of the richest segment of large caps.
This data also would appear to show that listing shares on the market provides a growth accelerator to growth for companies, facilitating mergers and acquisitions if one considers the number of companies that delist their shares. The demands imposed in terms of transparency, governance and financial discipline are often highlighted as good reasons not to be listed, but are in reality, necessary requirements for progress, especially for smaller companies. These requirements lay the solid foundations for sound long-term development. It is crucial to attract these entrepreneurs. At the same time, all stakeholders at the European level need to consider every conceivable measure to reduce the overall listing costs without diminishing the transparency that is essential for investors.
A few concrete suggestions— already proposed in last year’s study — for creating a positive environment over the long-term for small and mid caps:
• Stabilizing regulations streamlining the burdens and requirements imposed on small and mid caps by recognizing their specific nature, and requiring an annual contract with a brokerage firm for companies without analyst coverage.
• Measuring upstream the impact of a regulation on the economic models of the parties concerned
• Create more favourable conditions for going public, by streamlining regulatory requirements for the IPO phase
38
• More systematically encourage the flow of European savings into micro and small cap asset classes, either by developing a specific pan-European regulatory and tax framework for micro and small cap funds or easing constraints imposed on insurance companies on the use of such assets
• Create a long-term European retirement savings vehicle subject to harmonized taxation conditions to promote savings in small and mid cap stocks
• For asset management companies, create investment funds better adapted to the liquidity profile of these securities and the complexity of their universes. For example introduce different liquidity clauses to allow for long-term investments as with non-listed vehicle
• Create an incentive comparable to the research tax credit at the European level for brokerage firms allocating research analysts to cover the universe of small and mid caps
CONCLUSIONS AND PROPOSALS
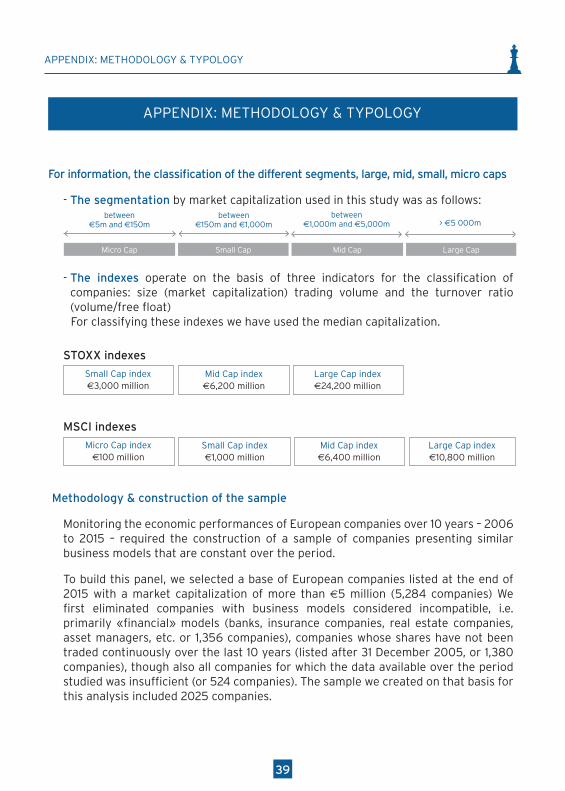
39
APPENDIX: METHODOLOGY & TYPOLOGY
For information, the classification of the different segments, large, mid, small, micro caps
- The segmentation by market capitalization used in this study was as follows:between
€150m and €1,000m> <>
between €5m and €150m < > < > €5 00Om> <
Small CapMicro Cap Mid Cap Large Cap
- The indexes operate on the basis of three indicators for the classification of companies: size (market capitalization) trading volume and the turnover ratio (volume/free float)
For classifying these indexes we have used the median capitalization.
STOXX indexes
Small Cap index€3,000 million
Mid Cap index€6,200 million
Large Cap index€24,200 million
MSCI indexes
Micro Cap index€100 million
Small Cap index€1,000 million
Mid Cap index€6,400 million
Large Cap index€10,800 million
Methodology & construction of the sample
Monitoring the economic performances of European companies over 10 years – 2006 to 2015 – required the construction of a sample of companies presenting similar business models that are constant over the period.
To build this panel, we selected a base of European companies listed at the end of 2015 with a market capitalization of more than €5 million (5,284 companies) We first eliminated companies with business models considered incompatible, i.e. primarily «financial» models (banks, insurance companies, real estate companies, asset managers, etc. or 1,356 companies), companies whose shares have not been traded continuously over the last 10 years (listed after 31 December 2005, or 1,380 companies), though also all companies for which the data available over the period studied was insufficient (or 524 companies). The sample we created on that basis for this analysis included 2025 companies.
APPENDIX: METHODOLOGY & TYPOLOGY
between €1,000m and €5,000m
40
This study was produced by La Financière de ’Echiquier and the MiddleNext Research Institute
Research coordinator: Gaël Faijean, portfolio manager, in charge of quantitative analysis at LFDE
About La Financière de l’Echiquier – www.lfde.en
Created in 1991, La Financière de l’Echiquier is one of France’s leading independent asset management companies with €8 billion in assets under management and a team of 104 employees. LFDE is wholly-owned by its management and employees. Its business: managing savings and financial investments for retail customers, wealth management advisors and institutional customers.
About MiddleNext Research Institutewww.middlenext.com
MiddleNext is the independent French association representing listed SMEs and midcaps. MiddleNext was founded in 1987 and represents and defends the interests of small and mid caps, assists listed companies through its training institute and contributes to the development of knowledge about mid caps through its research institute.
MiddleNext co-chairs the Smaller Issuers Committee of European Issuers, the leading European association promoting the interests of companies listed on stock exchanges. European Issuers is present in 15 countries and represents over 9,200 listed companies with market capitalisation of some €8,500 billion. The president of of MiddleNext is Guillaume Robin and its General Manager is Caroline Weber. It is headed by a Board comprising 12 directors of listed companies. It is financed by directors of mid cap companies.