Embed Size (px)
Citation preview
The 2016-2017 Economic Impact of theDelaware State Park SystemFull Report
Copyright © 2017 Rockport Analytics, LLC. All Rights Reserved. 2
Table of Contents
• The Company: Rockport Analytics…………….……………………………….…..….. Page 3
• Economic Impact Study Definitions…………….…………………………........…..…. Page 4
• Economic Impact Headlines……………................................................................. Page 5
• DSP System Visitation Metrics……………………………………………..……..……. Page 7
• DSP System Economic Impact Metrics …………………………………...…….…… Page 14
• DSP Impact in Perspective………………………………………...….…….…….……. Page 21
• Visitor Performance & Impact of the Camping Parks……………………….....……... Page 22
– Cape Henlopen State Park…………………………………………….….…....… Page 23
– Delaware Seashore State Park….……………….……………………..………… Page 30
– Killens Pond State Park…………………………………………………………… Page 37
– Lums Pond State Park………………………………………………….......…..… Page 44
– Trap Pond State Park……………………………………………..……….…….… Page 51
• Methodology…………………………………………………………………...……….... Page 58
Copyright © 2017 Rockport Analytics, LLC. All Rights Reserved. 3
Background & MethodologyStudy OverviewThe 2016/2017 economic impact of Delaware State Parks was commissioned by Delaware Division of Parks and Recreation. This report covers both the Division’s 2016 & 2017 fiscal years and the analysis seeks to translate the contribution made by main purpose park visitors to Delaware’s GDP, jobs, wages, and tax receipts. The research was conducted by Rockport Analytics, an independent market research & consulting company, using a time-tested approach that has been applied to many events, attractions and destinations across the United States. The goal of the study was to measure and analyze the full economic contribution that park visitors make to the Delaware economy. The Delaware Division of Parks and Recreation would also like to extend special thanks to the Delaware Office of Tourism Development for their support and partnership in conducting this study.
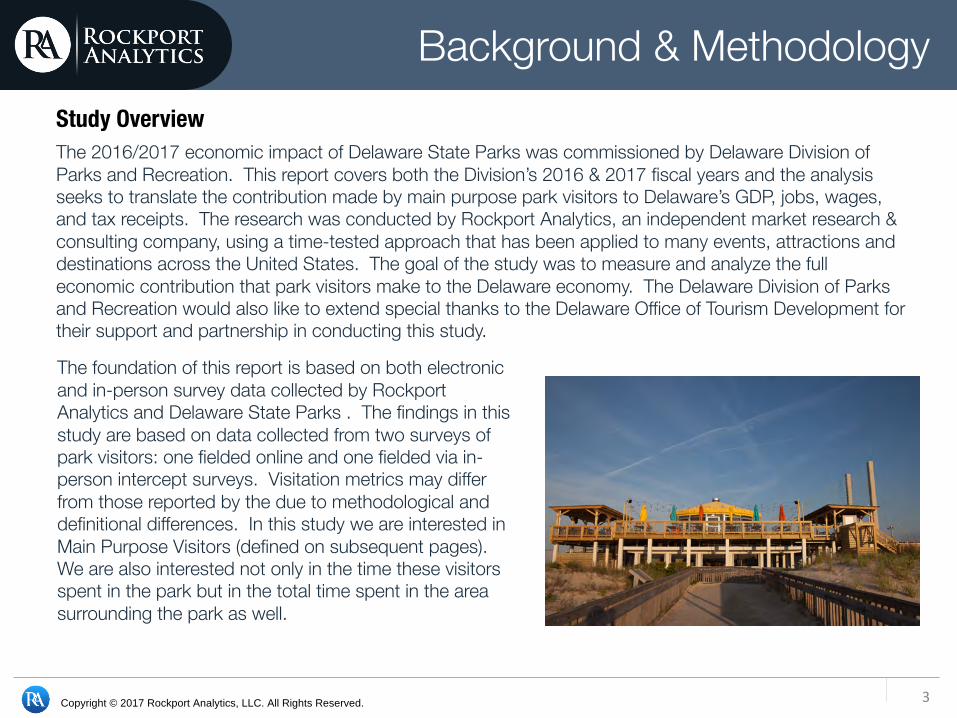
The foundation of this report is based on both electronic and in-person survey data collected by Rockport Analytics and Delaware State Parks . The findings in this study are based on data collected from two surveys of park visitors: one fielded online and one fielded via in-person intercept surveys. Visitation metrics may differ from those reported by the due to methodological and definitional differences. In this study we are interested in Main Purpose Visitors (defined on subsequent pages). We are also interested not only in the time these visitors spent in the park but in the total time spent in the area surrounding the park as well.
Copyright © 2017 Rockport Analytics, LLC. All Rights Reserved.
Economic Impact Studies (EIS) seek to estimate the incremental benefits to the state and local economies of an attraction, event, public investment, or change in policy. The resulting net increase/decrease in jobs, wages, taxes and GDP can help to determine the optimal level of public investment in an activity. • The key is the level of net incremental spending directly attributable to the DSP system.• Direct and ancillary Delaware resident spending surrounding the DSP must not be
included - the assumption is that those monies would be spent elsewhere in the Delaware economy if the DSP did not exist.
• Delaware residents do benefit from the DSP. The benefits are about subjective choices among education/attraction alternatives rather than the creation of net new economic activity.
• Main Purpose Visitor - direct and ancillary spending by visitors to/within Delaware whose primary purpose is to visit a Delaware State Park is clearly net new and attributable to the DSP.
• DSP’s operational spending is net new and attributable as defined by labor and material purchases that are direct injections into the state and local economies of Delaware.
• DSP’s capital spending is, likewise, a direct injection, one with potentially longer-lasting benefits. This type of spending typically involves construction (one-time benefits) and expansion/improvements to DSP’s facilities and offerings (continuing benefits).
4
Economic Impact Studies (EIS) Definitions
Copyright © 2017 Rockport Analytics, LLC. All Rights Reserved. 5
Delaware State Parks Economic Impact Headlines
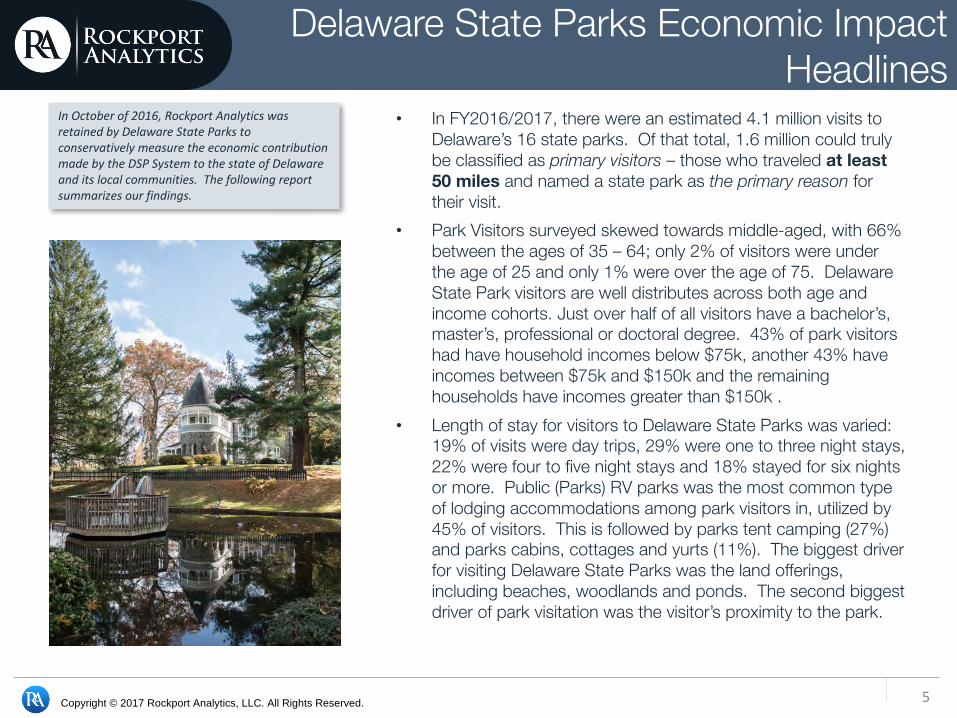
• In FY2016/2017, there were an estimated 4.1 million visits to Delaware’s 16 state parks. Of that total, 1.6 million could truly be classified as primary visitors – those who traveled at least 50 miles and named a state park as the primary reason for their visit.
• Park Visitors surveyed skewed towards middle-aged, with 66% between the ages of 35 – 64; only 2% of visitors were under the age of 25 and only 1% were over the age of 75. Delaware State Park visitors are well distributes across both age and income cohorts. Just over half of all visitors have a bachelor’s, master’s, professional or doctoral degree. 43% of park visitors had have household incomes below $75k, another 43% have incomes between $75k and $150k and the remaining households have incomes greater than $150k .
• Length of stay for visitors to Delaware State Parks was varied: 19% of visits were day trips, 29% were one to three night stays, 22% were four to five night stays and 18% stayed for six nights or more. Public (Parks) RV parks was the most common type of lodging accommodations among park visitors in, utilized by 45% of visitors. This is followed by parks tent camping (27%) and parks cabins, cottages and yurts (11%). The biggest driver for visiting Delaware State Parks was the land offerings, including beaches, woodlands and ponds. The second biggest driver of park visitation was the visitor’s proximity to the park.
InOctoberof2016,RockportAnalyticswasretainedbyDelawareStateParkstoconservativelymeasuretheeconomiccontributionmadebytheDSPSystemtothestateofDelawareanditslocalcommunities.Thefollowingreportsummarizesourfindings.
Copyright © 2017 Rockport Analytics, LLC. All Rights Reserved. 6
Delaware State Parks Economic Impact Headlines
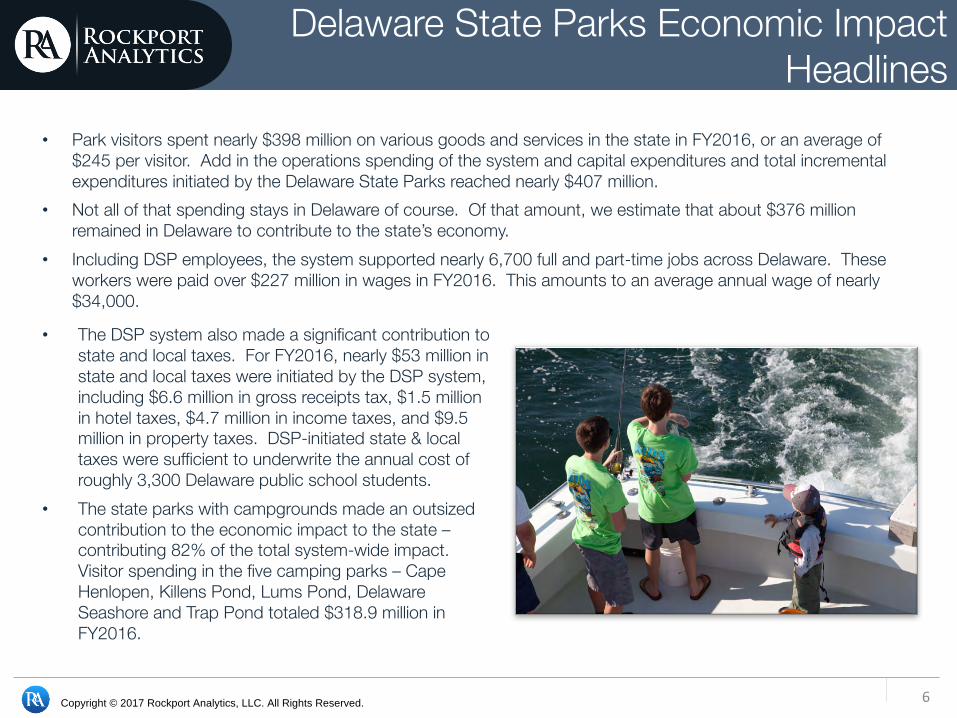
• The DSP system also made a significant contribution to state and local taxes. For FY2016, nearly $53 million in state and local taxes were initiated by the DSP system, including $6.6 million in gross receipts tax, $1.5 million in hotel taxes, $4.7 million in income taxes, and $9.5 million in property taxes. DSP-initiated state & local taxes were sufficient to underwrite the annual cost of roughly 3,300 Delaware public school students.
• The state parks with campgrounds made an outsized contribution to the economic impact to the state –contributing 82% of the total system-wide impact. Visitor spending in the five camping parks – Cape Henlopen, Killens Pond, Lums Pond, Delaware Seashore and Trap Pond totaled $318.9 million in FY2016.
greater than $150k
• Park visitors spent nearly $398 million on various goods and services in the state in FY2016, or an average of $245 per visitor. Add in the operations spending of the system and capital expenditures and total incremental expenditures initiated by the Delaware State Parks reached nearly $407 million.
• Not all of that spending stays in Delaware of course. Of that amount, we estimate that about $376 million remained in Delaware to contribute to the state’s economy.
• Including DSP employees, the system supported nearly 6,700 full and part-time jobs across Delaware. These workers were paid over $227 million in wages in FY2016. This amounts to an average annual wage of nearly $34,000.
7
Delaware State Park SystemFY 2016/2017 Visitor Demographics, Visitation & Spending
Copyright © 2017 Rockport Analytics, LLC. All Rights Reserved. 8
From Attendance to Main Purpose Visitors
DelawareStateParkAttendanceProgressionAllDSP Camping Parks1 Day Use Parks2
Total Attendance 4.1 million 3.0 million 1.1 millionAll Visitors* 2.3 million 2.0 million 284,000
Main Purpose Visitors** 1.6 million 1.4 million 194,000 Residents 1.8 million 1 million 861,000
• Avisitorisanattendeewhohaseitherstayedovernightortraveledatleast50milesone-waytovisita DelawareStatePark• **AMainPurposeVisitor isavisitorwhohasidentified aDelawareStateParksiteastheprincipalreasonfortheirvisittotherespectivedestinationSource:DelawareDivisionofParksandRecreation, DKShifflet,UNWTO,RockportAnalytics
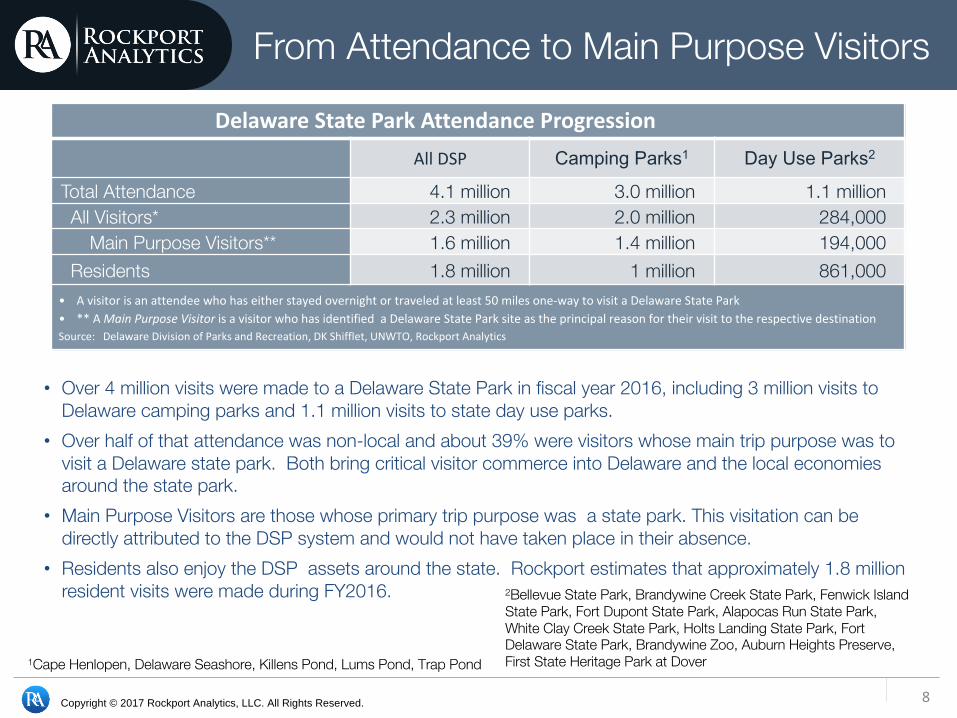
• Over 4 million visits were made to a Delaware State Park in fiscal year 2016, including 3 million visits to Delaware camping parks and 1.1 million visits to state day use parks.
• Over half of that attendance was non-local and about 39% were visitors whose main trip purpose was to visit a Delaware state park. Both bring critical visitor commerce into Delaware and the local economies around the state park.
• Main Purpose Visitors are those whose primary trip purpose was a state park. This visitation can be directly attributed to the DSP system and would not have taken place in their absence.
• Residents also enjoy the DSP assets around the state. Rockport estimates that approximately 1.8 million resident visits were made during FY2016.
1Cape Henlopen, Delaware Seashore, Killens Pond, Lums Pond, Trap Pond
2Bellevue State Park, Brandywine Creek State Park, Fenwick Island State Park, Fort Dupont State Park, Alapocas Run State Park, White Clay Creek State Park, Holts Landing State Park, Fort Delaware State Park, Brandywine Zoo, Auburn Heights Preserve, First State Heritage Park at Dover
Copyright © 2017 Rockport Analytics, LLC. All Rights Reserved. 9
DSP FY 2016/2017 Visitor Demographics
2%
11%
19%
25% 23%
19%
1% 0%
5%
10%
15%
20%
25%
30%
Under 25 25 - 34 35 - 44 45 – 54 55 - 64 55 - 74 75+
Perc
enta
ge o
f DSP
Visi
tors
Age of Survey Participants
17% 18% 20%
11%
26% 25%
0% 5%
10% 15% 20% 25% 30%
Perc
enta
ge o
f DSP
Visi
tors
Educational Attainment of DSP Visitors
4% 6% 11%
22% 19%
24%
7% 5%
0% 5%
10% 15% 20% 25% 30%
Perc
enta
ge o
f DSP
Visi
tors
Household Income of DSP Visitors
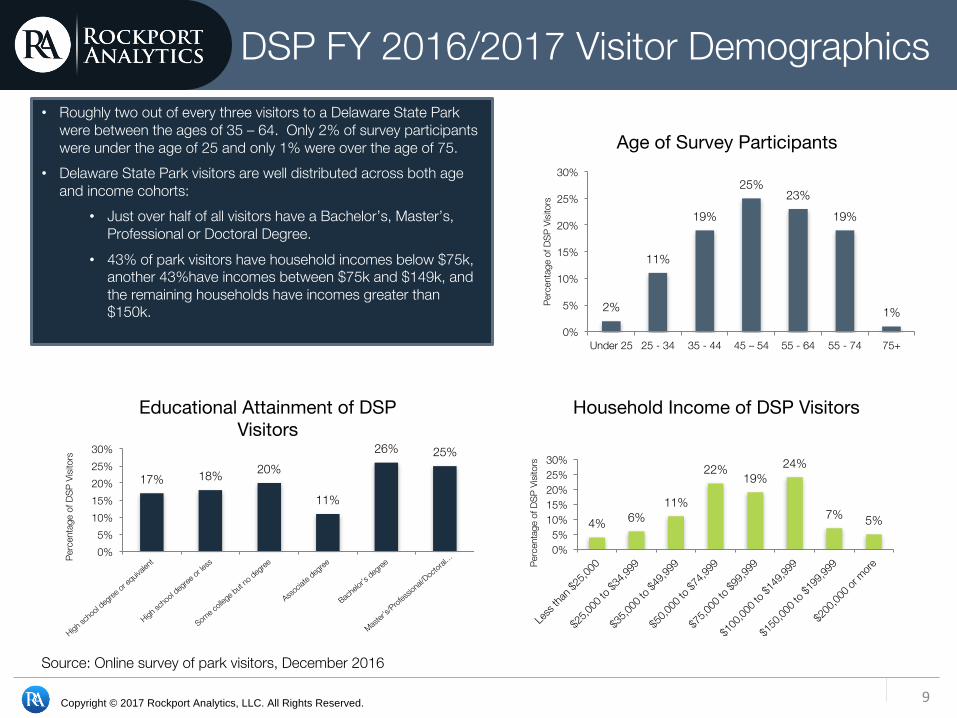
• Roughly two out of every three visitors to a Delaware State Park were between the ages of 35 – 64. Only 2% of survey participants were under the age of 25 and only 1% were over the age of 75.
• Delaware State Park visitors are well distributed across both age and income cohorts:
• Just over half of all visitors have a Bachelor’s, Master’s, Professional or Doctoral Degree.
• 43% of park visitors have household incomes below $75k, another 43%have incomes between $75k and $149k, and the remaining households have incomes greater than $150k.
Source: Online survey of park visitors, December 2016

Copyright © 2017 Rockport Analytics, LLC. All Rights Reserved. 10
DSP Main Purpose Visitor Behavior & Key Drivers of Park Visitation
32%
9%
41%
7% 1%
10%
0% 5%
10% 15% 20% 25% 30% 35% 40% 45%
Prox
imity
/Loc
atio
n
Amen
tities
Offe
red
Land
Offe
rings
(B
each
, W
oodl
ands
, Pon
d et
c )
Cost
Frien
dly
Staf
f
Oth
er
Primary Reason for Visiting a Delaware State Park
19%
29% 22%
18%
Average Length of Stay Amongst Park Visitors
None (Day trip only)
1 to 3 nights
4 to 5 nights
6 Nights or more
2%
45%
3%
27%
7% 3% 11%
3% 0% 5%
10% 15% 20% 25% 30% 35% 40% 45% 50%
Hote
l or M
otel
Recr
eatio
nal
Vehi
cle (R
V)
Publ
ic (P
arks
) …
Recr
eatio
nal
Vehi
cle (R
V)
Priva
te L
and
Park
s te
nt
cam
ping
Priva
te te
nt
cam
ping
/cam
pgr
ound
Stay
ed w
ith
frien
ds o
r re
lative
s
Park
s ca
bin/
cotta
ge/y
urt
Oth
er
Type of Lodging Accommodations Amongst Multi-Day Park Visitors • The length of stay for visitors to Delaware State Parks was
varied: 19% of visits were day trips, 29% were one to three night stays, 22% were four to five night stays and 18% stayed six nights or more.
• Public RV parks was the most common type of lodging accommodations among park visitors, utilized by 45% of visitors. This is followed by parks tent camping (27%) and parks cabins, cottages and yurts (11%).
• The biggest driver for visiting Delaware State Parks was the land offerings, including beaches, woodlands and ponds. The second biggest driver of park visitation was the visitor’s proximity to the park.
Source: Online survey of park visitors, December 2016
Copyright © 2017 Rockport Analytics, LLC. All Rights Reserved. 11
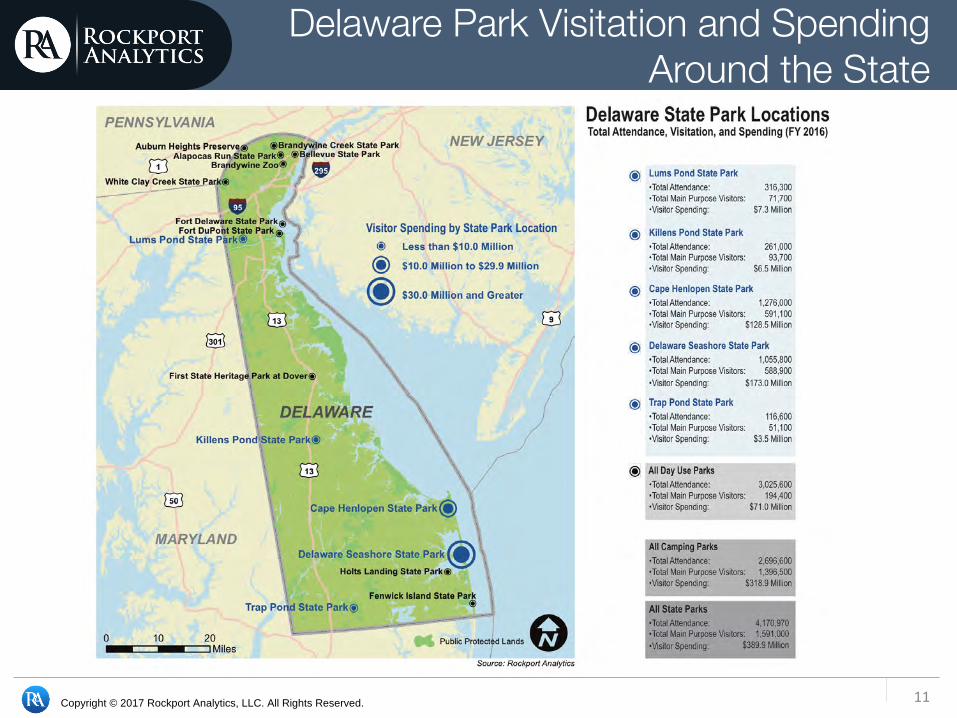
Delaware Park Visitation and Spending Around the State
Copyright © 2017 Rockport Analytics, LLC. All Rights Reserved. 12
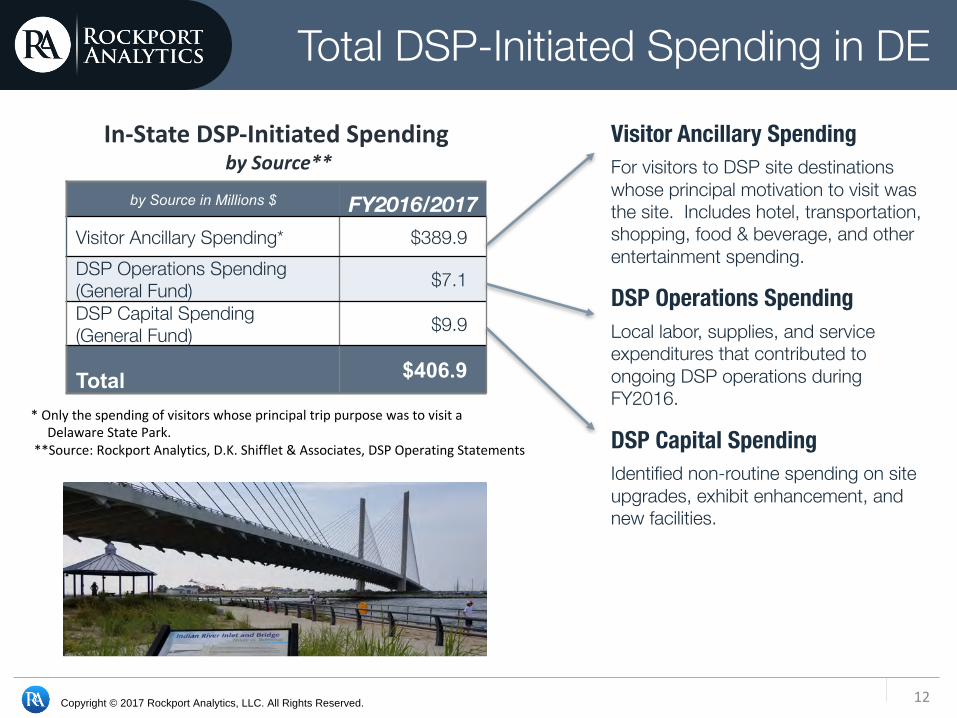
Total DSP-Initiated Spending in DE
by Source in Millions $ FY2016/2017Visitor Ancillary Spending* $389.9 DSP Operations Spending (General Fund) $7.1 DSP Capital Spending (General Fund) $9.9
Total $406.9
In-StateDSP-InitiatedSpendingbySource**
Visitor Ancillary SpendingFor visitors to DSP site destinations whose principal motivation to visit was the site. Includes hotel, transportation, shopping, food & beverage, and other entertainment spending.
DSP Operations SpendingLocal labor, supplies, and service expenditures that contributed to ongoing DSP operations during FY2016.
DSP Capital SpendingIdentified non-routine spending on site upgrades, exhibit enhancement, and new facilities.
*OnlythespendingofvisitorswhoseprincipaltrippurposewastovisitaDelawareStatePark.
**Source:RockportAnalytics,D.K.Shifflet&Associates,DSPOperatingStatements
Copyright © 2017 Rockport Analytics, LLC. All Rights Reserved. 13
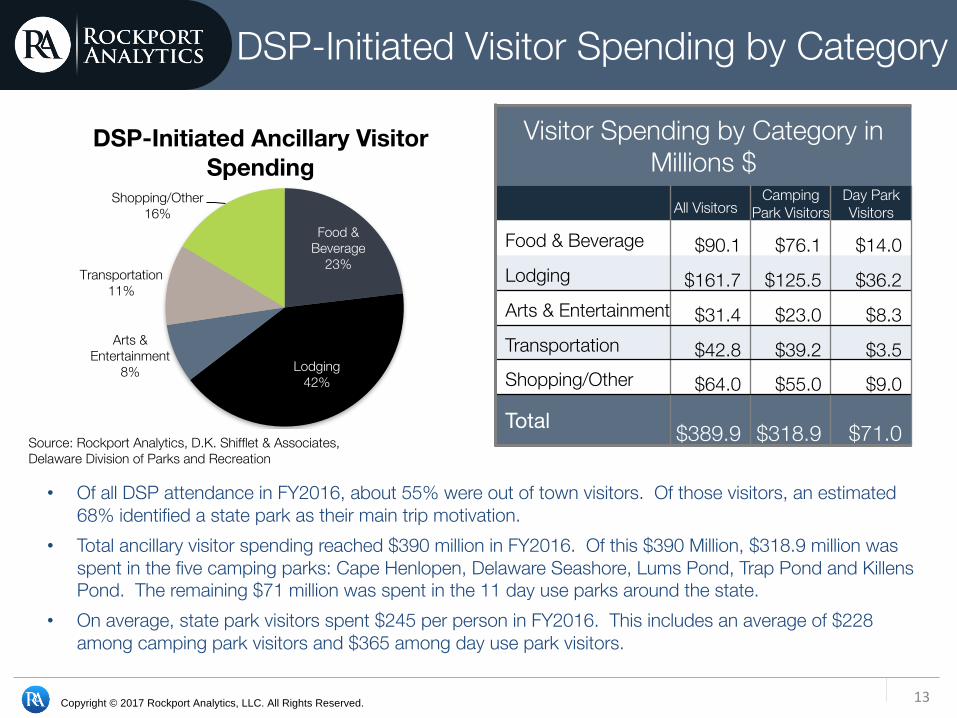
DSP-Initiated Visitor Spending by Category
Visitor Spending by Category in Millions $
All VisitorsCamping
Park VisitorsDay Park Visitors
Food & Beverage $90.1 $76.1 $14.0 Lodging $161.7 $125.5 $36.2 Arts & Entertainment $31.4 $23.0 $8.3 Transportation $42.8 $39.2 $3.5 Shopping/Other $64.0 $55.0 $9.0
Total $389.9 $318.9 $71.0
• Of all DSP attendance in FY2016, about 55% were out of town visitors. Of those visitors, an estimated 68% identified a state park as their main trip motivation.
• Total ancillary visitor spending reached $390 million in FY2016. Of this $390 Million, $318.9 million was spent in the five camping parks: Cape Henlopen, Delaware Seashore, Lums Pond, Trap Pond and Killens Pond. The remaining $71 million was spent in the 11 day use parks around the state.
• On average, state park visitors spent $245 per person in FY2016. This includes an average of $228 among camping park visitors and $365 among day use park visitors.
Source: Rockport Analytics, D.K. Shifflet & Associates,Delaware Division of Parks and Recreation
Food & Beverage
23%
Lodging42%
Arts & Entertainment
8%
Transportation11%
Shopping/Other16%
DSP-Initiated Ancillary Visitor Spending
14
Delaware State Park SystemSystem-Wide Economic Impact on the State of Delaware
Copyright © 2017 Rockport Analytics, LLC. All Rights Reserved.
ContributiontoDECitizens,Businesses,
Governments
ContributiontoDelawareEconomy
DSP-InitiatedExpendituresbySource
TotalIncrementalDSP-InitiatedSpending
FY2016TotalExpenditures$406.9million
DSPOperationsSpending$7.1million
DirectImpacts$245.2million
Indirect(SupplyChain)$54.0million
JobsSupported
6,700
WagesPaid$222.5million
BusinessRevenue$536.5million
State&LocalTaxes$52.9million
Induced(Income)
$76.9million
LeakagesOutsideofDelaware
($30.9million)
VisitorAncillarySpending
$389.9million
CapitalSpending$9.9million
15
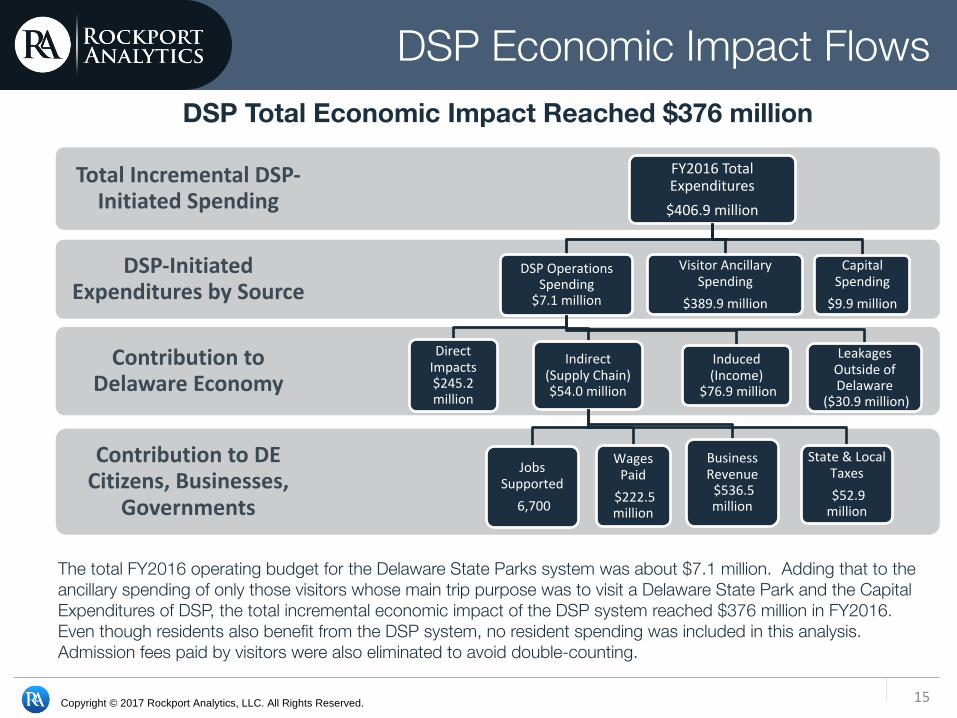
DSP Economic Impact FlowsDSP Total Economic Impact Reached $376 million
The total FY2016 operating budget for the Delaware State Parks system was about $7.1 million. Adding that to the ancillary spending of only those visitors whose main trip purpose was to visit a Delaware State Park and the Capital Expenditures of DSP, the total incremental economic impact of the DSP system reached $376 million in FY2016. Even though residents also benefit from the DSP system, no resident spending was included in this analysis. Admission fees paid by visitors were also eliminated to avoid double-counting.
Copyright © 2017 Rockport Analytics, LLC. All Rights Reserved. 16
DSP’s Economic Impact Bottom Line
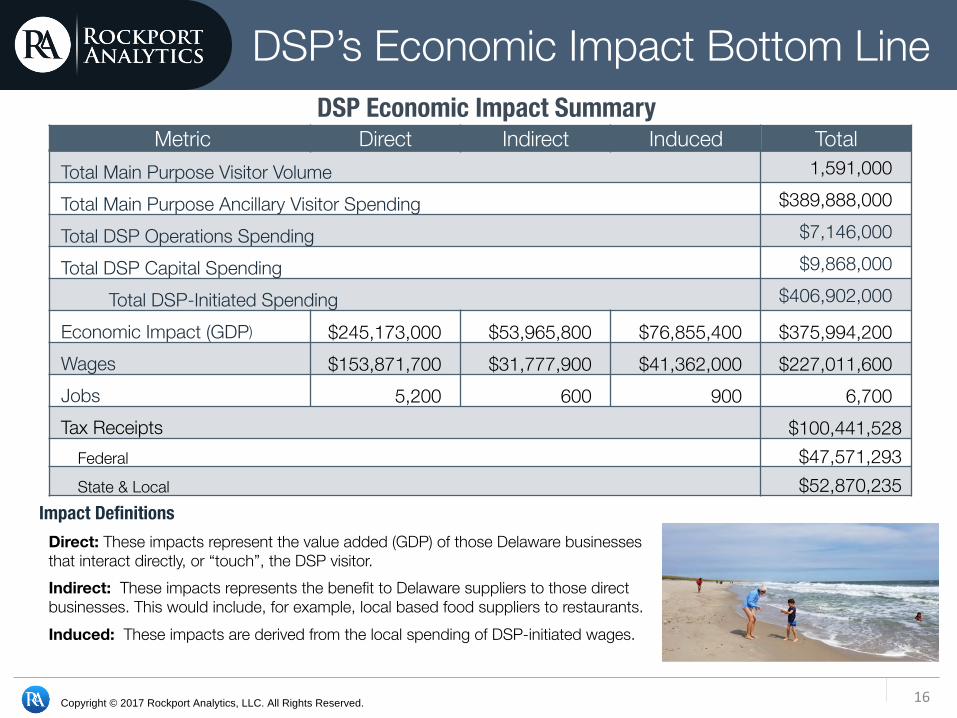
Metric Direct Indirect Induced TotalTotal Main Purpose Visitor Volume 1,591,000
Total Main Purpose Ancillary Visitor Spending $389,888,000
Total DSP Operations Spending $7,146,000
Total DSP Capital Spending $9,868,000
Total DSP-Initiated Spending $406,902,000
Economic Impact (GDP) $245,173,000 $53,965,800 $76,855,400 $375,994,200Wages $153,871,700 $31,777,900 $41,362,000 $227,011,600Jobs 5,200 600 900 6,700Tax Receipts $100,441,528
Federal $47,571,293State & Local $52,870,235
DSP Economic Impact Summary
Impact DefinitionsDirect: These impacts represent the value added (GDP) of those Delaware businesses that interact directly, or “touch”, the DSP visitor. Indirect: These impacts represents the benefit to Delaware suppliers to those direct businesses. This would include, for example, local based food suppliers to restaurants. Induced: These impacts are derived from the local spending of DSP-initiated wages.
Copyright © 2017 Rockport Analytics, LLC. All Rights Reserved. 17
The DSP Supports the Top Lines of Many Different Businesses Across the State
Industry (NAICS)* Direct Indirect Induced Total
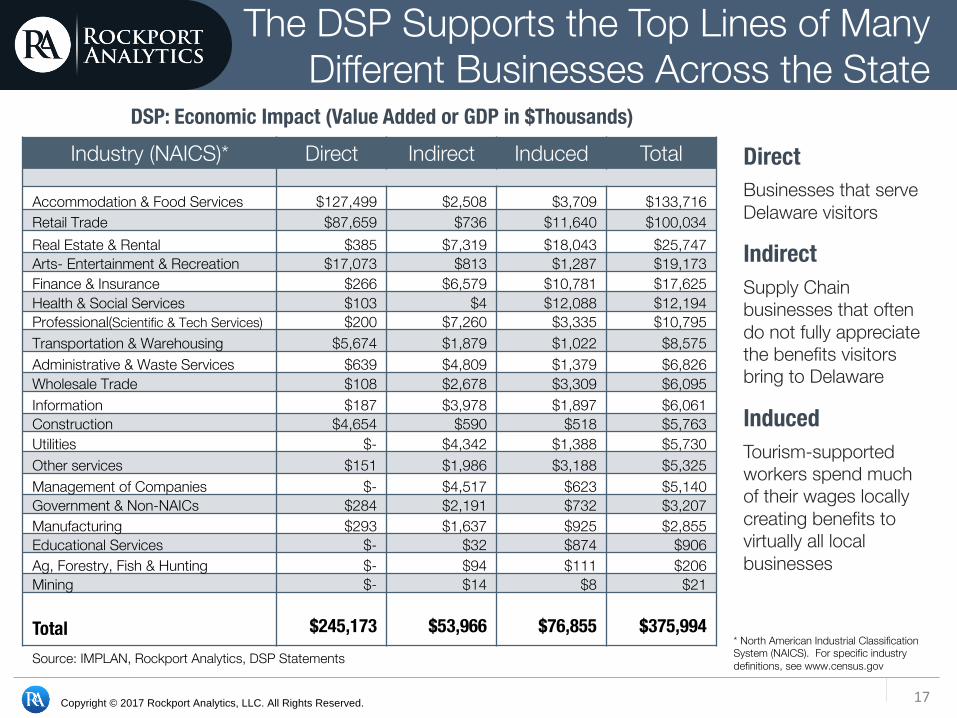
Accommodation & Food Services $127,499 $2,508 $3,709 $133,716 Retail Trade $87,659 $736 $11,640 $100,034 Real Estate & Rental $385 $7,319 $18,043 $25,747 Arts- Entertainment & Recreation $17,073 $813 $1,287 $19,173 Finance & Insurance $266 $6,579 $10,781 $17,625 Health & Social Services $103 $4 $12,088 $12,194 Professional(Scientific & Tech Services) $200 $7,260 $3,335 $10,795 Transportation & Warehousing $5,674 $1,879 $1,022 $8,575 Administrative & Waste Services $639 $4,809 $1,379 $6,826 Wholesale Trade $108 $2,678 $3,309 $6,095 Information $187 $3,978 $1,897 $6,061 Construction $4,654 $590 $518 $5,763 Utilities $- $4,342 $1,388 $5,730 Other services $151 $1,986 $3,188 $5,325 Management of Companies $- $4,517 $623 $5,140 Government & Non-NAICs $284 $2,191 $732 $3,207 Manufacturing $293 $1,637 $925 $2,855 Educational Services $- $32 $874 $906 Ag, Forestry, Fish & Hunting $- $94 $111 $206 Mining $- $14 $8 $21
Total $245,173 $53,966 $76,855 $375,994
DirectBusinesses that serve Delaware visitors
IndirectSupply Chain businesses that often do not fully appreciate the benefits visitors bring to Delaware
InducedTourism-supported workers spend much of their wages locally creating benefits to virtually all local businesses
DSP: Economic Impact (Value Added or GDP in $Thousands)
* North American Industrial Classification System (NAICS). For specific industry definitions, see www.census.govSource: IMPLAN, Rockport Analytics, DSP Statements
Copyright © 2017 Rockport Analytics, LLC. All Rights Reserved. 18
DSP Activity Supports a Wide Array of Jobs Around the State
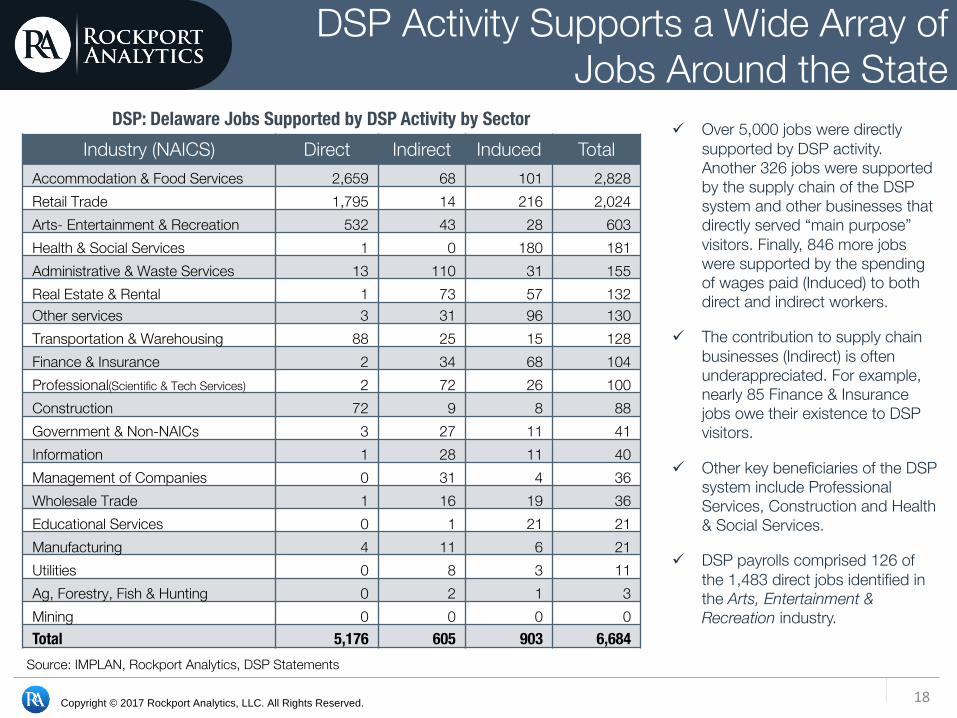
Industry (NAICS) Direct Indirect Induced TotalAccommodation & Food Services 2,659 68 101 2,828Retail Trade 1,795 14 216 2,024Arts- Entertainment & Recreation 532 43 28 603Health & Social Services 1 0 180 181Administrative & Waste Services 13 110 31 155Real Estate & Rental 1 73 57 132Other services 3 31 96 130Transportation & Warehousing 88 25 15 128Finance & Insurance 2 34 68 104Professional(Scientific & Tech Services) 2 72 26 100Construction 72 9 8 88Government & Non-NAICs 3 27 11 41Information 1 28 11 40Management of Companies 0 31 4 36Wholesale Trade 1 16 19 36Educational Services 0 1 21 21Manufacturing 4 11 6 21Utilities 0 8 3 11Ag, Forestry, Fish & Hunting 0 2 1 3Mining 0 0 0 0Total 5,176 605 903 6,684
DSP: Delaware Jobs Supported by DSP Activity by Sectorü Over 5,000 jobs were directly
supported by DSP activity. Another 326 jobs were supported by the supply chain of the DSP system and other businesses that directly served “main purpose” visitors. Finally, 846 more jobs were supported by the spending of wages paid (Induced) to both direct and indirect workers.
ü The contribution to supply chain businesses (Indirect) is often underappreciated. For example, nearly 85 Finance & Insurance jobs owe their existence to DSP visitors.
ü Other key beneficiaries of the DSP system include Professional Services, Construction and Health & Social Services.
ü DSP payrolls comprised 126 of the 1,483 direct jobs identified in the Arts, Entertainment & Recreation industry.
Source: IMPLAN, Rockport Analytics, DSP Statements
Copyright © 2017 Rockport Analytics, LLC. All Rights Reserved. 19
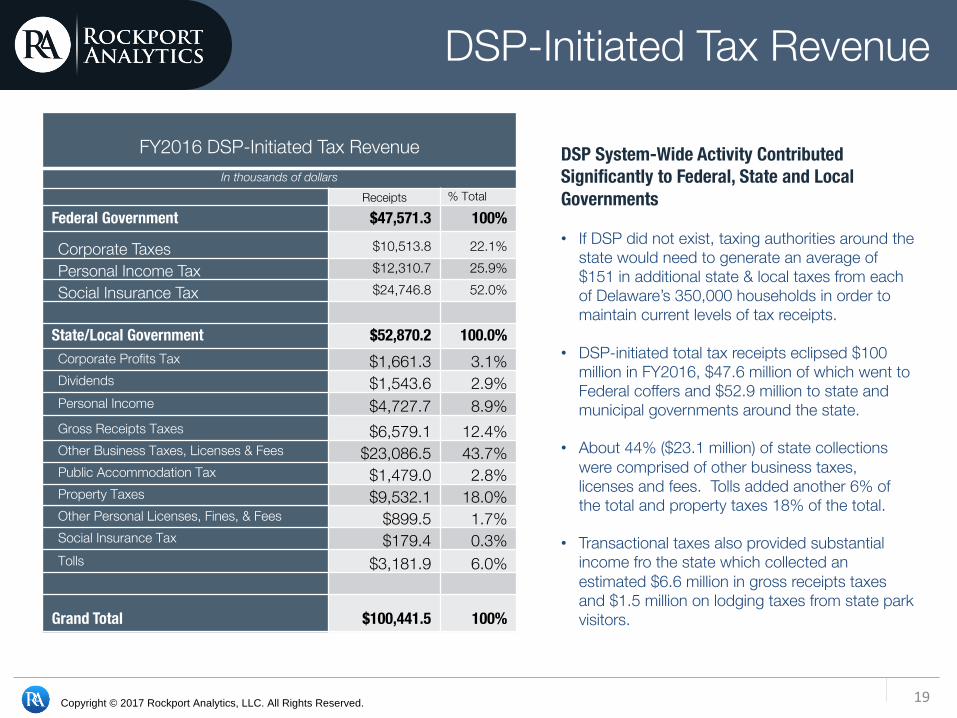
DSP-Initiated Tax Revenue
DSP System-Wide Activity Contributed Significantly to Federal, State and Local Governments
• If DSP did not exist, taxing authorities around the state would need to generate an average of $151 in additional state & local taxes from each of Delaware’s 350,000 households in order to maintain current levels of tax receipts.
• DSP-initiated total tax receipts eclipsed $100 million in FY2016, $47.6 million of which went to Federal coffers and $52.9 million to state and municipal governments around the state.
• About 44% ($23.1 million) of state collections were comprised of other business taxes, licenses and fees. Tolls added another 6% of the total and property taxes 18% of the total.
• Transactional taxes also provided substantial income fro the state which collected an estimated $6.6 million in gross receipts taxes and $1.5 million on lodging taxes from state park visitors.
FY2016 DSP-Initiated Tax RevenueIn thousands of dollars
Receipts % Total
Federal Government $47,571.3 100%
Corporate Taxes $10,513.8 22.1%
Personal Income Tax $12,310.7 25.9%
Social Insurance Tax $24,746.8 52.0%
State/Local Government $52,870.2 100.0% Corporate Profits Tax $1,661.3 3.1% Dividends $1,543.6 2.9% Personal Income $4,727.7 8.9% Gross Receipts Taxes $6,579.1 12.4% Other Business Taxes, Licenses & Fees $23,086.5 43.7% Public Accommodation Tax $1,479.0 2.8% Property Taxes $9,532.1 18.0% Other Personal Licenses, Fines, & Fees $899.5 1.7% Social Insurance Tax $179.4 0.3% Tolls $3,181.9 6.0%
Grand Total $100,441.5 100%
Copyright © 2017 Rockport Analytics, LLC. All Rights Reserved. 20
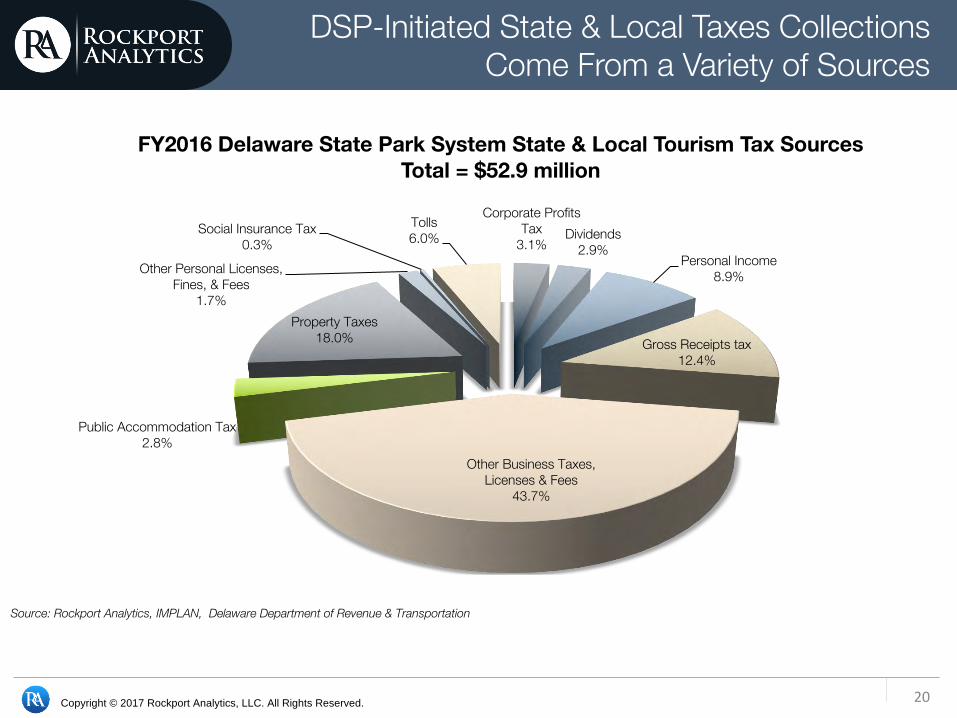
DSP-Initiated State & Local Taxes Collections Come From a Variety of Sources
Corporate Profits Tax
3.1%Dividends
2.9%Personal Income
8.9%
Gross Receipts tax12.4%
Other Business Taxes, Licenses & Fees
43.7%
Public Accommodation Tax2.8%
Property Taxes18.0%
Other Personal Licenses, Fines, & Fees
1.7%
Social Insurance Tax0.3%
Tolls6.0%
FY2016 Delaware State Park System State & Local Tourism Tax SourcesTotal = $52.9 million
Source: Rockport Analytics, IMPLAN, Delaware Department of Revenue & Transportation
Copyright © 2017 Rockport Analytics, LLC. All Rights Reserved. 21
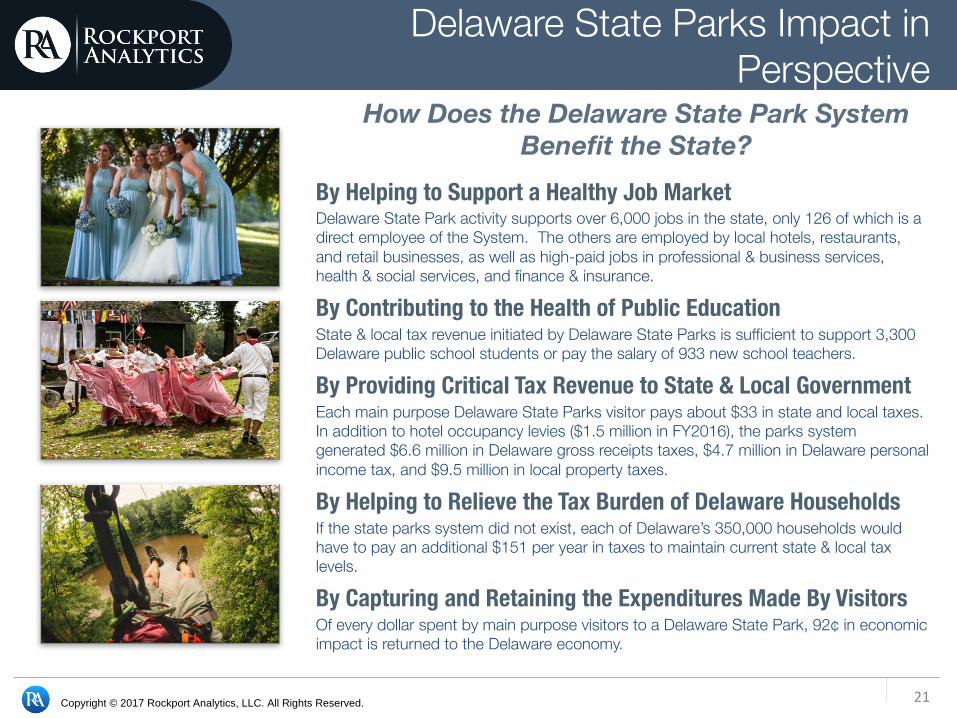
Delaware State Parks Impact in Perspective
By Helping to Support a Healthy Job MarketDelaware State Park activity supports over 6,000 jobs in the state, only 126 of which is a direct employee of the System. The others are employed by local hotels, restaurants, and retail businesses, as well as high-paid jobs in professional & business services, health & social services, and finance & insurance.
By Contributing to the Health of Public EducationState & local tax revenue initiated by Delaware State Parks is sufficient to support 3,300 Delaware public school students or pay the salary of 933 new school teachers.
By Providing Critical Tax Revenue to State & Local Government Each main purpose Delaware State Parks visitor pays about $33 in state and local taxes. In addition to hotel occupancy levies ($1.5 million in FY2016), the parks system generated $6.6 million in Delaware gross receipts taxes, $4.7 million in Delaware personal income tax, and $9.5 million in local property taxes.
By Helping to Relieve the Tax Burden of Delaware HouseholdsIf the state parks system did not exist, each of Delaware’s 350,000 households would have to pay an additional $151 per year in taxes to maintain current state & local tax levels.
By Capturing and Retaining the Expenditures Made By Visitors Of every dollar spent by main purpose visitors to a Delaware State Park, 92¢ in economic impact is returned to the Delaware economy.
How Does the Delaware State Park System Benefit the State?
Delaware State Park SystemFY 2016/2017 Visitation, Spending & Economic Impact of the Camping Parks
22
23
Cape Henlopen State ParkVisitor Performance, Spending & Economic Impact
Copyright © 2017 Rockport Analytics, LLC. All Rights Reserved. 24
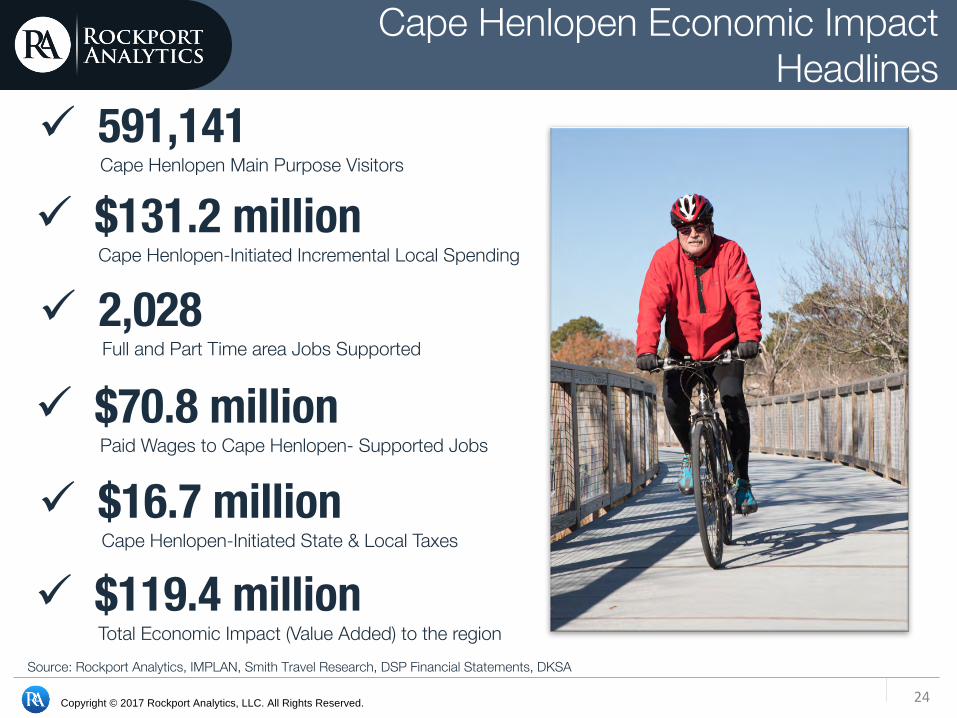
Cape Henlopen Economic Impact Headlines
ü $119.4 millionTotal Economic Impact (Value Added) to the region
ü $16.7 millionCape Henlopen-Initiated State & Local Taxes
ü 591,141Cape Henlopen Main Purpose Visitors
ü 2,028Full and Part Time area Jobs Supported
Source: Rockport Analytics, IMPLAN, Smith Travel Research, DSP Financial Statements, DKSA
ü $131.2 million Cape Henlopen-Initiated Incremental Local Spending
ü $70.8 millionPaid Wages to Cape Henlopen- Supported Jobs
Copyright © 2017 Rockport Analytics, LLC. All Rights Reserved. 25
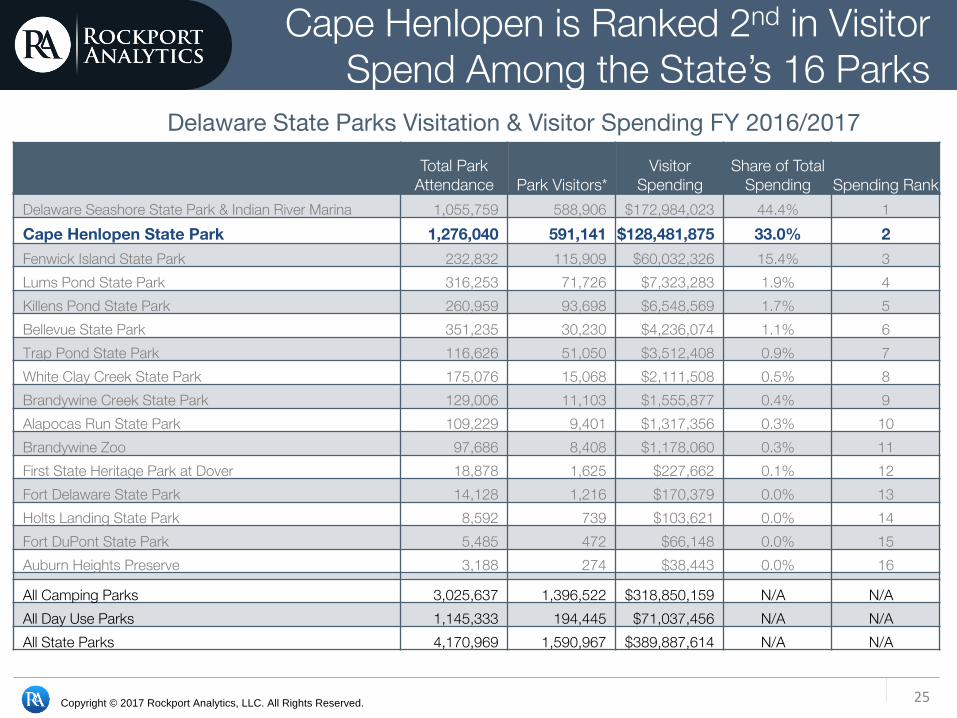
Cape Henlopen is Ranked 2nd in Visitor Spend Among the State’s 16 Parks
Total Park Attendance Park Visitors*
Visitor Spending
Share of Total Spending Spending Rank
Delaware Seashore State Park & Indian River Marina 1,055,759 588,906 $172,984,023 44.4% 1Cape Henlopen State Park 1,276,040 591,141 $128,481,875 33.0% 2Fenwick Island State Park 232,832 115,909 $60,032,326 15.4% 3Lums Pond State Park 316,253 71,726 $7,323,283 1.9% 4Killens Pond State Park 260,959 93,698 $6,548,569 1.7% 5Bellevue State Park 351,235 30,230 $4,236,074 1.1% 6Trap Pond State Park 116,626 51,050 $3,512,408 0.9% 7White Clay Creek State Park 175,076 15,068 $2,111,508 0.5% 8Brandywine Creek State Park 129,006 11,103 $1,555,877 0.4% 9Alapocas Run State Park 109,229 9,401 $1,317,356 0.3% 10Brandywine Zoo 97,686 8,408 $1,178,060 0.3% 11First State Heritage Park at Dover 18,878 1,625 $227,662 0.1% 12Fort Delaware State Park 14,128 1,216 $170,379 0.0% 13Holts Landing State Park 8,592 739 $103,621 0.0% 14Fort DuPont State Park 5,485 472 $66,148 0.0% 15Auburn Heights Preserve 3,188 274 $38,443 0.0% 16
All Camping Parks 3,025,637 1,396,522 $318,850,159 N/A N/AAll Day Use Parks 1,145,333 194,445 $71,037,456 N/A N/AAll State Parks 4,170,969 1,590,967 $389,887,614 N/A N/A
Delaware State Parks Visitation & Visitor Spending FY 2016/2017
Copyright © 2017 Rockport Analytics, LLC. All Rights Reserved. 26
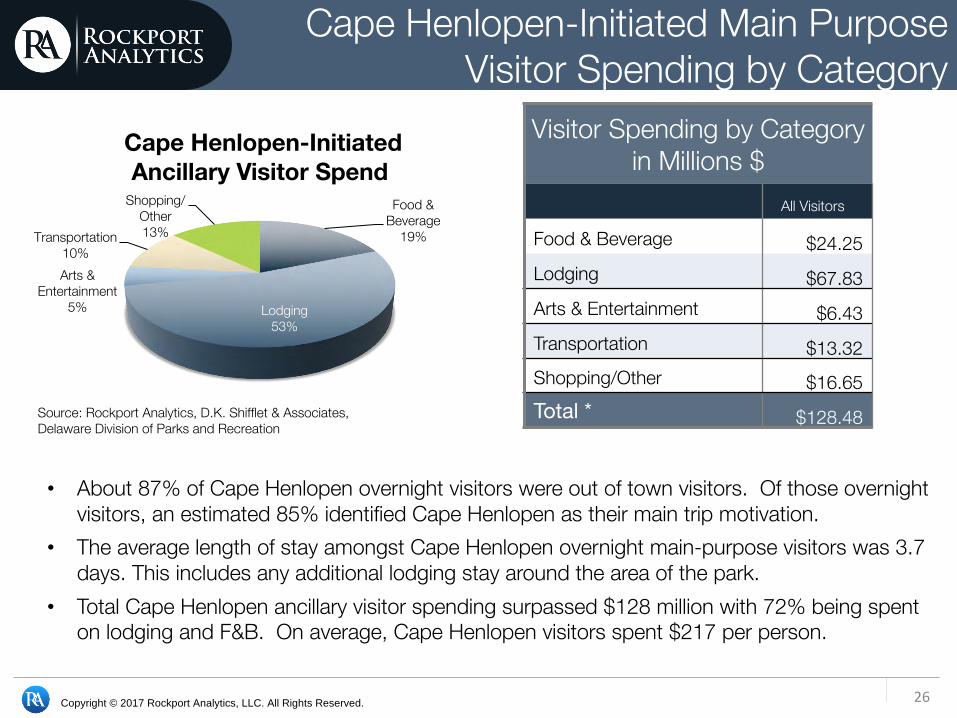
Cape Henlopen-Initiated Main Purpose Visitor Spending by Category
Visitor Spending by Category in Millions $
All Visitors
Food & Beverage $24.25 Lodging $67.83 Arts & Entertainment $6.43 Transportation $13.32 Shopping/Other $16.65 Total * $128.48
• About 87% of Cape Henlopen overnight visitors were out of town visitors. Of those overnight visitors, an estimated 85% identified Cape Henlopen as their main trip motivation.
• The average length of stay amongst Cape Henlopen overnight main-purpose visitors was 3.7 days. This includes any additional lodging stay around the area of the park.
• Total Cape Henlopen ancillary visitor spending surpassed $128 million with 72% being spent on lodging and F&B. On average, Cape Henlopen visitors spent $217 per person.
Source: Rockport Analytics, D.K. Shifflet & Associates, Delaware Division of Parks and Recreation
Food & Beverage
19%
Lodging53%
Arts & Entertainment
5%
Transportation10%
Shopping/Other13%
Cape Henlopen-Initiated Ancillary Visitor Spend
Copyright © 2017 Rockport Analytics, LLC. All Rights Reserved. 27
Cape Henlopens Economic Impact Bottom Line
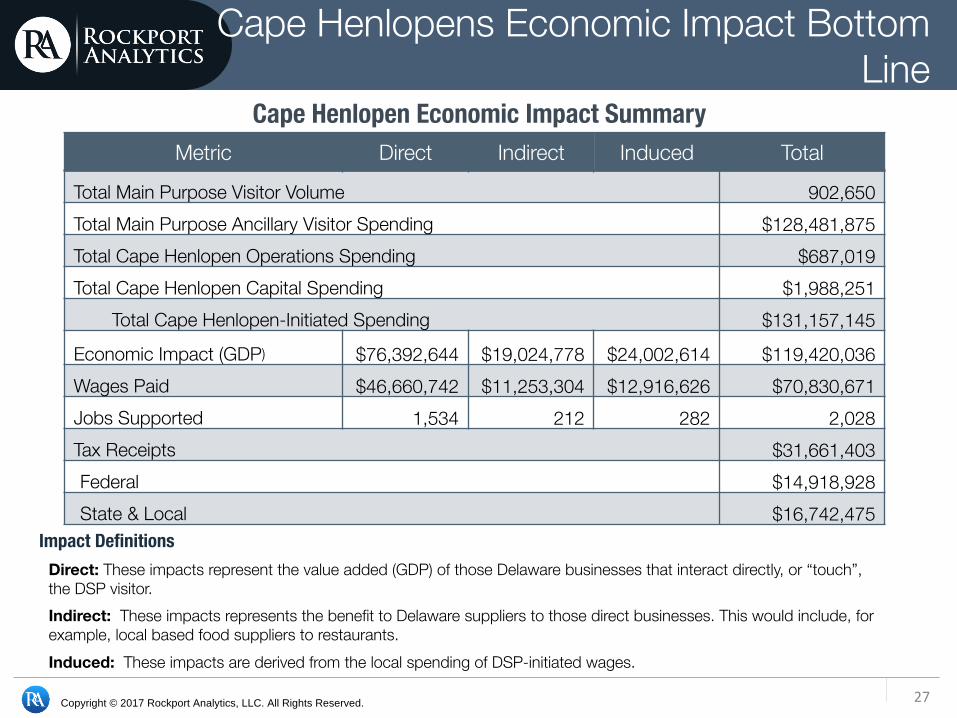
Metric Direct Indirect Induced Total
Total Main Purpose Visitor Volume 902,650Total Main Purpose Ancillary Visitor Spending $128,481,875 Total Cape Henlopen Operations Spending $687,019 Total Cape Henlopen Capital Spending $1,988,251
Total Cape Henlopen-Initiated Spending $131,157,145
Economic Impact (GDP) $76,392,644 $19,024,778 $24,002,614 $119,420,036Wages Paid $46,660,742 $11,253,304 $12,916,626 $70,830,671 Jobs Supported 1,534 212 282 2,028 Tax Receipts $31,661,403 Federal $14,918,928 State & Local $16,742,475
Cape Henlopen Economic Impact Summary
Impact DefinitionsDirect: These impacts represent the value added (GDP) of those Delaware businesses that interact directly, or “touch”, the DSP visitor. Indirect: These impacts represents the benefit to Delaware suppliers to those direct businesses. This would include, for example, local based food suppliers to restaurants. Induced: These impacts are derived from the local spending of DSP-initiated wages.
Copyright © 2017 Rockport Analytics, LLC. All Rights Reserved. 28
Cape Henlopen-Initiated Tax Revenue
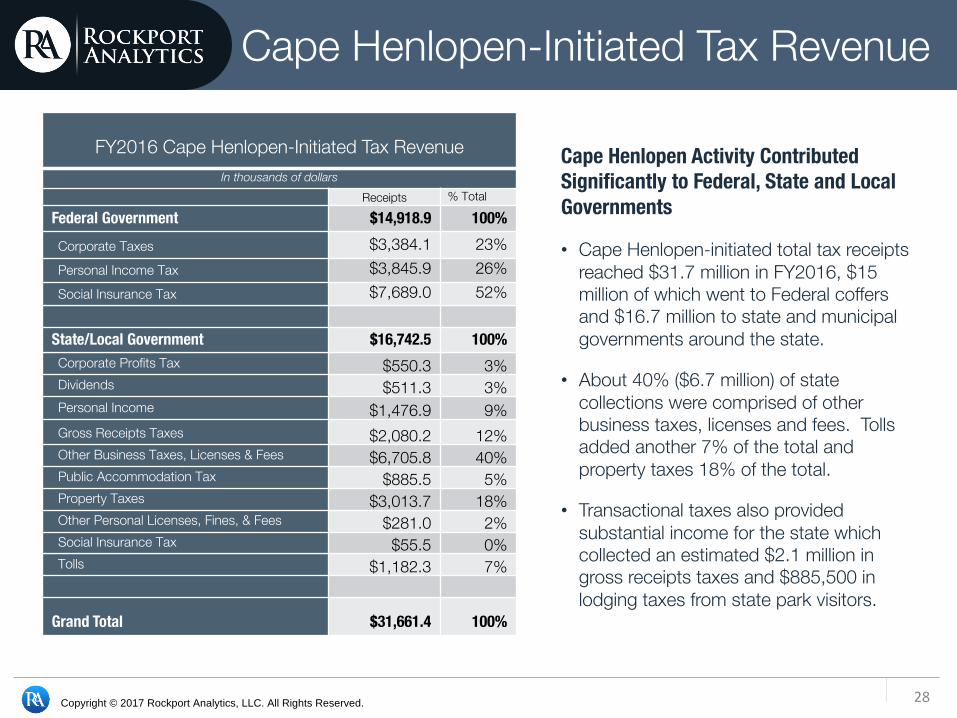
Cape Henlopen Activity Contributed Significantly to Federal, State and Local Governments
• Cape Henlopen-initiated total tax receipts reached $31.7 million in FY2016, $15 million of which went to Federal coffers and $16.7 million to state and municipal governments around the state.
• About 40% ($6.7 million) of state collections were comprised of other business taxes, licenses and fees. Tolls added another 7% of the total and property taxes 18% of the total.
• Transactional taxes also provided substantial income for the state which collected an estimated $2.1 million in gross receipts taxes and $885,500 in lodging taxes from state park visitors.
FY2016 Cape Henlopen-Initiated Tax RevenueIn thousands of dollars
Receipts % Total
Federal Government $14,918.9 100% Corporate Taxes $3,384.1 23% Personal Income Tax $3,845.9 26% Social Insurance Tax $7,689.0 52%
State/Local Government $16,742.5 100% Corporate Profits Tax $550.3 3% Dividends $511.3 3% Personal Income $1,476.9 9% Gross Receipts Taxes $2,080.2 12% Other Business Taxes, Licenses & Fees $6,705.8 40% Public Accommodation Tax $885.5 5% Property Taxes $3,013.7 18% Other Personal Licenses, Fines, & Fees $281.0 2% Social Insurance Tax $55.5 0% Tolls $1,182.3 7%
Grand Total $31,661.4 100%
Copyright © 2017 Rockport Analytics, LLC. All Rights Reserved. 29
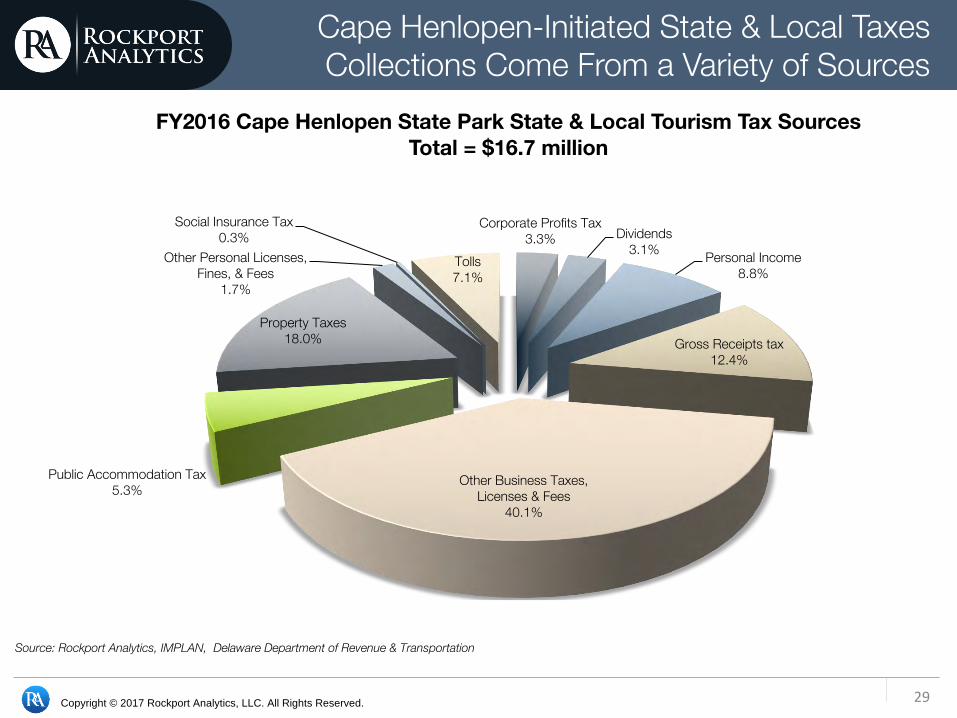
Cape Henlopen-Initiated State & Local Taxes Collections Come From a Variety of Sources
Corporate Profits Tax3.3% Dividends
3.1% Personal Income8.8%
Gross Receipts tax12.4%
Other Business Taxes, Licenses & Fees
40.1%
Public Accommodation Tax5.3%
Property Taxes18.0%
Other Personal Licenses, Fines, & Fees
1.7%
Social Insurance Tax0.3%
Tolls7.1%
FY2016 Cape Henlopen State Park State & Local Tourism Tax SourcesTotal = $16.7 million
Source: Rockport Analytics, IMPLAN, Delaware Department of Revenue & Transportation
30
Delaware Seashore State Park & Indian River MarinaVisitor Performance, Spending & Economic Impact
Copyright © 2017 Rockport Analytics, LLC. All Rights Reserved. 31
Delaware Seashore Economic Impact Headlines
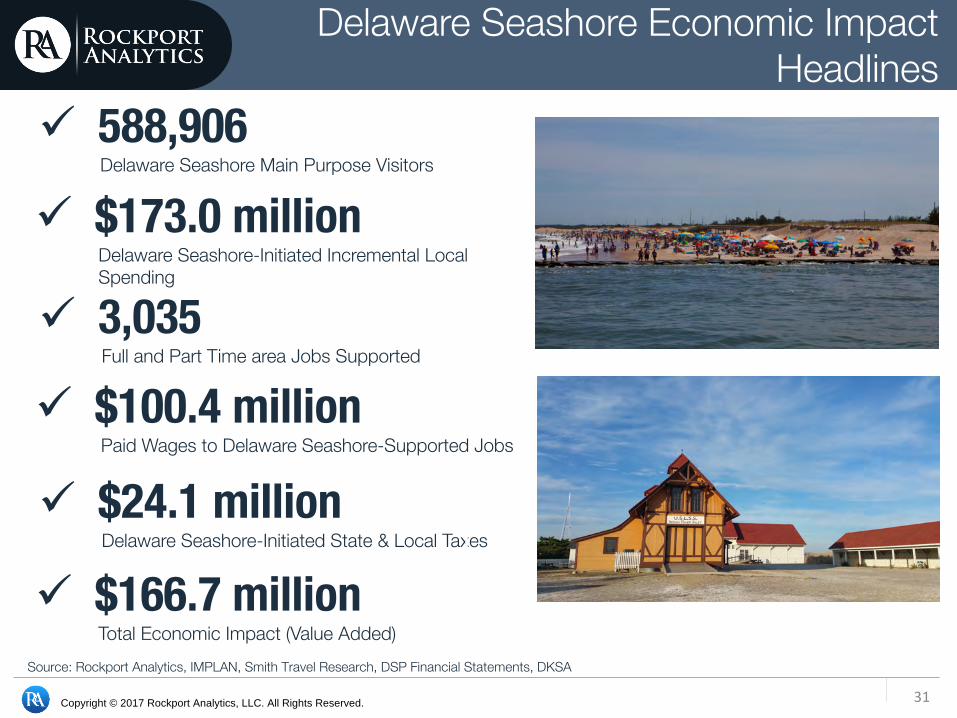
ü $166.7 millionTotal Economic Impact (Value Added)
ü $24.1 millionDelaware Seashore-Initiated State & Local Taxes
ü 588,906Delaware Seashore Main Purpose Visitors
ü 3,035Full and Part Time area Jobs Supported
Source: Rockport Analytics, IMPLAN, Smith Travel Research, DSP Financial Statements, DKSA
ü $173.0 million Delaware Seashore-Initiated Incremental Local Spending
ü $100.4 millionPaid Wages to Delaware Seashore-Supported Jobs
Copyright © 2017 Rockport Analytics, LLC. All Rights Reserved. 32
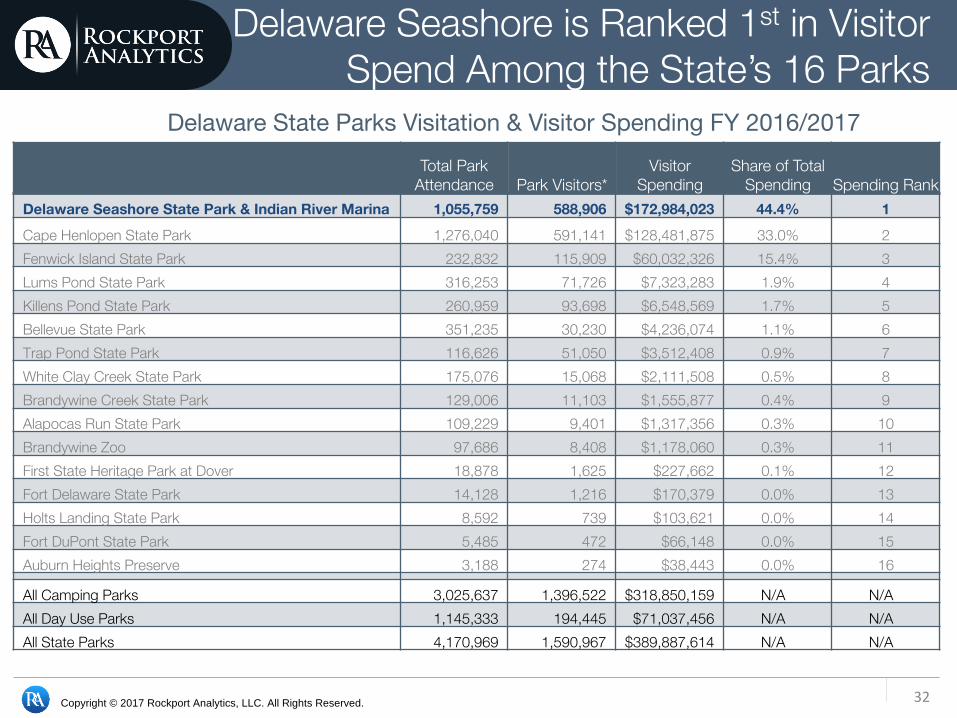
Delaware Seashore is Ranked 1st in Visitor Spend Among the State’s 16 Parks
Delaware State Parks Visitation & Visitor Spending FY 2016/2017Total Park
Attendance Park Visitors*Visitor
SpendingShare of Total
Spending Spending RankDelaware Seashore State Park & Indian River Marina 1,055,759 588,906 $172,984,023 44.4% 1
Cape Henlopen State Park 1,276,040 591,141 $128,481,875 33.0% 2Fenwick Island State Park 232,832 115,909 $60,032,326 15.4% 3Lums Pond State Park 316,253 71,726 $7,323,283 1.9% 4Killens Pond State Park 260,959 93,698 $6,548,569 1.7% 5Bellevue State Park 351,235 30,230 $4,236,074 1.1% 6Trap Pond State Park 116,626 51,050 $3,512,408 0.9% 7White Clay Creek State Park 175,076 15,068 $2,111,508 0.5% 8Brandywine Creek State Park 129,006 11,103 $1,555,877 0.4% 9Alapocas Run State Park 109,229 9,401 $1,317,356 0.3% 10Brandywine Zoo 97,686 8,408 $1,178,060 0.3% 11First State Heritage Park at Dover 18,878 1,625 $227,662 0.1% 12Fort Delaware State Park 14,128 1,216 $170,379 0.0% 13Holts Landing State Park 8,592 739 $103,621 0.0% 14Fort DuPont State Park 5,485 472 $66,148 0.0% 15Auburn Heights Preserve 3,188 274 $38,443 0.0% 16
All Camping Parks 3,025,637 1,396,522 $318,850,159 N/A N/AAll Day Use Parks 1,145,333 194,445 $71,037,456 N/A N/AAll State Parks 4,170,969 1,590,967 $389,887,614 N/A N/A
Copyright © 2017 Rockport Analytics, LLC. All Rights Reserved. 33
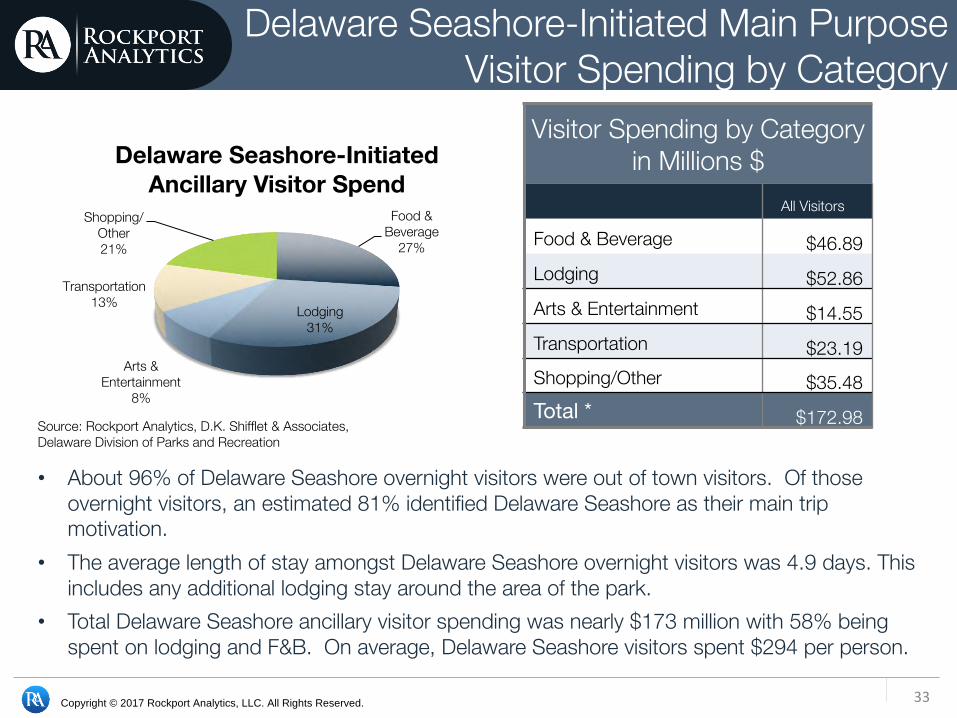
Delaware Seashore-Initiated Main Purpose Visitor Spending by Category
Visitor Spending by Category in Millions $
All Visitors
Food & Beverage $46.89 Lodging $52.86 Arts & Entertainment $14.55 Transportation $23.19 Shopping/Other $35.48 Total * $172.98
• About 96% of Delaware Seashore overnight visitors were out of town visitors. Of those overnight visitors, an estimated 81% identified Delaware Seashore as their main trip motivation.
• The average length of stay amongst Delaware Seashore overnight visitors was 4.9 days. This includes any additional lodging stay around the area of the park.
• Total Delaware Seashore ancillary visitor spending was nearly $173 million with 58% being spent on lodging and F&B. On average, Delaware Seashore visitors spent $294 per person.
Source: Rockport Analytics, D.K. Shifflet & Associates, Delaware Division of Parks and Recreation
Food & Beverage
27%
Lodging31%
Arts & Entertainment
8%
Transportation13%
Shopping/Other21%
Delaware Seashore-Initiated Ancillary Visitor Spend
Copyright © 2017 Rockport Analytics, LLC. All Rights Reserved. 34
Delaware Seashore Economic Impact Bottom Line
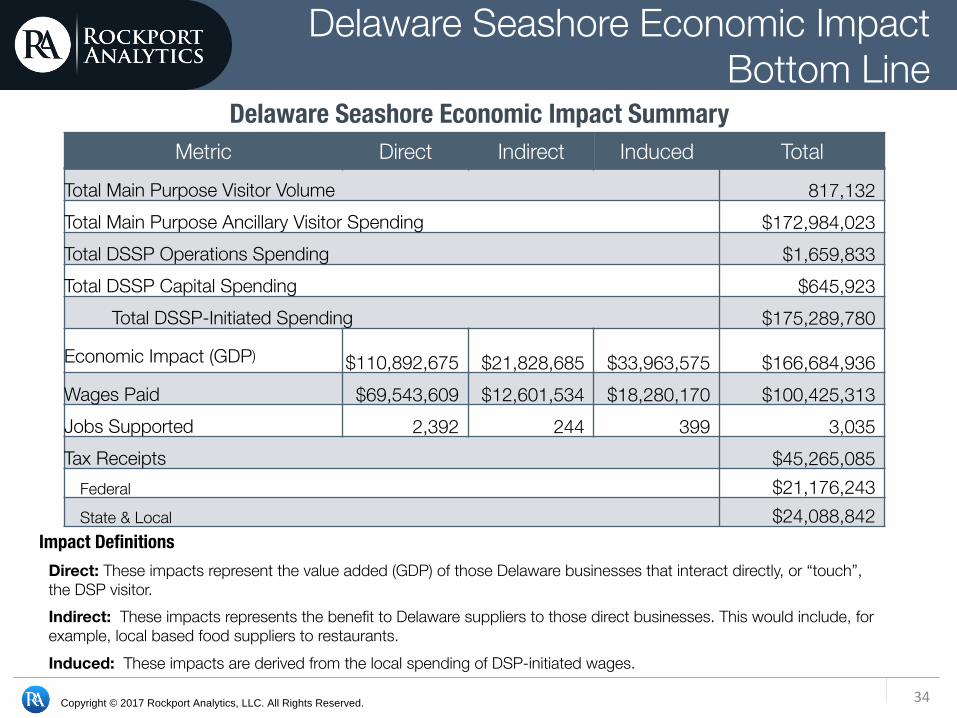
Metric Direct Indirect Induced TotalTotal Main Purpose Visitor Volume 817,132Total Main Purpose Ancillary Visitor Spending $172,984,023 Total DSSP Operations Spending $1,659,833 Total DSSP Capital Spending $645,923
Total DSSP-Initiated Spending $175,289,780
Economic Impact (GDP) $110,892,675 $21,828,685 $33,963,575 $166,684,936 Wages Paid $69,543,609 $12,601,534 $18,280,170 $100,425,313 Jobs Supported 2,392 244 399 3,035Tax Receipts $45,265,085
Federal $21,176,243 State & Local $24,088,842
Delaware Seashore Economic Impact Summary
Impact DefinitionsDirect: These impacts represent the value added (GDP) of those Delaware businesses that interact directly, or “touch”, the DSP visitor. Indirect: These impacts represents the benefit to Delaware suppliers to those direct businesses. This would include, for example, local based food suppliers to restaurants. Induced: These impacts are derived from the local spending of DSP-initiated wages.
Copyright © 2017 Rockport Analytics, LLC. All Rights Reserved. 35
DE Seashore-Initiated Tax Revenue
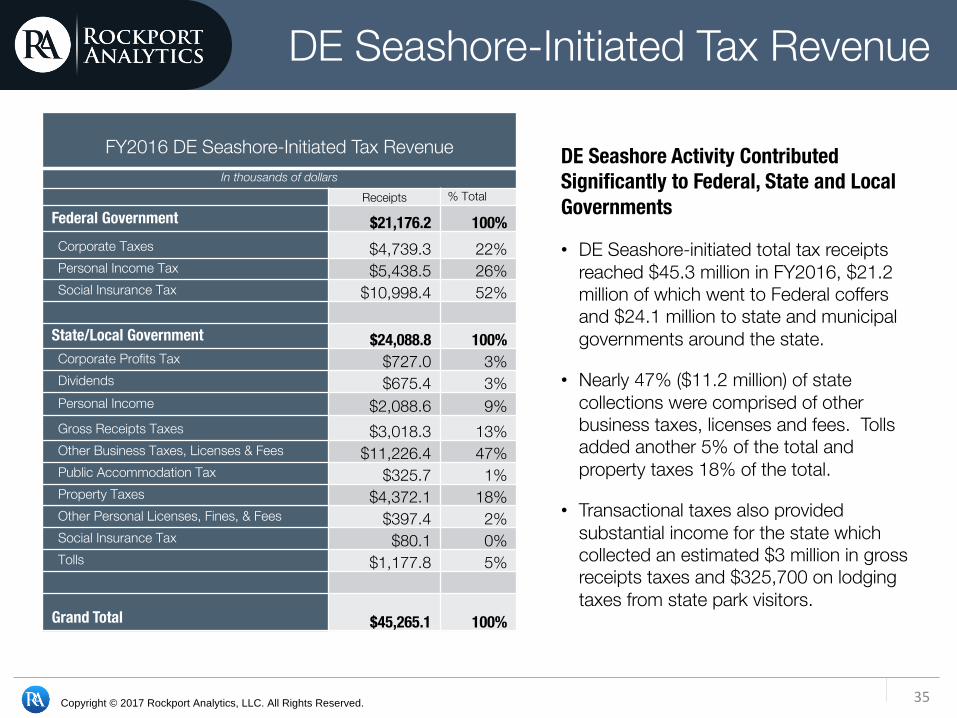
DE Seashore Activity Contributed Significantly to Federal, State and Local Governments
• DE Seashore-initiated total tax receipts reached $45.3 million in FY2016, $21.2 million of which went to Federal coffers and $24.1 million to state and municipal governments around the state.
• Nearly 47% ($11.2 million) of state collections were comprised of other business taxes, licenses and fees. Tolls added another 5% of the total and property taxes 18% of the total.
• Transactional taxes also provided substantial income for the state which collected an estimated $3 million in gross receipts taxes and $325,700 on lodging taxes from state park visitors.
FY2016 DE Seashore-Initiated Tax RevenueIn thousands of dollars
Receipts % Total
Federal Government $21,176.2 100% Corporate Taxes $4,739.3 22% Personal Income Tax $5,438.5 26% Social Insurance Tax $10,998.4 52%
State/Local Government $24,088.8 100% Corporate Profits Tax $727.0 3% Dividends $675.4 3% Personal Income $2,088.6 9% Gross Receipts Taxes $3,018.3 13% Other Business Taxes, Licenses & Fees $11,226.4 47% Public Accommodation Tax $325.7 1% Property Taxes $4,372.1 18% Other Personal Licenses, Fines, & Fees $397.4 2% Social Insurance Tax $80.1 0% Tolls $1,177.8 5%
Grand Total $45,265.1 100%

Copyright © 2017 Rockport Analytics, LLC. All Rights Reserved. 36
DE Seashore-Initiated State & Local Taxes Collections Come From a Variety of Sources
Corporate Profits Tax
3.0% Dividends2.8% Personal Income
8.7%
Gross Receipts tax12.5%
Other Business Taxes, Licenses & Fees
46.6%
Public Accommodation Tax1.4%
Property Taxes18.1%
Other Personal Licenses, Fines, & Fees1.6%
Social Insurance Tax0.3% Tolls
4.9%
FY2016 Delaware Sea Shore State Park State & Local Tourism Tax SourcesTotal = $24.1 million
Source: Rockport Analytics, IMPLAN, Delaware Department of Revenue & Transportation

37
Killens Pond State ParkVisitor Performance, Spending & Economic Impact
Copyright © 2017 Rockport Analytics, LLC. All Rights Reserved. 38
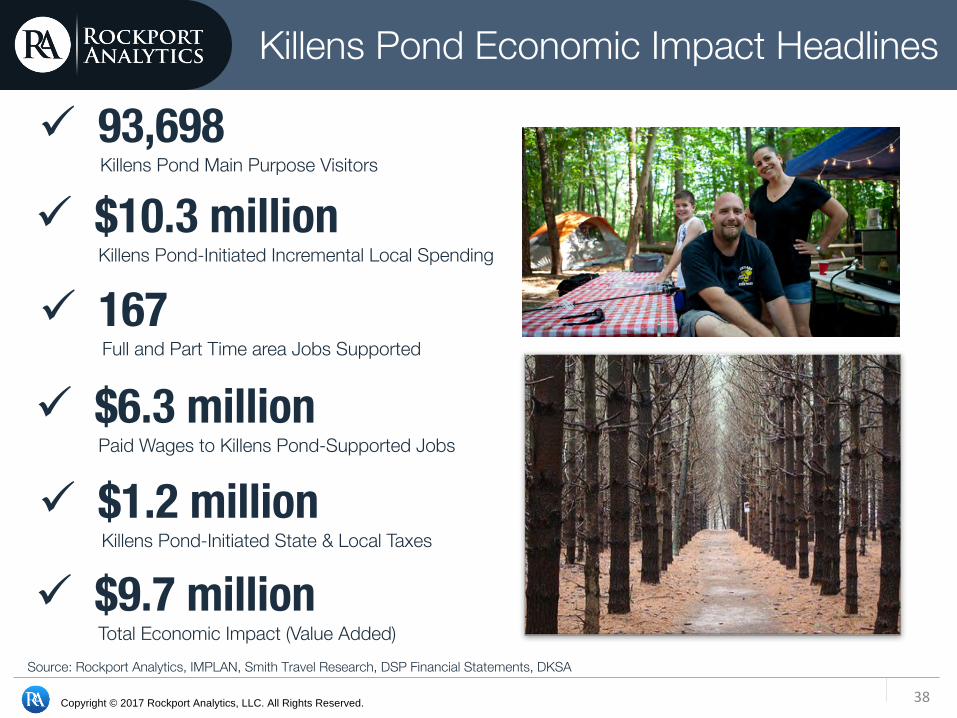
Killens Pond Economic Impact Headlines
ü $9.7 millionTotal Economic Impact (Value Added)
ü $1.2 millionKillens Pond-Initiated State & Local Taxes
ü 93,698Killens Pond Main Purpose Visitors
ü 167Full and Part Time area Jobs Supported
Source: Rockport Analytics, IMPLAN, Smith Travel Research, DSP Financial Statements, DKSA
ü $10.3 million Killens Pond-Initiated Incremental Local Spending
ü $6.3 millionPaid Wages to Killens Pond-Supported Jobs
Copyright © 2017 Rockport Analytics, LLC. All Rights Reserved. 39
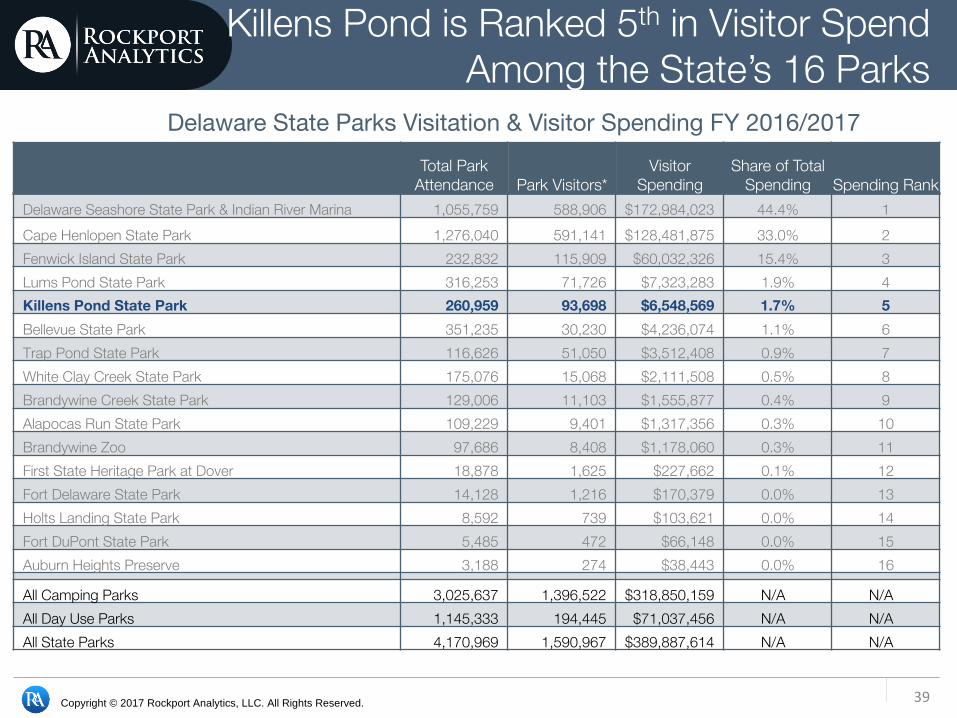
Killens Pond is Ranked 5th in Visitor Spend Among the State’s 16 Parks
Delaware State Parks Visitation & Visitor Spending FY 2016/2017Total Park
Attendance Park Visitors*Visitor
SpendingShare of Total
Spending Spending RankDelaware Seashore State Park & Indian River Marina 1,055,759 588,906 $172,984,023 44.4% 1Cape Henlopen State Park 1,276,040 591,141 $128,481,875 33.0% 2Fenwick Island State Park 232,832 115,909 $60,032,326 15.4% 3Lums Pond State Park 316,253 71,726 $7,323,283 1.9% 4Killens Pond State Park 260,959 93,698 $6,548,569 1.7% 5Bellevue State Park 351,235 30,230 $4,236,074 1.1% 6Trap Pond State Park 116,626 51,050 $3,512,408 0.9% 7White Clay Creek State Park 175,076 15,068 $2,111,508 0.5% 8Brandywine Creek State Park 129,006 11,103 $1,555,877 0.4% 9Alapocas Run State Park 109,229 9,401 $1,317,356 0.3% 10Brandywine Zoo 97,686 8,408 $1,178,060 0.3% 11First State Heritage Park at Dover 18,878 1,625 $227,662 0.1% 12Fort Delaware State Park 14,128 1,216 $170,379 0.0% 13Holts Landing State Park 8,592 739 $103,621 0.0% 14Fort DuPont State Park 5,485 472 $66,148 0.0% 15Auburn Heights Preserve 3,188 274 $38,443 0.0% 16
All Camping Parks 3,025,637 1,396,522 $318,850,159 N/A N/AAll Day Use Parks 1,145,333 194,445 $71,037,456 N/A N/AAll State Parks 4,170,969 1,590,967 $389,887,614 N/A N/A
Copyright © 2017 Rockport Analytics, LLC. All Rights Reserved. 40
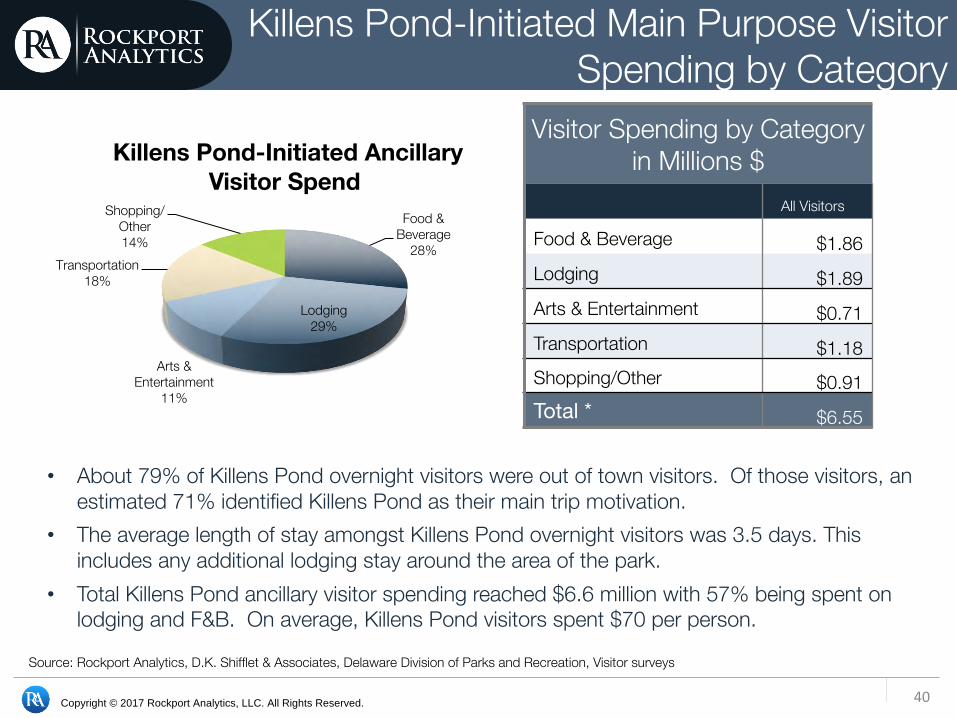
Killens Pond-Initiated Main Purpose Visitor Spending by Category
Visitor Spending by Category in Millions $
All Visitors
Food & Beverage $1.86 Lodging $1.89 Arts & Entertainment $0.71 Transportation $1.18 Shopping/Other $0.91 Total * $6.55
• About 79% of Killens Pond overnight visitors were out of town visitors. Of those visitors, an estimated 71% identified Killens Pond as their main trip motivation.
• The average length of stay amongst Killens Pond overnight visitors was 3.5 days. This includes any additional lodging stay around the area of the park.
• Total Killens Pond ancillary visitor spending reached $6.6 million with 57% being spent on lodging and F&B. On average, Killens Pond visitors spent $70 per person.
Source: Rockport Analytics, D.K. Shifflet & Associates, Delaware Division of Parks and Recreation, Visitor surveys
Food & Beverage
28%
Lodging29%
Arts & Entertainment
11%
Transportation18%
Shopping/Other14%
Killens Pond-Initiated Ancillary Visitor Spend

Copyright © 2017 Rockport Analytics, LLC. All Rights Reserved. 41
Killens Pond Economic Impact Bottom Line
Metric Direct Indirect Induced TotalTotal Main Purpose Visitor Volume 156,453Total Main Purpose Ancillary Visitor Spending $6,548,569 Total Killens Pond Operations Spending $490,058 Total Killens Pond Capital Spending $3,214,094
Total Killens Pond-Initiated Spending $10,252,721 Economic Impact (GDP) $6,234,514 $1,322,298 $2,133,934 $9,690,747Wages Paid $4,355,435 $790,539 $1,148,297 $6,294,271 Jobs Supported 128 14 25 167Tax Receipts $2,413,403 Federal $1,255,355 State & Local $1,158,048
Killens Pond Economic Impact Summary
Impact DefinitionsDirect: These impacts represent the value added (GDP) of those Delaware businesses that interact directly, or “touch”, the DSP visitor. Indirect: These impacts represents the benefit to Delaware suppliers to those direct businesses. This would include, for example, local based food suppliers to restaurants. Induced: These impacts are derived from the local spending of DSP-initiated wages.
Copyright © 2017 Rockport Analytics, LLC. All Rights Reserved. 42
Killens Pond-Initiated Tax Revenue
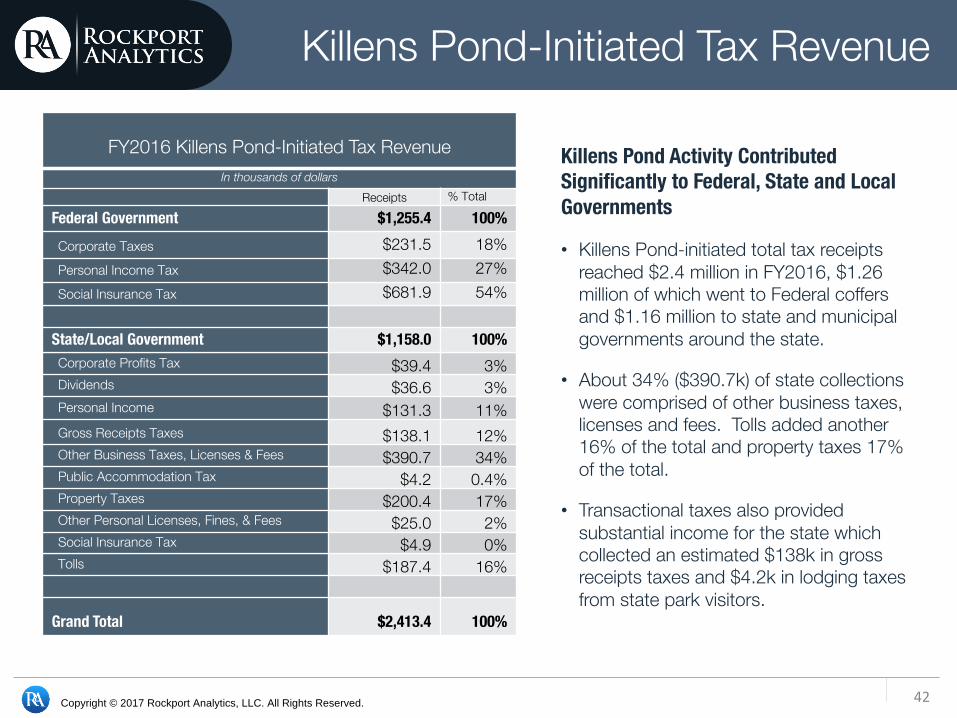
Killens Pond Activity Contributed Significantly to Federal, State and Local Governments
• Killens Pond-initiated total tax receipts reached $2.4 million in FY2016, $1.26 million of which went to Federal coffers and $1.16 million to state and municipal governments around the state.
• About 34% ($390.7k) of state collections were comprised of other business taxes, licenses and fees. Tolls added another 16% of the total and property taxes 17% of the total.
• Transactional taxes also provided substantial income for the state which collected an estimated $138k in gross receipts taxes and $4.2k in lodging taxes from state park visitors.
FY2016 Killens Pond-Initiated Tax RevenueIn thousands of dollars
Receipts % Total
Federal Government $1,255.4 100% Corporate Taxes $231.5 18% Personal Income Tax $342.0 27% Social Insurance Tax $681.9 54%
State/Local Government $1,158.0 100% Corporate Profits Tax $39.4 3% Dividends $36.6 3% Personal Income $131.3 11% Gross Receipts Taxes $138.1 12% Other Business Taxes, Licenses & Fees $390.7 34% Public Accommodation Tax $4.2 0.4% Property Taxes $200.4 17% Other Personal Licenses, Fines, & Fees $25.0 2% Social Insurance Tax $4.9 0% Tolls $187.4 16%
Grand Total $2,413.4 100%
Copyright © 2017 Rockport Analytics, LLC. All Rights Reserved. 43
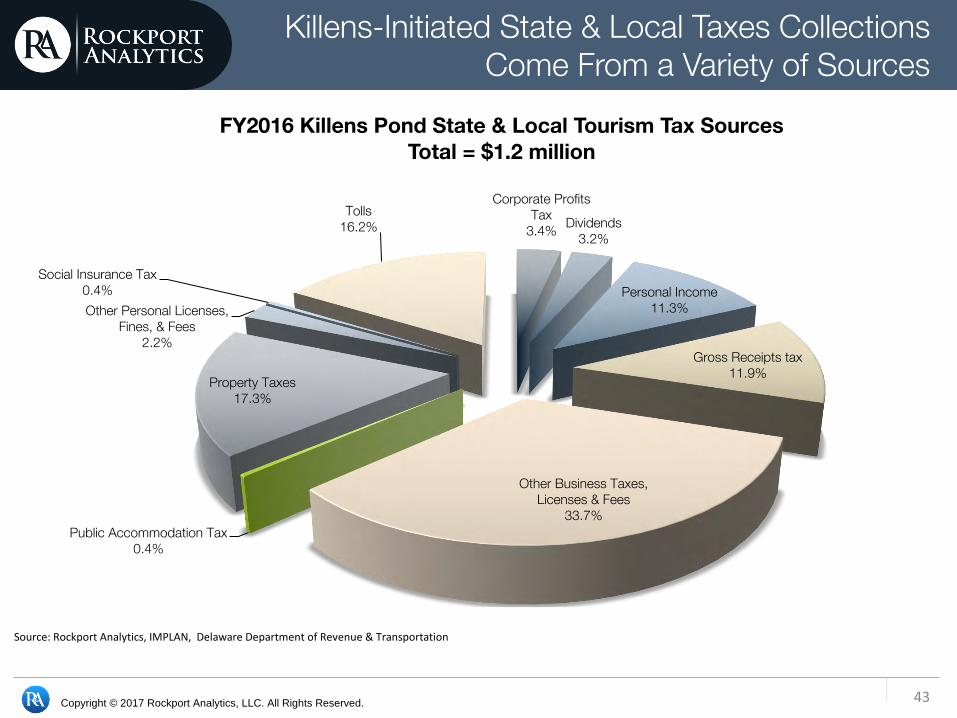
Killens-Initiated State & Local Taxes Collections Come From a Variety of Sources
Corporate Profits Tax
3.4% Dividends3.2%
Personal Income11.3%
Gross Receipts tax11.9%
Other Business Taxes, Licenses & Fees
33.7%Public Accommodation Tax
0.4%
Property Taxes17.3%
Other Personal Licenses, Fines, & Fees
2.2%
Social Insurance Tax0.4%
Tolls16.2%
FY2016 Killens Pond State & Local Tourism Tax SourcesTotal = $1.2 million
Source:RockportAnalytics,IMPLAN,DelawareDepartmentofRevenue&Transportation
44
Lums Pond State ParkVisitor Performance, Spending & Economic Impact
Copyright © 2017 Rockport Analytics, LLC. All Rights Reserved. 45
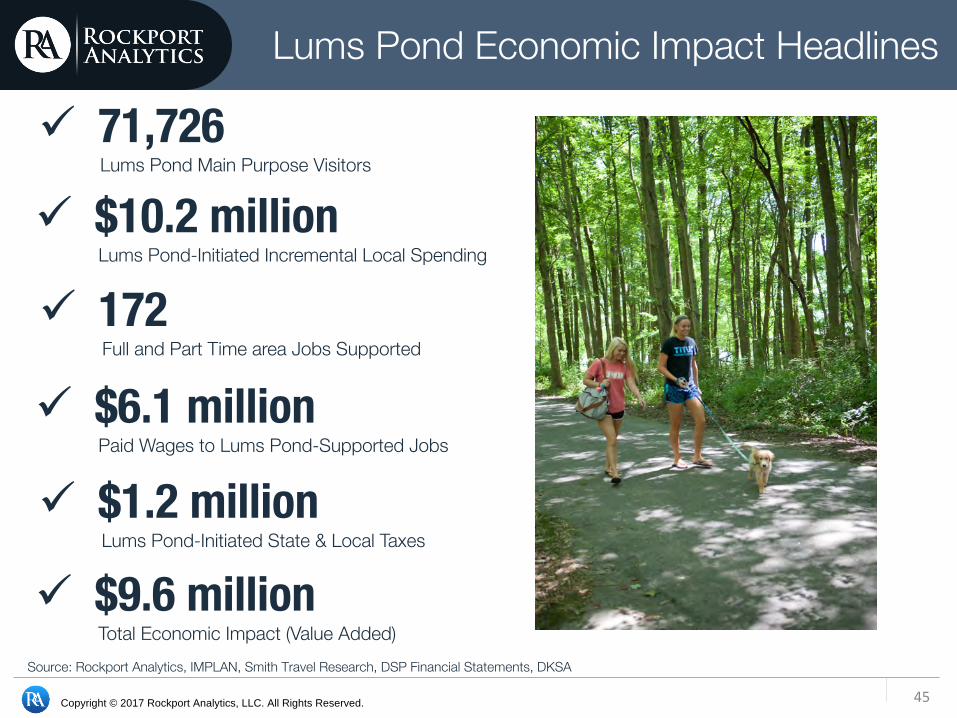
Lums Pond Economic Impact Headlines
ü $9.6 millionTotal Economic Impact (Value Added)
ü $1.2 millionLums Pond-Initiated State & Local Taxes
ü 71,726Lums Pond Main Purpose Visitors
ü 172Full and Part Time area Jobs Supported
Source: Rockport Analytics, IMPLAN, Smith Travel Research, DSP Financial Statements, DKSA
ü $10.2 million Lums Pond-Initiated Incremental Local Spending
ü $6.1 millionPaid Wages to Lums Pond-Supported Jobs

Copyright © 2017 Rockport Analytics, LLC. All Rights Reserved. 46
Lums Pond is Ranked 4th in Visitor Spend Among the State’s 16 Parks
Delaware State Parks Visitation & Visitor Spending FY 2016/2017Total Park
Attendance Park Visitors*Visitor
SpendingShare of Total
Spending Spending RankDelaware Seashore State Park & Indian River Marina 1,055,759 588,906 $172,984,023 44.4% 1Cape Henlopen State Park 1,276,040 591,141 $128,481,875 33.0% 2Fenwick Island State Park 232,832 115,909 $60,032,326 15.4% 3Lums Pond State Park 316,253 71,726 $7,323,283 1.9% 4Killens Pond State Park 260,959 93,698 $6,548,569 1.7% 5Bellevue State Park 351,235 30,230 $4,236,074 1.1% 6Trap Pond State Park 116,626 51,050 $3,512,408 0.9% 7White Clay Creek State Park 175,076 15,068 $2,111,508 0.5% 8Brandywine Creek State Park 129,006 11,103 $1,555,877 0.4% 9Alapocas Run State Park 109,229 9,401 $1,317,356 0.3% 10Brandywine Zoo 97,686 8,408 $1,178,060 0.3% 11First State Heritage Park at Dover 18,878 1,625 $227,662 0.1% 12Fort Delaware State Park 14,128 1,216 $170,379 0.0% 13Holts Landing State Park 8,592 739 $103,621 0.0% 14Fort DuPont State Park 5,485 472 $66,148 0.0% 15Auburn Heights Preserve 3,188 274 $38,443 0.0% 16
All Camping Parks 3,025,637 1,396,522 $318,850,159 N/A N/AAll Day Use Parks 1,145,333 194,445 $71,037,456 N/A N/AAll State Parks 4,170,969 1,590,967 $389,887,614 N/A N/A

Copyright © 2017 Rockport Analytics, LLC. All Rights Reserved. 47
Lums Pond-Initiated Main Purpose Visitor Spending by Category
Visitor Spending by Category in Millions $
All Visitors
Food & Beverage $2.04 Lodging $1.82 Arts & Entertainment $1.08 Transportation $0.98 Shopping/Other $1.41 Total * $7.32
• About 65% of Lums Pond overnight visitors were out of town visitors. Of those overnight visitors, an estimated 63% identified Lums Pond as their main trip motivation.
• The average length of stay amongst Lums Pond overnight visitors was 3.5 days. This includes any additional lodging stay around the area of the park.
• Total Lums Pond ancillary visitor spending eclipsed $7 million with 53% being spent on lodging and F&B. On average, Lums Pond visitors spent $102 per person.
Source: Rockport Analytics, D.K. Shifflet & Associates, Delaware Division of Parks and Recreation
Food&Beverage
19%
Lodging53%
Arts&Entertainment
5%
Transportation10%
Shopping/Other13%
Lums Pond-Initiated Ancillary Visitor Spend
Copyright © 2017 Rockport Analytics, LLC. All Rights Reserved. 48
Lums Pond Economic Impact Bottom Line
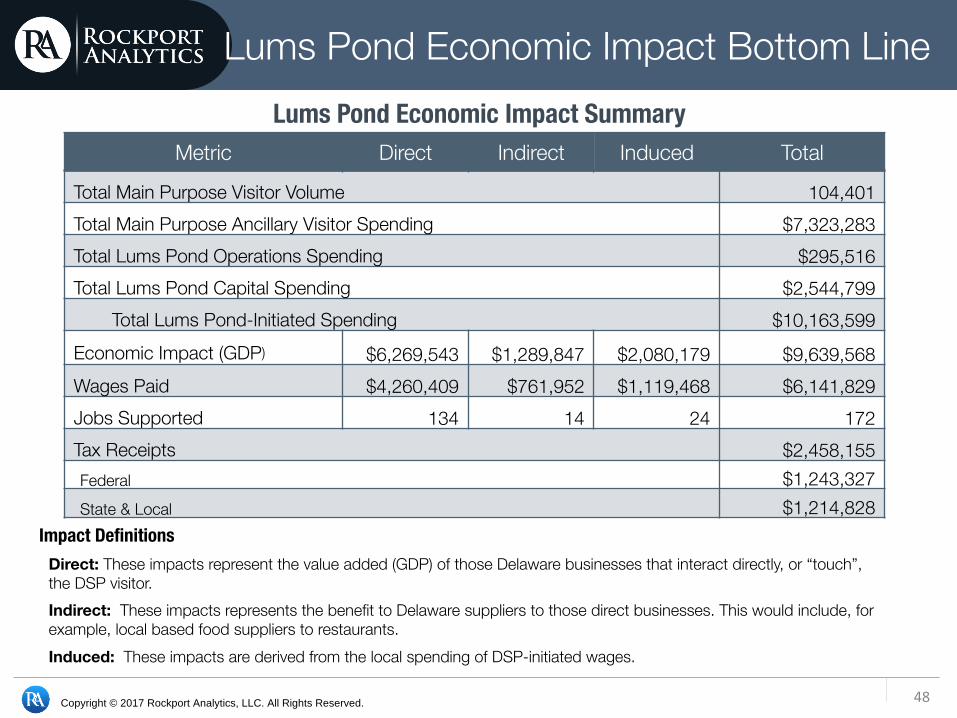
Metric Direct Indirect Induced Total
Total Main Purpose Visitor Volume 104,401Total Main Purpose Ancillary Visitor Spending $7,323,283 Total Lums Pond Operations Spending $295,516 Total Lums Pond Capital Spending $2,544,799
Total Lums Pond-Initiated Spending $10,163,599 Economic Impact (GDP) $6,269,543 $1,289,847 $2,080,179 $9,639,568Wages Paid $4,260,409 $761,952 $1,119,468 $6,141,829 Jobs Supported 134 14 24 172Tax Receipts $2,458,155 Federal $1,243,327 State & Local $1,214,828
Lums Pond Economic Impact Summary
Impact DefinitionsDirect: These impacts represent the value added (GDP) of those Delaware businesses that interact directly, or “touch”, the DSP visitor. Indirect: These impacts represents the benefit to Delaware suppliers to those direct businesses. This would include, for example, local based food suppliers to restaurants. Induced: These impacts are derived from the local spending of DSP-initiated wages.

Copyright © 2017 Rockport Analytics, LLC. All Rights Reserved. 49
Lums Pond-Initiated Tax Revenue
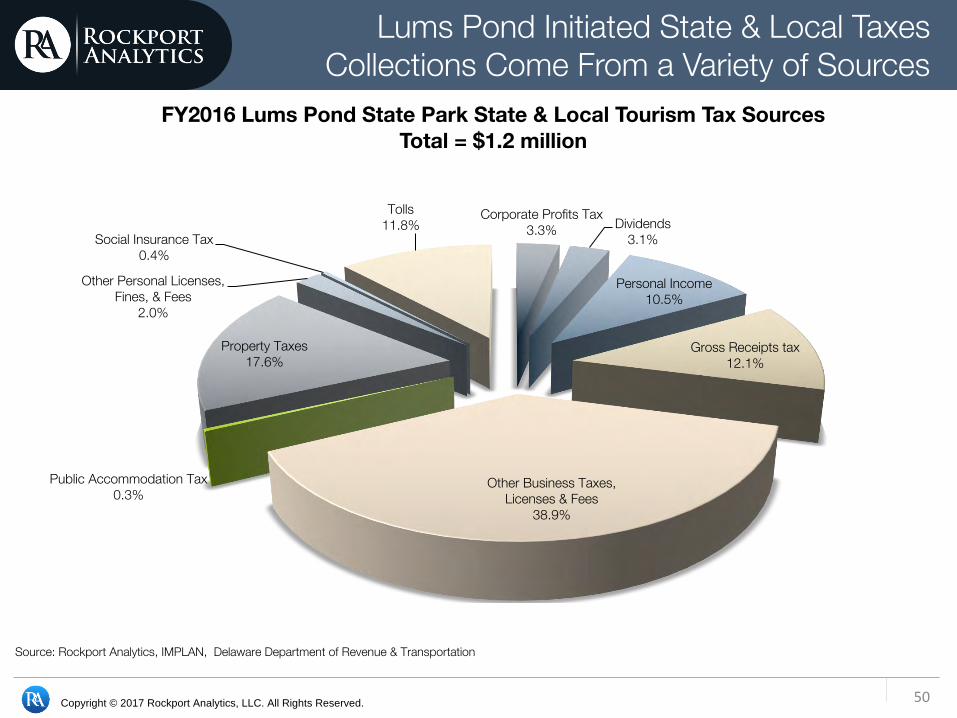
Lums Pond Activity Contributed Significantly to Federal, State and Local Governments
• Lums Pond-initiated total tax receipts reached $2.5 million in FY2016, $1.2 million of which went to Federal coffers with another $1.2 million supporting state and municipal governments around the state.
• About 39% ($472k) of state collections were comprised of other business taxes, licenses and fees. Tolls added another 12% of the total and property taxes 18% of the total.
• Transactional taxes also provided substantial income for the state which collected an estimated $147.1k in gross receipts taxes and $4.1k in lodging taxes from state park visitors.
FY2016 Lums Pond-Initiated Tax RevenueIn thousands of dollars
Receipts % Total
Federal Government $1,243.3 100% Corporate Taxes $241.8 19% Personal Income Tax $333.2 27% Social Insurance Tax $668.3 54%
State/Local Government $1,214.8 100% Corporate Profits Tax $40.0 3% Dividends $37.1 3% Personal Income $128.0 11% Gross Receipts Taxes $147.1 12% Other Business Taxes, Licenses & Fees $472.6 39% Public Accommodation Tax $4.1 0.3% Property Taxes $213.3 18% Other Personal Licenses, Fines, & Fees $24.4 2% Social Insurance Tax $4.8 0% Tolls $143.5 12%
Grand Total $2,458.2 100%
Copyright © 2017 Rockport Analytics, LLC. All Rights Reserved. 50
Lums Pond Initiated State & Local Taxes Collections Come From a Variety of Sources
Corporate Profits Tax3.3% Dividends
3.1%
Personal Income10.5%
Gross Receipts tax12.1%
Other Business Taxes, Licenses & Fees
38.9%
Public Accommodation Tax0.3%
Property Taxes17.6%
Other Personal Licenses, Fines, & Fees
2.0%
Social Insurance Tax0.4%
Tolls11.8%
FY2016 Lums Pond State Park State & Local Tourism Tax SourcesTotal = $1.2 million
Source: Rockport Analytics, IMPLAN, Delaware Department of Revenue & Transportation
51
Trap Pond State ParkVisitor Performance, Spending & Economic Impact
Copyright © 2017 Rockport Analytics, LLC. All Rights Reserved. 52
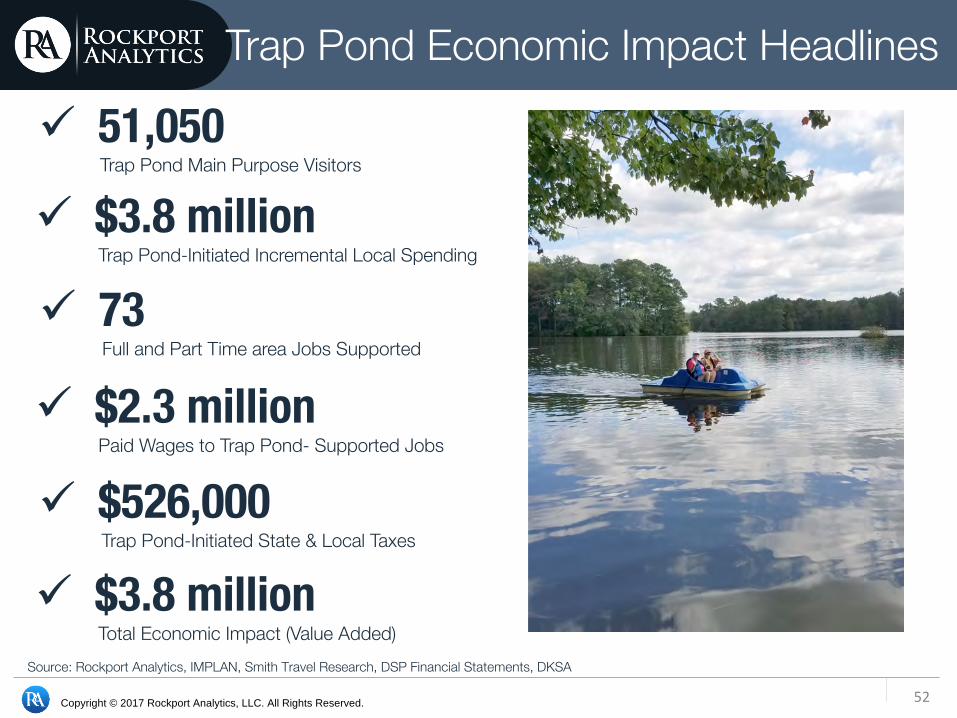
Trap Pond Economic Impact Headlines
ü $3.8 millionTotal Economic Impact (Value Added)
ü $526,000Trap Pond-Initiated State & Local Taxes
ü 51,050Trap Pond Main Purpose Visitors
ü 73Full and Part Time area Jobs Supported
Source: Rockport Analytics, IMPLAN, Smith Travel Research, DSP Financial Statements, DKSA
ü $3.8 million Trap Pond-Initiated Incremental Local Spending
ü $2.3 million Paid Wages to Trap Pond- Supported Jobs
Copyright © 2017 Rockport Analytics, LLC. All Rights Reserved. 53
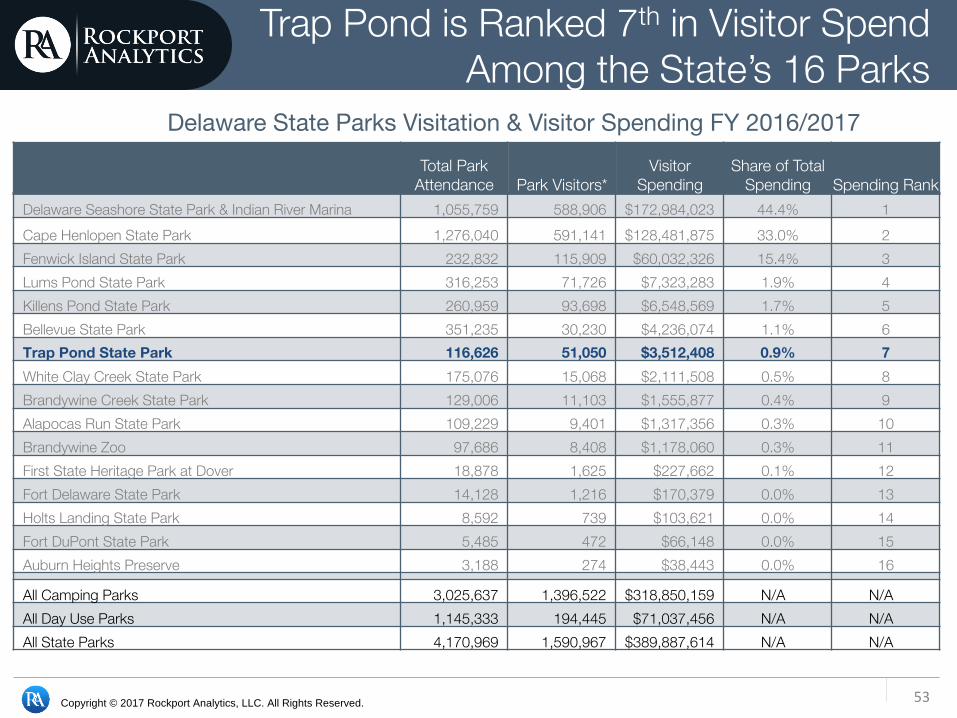
Trap Pond is Ranked 7th in Visitor Spend Among the State’s 16 Parks
Delaware State Parks Visitation & Visitor Spending FY 2016/2017Total Park
Attendance Park Visitors*Visitor
SpendingShare of Total
Spending Spending RankDelaware Seashore State Park & Indian River Marina 1,055,759 588,906 $172,984,023 44.4% 1Cape Henlopen State Park 1,276,040 591,141 $128,481,875 33.0% 2Fenwick Island State Park 232,832 115,909 $60,032,326 15.4% 3Lums Pond State Park 316,253 71,726 $7,323,283 1.9% 4Killens Pond State Park 260,959 93,698 $6,548,569 1.7% 5Bellevue State Park 351,235 30,230 $4,236,074 1.1% 6Trap Pond State Park 116,626 51,050 $3,512,408 0.9% 7White Clay Creek State Park 175,076 15,068 $2,111,508 0.5% 8Brandywine Creek State Park 129,006 11,103 $1,555,877 0.4% 9Alapocas Run State Park 109,229 9,401 $1,317,356 0.3% 10Brandywine Zoo 97,686 8,408 $1,178,060 0.3% 11First State Heritage Park at Dover 18,878 1,625 $227,662 0.1% 12Fort Delaware State Park 14,128 1,216 $170,379 0.0% 13Holts Landing State Park 8,592 739 $103,621 0.0% 14Fort DuPont State Park 5,485 472 $66,148 0.0% 15Auburn Heights Preserve 3,188 274 $38,443 0.0% 16
All Camping Parks 3,025,637 1,396,522 $318,850,159 N/A N/AAll Day Use Parks 1,145,333 194,445 $71,037,456 N/A N/AAll State Parks 4,170,969 1,590,967 $389,887,614 N/A N/A
Copyright © 2017 Rockport Analytics, LLC. All Rights Reserved. 54
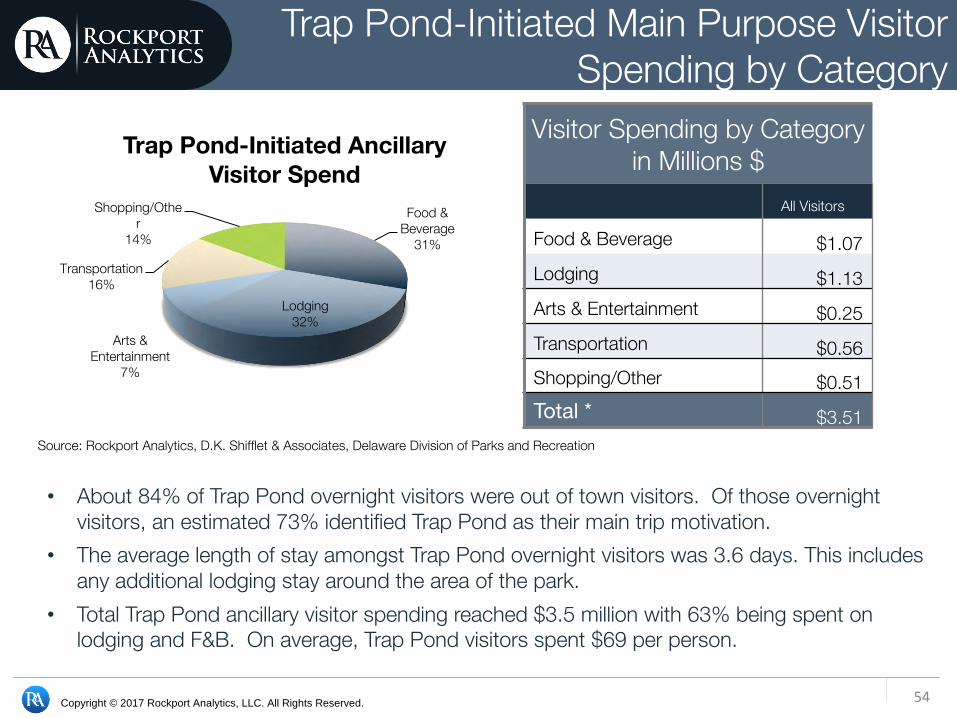
Trap Pond-Initiated Main Purpose Visitor Spending by Category
Visitor Spending by Category in Millions $
All Visitors
Food & Beverage $1.07 Lodging $1.13 Arts & Entertainment $0.25 Transportation $0.56 Shopping/Other $0.51 Total * $3.51
• About 84% of Trap Pond overnight visitors were out of town visitors. Of those overnight visitors, an estimated 73% identified Trap Pond as their main trip motivation.
• The average length of stay amongst Trap Pond overnight visitors was 3.6 days. This includes any additional lodging stay around the area of the park.
• Total Trap Pond ancillary visitor spending reached $3.5 million with 63% being spent on lodging and F&B. On average, Trap Pond visitors spent $69 per person.
Source: Rockport Analytics, D.K. Shifflet & Associates, Delaware Division of Parks and Recreation
Food & Beverage
31%
Lodging32%
Arts & Entertainment
7%
Transportation16%
Shopping/Other
14%
Trap Pond-Initiated Ancillary Visitor Spend

Copyright © 2017 Rockport Analytics, LLC. All Rights Reserved. 55
Trap Pond Economic Impact Bottom Line
Metric Direct Indirect Induced Total
Total Main Purpose Visitor Volume 78,425Total Main Purpose Ancillary Visitor Spending $3,512,408 Total Trap Pond Operations Spending $323,149 Total Trap Pond Capital Spending $7,000
Total Trap Pond-Initiated Spending $3,842,557 Economic Impact (GDP) $2,526,558 $487,321 $789,621 $3,820,858Wages Paid $1,627,141 $282,467 $424,994 $2,345,034 Jobs Supported 58 5 9 73Tax Receipts $1,014,324 Federal $487,915 State & Local $526,409
Trap Pond Economic Impact Summary
Impact DefinitionsDirect: These impacts represent the value added (GDP) of those Delaware businesses that interact directly, or “touch”, the DSP visitor. Indirect: These impacts represents the benefit to Delaware suppliers to those direct businesses. This would include, for example, local based food suppliers to restaurants. Induced: These impacts are derived from the local spending of DSP-initiated wages.
Copyright © 2017 Rockport Analytics, LLC. All Rights Reserved. 56
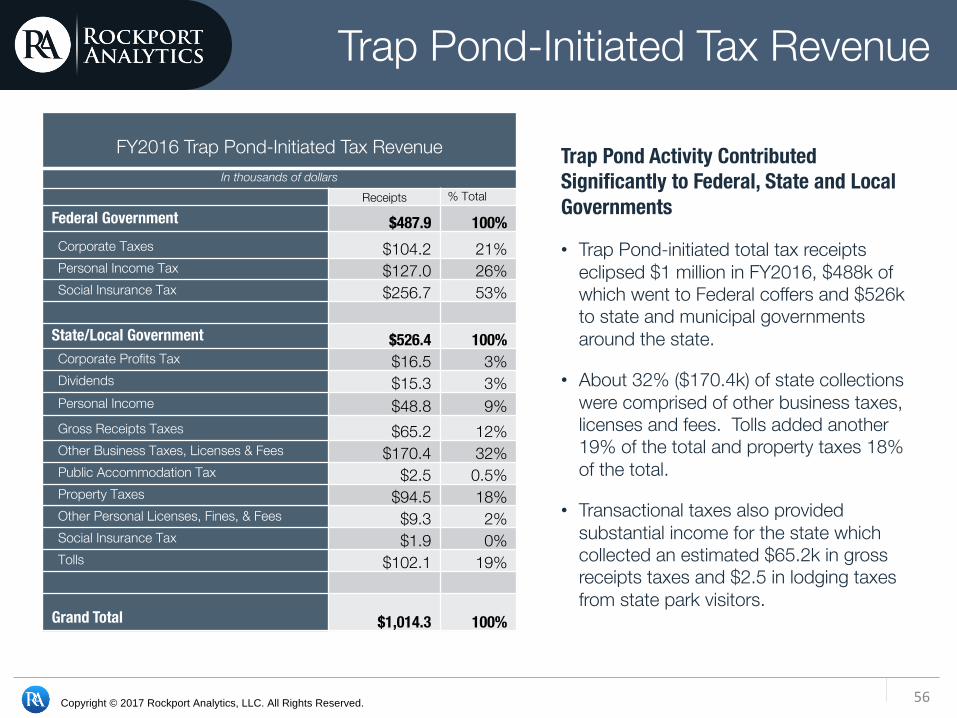
Trap Pond-Initiated Tax Revenue
Trap Pond Activity Contributed Significantly to Federal, State and Local Governments
• Trap Pond-initiated total tax receipts eclipsed $1 million in FY2016, $488k of which went to Federal coffers and $526k to state and municipal governments around the state.
• About 32% ($170.4k) of state collections were comprised of other business taxes, licenses and fees. Tolls added another 19% of the total and property taxes 18% of the total.
• Transactional taxes also provided substantial income for the state which collected an estimated $65.2k in gross receipts taxes and $2.5 in lodging taxes from state park visitors.
FY2016 Trap Pond-Initiated Tax RevenueIn thousands of dollars
Receipts % Total
Federal Government $487.9 100% Corporate Taxes $104.2 21% Personal Income Tax $127.0 26% Social Insurance Tax $256.7 53%
State/Local Government $526.4 100% Corporate Profits Tax $16.5 3% Dividends $15.3 3% Personal Income $48.8 9% Gross Receipts Taxes $65.2 12% Other Business Taxes, Licenses & Fees $170.4 32% Public Accommodation Tax $2.5 0.5% Property Taxes $94.5 18% Other Personal Licenses, Fines, & Fees $9.3 2% Social Insurance Tax $1.9 0% Tolls $102.1 19%
Grand Total $1,014.3 100%

Copyright © 2017 Rockport Analytics, LLC. All Rights Reserved. 57
Trap-Initiated State & Local Taxes Collections Come From a Variety of Sources
Corporate Profits Tax
3.1% Dividends2.9%
Personal Income9.3%
Gross Receipts tax12.4%
Other Business Taxes, Licenses & Fees
32.4%
Public Accommodation Tax0.5%
Property Taxes18.0%
Other Personal Licenses, Fines, & Fees
1.8%
Social Insurance Tax0.4%
Tolls19.4%
FY2016 Trap Pond State Park State & Local Tourism Tax SourcesTotal = $526 thousand
Source: Rockport Analytics, IMPLAN, Delaware Department of Revenue & Transportation
Copyright © 2017 Rockport Analytics, LLC. All Rights Reserved. 58
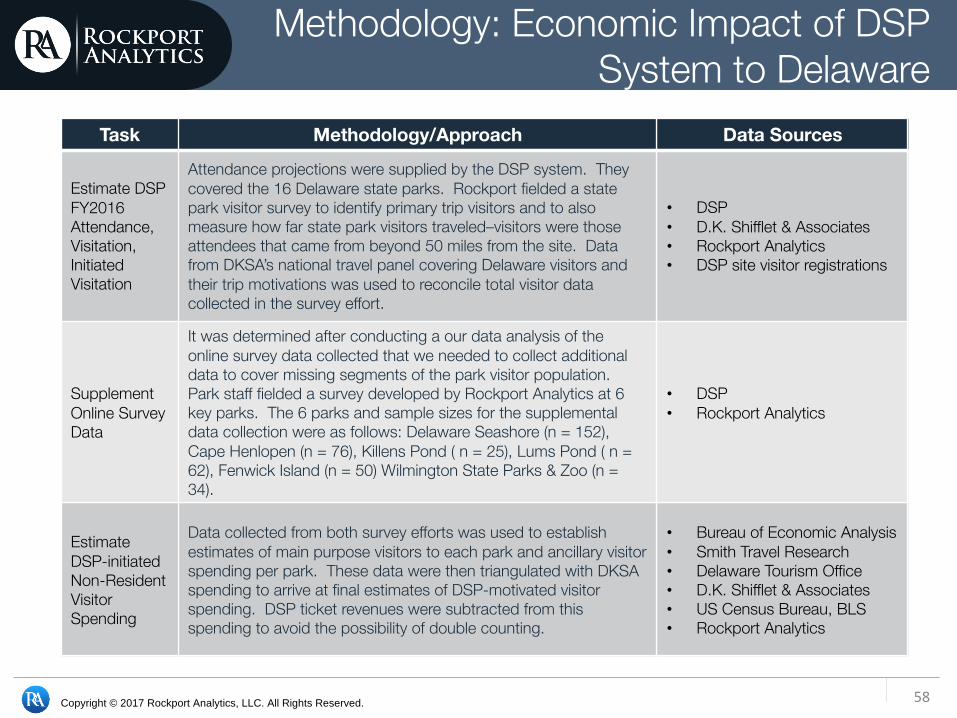
Methodology: Economic Impact of DSP System to Delaware
Task Methodology/Approach Data Sources
Estimate DSP FY2016 Attendance, Visitation, Initiated Visitation
Attendance projections were supplied by the DSP system. They covered the 16 Delaware state parks. Rockport fielded a state park visitor survey to identify primary trip visitors and to also measure how far state park visitors traveled–visitors were those attendees that came from beyond 50 miles from the site. Data from DKSA’s national travel panel covering Delaware visitors and their trip motivations was used to reconcile total visitor data collected in the survey effort.
• DSP• D.K. Shifflet & Associates• Rockport Analytics• DSP site visitor registrations
Supplement Online Survey Data
It was determined after conducting a our data analysis of the online survey data collected that we needed to collect additional data to cover missing segments of the park visitor population. Park staff fielded a survey developed by Rockport Analytics at 6 key parks. The 6 parks and sample sizes for the supplemental data collection were as follows: Delaware Seashore (n = 152), Cape Henlopen (n = 76), Killens Pond ( n = 25), Lums Pond ( n = 62), Fenwick Island (n = 50) Wilmington State Parks & Zoo (n = 34).
• DSP• Rockport Analytics
Estimate DSP-initiatedNon-Resident Visitor Spending
Data collected from both survey efforts was used to establish estimates of main purpose visitors to each park and ancillary visitor spending per park. These data were then triangulated with DKSA spending to arrive at final estimates of DSP-motivated visitor spending. DSP ticket revenues were subtracted from this spending to avoid the possibility of double counting.
• Bureau of Economic Analysis• Smith Travel Research• Delaware Tourism Office• D.K. Shifflet & Associates• US Census Bureau, BLS• Rockport Analytics

Copyright © 2017 Rockport Analytics, LLC. All Rights Reserved. 59
Methodology: Economic Impact of DSP System to Delaware (continued)
Task Methodology/Approach Data Sources
Estimate DSP Operations & CapitalSpending
Operating revenue, costs, and capital spending was supplied by DSP. Revenue was used only to reduce visitor spending in the entertainment category as described above. Careful attention was used to avoid double counting. Operating and capex expenditures are another important contribution of the DSP.
• DSP• Rockport Analytics
Translatespending into economic impact on Delaware on local markets
Spending streams for visitors and operations by detailed category are inputted into the latest (2016) IMPLAN economic models for the Delaware and its counties. Contributions to GDP, jobs, wages, and taxes are estimated by the model. IMPLAN is a non-proprietary model of the regional economy that is widely used by to assess the economic impact of public and private investments.
• IMPLAN (www.implan.com)
CalculateDelaware state & local taxes generated by the DSP system
Taxes directly applicable to visitor & operational transactions are calculated using the categorical spending described above against appropriate current tax rates less any exemptions.
• Delaware Department of Revenue
• Delaware tourism taxes & rates
• Other local tax authorities• Rockport Analytics

Copyright © 2017 Rockport Analytics, LLC. All Rights Reserved. 60
Contact
Rockport Analytics West Chester, PA
Annapolis, MD
web: rockportanalytics.comemail: [email protected]
phone: (866) 481-9877
![ROCKPORT PUBLIC SCHOOLS GIVES BACK: A FIRST NIGHT · [ ROCKPORT, MA ] WELCOME TO RPS GIVES BACK: A FIRST NIGHT FOR EDUCATION The Rockport Public School Community and the Town of Rockport](https://img.pdfslide.us/doc/110x75/5f291645751f531d1b49dcd6/rockport-public-schools-gives-back-a-first-night-rockport-ma-welcome-to-rps.jpg)