Embed Size (px)
Citation preview

Results of the 2011 Post-High School Follow-Up Survey
September 30, 2011
Prepared for the Indiana Department of Education by:
Terry Spradlin, Director for Education Policy & Project Manager Stephen Hiller, Graduate Research Assistant
Aaron Robinson, Undergraduate Research Assistant

Center for Evaluation & Education Policy Jonathan A. Plucker, Ph.D.
Director
1900 East Tenth Street Bloomington, IN 47406-7512
812-855-4438
More about the Center for Evaluation and Education Policy and our publications can be found on our website:
http://ceep.indiana.edu
Page ii

The 2011 Post-High School Follow-Up Survey
Acknowledgements The Center for Evaluation & Education Policy would like to acknowledge its business partners in the completion of this report. First, we extend our appreciation to Briljent, LLC, who provided the print and mail services for the survey. In particular, we are grateful to Theresa Walker, Vice President of Procurement, and Kasia Gilliland, Senior Project Manager, for the coordination and management of the printing and mailing of the survey. Next, we extend our gratitude to staff from Stone Research Services, the business partner that completed the phone surveys to compile extensive youth respondent records for this report. Key staff from Stone Research Services included Teresa Young, Director of Client Services/Operations, who was involved in the initial planning, bidding, and scheduling of the project; Jason Anderson, Account Manager, who was responsible for the operational execution and completion of the research project, communicated project status to the CEEP management team, and relayed project information from CEEP to the Bloomington Call Center; Cathy Stewart, Data Processing Manager, who monitored data throughout fielding to ensure responses were being captured correctly, merged the telephone, mail-in, and online data files to create an overall data set which was used in the creation of cross-tabulated results using weighted tabulations, and was also responsible for the text editing and coding of this project; Michelle Marks, Programmer, who created the CATI (Computer Assisted Telephone Interviewing) program for interviewers to use while dialing and also processed the sample file and loaded it into the CATI software; and finally, Lorraine Lovig, Bloomington Call Center Director, who was responsible for the management of the Bloomington Call Center and enforcing standard interviewing practices and quality controls and who trained and managed interviewers and supervisory staff so that all study specifications were met. Finally, we would also like to thank Teresa Grossi, Ph.D., Director of the Center on Community Living and Careers, at the Indiana Institute on Disability and Community, for her contributions and insights in 2010 on the development of the survey questionnaire, as well as John Hill, Exceptional Learners Specialist, Indiana Department of Education, for his guidance and collaboration on this report.
Page iii

The 2011 Post-High School Follow-Up Survey
Table o Th
f Contents
e 2011 Indiana Department of Education PostHigh School FollowUp Survey ........................ 1 Objectives of Study Methodology ................................................................................................................................. 1
Survey Development ......................................................................................................................................................... 2
Phase 1: Mail Survey .......................................................................................................................................................... 2
Phase 2: Phone Survey ...................................................................................................................................................... 2
Sample Statistics ................................................................................................................................................................. 4
Margin of Error .................................................................................................................................................................... 5
Respondent Selection and Sample Control .............................................................................................................. 5
Response Rate ...................................................................................................................................................................... 5
Survey Results ........................................................................................................................................................... 6 Statewide Aggregate Data Analysis .................................................................................................................. 9 Data on Mutually Exclusive Categories of “Leavers” ............................................................................................ 9
Data for Measures/Indicators ..................................................................................................................................... 10
Weighted Geographic Data Analysis ............................................................................................................. 12 Survey Challenges and Areas for Improvement ....................................................................................... 17 ppendix: Survey Document ............................................................................................................................ 18 A
Page iv

The 2011 Post-High School Follow-Up Survey
Page 1
The 2011 Indiana Department of Education Post-High School Follow-Up Survey
As part of its contract with the Indiana Department of Education (IDOE), the Center for Evaluation & Education Policy (CEEP) at Indiana University conducted a multi-stage survey of youth who are no longer in an Indiana high school, and who had individualized education programs (IEPs) in effect at the time they left school, to determine whether they were enrolled in post secondary education or employed within one year of leaving high school. In accordance with federal mandates (Indicator 14), CEEP worked collaboratively with IDOE staff to develop a survey to examine the effectiveness of Indiana’s special education services in enabling IEP students’ success after they had exited the K-12 educational system. This study is a fact-based effort to collect post-high school follow-up data and prepare it for federal reporting for the Indiana Department of Education, Division of Differentiated Learners. The questions were adapted from federal guidelines with the goal of determining the employment and/or educational status of former IEP students (per 20 U.S.C. 1416(a)(3)(B)), regardless of whether they had received their diploma or not. The 2011 IDOE Post-High School Follow-Up Survey represents the second year CEEP has conducted this survey on behalf of the IDOE. Concurrently with the development of the survey instrument, and in collaboration with IDOE staff, the CEEP Project Team requested that all 292 school corporations as well as charter high schools in the state forward contact information on former IEP high school students via e-mail to CEEP. Contact information requested included the student’s first and last name, home address, telephone number, email address, and student cell phone number. As the survey’s target population was former high school students there was a fairly high probability that a significant percentage of contact information would be inaccurate, and with it some risk of sample bias. However, contact data submitted by school corporations proved to be highly accurate information. Only approximately 18 survey envelopes of 13,378 mailed were returned as undeliverable. Objectives of Study Methodology This research study has three primary methodological objectives:
• Serve as a standardized approach for reliable measurement of special needs students who have exited an Indiana high school and entered the workplace and/or postsecondary education within one year of leaving high school;
• Allow for reliable comparisons to results of similar survey research projects; • Provide a research methodology that facilitates replication in the future and comparison
of results.
The 2011 Post-High School Follow-Up Survey
Page 2
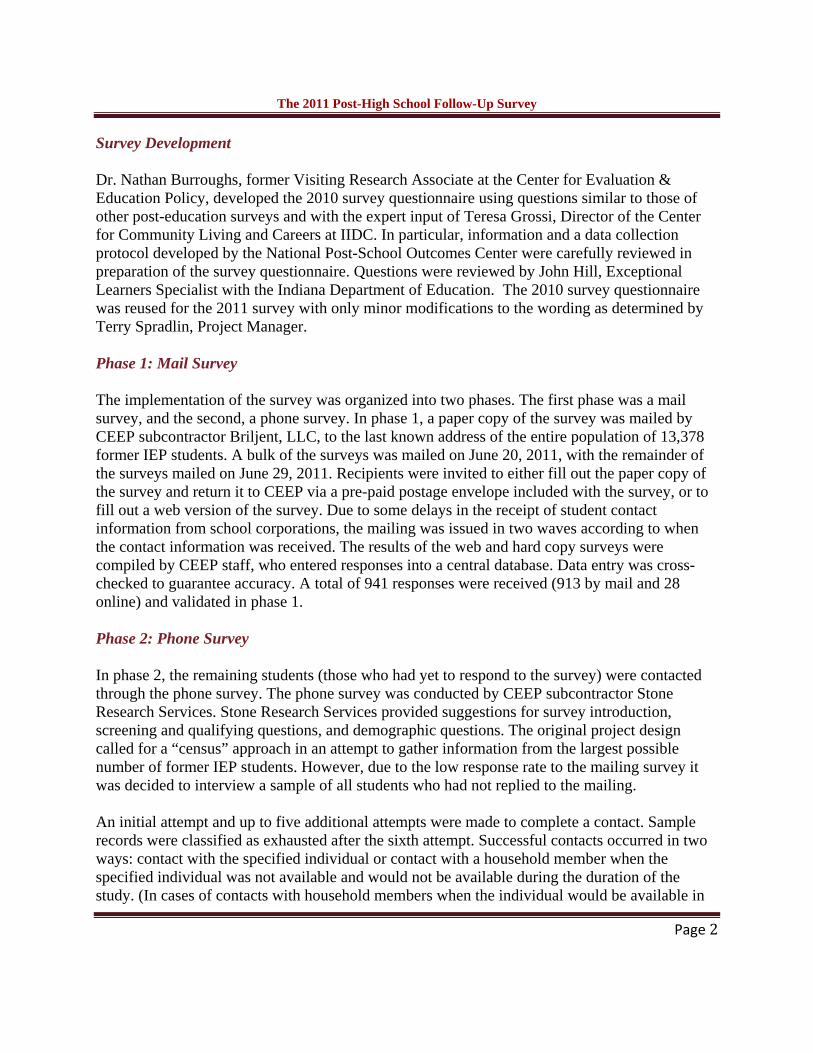
Survey Development Dr. Nathan Burroughs, former Visiting Research Associate at the Center for Evaluation & Education Policy, developed the 2010 survey questionnaire using questions similar to those of other post-education surveys and with the expert input of Teresa Grossi, Director of the Center for Community Living and Careers at IIDC. In particular, information and a data collection protocol developed by the National Post-School Outcomes Center were carefully reviewed in preparation of the survey questionnaire. Questions were reviewed by John Hill, Exceptional Learners Specialist with the Indiana Department of Education. The 2010 survey questionnaire was reused for the 2011 survey with only minor modifications to the wording as determined by Terry Spradlin, Project Manager. Phase 1: Mail Survey The implementation of the survey was organized into two phases. The first phase was a mail survey, and the second, a phone survey. In phase 1, a paper copy of the survey was mailed by CEEP subcontractor Briljent, LLC, to the last known address of the entire population of 13,378 former IEP students. A bulk of the surveys was mailed on June 20, 2011, with the remainder of the surveys mailed on June 29, 2011. Recipients were invited to either fill out the paper copy of the survey and return it to CEEP via a pre-paid postage envelope included with the survey, or to fill out a web version of the survey. Due to some delays in the receipt of student contact information from school corporations, the mailing was issued in two waves according to when the contact information was received. The results of the web and hard copy surveys were compiled by CEEP staff, who entered responses into a central database. Data entry was cross-checked to guarantee accuracy. A total of 941 responses were received (913 by mail and 28 online) and validated in phase 1. Phase 2: Phone Survey In phase 2, the remaining students (those who had yet to respond to the survey) were contacted through the phone survey. The phone survey was conducted by CEEP subcontractor Stone Research Services. Stone Research Services provided suggestions for survey introduction, screening and qualifying questions, and demographic questions. The original project design called for a “census” approach in an attempt to gather information from the largest possible number of former IEP students. However, due to the low response rate to the mailing survey it was decided to interview a sample of all students who had not replied to the mailing. An initial attempt and up to five additional attempts were made to complete a contact. Sample records were classified as exhausted after the sixth attempt. Successful contacts occurred in two ways: contact with the specified individual or contact with a household member when the specified individual was not available and would not be available during the duration of the study. (In cases of contacts with household members when the individual would be available in

The 2011 Post-High School Follow-Up Survey
Page 3
the future, additional attempts were scheduled to reach her/him at an agreeable time. Such contacts with other household members were classified as unsuccessful.) Successful contacts with the former students resulted in one of three possible outcomes:
• Initial refusal to begin interview; • Interview initiated but not completed – individual refused to complete during the time
frame of the project; • Completed interview with individual.
Successful contacts with other household members resulted in three possible outcomes:
• Initial refusal to begin interview; • Interview initiated but not completed – respondent refused to complete during the time
frame of the project; • Completed interview with household member.
Unsuccessful contacts were classified as “live sample - further action” and “dead sample – no further action.” Live samples were eligible for additional attempts if the maximum of six attempts was not yet met. Live sample dispositions included callbacks, no answers, answering machines, and busy signals. Dead sample dispositions were not eligible for additional attempts. Dead sample dispositions include operator intercepts for disconnected numbers, fax numbers, and specified graduate no longer available at that number with no replacement telephone number. Telephone surveys were conducted in a controlled environment to ensure consistency of questionnaire administration among all respondents. Operational controls employed:
• Professional, experienced market research interviewers; • CATI (Computer-Assisted Telephone Interviewing) questionnaire administration; • CATI sample administration.
The CATI sample administration managed scheduling of attempts so that second and subsequent attempts on each sample record were made during different “day parts” and on different days of the week. “Day parts” were classified as “Day Time” (9:00 a.m. to 5:00 p.m.) and “Weekend/Evening” (Saturday noon to 5:00 p.m.; Sunday 5:00 p.m. to 9:00 p.m.; weekday evenings 5:00 p.m. to 9:00 p.m.). All times were based on the respondent’s local time. Field status reports were prepared each day to summarize interviewing activity on a daily and cumulative basis. Data from all survey methods (mailing, phone, and online) were compiled and aggregated to a single master data file. A data file of close-ended responses for each respondent was prepared in a mutually agreed upon format (dbf, flat ascii, Excel, SPSS). Text responses to any open-ended questions were coded, edited, and formatted in an Excel file with one record per respondent.
The 2011 Post-High School Follow-Up Survey
Page 4
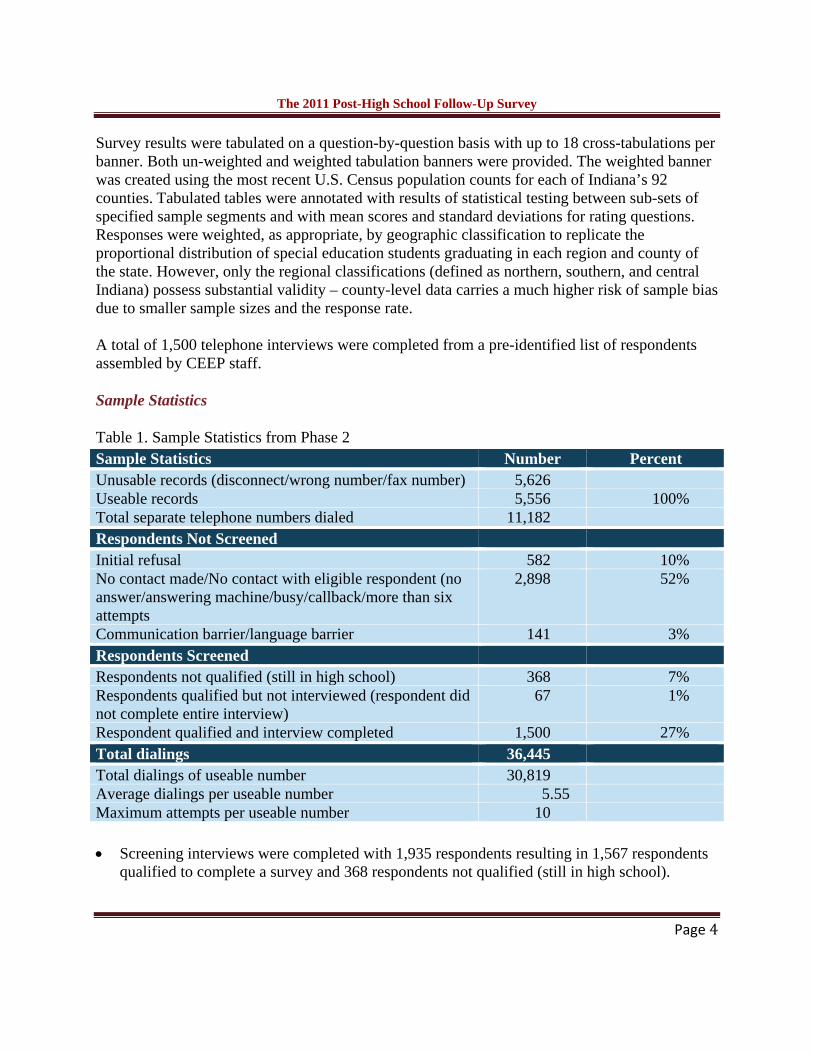
Survey results were tabulated on a question-by-question basis with up to 18 cross-tabulations per banner. Both un-weighted and weighted tabulation banners were provided. The weighted banner was created using the most recent U.S. Census population counts for each of Indiana’s 92 counties. Tabulated tables were annotated with results of statistical testing between sub-sets of specified sample segments and with mean scores and standard deviations for rating questions. Responses were weighted, as appropriate, by geographic classification to replicate the proportional distribution of special education students graduating in each region and county of the state. However, only the regional classifications (defined as northern, southern, and central Indiana) possess substantial validity – county-level data carries a much higher risk of sample bias due to smaller sample sizes and the response rate. Aa
total of 1,500 telephone interviews were completed from a pre-identified list of respondents ssembled by CEEP staff. S
ample Statistics
Table 1. Sample Statistics from Phase 2 Sample Statistics Number Percent Unusable records (disconnect/wrong number/fax number) 5,626 Useable records 5,556 100% Total separate telephone numbers dialed 11,182 Respondents Not Screened Initial refusal 582 10% No contact made/No contact with eligible respondent (no answer/answering machine/busy/callback/more than six attempts
2,898 52%
Communication barrier/language barrier 141 3% Respondents Screened Respondents not qualified (still in high school) 368 7% Respondents qualified but not interviewed (respondent did not complete entire interview)
67 1%
Respondent qualified and interview completed 1,500 27% Total dialings 36,445 Total dialings of useable number 30,819 Average dialings per useable number 5.55 Maximum attempts per useable number 10 • Screening interviews were completed with 1,935 respondents resulting in 1,567 respondents
qualified to complete a survey and 368 respondents not qualified (still in high school).

The 2011 Post-High School Follow-Up Survey
Page 5
• The ratio of initial refusals to completed screening interviews (582/1,935) was 0.3:1 which is well below the average random digit dialing ratio of 2.5:1 and the 1:1 ratio generally seen for pre-identified sample files.
Margin of Error Statistical accuracy of survey findings based on a 1,500 pre-identified but randomly interviewed sample is approximately plus or minus three percentage points at the 95% confidence level. This means that if the survey was replicated 100 times, the results of this survey will fall within plus or minus three percentage points of the average results in 95 out of 100 times. Respondent Selection and Sample Control • Participants were asked for by name listed on the sample file. • Participants were screened to be out of high school. • The sample file was randomly sorted to ensure youth from a mix of school corporations were
interviewed. Response Rate When combining all survey responses (paper, online, phone), approximately 18 percent of students (2,351 of 13,378 students) completed the survey.. This high response rate can be attributed in part to working directly with local education authorities (LEAs) and parent advocacy organizations. Before the survey was distributed, both the Indiana Department of Education and CEEP informed schools and parents about the upcoming survey and the importance of participation. Parents were informed that it would be an opportunity for them to provide feedback to the state in regards to the quality of special education services that their child had received. The statewide parent advocacy organization helped increase awareness by including information via their website and newsletters regarding the importance of completing the surveys.

The 2011 Post-High School Follow-Up Survey
Page 6
Survey Results
(n=2,351 respondents/includes phase 1 and 2 responses combined) *Percentages may not add up to 100% of the 2,351 respondents as some refused to answer or answered “Don’t know,” on particular questions.
1. Have you graduated from high school or left high school for some other reason? 0% answered NO (individuals who indicated that they were still in high school were excluded from the sample and the subsequent survey results.) 100% (2,351) answered YES 2.In the 12 months after leaving high school, have you enrolled and participated in any school, job training, college or other education program? 38.1% (895) answered NO 61.4% (1,443) answered YES
3. (If yes to previous question) Did you complete an entire term? (A term can be
quarter, semester, inter-session, summer, or on-line) 16.8% (243) answered NO 82.1% (1,184) answered YES
4. Describe the kind of school or job training program you were enrolled. a. High school completion program (e.g., adult basic education, GED)
91.1% (1,314) answered NO 8.9% (129) answered YES
b. Short-term education or employment training program (WIA, Job Corps) 93.8% (1,354) answered NO 6.2% (89) answered YES
c. Vocational, technical, trade school 84.7% (1,222) answered NO 15.3% (221) answered YES
d. 2-or 4-year college or university 39.8% (574) answered NO 60.2% (869) answered YES
e. Religious or church sponsored mission 99.4% (1,435) answered NO .6% (8) answered YES
f. Other (specify)_________________ 91.2% (1,316) answered NO 8.8% (127) answered YES

The 2011 Post-High School Follow-Up Survey
Page 7
Table 2. Analysis of Question 4F
“Other” Category Number of Respondents
Vocational, technical, trade school* 33 Short-term education or employment training program (WIA, Job Corps, Work One)* 14
Other 14 Don't Know 12 High School Completion Program (Adult Basic Education, GED)* 9 A life skills program 9 2 or 4 year college or university* 8 I have a job 7 Alternative school program 7 Army/National Guard 4 Home Schooled 3 Apprenticeship/Internship 3 None/Nothing 1 Total 124** * Coding by subcontractor, Stone Research Services, indicated that some “Other” responses were, in fact, one of the pre‐set responses. ** Three respondents selected “Other” but did not specify
5. In the 12 months after leaving high school, have you ever worked? 33.2% (780) said NO (note: the survey was completed for anyone answering “no”) 66.8% (1,571) said YES
6. Since leaving high school, have you worked for a total of 3 months (about 90 days)? (days do not need to be in a row) 16.8% (264) said NO 82.9% (1,303) said YES
7. Did you work an average 20 or more hours per week? (Hours may vary from week to week) 15.7% (247) said NO 83.8% (1,317) said YES
8. Were you paid at least the minimum wage of $7.25 an hour? 6.3% (99) said NO 93.3% (1,466) said YES

The 2011 Post-High School Follow-Up Survey
Page 8
9. Describe the job you have or have had. Note: Respondents were permitted to select more than one answer.
a. In a company, business, or service with people with and without disabilities 38.6% (607) said NO 61.4% (964) said YES
b. In the military 97.6% (1,533) said NO 2.4% (38) said YES
c. In supported employment (paid work with support services to you and the employer) 78% (1,397) said NO 22% (345) said YES
d. Self-employed 88.9% (1,151) said NO 11.1% (174) said YES
e. In your family’s business (farm, store, fishing, ranching, catering) 88.4% (1,388) said NO 11.6% (183) said YES
f. In sheltered workshop (where most workers have disabilities) 94.3% (1,481) said NO 5.7% (61) said YES
g. Employed while in jail or prison 99.4% (1,562) said NO .6% (9) said YES
h. Other (specify)________________ 65.1% (1,023) said NO 34.9% (548) said YES
Table 3. Analysis of Question 9H
“Other” Category Number of Respondents
In a company, business, or service with people with or without disabilities* 421Other 36Babysitting/child care 21Farm work (other than family farm) 18Camp counselor/Boy and Girls Club 9Working through my university/school 9Landscaping 9In supported employment (paid work with services and wage support to the employer)* 6

The 2011 Post-High School Follow-Up Survey
Page 9
In your family's business (e.g., farm, store, fishing, ranching, catering)* 4Volunteer 4Mechanic 4Don't Know 3Self-employed* 1Volunteer firefighter 1Cleaning houses 1None/Nothing 1
Total 546*** Coding by subcontractor, Stone Research Services, indicated that some “Other” responses were, in fact, one of the pre‐set responses. ** Two respondents selected “Other” but did not specify.
Statewide Aggregate Data Analysis Data on Mutually Exclusive Categories of “Leavers” Enrolled in Higher Education: A total of 37.3% or 877 of all survey respondents were enrolled in a 2- or 4-year college or university within one year of leaving high school. Of those, 770, or 32.8% of all respondents, were enrolled in higher education for at least one complete term. This figure represents respondents who replied with “2- or 4-year college or university” in Question 4 and also replied “yes” to Question 3.
Competitively Employed: A total of 1,571 or 66.8% of respondents were employed. Of those, 836, or 35.6% of all respondents were employed at or above minimum wage and worked 20 hours per week or more for at least 90 days, excluding respondents who were self-employed, working in a family business, working in sheltered employment, or working while in jail (competitively employed). Of those, 563 or 23.9% of the 2,351 respondents were competitively employed but were not enrolled in higher education as defined in #1. Enrolled in Some Other Form of Post-Secondary Education or Training: A total of 421, or 17.9%, of all respondents were enrolled in some other form of post-secondary education for at least one term, excluding 2- or 4-year college or university. Of those, 253, or 10.8%, were enrolled in some other form of post-secondary education or job training for at least one semester but not competitively employed. Some Other Employment: A total of 1,303, or 55.4%, of all respondents were in some other form of employment (employed for at least 90 days at any time in the previous year). Of those, 210, or 8.9% of all

The 2011 Post-High School Follow-Up Survey
Page 10
respondents were in some other form of employment but not enrolled in higher education (#1), not competitively employed (#2), nor in some other form of post-secondary education or job training (#3). Table 4. Summary of Data on Mutually Exclusive Categories of “Leavers” Category Number of Respondents Percent of All Respondents Enrolled in Higher Education 770 32.8% Competitively Employed 563 23.9% Enrolled in Some Other Form of Education or Training 253 10.8%
Some Other Employment 210 8.9% Data for Measures/Indicators Further analysis generates a number of findings. Measurement A as described by 20 U.S.C. 1416(a)(3)(B) asks for the percentage of youth enrolled in a 2- or 4-year college. A total of 869 respondents indicated they were enrolled in such a school, while eight responses in the “other” category also indicated this type of enrollment, for a total of 877 or 37.3% of the 2,351 responses. Measurement A also specifies that students should be enrolled for at least one full term. Of the 877 responses, 770, or 32.8%, of all 2,351 respondents were enrolled for at least one full term. Measurement B of 20 U.S.C. 1416(a)(3)(B) asks for the number of youth enrolled in higher education (as described in Measurement A) or competitively employed. Competitive employment includes pay at or above the minimum wage for 20 hours a week or more for at least 90 days during the year since leaving high school. Military employment and other settings with others who are nondisabled are included. Family business, self-employment, and employment in jail or in a sheltered workshop are excluded. A total of 1,108, or 47.1%, of all respondents indicated that they were employed at or above the minimum wage for 20 hours per week for at least 90 days in the previous year since leaving high school. Once students working in family business, self-employment, and employment while in jail or in a sheltered workshop are excluded, 853, or 36.3% of all respondents, are considered “competitively employed.” Of these, 563 were not also enrolled in higher education as described by Measurement A. Adding these to Measure A, 1,333, or 56.7%, of all respondents were competitively employed or enrolled in higher education (this number also includes those that were both competitively employed and enrolled in higher education). Measurement C computes the percentage who were enrolled in higher education or some other postsecondary education or training program or competitively employed or held some other

The 2011 Post-High School Follow-Up Survey
Page 11
employment during the year after leaving high school. Any “yes” response to Question 3 was included as the type of education specified (as both definitions of enrollment in higher education and enrollment in some other form of post-secondary education or job training program was limited to those enrolled for at least one complete term) . Likewise, any “yes” response to Question 6 was considered as being competitively employed or holding employment of some form (as both definitions are limited to those employed for at least 90 days). To prevent double-counting respondents, any who responded “yes” to both questions will be subtracted from the total employed (as they would already be counted in the enrolled total). Of the 2,351 total respondents, 1,789, or 76.1%, were enrolled in higher education or some other postsecondary education or training program or competitively employed or held some other employment during the year after leaving high school. Of the 2,351 respondents to the post-graduate survey, 698, or 29.7%, indicated that they were both enrolled in higher education or some other form of post-secondary education or job training and competitively employed or in some other form of employment. Table 5. Summary of Data for Measures/Indicators Category Number of Respondents Percent of All Respondents Measurement A 770 32.8% Measurement B 1,333 56.7% Measurement C 1,789 76.1%
The 2011 Post-High School Follow-Up Survey
Page 12
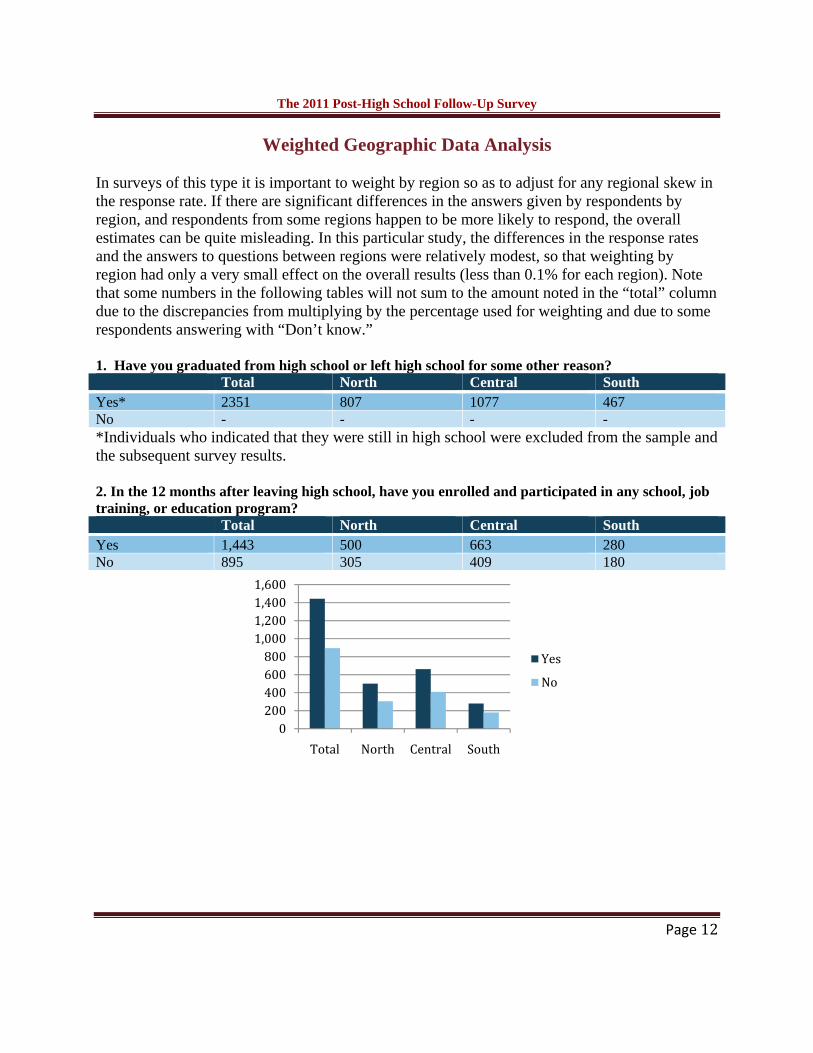
Weighted Geographic Data Analysis In surveys of this type it is important to weight by region so as to adjust for any regional skew in the response rate. If there are significant differences in the answers given by respondents by region, and respondents from some regions happen to be more likely to respond, the overall estimates can be quite misleading. In this particular study, the differences in the response rates and the answers to questions between regions were relatively modest, so that weighting by region had only a very small effect on the overall results (less than 0.1% for each region). Note that some numbers in the following tables will not sum to the amount noted in the “total” column due to the discrepancies from multiplying by the percentage used for weighting and due to some respondents answering with “Don’t know.” 1. Have you graduated from high school or left high school for some other reason? Total North Central South Yes* 2351 807 1077 467 No - - - - *Individuals who indicated that they were still in high school were excluded from the sample and the subsequent survey results. 2. In the 12 months after leaving high school, have you enrolled and participated in any school, job training, or education program? Total North Central South Yes 1,443 500 663 280 No 895 305 409 180
0200400600800
1,0001,2001,4001,600
Total North Central South
Yes
No

The 2011 Post-High School Follow-Up Survey
Page 13
3. If you went to college or a job training program, did you complete an entire term? Total North Central South Yes 1184 420 544 220 No 243 76 112 56
4. Please describe the kind of school or job training program you were enrolled Total North Central South 2-or 4-year college or university 877 318 414 145 Vocational, technical, trade school 255 94 101 60 High school completion program 138 40 70 28 Short-term education or employment training program 103 22 49 31
A life skills program 9 6 2 1 Religious or church sponsored mission 8 2 4 2 I have a job 7 1 2 4 Alternative school program 7 2 4 1 Ar National Guard my/ 4 1 3 0
0200400600800100012001400
Total North Central South
Yes
No
01002003004005006007008009001000
2‐or 4‐year college or university
Vocational, technical, trade
school
High school completion program
Short‐term education or employment training program
Religious or church
sponsored mission
Total
North
Central
South

The 2011 Post-High School Follow-Up Survey
Page 14
5. In the 12 months after leaving high school, have you ever worked? Total North Central South Yes 1,571 524 725 321 No 780 283 351 146
0200400600800
1,0001,2001,4001,6001,800
Total North Central South
Yes
No
6. Since leaving high school, have you worked for a total of 3 months (about 90 days)? (days do not need to be in a row) Total North Central South Yes 1,303 427 600 276 No 264 96 122 46
0200400600800
1,0001,2001,400
Total North Central South
Yes
No

The 2011 Post-High School Follow-Up Survey
Page 15
7. Did you work an average 20 or more hours per week? (Hours may vary from week to week) Total North Central South Yes 1,317 432 604 281 No 247 91 117 39
8. Were you paid at least the minimum wage of $7.25 an hour? Total North Central South Yes 1,466 497 670 299 No 99 27 51 21
0200400600800
1,0001,2001,400
Total North Central South
Yes
No
0200400600800
1,0001,2001,4001,600
Total North Central South
Yes
No

The 2011 Post-High School Follow-Up Survey
Page 16
9. Describe the job you have or have had. Total North Central South In a company, business, or service with people with and without disabilities
1192 406 542 243
In supported employment 351 117 163 71 In your family’s business 184 49 88 47 Self-employed 175 50 78 47 In sheltered workshop 90 23 46 20 In the military 38 12 19 7 Babysitting/child care 22 3 13 6 Farm work 18 5 9 4 Camp counselor/Boys and Girls club 9 3 4 2
0200400600800100012001400
In a company, business, or service with
people with and without
disabilities
In supported employment
In your family’s business
Sel
Total
North
Central
Southf‐employed In sheltered workshop
An analysis of the results of the survey disaggregated by region suggests that there may be variations in the behavior of IEP students who have left school. These differences could be due to either demographic differences, such as income and race, substantial policy differences at the LEA level, or differences in employment opportunities by region for the general population that also affect former IEP students. For example, the proportion of students who have worked during the 12 months since they left high school rises appreciably the further south they live. Whereas 68% of respondents in the northern part of the state have worked, 73% of those in the center of the state have worked, and 77% in the state’s southern counties. Similarly, respondents in the southern portions of Indiana are more likely to have worked where there were no other disabled workers (north 58%, central 61%, south 63%) or in sheltered employment (4% in the north and central regions, 6% in the south).

The 2011 Post-High School Follow-Up Survey
Page 17
Survey Challenges and Areas for Improvement Two key challenges continue during the implementation of the 2011 survey. Some school corporations were very slow to respond to IDOE and CEEP requests for contact information. School corporations were provided with multiple notifications and a template in which to enter and return the data. In addition, many school corporations did not use the template provided and failed to provide certain requested information. Further, some school corporations provided contact information for people who did not qualify as former IEP students, such as currently enrolled K-12 IEP students. The second difficulty during the survey administration was the low response rate to the mailed survey. For the mailed survey, the response rate was approximately 18%. However, this increased from last year’s survey response rate of approximately 6%. This increase could be partially attributed to the inclusion of pre-paid postage for the survey mailings for the study’s second year. The number of disconnected or otherwise inaccurate telephone numbers also reduced the response rate for the phone survey. While the nature of the target population creates inherent challenges to data quality, the results of the survey likely have some degree of sample bias.

The 2011 Post-High School Follow-Up Survey
Page 18
Appendix: Survey Document

The 2011 Post-High School Follow-Up Survey
Page 19
Name Address City, State, Zip Please take a moment to complete the 2011 Indiana Post-High School Outcome Survey, which is being conducted for the Indiana Department of Education. Your information will be used to measure how well Indiana is preparing students who have had Individualized Education Plans before leaving or finishing high school. The results of this survey will be given to the U.S. Department of Education. Your answers will be kept private and the results will be combined with others taking the survey so that your information will remain confidential. You may either fill out the survey and return it in the self-addressed and postage-paid envelope included with this letter OR fill it out on the web at http://ceep.indiana.edu/post/. If completing the survey on the web, please use the following school corporation #: (insert here). Please return the survey as soon as possible. Thank you for your help in completing the survey!
POST-HIGH SCHOOL OUTCOME SURVEY 1. Have you graduated from high school or left high school for some other reason? __ YES __ NO 2. In the 12 months after leaving high school, have you enrolled and participated in any school, job training, or education program? __ YES GO TO QUESTIONS 3 AND 4 __ NO GO TO QUESTION 5 3. Did you complete an entire term? (A term can be quarter, semester, inter-session, summer, or on-line) __ YES __ NO 4. Describe the kind of school or job training program you were enrolled. (CHECK ONE OPTION) __ High school completion program (e.g., Adult Basic Education, GED) __ Short-term education or employment training program (e.g., WIA, Job Corps) __ Vocational, technical, trade school __ 2- or 4-year college or university __ Religious or church sponsored mission __ Other (Specify): ___________________________________

The 2011 Post-High School Follow-Up Survey
Page 20
5. In the 12 months after leaving high school, have you ever worked? __YES GO TO QUESTIONS 6, 7, 8 & 9 __NO STOP: THE SURVEY IS FINISHED 6. Since leaving high school, have you worked for a total of 3 months (about 90 days)? (Days do not need to be in a row) __YES __NO 7. Did you work an average 20 or more hours per week (or about half time of a 40-hour week)? (Hours may vary week to week) __YES __NO 8. Were you paid at least the minimum wage of $7.25 an hour? __YES __NO 9. Describe the job you have or have had. (CHECK ONE OPTION) ___ In a company, business, or service with people with and without disabilities ___ In the military ___ In supported employment (paid work with services and wage support to the employer) ___ Self-employed ___ In your family’s business (e.g., farm, store, fishing, ranching, catering) ___ In sheltered employment (where most workers have disabilities) ___ Employed while in jail or prison ___ Other (Specify) __________________________________ Thank you very much for your participation in this survey. If you have any questions, please contact Terry Spradlin at [email protected] or call 812-855-4438.